Ammonium Transformation in 14 Lakes along a Trophic Gradient


Department of Earth and Environmental Sciences, University of Milano-Bicocca, Piazza Della Scienza 1, 20126 Milano, Italy
*
Author to whom correspondence should be addressed.
Water 2018, 10(3), 265; https://doi.org/10.3390/w10030265
Submission received: 3 February 2018
/
Revised: 26 February 2018
/
Accepted: 1 March 2018
/
Published: 3 March 2018
(This article belongs to the Special Issue Biological Communities Respond to Multiple Human-Induced Aquatic Environment Change)
Abstract
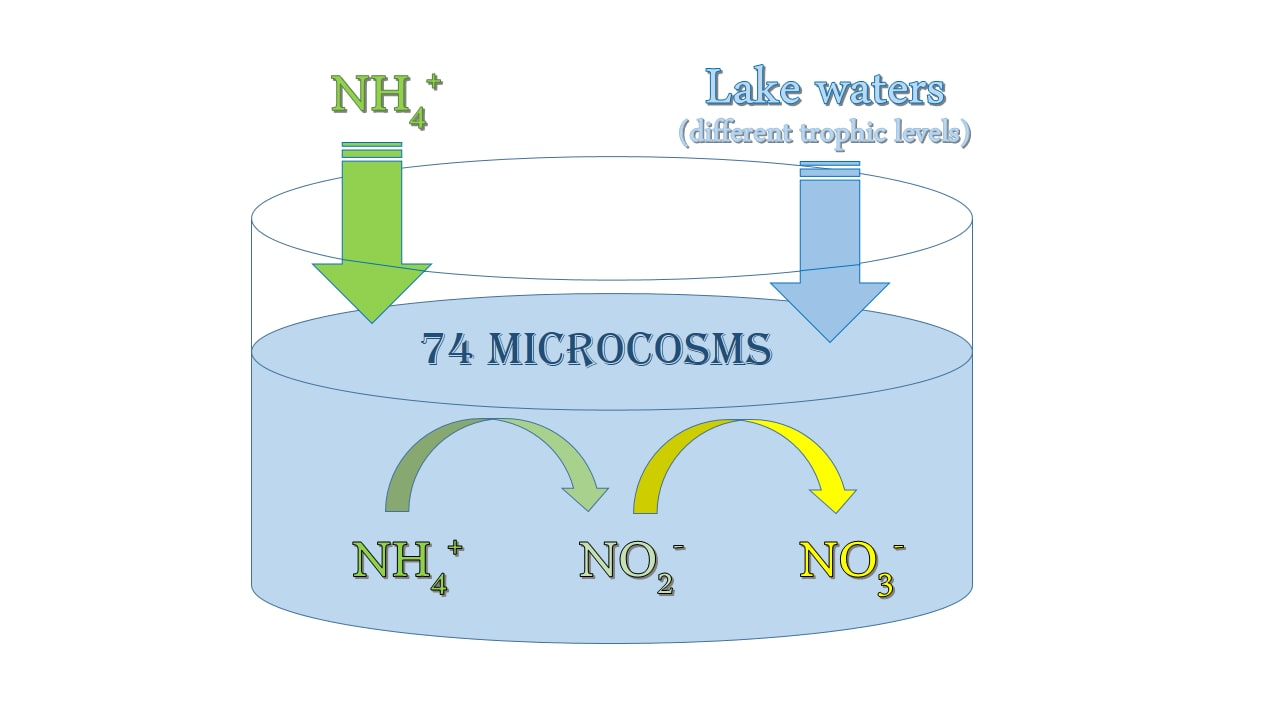
:Ammonia is a widespread pollutant in aquatic ecosystems originating directly and indirectly from human activities, which can strongly affect the structure and functioning of the aquatic foodweb. The biological oxidation of NH4+ to nitrite, and then nitrate is a key part of the complex nitrogen cycle and a fundamental process in aquatic environments, having a profound influence on ecosystem stability and functionality. Environmental studies have shown that our current knowledge of physical and chemical factors that control this process and the abundance and function of involved microorganisms are not entirely understood. In this paper, the efficiency and the transformation velocity of ammonium into oxidised compounds in 14 south-alpine lakes in northern Italy, with a similar origin, but different trophic levels, are compared with lab-scale experimentations (20 °C, dark, oxygen saturation) that are performed in artificial microcosms (4 L). The water samples were collected in different months to highlight the possible effect of seasonality on the development of the ammonium oxidation process. In four-liter microcosms, concentrations were increased by 1 mg/L NH4+ and the process of ammonium oxidation was constantly monitored. The time elapsed for the decrease of 25% and 95% of the initial ion ammonium concentration and the rate for that ammonium oxidation were evaluated. Principal Component Analysis and General Linear Model, performed on 56 observations and several chemical and physical parameters, highlighted the important roles of total phosphorus and nitrogen concentrations on the commencement of the oxidation process. Meanwhile, the natural concentration of ammonium influenced the rate of nitrification (µg NH4+/L day). Seasonality did not seem to significantly affect the ammonium transformation. The results highlight the different vulnerabilities of lakes with different trophic statuses.

1. Introduction
Total ammonia (TAN), in particular the unionized compound, is one of the major environmental pollutants in freshwater aquatic systems that is physiologically harmful to aquatic organisms and affects ecosystem functionality [1,2]. However, the threshold of ammonia toxicity varies widely, as there are sensitive and insensitive species. Nitrogen pollution in water has become a serious global environmental problem. It causes water eutrophication, stimulating the growth of dinoflagellates and Cyanobacteria and influencing phytoplankton blooms, and represents a potential hazard to human health [3,4,5,6].
In aquatic environments, total ammonia exists in two chemical forms, unionized ammonia (NH3) and ionized ammonium (NH4+) [7], with different percentage depending on pH. In general, in water at 8.0 pH and 20 °C, only about 10% of the total ammonia is present as the more toxic form, ammonia (NH3). Since 90% is present as ammonium (NH4+), it is preferable to use the term ammonium to refer to this type of pollution in natural water ([3,8] and the references therein).
Nowadays, there is increasing attention and a significant number of studies that are focusing on nitrogen to gain more knowledge about the factors that are influencing its different transformation pathways. In freshwater ecosystems, under anoxic conditions, the anaerobic oxidation of ammonium can occur, which is called anammox reaction: NH4+ + NO2− → N2 [9,10]. On the other hand, in aerobic conditions, the biological oxidation of ammonium to nitrite and then nitrate (nitrification) is a two-step process involving different taxa of chemolithotrophic organisms: archaeal and bacterial ammonia oxidizers (AOA, AOB), which obtain their energy from the oxidation of ammonia to nitrite, and nitrite oxidizing bacteria (NOB), which strictly depend on ammonia oxidizers and complete the oxidation to nitrate [11,12]. This process is a key part of the complex nitrogen cycle and a fundamental process in aquatic environments, having a profound influence on ecosystem stability [13,14].
Total ammonia can enter water bodies from natural sources, such as the end product of animal protein catabolism, and/or anthropogenic sources, such as atmospheric deposition, sewage effluents, industrial wastes, agricultural run-off, and the decomposition of biological wastes ([15,16,17,18] and references therein). In the last decades, anthropogenic activity has increased the inputs of nitrogen affecting water quality and aquatic biodiversity, with also considerable socioeconomic consequences [19,20,21,22]. Thus, environmental factors influencing ammonium oxidation in freshwater systems have received considerable attention. Previous studies have highlighted that the nitrification rate in estuaries and in rivers depends on the activities of nitrifying bacteria and is affected by environmental parameters such as temperature, light, and pH values, as well as oxygen, nitrogen, organic carbon, and sulphide concentrations [13,23,24,25]. Despite recent advances, measurements of rates and controls of nitrification are relatively rare in lake ecosystems [26]. There is limited knowledge of the relationships among ammonium nitrification rate, lake trophic degree, and the associated microorganisms, which are closely related with the NH4+ removal efficiency and the self-purification capacity of lake ecosystems [27,28,29].
The transformation efficiency and velocity of ammonium into oxidized compounds in 14 lakes, located in the same geographic region, were compared with lab-scale experimentations performed in artificial aerobic microcosms. Our major goals were to determine nitrification rates in several lentic environments, which are characterized by different trophic levels (e.g., Total Phosphorus, Total Nitrogen) and natural content levels of ammonium in different seasons.
We conducted experiments to address the following questions that arose from previous studies: Are nitrification rates related to the lake trophic degree? How do lakes with different trophic degree react to an increased load of ammonium? Is the nitrification process influenced by seasonality? We hypothesized that the nitrification rate increased in productive lakes and in some seasons. A possible relationship between there parameters could lead to further questions regarding the different vulnerabilities in lakes of different trophic statuses.
2. Materials and Methods
2.1. Study Sites
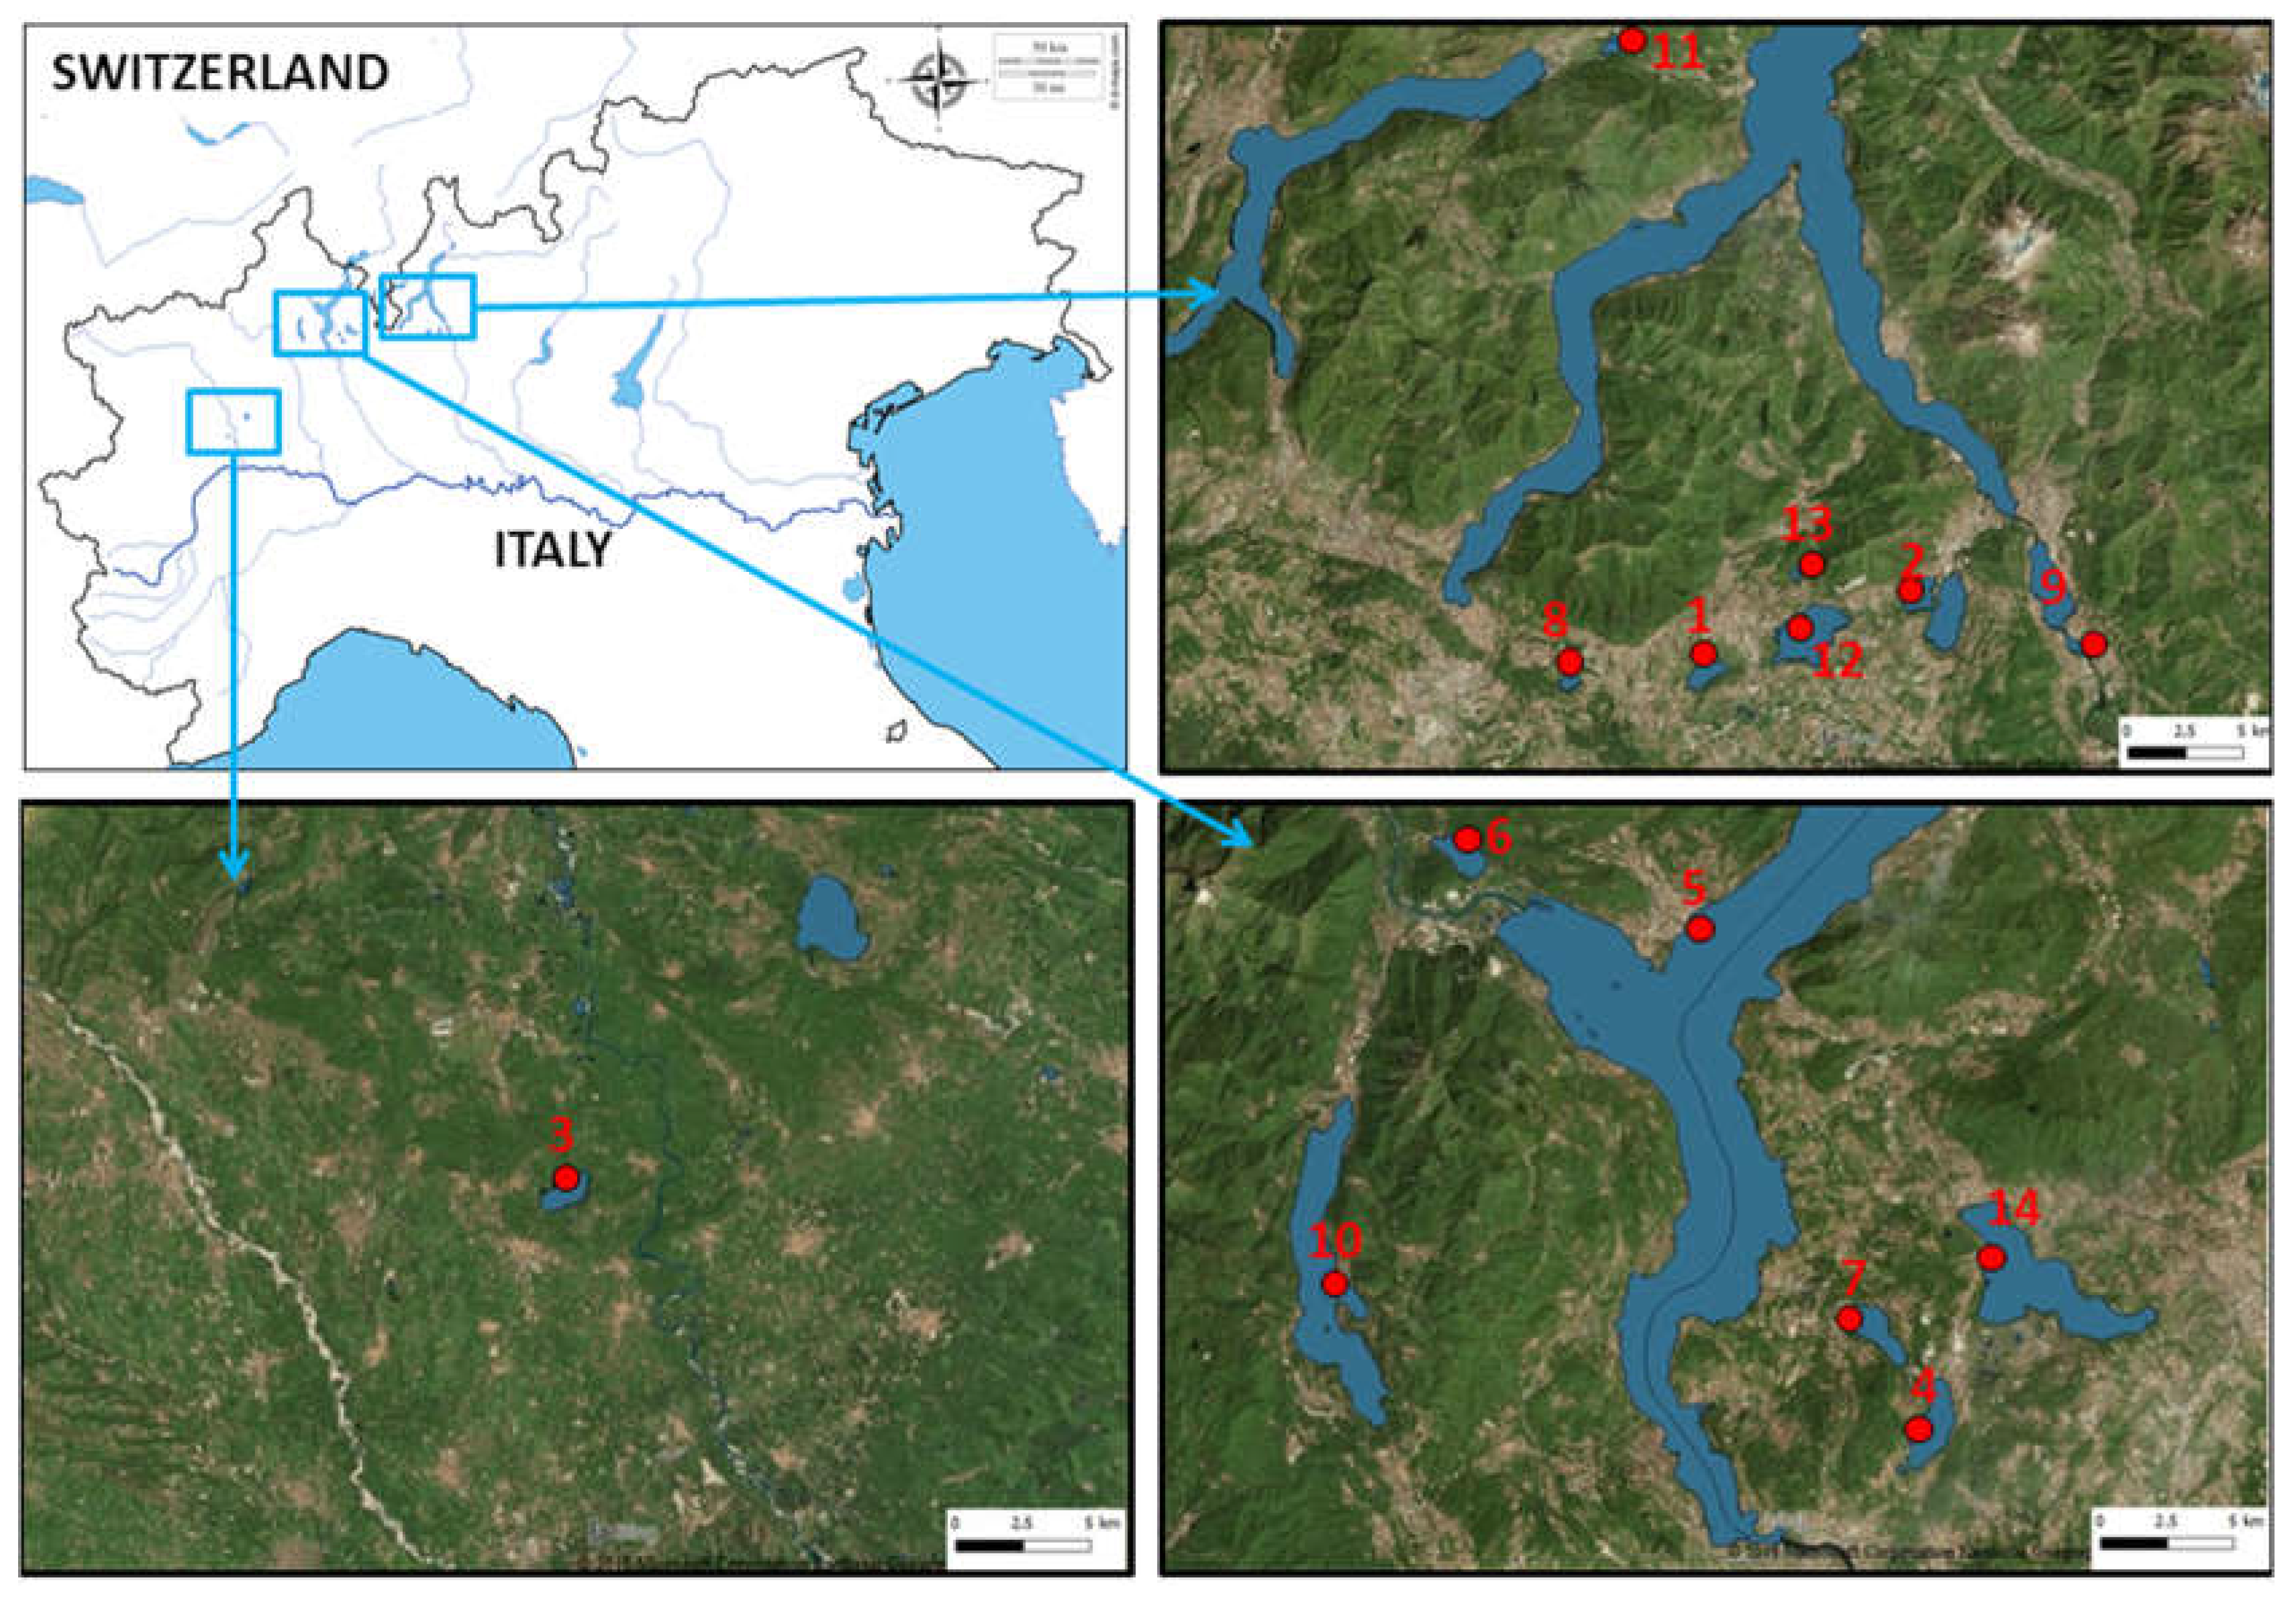
Water samples were collected from fourteen Italian lakes: L. Candia, L. Orta, L. Mergozzo, L. Maggiore, L. Monate, L. Comabbio, L. Varese, L. Piano, L. Montorfano, L. Alserio, L. Segrino, L. Pusiano, L. Annone (W), and L. Olginate. These lakes are located in Northern Italy, included from Piemonte region (45°49′ N, 8°24′ E) and the western part of Lombardia region (45°47′ N, 9°25′ E) (Figure 1).
The lakes have different morphometric and chemical characteristics. The lakes were classified in relation to their different trophic status, following Organisation for Economic Co-operation and Development recommendations [30], which span from oligotrophic to highly eutrophic. For more information about the 14 studied lakes, see Table 1.
2.2. Sampling Method and Experimental Procedure
For each lake, the water samples were collected in different months to highlight the possible variations in the ammonium transformation in relation to seasonality, totaling 74 samples. On water samples of Lakes Candia and Piano, the experiment was performed only once during the study, because, for logistic problems, we could not collect their water in different months. Each lake sample was collected by Niskin’s bottle near the littoral zone (3 m depth), in open water without vegetation, and quickly transferred to the laboratory. Before the experimental procedure, we measured the main chemical and physical parameters, characterizing lacustrine water quality. Temperature and pH were detected in situ with a portable underwater multiparameter probe (WTW multi3432). Total phosphorus, soluble reactive phosphorus, total nitrogen, ammonium nitrogen, and alkalinity were analyzed using standard methods [36,37]. Nitrate nitrogen anions were measured using the Ion Chromatography (Thermo Scientific™ Dionex™, Waltham, MA, USA).
For each lake, the water samples were placed into clean 4 L polycarbonate microcosms (tanks) and amended with one mg/L of ammonium, as NH4Cl (10 μM). The microcosms were kept in the dark at 20 °C and continually shaken. The oxygen saturation was maintained between 80% and 100%. For all the sampled lakes, excluding L. Candia and L. Piano (not watertight seal of microcosms), experiment replicates have been performed in order to verify the text repeatability.
The ammonium consumption was monitored at high frequency, by colorimetric spectrophotometry, until its complete depletion.
2.3. Data Analyses
To analyze and discuss the experimental results, three parameters have been evaluated: (a) D25 and (b) D95, as time elapsed to observe an ammonium decrease of 25% and 95% of the initial concentration in amended microcosm; (c) OxRate, amount of ammonium oxidised in each day (µg NH4+/L day) to reduce the ammonium concentration from 25% to 95% of initial concentration in amended microcosms. To avoid redundancy among dependent variables, the relations between these parameters have been tested by Spearman’s rank correlation coefficient.
For statistical analyses, two parameters were selected as response variables, D25 and OxRate, and to avoid collinearity among predictor, two principal component analyses (PCA) were performed in order to reduce dimensions and select a smaller set of variables [38]. The chemico-physical included parameters, measured before the experiment on lake water samples, were: total phosphorus (TP), soluble reactive phosphorus (SRP), total nitrogen (TP), nitrate nitrogen (NO3−), ammonium nitrogen (NH4+), temperature (TEMP), alkalinity (ALK), and pH. All data were centered (mean value = 0) and scaled (variance = 1) to allow comparison among parameters [39]. Only six predictors were selected from the initial set of 8 to perform the following analyses. We used general linear models (GLMs), a statistical procedure similar to an analysis of variance used to estimate effect size of different factors on a variable of interest [40,41], to analyze the effect of trophic degrees and seasonality on the transformation velocity of ammonia into oxidised compounds. One model had as response variable D25 and the other one had OxRate. We first built a full model including all independent variables that may affect the dependent variable under scrutiny: TP, TN, ALK, TEMP, pH, NH4+, and the possible interactions. Finally, we removed all of the non-significant predictors in two-steps to obtain a final model [42]. The assumptions for general linear models were checked by inspection of diagnostic plots and applying Shapiro–Wilks tests [43]. Interactions were excluded before the relevant main effects. Statistical analyses and figures were produced using different packages (base packages and “ggplot2”, “corrplot”, “factoextra”) in R 3.4.1. [44,45,46,47].
3. Results
3.1. Lakes Characteristics
The mean values (±Standard Error of the Mean) of chemico-physical parameters measured for each lake during every sampling activity are reported in Table 2. Among the 14 lakes that were analyzed, total phosphorus (TP) ranged from 3.0 to 144.0 µg/L, with a mean value of 21.7 ± 2.3 µg/L (±SEM) and soluble reactive phosphorus (SRP) ranged from 1.0 to 99.0 µg/L, with a mean value of 9.8 ± 1.9 µg/L. Total nitrogen (TN) concentrations were between 90.0 and 4218.5 µg/L, with a mean value of 1173.1 ± 93.1 µg/L. Nitrate nitrogen (NO3−) and ammonium nitrogen (NH4+) were in the range of 0–3770 µg/L—with a mean of 593.0 ± 83.2 µg/L, and 0–775 µg/L—with a mean value of 125.9 ± 24.0 µg/L, respectively. Temperature showed a mean value of 14.3 ± 0.9 °C, ranging between 5.6 °C and 27.3 °C. Alkalinity ranged from 0.3 to 4.3, with a mean value of 2.0 ± 0.1 meq/L. Finally, pH had a mean value of 7.9 ± 0.06 and ranged from 6.5 to 8.9.
3.2. Ammonium Oxidation
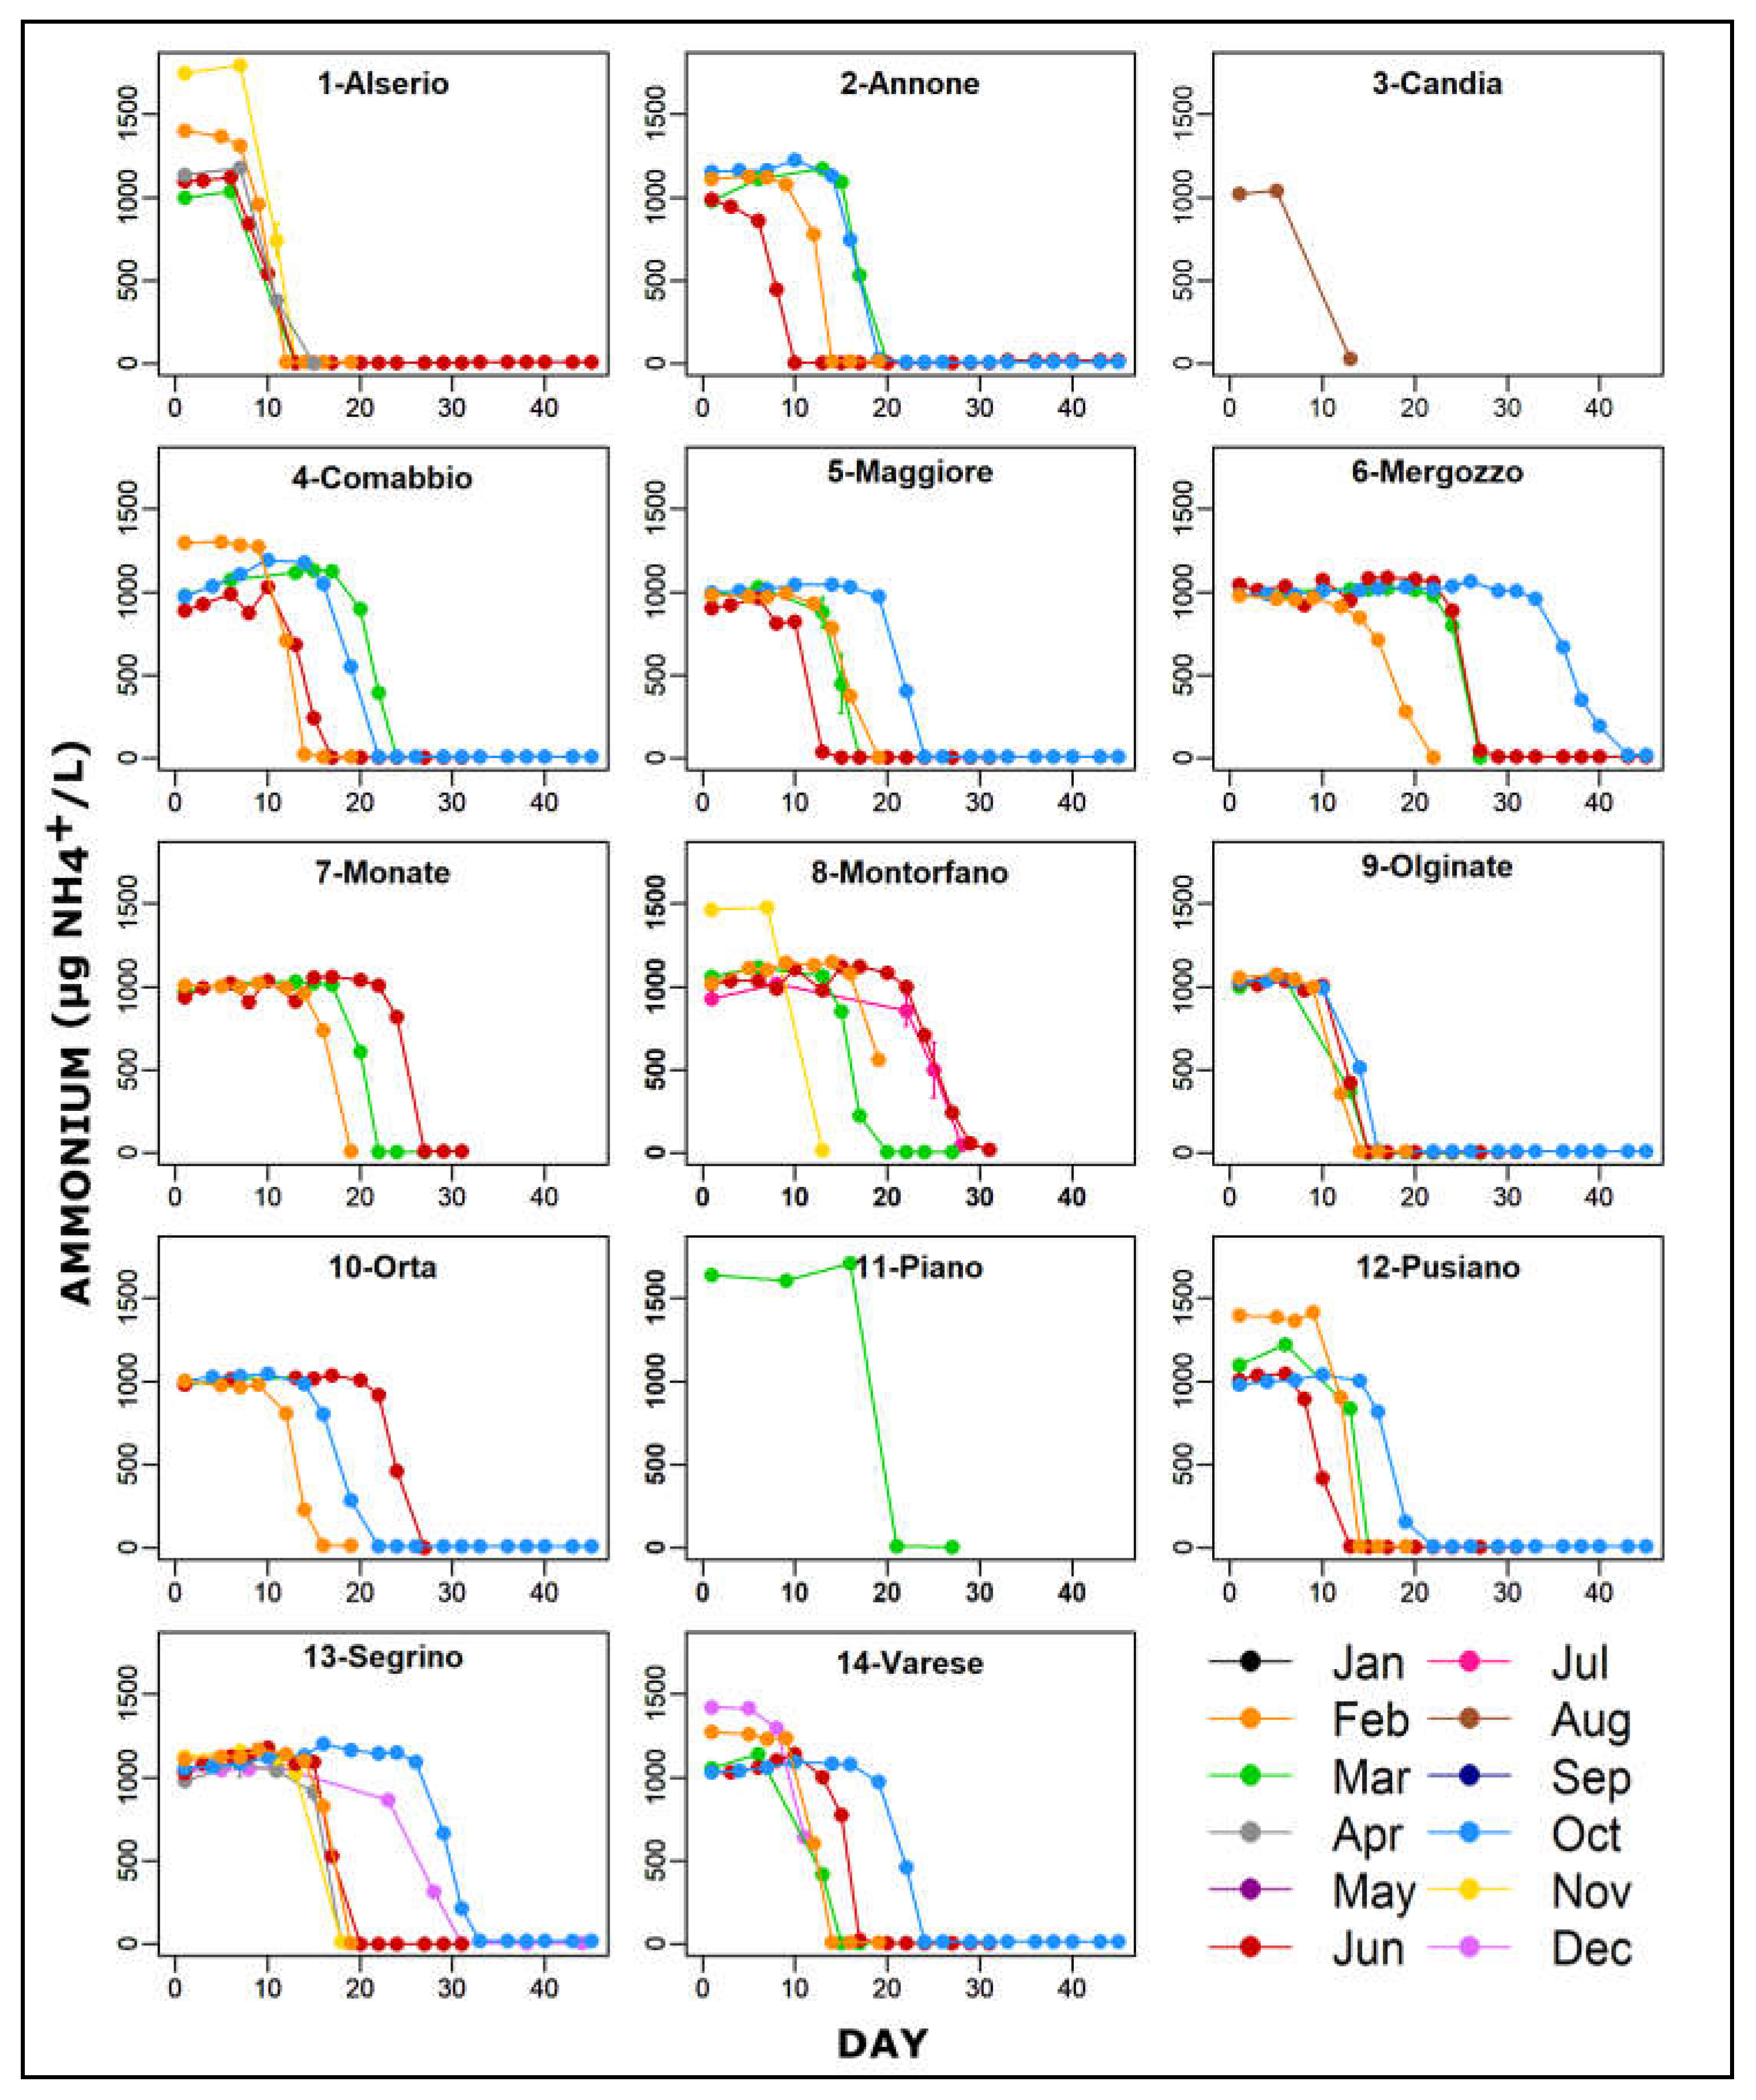
The trend of ammonium oxidation in the various lakes and in water samples collected in different months are shown in Figure 2. The oxidation process, after the addition of 1 mg/L of NH4+, started after several days in all microcosms with different timing depending on the lake. The minimum was observed in microcosm of L. Annone sampled in June (Figure 2 (2-Annone)) while the maximum in L. Mergozzo sampled in October (Figure 2 (6-Mergozzo)). It was not possible to observe a clear relationship between sampling month and the time elapsed for the ammonium oxidation.
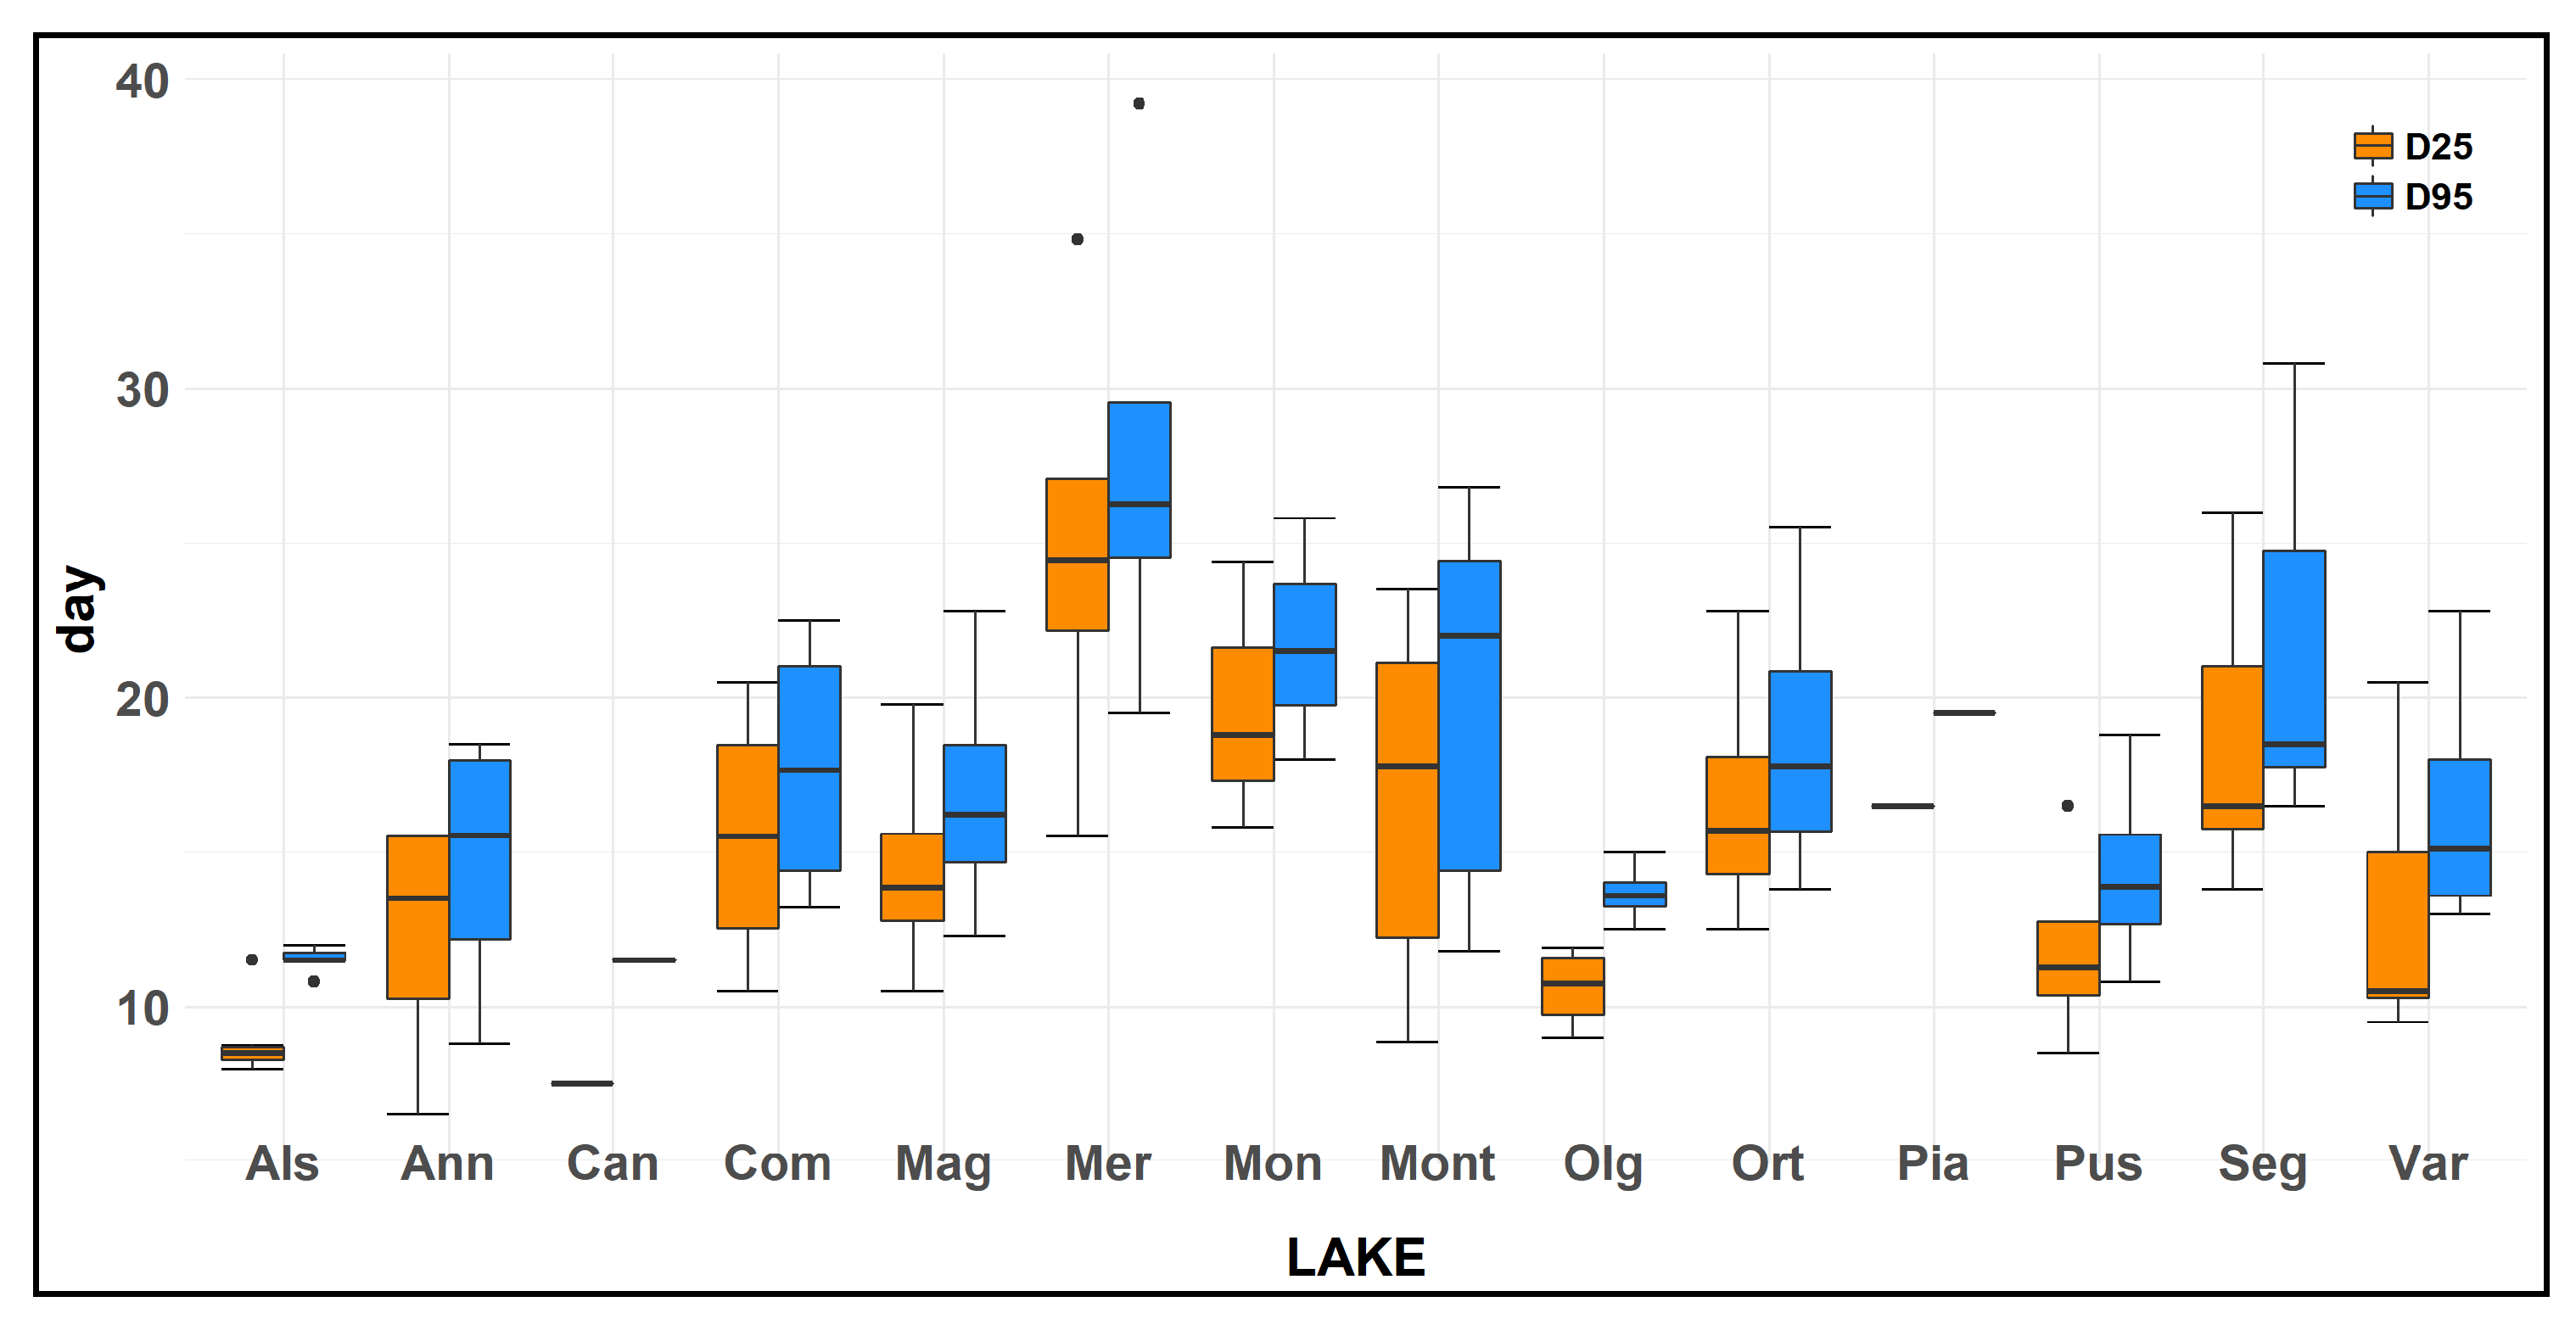
For all of the 74 water samples examined, D25 ranged from 6.5 to 34.8 days, with a mean value of 15.1 ± 0.7 days (±SEM). The various lakes showed a difference in this parameter, with a mean value of 8.9 ± 0.5 days for L. Alserio, 12.2 ± 2.1 days for L. Annone, 7.5 days for L. Candia, 15.5 ± 2.2 days for L. Comabbio, 14.5 ± 1.9 days for L. Maggiore, 24.8 ± 3.9 days for L. Mergozzo, 19.7 ± 2.5 days for L. Monate, 16.7 ± 2.3 days for L. Montorfano, 10.6 ± 0.7 days for L. Olginate, 18.0 ± 2.2 days for L. Orta, 16.5 days for L. Piano, 11.9 ± 1.7 days for L. Pusiano, 17.7 ± 4.3 days for L. Segrino, 13.2 ± 2.1 days for L. Varese (Figure 3). The lakes that showed the lower velocity of ammonium oxidation were L. Mergozzo, L. Monate, L. Orta, L. Segrino; meanwhile, L. Candia, L. Alserio, and L. Olginate displayed the higher velocity of ammonium oxidation. A huge variation in D25 value was highlighted in the various months for L. Mergozzo, for which we detected a difference between the maximum and the minimum value of 19.3 days. However, the overall D25 mean value of the fourteen lakes did not display a large variation among the different seasons. This parameter had a mean value of 15.2 ± 1.4 days in spring, 15.2 ± 1.6 days in summer, 16.7 ± 1.9 days in autumn, and 13.2 ± 1.0 days in winter.
D95 showed a mean value among the lakes of 17.9 ± 0.8 days. The various lakes showed a difference in this parameter, with a mean value of 12.8 ± 1.3 days for L. Alserio, 14.6 ± 2.2 days for L. Annone, 13.8 days for L. Candia, 17.7 ± 2.2 days for L. Comabbio, 16.8 ± 2.2 days for L. Maggiore, 27.8 ± 4.1 days for L. Mergozzo, 21.7 ± 2.2 days for L. Monate, 19.7 ± 2.4 days for L. Montorfano, 13.7 ± 0.5 days for L. Olginate, 20.6 ± 2.8 days for L. Orta, 20.5 days for L. Piano, 14.3 ± 1.7 days for L. Pusiano, 20.4 ± 2.2 days for L. Segrino, 16.5 ± 1.7 days for L. Varese (Figure 3). The lakes that showed the higher value of D95 were L. Mergozzo, L. Monate; instead L. Alserio, and L. Olginate displayed the lower values, similar to that detected for D25. The results were similar to that detected for D25 and a Spearman’s correlation analysis highlighted a strong relationship (ρ = 0.98, p < 0.001) between D25 and D95.
The difference in days elapsed from the D95 to D25 ranged from 1.3 (L. Orta in February) to 5.0 days (L. Segrino in December) with a mean value of 3.9 ± 0.2 days.
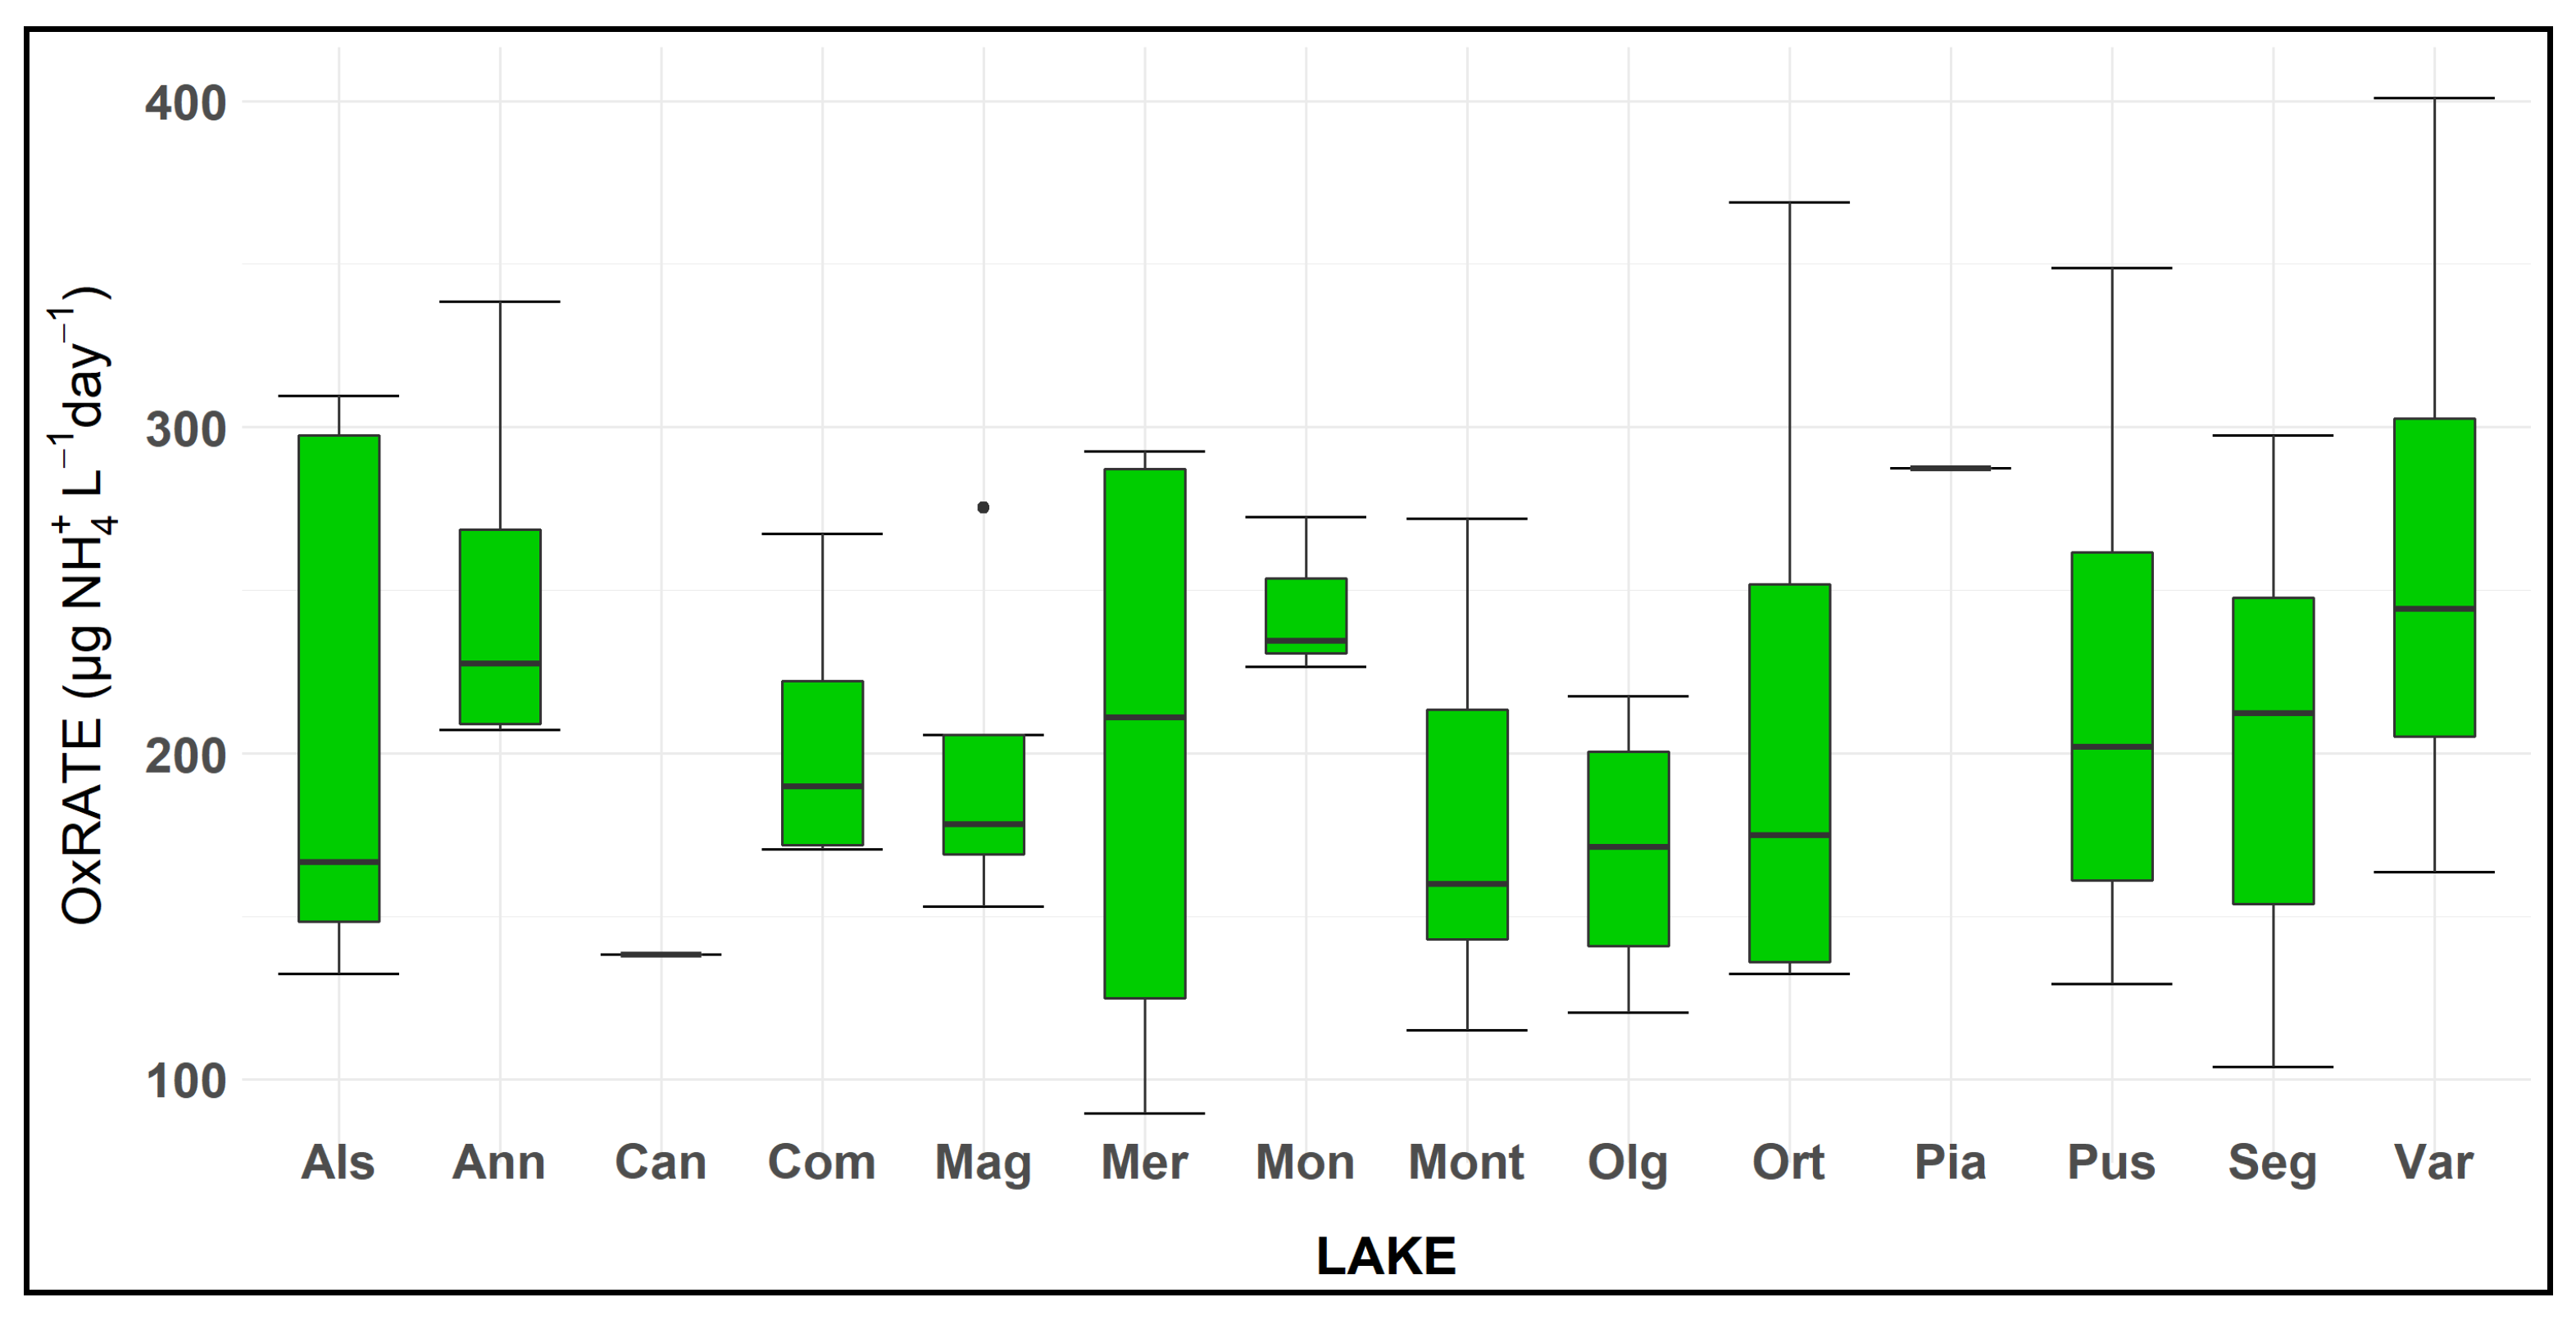
The rate of oxidation (OxRate), referred to the time elapsed to measure an ammonium decrease from 25% to 95%, showed different values from 90 to 400 µg NH4+/L day, respectively, in L. Mergozzo, in October, and L. Varese, in June. The mean value of the 14 lakes was equal to 210 ± 9.7 µg NH4+/L day (Figure 4).
3.3. Relationship between Ammonium Oxidation and Chemico-Physical Parameters
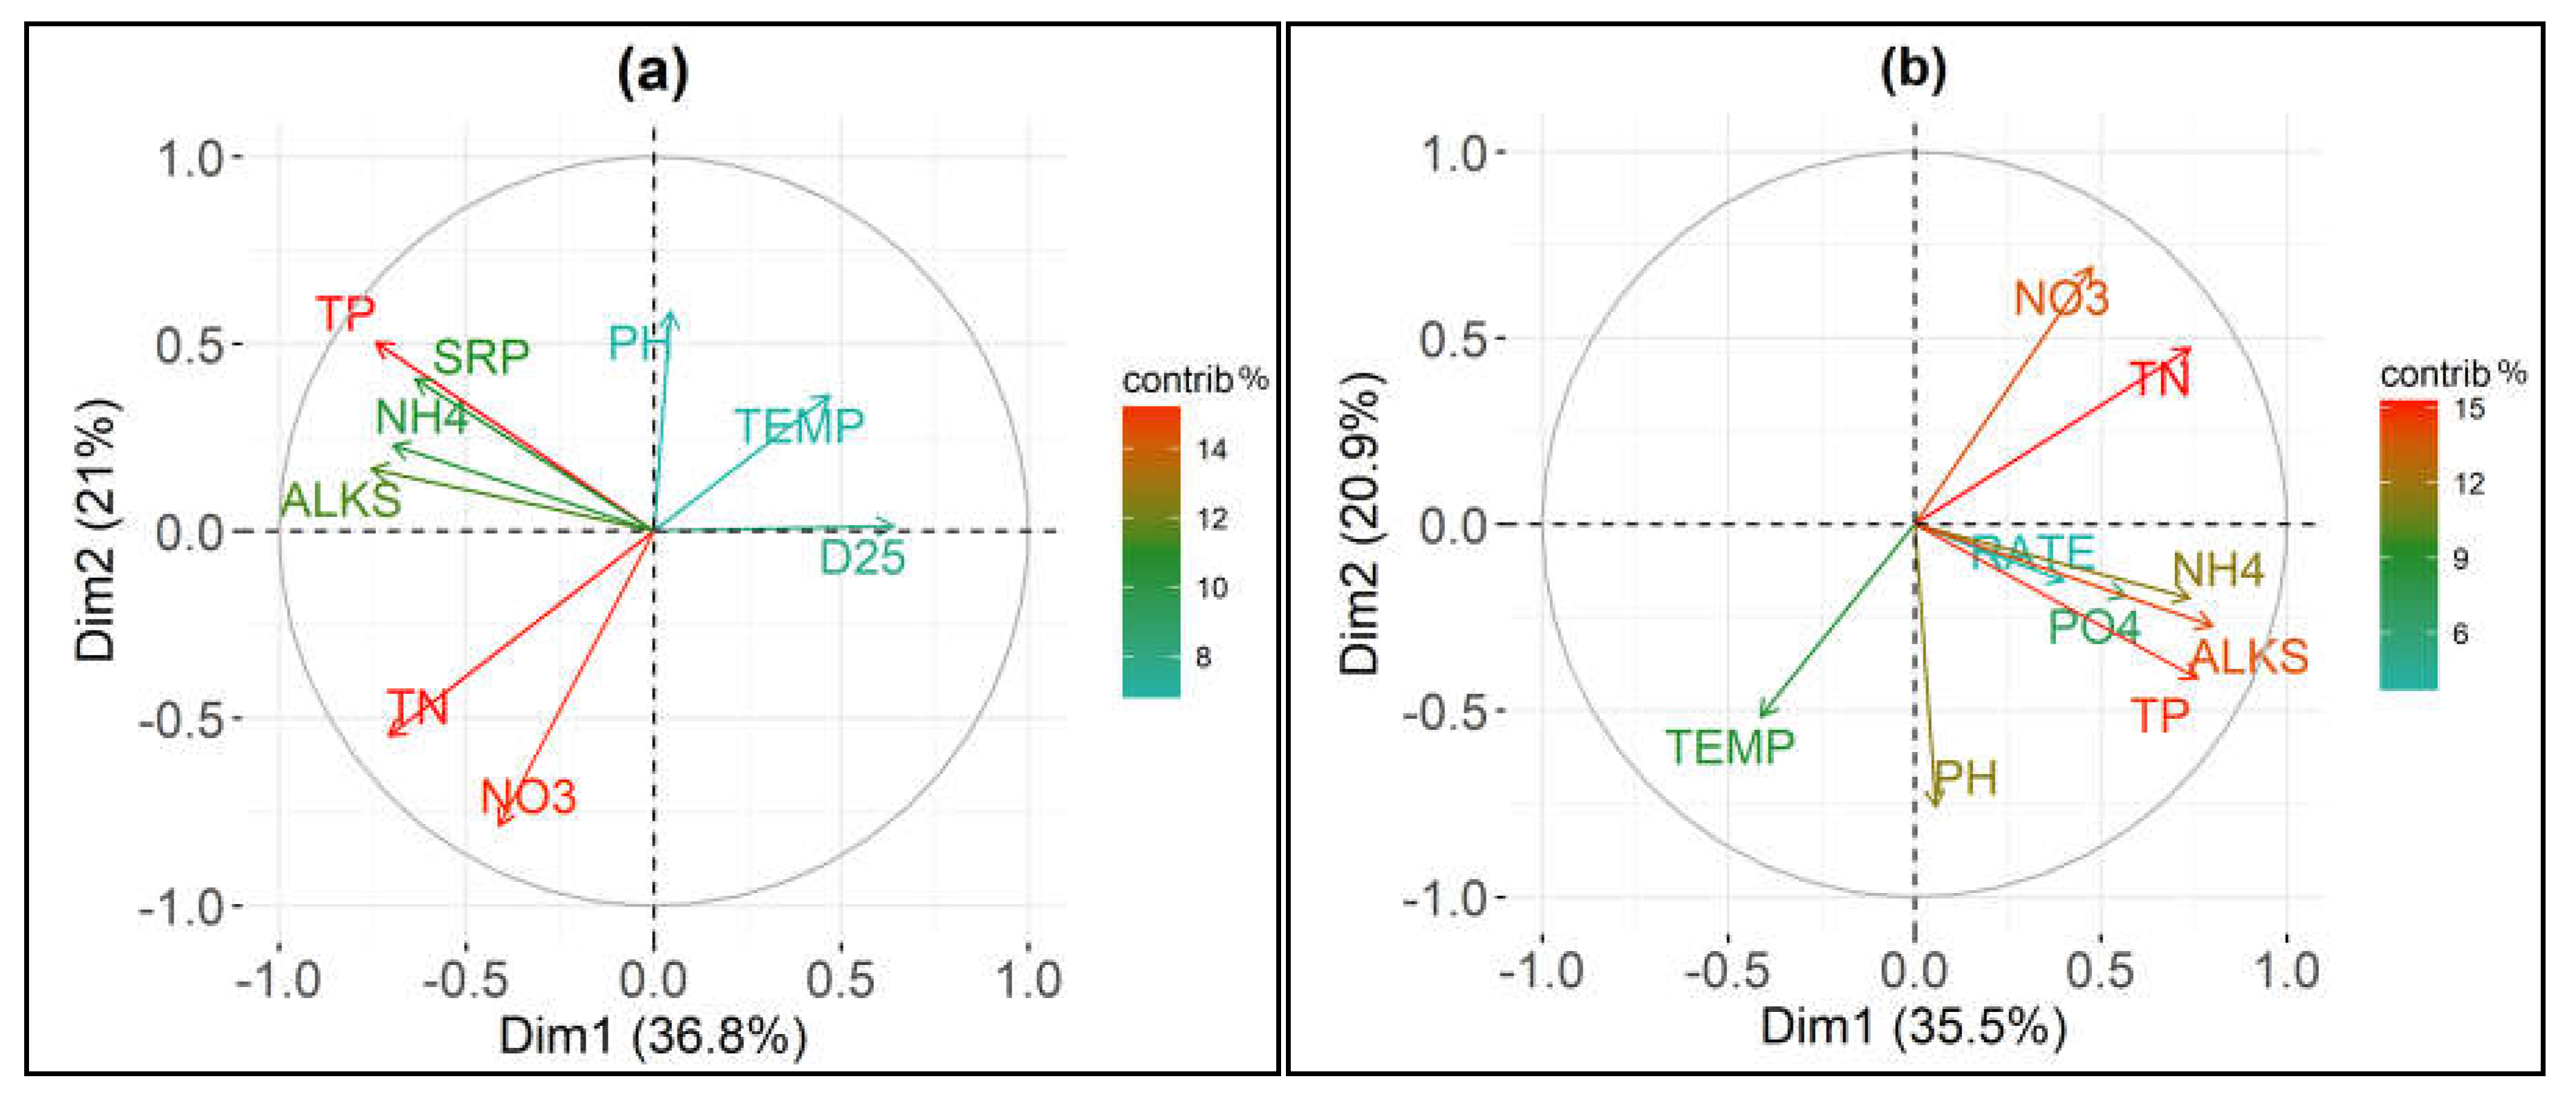
The loadings plots of the Principal Component Analyses performed on the eight chemico-physical parameters and D25 and OxRate are presented in Figure 5.
The first two components of the PCA with the D25 values explained 57.8% of the total variance (PC1 36.8%; PC2 21%—Figure 5a); while, the first two components of the PCA with the OxRate values explained 56.4% of the total variance (PC1 35.5%; PC2 20.9%—Figure 5b). Total phosphorus and soluble reactive phosphorus were highly correlated. There was also a strong correlation between total nitrogen and nitrate nitrogen. Consequently, soluble reactive phosphorus and nitrate nitrogen were removed from the following analyses to avoid collinearity.
We used general linear models (GLM) in order to analyze the effect of chemical and physical parameters, trophic condition (as indicated by TP and TN), and seasonality on the oxidation velocity of ammonium. General Linear Models (GLMs) were performed with D25 and OxRate as response variables. The full models were built using six parameters that included non-significant terms which, following a two-step process, were excluded from the models (see “Materials and Methods” section). The original in-lake values for temperature, alkalinity, ammonium nitrogen, pH and sampling months seemed not to be a significant predictor for D25. The final GLM highlighted total phosphorus and total nitrogen as significant predictors of time elapsed to oxidase the 25% of initial ammonium (Table 3a). The D25 model was significant (F(54) = 11.36, p < 0.001).
Only ion ammonium initial concentration (NH4+) seemed to be a significant predictor for OxRate (Table 3b). The overall OxRate model was significant (F(54) = 11.71, p < 0.01).
4. Discussion
During the last decades, human population growth and anthropic activities have substantially altered the nitrogen cycle, increasing the availability and the mobility of this element. The enhanced concentrations of inorganic nitrogenous compounds (NH4+, NO2−, NO3−) in ground and surface waters affect many aquatic organisms and contribute to the degradation of freshwater, estuarine, and coastal marine ecosystems [48,49]. In particular, intensive animal farming and the use of fertilizer have significantly increased ammonium loading. Unionized ammonia is very toxic to aquatic communities, in particular fish, causing, for example, damage to the gill epithelium, acidosis, ATP depletion in the basilar region of the brain, disruption of osmoregulatory activity, etc. [48]. The ionized form of ammonia, ammonium (NH4+), has minor toxicity compared to NH3 [48]. On the basis of acute and chronic toxicity data, water quality criteria were proposed to protect sensitive aquatic animals, which was equal to 17 mg TAN/L for short-term exposure and 1.9 mg TAN/L for long-term exposure (pH = 7; T = 20 °C) [48,50]. In the present study, the natural concentrations of total ammonia in the 14 studied lakes varied widely, with values up to 0.77 mg/L (43 µM). This value is below the toxicity threshold but could represent a problem of concern in the future, given the reported increase of these compounds in aquatic systems [51,52]. High ammonium loads can also enhance the development of primary producers. Historically, phosphorus has been considered the primary limiting nutrient for phytoplanktonic organisms; however, recent studies have highlighted the importance of nitrogen in determining both the proliferation and the toxicity of non-diazotrophic Cyanobacteria [48,53,54]. Indeed, ammonium appears to favor cyanobacterial dominance in lakes, most likely because of their superior uptake kinetics [3]. At the same time, when NH4+ concentrations are sufficiently high, ammonium may suppress the overall growth of phytoplanktonic organisms [3,55]. Significant inputs of NH4+ can also contribute to the acidification process since nitrification produces hydrogen ions [48], and consequently contributing to the loss of aquatic plants [56,57].
In this context, more knowledge about the transformation process of ammonium is needed, particularly concerning the vulnerability of different lakes to ammonium changes. The goal of the study was to determine the ‘ability’ of lakes with different trophic levels and natural content levels of TAN to overcome high concentrations of ammonium. Our study highlighted a significant difference in the ammonium oxidation rate in water of 14 lakes amended with 1 mg NH4+/L. Previous studies have highlighted that a high ammonia concentration may result in ammonia oxidation inhibition; however, to observe this effect there must be a recorded ammonia concentration in the range of 10–150 mg/L [58,59,60]. We are confident that an ammonium decrease in the microcosms was linked to nitrification processes, as the experiments were conducted in aerobic conditions and the anammox process could not occur.
Using a lab-scale approach, we found that the start of the nitrification process varied as a function of the lake’s trophic status. Indeed, lakes that are characterized by a higher trophic degree seemed to present a faster ammonium transformation, as the nitrification process started earlier when compared to the samples from the oligotrophic lakes. The multivariate regression supported this statement, as the number of days elapsed from the experiment start until a decrease of ammonium concentration equal to 25% was inversely related to total phosphorus and total nitrogen contents. Total phosphorus and nitrogen represent the limiting nutrients in freshwater ecosystems; thus, their concentrations can be considered representative of the lake trophic status [61]. Previous studies have reported the importance of these two nutrients in determining the abundance of archaea and bacteria that are responsible for the ammonium nitrification process [62]. The pH did not seem to affect the D25 parameter, as no relationship was highlighted both in PCA and in GLM. This result appeared inconsistent with those found by different studies, since the effect of pH on nitrification has been widely shown. The literature reported that complete inhibition of nitrification could occur at a pH lower than 6.35 and higher than 8.95; meanwhile, from 6.45 to 8.95, there was no effect and complete nitrification occurred [63]. In the present work, the initial pH values were included in this range, which were always more than 6.5 and less than 8.9, and no nitrification inhibition could be highlighted, as we did not observe a postponed nitrification start in relation to the lower values of pH. Similar observations could be reported for alkalinity, which has been widely reported to affect the nitrification process [64,65]. Alkalinity is an important parameter, as it influences pH and is a measure of the inorganic carbon available for nitrifiers; a lack of alkalinity will stop nitrification. Alkalinity is consumed at 7.14 g as CaCO3 per gram of NH4+ oxidized to NO2− and, consequently, it decreases during the nitrification process. Optimal values for nitrification range from 75 to 150 mg CaCO3/L [66,67]. Our statistical analyses did not show a significant influence of the initial alkalinity (ranging from 13 to 216 mg CaCO3/L) on the number of days elapsed from the experiment start until a decrease of ammonium concentration equal to 25% was achieved.
We also evaluated the effect of seasonality on the nitrification process, based on the lake temperature detected when the water samples were collected. Our results did not show any effects of the lake in-situ temperature on the commencement of oxidation in the lab-microcosms, even though the samples collected in different months provided lake water temperatures ranging from 5.6 to 27.3 °C. Indeed, the temperature affects the growth rate of both types of bacteria involved in the nitrification process, with ammonia oxidizers having superior growth rates at high temperatures when compared to nitrite oxidizers [63]. We hypothesized that in lab-microcosms, which were constantly maintained at 20 °C, the commencement of oxidation was affected by the bacteria acclimation lag time, as Zhu and Chen [54] reported that nitrifying bacteria can adapt to a wide range of temperatures if acclimated slowly. However, it has to be highlighted that using temperature as an indicator of seasonality could restrict the analysis of this predictor factor. In effect, several lakes showed a higher rate of oxidation at the start (February–March) compared to the end (October–November) of the growing season.
Although a clear seasonal pattern could not be highlighted overall, some lakes showed a difference in the D25 value among the experiments. However, these differences did not appear to be related to the month, since for some lakes (e.g., L. Maggiore, L. Mergozzo, L. Pusiano, L. Segrino, L. Varese) the higher value of D25 was recorded in autumn, while for others (e.g., L. Monate, L. Montorfano, L. Orta), the higher value was recorded in summer. Furthermore, the interaction between seasonality and nutrient contents (in GLM) was not selected among the predictive parameters of the decrease in ammonium concentrations and of the oxidation rate in microcosms. Future research with a field-scale approach should help to clarify the role of seasonality in the nitrification process.
Our research highlighted an important role of the initial acclimation in the determination of the time needed to oxidize all ammonium, as the range of the D25 parameter was quite large compared to the range of days elapsed from D25 to D95. Once it began, the ammonium oxidation rate was significantly and positively affected by the natural content of ammonium in the lakes, as highlighted by the second GLM model [12,62,68].
In conclusion, the time required to oxidize a 1 mg/L ammonium addition in microcosms filled with water of 14 south-alpine lakes showed a remarkable range. Lake trophic status and nutrient concentrations have been shown to play important roles in determining the time elapsed before the beginning of nitrification processes, while the natural ammonium concentration in lakes significantly influences the nitrification rate of additional ammonium inputs.
Acknowledgments
This work was supported by the University of Milano-Bicocca (FA). We are grateful to Letizia Garibaldi, Alba Varallo and Angela Ferrauto. We thank the anonymous reviewers for their comments, which helped to improve this article.
Author Contributions
B.L. conceived the study, performed lab experiments, discussed results, wrote the text; M.P. collected samples, performed lab analyses and discussed results; V.S. collected samples and performed lab analyses; V.N. performed statistical analyses, discussed results and wrote the text.
Conflicts of Interest
The authors declare no conflict of interest.
References
- Benli, A.Ç.K.; Köksal, G.; Özkul, A. Sublethal ammonia exposure of Nile tilapia (Oreochromis niloticus L.): Effects on gill, liver and kidney histology. Chemosphere 2008, 72, 1355–1358. [Google Scholar] [CrossRef] [PubMed]
- Li, M.; Yu, N.; Qin, J.G.; Li, E.; Du, Z.; Chen, L. Effects of ammonia stress, dietary linseed oil and Edwardsiella ictaluri challenge on juvenile darkbarbel catfish Pelteobagrus vachelli. Fish Shellfish Immunol. 2014, 38, 158–165. [Google Scholar] [CrossRef] [PubMed]
- Collos, Y.; Harrison, P.J. Acclimation and toxicity of high ammonium concentrations to unicellular algae. Mar. Pollut. Bull. 2014, 80, 8–23. [Google Scholar] [CrossRef] [PubMed]
- Zekker, I.; Rikmann, E.; Tenno, T.; Kroon, K.; Vabamäe, P.; Salo, E.; Tenno, T.; Loorits, L.; Dc Rubin, S.S.C.; Vlaeminck, S.E. Deammonification process start-up after enrichment of anammox microorganisms from reject water in a moving-bed biofilm reactor. Environ. Technol. (United Kingdom) 2013, 34, 3095–3101. [Google Scholar] [CrossRef] [PubMed]
- Zekker, I.; Rikmann, E.; Tenno, T.; Vabamäe, P.; Kroon, K.; Loorits, L.; Saluste, A.; Tenno, T. Effect of concentration on anammox nitrogen removal rate in a moving bed biofilm reactor. Environ. Technol. 2012, 33, 2263–2271. [Google Scholar] [CrossRef] [PubMed]
- Leoni, B.; Garibaldi, L. Population dynamics of Chaoborus flavicans and Daphnia spp.: Effects on a zooplankton community in a volcanic eutrophic lake with naturally high metal concentrations (L. Monticchio Grande, Southern Italy). J. Limnol. 2009, 68, 37–45. [Google Scholar] [CrossRef]
- Wajsbrot, N.; Gasith, A.; Diamant, A.; Popper, D.M. Chronic toxicity of ammonia to juvenile gilthead seabream Sparus aurata and related histopathological effects. J. Fish Biol. 1993, 42, 321–328. [Google Scholar] [CrossRef]
- Hargreaves, J.A.; Tucker, C.S. Managing Ammonia in Fish Ponds; SRAC Publication: Stoneville, MS, USA, 2004. [Google Scholar]
- Brandes, J.A.; Devol, A.H.; Deutsch, C. New developments in the marine nitrogen cycle. Chem. Rev. 2007, 107, 577–589. [Google Scholar] [CrossRef] [PubMed]
- Zekker, I.; Rikmann, E.; Kroon, K.; Mandel, A.; Mihkelson, J. Ameliorating nitrite inhibition in a low-temperature nitritation–anammox MBBR using bacterial intermediate nitric oxide. Int. J. Environ. Sci. Technol. 2017, 14, 2343–2356. [Google Scholar] [CrossRef]
- Hayden, C.J.; Beman, J.M. High abundances of potentially active ammonia-oxidizing bacteria and archaea in oligotrophic, high-altitude lakes of the Sierra Nevada, California, USA. PLoS ONE 2014, 9, e111560. [Google Scholar] [CrossRef] [PubMed]
- Mukherjee, M.; Ray, A.; Post, A.F.; McKay, R.M.; Bullerjahn, G.S. Identification, enumeration and diversity of nitrifying planktonic archaea and bacteria in trophic end members of the Laurentian Great Lakes. J. Great Lakes Res. 2016, 1, 39–49. [Google Scholar] [CrossRef]
- Bernhard, A.E.; Tucker, J.; Giblin, A.E.; Stahl, D.A. Functionally distinct communities of ammonia-oxidizing bacteria along an estuarine salinity gradient. Environ. Microbiol. 2007, 9, 1439–1447. [Google Scholar] [CrossRef] [PubMed]
- Wang, C.; Liu, J.; Wang, Z.; Pei, Y. Nitrification in lake sediment with addition of drinking water treatment residuals. Water Res. 2014, 56, 234–245. [Google Scholar] [CrossRef] [PubMed]
- Randall, D.J.; Tsui, T.K.N. Ammonia toxicity in fish. Mar. Pollut. Bull. 2002, 45, 17–23. [Google Scholar] [CrossRef]
- Sinha, A.K.; Liew, H.J.; Diricx, M.; Blust, R.; De Boeck, G. The interactive effects of ammonia exposure, nutritional status and exercise on metabolic and physiological responses in gold fish (Carassius auratus L.). Aquat. Toxicol. 2012, 109, 33–46. [Google Scholar] [CrossRef] [PubMed]
- Cheng, C.H.; Yang, F.F.; Ling, R.Z.; Liao, S.A.; Miao, Y.T.; Ye, C.X.; Wang, A.L. Effects of ammonia exposure on apoptosis, oxidative stress and immune response in pufferfish (Takifugu obscurus). Aquat. Toxicol. 2015, 164, 61–71. [Google Scholar] [CrossRef] [PubMed]
- Rikmann, E.; Zekker, I.; Tenno, T.; Saluste, A.; Tenno, T. Inoculum-free start-up of biofilm- and sludge-based deammonification systems in pilot scale. Int. J. Environ. Sci. Technol. 2018, 15, 133–148. [Google Scholar] [CrossRef]
- Pauer, J.J.; Auer, M.T. Nitrification in the water column and sediment of a hypereutrophic lake and adjoining river system. Water Res. 2000, 34, 1247–1254. [Google Scholar] [CrossRef]
- Beaulieu, J.J.; Tank, J.L.; Hamilton, S.K.; Wollheim, W.M.; Hall, R.O.; Mulholland, P.J.; Peterson, B.J.; Ashkenas, L.R.; Cooper, L.W.; Dahm, C.N.; et al. Nitrous oxide emission from denitrification in stream and river networks. Proc. Natl. Acad. Sci. USA 2011, 108, 214–219. [Google Scholar] [CrossRef] [PubMed]
- Zhao, X.; Wei, Z.; Zhao, Y.; Xi, B.; Wang, X.; Zhao, T.; Zhang, X.; Wei, Y. Environmental factors influencing the distribution of ammonifying and denitrifying bacteria and water qualities in 10 lakes and reservoirs of the Northeast, China. Microb. Biotechnol. 2015, 8, 541–548. [Google Scholar] [CrossRef] [PubMed]
- Smith, V.; Wood, S.; McBride, C.; Atalah, J.; Hamilton, D. Phosphorus and nitrogen loading restraints are essential for successful eutrophication control of Lake Rotorua, New Zealand. Inland Waters 2016, 6, 273–283. [Google Scholar] [CrossRef]
- Lipschultz, F.; Wofsy, S.C.; Fox, L.E. The effects of light and nutrients on rates of ammonium transformation in a eutrophic river. Mar. Chem. 1985, 16, 329–341. [Google Scholar] [CrossRef]
- Usui, T.; Koike, I.; Ogura, N. N2O production, nitrification and denitrification in an estuarine sediment. Estuar. Coast. Shelf Sci. 2001, 52, 769–781. [Google Scholar] [CrossRef]
- Strauss, E.A.; Richardson, W.B.; Bartsch, L.A.; Cavanaugh, J.C.; Bruesewitz, D.A.; Imker, H.; Heinz, J.A.; Soballe, D.M. Nitrification in the Upper Mississippi River: Patterns, controls, and contribution to the NO3− budget. J. N. Am. Benthol. Soc. 2004, 23, 1–14. [Google Scholar] [CrossRef]
- Small, G.E.; Bullerjahn, G.S.; Sterner, R.W.; Beall, B.F.N.; Brovold, S.; Finlay, J.C.; McKay, R.M.L.; Mukherjee, M. Rates and controls of nitrification in a large oligotrophic lake. Limnol. Oceanogr. 2013, 58, 276–286. [Google Scholar] [CrossRef]
- Leoni, B.; Nava, V.; Patelli, M. Relationship among climate variability, Cladocera phenology and pelagic food web in deep lakes in different trophic state. Mar. Freshw. Res. 2017. accepted for publication. [Google Scholar]
- Kowalczewska-Madura, K.; Godyn, R.; Dera, M. Spatial and seasonal changes of phosphorus internal loading in two lakes with different trophy. Ecol. Eng. 2015, 74, 187–195. [Google Scholar] [CrossRef]
- Poste, A.E.; Muir, D.C.G.; Guildford, S.J.; Hecky, R.E. Bioaccumulation and biomagnification of mercury in African lakes: The importance of trophic status. Sci. Total Environ. 2015, 506–507, 126–136. [Google Scholar] [CrossRef] [PubMed]
- Premazzi, G.; Chiaudani, G. Ecological Quality of Surface Waters: Quality Assessment Schemes for European Community Lakes; European Commission: Brussels, Luxembourg, 1992; Volume 14563.
- Ambrosetti, W.; Barbanti, L. Physical limnology of Italian lakes. 1. Relationship between morphometry and heat content. J. Limnol. 2003, 61, 147–157. [Google Scholar] [CrossRef]
- Leoni, B.; Morabito, G.; Rogora, M.; Pollastro, D.; Mosello, R.; Arisci, S.; Forasacco, E.; Garibaldi, L. Response of planktonic communities to calcium hydroxide addition in a hardwater eutrophic lake: Results from a mesocosm experiment. Limnology 2007, 8, 121–130. [Google Scholar] [CrossRef]
- Riccardi, N.; Mangoni, M. Considerations on the biochemical composition of some freshwater zooplankton species. J. Limnol. 1999, 58, 58–65. [Google Scholar] [CrossRef]
- Volta, P.; Jeppesen, E.; Leoni, B.; Campi, B.; Sala, P.; Garibaldi, L.; Lauridsen, T.L.; Winfield, I.J. Recent invasion by a non-native cyprinid (common bream Abramis brama) is followed by major changes in the ecological quality of a shallow lake in southern Europe. Biol. Invasions 2013, 15, 2065–2079. [Google Scholar] [CrossRef] [Green Version]
- Rogora, M.; Mosello, R.; Kamburska, L.; Salmaso, N.; Cerasino, L.; Leoni, B.; Garibaldi, L.; Soler, V.; Lepori, F.; Colombo, L.; et al. Recent trends in chloride and sodium concentrations in the deep subalpine lakes (Northern Italy). Environ. Sci. Pollut. Res. 2015, 22, 19013–19026. [Google Scholar] [CrossRef] [PubMed]
- American Public Health Association (APHA). Standard Methods for the Examination of Water and Wastewater; American Public Health Association: Washington, DC, USA, 1998; p. 552. [Google Scholar]
- Marti, C.M.; Imberger, J.; Garibaldi, L.; Leoni, B. Using time scales to characterize phytoplankton assemblages in a deep subalpine lake during the thermal stratification period: Lake Iseo, Italy. Water Resour. Res. 2015, 52, 1762–1780. [Google Scholar] [CrossRef]
- Van Der Maaten, L.J.P.; Postma, E.O.; Van Den Herik, H.J. Dimensionality Reduction: A Comparative Review. J. Mach. Learn. Res. 2009, 10, 1–41. [Google Scholar] [CrossRef]
- Jollife, I.T.; Cadima, J. Principal component analysis: A review and recent developments. Philos. Trans. A Math. Phys. Eng. Sci. 2016, 374, 20150202. [Google Scholar] [CrossRef] [PubMed]
- Madsen, H.; Thyregod, P. Introduction to General and Generalized Linear Models; CRC Press: Boca Raton, FL, USA, 2010; ISBN 9781420091557. [Google Scholar]
- Leoni, B.; Marti, C.L.; Imberger, J.; Garibaldi, L. Summer spatial variations in phytoplankton composition and biomass in surface waters of a warm-temperate, deep, oligo-holomictic lake: Lake Iseo, Italy. Inland Waters 2014, 4, 303–310. [Google Scholar] [CrossRef]
- Miller, A.J. Subset Selection in Regression; Chapman & Hall/CRC: Boca Raton, FL, USA, 2002; ISBN 9781584881711. [Google Scholar]
- Schützenmeister, A.; Jensen, U.; Piepho, H.P. Checking normality and homoscedasticity in the general linear model using diagnostic plots. Commun. Stat. Simul. Comput. 2012, 41, 141–154. [Google Scholar] [CrossRef]
- R Core Team. R: A Language and Environment for Statistical Computing; R Core Team: Vienna, Austria, 2017; ISBN 3_900051_00_3. [Google Scholar]
- Wickham, H. ggplot2: Elegant Graphics for Data Analysis; Springer-Verlag: New York, NY, USA, 2009; Volume 35, ISBN 9780387981406. [Google Scholar]
- Wei, T.; Simko, V. R Package “Corrplot”: Visualization of a Correlation Matrix (Version 0.84). Available online: https://github.com/taiyun/corrplot (accessed on 14 November 2017).
- Kassambara, A.; Mundt, F. Factoextra: Extract and Visualize the Results of Multivariate Data Analyses (Version 1.0.5). Available online: https://CRAN.R-project.org/package=factoextra (accessed on 22 August 2017).
- Camargo, J.A.; Alonso, Á. Ecological and toxicological effects of inorganic nitrogen pollution in aquatic ecosystems: A global assessment. Environ. Int. 2006, 32, 831–849. [Google Scholar] [CrossRef] [PubMed]
- Rabalais, N.N. Nitrogen in Aquatic Ecosystems. Ambio 2002, 31, 102–112. [Google Scholar] [CrossRef] [PubMed]
- U.S. Environmental Protection Agency. Aquatic Life Ambient Water Quality Criteria for Ammonia—Freshwater; U.S. Environmental Protection Agency: Washington, DC, USA, 2013; Volume 78, pp. 67–79.
- Netten, J.J.C.; van der Heide, T.; Smolders, A.J.P. Interactive effects of pH, temperature and light during ammonia toxicity events in Elodea canadensis. Chem. Ecol. 2013, 29, 448–458. [Google Scholar] [CrossRef]
- Loken, L.C.; Small, G.E.; Finlay, J.C.; Sterner, R.W.; Stanley, E.H. Nitrogen cycling in a freshwater estuary. Biogeochemistry 2016, 127, 199–216. [Google Scholar] [CrossRef]
- Gobler, C.J.; Burkholder, J.M.; Davis, T.W.; Harke, M.J.; Johengen, T.; Stow, C.A.; Van De Waal, D.B. The dual role of nitrogen supply in controlling the growth and toxicity of cyanobacterial blooms. Harmful Algae 2016, 54, 87–97. [Google Scholar] [CrossRef] [PubMed]
- Nava, V.; Patelli, M.; Soler, V.; Leoni, B. Interspecific relationship and ecological requirements of two potentially harmful cyanobacteria in a Deep South-Alpine Lake (L. Iseo, I). Water (Switzerland) 2017, 9, 993. [Google Scholar] [CrossRef]
- Glibert, P.M.; Wilkerson, F.P.; Dugdale, R.C.; Raven, J.A.; Dupont, C.L.; Leavitt, P.R.; Parker, A.E.; Burkholder, J.M.; Kana, T.M. Pluses and minuses of ammonium and nitrate uptake and assimilation by phytoplankton and implications for productivity and community composition, with emphasis on nitrogen-enriched conditions. Limnol. Oceanogr. 2016, 61, 165–197. [Google Scholar] [CrossRef]
- Nimptsch, J.; Pflugmacher, S. Ammonia triggers the promotion of oxidative stress in the aquatic macrophyte Myriophyllum mattogrossense. Chemosphere 2007, 66, 708–714. [Google Scholar] [CrossRef] [PubMed]
- Gerletti, M.; Provini, A. Effect of nitrification in Lake Orta. In Ninth International Conference on Water Pollution Research, Proceedings of the 9th International Conference, Stockholm, Sweden, 12–16 June 1978; Elsevier: Amsterdam, The Netherlands, 1979; pp. 839–851. ISBN 9780080229393. [Google Scholar]
- Kim, J.H.; Guo, X.; Park, H.S. Comparison study of the effects of temperature and free ammonia concentration on nitrification and nitrite accumulation. Process Biochem. 2008, 43, 154–160. [Google Scholar] [CrossRef]
- Anthonisen, A.; Loehr, R.; Prakasam, T.; Srinath, E. Inhibition of Nitrification by Ammonia and Nitrous Acid. J. Water Pollut. Control Fed. 1976, 48, 835–852. [Google Scholar] [CrossRef] [PubMed]
- Hira, D.; Aiko, N.; Yabuki, Y.; Fujii, T. Impact of aerobic acclimation on the nitrification performance and microbial community of landfill leachate sludge. J. Environ. Manag. 2018, 209, 188–194. [Google Scholar] [CrossRef] [PubMed]
- Elser, J.J.; Bracken, M.E.S.; Cleland, E.E.; Gruner, D.S.; Harpole, W.S.; Hillebrand, H.; Ngai, J.T.; Seabloom, E.W.; Shurin, J.B.; Smith, J.E. Global analysis of nitrogen and phosphorus limitation of primary producers in freshwater, marine and terrestrial ecosystems. Ecol. Lett. 2007, 10, 1135–1142. [Google Scholar] [CrossRef] [PubMed]
- Yang, Y.; Zhang, J.; Zhao, Q.; Zhou, Q.; Li, N.; Wang, Y.; Xie, S.; Liu, Y. Sediment Ammonia-Oxidizing Microorganisms in Two Plateau Freshwater Lakes at Different Trophic States. Microb. Ecol. 2016, 71, 257–265. [Google Scholar] [CrossRef] [PubMed]
- Ruiz, G.; Jeison, D.; Chamy, R. Nitrification with high nitrite accumulation for the treatment of wastewater with high ammonia concentration. Water Res. 2003, 37, 1371–1377. [Google Scholar] [CrossRef]
- Biesterfeld, S.; Farmer, G.; Russell, P.; Figueroa, L. Effect of alkalinity type and concentration on nitrifying biofilm activity. Water Environ. Res. 2003, 75, 196–204. [Google Scholar] [CrossRef] [PubMed]
- Shanahan, J.W.; Semmens, M.J. Alkalinity and pH effects on nitrification in a membrane aerated bioreactor: An experimental and model analysis. Water Res. 2015, 74, 10–22. [Google Scholar] [CrossRef] [PubMed]
- Li, B.; Irvin, S. The comparison of alkalinity and ORP as indicators for nitrification and denitrification in a sequencing batch reactor (SBR). Biochem. Eng. J. 2007, 34, 248–255. [Google Scholar] [CrossRef]
- Lawson, T.B. Fundamentals of Aquacultural Engineering; Springer: Boston, MA, USA, 1995; ISBN 978-1-4612-7578-7. [Google Scholar]
- Isnansetyo, A.; Getsu, S.; Seguchi, M.; Koriyama, M. Independent Effects of Temperature, Salinity, Ammonium Concentration and pH on Nitrification Rate of the Ariake Seawater Above Mud Sediment. HAYATI J. Biosci. 2014, 21, 21–30. [Google Scholar] [CrossRef]
Figure 1.
Locations of the 14 sampling south-alpine lakes in Northern Italy. The numbers in the map are referred to lakes list in Table 1 (from d-maps.com modified).
Figure 1.
Locations of the 14 sampling south-alpine lakes in Northern Italy. The numbers in the map are referred to lakes list in Table 1 (from d-maps.com modified).

Figure 2.
Ammonium oxidation trends in lab-microcosms filled with water of 14 south-alpine lakes sampled in different months and amended with 1 mg /L of NH4+. Results are expressed as mean ±SEM for duplicate tests. Note that the SEM bars in most of cases showed low values.
Figure 2.
Ammonium oxidation trends in lab-microcosms filled with water of 14 south-alpine lakes sampled in different months and amended with 1 mg /L of NH4+. Results are expressed as mean ±SEM for duplicate tests. Note that the SEM bars in most of cases showed low values.

Figure 3.
Box plot of the number of days elapsed from the experiment start until an ammonia concentration decrease of 25% (D25) and 95% (D95) of the initial concentration in the 14 studied lakes. Note that for samples of Lakes Candia and Piano the experiment was performed only once during the study. Box plot statistics: the lower and upper hinges correspond to the first and third quartiles. The upper (lower) whisker extends from the hinge to the largest (smallest) value no further than 1.5 × InterQuartileRange from the hinge. Data beyond the end of the whiskers are outlying points and are plotted individually.

Figure 4.
Box plot of the OxRate, amount of ammonium oxidised in each day (µg NH4+/L day) to reduce the ammonium concentration from 25% to 95% of the initial concentration in amended microcosms. Note that for samples of Lakes Candia and Piano the experiment was performed only once during the study. See Figure 3 for box plot statistics.

Figure 5.
Loadings plots of the first two components of the principal component analysis (PCA) with different colors according to the parameters contributions (“contrib %”) performed on 8 chemico-physical parameters and (a) number of days elapsed from the beginning of the experimental procedure until an ammonium concentration decrease equal to the 25% (D25); and, (b) oxidation rate of ammonium (OxRate). See “Materials and Methods” for abbreviations.


Table 1.
Main morphometric and chemico-physical characteristics of 14 south-alpine lakes [31,32,33,34,35].
| Lake | Area (km2) | Volume (m3 × 106) | Depthmax (m) | Depthmean (m) | Trophic Status |
|---|---|---|---|---|---|
| 1-Alserio | 1.23 | 6.55 | 8.1 | 5.3 | Hypereutrophic |
| 2-Annone (W) | 1.75 | 7.60 | 10.0 | 4.5 | Eutrophic |
| 3-Candia | 1.49 | 8.10 | 7.7 | 3.8 | Meso-eutrophic |
| 4-Comabbio | 3.58 | 16.40 | 7.7 | 4.6 | Hypereutrophic |
| 5-Maggiore | 213 | 37500 | 370 | 176 | Oligotrophic |
| 6-Mergozzo | 1.83 | 83.00 | 73.0 | 45.4 | Oligotrophic |
| 7-Monate | 2.51 | 45.00 | 34.0 | 14.4 | Oligotrophic |
| 8-Montorfano | 1.90 | 1.90 | 6.8 | 4.0 | Meso-eutrophic |
| 9-Olginate | 0.58 | 7.00 | 17.0 | 8.0 | Meso-eutrophic |
| 10-Orta | 18.10 | 1286 | 143 | 70.9 | Oligotrophic |
| 11-Piano | 0.63 | 4.03 | 12.5 | 5.1 | Eutrophic |
| 12-Pusiano | 4.93 | 69.00 | 24.3 | 14.0 | Eutrophic |
| 13-Segrino | 0.38 | 1.20 | 9.0 | 4.6 | Oligotrophic |
| 14-Varese | 14.90 | 162 | 26.0 | 9.9 | Hypereutrophic |
Table 2.
Mean value ±SEM of the chemico-physical parameters of the 14 lakes, calculated on measurements performed in different months. Note that for Lake Candia and Piano the values refer to a single month. n: number of experiments performed for each lake.
Table 2.
Mean value ±SEM of the chemico-physical parameters of the 14 lakes, calculated on measurements performed in different months. Note that for Lake Candia and Piano the values refer to a single month. n: number of experiments performed for each lake.
| Lake | n | TP (µg/L) | SRP (µg/L) | TN (µg/L) | NO3− (µg/L) | NH4+ (µg/L) | Temperature (°C) | Alkalinity (meq/L) | pH (Units) |
|---|---|---|---|---|---|---|---|---|---|
| 1-Alserio | 5 | 31.9 ± 2.4 | 17.5 ± 3.4 | 2930 ± 333 | 1680 ± 543 | 320 ± 137 | 13.7 ± 2.8 | 3.8 ± 0.2 | 8.0 ± 0.1 |
| 2-Annone (W) | 4 | 27.1 ± 2.2 | 8.7 ± 0.5 | 870 ± 79 | 171 ± 82 | 87 ± 43 | 15.1 ± 4.0 | 2.9 ± 0.1 | 8.3 ± 0.1 |
| 3-Candia | 1 | 18.0 | 2.0 | 1060 | 170 | 17 | 27 | 1.18 | 7.5 |
| 4-Comabbio | 4 | 30.5 ± 5.5 | 16.2 ± 3.6 | 860 ± 105 | 158 ± 88 | 89 ± 75 | 15.2 ± 4.0 | 2.0 ± 0.1 | 8.4 ± 0.1 |
| 5-Maggiore | 4 | 7.6 ± 0.7 | 3.5 ± 0.6 | 885 ± 53 | 648 ± 61 | 10 ± 5 | 14.4 ± 3.5 | 0.9 ± 0.2 | 7.9 ± 0.2 |
| 6-Mergozzo | 4 | 5.0 ± 0.7 | 2.5 ± 0.3 | 851 ± 64 | 595 ± 36 | 15 ± 10 | 14.8 ± 3.8 | 0.3 ± 0.1 | 7.3 ± 0.3 |
| 7-Monate | 3 | 8.0 ± 1.3 | 2.0 ± 0.6 | 459 ± 13 | 158 ± 27 | 16 ± 6 | 13.6 ± 4.0 | 1.1 ± 0.2 | 7.9 ± 0.5 |
| 8-Montorfano | 7 | 18.3 ± 2.5 | 6.8 ± 0.6 | 936 ± 84 | 129 ± 50 | 245 ± 94 | 16.3 ± 2.9 | 1.9 ± 0.1 | 8.3 ± 0.1 |
| 9-Olginate | 4 | 18.0 ± 1.9 | 5.7 ± 1.8 | 942 ± 60 | 648 ± 79 | 39 ± 7 | 13.5 ± 3.5 | 1.4 ± 0.3 | 8.2 ± 0.3 |
| 10-Orta | 4 | 7.2 ± 1.4 | 3.2 ± 0.5 | 1537 ± 19 | 1313 ± 24 | 16 ± 7 | 14.7 ± 3.7 | 0.3 ± 0.1 | 7.2 ± 0.3 |
| 11-Piano | 1 | 63.0 | 8.0 | 2069 | 1424 | 677 | 11 | 3.8 | 8.4 |
| 12-Pusiano | 4 | 26.0 ± 4.6 | 3.6 ± 0.5 | 1313 ± 256 | 667 ± 189 | 133 ± 89 | 14.8 ± 4.4 | 2.6 ± 0.2 | 8.1 ± 0.2 |
| 13-Segrino | 7 | 10.7 ± 0.7 | 4.0 ± 0.5 | 1311 ± 195 | 751 ± 198 | 85 ± 16 | 11.4 ± 2.5 | 2.4 ± 0.1 | 7.9 ± 0.1 |
| 14-Varese | 5 | 50.4 ± 19.1 | 38.2 ± 18.3 | 901 ± 104 | 220 ± 71 | 117 ± 88 | 12.7 ± 3.1 | 2.5 ± 0.1 | 7.9 ± 0.1 |
Table 3.
Final General Linear Model and parameter estimates of (a) the response variable D25 and (b) the response variable OxRate. Number of tested data was 56 in each model and the months included ranged from February to December.
Table 3.
Final General Linear Model and parameter estimates of (a) the response variable D25 and (b) the response variable OxRate. Number of tested data was 56 in each model and the months included ranged from February to December.
| Model | Response Variable | Predictor | t | p |
|---|---|---|---|---|
| (a) | D25 | TP | −3.133 | 0.003 ** |
| TN | −2.974 | 0.004 ** | ||
| (b) | OxRate | NH4+ | 3.422 | 0.002 ** |
Note: ** p < 0.01.
© 2018 by the authors. Licensee MDPI, Basel, Switzerland. This article is an open access article distributed under the terms and conditions of the Creative Commons Attribution (CC BY) license (http://creativecommons.org/licenses/by/4.0/).
Share and Cite
MDPI and ACS Style
Leoni, B.; Patelli, M.; Soler, V.; Nava, V. Ammonium Transformation in 14 Lakes along a Trophic Gradient. Water 2018, 10, 265. https://doi.org/10.3390/w10030265
AMA Style
Leoni B, Patelli M, Soler V, Nava V. Ammonium Transformation in 14 Lakes along a Trophic Gradient. Water. 2018; 10(3):265. https://doi.org/10.3390/w10030265
Chicago/Turabian StyleLeoni, Barbara, Martina Patelli, Valentina Soler, and Veronica Nava. 2018. "Ammonium Transformation in 14 Lakes along a Trophic Gradient" Water 10, no. 3: 265. https://doi.org/10.3390/w10030265
Note that from the first issue of 2016, this journal uses article numbers instead of page numbers. See further details here.