Upscaling the Zeolite-Anammox Process: Treatment of Secondary Effluent


Biological & Agricultural Engineering, UC Davis, Davis, CA 95616, USA
*
Author to whom correspondence should be addressed.
Water 2018, 10(3), 236; https://doi.org/10.3390/w10030236
Submission received: 17 January 2018
/
Revised: 13 February 2018
/
Accepted: 13 February 2018
/
Published: 25 February 2018
(This article belongs to the Special Issue Advances in Wastewater Treatment using Zeolite and Anammox)
Abstract
:Water quality in San Francisco Bay is reportedly adversely affected by nitrogen loading from the wastewater treatment plants (WWTPs) discharging around the periphery of the Bay. Here, we consider a zeolite-anammox system to remove ammonia and nitrate from secondary-treated wastewater at ambient temperatures (12–30 °C). Until now, use of anammox bacteria has been largely limited to treatment of high-ammonia content wastewater at warm temperatures (30–40 °C). Specifically, we investigate upscaling the zeolite-anammox system to nitrogen removal from relatively low-ammonia content (~35 NH3-N mg/L) effluent using gravity-fed 0.7 m wide and 0.17 m deep linear-channel reactors within pilot plants located at either the WWTP or some eight kilometers away. Following establishment, we monitored ammonia and nitrate concentrations along one reactor bi-weekly and only inflow–outflow concentrations at the other for more than a year. We found nearly complete ammonia removal within the first 22 m of reactor consistent with the theoretical 89% nitrogen removal capacity associated with the nitrogen-conversion stoichiometry of anammox bacteria. We also determined degradation parameters of a constant 1.41 mg NH3-N/L per hour in the first 15 m, or 20.7 g NH3-N/m3/day for overall reactor volume. At the higher flowrate of the second reactor, we achieved a removal rate of 42 g NH3-N/m3/day. Overall, the linear-channel reactors operated with minimal maintenance, no additional energy inputs (e.g., for aeration) and consistently achieved NH3-N discharge concentrations ~1 mg/L despite fluctuating temperatures and WWTP effluent concentrations of 20–75 mg NH3-N/L.
1. Introduction
Water quality studies of the San Francisco Bay (SFB) estuary [1] indicate that it is adversely affected by nitrogen and phosphorous inputs from multiple anthropogenic sources [2], the greatest being nitrogen loads from wastewater treatment plant (WWTP) discharges on the Bay periphery [3]. Nitrogenous waste (primarily ammonia and/or nitrate) is of particular concern in SFB, especially in the shallower reaches subject to tidal flood–drain processes. Ammonia is directly toxic to fish and marine life, while nitrate stimulates algal growth that depletes dissolved oxygen levels at night resulting in suffocation of oxygen-breathing organisms. In the past decade, State regulatory agencies noted that nutrient concentrations in SFB exceed those in other estuarine ecosystems where degradation is apparent. This observation has raised concerns that SFB may be trending toward, or already experiencing, adverse impacts due to high nutrient loads, thereby requiring greater regulation of WWTP nitrogen loading to the Bay.
We consider upscaling the zeolite-anammox treatment process [4] to the commercial scale at several WWTPs around the SFB. Here, we focus on its application towards nitrogen removal from low-ammonium content secondary-treated effluent from the Alvarado and Martinez WWTPs prior to its discharge in the SFB estuary. Specifically, we examine performance of a non-aerated, gravity-flow system that builds on our earlier proof-of-concept study [4].
“Traditional” nitrogen removal in WWTPs relies on a two-step treatment process of nitrification and denitrification where nitrifying bacteria oxidize ammonia to nitrate using available dissolved oxygen, and denitrifying bacteria reduce the nitrate to nitrogen gas, requiring both anaerobic conditions and an organic carbon (e.g., Biological Oxygen Demand, BOD5) source. Since discovery of anaerobic ammonium oxidation (dubbed ‘anammox’) bacteria in the 1990s, various anammox-based treatment systems have emerged that effectively convert ammonium eventually to nitrogen gas, thereby bypassing the usual denitrification process. Some anammox bacteria are capable of dissimilatory nitrate reduction to ammonium (DNRA) while other anammox convert the ammonia to H2N2 and eventually to simply nitrogen (N2) gas [5]. Similarly, treatment methods have emerged exploiting the large cation-exchange capacity of zeolite aggregates; however, some issues remain in upscaling their application in wastewater treatment due to media regeneration requirements. Grismer and Collison [6] provide a more detailed review of the use of zeolites and anammox bacteria in wastewater treatment systems and here we only briefly summarize their observations relevant to domestic wastewater treatment.
During the past two decades, laboratory and some pilot-scale studies of new approaches to nitrogen treatment include use of zeolite aggregates and anammox bacteria [6]; however, there are few reports of their application at full-scale WWTP operations. Zeolites are a commonly found deposit in some parts of the world whose aggregates have particle densities much less than that of quartz sand (roughly 1900 vs. ~2600 kg/m3, respectively), some internal porosity and unusually large cation-exchange capacity (CEC ~2 meq/g) for the type of mineral; a value approaching that of clay particles. Some research has explored use of zeolite aggregates as an ammonium adsorption substrate, but problems of regeneration of the exchange/adsorption sites limits full-scale application of this process alone. Discovered in WWTP anaerobic digesters and in several marine environments, identification of anammox bacteria metabolic processes were key towards closing nitrogen balance estimates in estuary-marine studies [5]. Lackner et al [7] reported their use in membrane and partial nitritation reactors at several WWTPs around the world. In contrast to these individual applications of either zeolite substrates or anammox bacteria, or the typical two-step process outlined above, the zeolite-anammox system uses an apparently symbiotic combination of nitrifying and anammox bacteria in zeolite aggregate biofilms [4]. It appears that the zeolite-anammox process immobilizes influent ammonium ions at cation-exchange sites and the anammox bacteria strip these ions from the zeolite surfaces that enable it to operate across a range of temperatures and influent ammonia concentrations [6].
Anammox bacteria prefer anaerobic environments and have much slower growth rates (doubling times of 10–11 days) as compared to typical nitrifying or denitrifying bacteria. In the zeolite-anammox reactors, the anammox presumably congregate at aerobic–anaerobic interfaces where they combine nitrite and ammonia to form nitrogen gas with some residual nitrate following the reaction observed by Strous, M. et al. [8] below.
NH4+ + 1.32 NO2− + 0.066 HCO3− + 0.13 H+ => 1.02 N2(g) + 0.26 NO3− + 2.03 H2O + 0.066 CH2O0.5N0.15
Theoretically based on the stoichiometry above, anammox can achieve up to 89% nitrogen removal depending on available nitrite and ammonium. Collison and Grismer [4] speculated that nitrifying bacteria in the zeolite biofilms convert approximately half the ammonia to nitrite using the first stage of nitrification while the adjacent anammox bacteria combine the ammonium and nitrite to form nitrogen gas. The continuous cycle of adsorption and biological removal of the ammonium ions provides a self-regenerating capacity to the zeolite-anammox system that is also self-regulating, requiring minimal monitoring and adjustment following establishment of the anammox colonies. That is, the zeolite-anammox reactor does not require additional heating or organic food source for the bacteria making it potentially simpler, easier, and less expensive to operate as compared to other reactor combinations that involve more careful manipulation, or control of various processes. With discovery of DNRA enzymes [5], some strains of anammox bacteria can convert both oxidized and reduced forms of nitrogen to ammonium and then to nitrogen gas. Regardless, successful employment of anammox bacteria in WWTP reactors provide an interesting opportunity to reduce WWTP nitrogen loads to sensitive receiving waters. Here, we investigate upscaling the zeolite-anammox process to the WWTP scale of operations and conditions.
2. Research and Project Objectives
While considerable laboratory-scale work related to use of zeolite aggregates or anammox bacteria for nitrogen removal from various wastewaters has provided insight into the various treatment mechanisms associated with the ion-exchange and autotrophic anammox processes, there has been little if any work considering the combined processes, especially at the commercial domestic WWTP scale (e.g., [9]). With the proof-of-concept, benchtop zeolite-anammox treatment system described by Collison and Grismer [4], we hypothesize that it is possible to upscale this process for efficient removal of ammonia from secondary-treated wastewater prior to discharge into sensitive environments.
We conducted these projects jointly with the Union Sanitary (USD) and the Contra Costa Central Sanitation Districts (CCCSD) taking secondary-treated wastewater from their Alvarado and Martinez WWTPs, respectively, to self-contained zeolite-anammox pilot-plant trailers either sited adjacent to Hayward Marsh (roughly eight kilometers from the Alvarado WWTP) or on-site at the Martinez WWTP. These WWTPs are part of the East Bay group of wastewater discharge agencies that are among the three greatest nitrogen dischargers to the central SFB region (RWQCB staff communication, 2012) and are anticipating stricter nitrogen discharge regulations. Both WWTPs are secondary treatment facilities with capacities of roughly 120,000–125,000 m3/day (30–33 mg/day). Their secondary treatment includes screening, primary sedimentation, activated sludge, secondary clarification, and chlorination/ disinfection processes, though the Martinez WWTP incinerates their sludge. While these processes remove most of the wastewater BOD and nitrate to less than ~3 mg/L, ammonia-N concentrations in the treated effluent received by the trailers ranged from 25 to 75 mg/L. The primary project goals were to reduce those NH3-N influent concentrations to nitrate and ammonia concentrations less than 3 and 5 mg/L, respectively. In this pilot-plant study, our objectives were to not only obtain these low effluent nitrogen concentration goals, but to also develop the constructed wetland nitrogen ‘degradation’ factors needed to expand the pilot-plant treatment systems to full-scale treatment capacity of more than 11,000 m3/day.
3. Methodology
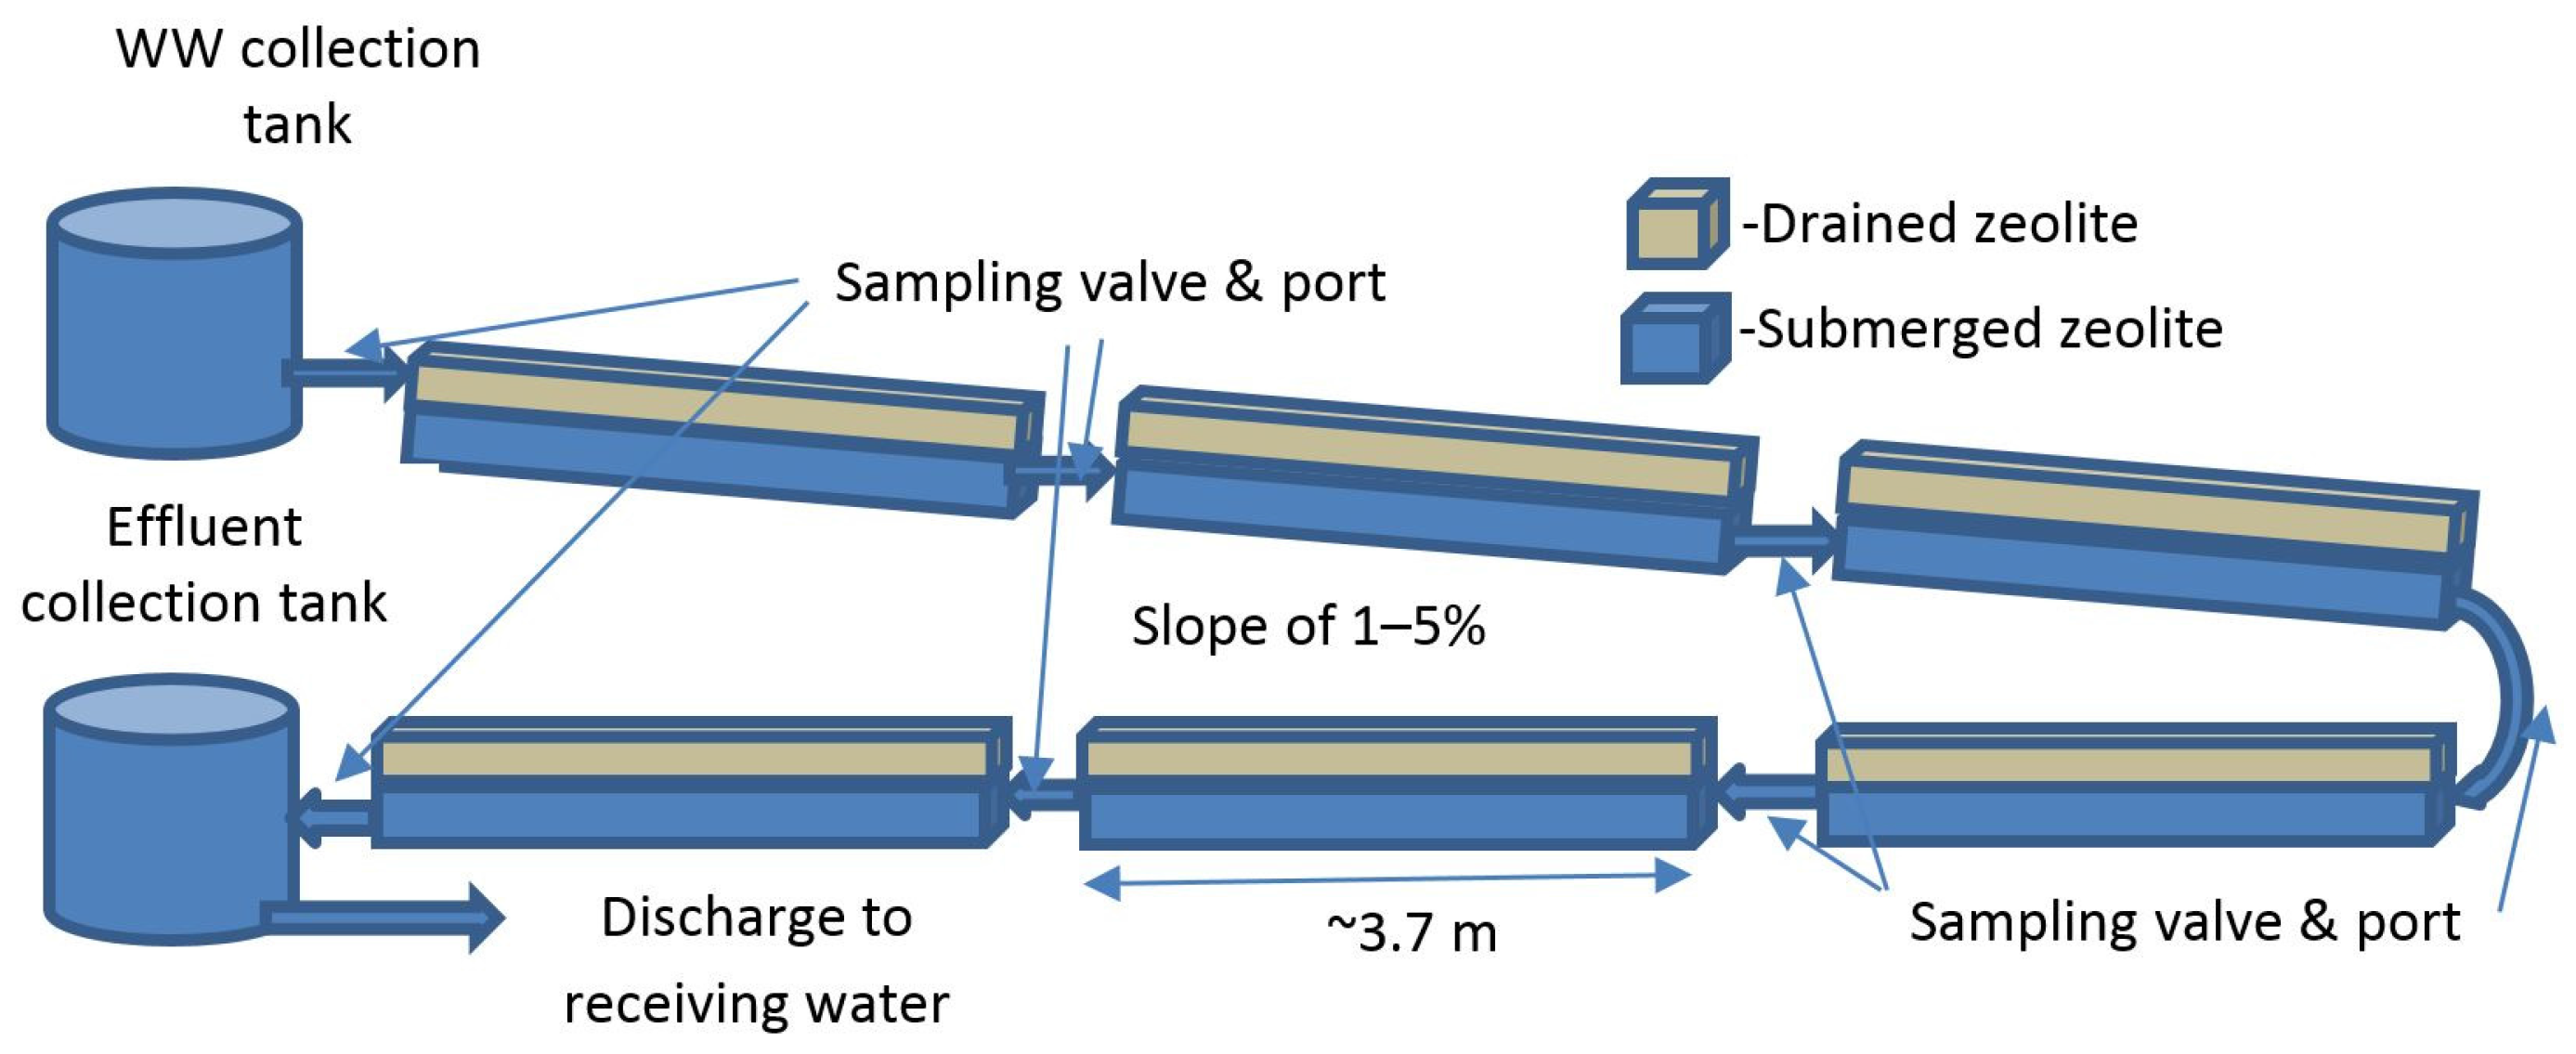
We constructed the zeolite-anammox pilot-plants within 15 m long trailers located at the Alvarado WWTP disposal site at Hayward Marsh or onsite at the Martinez WWTP. Approximately 11,400 m3/day (~3 mg/day) of this secondary-treated effluent from the Alvarado WWTP is piped 8 km for eventual discharge to the Hayward Marsh on the edge of SFB. We diverted the WWTP treated wastewater into header tanks within each trailer where flow was divided among different zeolite-anammox treatment systems. Here, we consider the gravity-fed, non-aerated linear-channel reactors that employed a serial sequence of six (Martinez WWTP) or twelve (Hayward marsh) roughly 3.7 m long by 0.7 m wide and 0.17 m deep channels as schematically shown in Figure 1.
We filled each channel section with ~20 mm (3/4 inch) zeolite (clinoptilolite) ‘drain rock’ from Ash Meadows near Pahrump, Nevada (see characteristics in Table 1) to a depth of about 0.15 m at a dry bulk density of about 850 kg/m3. This depth of aggregate enabled a small freeboard height to accommodate aggregate loading and fluctuating inflows. Normally, we maintained a flow depth of about 0.1 m such that the top ~50 mm of aggregate could “wick up” the wastewater as a “passive” aeration method, while the lower submerged layer favored anammox bacterial growth while collecting settling detritus and TSS. Thus, each section had an active pore volume of about 125 L, or about 1.5 to 3.0 m3 overall (for 6 or 12 sections). A short tube having a “T” valve connected channel sections together and facilitated water sampling along the combined linear-channel reactor. At the Hayward Marsh reactor, we sampled within and between channel sections during the study period while after establishing that only six sections were required, we sampled at only the inlet and outlet of the Martinez linear-channel reactor.
Following reactor setup within each trailer, at the Hayward Marsh reactor we ‘seeded’ the zeolite aggregate with anammox-containing effluent from the WWTP anaerobic digester at about 3% by volume for a few days prior to initiating flows from the WWTP. At the Martinez WWTP, we ‘seeded’ the linear-channel reactor with bio-zeolite (zeolite coated with anammox and nitrifier bacterial biofilms) aggregate at about 4% by volume before initiating flows from the WWTP. During the next 4 weeks at the Hayward Marsh pilot-plant, a steady flow of about 20 L/h of the secondary-treated effluent in the linear-channel reactor enabled the microbial communities to colonize the zeolite, while nearly 4 months of WWTP flows were required at the Martinez reactor to colonize the reactor successfully. Later at Hayward Marsh, we maintained a steady flowrate of about 38 L/h for the next 35 weeks. Following pumping problems and operational changes at the WWTP, the reactor inflow rate decreased to about 22 L/h with higher nitrogen concentrations for the next 4 months, returning to about 38 L/h during the final 2 months of the project. With our experience at the Hayward Marsh reactor, we used greater flowrates of about 110 L/h at the Martinez reactor during a nearly 11-month study period. At Hayward Marsh, ambient temperatures in the pilot-plant trailer were more variable than that at the WWTPs, fluctuating from 10 to 21 °C following seasonal weather trends. However, the influent temperature entering the trailers was a relatively constant 20–23 °C at a pH of 7–8 and BOD concentration of 2–4 mg/L.
Following apparent establishment of the anammox communities in the Hayward Marsh linear-channel reactor, we scraped biofilm samples from the aggregates and submitted them for testing by labs at the Universities of Columbia and California at Berkeley. Sampling biofilms from the zeolite aggregate was challenging and a standard sampling protocol has yet to be developed, though currently available DNA gene sequencing techniques require little sample material and simple cotton-tip swabbing seems to be adequate. Nonetheless, in biofilm samples collected in August 2013 from the zeolite-aggregate surfaces, the Earth and Environmental Engineering lab of Kartik Chandran at Columbia University identified relative abundances of 1.5–3.0% anammox, 0.5–1.5% of nitrobacter and about 1% nitrospira bacterial classes. Sampling again in October 2013, Yujie Men and her group in the Civil Engineering Lab at UC Berkeley, using DNA sequencing of the covers of the anammox 16S ribosomal subunits found about 6 × 10⁷ gene copies/ml, an order of magnitude less than, but readily comparable to that of 9 × 10⁸ gene copies/mL from an enriched anammox culture in her lab. While both labs found anammox bacteria in the zeolite biofilm samples, unfortunately, neither lab reported particular anammox taxonomy in the samples.
Water quality analyses of reactor water samples were conducted within the WWTP labs as needed for regulatory compliance as well as through Alpha Analytical Laboratories (California NELAP Certified) using standard quality assurance procedures that included blank, chemical standard and replicate samples with each run of sample analyses for a particular constituent. Table 2 summarizes the analytical methods used. Though we operated the Hayward Marsh pilot-plant continuously from August 2012 to December 2013, we analyze roughly bi-weekly sampling results from two periods that included the first 11 and the last 2 months of fairly steady influent nitrogen loads (13-month period), and then the August–September, 2-month period having a smaller average inflow rate, but greater influent ammonia concentrations. Similarly, we focus on the roughly bi-weekly inlet–outlet sampling at the Martinez reactor during the 11-month period of December 2014 to October 2015.
4. Results and Discussion
Before considering the performance of the linear-channel reactor with respect to nitrogen removal, we first briefly review the general water quality characteristics. Table 3 summarizes the water quality characteristics from limited sampling at the pilot-plant inlets and linear-channel reactor outlets during the study period. Dissolved oxygen contents of the wastewater generally increased from 0.1 to roughly 8 mg/L along the length of the Hayward Marsh channel reactor and depended primarily on the sampling location. While converting ammonia to nitrite generally lowers pH (nitrification step), pH varied little and posed no practical problems because of the relatively low influent NH3 concentration (~35 mg/L) with more than adequate alkalinity to buffer the systems and because both ammonia and nitrate removal occurred within the same reactor. Alkalinity and P-species declined slightly across the reactor length, while Na ions replaced Ca ions due to preferential divalent cation adsorption by the zeolite. Other constituent concentrations remained more-or-less constant during the study period.
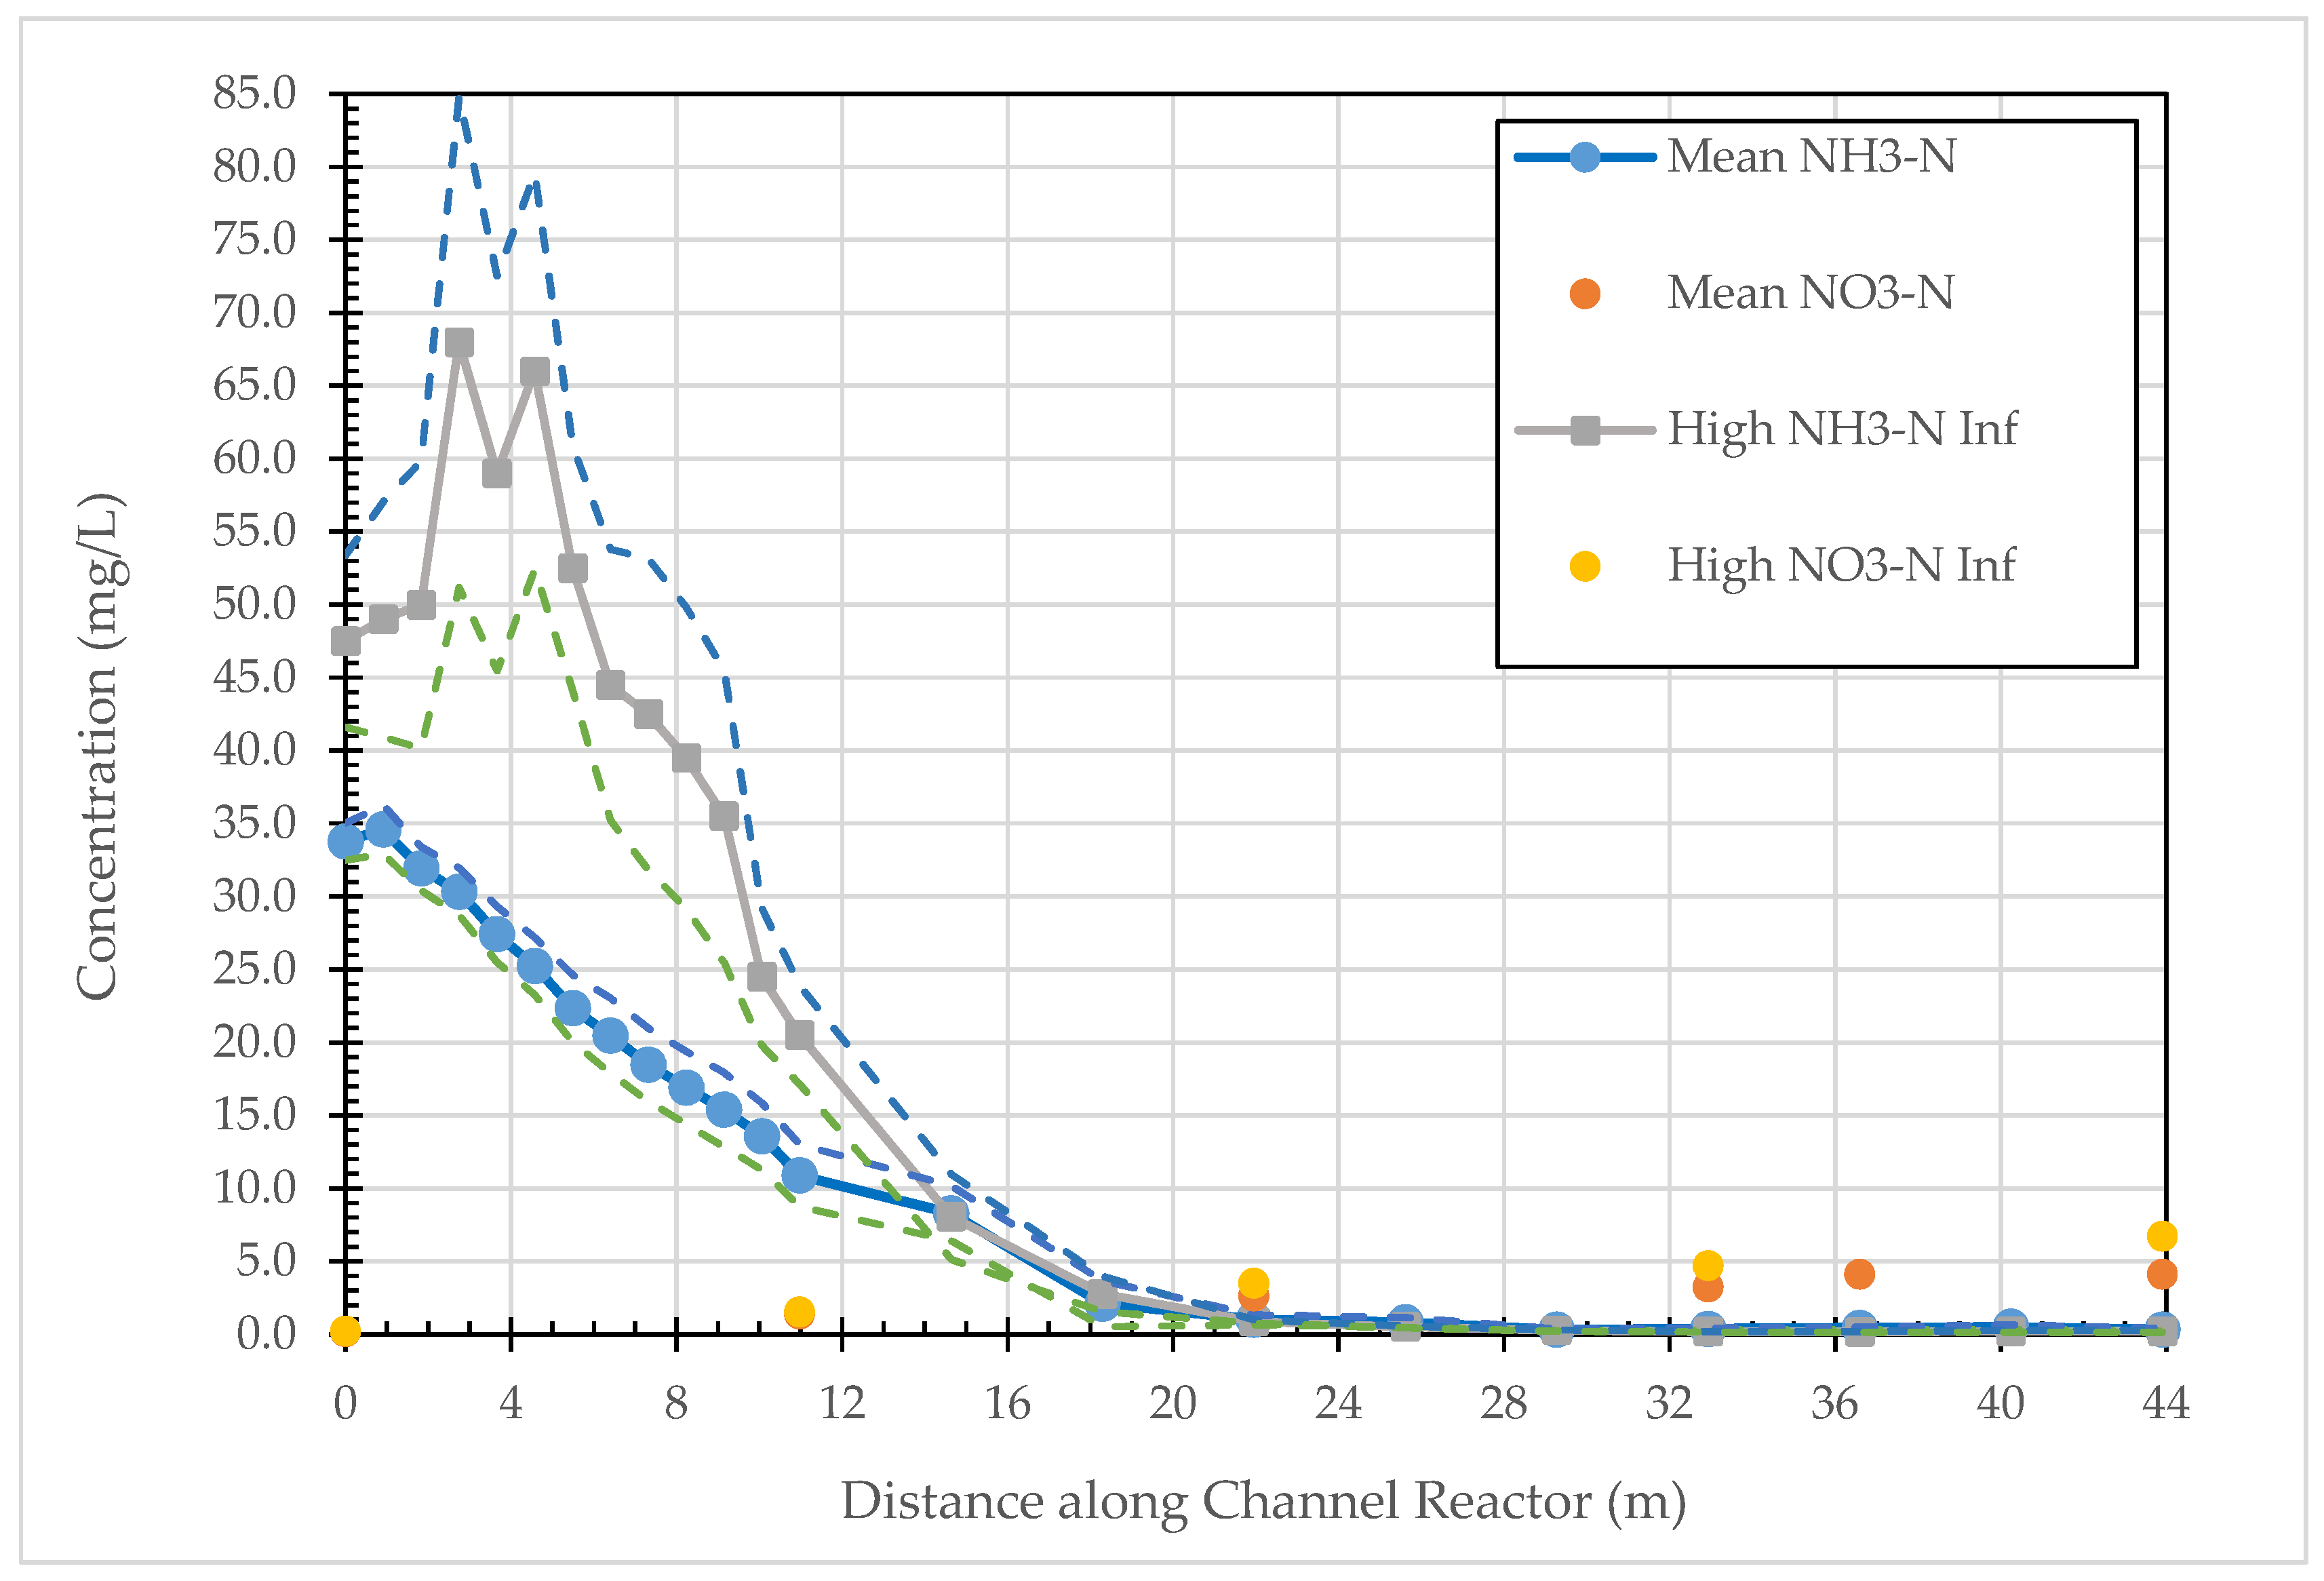
We first consider sampling results from the Hayward Marsh linear-channel reactor because these guided our later approach to operation of the Martinez reactor. Figure 2 illustrates the average ammonia and nitrate concentrations during the 13- and 2-month periods of relatively constant influent flowrates and nitrogen concentrations and smaller influent flowrates, but greater nitrogen concentrations, respectively. During the 13-month period, there was a slight increase in the ammonia-N concentration in the first meter of channel to nearly 35 mg/L on average, followed by a steady, constant decrease of 2.24 mg NH3-N/L per meter of channel for the next ~15 meters (linear regression R2 = 0.994). Expressed in terms of an ammonia degradation constant (linear, not first-order), there is a constant decrease of 1.41 mg NH3-N/L per hour in the first 15 m. From about 11 to 22 meters along the channel there is another 0.9 mg NH3-N/L decrease per meter until the NH3-N concentrations fall below ~1 mg/L on average, thereafter for the remaining ~22 m of channel. Nitrate concentrations along the linear reactor were similar to that of the influent and slightly increased with distance along the reactor following removal of the ammonia. Overall, the first half of the linear-channel reactor achieved ~99% of the ammonia-nitrogen removal from the WWTP effluent with the second half providing a safety factor for normal operations. Focusing on the first 22 m of the linear reactor, the system removed ~34 mg NH3-N/L through a 1.5 m3 active reactor volume in a nearly 20 h hydraulic residence time; that is, a removal rate of 20.7 g NH3-N/m3 media, or 2.1 g NH3-N/surface m2 of reactor per day. These latter two values, or the previous linear degradation factor, informed design of the larger constructed wetland system needed to treat the entire WWTP effluent volume sent to Hayward Marsh.
To underscore something of the robustness of the zeolite-anammox treatment system, during the 2-month early fall period, pump problems and pipeline maintenance resulted in the pilot-plant trailer receiving average ammonia concentrations roughly twice (~70 mg/L) that of the remaining 13-month period at about half the flow rate encountered otherwise. Based on the two to three samplings during this period, average ammonia concentrations along the zeolite-anammox linear reactor again showed an increase in the first few meters of reactor followed by a nearly linear decrease to <1 mg/L by 22 m as shown in Figure 2. Despite changing conditions, the pilot plant continued to perform very well, achieving greater than 99% ammonia removal and resulting in the same degradation or constructed wetland design parameters as that during the 13-month period.
While ammonia-N concentrations decreased by more than an order of magnitude on average from the inlet to outlet of the linear reactor during the study period, nitrate-N concentrations increased from about 0.2 mg/L at the inlet to 4 mg/L at the outlet. However, during the first 10-months, the effluent NO3-N concentration from the linear reactor averaged less than 2 mg/L and then increased to between 3–5 mg/L thereafter (Figure 2). We speculate that the increased nitrate concentration was likely associated with sloughing bacteria, or bacterial detritus as there was virtually no ammonium remaining for the anammox to combine with any available nitrite to form N2.
Having established the length of linear-channel reactor required (22 m) to treat the secondary-treated WWTP effluent, we sampled only at the reactor inlet and outlet at the Martinez pilot-plant while determining the time required for the reactor to reach treatment goals of <3 mg/L ammonia-N. Detection of significant anammox activity as falling nitrate concentrations and appearance of what we will describe later as ‘black zeolite’ near the influent end of the reactor occurred much later than anticipated from our prior experience with the Hayward Marsh linear reactor. At Martinez, the linear-channel reactor required about double that required in the reactor at Hayward marsh or some five and half months before we observed formation of ‘black zeolite’ and effluent nitrate concentrations fell below ~3 mg/L.
Uncertain as to why this additional start-up time was required at the Martinez reactor, we explored the differences in the CCCSD secondary effluent iron concentrations as iron and manganese are well recognized trace mineral nutrients for soil microbial communities. Moreover, research became available indicating that addition of reduced manganese or iron to laboratory anammox reactors enhanced anammox bacterial growth rates [10,11,12,13,14], but no minimum values for accelerating growth have yet been reported. From 13 water samples collected roughly bi-weekly during the Martinez study, we found that the mean soluble iron concentration of the CCCSD secondary effluent was only 0.063 mg/L (with a standard deviation of 0.023 mg/L); this was more than an order-of-magnitude less than secondary effluent iron concentrations of about 0.5–1 mg/L at other east Bay WWTPs. Soluble iron concentrations of the influent at the Hayward Marsh reactor averaged about 0.7 mg/L, somewhat greater than average background concentrations of 0.5 mg/L in water. We had not encountered this problem previously because most WWTPs employ anaerobic digesters to treat sludge and routinely add iron to prevent corrosion to the digester infrastructure or for phosphorous removal. Many WWTPs also add iron to their pipe collection network to limit corrosion. CCCSD is one of only two WWTPs in California that incinerate sludge and do not add iron at the WWTP; neither does CCCSD add iron to their collection network. Measured soluble iron in the CCCSD wastewater was an order-of-magnitude less than background (see Table 3); thus, we concluded that limited iron availability increased the startup time required for anammox activity to become apparent at the Martinez linear reactor.
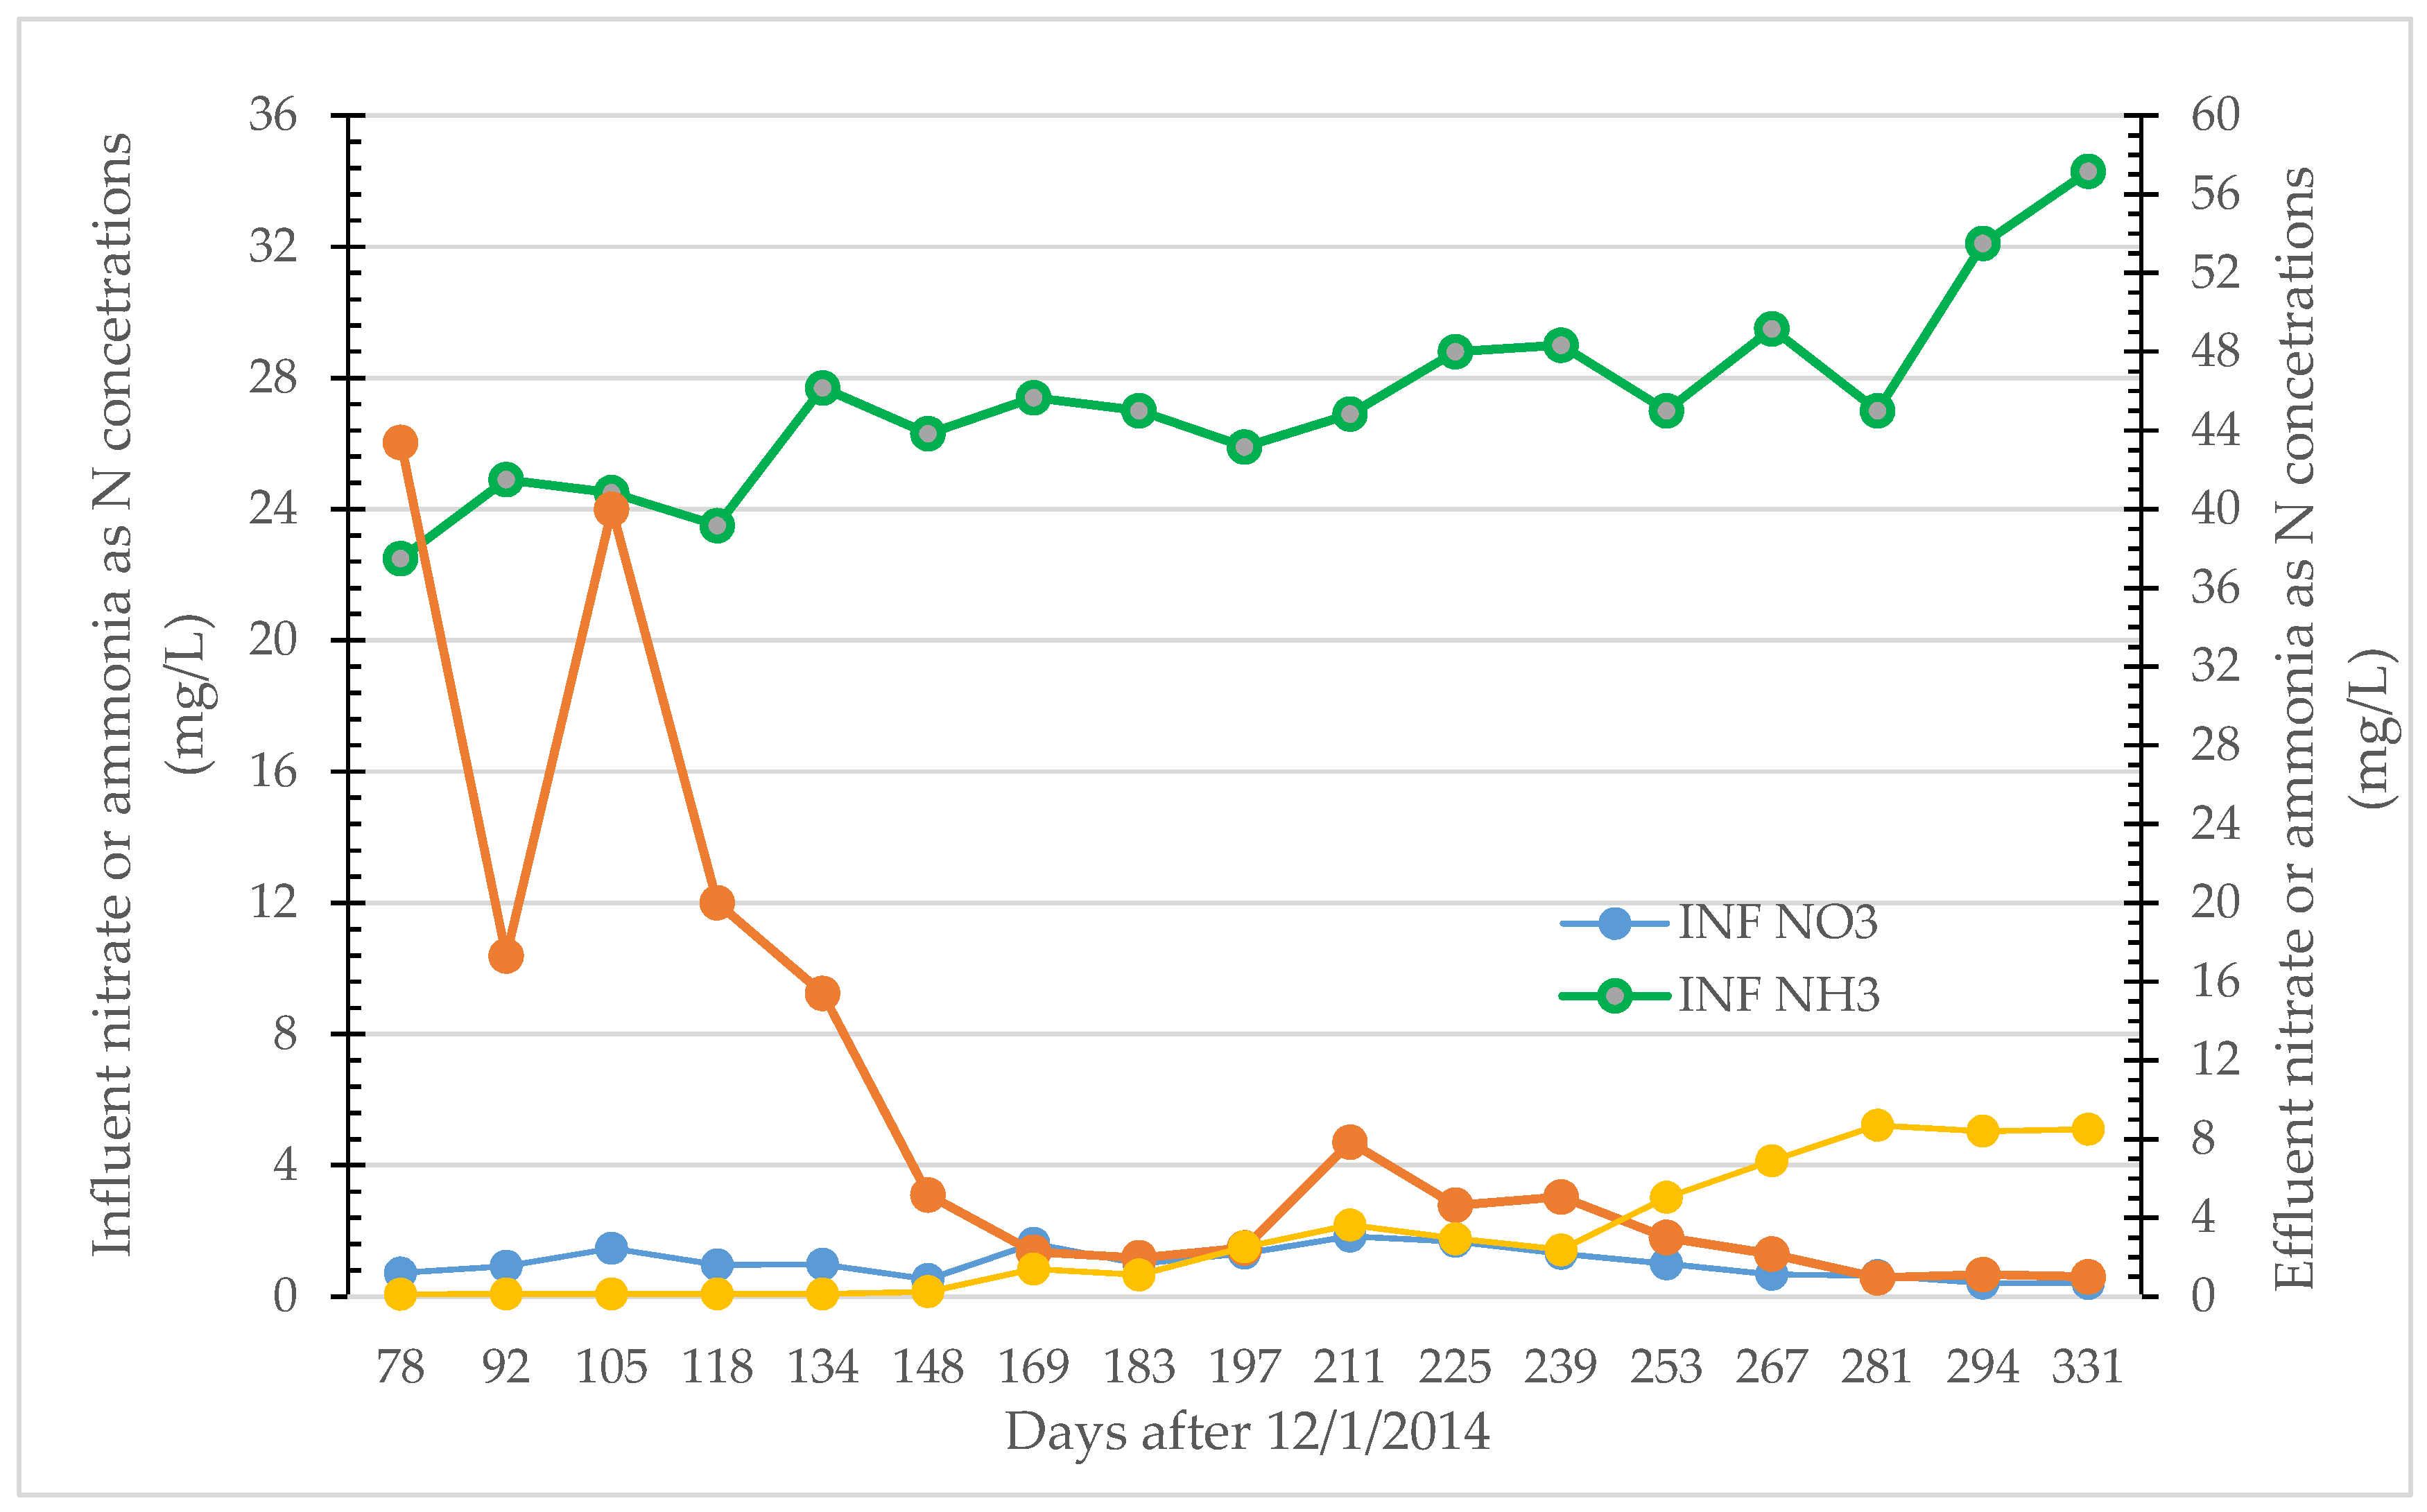
Nonetheless, as shown in Figure 3, following establishment of the microbial communities in the reactor, outlet ammonia concentrations declined below 1 mg/L and nitrate concentrations were equivalent to that of the influent during the last ten months of the study period for the Martinez linear-channel reactor.
Table 4 summarizes the average treatment performance results for the Martinez reactor during what is presumably the nitrifier (<150 days) and anammox (>170 days) dominant periods as shown in Figure 3. On average there is about 83% ammonia-N removal, and effluent nitrate-N concentrations were <3 mg/L following establishment of the anammox activity in the reactor. This removal fraction is consistent with the 89% theoretically possible with anammox bacteria alone based on the observed stoichiometry of the anammox process outlined above. With a steady flow of 110 L/h and average removal of ~24 mg NH3-N/L, the average degradation rate of 42 mg NH3-N/m3/day was about double that of 21 mg/m3/day achieved in the Hayward Marsh linear-channel reactor due to the greater flowrates and perhaps from reactor temperature averaging 4 °C greater during this sampling period.
Overall, while operating during a roughly one-year period each linear-channel reactor successfully removed nitrogen species from WWTP secondary effluent achieving discharge nitrate- and ammonia-N concentrations less than project goals of 3 mg/L, despite variable nitrogen concentrations and flowrates within the system. The eventual appearance of ‘black zeolite’ as shown in Figure 4 near the influent end of each reactor coincided with the reduction of reactor effluent nitrate-N concentrations below ~4 mg/L. It appears that in functioning zeolite-anammox reactors, aggregate in the anoxic zones become black (see Figure 4a) while normally the zeolite aggregate is typically a greyish-white color as in Figure 4b. We presume that the black colorization occurs when the zeolite aggregate is coated with reduced-iron enriched anammox biofilms (Figure 4a) under anaerobic conditions that returns to its grey-white color (Figure 4b) when removed from the reactor and allowed to air dry presumably as the reduced iron oxidizes.
While we verified the presence of anammox bacteria on the aggregate in the linear-channel reactors from the microbial sampling, questions remained about the relative activity of anammox as compared to that of denitrifying bacteria and zeolite adsorption, or cation exchange of ammonium needed to achieve observed amounts of ammonia removal. Presuming that all of the zeolite CEC preferentially adsorbed ammonium ions at 2 meg/g and that the submerged two-thirds of the reactor zeolite mass was involved in the exchange-adsorption process, than a 22 m long reactor could adsorb approximately 1.1 × 10⁶ meq of ammonium ions. At a an average flowrate of 30 L/h (between the two systems considered here) and removal of 35 mg/L ammonia-N, the zeolite adsorption sites would be completely saturated in about 45 days of operation, an order-of-magnitude less than the ~450 days of the two studies. This is a very conservative estimate based on the maximum zeolite exchange capacity reported and the assumption that ammonium is preferentially adsorbed/exchanged over other cations in solution. As we observed above with the changes in the Ca and Na concentrations across the reactor, it is likely that the zeolite may preferentially adsorb divalent cations such that only a fraction of the 1.6 to 2 meq/g is available for ammonium ions. Similarly, considering possible ammonia removal by denitrifying bacteria requires approximately 4 mg BOD/L for each 1 mg/L ammonia-N removal [15]; hence the use of additional methanol in denitrification reactors as a carbon source for the denitrifying bacteria. Thus, denitrifier bacterial removal of 35 mg NH3-N/L in the linear-channel reactors requires a continuous stream of 140 mg BOD/L in the treated wastewater. However, with influent BOD concentrations of only 2–4 mg/L, there was insufficient carbon in the wastewater for this degree of removal by denitrification bacteria. Combined, zeolite adsorption-exchange and possible denitrification in the linear-reactor may account for about 1 mg NH3-N/L removal rather than the 25–35 mg/L removal observed in the two linear-channel reactors. Moreover, in an effort to augment denitrification at the Hayward Marsh linear-channel reactor during the first three months of the study we continuously added sugar solutions equivalent to ~100 mg BOD/L to the secondary effluent and found no effect on ammonia or nitrate concentrations along or in the discharge from the reactor. This lack of effect associated with additional carbon in the reactor is reflected in part by the small standard errors of the ammonia-N concentrations along the reactor as shown in Figure 2. Moreover, together with stoichiometric estimations made above, absence of any effect from the additional carbon source indicated that successful treatment was associated with anammox activity in the reactors as shown in Figure 3 after 150 days and summarized in Table 4.
5. Summary and Conclusions
This paper considers application of the zeolite-anammox wastewater treatment process to nitrogen removal from WWTP secondary effluent with eventual discharge to sensitive areas of the San Francisco Bay estuary. The zeolite-anammox treatment system seems to combine the zeolite adsorption capacity to provide sites for an anammox-nitrifier bacterial biofilm capable of effectively converting ammonium to nitrogen gas across a range of ammonium concentrations and ambient temperatures (15–30 °C). However, there is little, if any, information available in the literature about this integrated process, especially at WWTP scale applications. The system is self-regulating to a degree as the bacteria continuously regenerate the zeolite cation-exchange sites by stripping and converting the ammonium with minimal operator intervention.
The gravity-flow linear-channel reactors operating at Hayward Marsh and the Martinez WWTP achieved ammonia-N removal rates of 21–42 mg NH3-N/m3/day from secondary-treated wastewater while maintaining project-goal discharge ammonia and nitrate as N concentrations less than 3 mg/L. We found that when effective ammonia-N removal occurred within in the linear-channel reactors that we also observed formation of ‘black zeolite’ near the influent end of the reactor. Effective reactor operation and the presence of ‘black zeolite’ was not achieved at the Martinez for several months or more than twice the ‘start-up time’ required at the Hayward Marsh reactor. We speculate this additional time required to achieve treatment performance was associated with the limited ferrous iron available in the Martinez WWTP effluent because it uses sludge incineration rather than anaerobic digestion in its wastewater treatment train.
As the linear-channel reactors did not require additional pumping or aeration, we found an energy savings with the process as compared to others considered by the WWTPs. Overall, the zeolite-anammox treatment system appears to offer advantages of lowered infrastructure costs, reduced energy requirements, and minimal maintenance and monitoring as compared to traditional operations. Further, as compared to conventional nitrification–denitrification treatment methods, the zeolite-anammox system operating in a single reactor has the potential to reduce carbon dioxide and nitrous oxide greenhouse-gas emissions, though this conclusion requires additional study.
From the degradation factors for the linear-channel gravity-flow reactors, we proposed a constructed wetland having a three-layer (drain rock-zeolite-drain rock) substrate of roughly 0.2 m thickness each for treatment of the USD Alvarado WWTP secondary effluent. The commercially available drain rock layers would collect suspended solids and detritus at the bottom and protect the zeolite aggregate from the top while providing additional pore-space for fluctuating water levels. Thus, for example a roughly 200 m wide by 600 m long zeolite-anammox wetland (12 ha) could treat the entire secondary effluent flows of ~11,400 m3/day from the Alvarado WWTP having an average of 35 NH3-N mg/L to less than 1 mg/L using about a one-day residence time. Neglecting seepage and evaporation from the constructed wetland, such a design includes a safety factor of about 3 to ensure system success.
Acknowledgments
We completed this work with the support and cooperation of the Union (USD) and the Contra Costa Central Sanitation Districts (CCCSD) and their staff.
Author Contributions
Robert Collison designed, managed and oversaw operation of the experiments, while Mark Grismer completed the data analyses and drafted the paper.
Conflicts of Interest
The authors declare no conflict of interest.
References
- San Francisco Estuary Institute (SFEI). San Francisco Bay Nutrient Management Strategy (NMS) Science Plan, 2016. Available online: http://sfbaynutrients.sfei.org/sites/default/files/2016_NMSSciencePlan_Report_Sep2016.pdf (accessed on 13 February 2017).
- Cloern, J.E.; Jassby, A.D. Drivers of change in estuarine-coastal ecosystems: Discoveries from four decades of study in San Francisco Bay. Rev. Geophys. 2012, 50, RG4001. [Google Scholar] [CrossRef]
- Parker, A.E.; Dugdale, R.C.; Wilkerson, F.P. Elevated ammonium concentrations from wastewater discharge depress primary productivity in the Sacramento River and the Northern San Francisco Estuary. Mar. Pollut. Bull. 2012, 64, 574–586. [Google Scholar] [CrossRef] [PubMed]
- Collison, R.S.; Grismer, M.E. Nitrogen and COD Removal from Septic Tank Wastewater in Subsurface Flow Constructed Wetlands: Substrate (cation exchange capacity) effects. Water Environ. Res. 2014, 86, 314–323. [Google Scholar] [CrossRef] [PubMed]
- Giblin, A.E.; Tobias, C.R.; Song, B.; Weston, N.; Banta, G.T.; Rivera-Monroy, V.H. The importance of dissimilatory nitrate reduction to ammonium (DNRA) in the nitrogen cycle of coastal ecosystems. Oceanography 2013, 26, 124–131. [Google Scholar] [CrossRef]
- Grismer, M.E.; Collison, R.S. The zeolite-anammox treatment process for nitrogen removal from wastewater—A Review. Water 2017, 9, 901. [Google Scholar] [CrossRef]
- Lackner, S.; Gilbert, E.M.; Vlaeminck, S.E.; Joss, A.; Horn, H.; van Loosdrecht, M.C.M. Full-scale partial nitritation/anammox experiences—An application survey. Water Res. 2014, 55, 292–303. [Google Scholar] [CrossRef] [PubMed]
- Strous, M.; Heijnen, J.J.; Kuenen, J.G.; Jetten, M.S.M. The sequencing batch reactor as a powerful tool for the study of slowly growing anaerobic ammonium oxidizing microorganisms. Appl. Microbiol. Biotechnol. 1998, 50, 589–596. [Google Scholar] [CrossRef]
- Kassab, G.; Halalsheh, M.; Klapwijk, A.; Fayyad, M.; van Lier, J.B. Sequential anaerobic–aerobic treatment for domestic wastewater—A review. Bioresour. Technol. 2010, 101, 3299–3310. [Google Scholar] [CrossRef] [PubMed]
- Liu, Y.; Ni, B.-J. Appropriate Fe (II) Addition Significantly Enhances Anaerobic Ammonium Oxidation (Anammox) Activity through Improving the Bacterial Growth Rate. Sci. Rep. 2015, 5, 8204. [Google Scholar] [CrossRef] [PubMed] [Green Version]
- Qiao, S.; Bi, Z.; Zhou, J.; Cheng, Y.; Zhang, J. Long term effects of divalent ferrous ion on the activity of anammox biomass. Bioresour. Technol. 2013, 142, 490–497. [Google Scholar] [CrossRef] [PubMed]
- Qiao, S.; Bi, Z.; Zhou, J.; Cheng, Y.; Zhang, J.; Bhatti, Z. Long term effect of MnO2 powder addition on nitrogen removal by anammox process. Bioresour. Technol. 2012, 124, 520–525. [Google Scholar] [CrossRef] [PubMed]
- Waki, M.; Yasuda, T.; Fukumoto, Y.; Kuroda, K.; Suzuki, K. Effect of electron donors on anammox coupling with nitrate reduction for removing nitrogen from nitrate and ammonium. Bioresour. Technol. 2013, 130, 592–598. [Google Scholar] [CrossRef] [PubMed]
- Zhang, J.; Zhang, Y.; Li, Y.; Zhang, L.; Qiao, S.; Yang, F.; Quan, X. Enhancement of nitrogen removal in a novel anammox reactor packed with Fe electrode. Bioresour. Technol. 2012, 114, 102–108. [Google Scholar] [CrossRef] [PubMed]
- Metcalf and Eddy, Inc. Wastewater Engineering: Treatment, Disposal and Reuse, 3rd Ed.; Tchobanoglous, G., Burton, F., Eds.; McGraw-Hill, Inc.: New York, NY, USA, 1991; p. 720. [Google Scholar]
Figure 1.
Schematic illustration of linear-channel reactors in pilot-plant trailers.

Figure 2.
Mean (n = 12) and standard error ammonia and mean nitrate concentrations along the zeolite-anammox linear reactor during the constant flow (September 2012 to August 2013 and November to December 2013) and low-flow (n = 3), high NH3-N influent (August to October 2013) periods at Hayward Marsh reactor.

Figure 3.
Influent and effluent nitrogen concentrations in the Martinez linear-channel reactor during the latter ten months of the project.
Figure 3.
Influent and effluent nitrogen concentrations in the Martinez linear-channel reactor during the latter ten months of the project.

Figure 4.
Example photos of zeolite aggregate used in reactors from (a) anaerobic layer prior to air-drying with reduced iron coating and (b) after air-drying without reduced iron coating.
Figure 4.
Example photos of zeolite aggregate used in reactors from (a) anaerobic layer prior to air-drying with reduced iron coating and (b) after air-drying without reduced iron coating.


Table 1.
Zeolite properties—High purity (97%) clinoptilolite from Amargosa Valley, Nevada.
| Property | Value |
|---|---|
| Cation-Exchange Capacity (CEC) | 1.6–2.0 meq/g |
| Particle Density | 1890 kg/m3 |
| Specific Surface | 40 m2/g |
| Internal pore size | 0.4–0.7 nm |
| Hardness | 4.0–5.0 Mohs |
Table 2.
Analytical methods used for water quality analyses.
| Analysis | Method |
|---|---|
| Alkalinity | SM 1 2320B |
| BOD5 2 | EPA 405.1 |
| B | EPA 200.7 |
| COD 3 | Modified EPA 410.4 |
| Ca | EPA 200.7 |
| Cl | SM4500 |
| Fe | EPA 200.7 |
| Mg | EPA 200.7 |
| Na | EPA 200.7 |
| NO3-N | EPA 300.0/9056 |
| NH3-N | SM4500-NH3D |
| SO4 | EPA 300.0 |
| PO4 | EPA 300.0 |
| TP | EPA 365.3/SM4500PE |
| TS | SM2540B |
1 Standard Methods; 2 Biological Oxygen Demand; 3 Chemical Oxygen Demand.
Table 3.
General inlet and effluent water quality characteristics of pilot-plant treatment system from bi-monthly sampling during study period.
Table 3.
General inlet and effluent water quality characteristics of pilot-plant treatment system from bi-monthly sampling during study period.
| Parameter | Mean Concentrations at USD 2 | Mean Concentrations at CCCSD 3 | ||
|---|---|---|---|---|
| Influent | Effluent | Influent | Effluent | |
| Alkalinity (mg/L as CaCO3) | 260 | 215 | 228 | 176 |
| pH (units) | 7.5 | 7.4 | 7.4 | 7.3 |
| TS (mg/L) | 880 | 895 | ND 1 | ND |
| SO4 (mg/L) | 61.3 | 63.0 | ND | ND |
| PO4 (mg/L) | 5.0 | 4.3 | ND | ND |
| TP (mg/L) | 2.1 | 1.5 | 1.0 | 1.0 |
| B (mg/L) | 0.50 | 0.48 | ND | ND |
| Ca (mg/L) | 38.5 | 17.5 | 39.6 | 26.6 |
| Fe (mg/L) | 0.7 | 0.7 | 0.06 | 0.06 |
| Na (mg/L) | 205 | 230 | 114 | 162 |
| Mg (mg/L) | 23.0 | 22.5 | 16.9 | 15.1 |
| Cl (mg/L) | 265 | 275 | 120 | 122 |
1 Not Determined; 2 Union Sanitary Districts; 3 the Contra Costa Central Sanitation Districts.
Table 4.
Mean influent and effluent nitrogen concentrations for the Martinez linear-channel (LC) reactor during nitrifier and anammox dominant periods as shown in Figure 3.
Table 4.
Mean influent and effluent nitrogen concentrations for the Martinez linear-channel (LC) reactor during nitrifier and anammox dominant periods as shown in Figure 3.
| Martinez LC Reactor | Influent | Effluent | ||
|---|---|---|---|---|
| NO3-N (mg/L) | NH3-N (mg/L) | NO3-N (mg/L) | NH3-N (mg/L) | |
| Nitrifier period days 1–148 (n = 9) | ||||
| Mean | 1.3 | 23.6 | 27.5 | 0.3 |
| St Dev. | 0.6 | 3.9 | 12.5 | 0.2 |
| Anammox period days 169–331 (n = 11) | ||||
| Mean | 1.1 | 28.6 | 3.0 | 4.7 |
| St Dev. | 0.5 | 2.4 | 2.0 | 2.8 |
© 2018 by the authors. Licensee MDPI, Basel, Switzerland. This article is an open access article distributed under the terms and conditions of the Creative Commons Attribution (CC BY) license (http://creativecommons.org/licenses/by/4.0/).
Share and Cite
MDPI and ACS Style
Collison, R.S.; Grismer, M.E. Upscaling the Zeolite-Anammox Process: Treatment of Secondary Effluent. Water 2018, 10, 236. https://doi.org/10.3390/w10030236
AMA Style
Collison RS, Grismer ME. Upscaling the Zeolite-Anammox Process: Treatment of Secondary Effluent. Water. 2018; 10(3):236. https://doi.org/10.3390/w10030236
Chicago/Turabian StyleCollison, Robert S., and Mark E. Grismer. 2018. "Upscaling the Zeolite-Anammox Process: Treatment of Secondary Effluent" Water 10, no. 3: 236. https://doi.org/10.3390/w10030236
Note that from the first issue of 2016, this journal uses article numbers instead of page numbers. See further details here.