 Isaac Zentner1†Hyun-moon Back2
 Leonid Kagan2
 Selvakumar Subbian1
 Jyothi Nagajyothi3
 Shashikant Srivastava4
 Jotam Pasipanodya5
 Tawanda Gumbo5Gregory P. Bisson6
 Christopher Vinnard1*†
- 1Public Health Research Institute, New Jersey Medical School, Newark, NJ, United States
- 2Department of Pharmaceutics and Center of Excellence for Pharmaceutical Translational Research and Education, Ernest Mario School of Pharmacy, Rutgers University, Piscataway, NJ, United States
- 3Center for Discovery and Innovation, Hackensack Meridian Health, Nutley, NJ, United States
- 4Department of Pulmonary Immunology, University of Texas Health Science Center at Tyler, Tyler, TX, United States
- 5Praedicare Inc, Dallas, TX, United States
- 6Perelman School of Medicine, University of Pennsylvania, Philadelphia, PA, United States
Background: The potential for hepatotoxicity during isoniazid-based tuberculosis (TB) treatment presents a major challenge for TB control programs worldwide. We sought to determine whether pharmacokinetic exposures of isoniazid and its metabolites were related to cellular oxidation/reduction status and downstream markers of oxidative DNA damage.
Methods: We performed intensive pharmacokinetic sampling among isoniazid-treated patients to determine the relative plasma exposures of isoniazid, acetylisoniazid, hydrazine, and acetylhydrazine. Physiologically-based pharmacokinetic modeling was used to estimate liver tissue exposures during a 24-h dosing interval for each compound. We experimentally treated HepG2 cells with isoniazid and metabolites at equimolar concentrations corresponding to these exposures for 7, 14, and 28-day periods, and performed assays related to redox imbalance and oxidative DNA damage at each timepoint. We related a urine marker of oxidative DNA damage to serum isoniazid pharmacokinetic exposures and pharmacogenetics in a clinical study.
Results: Among isoniazid-treated patients, serum concentrations of hydrazine and isoniazid concentrations were highly correlated. At equimolar concentrations that approximated hepatic tissue exposures during a 24-h dosing interval, hydrazine demonstrated the highest levels of redox imbalance, mitochondrial injury, and oxidative DNA damage over a 28-day treatment period. In a clinical validation study of isoniazid-treated TB patients, peak isoniazid serum concentrations were positively associated with a urine biomarker of oxidative DNA damage.
Conclusions: Isoniazid and its metabolites share the potential for oxidative cellular damage, with the greatest effects observed for hydrazine. Future studies should investigate the clinical consequences of oxidative stress with regards to clinical episodes of drug induced liver injury during isoniazid treatment.
Background
The potential for isoniazid hepatotoxicity during tuberculosis (TB) treatment remains a major challenge for TB control efforts worldwide. In the United States, isoniazid is the second leading cause of drug-induced liver injury, with evidence of under-reporting (Hayashi et al., 2015). Aside from the direct effects of patient injury, the potential for hepatotoxicity during isoniazid treatment places additional burdens on TB control programs (Saukkonen et al., 2006), including laboratory monitoring and treatment interruptions, and hampers drug development efforts (Wallis, 2013). The risk of isoniazid-related hepatotoxicity is further increased in the setting of co-infection with human immunodeficiency virus (HIV) (Ungo et al., 1998).
A central challenge to understanding isoniazid hepatotoxicity has been its uncertain relationship with dose size (Hassan et al., 2015). Damage mediated by reactive oxygen species (ROS), as a consequence of imbalance between cellular oxidation and reduction (Sies, 2015), is a key determinant of drug hepatotoxicity (Jones et al., 2010; Roth and Lee, 2017). The imbalance between oxidation and reduction processes overwhelms cellular stores of glutathione, which provides an intracellular sink for ROS directed by the glutathione-s-transferase (GST) family of proteins (Hayes et al., 2005). With its high cellular density of mitochondria, the liver is particularly vulnerable to injury from ROS byproducts, leading to free radical-induced modifications of host proteins, DNA, and lipids (Friedman and Nunnari, 2014).
While there is abundant evidence that isoniazid and its metabolites cause redox imbalance in mammalian cells (Chowdhury et al., 2001; Hassan et al., 2015; Metushi et al., 2016), clinical studies have not yet linked isoniazid parent-metabolite pharmacokinetic exposures with markers of oxidative stress. Hydrazine, an isoniazid metabolite that damages the electron transport chain in mitochondria, has been proposed as a primary driver of isoniazid hepatotoxicity, yet pre-clinical studies have evaluated concentrations higher than those achieved in patients during isoniazid treatment. Establishing the link, if any, between markers of oxidative stress and hepatotoxicity during isoniazid treatment could lead to alternate approaches to monitoring during treatment, personalization of isoniazid dosing, or the development of ameliorating therapeutic strategies for toxicity prevention (Yew et al., 2018). Here, we hypothesized that long-term exposures to isoniazid and its metabolites were related to markers of redox imbalance in hepatocytes, and that hydrazine exposures would drive redox imbalance and oxidative damage in the liver.
Methods
Clinical Pharmacokinetic Study to Determine Relative Plasma Exposures of Isoniazid, Acetylisoniazid, Hydrazine, and Acetylhydrazine
The parent-metabolite clinical pharmacokinetic study was approved by the Institutional Review Board of Rutgers University, Newark (protocol #20170001150). We performed intensive pharmacokinetic sampling for drug and metabolite concentrations in 10 TB patients (4 latent infection patients and 6 active TB patients) treated with isoniazid, in order to identify the relevant metabolite concentrations for subsequent pre-clinical experiments. After an overnight fast, patients were dosed with oral isoniazid (300 mg). A pre-dose blood draw was performed, with additional blood draws at 1, 2, 4, 6, and 8 h after dosing. Following centrifugation, plasma samples were stored at -80C until shipment to Alturas Analytics (Moscow, ID) for analysis. At each timepoint, we measured plasma concentrations of isoniazid, acetylisoniazid, hydrazine, and acetylhydrazine (Figure 1). Noncompartmental pharmacokinetic analysis was performed to determine area under the concentration-versus-time curve (AUC), extrapolated over a 24-h dosing interval according to the slope defined in the elimination phase.
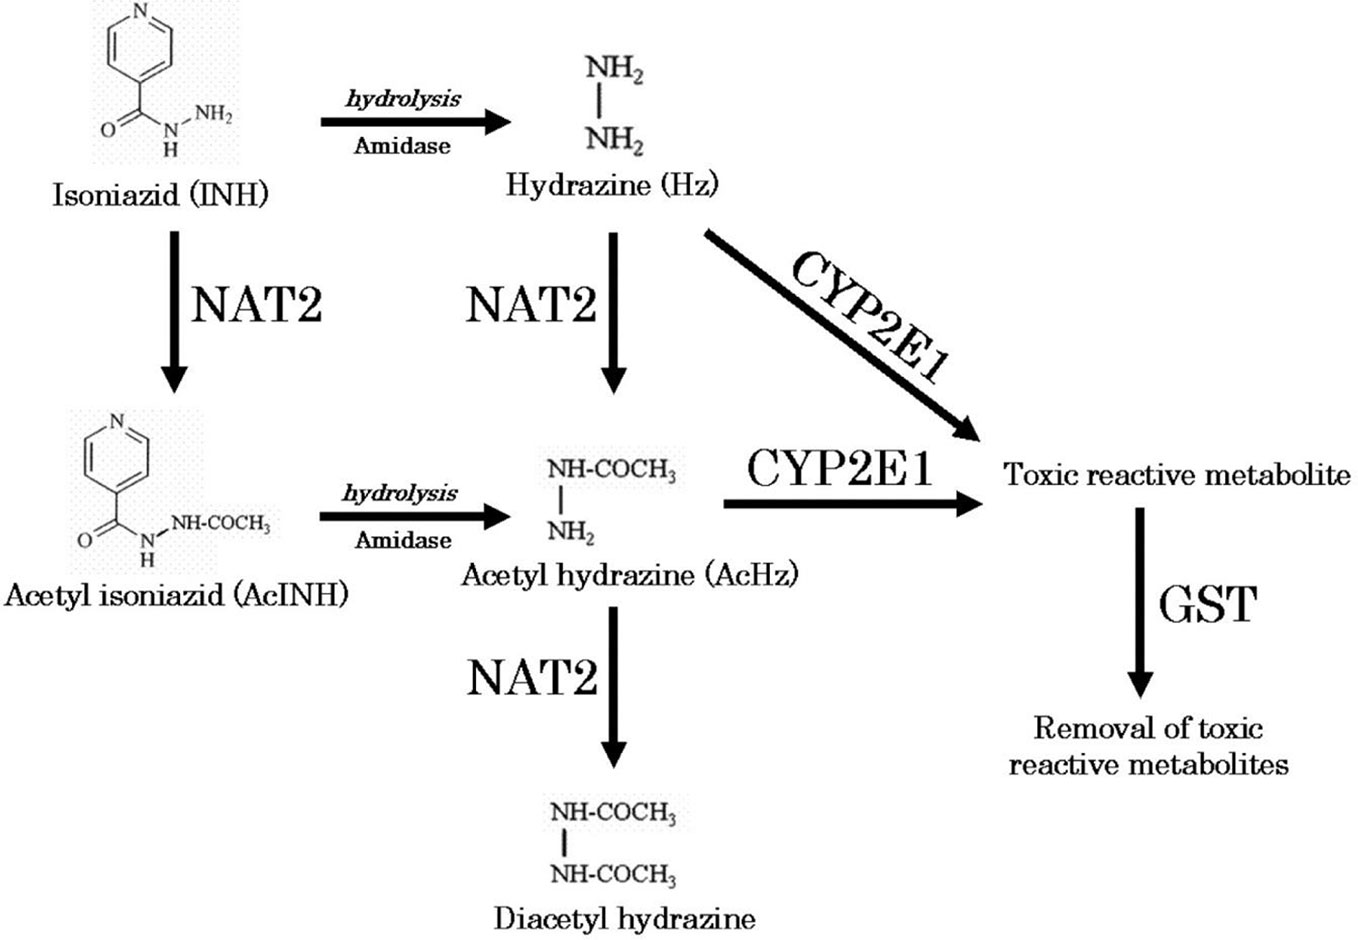
Figure 1 Metabolic pathway of isoniazid (Sotsuka et al., 2011). Reproduced with permission from Sotsuka T et al. Association of isoniazid-metabolizing enzyme genotypes and isoniazid-induced hepatotoxicity in tuberculosis patients. In Vivo 2011;25:803-12.
Physiologically-Based Pharmacokinetic Model of Liver Tissue Exposures of Isoniazid and Its Metabolites
To predict the hepatic tissue exposures of isoniazid, acetylisoniazid, hydrazine, and acetylhydrazine during isoniazid treatment, the whole-body physiologically based pharmacokinetic model with advanced compartmental and transit model in GastroPlus (Ver 9.7) was used (Supplementary Figure 1). All physicochemical properties for those substances were predicted based on chemical structure from a built-in predictor in GastroPlus. Population-dependent physiological parameters, including tissue volumes and perfusion rate in humans, were obtained using the Population Estimates for Age-Related Physiology module in GastroPlus (Supplementary Table 1). After simulating time-versus-concentration profiles of substances in liver and plasma, noncompartmental pharmacokinetic analysis was performed to calculate the AUC0-24 ratio between liver and plasma. This ratio was used to predict liver tissue exposures to isoniazid and metabolites, during a 24-h dosing interval, based on the observed plasma exposures in the clinical study.
In Vitro Pharmacologic Exposures of Hepatocytes to Isoniazid and Its Metabolites
The human liver carcinoma cell line, HepG2, is highly differentiated and is often used to screen the cytotoxicity potential of new chemical entities early in drug development (Gerets et al., 2012). HepG2 cells were cultured in Dulbecco’s modified Eagle’s medium (DMEM) supplemented with 10% fetal bovine serum (FBS), 100 U/ml penicillin, 100 μg/ml streptomycin, and 2mM L-glutamine, unless otherwise stated. Cells were continuously incubated at 37°C in a humidified 5% CO2/95% air environment and plated in a 12-well plate at 4x10⁵ cells/well, over a duration of 24 h prior to compound exposure. Compound stocks dissolved in water were freshly made each exposure day. Cellular supernatant was replaced with 2 ml of culture media containing 10 µM of compound and left to incubate until 90% confluency was reached. Cell passages were conducted every 3 days under continual exposure to the designated compound for the indicated time period. Cellular supernatant was collected at each passage, clarified, aliquoted, and stored at -80°C for future analysis. Treated cells and supernatants were then examined for markers of cytotoxicity, mitochondrial toxicity, and oxidative DNA damage as described below.
Free Thiol Availability Assay
By serving as targets of ROS, thiols provide the cellular defense system against oxidative stress. Glutathione is the principal non-protein thiol in most cells, and high intracellular glutathione concentrations are required to maintain protein thiols in reduced states, which is essential for cellular functions in metabolism, signaling, and detoxification (Tomanek, 2015). Cellular glutathione depletion was quantified in a free thiol availability assay (Mandavilli and Janes, 2010). Black 96-well polystyrene clear bottom plates were coated with 50 µg/ml of poly-d-lysine for 1 h at 37°C. Following multiple washes with PBS, HepG2 cells from the long-term low-exposure culture growth, at the indicated times, were plated at 3.3x10⁵ cells per well and left to incubated at 37°C for 12 h maintain compound exposure. ThiolTracker™ Violet dye (ThermoFisher) was used to assess free thiol availability following the manufacturer’s instructions. Briefly, cells were washed two times with D-PBS +C/M prior to the addition of 20 µM of ThiolTracker. Following a 30 min incubation at 37°C, cells were washed three times with D-PBS +C/M. Fluorescent intensity at 404nmEx/526nmEm was measured on a Synergy H1 Hybrid Multi-Mode Reader (BioTek).
Mitochondrial Membrane Integrity
To assess mitochondrial membrane integrity, black 96-well polystyrene clear bottom plates were coated with 50 µg/ml of poly-d-lysine for 1 h at 37°C. Following multiple washes with PBS, HepG2 cells from the long-term low-exposure culture growth, at the indicated times, were plated at 3.3x10⁵ cells per well and left to incubated at 37°C for 12 h maintaining compound exposure. Tetramethylrhodamine, methyl ester (ThermoFisher, Waltham, Massachusetts) was added at 100 nM at 37°C for 30 min. Following three washes with PBS, fluorescent intensity at 488nmEx/570nmEm was measured on a Synergy H1 Hybrid Multi-Mode Reader (BioTek).
Cellular and Mitochondrial Toxicity
Mitochondrial toxicity analysis was assayed using the Mitochondrial ToxGlo Assay (Promega, Madison, WI) following the manufacturer’s instructions. Briefly, cells obtained from the long-term low-exposure culture growth, at the indicated times, were grown in a 96-well flat clear bottom black polystyrene plate at 3.3x10⁵ cells per well in glucose-free (galactose supplemented) culture media. Compound concentrations (10 µM) were consistently maintained throughout the experiment. Following a 24-h incubation with compound, cytotoxicity was evaluated by the addition of a fluorogenic peptide substrate, bis-AAF-R110, to the cell supernatant for 30 min at 37°C. The bis-AAF-R110 substrate penetrates compromised plasma membranes and is activated via interactions with necrosis-associated proteases. After the cells were allowed to incubate for 30 min at 37°C, fluorescence intensity was measured at 485nmEx/525nmEm. To evaluate mitochondrial toxicity, the plate was acclimated to room temperature for 5 min, at which point the ATP detection reagent was added. Cell lysis mixture was transferred to a 96-well flat solid white bottom plate and luminescence intensity was measured. Assays of fluorescence and luminescence activity were performed with a Synergy H1 Hybrid Multi-Mode Reader (BioTek, Winooski, VT).
Comet Chip Imaging of Cellular DNA Damage
Cells treated for 1 week with 10 µM of compound were plated onto a CometChip (Trevigen) at 2x10⁵ cells/ml in a single cell suspension (Ge et al., 2014). Cells were incubated on the chip for 60 min at 37°C. The plate was then gently washed with PBS and coated with 1% low melting agarose. After the agarose was solidified by cooling at 4°C, the plate was washed with pre-chilled non-activated alkaline lysis buffer (2.5 M NaCl, 100nM Na2EDTA, 10mM Tris, pH 10). The chip was lysed overnight at 4°C by submerging the chip in the alkaline lysis buffer containing 1% Triton-X. The plate was then washed with PBS and placed in an electrophoresis chamber filled with pre-chilled alkaline electrophoresis buffer (2mM Na2 EDTA, 300 mM NaOH). Following a 40 min incubation at 4°C to allow for alkaline unwinding, electrophoresis was carried out at 80 volts for 30 min at 4°C. The chip was then neutralized with two incubations at 4°C in 400 mM Tris, pH 7.5 buffer, and equilibrated in 20 mM Tris, pH 7.4 at 4°C for 20 min. DNA staining was achieved by incubating the chip in 100 ml of 0.2X SYBR Gold overnight at 4°C. Fluorescent images were acquired on an Evos FL Imaging System (ThermoFisher).
Immunofluorescence for γ-H2Ax
H2Ax is a core histone protein found in the nucleosome, and the phosphorylation of H2Ax is a marker of DNA damage caused by ROS. Variant histone H2AX (γ-H2AX) is a marker of DNA double-strand breaks (Rothkamm et al., 2015). Exposed cells (1 week with 10 µM of compound) were plated in a 12-well cell culture treated plate at 1x10⁵ cells/well. Following 24 h incubation at 37°C in media containing 10 µM of compound, cells were fixed with a cold 1:1 solution of methanol and acetone for 20 min at -20°C. The cells were subsequently washed with PBS and blocked for 2 h at room temperature with 1 ml of BlockAid™ Blocking Solution (Thermo Scientific). Each well was stained with a 1:1,000 dilution of rabbit anti-phospho-H2AFX (Millipore Sigma, St. Louis, MO) in PBS overnight at 4°C with gently rocking. Following multiple washing steps with PBS, cells were incubated with 5 µg/ml of anti-rabbit Alexa Fluor 647-conjugated antibody (ThermoFisher) for 1 h at room temperature. Cells were subsequently washed with PBS and stained with 1 µg/ml of Hoechst 33342 (ThermoFisher) for 5 min at room temperature. Fluorescent images were acquired on an Evos FL Imaging System (ThermoFisher).
8-Hydroxy-2’-Deoxyguanosine (8-OHdG) in Cellular Supernatant
Determination of 8-OHdG content in cellular supernatant was assed using an in-house competition ELISA. Clear 96-well plates were coated with 8-Hydroxy-2’-deoxyguanosine (BioVision, Milpitas, CA) overnight at 4°C. Plates were then washed three times with PBS. Cell supernatant in PBS or standard 8-OHdG standard curve dilutions were added to the appropriate wells. Rabbit anti-8-OHdG (Abcam, Cambridge, MA) was subsequently added at a 1:2,500 final dilution in PBS and the plate was incubated at room temperature with shaking for 2 h. Following three washes with PBS, anti-rabbit HRP antibody was added at a 1:5,000 dilution and the plate was incubated at room temperature with shaking for 1 h. Immediately following five rapid PBS washes, 3.7mM o-phenylenediamine in 0.05 M phosphate-citrate buffer containing 0.03% sodium perborate was added and the plate was incubated at room temperature protected from light for 30 min. Absorbance at 405 nm was then measured on a Synergy H1 Hybrid Multi-Mode Reader (BioTek).
Clinical Validation of Urine Oxidative DNA Damage in HIV/TB Patients
Study Setting and Subjects
We conducted a prospective cohort study of isoniazid pharmacokinetics among HIV/TB patients at 22 public clinics and Princess Marina Hospital in Gaborone, Botswana. The study population has been previously described (Vinnard et al., 2017). Eligibility criteria included citizens of Botswana, HIV infected adults (21 years of age or older) naïve to ART therapy, and newly diagnosed with pulmonary TB initiated on standard first-line TB regimens at weight-based dosing bands recommended in accordance with WHO guidelines. The study visit occurred between 5 and 28 days after initiation of first-line TB therapy that included isoniazid, prior to initiation of ART therapy.
Data Collection
After an overnight fast, the anti-TB drugs were directly administered. Blood samples (10 ml) were drawn at 0, 0.3, 0.9, 2.2, 4.5, and 8 h post-dosing, based on optimal sampling theory to estimate isoniazid pharmacokinetic parameters. Plasma isoniazid concentrations were measured with liquid chromatography-tandem mass spectrometry (LC-MS/MS) methods as previously described. The peak plasma concentration (Cmax) was obtained directly from the concentration-versus-time data), model-predicted isoniazid concentrations were used to estimate the area under the concentration-versus-time curve during a 24-h interval (AUC0-24). A spot urine sample (approximately 50 ml) was collected 4 h following anti-TB drug dosing and frozen at -80C until analysis. We measured urinary concentrations of 8-OHdG, a marker of oxidative DNA damage that is stable in cryopreserved urine samples, normalized to urine creatinine. The DNA Damage Competitive ELISA kit (ThermoFisher Scientific) was performed using a 1:4 dilution of urine-to-assay buffer. The manufacturer’s instructions were followed with one modification to the protocol. Antigen binding was performed overnight at 4°C with shaking in lieu of a 2-h incubation at room temperature. Each assay was performed in triplicate. Optical absorption was assessed using a Synergy H1 Hybrid Multimode Reader (BioTek). To obtain creatinine concentrations for all urine, the Creatinine Urinary Detection Kit (ThermoFisher Scientific) was performed according to the manufacturer’s instructions using a 1:20 dilution of urine-to-deionized water.
Pharmacogenetic Genotyping for NAT2 and GST Family Genes
DNA from whole blood samples was used to perform whole exome sequencing as previously described (Vinnard et al., 2017). Individuals with any combinations of the following NAT-2 alleles: 2*4, 2*11, 2*12, and 2*13, were classified rapid acetylators, while those with both combination of these alleles: 2*5, 2*6, 2*7, and 2*14, were considered slow acetylators, in accordance with existing literature (Doll and Hein, 2001). Patients who possessed one allele from the former group and another from the later were classified as intermediate acetylators. Patients whose single-nucleotide polymorphism (SNP) calls were not available in public databases (http://nat.mbg.duth.gr/ and http://NAT-2pred.rit.albany.edu/) or published literature were designated as ambiguous. We evaluated allele frequencies in SNPs corresponding to GST family genes based on previously identified clinical associations with oxidation/reduction status or isoniazid hepatotoxicity, including GSTA2, GSTP1, and GSTM1 (Ning et al., 2004; Wu et al., 2016). Based on a previously published classification scheme (Tetlow et al., 2001), we categorized GSTA2 haplotypes according to four SNPs (rs2180314, rs6577, rs2234951, rs1803682), as shown in Supplementary Table 3.
Statistical Analysis
Pharmacokinetic analyses were performed in Phoenix 8.0 (Certara USA, Inc., Princeton, NJ), and physiologically based pharmacokinetic modeling was performed GastroPlus v9.7 (SimulationsPlus, Redwood City, CA). Multivariate regression modeling was performed in Stata v13 (College Station, TX: StataCorp LP). Plots were generated in GraphPad Prism version 7.00 for Windows (GraphPad Software, La Jolla, CA, www.graphpad.com). Statistical significance was declared for p-values less than 0.05.
Results
Pharmacokinetic Exposures to Isoniazid and Its Metabolites in TB Patients
We obtained parent-metabolite pharmacokinetic data from 10 isoniazid-treated patients, including 4 patients with latent TB infection and 6 patients with active TB disease. The properties of the HPLC-MS/MS plasma assays for isoniazid and metabolites are included in Supplementary Table 2. The spaghetti plots of pharmacokinetic profiles are shown in Figure 2 for isoniazid (Figure 2A), acetylisoniazid (Figure 2B), hydrazine (Figure 2C), and acetylhydrazine (Figure 2D). For isoniazid, acetylisoniazid, and acetylhydrazine, all concentrations were greater than the lower limit of quantification, corresponding to 1 ng/ml, 10 ng/ml, and 10 ng/ml for isoniazid, acetylisoniazid, and acetylhydrazine, respectively. For hydrazine, 6 of 60 concentrations (10%) were below the lower limit of quantification, corresponding to 2 ng/ml. As expected, plasma AUC0-24 exposures for isoniazid and hydrazine were highly correlated (R2 = 0.78), consistent with the role of NAT2 enzyme in the metabolism of each compound (Figure 1).
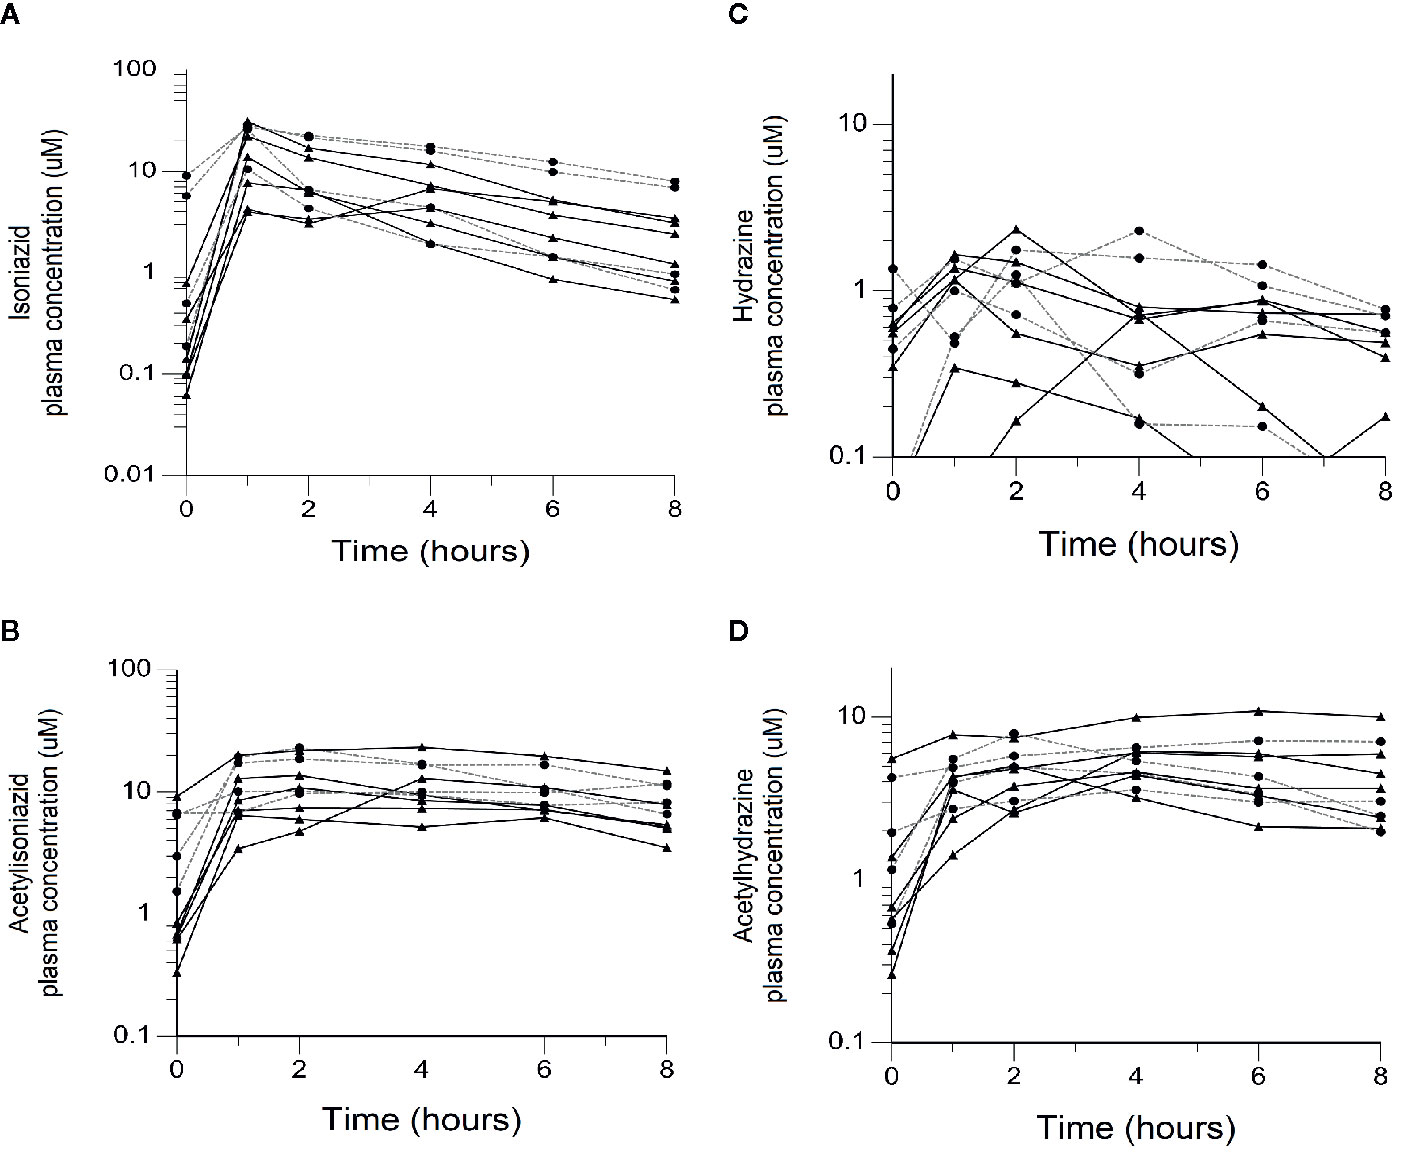
Figure 2 Plasma concentration-time exposures of isoniazid and its metabolites among 10 isoniazid-treated patients, including 6 patients treated with isoniazid in combination with first-line anti- tuberculosis (TB) therapy for active TB disease, and 4 patients treated with isoniazid monotherapy for latent TB infection. Black line/triangles: active TB disease patients; grey line/circles: latent TB infection patients. (A) Isoniazid. (B) Acetylisoniazid. (C) Hydrazine. (D) Acetylhydrazine.
The physiologically based pharmacokinetic model of isoniazid and metabolite distribution into tissue is included in Supplementary Figure 1. Based on this model, we predicted ratios of liver tissue:plasma exposures for isoniazid, acetylisoniazid, hydrazine, and acetylhydrazine as shown in Table 1. The model predicted an 18-fold higher liver tissue exposure for hydrazine compared to plasma, but lower liver tissue exposures for parent compound and the other metabolites compared to plasma. Based on these model-predicted liver tissue exposures, we selected the concentration of 10 uM to study in pre-clinical toxicodynamic models for all compounds, corresponding to an AUC0-24 of 240 uM*hr. This molar concentration fell within 1 log-10 for the median exposure to each compound.
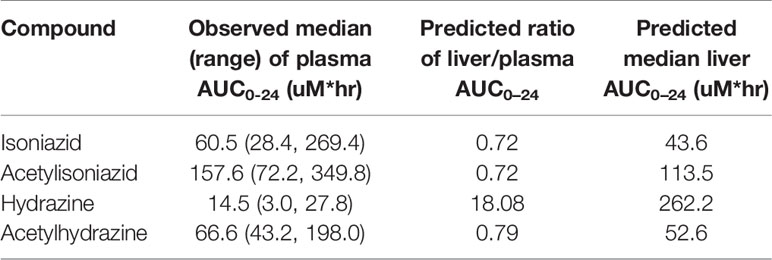
Table 1 Predicted liver tissue exposures of isoniazid and metabolites based on PBPK modeling.
Long-Term Exposures of HepG2 Cells Treated at Clinically Relevant Concentrations of Isoniazid and Metabolites
Biochemical Assays of Redox Imbalance and Mitochondrial Injury
There was no appreciable cytotoxicity and of isoniazid or its metabolites (Figure 3A). However, we observed thiol depletion in treated cells over the 28-day exposure period, demonstrating impaired cellular capacity to maintain the oxidation-reduction equilibrium, greatest among hydrazine-treated cells (Figure 3B). TMRM is a cell-permeant dye that accumulates in active mitochondria with intact membrane potential and is depleted with free radical injury to mitochondrial membrane potential. Figure 3C shows that there was TMRM depletion in all treated cells across 28 days of exposure, with the greatest depletion observed for hydrazine. Furthermore, Figure 3D shows that cellular ATP production was impaired at 28 days of treatment across all experiments, again with the greatest impairment observed for hydrazine as compared with the other compounds.
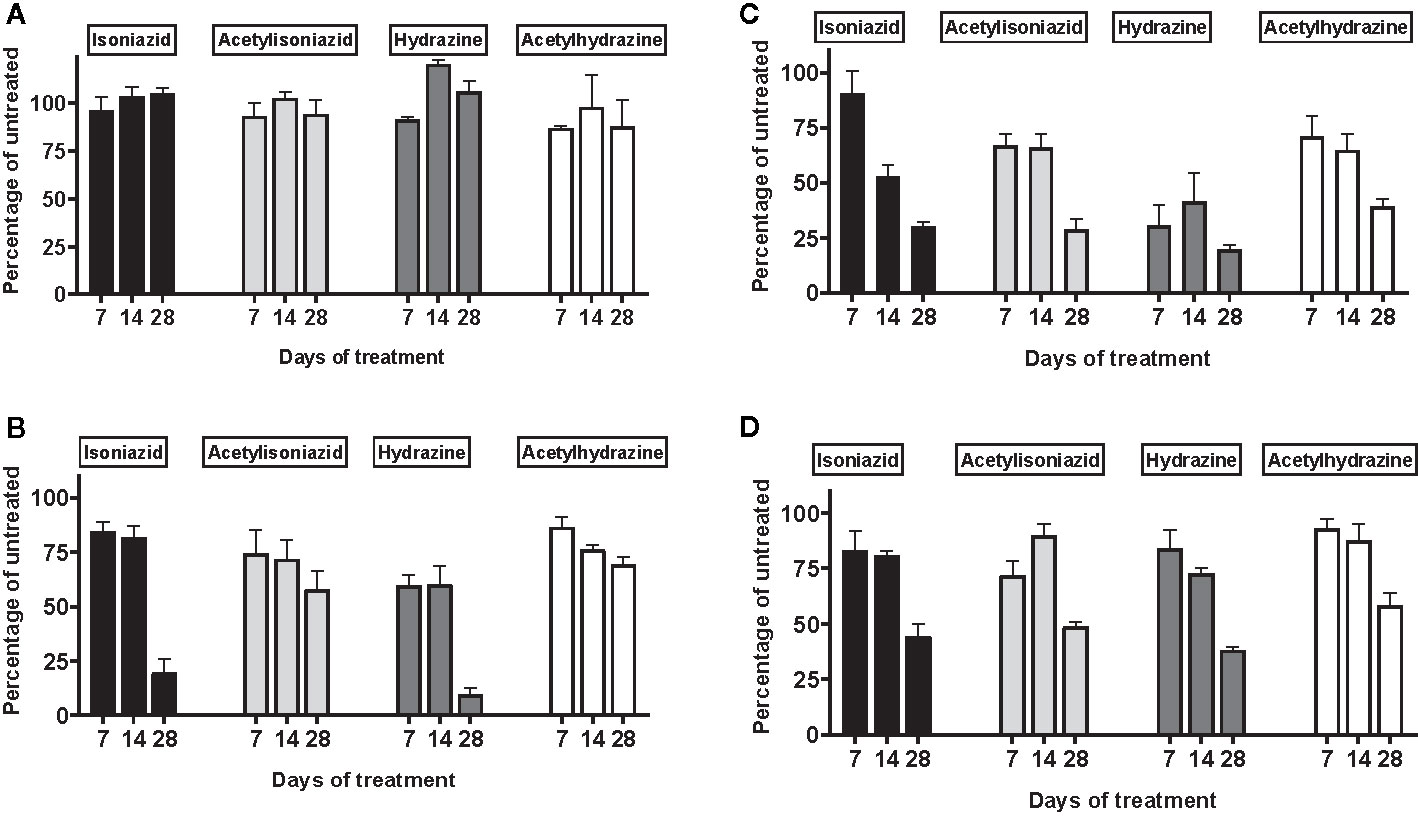
Figure 3 Mitochondrial injury and glutathione depletion in HepG2 cells treated with isoniazid and metabolites over 28 days. Cell passages were conducted every 3 days under continual exposure to the designated compound for the indicated time period. Treated cells and supernatants were then examined for markers of cytotoxicity and mitochondrial toxicity. (A) Overall cytotoxicity was evaluated by the addition of a fluorogenic peptide substrate, bis-AAF-R110, to the cell supernatant, which penetrates compromised plasma membranes and is activated via interactions with necrosis-associated proteases. (B) Cellular glutathione depletion was quantified in a free thiol availability assay. (C) Mitochondrial membrane integrity as measured with addition of TMRM, a cell-permeant dye that accumulates in active mitochondria with intact membrane potential and is depleted with free radical injury to mitochondrial membrane potential. (D) ATP production assayed using the Mitochondrial ToxGlo Assay (Promega, Madison, WI).
Microscopic and Biochemical Assays of Oxidative DNA Damage
We examined levels of oxidative DNA damage in treated HepG2 cells in several ways. First, CometChip microscopy demonstrated greater levels of DNA damage in cells treated for 1 week with hydrazine, acetylhydrazine, and acetylisoniazid, as compared to isoniazid (Figures 4A, B). Next, we measured γ-H2AX in treated cells, a variant histone which corresponds to the presence of double-stranded DNA breaks. Following a 1-week exposure period, γ-H2AX levels were greatest during treatment with hydrazine, as compared to isoniazid, acetylisoniazid, and acetylhydrazine (Figure 4C). Finally, we examined cellular supernatant levels of 8-OhDG, a measure of oxidative DNA damage that is stable in cryopreserved clinical samples (Frijhoff et al., 2015). Figure 4D shows that the highest increase in 8-OhDG levels in cell supernatant was with hydrazine treatment. Given that the 10 µM concentration used in these experiments was less than predicted in liver tissue for hydrazine, but greater than predicted for isoniazid and non-hydrazine metabolites, these findings collectively supported our hypothesis that hydrazine is the primary mediator of redox imbalance in hepatocytes.
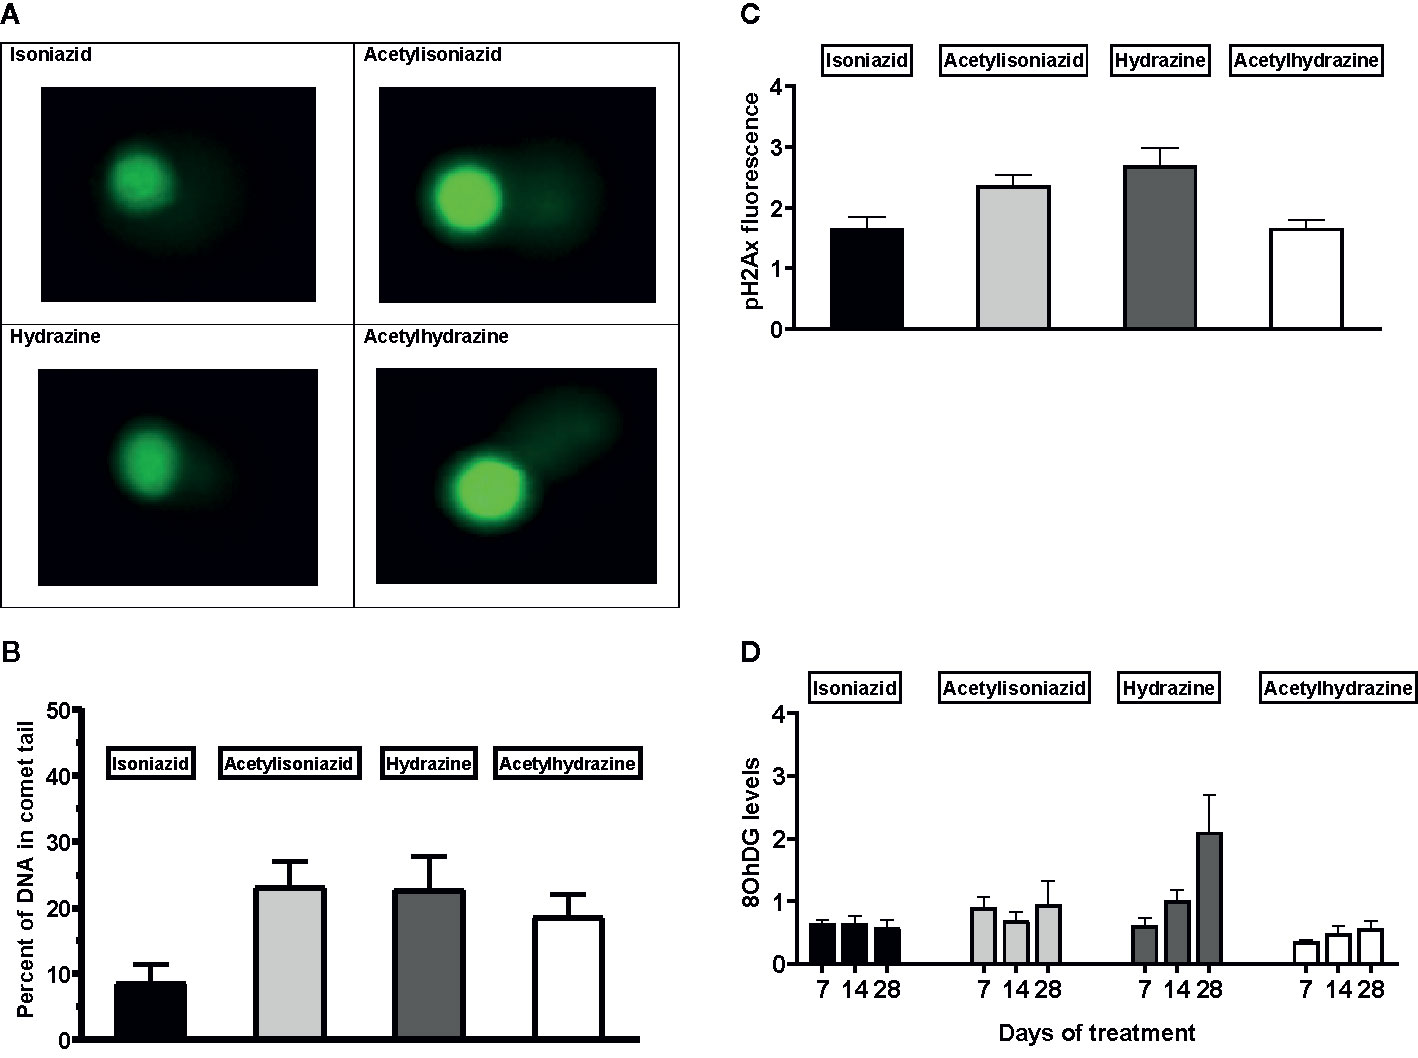
Figure 4 DNA damage markers in HepG2 cells treated with isoniazid and metabolites. (A) Comet chip microscopy of DNA damage after 7 days exposure. (B) Percentage of DNA in comet tail for isoniazid and metabolites after 7 days exposure. (C) Levels of phosphorylated gamma-ph2Ax levels in HepG2 cells after 28 days exposure. H2Ax is a core histone protein found in the nucleosome, and its phosphorylation is a marker of DNA damage caused by ROS. (D) 8-OhDG levels in cellular supernatant following 28 days exposure, a measure of oxidative DNA damage.
Oxidative DNA Damage Among Isoniazid-Treated TB Patients
To further test the clinical relevance of these in vitro findings, we collected urine samples obtained in a previously conducted clinical pharmacokinetic study of HIV/TB patients (Vinnard et al., 2017), to test for 8-OhDG concentrations, a stable marker of oxidative DNA damage, which has been linked to exposures to toxins such as cadmium (Pizzino et al., 2014), chromium, and lead (Pawlas et al., 2017) in other patient cohorts. Demographic, clinical, and immunologic characteristics of study participants are shown in Table 2, which shows that none of the characteristics differed NAT2 genotype. However, NAT2 genotype was associated with urine 8-OhDG concentrations, as shown in Figure 5A. In unadjusted analysis, we observed a significant increase in urine oxidative DNA damage among patients with slow NAT2 genotypes, compared to rapid acetylator genotypes (p=0.04). Next, we examined GSTA2, which encodes the dominant GST protein in human livers, and demonstrates population variability that corresponds to varying levels of hepatic GST expression (Ning et al., 2004). The rs2234951 and rs1803682 variants were not detected in the study cohort, while the SNPs rs6577 and rs2180314 were in complete linkage disequilibrium. Accordingly, all haplotypes were either GSTA2*B or *C under the naming schema proposed by Tetlow et al (Tetlow et al., 2001) (Supplementary Table 3). We identified 25 patients with the homozygous GSTA2*B/*B haplotype (rs6577/rs6577), 12 patients with the GSTA2*C/*B haplotype (rs6577/rs2180314), and 2 patients with the homozygous GSTA2*C/*C haplotype (rs2180314/rs2180134). In unadjusted analysis, GSTA2 genotype (GSTA2*C/*B or GSTA2*C/*C versus GSTA2*B/*B) was associated with urine oxidative DNA damage, as shown in Figure 5B (p=0.03). In contrast, neither the GSTP1 rs1695 variant, previously identified as a predictor of isoniazid toxicity in a Chinese cohort (Wu et al., 2016), nor the GSTM1 null variant were associated with urine oxidative DNA damage; however the number of patients with the GSTM1 null variant was small (n=3).
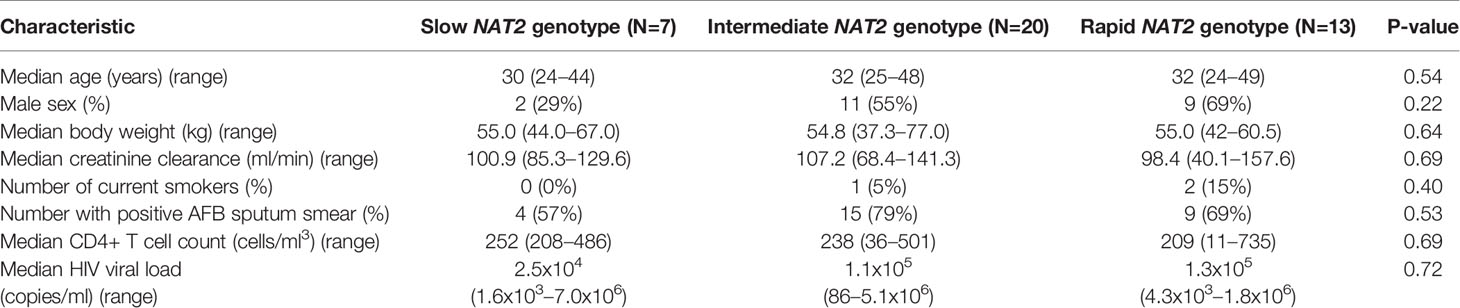
Table 2 Demographic and clinical characteristics of HIV/TB patients in Botswana, stratified by NAT2 genotype.
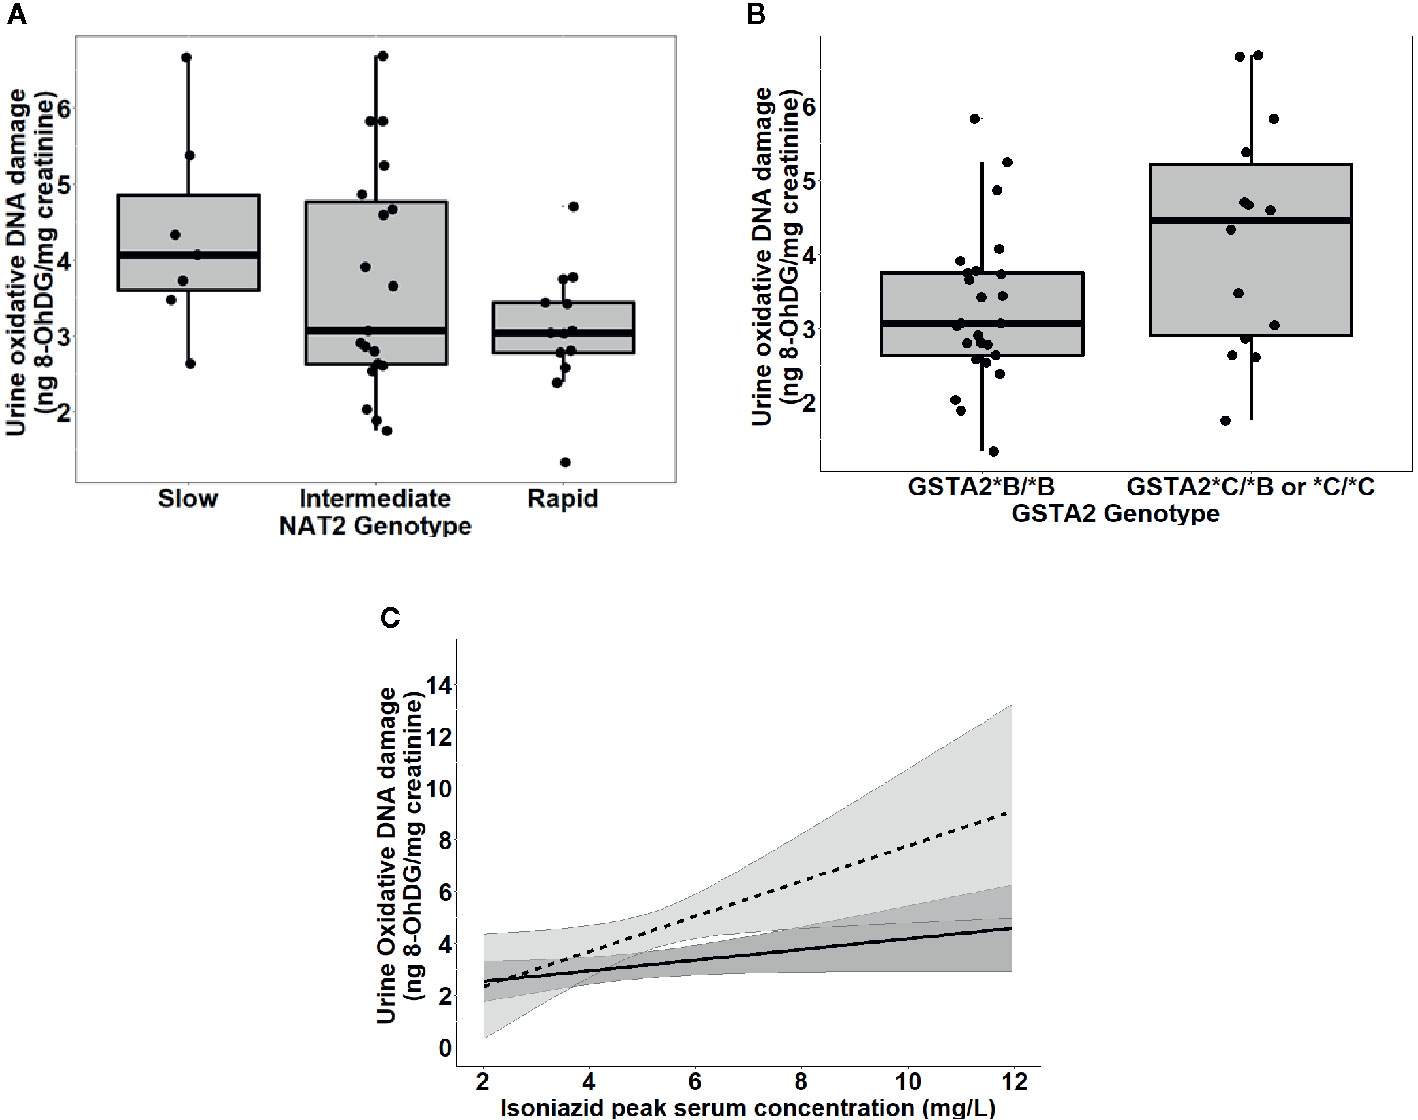
Figure 5 Urine levels of oxidative DNA damage among 39 HIV/TB patients in Botswana treated with first-line TB therapy including isoniazid, grouped by NAT2 and GSTA2 genotypes. (A) Univariate association of NAT2 genotype and urine oxidative DNA damage (p=0.04). Box plots correspond to median value and interquartile range. (B) Univariate association of urine 8-OhDG with GSTA2 genotype (p=.03). Box plots correspond to median value and interquartile range. (C) Margins plot of interaction between isoniazid Cmax and GSTA2 genotype. Each line represents marginal predicted levels of oxidative DNA damage for varying isoniazid Cmax, according to GSTA2 genotype, and the shaded areas represent 95% confidence intervals. Solid line: GSTA2*B/*B; dashed line: GSTA2*C/*B or *C.
Next, we examined the relationship between isoniazid pharmacokinetic exposures and urine oxidative DNA damage in a multivariate linear regression model. Based on our a priori criteria for model inclusion (greater than 20% change in the regression coefficient when the confounder was included in the model), the final multiple linear regression model included the confounding effects of body weight and renal function on the association between isoniazid Cmax and urine oxidative DNA damage (Table 3). Although not a significant confounder of this relationship, we included the effects of GSTA2 genotype (*B/*B vs *C/*B or *C/*C) based on its independent association with urine levels of oxidative DNA damage in unadjusted analysis. The corresponding increase in adjusted R-squared with sequential variable inclusion, along with the decline in Akaike information criteria (AIC) score, provided statistical support for choosing model as variables were added. Variance inflation factors for the variables in the final model were 1.31, 2.38, 1.78, and 1.39 for isoniazid Cmax, body weight, creatinine clearance, and GSTA2 genotype, respectively, supporting the absence of significant co-linearity among model predictors.
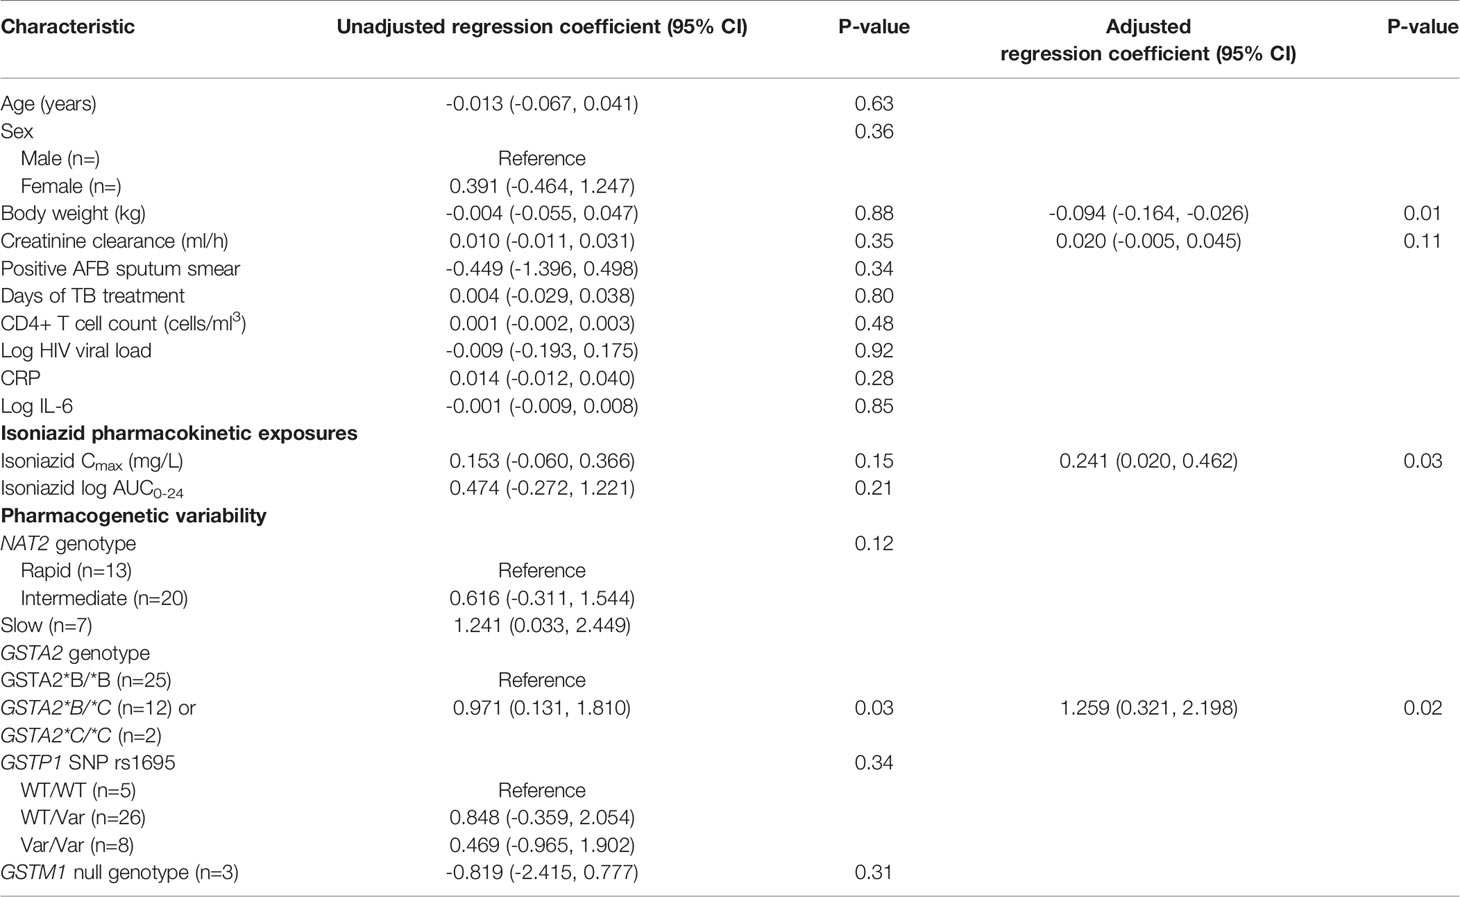
Table 3 Linear regression model of predictors of urine oxidative DNA damage among isoniazid-treated HIV/TB patients in Botswana.
Figure 5C is a marginal regression plot of isoniazid Cmax and urine oxidative DNA damage, with effect modification by GSTA2 genotype. Although the graphical relationship suggests that GSTA2 genotype acts both as an independent predictor as well as an effect modifier of the relationship between isoniazid Cmax and urine oxidative DNA damage, the difference in slopes did not reach the a priori threshold for statistical significance (p=0.12 for interaction term).
Discussion
Despite being a cornerstone of TB therapy for 60 years, there is considerable uncertainty regarding the mechanism for isoniazid hepatotoxicity, and the host factors that place TB patients at greatest risk. We first characterized plasma exposures to isoniazid and its metabolites (acetylisoniazid, hydrazine, and acetylhydrazine) in a clinical pharmacokinetic study, demonstrating that isoniazid and hydrazine plasma exposures are highly correlated. Based on these clinical data, we predicted liver tissue exposures using physiologically based pharmacokinetic modeling, observing that hydrazine concentrates in liver relative to plasma. We then developed a long-term, low-exposure experimental set-up in HepG2 cells in order to replicate parent-metabolite pharmacologic exposures in the liver during the course of isoniazid treatment. We found that the greatest levels of mitochondrial injury and oxidative DNA damage occurred with hydrazine treatment at equimolar concentrations. Finally, in a clinical translation of this observation, we observed that peak isoniazid serum concentrations and GSTA2 genotype were independently associated with increasing urine levels of oxidative DNA damage.
These findings link pharmacokinetic exposures to hydrazine, an isoniazid metabolite, with downstream effects on redox imbalance, adding to prior clinical studies of predictors of isoniazid hepatotoxicity. Slow acetylators of isoniazid, as defined by NAT2 genotype, have an increased risk of hepatotoxicity compared to intermediate or rapid acetylators, possessing one or two rapid NAT2 alleles, respectively (Wang et al., 2012). In a prior clinical study, peak serum isoniazid concentrations were directly correlated with elevations in liver transaminases, a marker of hepatic inflammation (Cojutti et al., 2016). Future work should identify whether early markers of oxidative stress among isoniazid-treated patients, such as the urine measure of DNA damage identified in this clinical study, are predictive of subsequent hepatotoxicity events. For example, a cross-sectional study among isoniazid-treated TB patients in India demonstrated an association between hepatotoxicity events and co-incident measurements of plasma oxidative stress markers (Chowdhury et al., 2001).
The GSTA2 gene encodes a protein sub-unit of α-GST, the predominant GST enzyme expressed in human liver tissue (Tetlow et al., 2001). Previously published data demonstrated decreased α-GST expression in liver tissue among individuals either heterozygous or homozygous for the GSTA2*C allele, suggesting greater vulnerability to oxidative hepatic injury (Ning et al., 2004). Consistent with this observation, we found that the GSTA2*C haplotype, either heterozygous or homozygous, was an independent predictor of urine oxidative DNA damage among HIV/TB patients. In contrast, we observed no relationship between urine oxidative DNA damage and the rs1695 allele in GSTP1, previously linked to anti-TB drug toxicity among Chinese patients (Wu et al., 2016), or the null mutant GSTM1.
The involvement of glutathione pathways in the development of isoniazid hepatotoxicity could identify both preventive and therapeutic strategies. Hydrazine cellular effects include inhibition of complex II of the electron transport chain, leading to accumulation of ROS that overwhelms cellular glutathione stores, and directly damaging to DNA through free radical injury (Runge-Morris et al., 1994). N-acetylcysteine, clinically used to counter acetaminophen toxicity, has also been used for glutathione deficiency in a wide range of conditions (Atkuri et al., 2007). Identification of intermediary signals on the pathway towards clinical hepatotoxicity events, such as oxidative DNA damage, would also improve efficiency of future clinical trial design of novel TB drug therapies, as isoniazid may be included in these investigational drug combinations (Wallis, 2013).
Aside from hepatotoxicity, oxidative DNA damage during isoniazid treatment may have additional downstream consequences. DNA damage signals induce the nuclear activity of poly(ADP-ribose) polymerase-1 (PARP-1), which is involved in DNA repair activities through multiple pathways (Krishnakumar and Kraus, 2010). Chronic PARP-1 activation competes for intracellular NAD+, resulting in impaired mitochondrial ATP production and cellular apoptosis (Fang et al., 2014). Thus, when considering the clinical implications of increased markers of oxidative DNA damage, additional effects aside from hepatotoxicity events should be considered. For example, isoniazid treatment has been linked to increased markers of cellular apoptosis in immune cells, and direct effects of isoniazid on the patient’s immune-metabolism has been suggested. Intriguingly, isoniazid treatment in mice induced apoptosis markers in CD4+ T cells (Tousif et al., 2014). Future clinical studies should directly compare isoniazid and metabolite pharmacokinetic exposures with toxicodynamic markers of redox imbalance, including urine markers of oxidative DNA damage.
This clinical and translational study of redox imbalance related to isoniazid and its metabolites had several important limitations. Multiple overlapping mechanisms may explain the observed relationship between isoniazid metabolites and oxidative stress markers; for example, one possibility is direct inhibition of the thioredoxin system of mitochondria, which is key contributor to oxidation/reduction balance (Stanley et al., 2011). Rather than directly measure concentrations in liver tissue, we used physiologically based pharmacokinetic models to estimate liver tissue exposures for each compound. In the clinical validation study, the metabolite concentrations were not measured, and thus we cannot directly evaluate the relationship between metabolite exposures (such as hydrazine) and oxidative stress in this clinical cohort. Based on our pre-clinical observations, we hypothesize that hydrazine exposures, rather than isoniazid exposures, would demonstrate the greatest association with urine oxidative DNA damage among isoniazid-treated TB patients. Furthermore, we did not perform prospective serial monitoring of hepatic transaminases in the clinical cohort, which was limited to 39 TB patients co-infected with HIV, and the significance of increased urine oxidative stress markers during isoniazid treatment remains uncertain. The independent role of HIV infection on oxidative stress markers during TB treatment remains to be determined. As we did not directly ascertain the predictive value of elevated urine oxidative stress markers with subsequent drug-induced liver injury, prospective studies will be essential to unravel the link between isoniazid and metabolite exposures, hepatocellular oxidative stress, and clinical hepatoxicity events, based on the rigorous assessment of causality with tools such as the Roussel Uclaf Causality Assessment Method (RUCAM) (Danan and Teschke, 2018).
This study had several strengths. Unlike many earlier studies, we examined physiologically relevant isoniazid and metabolite concentrations, supported by a parent-metabolite clinical pharmacokinetic study and physiologically-based pharmacokinetic modelling (Sager et al., 2015). We performed in vitro experiments to provide a mechanistic link between physiologic exposures to these compounds and cellular signals for redox imbalance and oxidative DNA damage. In this approach, we identified a marker of oxidative DNA damage, 8-OHdG, which was strongly induced by hydrazine exposures in the cell model, which we then related to isoniazid pharmacokinetic exposures and GSTA2 genotype in a clinical study. The identification of a urine-based biomarker of oxidative stress related to pharmacokinetic exposures and/or patient genotype supports non-invasive sampling strategies in future prospective studies of isoniazid toxicity. The feasibility of this future work is enhanced by the potential for point-of-care detection of 8-OHdG in paper-based devices (Martins et al., 2017).
In summary, the hydrazine metabolite of isoniazid was the strongest inducer of redox imbalance and downstream oxidative DNA damage in HepG2 cells over long-term exposures to clinically relevant concentrations. In a study of isoniazid-treated TB patients, peak serum isoniazid concentrations and GSTA2 genotype were independently associated with urine levels of 8-OHdG, a marker of oxidative DNA damage. Future clinical studies should evaluate urine 8-OHdG as an early predictor of clinical hepatotoxicity during isoniazid treatment.
Data Availability Statement
The data presented in this study are available in an open data repository (Figshare, doi:10.6084/m9.figshare.12709550).
Ethics Statement
The studies involving human participants were reviewed and approved by the University of Pennsylvania IRB and the Rutgers University IRB. The patients/participants provided their written informed consent to participate in this study.
Author Contributions
Study design: IZ, CV, SSu, JN, GB and TG. Data analysis: H-MB, LK, JP, SSr, IZ and CV. First draft: CV. All authors contributed to the review and preparation of the final manuscript.
Funding
CV was supported by NIAID (K23AI102639, R01AI137080).
Conflict of Interest
Authors JP and TG were employed by company Praedicare Inc.
The remaining authors declare that the research was conducted in the absence of any commercial or financial relationships that could be construed as a potential conflict of interest.
Acknowledgments
This manuscript has been released as a pre-print at medRxiv [Zentner et al. (2020)].
Supplementary Material
The Supplementary Material for this article can be found online at: https://www.frontiersin.org/articles/10.3389/fphar.2020.01103/full#supplementary-material
Supplementary Figure 1 | Physiologically-based pharmacokinetic model of isoniazid and metabolites.
Supplementary Table 1 | Parameters used in the physiologically-based pharmacokinetic model of isoniazid and metabolites.
Supplementary Table 2 | Properties of HPLC-MS/MS plasma assays for isoniazid and metabolites.
Supplementary Table 3 | GSTA2 haplotype designations based on SNPs, according to naming schema proposed by Tetlow et al (Tetlow et al., 2001). The rs2234951 and rs1803682 variants were not detected in the patient cohort; rs6577 and rs2180314 were in complete linkage disequilibrium.
References
Atkuri, K. R., Mantovani, J. J., Herzenberg, L. A., Herzenberg, L. A. (2007). N-Acetylcysteine–a safe antidote for cysteine/glutathione deficiency. Curr. Opin. Pharmacol. 7, 355–359. doi: 10.1016/j.coph.2007.04.005
Chowdhury, A., Santra, A., Kundu, S., Mukherjee, A., Pandit, A., Chaudhuri, S., et al. (2001). Induction of oxidative stress in antitubercular drug-induced hepatotoxicity. Indian J. Gastroenterol. 20, 97–100.
Cojutti, P., Duranti, S., Isola, M., Baraldo, M., Viale, P., Bassetti, M., et al. (2016). Might isoniazid plasma exposure be a valuable predictor of drug-related hepatotoxicity risk among adult patients with TB? J. Antimicrob. Chemother. 71, 1323–1329. doi: 10.1093/jac/dkv490
Danan, G., Teschke, R. (2018). Drug-Induced Liver Injury: Why is the Roussel Uclaf Causality Assessment Method (RUCAM) Still Used 25 Years After Its Launch? Drug Saf. 41 (8), 735–743. doi: 10.1007/s40264-018-0654-2
Doll, M. A., Hein, D. W. (2001). Comprehensive human NAT2 genotype method using single nucleotide polymorphism-specific polymerase chain reaction primers and fluorogenic probes. Anal. Biochem. 288, 106–108. doi: 10.1006/abio.2000.4892
Fang, E. F., Scheibye-Knudsen, M., Brace, L. E., Kassahun, H., SenGupta, T., Nilsen, H., et al. (2014). Defective mitophagy in XPA via PARP-1 hyperactivation and NAD(+)/SIRT1 reduction. Cell 157, 882–896. doi: 10.1016/j.cell.2014.03.026
Friedman, J. R., Nunnari, J. (2014). Mitochondrial form and function. Nature 505, 335–343. doi: 10.1038/nature12985
Frijhoff, J., Winyard, P. G., Zarkovic, N., Davies, S.S., Stocker, R., Cheng, D., et al. (2015). Clinical Relevance of Biomarkers of Oxidative Stress. Antioxid. Redox Signal 23, 1144–1170. doi: 10.1089/ars.2015.6317
Ge, J., Prasongtanakij, S., Wood, D. K., Weingeist, D. M., Fessler, J., Navasummrit, P., et al. (2014). CometChip: a high-throughput 96-well platform for measuring DNA damage in microarrayed human cells. J. Vis. Exp. 92, e50607. doi: 10.3791/50607
Gerets, H. H., Tilmant, K., Gerin, B., Chanteux, H., Depelchin, B. O., Dhalluin, S., et al. (2012). Characterization of primary human hepatocytes, HepG2 cells, and HepaRG cells at the mRNA level and CYP activity in response to inducers and their predictivity for the detection of human hepatotoxins. Cell Biol. Toxicol. 28, 69–87. doi: 10.1007/s10565-011-9208-4
Hassan, H. M., Guo, H. L., Yousef, B. A., Luyong, Z., Zhenzhou, J. (2015). Hepatotoxicity mechanisms of isoniazid: A mini-review. J. Appl. Toxicol. 35, 1427–1432. doi: 10.1002/jat.3175
Hayashi, P. H., Fontana, R. J., Chalasani, N. P., Stolz, A. A., Talwalker, J. A., Navarro, V. J., et al. (2015). Under-reporting and Poor Adherence to Monitoring Guidelines for Severe Cases of Isoniazid Hepatotoxicity. Clin. Gastroenterol. Hepatol. 13, 1676–82 e1. doi: 10.1016/j.cgh.2015.02.024
Hayes, J. D., Flanagan, J. U., Jowsey, I. R. (2005). Glutathione transferases. Annu. Rev. Pharmacol. Toxicol. 45, 51–88. doi: 10.1146/annurev.pharmtox.45.120403.095857
Jones, D. P., Lemasters, J. J., Han, D., Boelsterli, U. A., Kaplowitz, N. (2010). Mechanisms of pathogenesis in drug hepatotoxicity putting the stress on mitochondria. Mol. Interv. 10, 98–111. doi: 10.1124/mi.10.2.7
Krishnakumar, R., Kraus, W. L. (2010). The PARP side of the nucleus: molecular actions, physiological outcomes, and clinical targets. Mol. Cell 39, 8–24. doi: 10.1016/j.molcel.2010.06.017
Mandavilli, B. S., Janes, M. S. (2010). Detection of intracellular glutathione using ThiolTracker violet stain and fluorescence microscopy. Curr. Protoc. Cytom. 53 (1), 9–35. doi: 10.1002/0471142956.cy0935s53
Martins, G. V., Tavares, A. P. M., Fortunato, E., Sales, M. G. F. (2017). Paper-Based Sensing Device for Electrochemical Detection of Oxidative Stress Biomarker 8-Hydroxy-2’-deoxyguanosine (8-OHdG) in Point-of-Care. Sci. Rep. 7, 14558. doi: 10.1038/s41598-017-14878-9
Metushi, I., Uetrecht, J., Phillips, E. (2016). Mechanism of isoniazid-induced hepatotoxicity: then and now. Br. J. Clin. Pharmacol. 81, 1030–1036. doi: 10.1111/bcp.12885
Ning, B., Wang, C., Morel, F., Nowell, S., Ratnasinghe, D. L., Carter, W., et al. (2004). Human glutathione S-transferase A2 polymorphisms: variant expression, distribution in prostate cancer cases/controls and a novel form. Pharmacogenetics 14, 35–44. doi: 10.1097/00008571-200401000-00004
Pawlas, N., Olewinska, E., Markiewicz-Gorka, I., Kozłowska, A., Januszewska, L., Thomas Lundh, T., et al. (2017). Oxidative damage of DNA in subjects occupationally exposed to lead. Adv. Clin. Exp. Med. 26, 939–945. doi: 10.17219/acem/64682
Pizzino, G., Bitto, A., Interdonato, M., Galfo, F., Irrera, N., Mecchio, A., et al. (2014). Oxidative stress and DNA repair and detoxification gene expression in adolescents exposed to heavy metals living in the Milazzo-Valle del Mela area (Sicily, Italy). Redox Biol. 2, 686–693. doi: 10.1016/j.redox.2014.05.003
Roth, A. D., Lee, M. Y. (2017). Idiosyncratic Drug-Induced Liver Injury (IDILI): Potential Mechanisms and Predictive Assays. BioMed. Res. Int. 2017, 9176937. doi: 10.1155/2017/9176937
Rothkamm, K., Barnard, S., Moquet, J., Ellender, M., Rana, Z., Burdak-Rothkamm, S. (2015). DNA damage foci: Meaning and significance. Environ. Mol. Mutagen 56, 491–504. doi: 10.1002/em.21944
Runge-Morris, M., Wu, N., Novak, R. F. (1994). Hydrazine-mediated DNA damage: role of hemoprotein, electron transport, and organic free radicals. Toxicol. Appl. Pharmacol. 125, 123–132. doi: 10.1006/taap.1994.1056
Sager, J. E., Yu, J., Ragueneau-Majlessi, I., Isoherranen, N. (2015). Physiologically Based Pharmacokinetic (PBPK) Modeling and Simulation Approaches: A Systematic Review of Published Models, Applications, and Model Verification. Drug Metab. Dispos. 43, 1823–1837. doi: 10.1124/dmd.115.065920
Saukkonen, J. J., Cohn, D. L., Jasmer, R. M., Schenker, S., Jereb, J. A., Nolan, C. M., et al. (2006). An official ATS statement: hepatotoxicity of antituberculosis therapy. Am. J. Respir. Crit. Care Med. 174, 935–952. doi: 10.1164/rccm.200510-1666ST
Sies, H. (2015). Oxidative stress: a concept in redox biology and medicine. Redox Biol. 4, 180–183. doi: 10.1016/j.redox.2015.01.002
Sotsuka, T., Sasaki, Y., Hirai, S., Yamagishi, F., Ueno, K. (2011). Association of isoniazid-metabolizing enzyme genotypes and isoniazid-induced hepatotoxicity in tuberculosis patients. Vivo 25, 803–812.
Stanley, B. A., Sivakumaran, V., Shi, S., McDonald, I., Lloyd, D., Watson, W. H., et al. (2011). Thioredoxin reductase-2 is essential for keeping low levels of H(2)O(2) emission from isolated heart mitochondria. J. Biol. Chem. 286 (38), 33669–33677. doi: 10.1074/jbc.M111.284612
Tetlow, N., Liu, D., Board, P. (2001). Polymorphism of human Alpha class glutathione transferases. Pharmacogenetics 11, 609–617. doi: 10.1097/00008571-200110000-00007
Tomanek, L. (2015). Proteomic responses to environmentally induced oxidative stress. J. Exp. Biol. 218, 1867–1879. doi: 10.1242/jeb.116475
Tousif, S., Singh, D. K., Ahmad, S., Moodley, P., Bhattacharyya, M., Van Kaer, L., et al. (2014). Isoniazid induces apoptosis of activated CD4+ T cells: implications for post-therapy tuberculosis reactivation and reinfection. J. Biol. Chem. 289, 30190–30195. doi: 10.1074/jbc.C114.598946
Ungo, J. R., Jones, D., Ashkin, D., Hollender, E. S., Bernstein, D., Albanese, A. P., et al. (1998). Antituberculosis drug-induced hepatotoxicity. The role of hepatitis C virus and the human immunodeficiency virus. Am. J. Respir. Crit. Care Med. 157, 1871–1876. doi: 10.1164/ajrccm.157.6.9711039
Vinnard, C., Ravimohan, S., Tamuhla, N., Ivaturi, V., Pasipanodya, J., Srivastava, S., et al. (2017). Isoniazid clearance is impaired among human immunodeficiency virus/tuberculosis patients with high levels of immune activation. Br. J. Clin. Pharmacol. 83, 801–811. doi: 10.1111/bcp.13172
Wallis, R. S. (2013). Sustainable tuberculosis drug development. Clin. Infect. Dis. 56, 106–113. doi: 10.1093/cid/cis849
Wang, P. Y., Xie, S. Y., Hao, Q., Zhang, C., Jiang, B. F. (2012). NAT2 polymorphisms and susceptibility to anti-tuberculosis drug-induced liver injury: a meta-analysis. Int. J. Tuberc. Lung Dis. 16, 589–595. doi: 10.5588/ijtld.11.0377
Wu, S., Wang, Y. J., Tang, X., Wang, Y., Wu, J., Ji, G., et al. (2016). Genetic Polymorphisms of Glutathione S-Transferase P1 (GSTP1) and the Incidence of Anti-Tuberculosis Drug-Induced Hepatotoxicity. PloS One 11, e0157478. doi: 10.1371/journal.pone.0157478
Yew, W. W., Chang, K. C., Chan, D. P. (2018). Oxidative Stress and First-Line Antituberculosis Drug-Induced Hepatotoxicity. Antimicrob. Agents Chemother. 62 (8), e02637–17. doi: 10.1128/AAC.02637-17
Keywords: tuberculosis, hepatotoxicity, oxidative stress, DNA damage, isoniazid (INH)
Citation: Zentner I, Back H-m, Kagan L, Subbian S, Nagajyothi J, Srivastava S, Pasipanodya J, Gumbo T, Bisson GP and Vinnard C (2020) Redox Imbalance and Oxidative DNA Damage During Isoniazid Treatment of HIV-Associated Tuberculosis: A Clinical and Translational Pharmacokinetic Study. Front. Pharmacol. 11:1103. doi: 10.3389/fphar.2020.01103
Received: 18 May 2020; Accepted: 07 July 2020;
Published: 29 July 2020.
Edited by:
Lei Xi, Virginia Commonwealth University, United StatesReviewed by:
Nazareno Paolocci, Johns Hopkins University, United StatesRolf Teschke, Hospital Hanau, Germany
Copyright © 2020 Zentner, Back, Kagan, Subbian, Nagajyothi, Srivastava, Pasipanodya, Gumbo, Bisson and Vinnard. This is an open-access article distributed under the terms of the Creative Commons Attribution License (CC BY). The use, distribution or reproduction in other forums is permitted, provided the original author(s) and the copyright owner(s) are credited and that the original publication in this journal is cited, in accordance with accepted academic practice. No use, distribution or reproduction is permitted which does not comply with these terms.
*Correspondence: Christopher Vinnard, christopher.vinnard@njms.rutgers.edu
†Present addresses: Isaac Zentner, Process Development, Carisma Therapeutics, Inc. Philadelphia, PA, United States
Christopher Vinnard, Translational Medicine and Clinical Pharmacology, Sanofi US, Bridgewater, NJ, United States