Experimental Investigation of Local Scour Protection for Cylindrical Bridge Piers Using Anti-Scour Collars


Department of Bridge Engineering, Southwest Jiaotong University, Chengdu 610031, China
*
Author to whom correspondence should be addressed.
Water 2019, 11(7), 1515; https://doi.org/10.3390/w11071515
Submission received: 18 June 2019
/
Revised: 15 July 2019
/
Accepted: 18 July 2019
/
Published: 21 July 2019
(This article belongs to the Special Issue Experimental, Numerical and Field Approaches to Scour Research)
Abstract
:Local scour of bridge piers is one of the main threats responsible for bridge damage. Adopting scour countermeasures to protect bridge foundations from scour has become an important issue for the design and maintenance of bridges located in erodible sediment beds. This paper focuses on the protective effect of one active countermeasure named an “anti-scour collar” on local scour around the commonly used cylindrical bridge pier. A cylindrical pier model was set up in a current flume. River sand with a median particle size of 0.324 mm was selected and used as the sediment in the basin. A live-bed scour experimental program was carried out to study the protective effect of an anti-scour collar by comparing the local scour at a cylindrical bridge pier model with and without collar. The effects of three design parameters including collar installation height, collar external diameter and collar protection range, on the scour depth and scour development were investigated parametrically. According to the experimental results, it can be concluded that: the application of an anti-scour collar alleviates the local scour at the pier effectively; and the protection effect decreases with an increase in the collar installation height, but increases with an increase in the collar external diameter and the protection range. Design suggestions for improving the scour protective effect of the anti-scour collar are summarized and of great practical guiding significance to the development of anti-scour collars for bridge piers.
1. Introduction
The local scour of bridge piers is one of the main natural causes to bridge structure damage [1,2]. A survey conducted by the US Federal Highway Administration (FHWA) in 1973 showed that more than 20% of pier damage and 70% of abutment damage in a total number of 383 bridge accidents were caused by scour [3]. Wardhana and Hadipriono [4] studied over 500 instances of bridge damage that occurred between the year 1989 and 2000 in the United States and found that more than 50% of the bridge failures were caused by scour due to flood. In a Transportation Research Board’s (TRB’s) National Cooperative Highway Research Program (NCHRP) report, scour was implicated in up to 60% of bridge failures [5]. Yi et al. [6] reviewed 160 bridge collapse accidents that occurred from the year 2000 to 2014 in China and found that more than 30% of the bridge accidents were caused by scour. Scour is a natural phenomenon caused by the erosive action of flowing streams on erodible beds. Scour can remove the sediment around the bridge foundation, change the structural natural frequencies, reduce the lateral bearing capacity of the foundation and even reduce the seismic capacity of the bridge [7,8,9,10,11].
Scour is usually classified as general scour, contraction scour or local scour. Compared with the first two types of scour, the local scour is generally taken as the main hazard responsible for bridge damage [2,12]. Local scour is the flow erosion due to the blockage of the bridge pier or foundation, where sediment is carried away from the bridge piers or foundations and the scour hole is formed near the piers or foundations [1]. Many researchers have carried out theoretical analysis and experimental research on the local scour of piers. Ataie-Ashtiani and Beheshti [13] studied the local scour around pile groups under steady clear-water scour conditions experimentally. Zhang et al. [14] explored the local scour mechanism of cylindrical piers. Khosronejad et al. [15] carried out experiments and numerical simulations to investigate the clear-water scour around three bridge piers with different cross sections. Sumer et al. [16] summarized some recent research about scour around coastal structures, including flow and scour processes with the subheadings, and sediment behavior close to the structure with the subheadings and further examined the local scour around a pile subject to combined waves and current through testing [17]. Bouratsis et al. [18] carried out a quantitative spatio-temporal characterization study on scour at the base of a cylinder.
Local scour of a bridge foundation is almost inevitable in the actual river or ocean environment. Therefore, adopting some appropriate scour countermeasures to reduce the local scour hole around the bridge pier and protect the foundation of the bridge structure has become an important issue for the design and maintenance of bridges located in the erodible sediment beds. Traditional countermeasures used in bridge engineering can be divided into two categories: (a) passive countermeasures and (b) active countermeasures [2]. Passive countermeasures mainly include: the enlarged foundation [19], the concrete protection [20,21], the partial grouted riprap [5] and the riprap [22,23]. These measures aim to increase the resistance capacity of the bridge foundation to the inflow shear stress by laying a protective layer on the riverbed around the bridge foundation, so as to protect the erosion-prone sediment in the lower layer. Passive countermeasures have been widely used in current engineering practice, but they cannot eliminate the fundamental causes of scour. On the contrary, active countermeasures focus on the disturbing the flow field and thereby reducing the effect of inflow, and thus attract research interest. Some active countermeasures reported in the previous research consist of: the anti-scour collar [24,25], the ring-wing pier [26], the slot [27] and the sacrificial piles [28], etc. The active measures aim to improve the original hydraulic characteristics, such as changing the direction and reducing the flow speed, to weaken the effect of downflow and horseshoe vortexes and hence protect the bridge foundation from local scour.
Tafarojnoruz et al. [29] reviewed various flow-altering scour countermeasures and concluded that the difficulties in the field applications of active countermeasures limited their practical use. Among the active methods, the anti-scour collar can be a useful and simple countermeasure for local scour around cylindrical bridge piers, which can reduce the horseshoe vortex strength by diverting and acting as an obstacle in the downflow passage. Previous literature shows that placing a collar around the bridge pier can reduce the depth of scour [30]. The anti-scour collar external diameter and installation height proved to be the most important factors influencing its protection efficiency [2]. Chen et al. [31] proposed a new type of collar named hooked-collar, and found that that maximal downflow is highly reduced along with a corresponding decrease in horseshoe vortex strength for the experiments with the hooked-collar, compared to cases without the collar. Chiew [24] investigated the local scour of a pier using a collar, a slot, and their combination and found that placing either a collar or a slot around the bridge pier can reduce the scour depth, and their combination can further reduce the scour depth. Gaudio et al. [32] carried out clear-water tests on the bridge pier scour with various combinations of collars with some other countermeasures and concluded that an improper combination of two countermeasures may be less effective than each individual countermeasure. Similar studies about collars in reducing the scour depth can be found in several studies [25,27,29,33,34,35]. However, these studies seldom focused on the distribution of the scour depth around piers and how to design the anti-scour collar and optimize its protective effect on the local scour of piers.
In order to address the issues related to the optimal design of anti-scour collars and the local scour depth distribution around cylindrical bridge piers with anti-scour collars, this study is organized as follows: (1) A scour experimental program is firstly presented to study the protective effect of anti-scour collars at a local scour of a cylindrical bridge pier model; (2) local scour of the pier model with and without anti-scour collar is studied experimentally; (3) the effect of collar installation height, collar external diameter and collar protection range on its scour protective effect were investigated; and (4) the design of anti-scour collars on the characteristics and development of local scour hole around the pier model are discussed parametrically.
2. Experimental Setup
2.1. Testing Facilities
The experiments were carried out in the large-sized current flume at Southwest Jiaotong University. As shown in Figure 1, the flume is 60 m long, 2 m wide and 1.8 m high with side walls comprised of steel frames and toughened glass, which provides a clear and wide visual range during the testing. There is a scour section in the large-sized current flume, which is 7.5 m long, 2 m wide, 0.35 m deep. A test rack is installed above the sand pool and used to fix the testing physical models. A flow pump is installed at the inflow point to generate steady current in the flume. An outlet is set in the tail part. The water flows into the outlet through an annular channel under the flume and backs to the pump to realize the flow circulation.
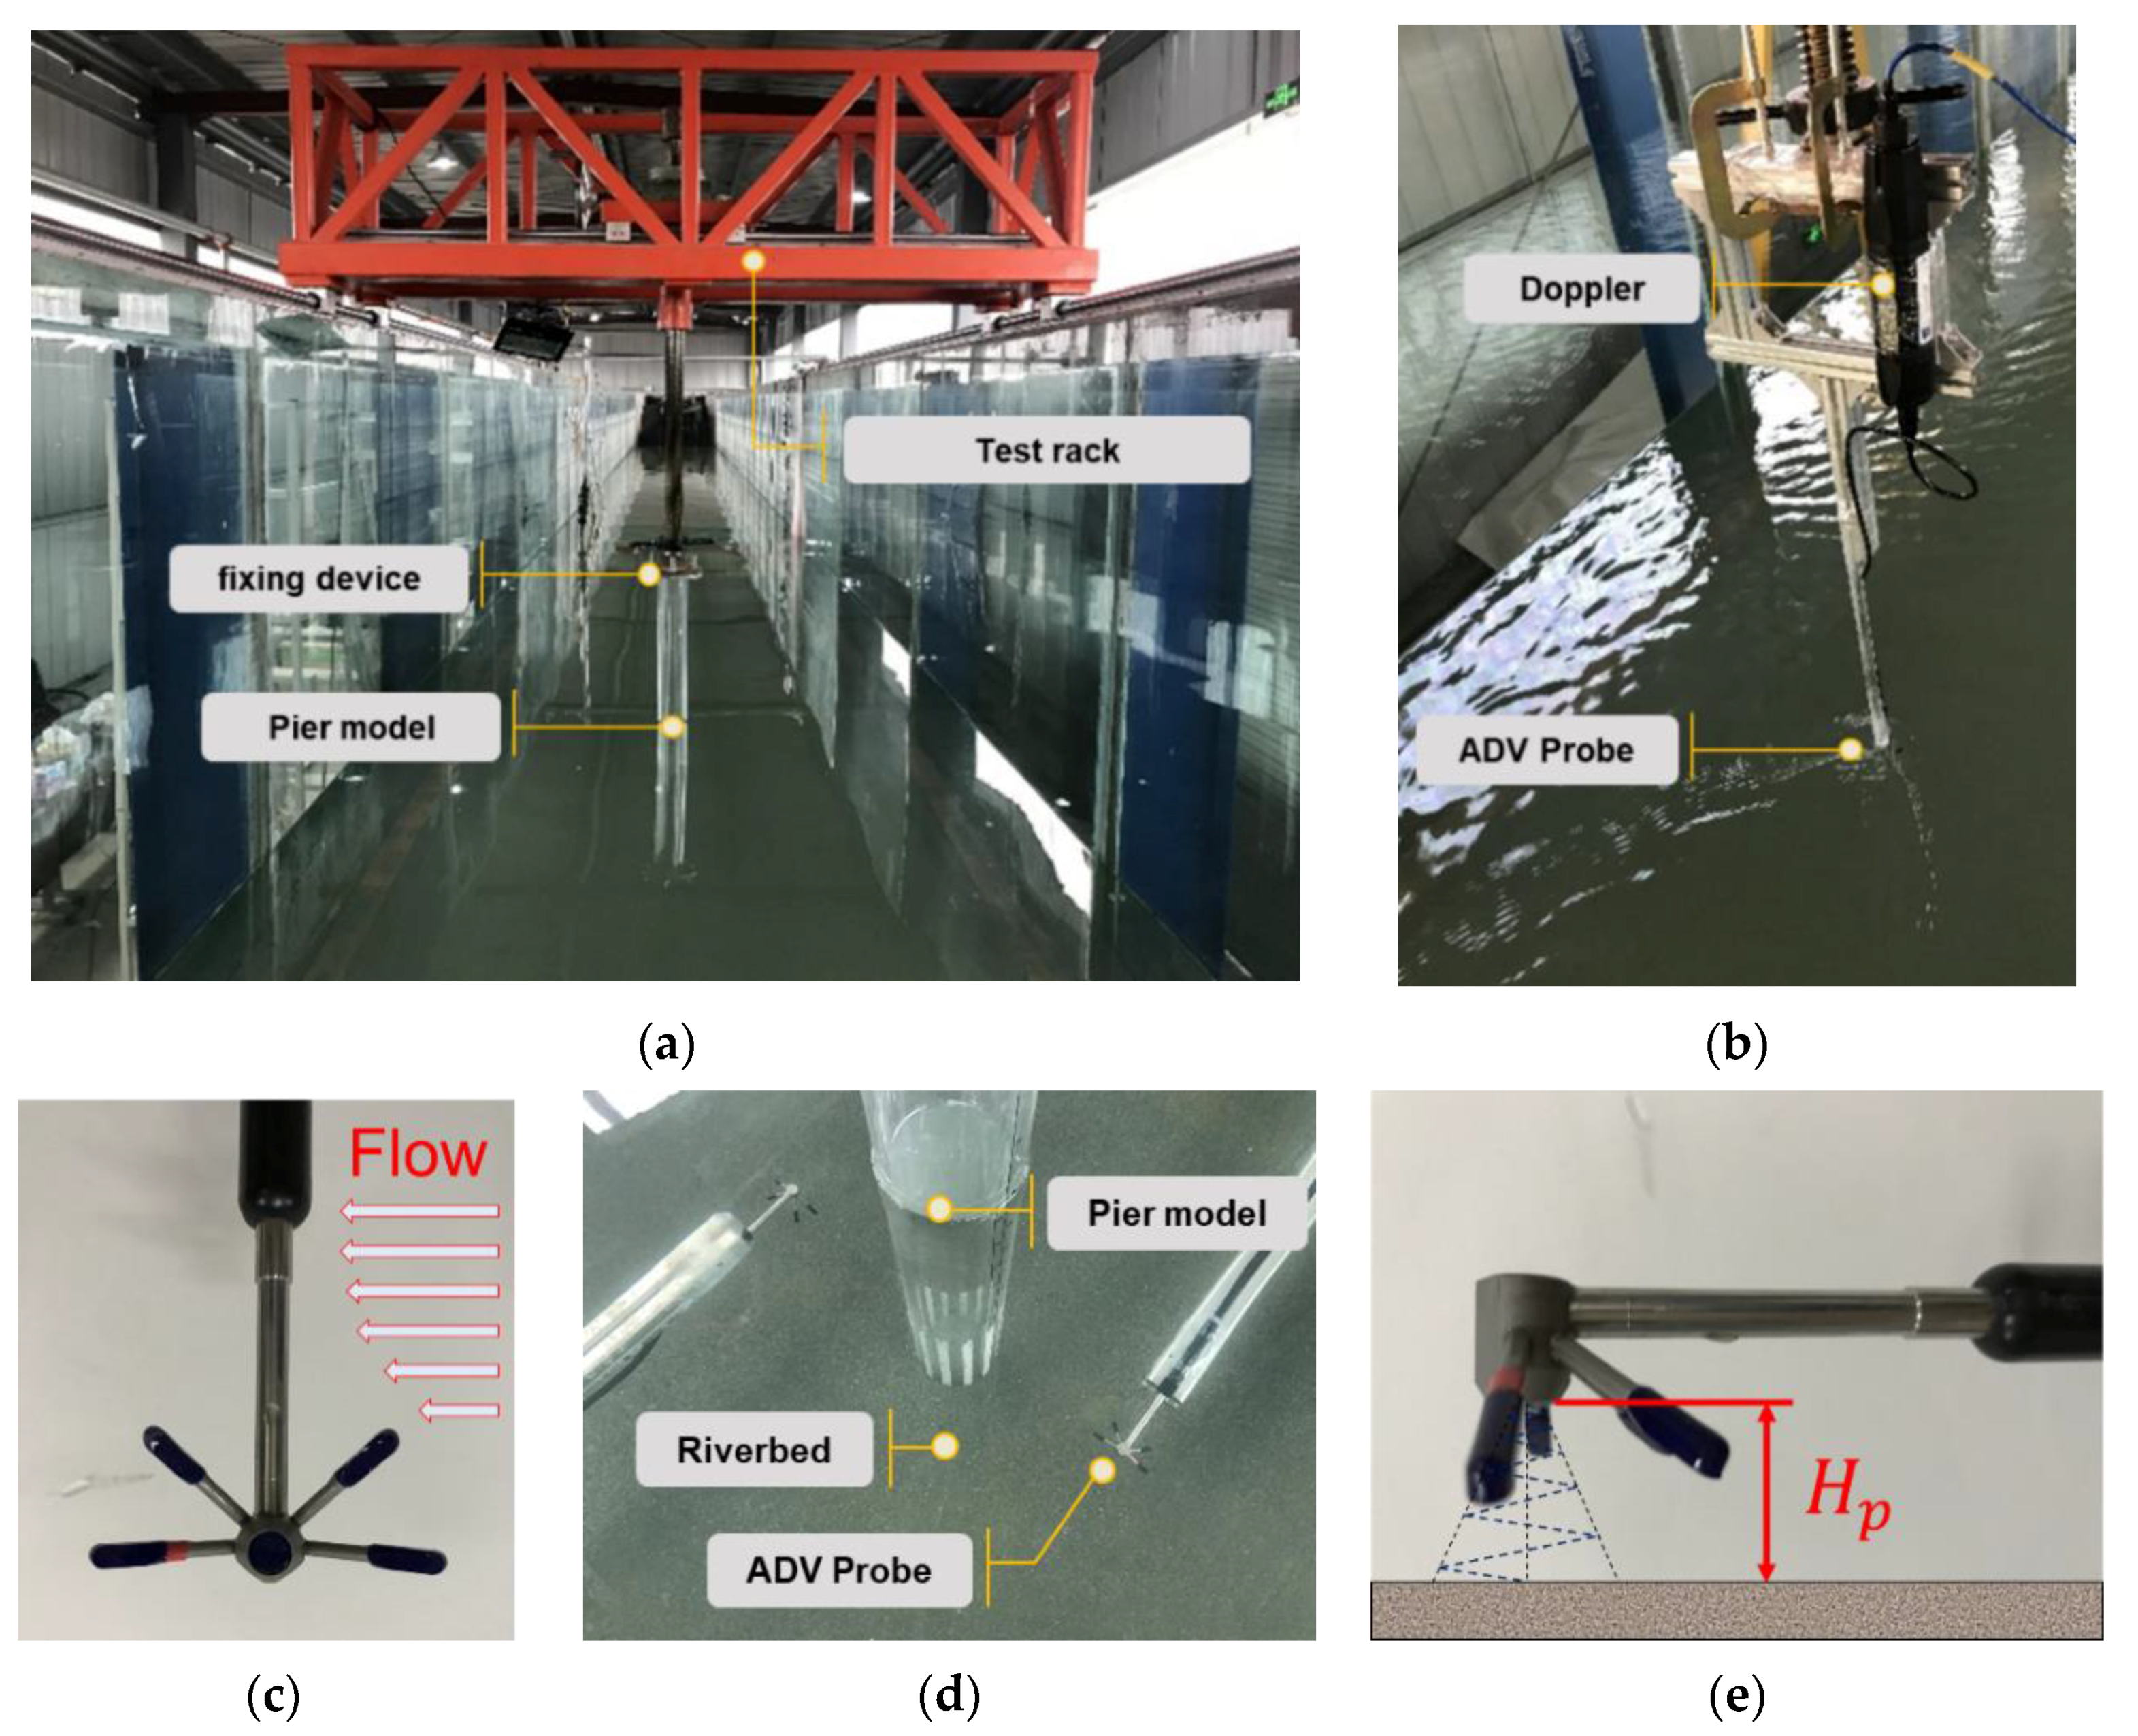
The layout of the scour testing facilities is shown in Figure 2. As shown in Figure 2a, the bridge pier model is inserted 20 cm into the riverbed. The top of the pier model is fixed with the test rack by the bolts to ensure the structural rigidity in the scour testing process. An Acoustic Doppler Velocimeter (ADV) was used to measure the flow velocity, and the maximum allowable flow velocity was 4 m/s. As shown in Figure 2b,c, ADV can be moved up and down to measure the velocity distribution along the water depth in this test. The ADV device in this study can also be used to measure the scour depth and obtain the shape of the scour pit around the foundation. Figure 2d,e shows the setup of ADV for the measurement of the range and depth of scour hole around piers.
2.2. Description of Anti-Scour Collar
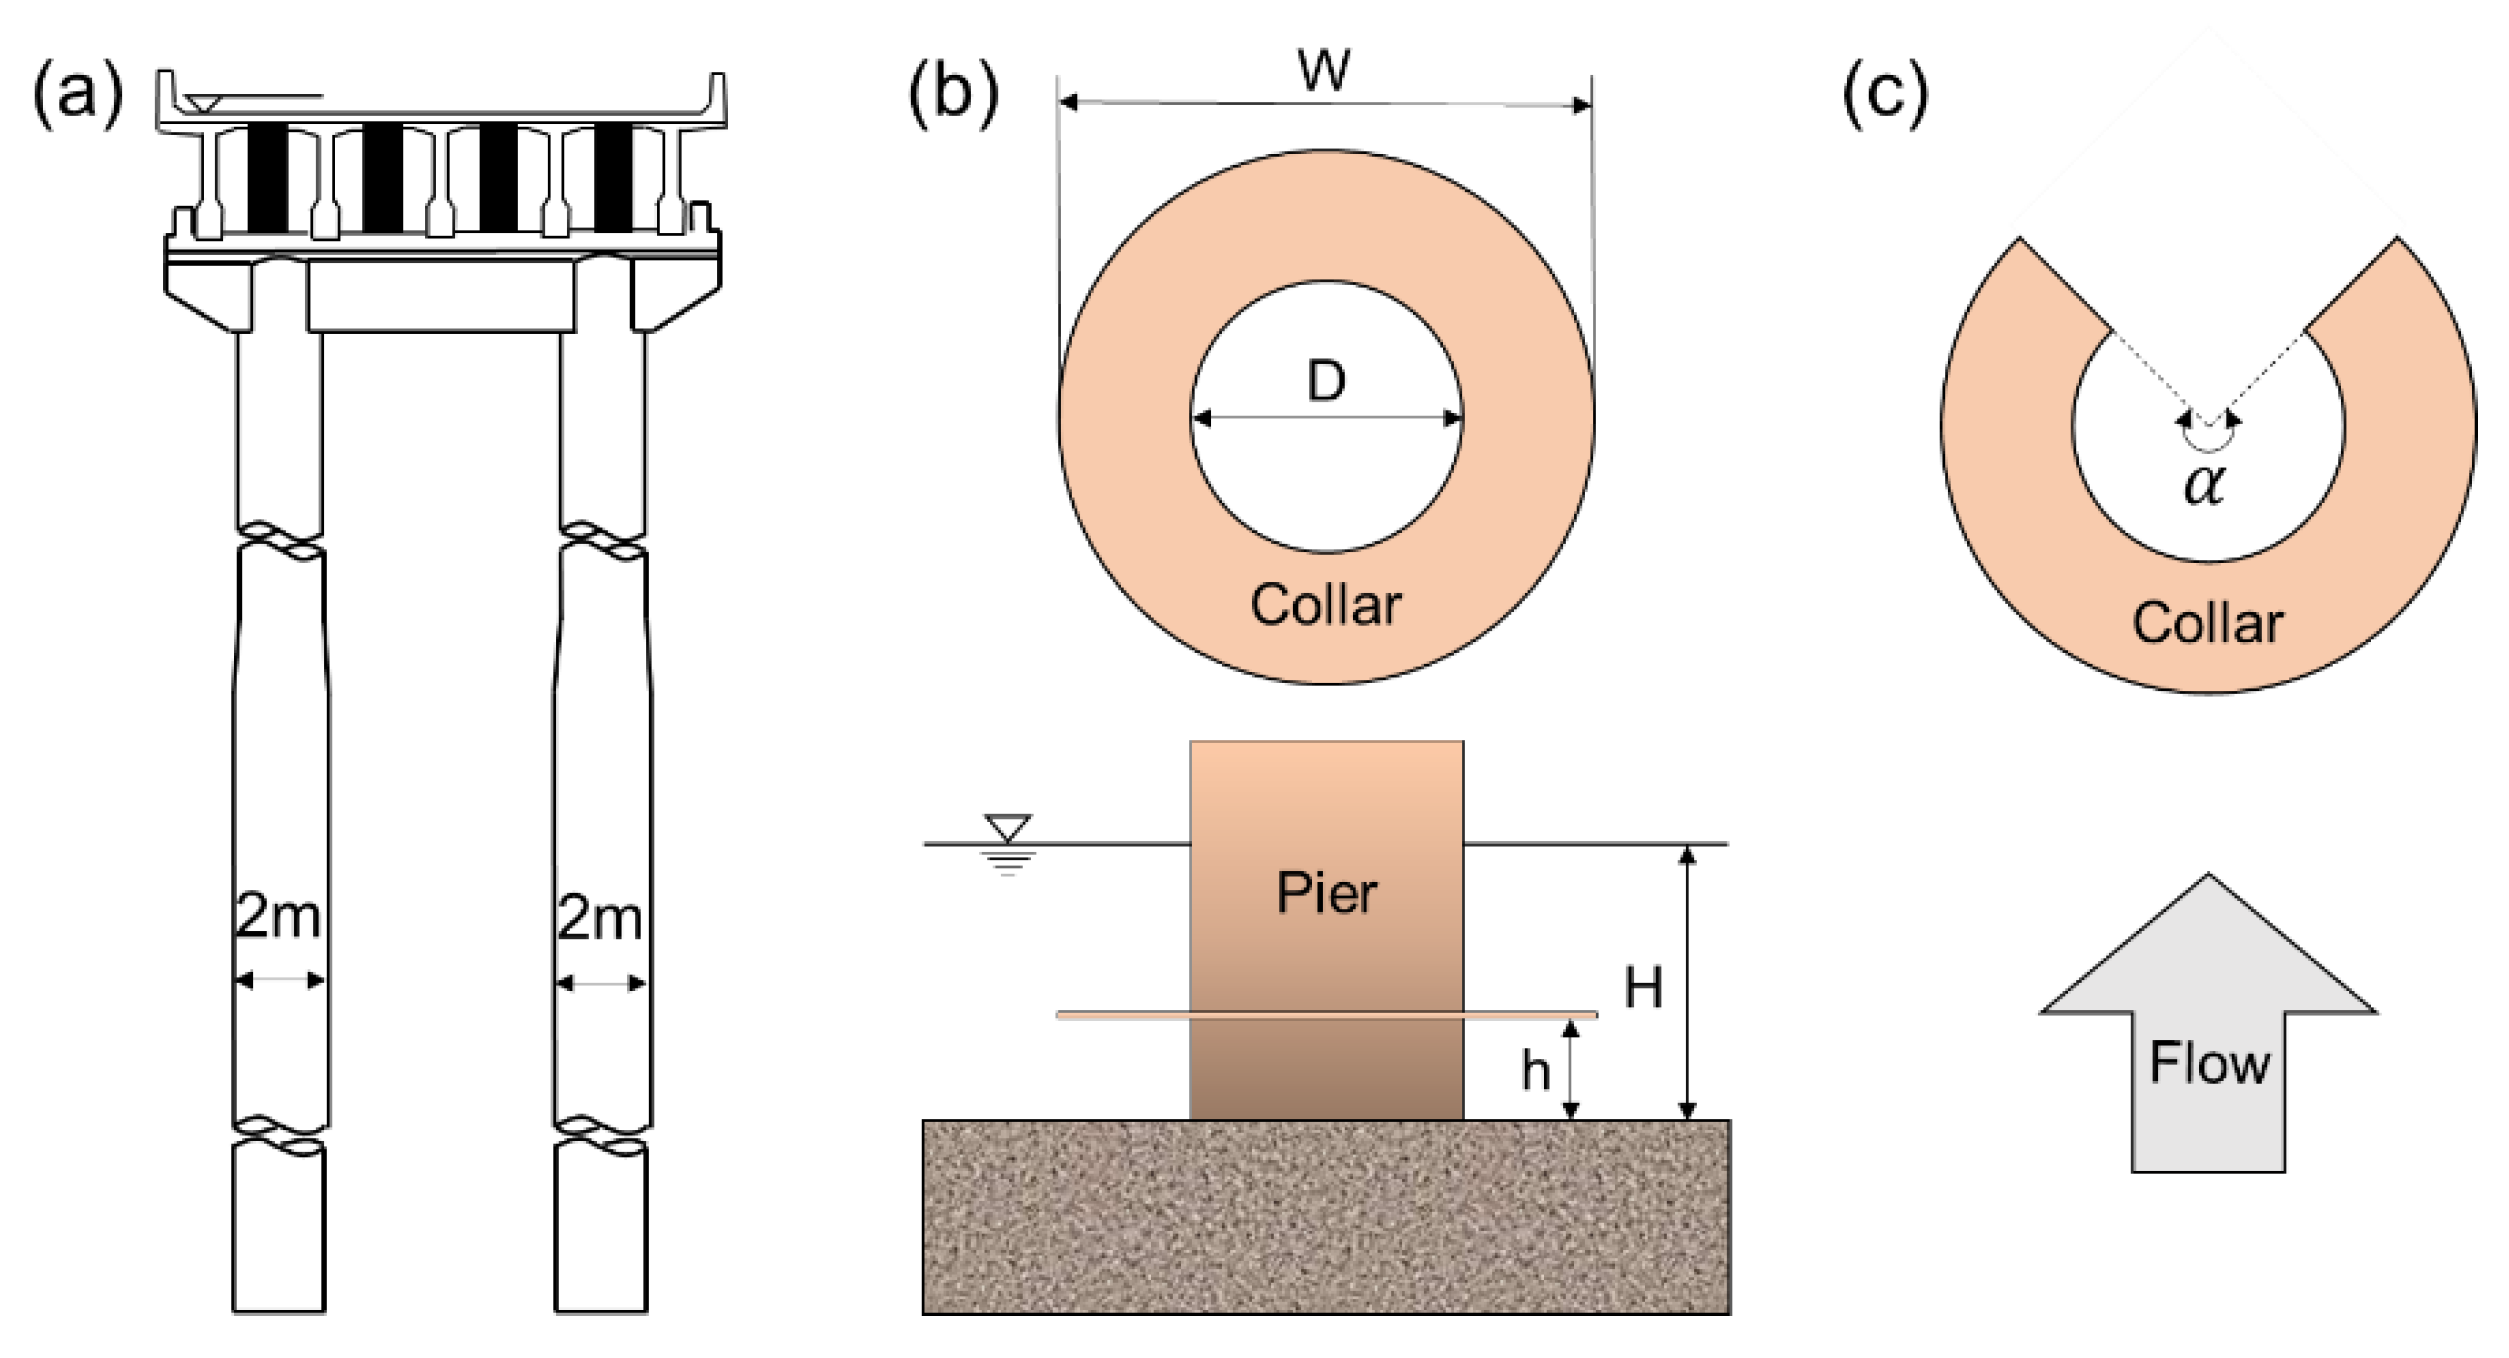
The commonly used highway bridges in the valley river areas always adopt cylindrical piers with a diameter of 2 m, as illustrated in Figure 3. A cylindrical pile with a diameter of 2 m was also used for scour analysis in some literature [36]. In this study, a length scale of 1:20 is adopted to design the model and flow conditions. The pier model was made of cylindrical acrylic tube with an outer diameter of 10 cm and a thickness of 1 cm.
The downward flow and horseshoe vortex are two main hydraulic effects that affect the local scour. The anti-scour collar installed at the bottom of the pier can protect the sediment particles far from erosion by reducing the downward flow particle velocity and the horseshoe vortex.
In this study, the anti-scour collar used in the physical model tests is an acrylic circle plate with a thickness of 0.5 cm. As shown in Figure 3, three key design parameters of the collar need to be addressed, including collar installation height h (a distance from the collar to the riverbed), collar external diameter W and collar protection range α. D is the outer diameter of pier, H is the water depth.
2.3. Flow Velocity Determination
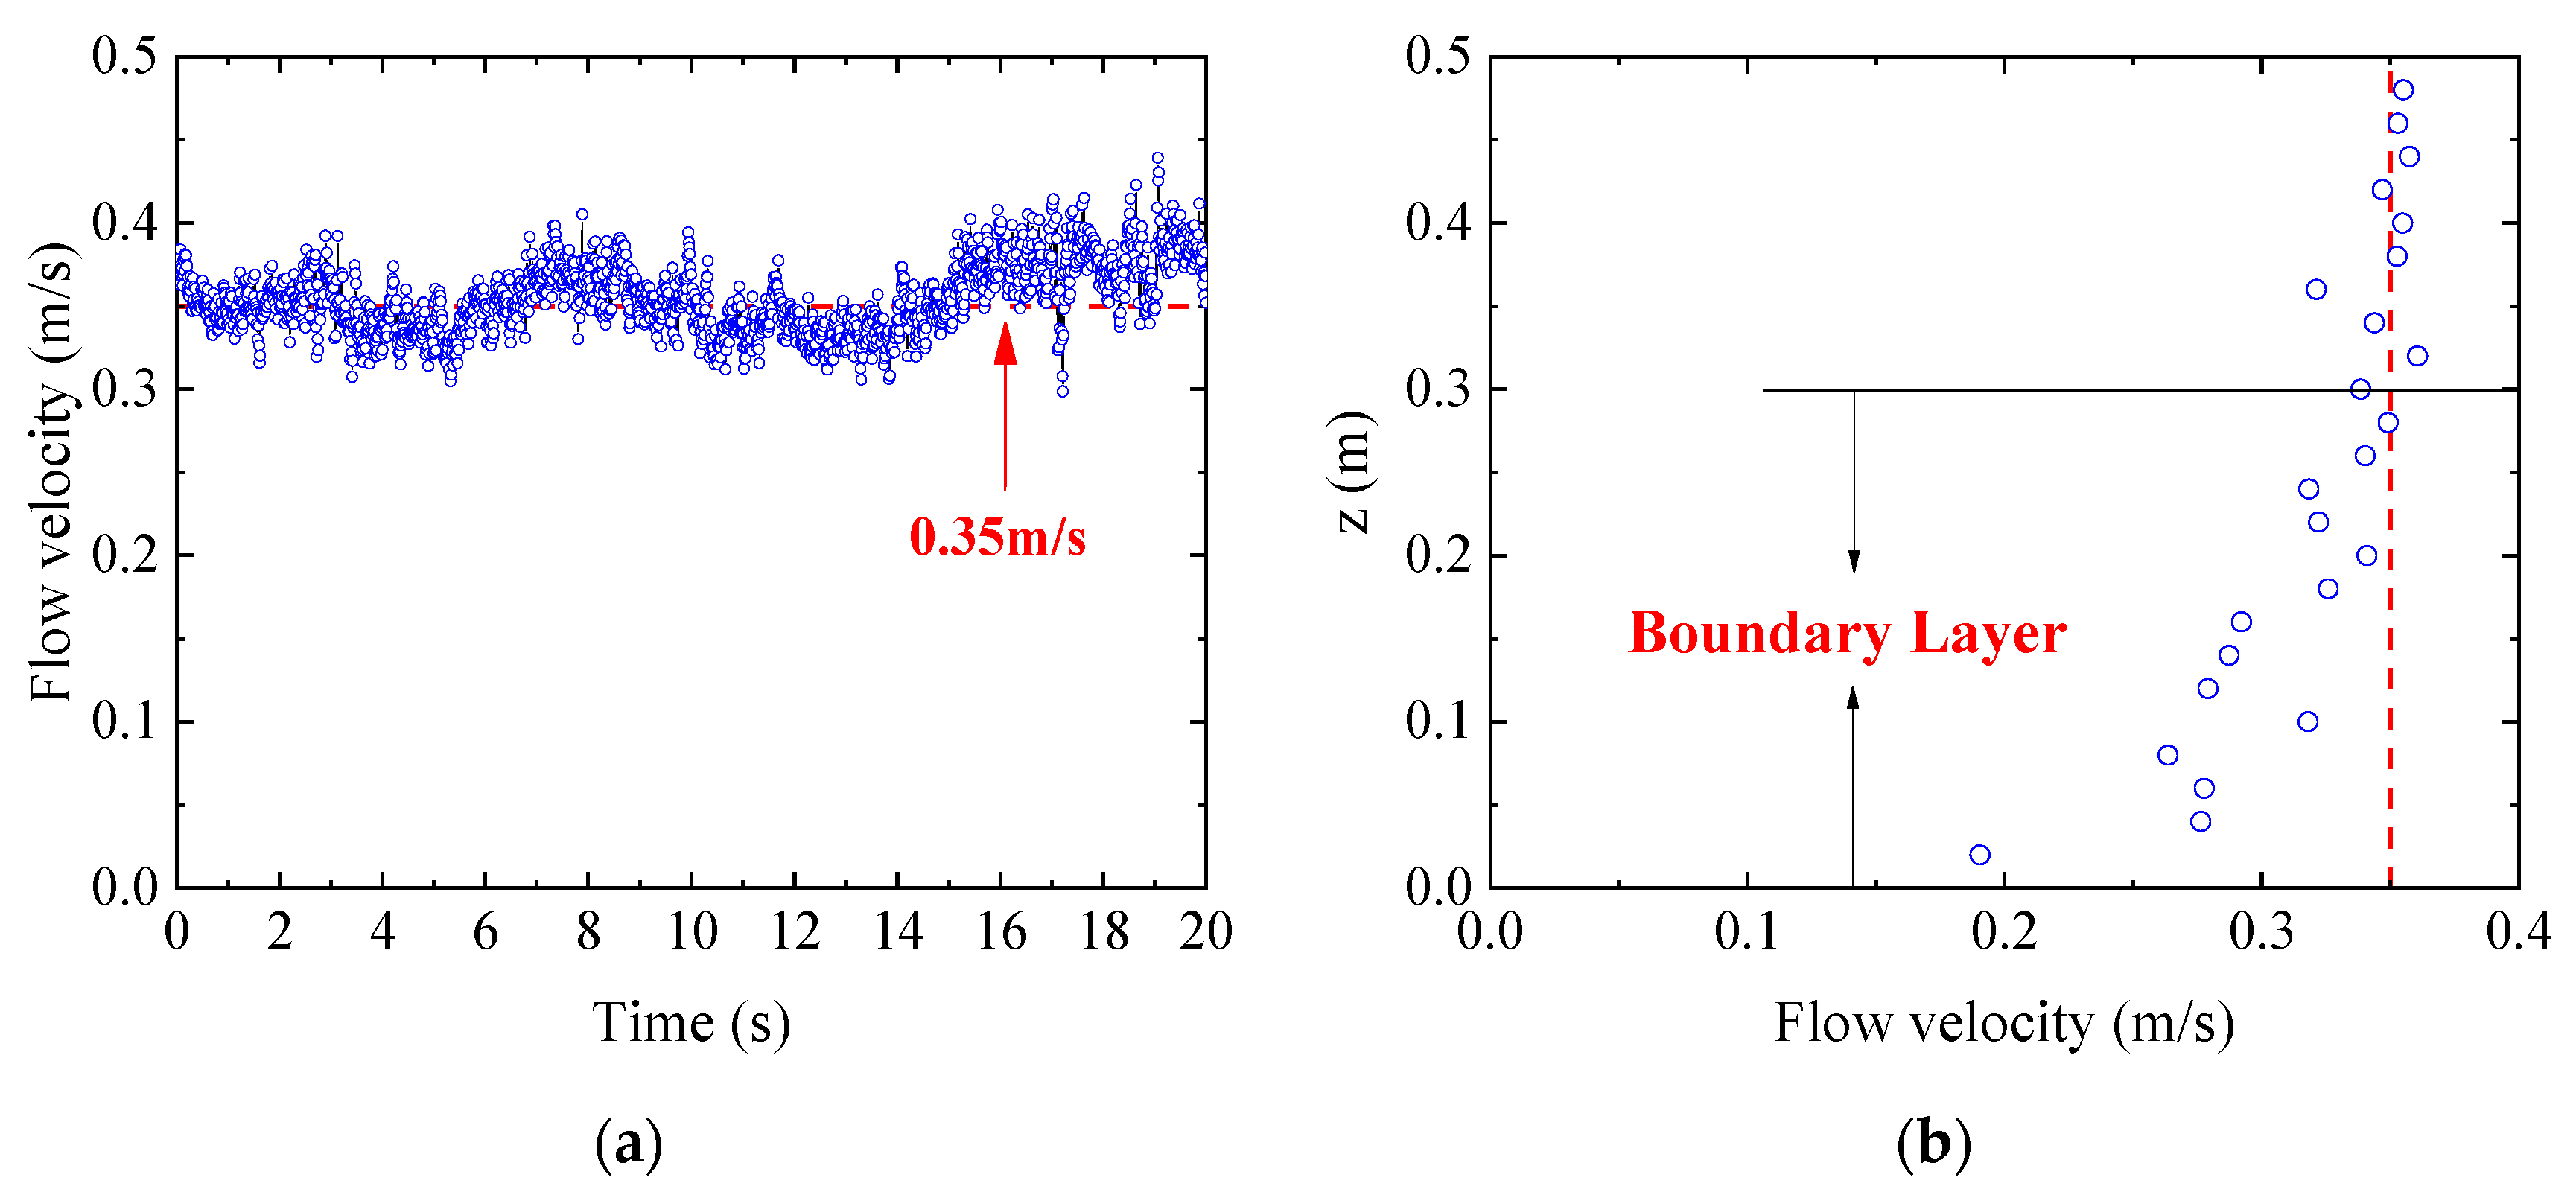
Figure 4a shows the flow velocity curve measured by the ADV probe at the position of 10 cm below water surface with a water depth of 50 cm and a flow velocity of 0.35 m/s. The sampling frequency of the ADV is 100 Hz. At each height, the mean value of three 20 s time histories of the flow velocity was calculated and used to remove the effect of the noise of the ADV velocity data.
The flow velocity at different heights was measured by the above method with height increment of 2 cm. The velocity distribution along the height z is shown in Figure 4b. The height of the boundary layer is about 30 cm. When the distance between the ADV probe and water surface is less than 20 cm, the measured velocity is basically stable near the maximum value. This phenomenon has also been found in previous similar studies [37].
3. Experimental Program
3.1. Threshold Velocity Calculation of Sediment
Natural uniform river sand was selected as the riverbed material for the tests. The median particle size of the sand is 0.324 mm, and the density of the river sediment is 2.65 g/cm3. Before the start of each test, the riverbed sediment in the scour section was smoothed and kept still for a period of time. Only one type of sand was used in all the tests carried out in this study. The water depth and flow velocity were kept constant at 0.5 m and 0.35 m/s, respectively.
The critical Shields parameter was calculated by the improved empirical formula by Soulsby and Whitehouse [38,39]
where the non-dimensional particle size D* is defined as D* = [g(s − 1)/ν2]1/3d50 with ν (=10−6 m2/s) being the kinematic viscosity of water. The Shields parameter due to total friction was obtained according to the measured velocity profile. The Shields parameter θs due to skin friction is defined as
where τs is the shear stress due to skin friction experienced by the sea bed from the flow, ρ is the water density, g is the acceleration due to gravity, s is the specific gravity of sand, d50 is the median particle size of sand, Ufs = (τs/ρ)1/2 is friction velocity associated with skin friction. The shear stress due to skin friction is calculated by the empirical formula for flat sand surface [39]
where the logarithmic relationship for CD is CD = {κ/[ln(z0s/h) + 1]}2, κ (=0.4) is the Karman constant, Ū is the depth averaged flow velocity, z0s (=d50/12) is the roughness height due to skin friction and h is the water depth.
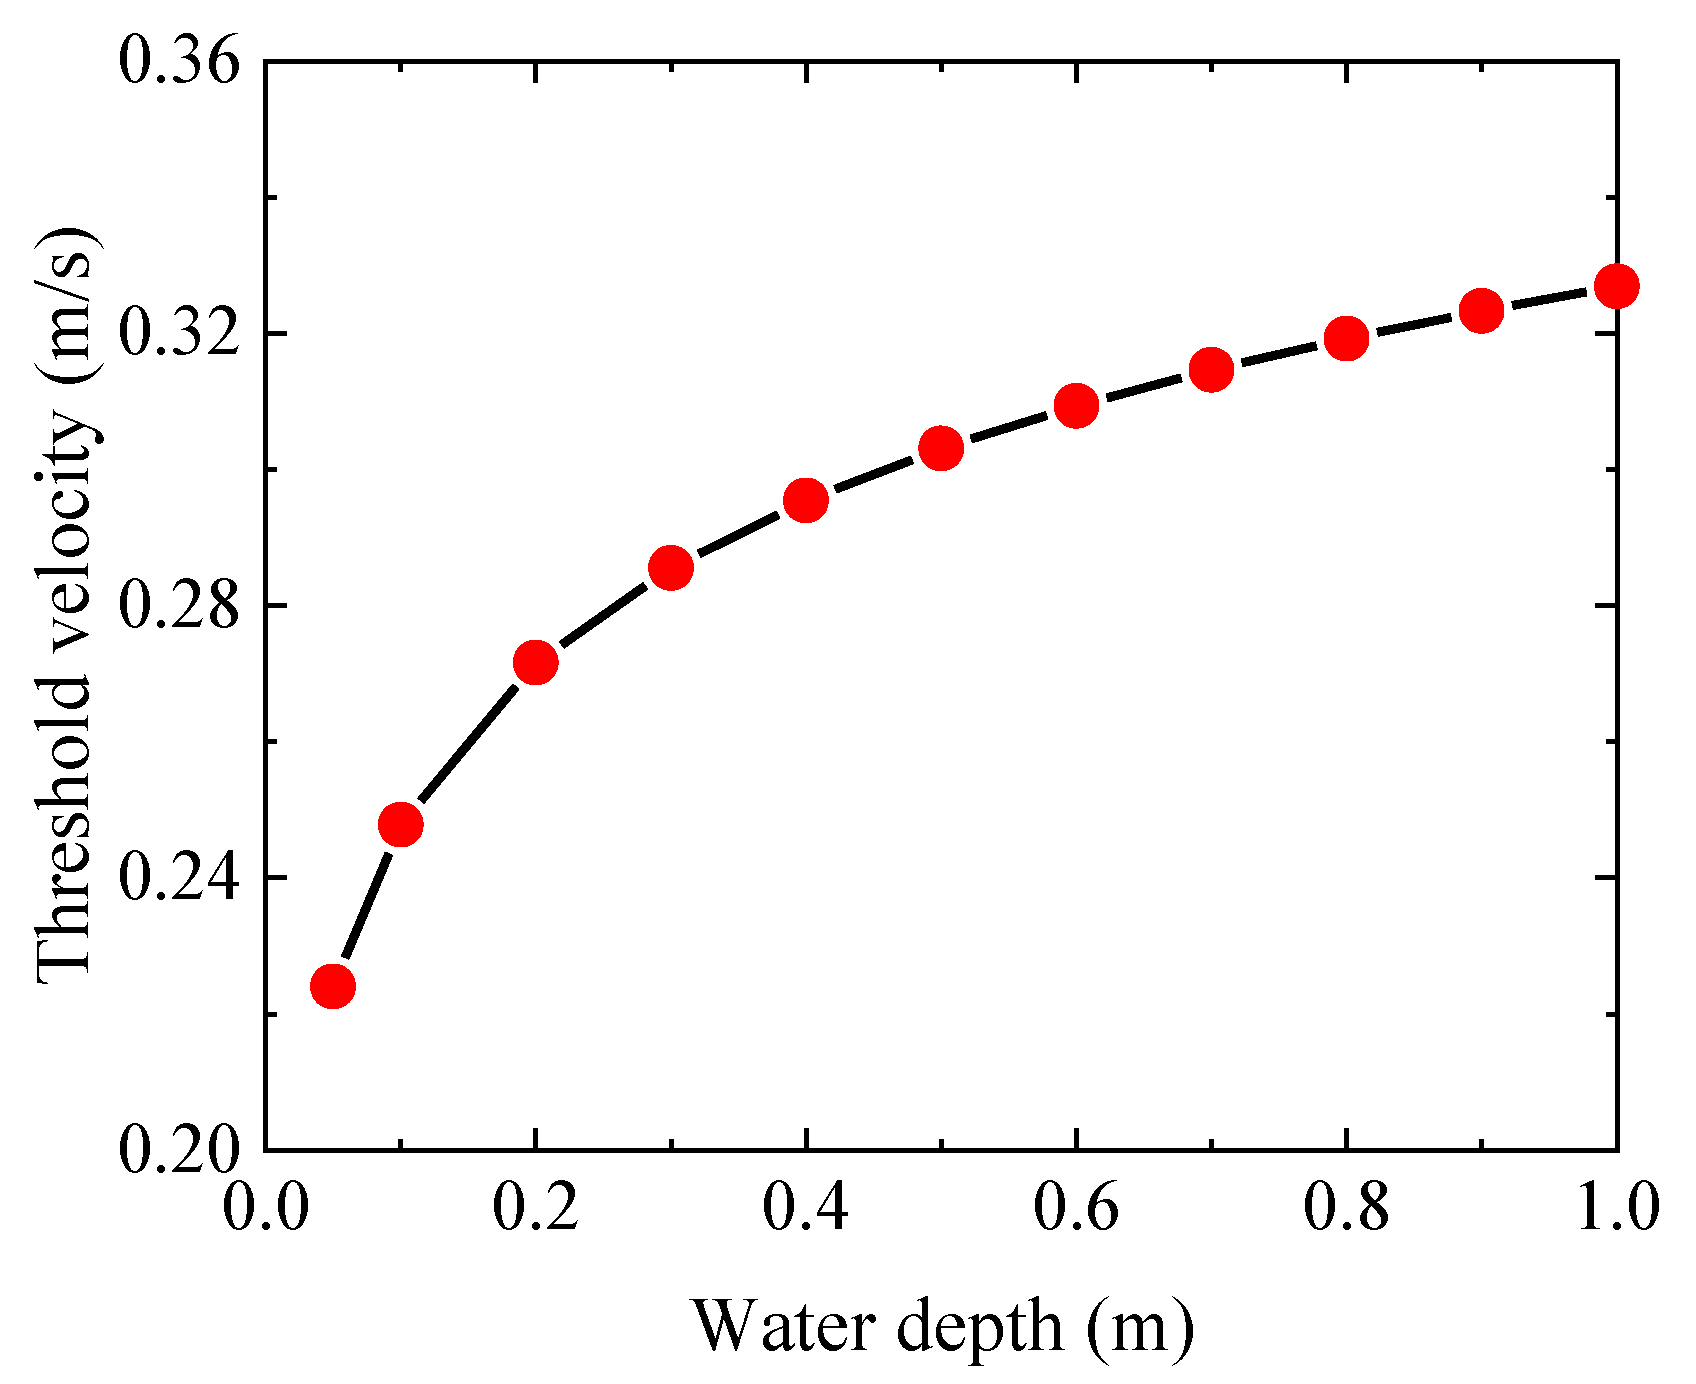
Table 1 summarizes the parameters used in the tests based on the above calculation and the observed sediment start-up phenomena in the experiment. The threshold velocity of sediment at different water depths calculated by the above equations is shown in Figure 5. The threshold velocity of sediment at the water depth of 0.5 m is about 0.303 m/s. Considering that the ripple development effect may affect the scour tests, the test flow velocity is set to be 0.35 m/s, which is only slightly larger than the actual threshold velocity of sediment. The sediment bed was carefully leveled and flattened before the test to ensure that the initial riverbed surface was the same under every working condition. Under such conditions, we observed no ripples in front of the pier model, only ripples behind the pier. In the test, the authors increased the flow velocity incrementally and observed the start-up of sediments. The observed threshold velocity in the test was very close to the threshold velocity calculated by above formula. It can be concluded that this formula is applicable to the sediments used in this paper. According to the skin friction Shields parameter, the tests are all under live-bed conditions. Live-bed scour was also confirmed by the sand ripples observed in the latter tests.
3.2. Calculation of Equilibrium Scour Time
Melville and Chiew [40] considered the temporal development of clear-water local scour depth at cylindrical bridge piers in uniform sand beds and put forward a formula to estimate the time taken for equilibrium scour depth development. Bateni et al. [41] presented a Bayesian neural network technique to predict the equilibrium scour depth around a bridge pier and the time variation of scour depth. Melville et al. [42] has divided the local scour process into three stages: initial stage, main scour stage and equilibrium condition. In order to understand the duration required for the scour test, time scale of scour around a vertical pile of a height the same as the water depth is calculated based on the following empirical formula proposed by Sumer et al. [43]
where S is the scour depth, S0 is the equilibrium scour depth, t is time and T is defined as the time scale of scour. Sumer et al. [43] found that time scale of scour around a vertical slender pile follows
where D is the representative dimension of the vertical pile (diameter for a circular pile or dimension perpendicular to flow for a rectangular cylinder), δ is the boundary layer thickness and T* is the non-dimensional time scale of scour. By using δ = 0.30 m, Equations (5) and (6), the time scale for D = 0.1 m is T = 720. By substituting S(t)/S0 = 0.95 and the above calculated time scales into Equation (4), the time taken for scour reaching 95% of equilibrium scour depth for D = 0.1 m is estimated as t= 36 min.
Yang et al. [44] carried out a study on the evolution of hydrodynamic characteristics with scour holes developing around pile groups, which demonstrates a high scouring rate for the early stage and the scouring phenomenon almost reached equilibrium after 240 min. Zhang et al. [45] established a set of three-dimensional numerical models to investigate the mechanisms of local scour around three adjacent piles with different arrangements under steady currents by as short as 500 s scour time. The total scour testing time of each test is thus set to be 120 min, which is much larger than the calculated approximate equilibrium scour time.
3.3. List of Testing Conditions
For the conditions given in Table 1, a series of experiments was conducted to investigate the effect of anti-scour collar parameters. Table 2 lists all the working conditions carried out in this study. Based on the scour test of a single cylindrical pier without collar, the optimal design of the collar is carried out to achieve the maximum protection efficiency. Three collar design parameters (collar installation height, external diameter and protection range) are considered to design the experimental scheme. According to the results of threshold velocity and approximate equilibrium scour time, a live-bed scour testing scheme was adopted in this test. Under various tests of cylindrical piers with different water depth and flow velocity, the working conditions of 0.35 m/s flow velocity and 0.5 m water depth were selected.
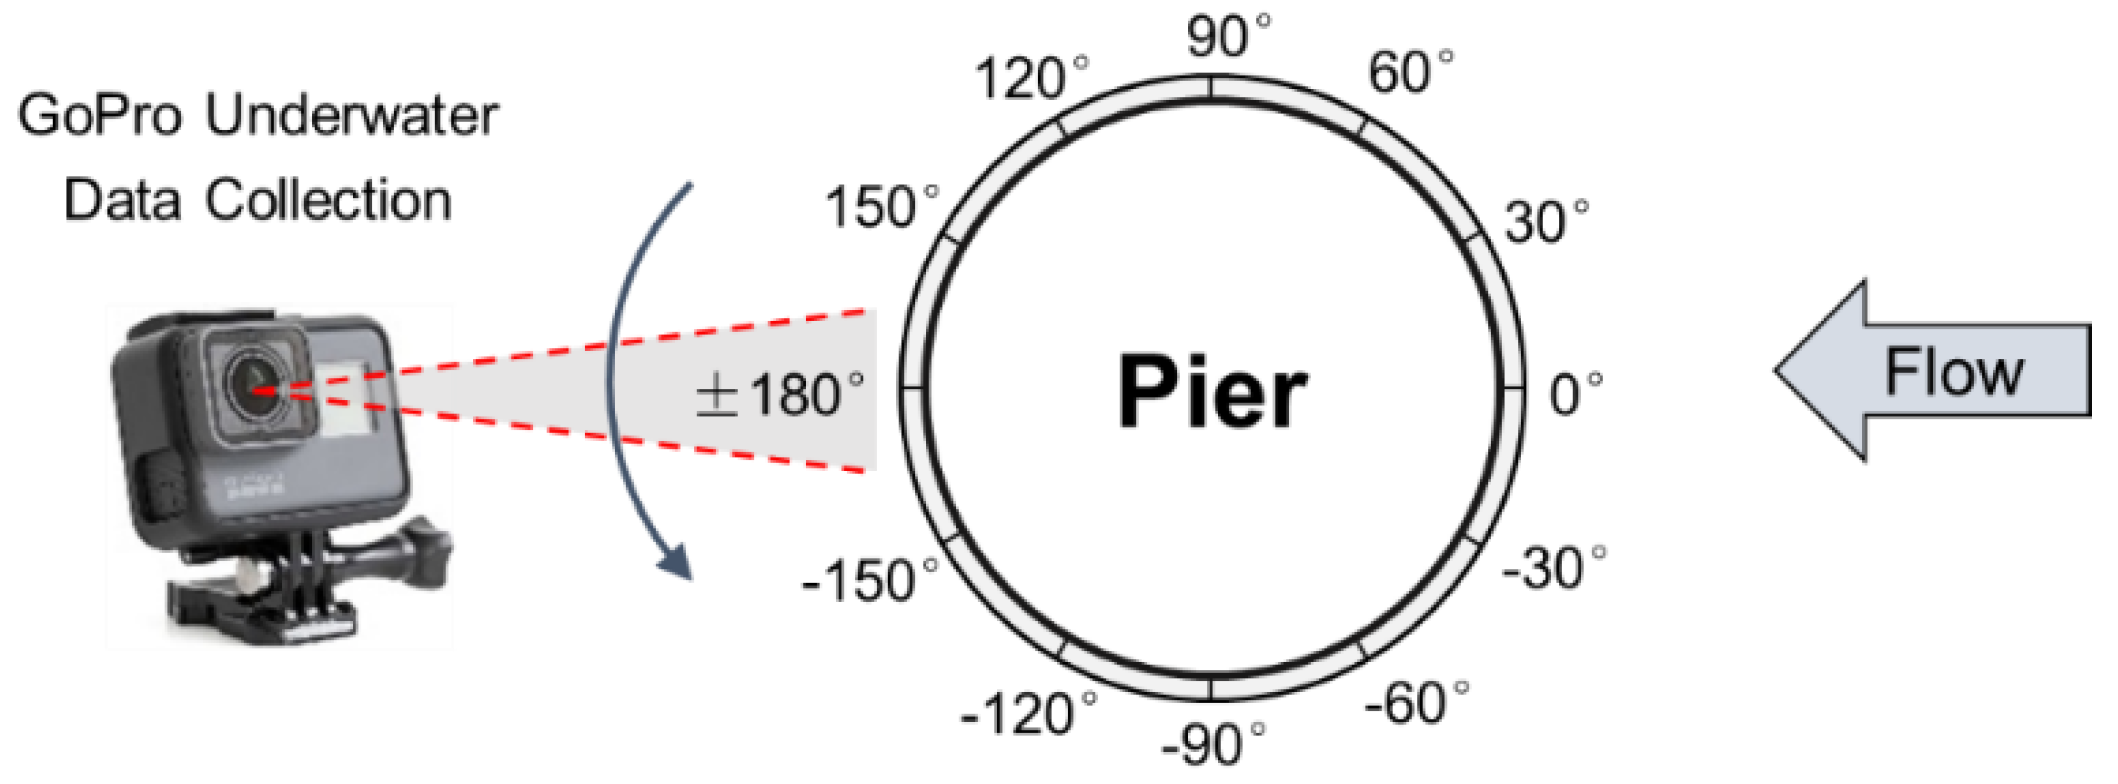
As shown in Figure 6, 12 measuring points were evenly arranged around the pier by 30° to monitor the scour depth and measure the development of the scour hole for different testing cases. In the experiment, a GoPro camera was used for data acquisition of scour depth around the pier model in water, and an ADV velocimeter is used to judge the evenness of the initial riverbed and to measure the length and width of the scour hole. The measured scour width is the distance between the edges of the scour hole on both sides, while the scour length is the distance between the edges of the scour hole upstream and the highest point of the riverbed behind the pier. In the 60 min, the measuring point reading was recorded every 10 min, and then the data was recorded every 30 min.
4. Results and Discussion
The test results show that the maximum scouring depth can be replaced by the maximum value of the measuring points reading. A local scour test of the cylindrical pier model without an anti-scour collar (the unprotected case) was conducted first to obtain the reference scour characteristics for the pier without any protection. The rest of the testing cases of the pier model with different anti-scour collar designs were then carried out and compared with the unprotected case to show the scour protection efficiency (factor β in percent).
4.1. Characteristics of Local Scour for a Cylindrical Pier without Protection
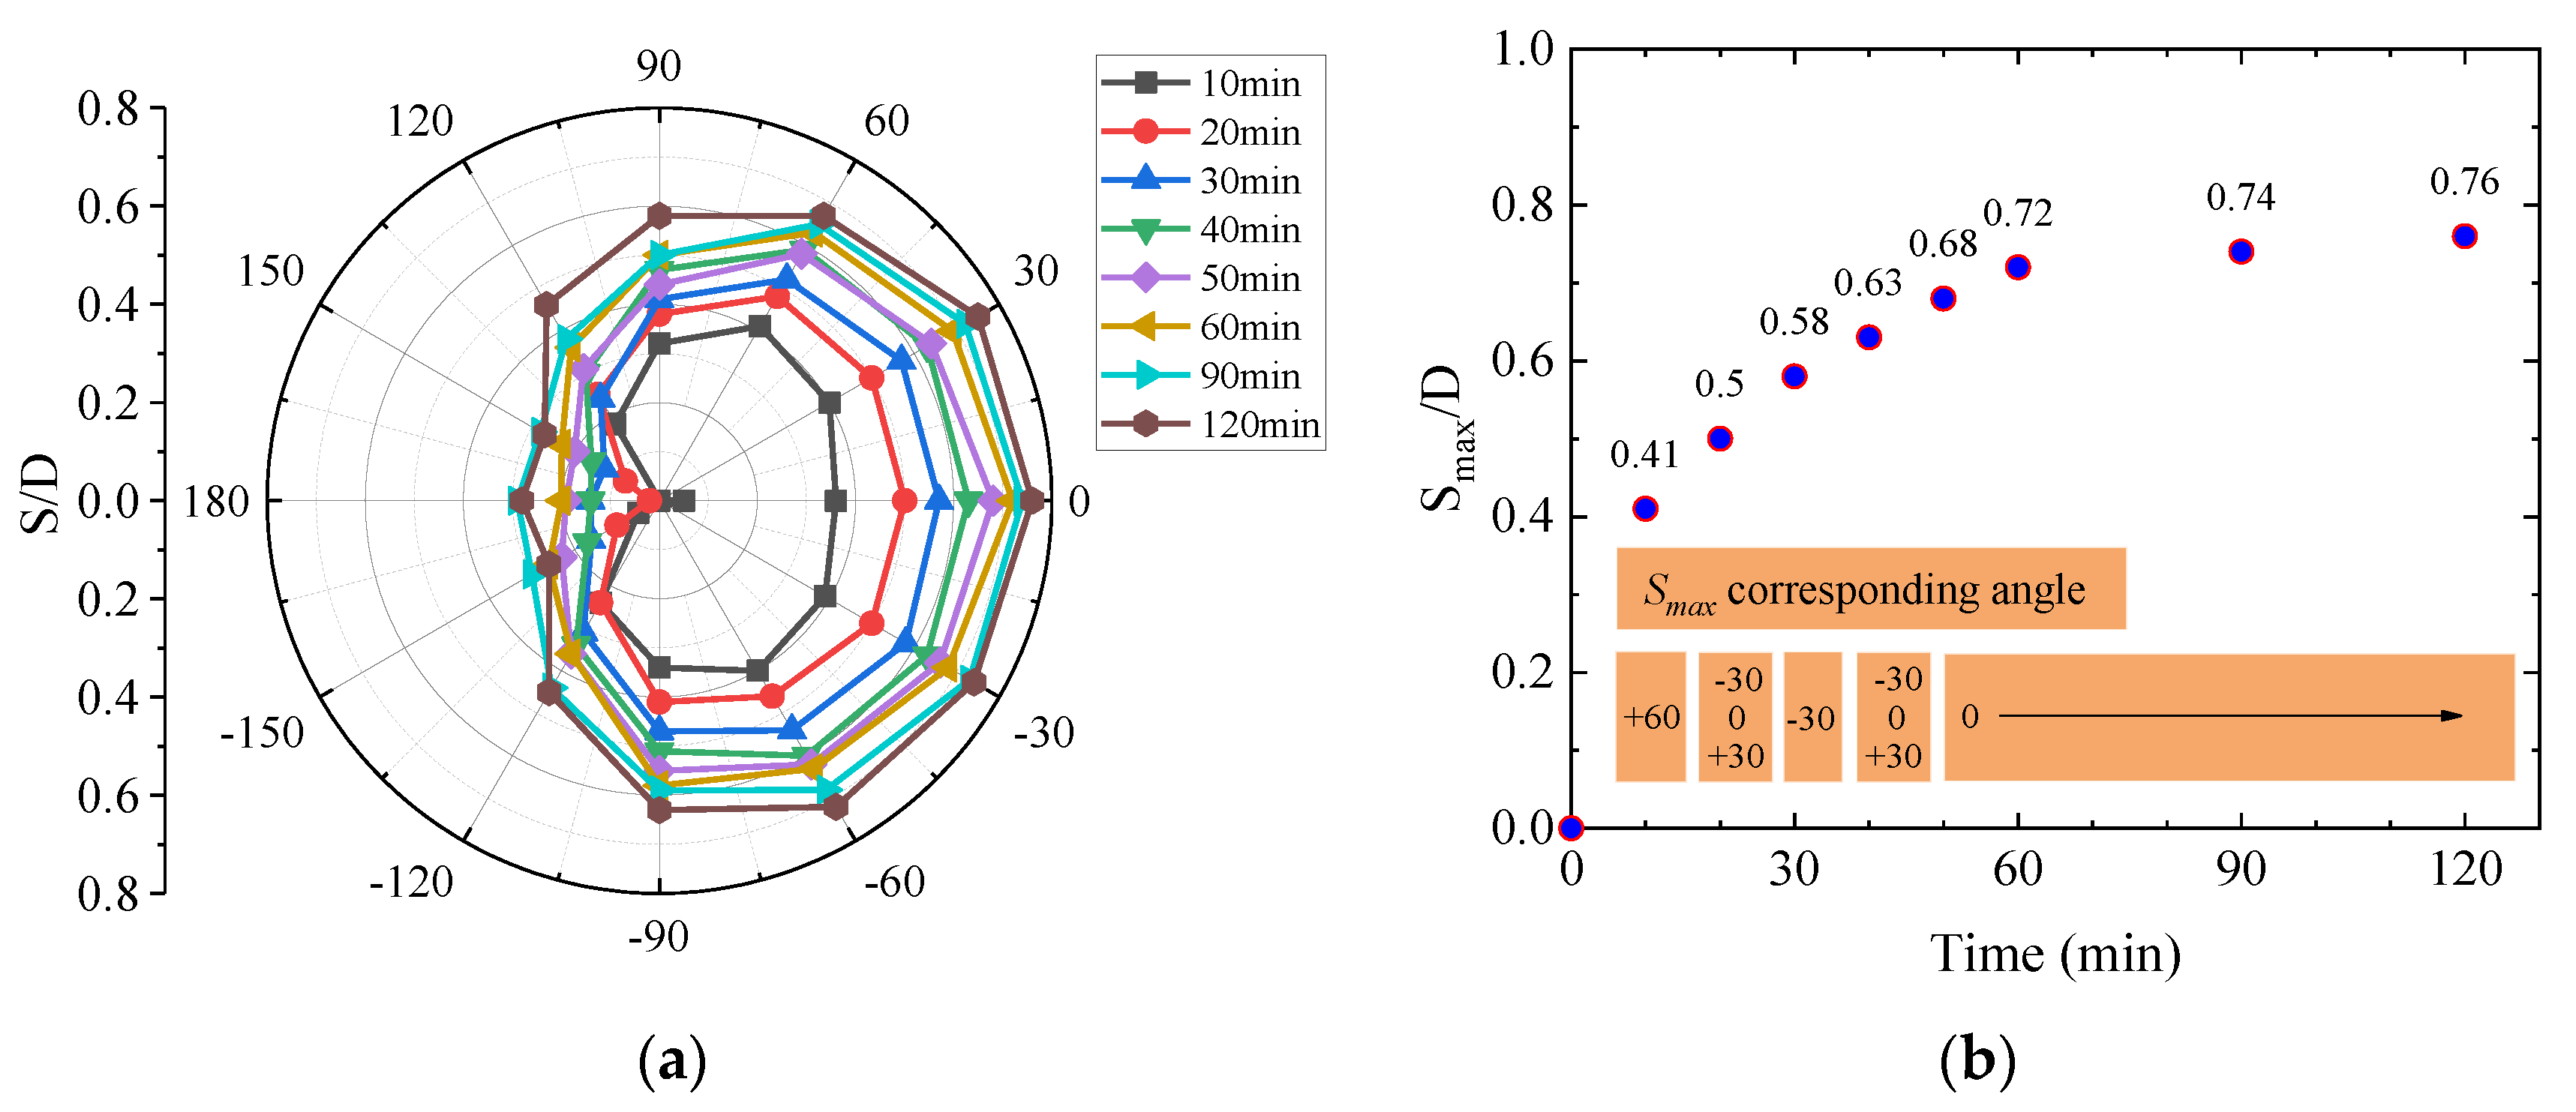
In order to eliminate the effect of geometry of the pier on the results [46], the dimensionless scour depth S/D measured at twelve measuring points under different scouring times are plotted in Figure 7a, respectively. The shape of the scour hole around the pier model is symmetric around the current flow direction. Because the flow velocity and bed shear stress behind the pier were smaller than that in front of the pier due to the shadowing effect of the pier, the scour depth is decreasing from the upstream (0°) to the downstream pier side (180°). The scour hole developed continuously with the testing time. At 10 min of scour, the maximum scour depth occurred at the 60° side of the pier, while the minimum scour depth appeared at the 180° position, which is just in the back of the pier. After 10 min, the position of the measured maximum scour depth gradually moved from the side to the front of the pier, and the final maximum scour depth at 120 min occurred at the front of the pier.
The maximum dimensionless scour depth S/D around the pier as a function of scour testing time is given in Figure 7b. In the first 30 min, scour occurred quickly; the maximum scour depth and the length and width of the scour hole increased rapidly. The growth rate of the maximum scour depth slowed down with the increase of testing time and reached close to zero in the approximate equilibrium condition. Similar phenomena have also been reported in the references [31,43]. The maximum dimensionless scour depth S of the sediment hole around the pier is 0.58 at 30 min and increases to 0.72 at 60 min, which is more than 90% of the scour depth at 120 min. Although scour still occurred in the later period, the growth of both scour depth and hole’s range are very small. The minimum scour depth occurred at 150° at 120 min. As the photos of the scour hole at 120 min shown in Figure 8, the minimum scour depth is approximately 30% of the maximum scour depth of the final scour hole. According to the development of scour depth as a function of the experimental time for all working conditions, although the scour depth will still increase after 120 min in the tests, the increase of depth is very slight and the increasing rate is significantly slower than that of the first 60 min, which can be treated as the time to approximate equilibrium condition.
The maximum bed shear stress and the maximum scour depth appeared in front of the upstream side of the pier [40,43]. Due to the blocking effect of the pier, turbulent flow is generated around the pier and accelerated the development of scour in front of the pier. They all found that the maximum scour depth occurred in the upstream front of the cylindrical pier.
4.2. Effect of Collar Installation Height
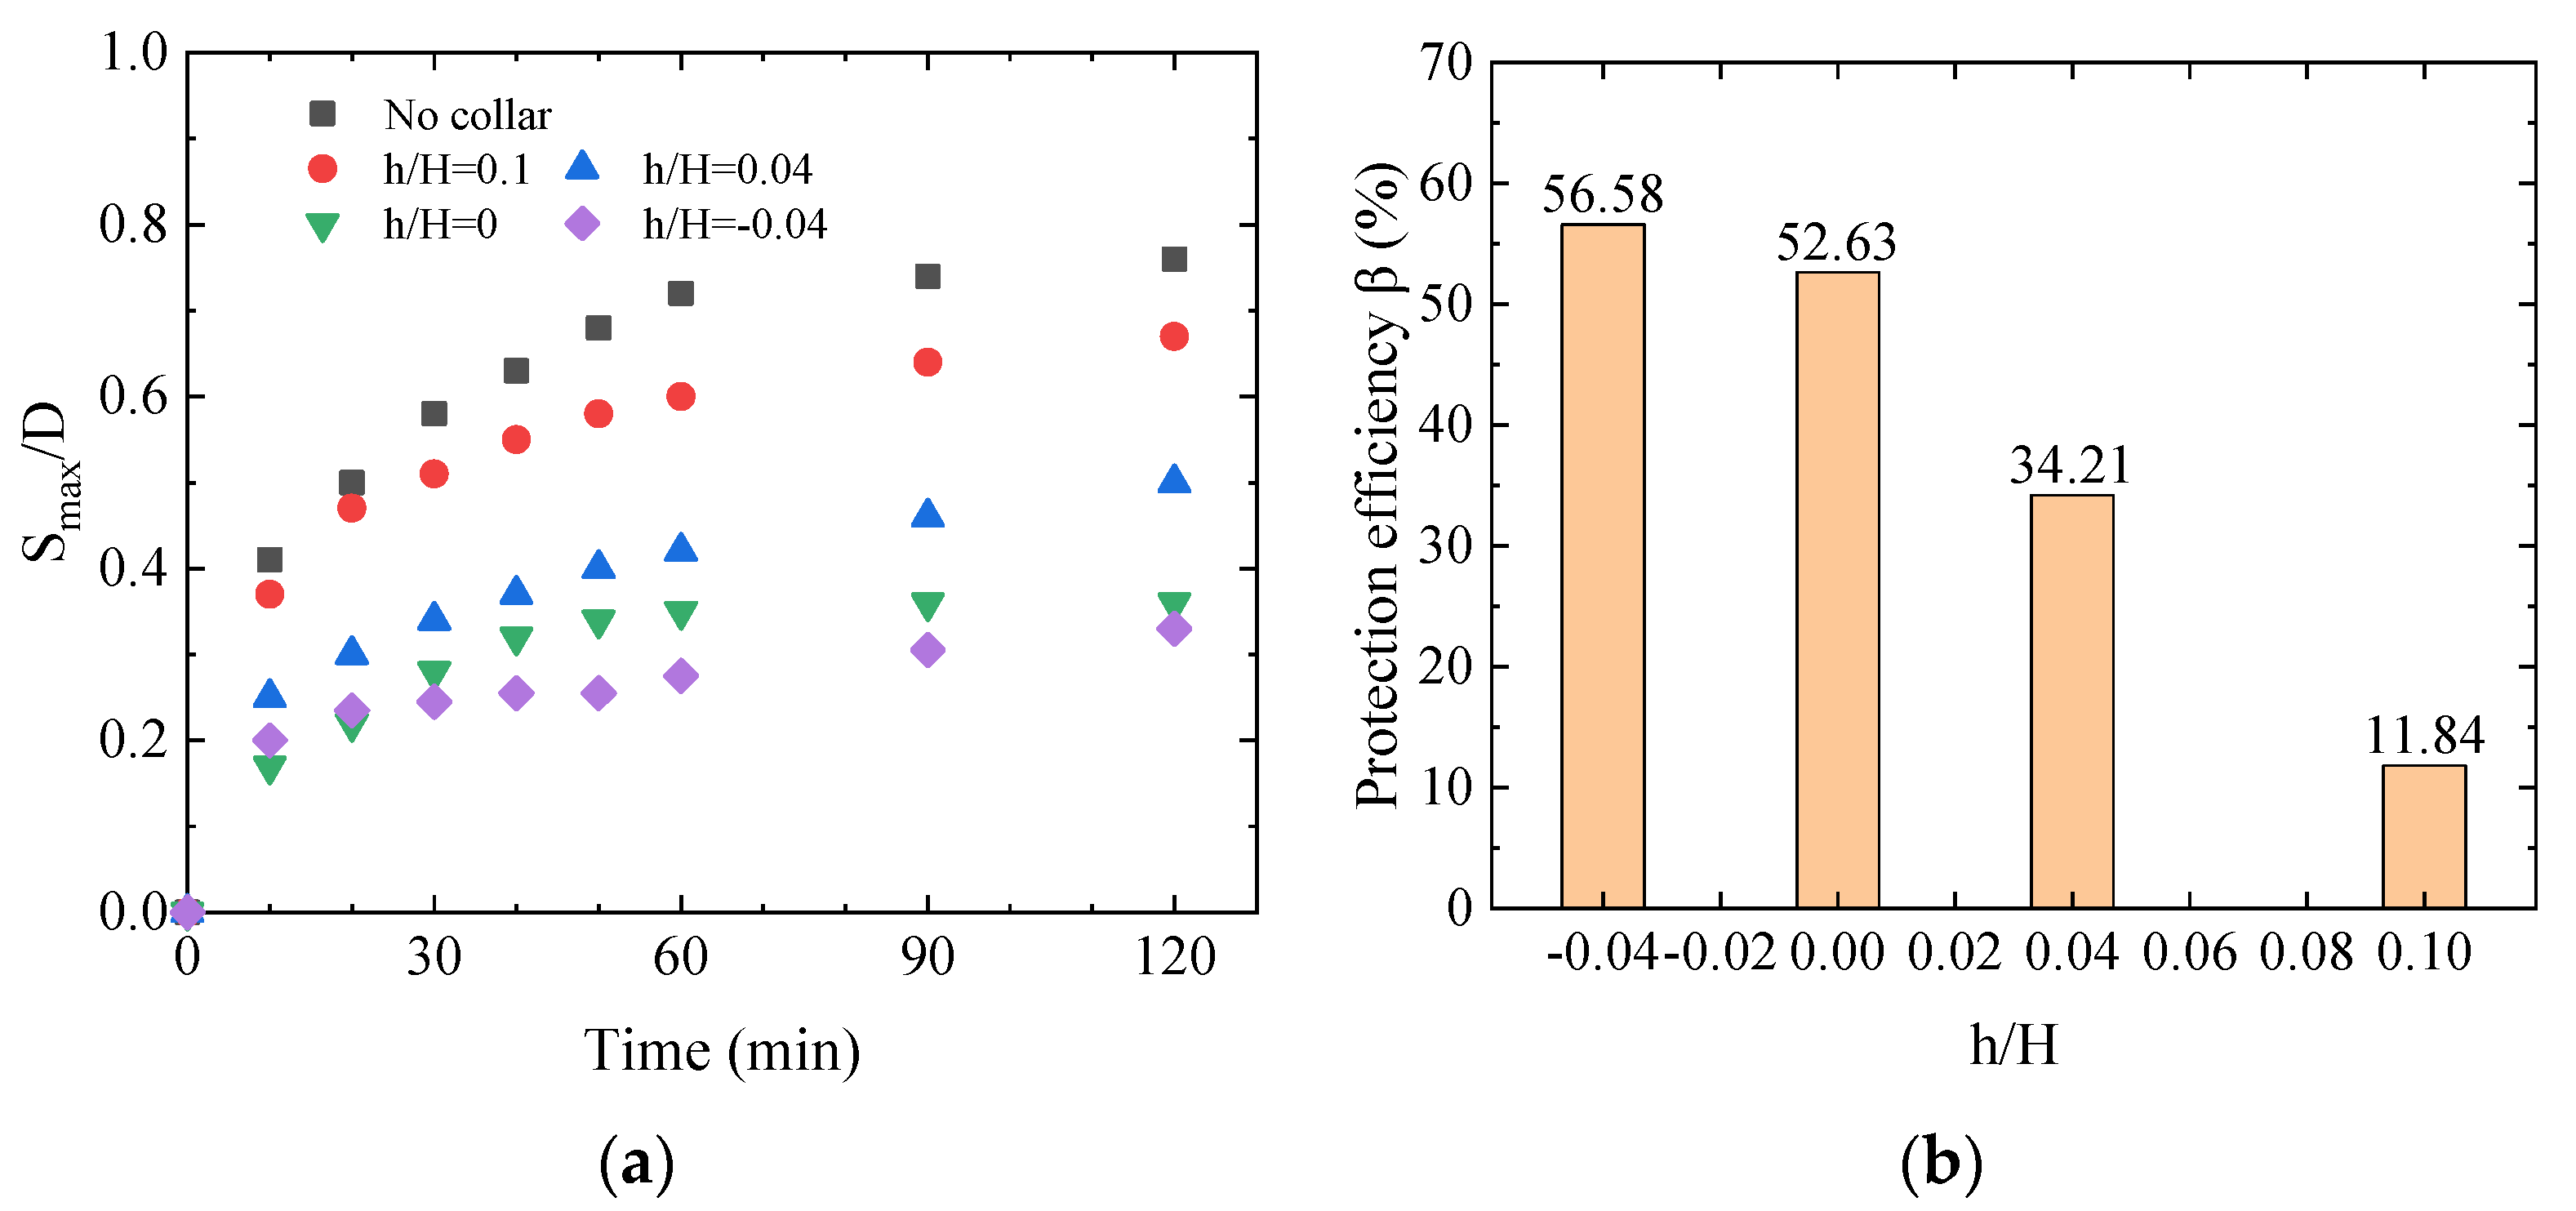
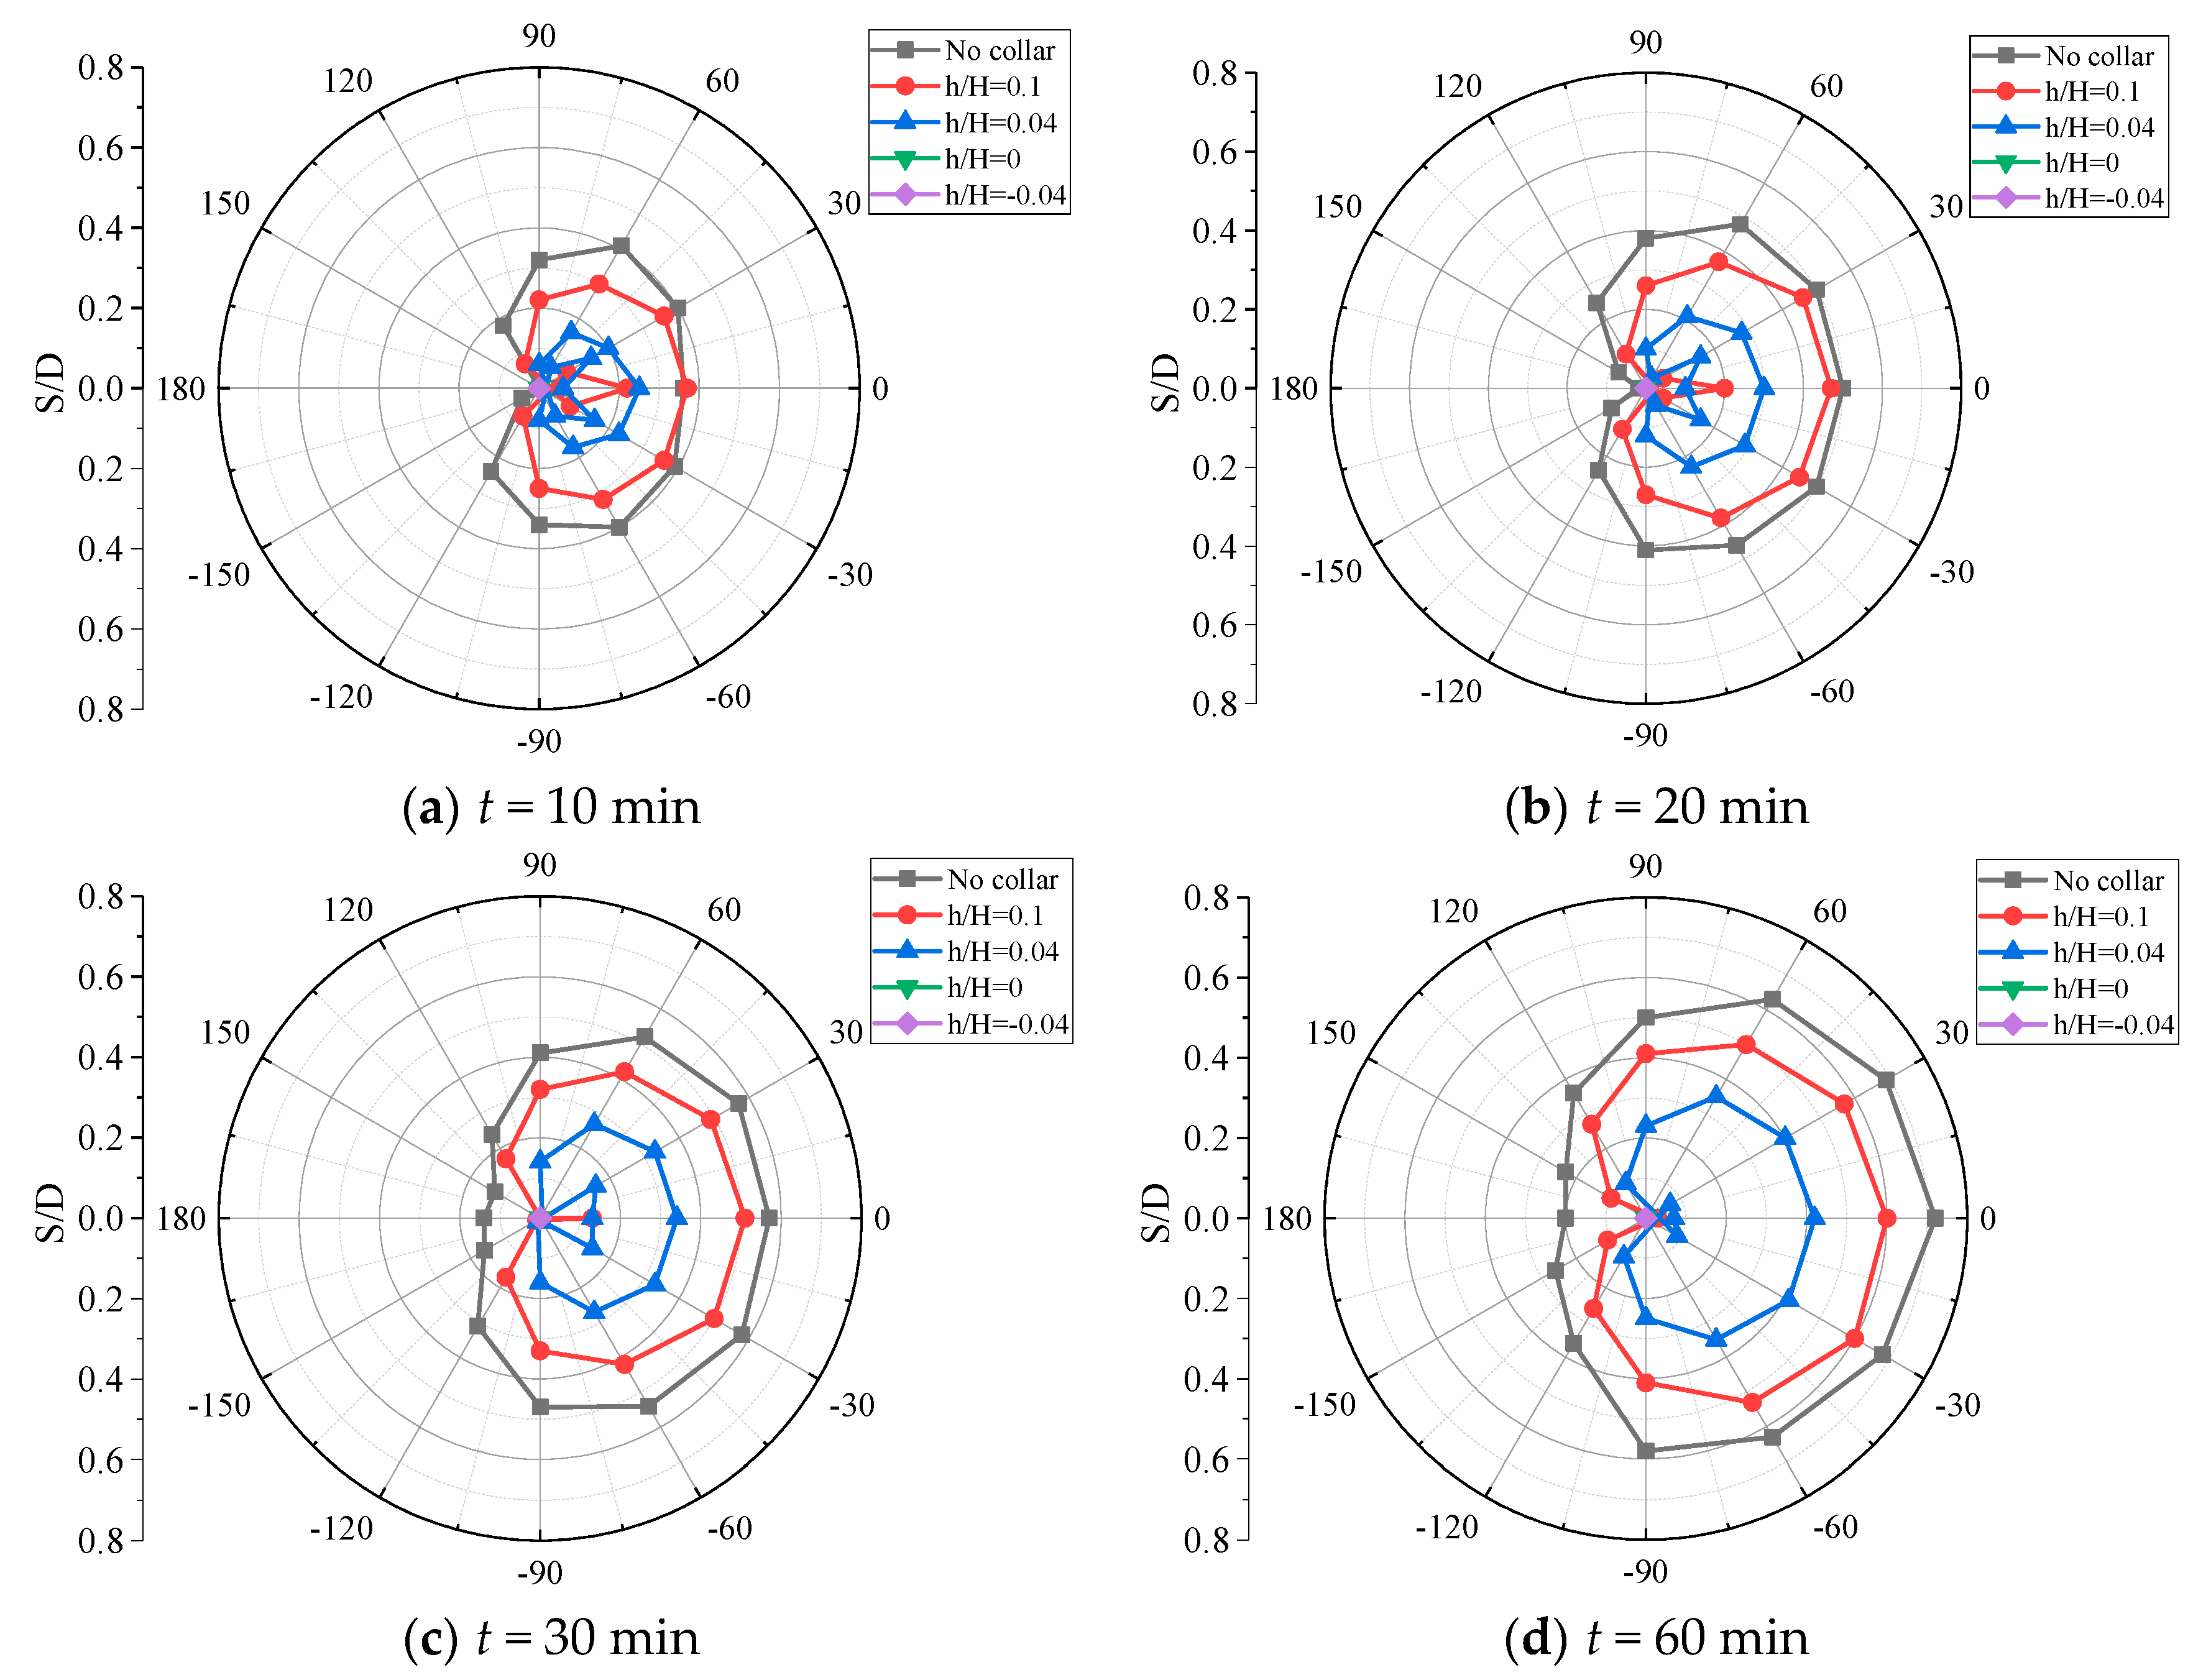
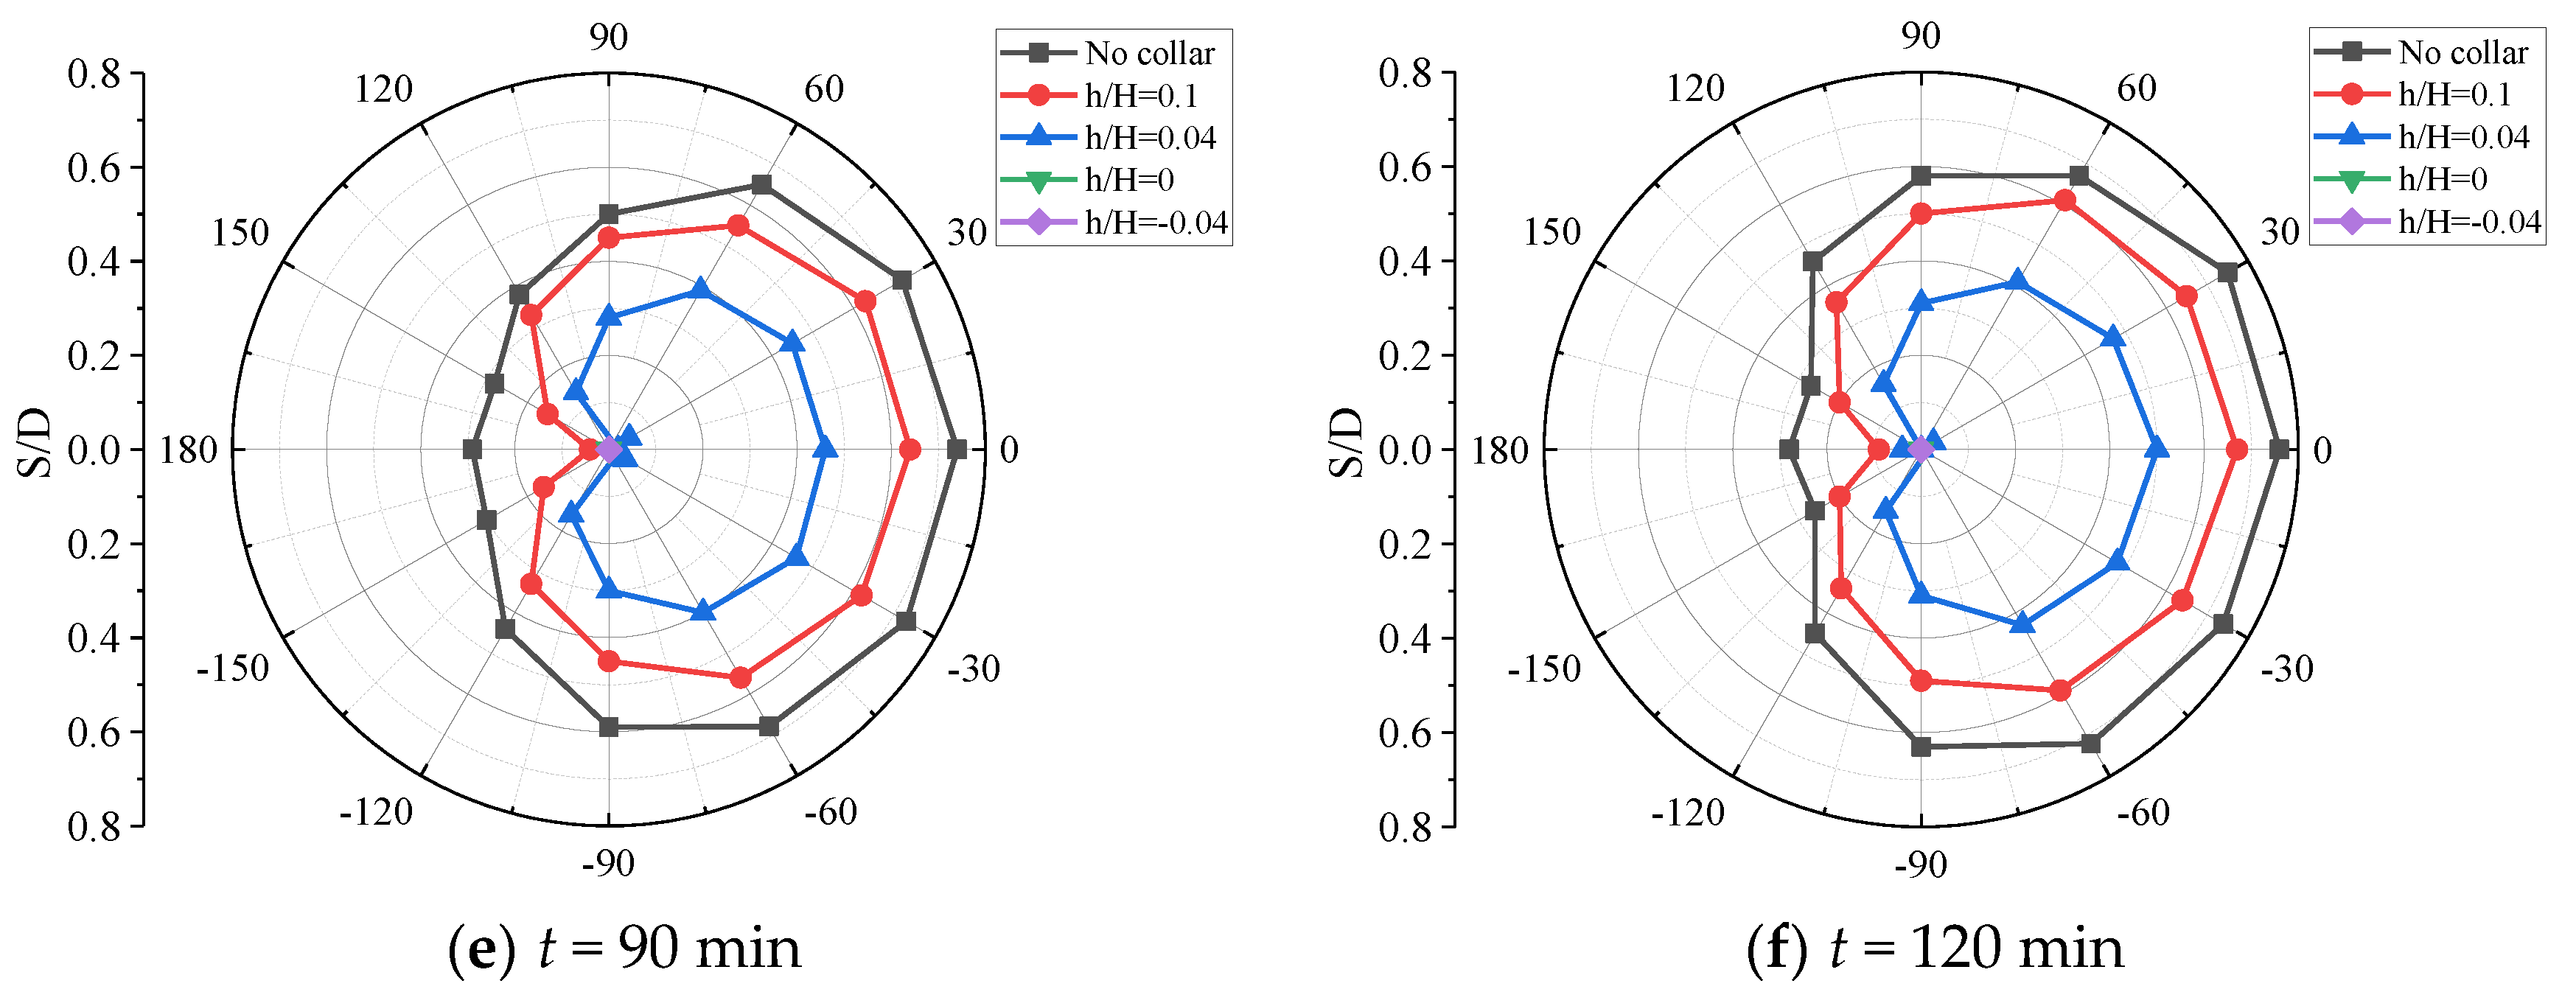
Testing of Cases 2 to 5 was conducted to investigate the influence of collar installation height on the scour protection effect. In these cases, the external diameter W/D and protection angle a of the anti-scour collar equaled 2.5 and 360°, respectively. The installation height of the anti-scour collar h/H was set to be 0.1, 0.04, 0 and −0.04 for Case 2 to 5, respectively. The negative height indicates that the collar was located under the riverbed. The development of maximum scour depth Smax/D at different collar installation heights is shown in Figure 9a. The anti-scour collar reduced the local scour depth and had a protective effect on the cylindrical pier regardless of the installation height. The results of scour depth as a function of collar installation height agree with the experimental results of Chiew [24] and Ettema [30].
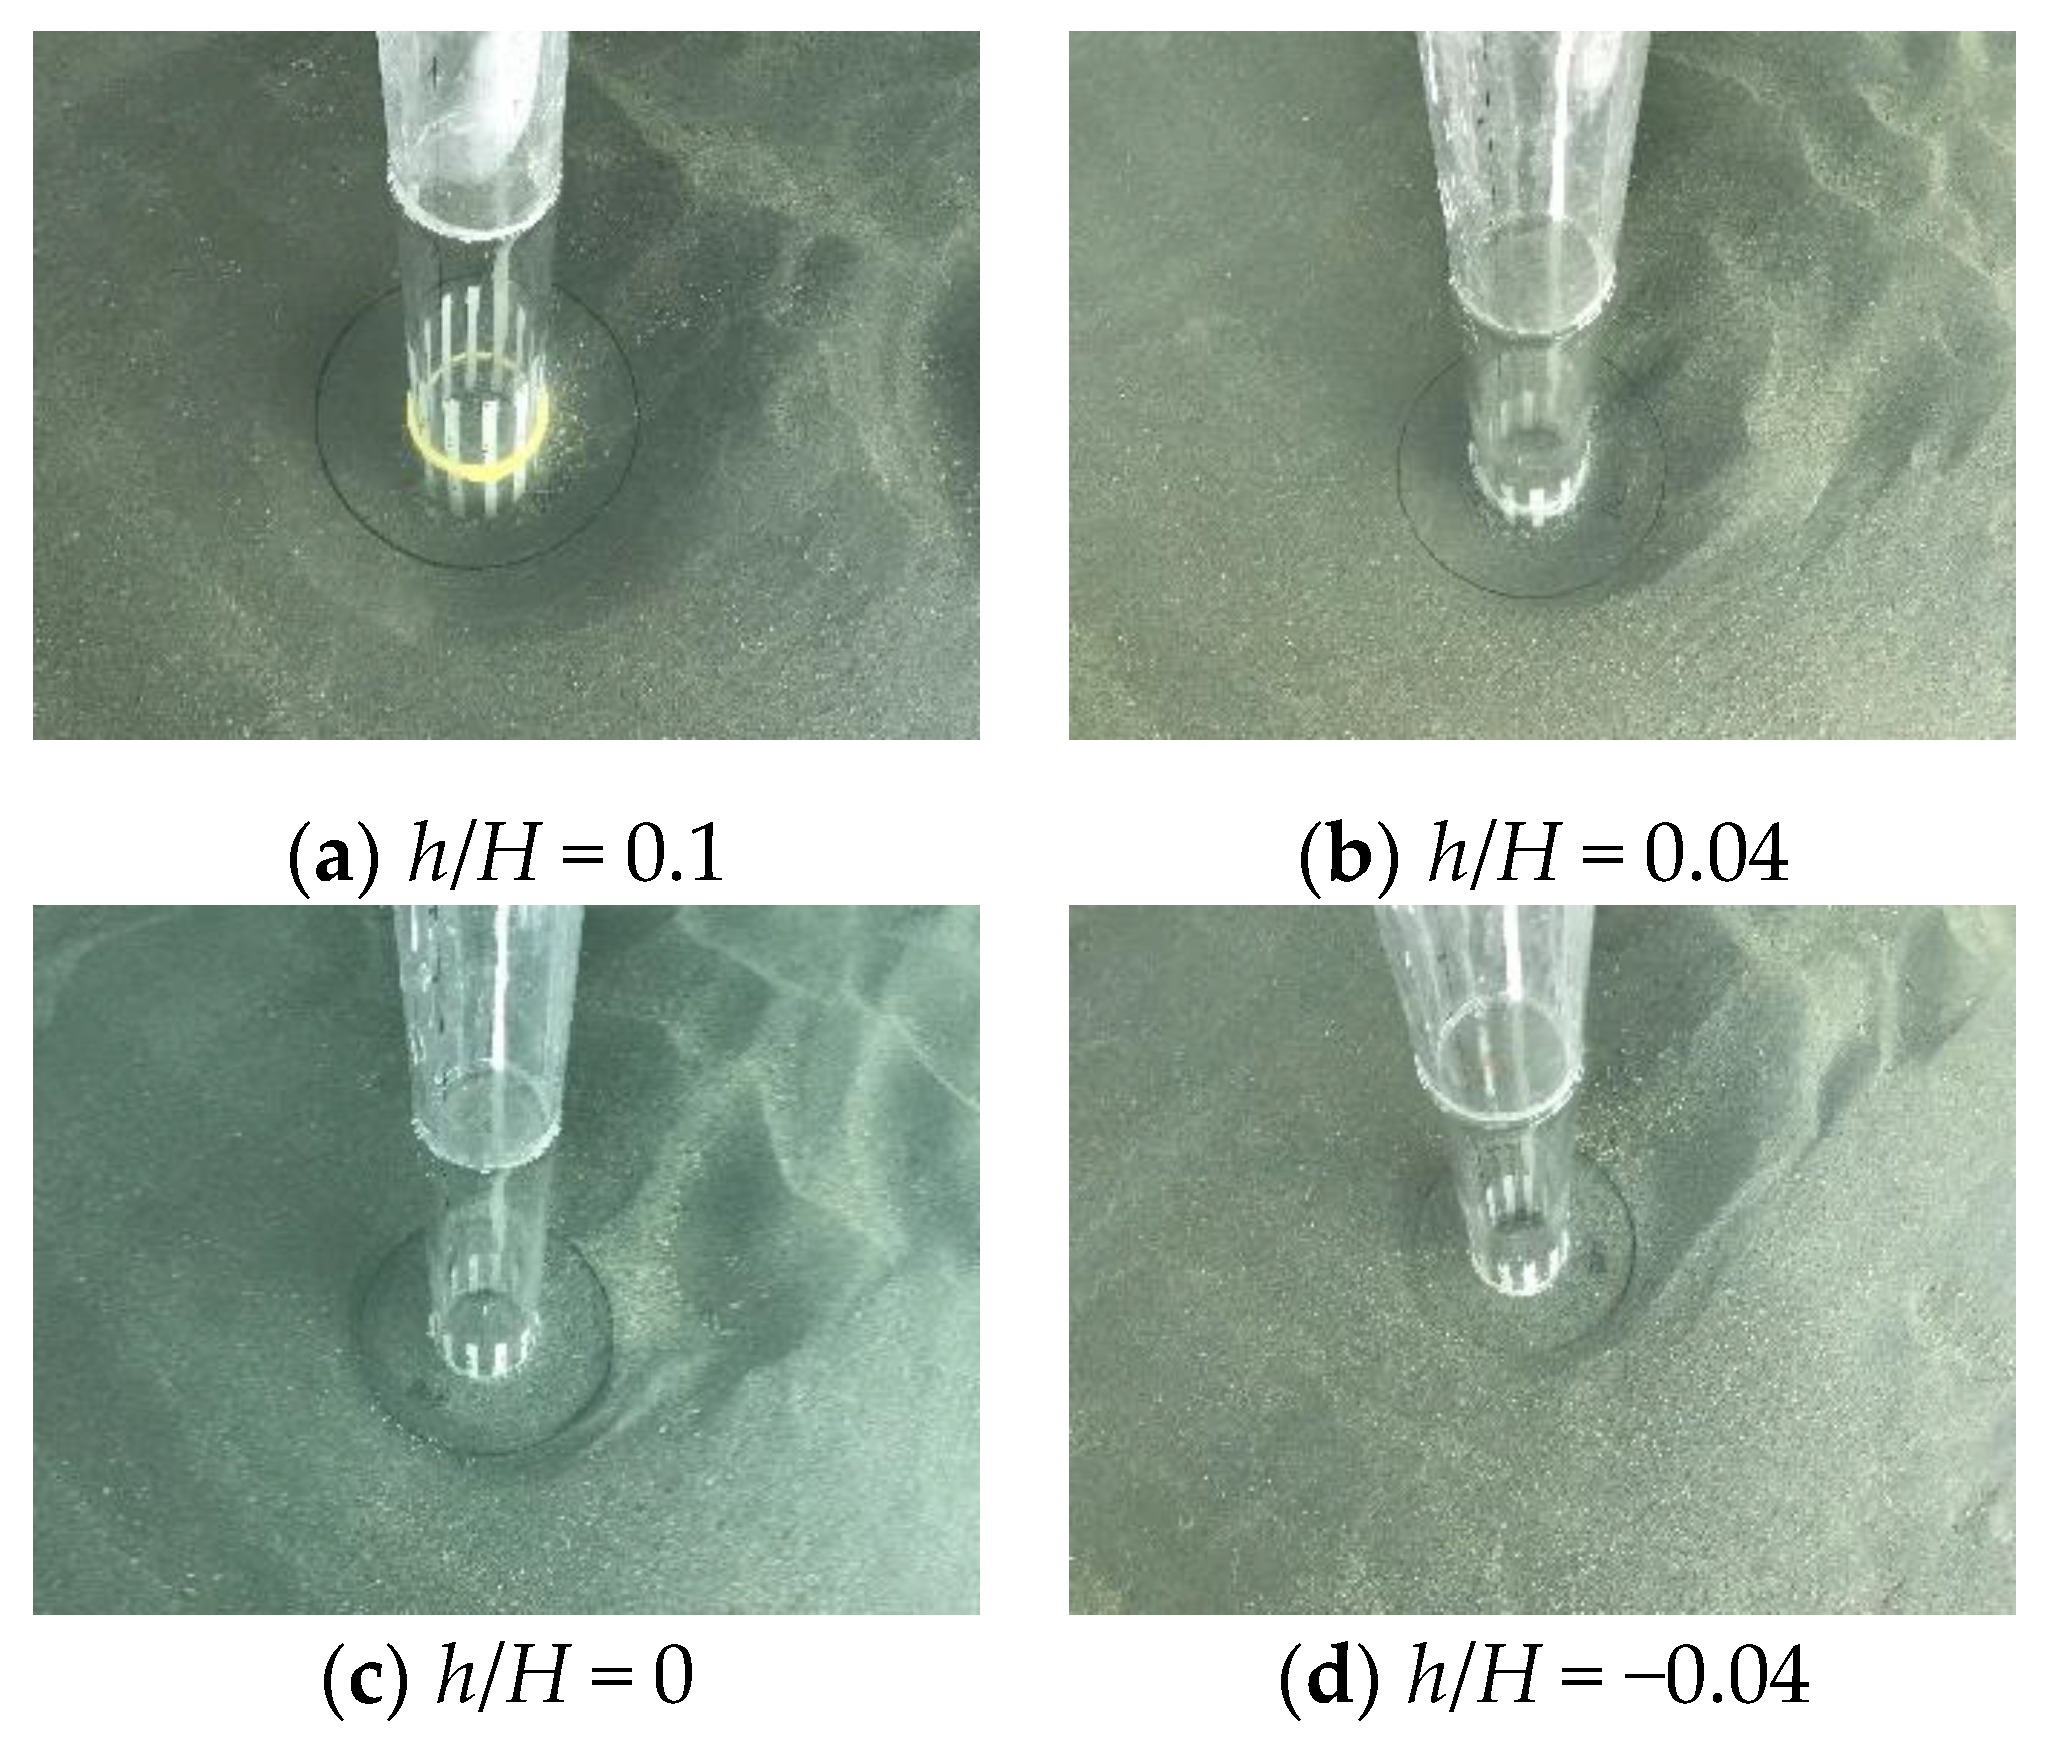
In order to assess the efficiency of the collar, we define a protection efficiency factor β = (St,max − Si)/St,max, where St,max is the maximum scour depth of the unprotected case in 120 min, Si is the maximum scour depth of Case i in 120 min. The larger the factor β is, the better the protective effect is. The protection efficiency factor β versus the installation height is given in Figure 9b. The photos of scour holes for Case 2 to 5 at t = 120 min are shown in Figure 10. The development of scour depth around the pier model as a function of collar installation height is illustrated in Figure 11.
When the collar was located above riverbed, the closer the collar was to the riverbed, the better the protective effect. The protective effect is increased with the decrease of the installation height for all the measuring points around the pier. The maximum scour depth occurred at the 0° point, which located in front of the pier. The location of the maximum scour is the same to the model without an anti-scour collar.
When the anti-scour collar was located at the riverbed surface (h/H = 0), there was not any scour of sediment found at all twelve measuring points in the first 120 min testing. The anti-scour collar protected the sediment under the collar from being washed away, but the sediment at the downstream edge of the collar was washed away. Although the scour hole was developed to the sediment under the collar with the increase of scour testing time after 120 min, the maximum scour depth always occurred at two side points outside the collar behind the pier.
When the anti-scour collar was embedded into the riverbed (h/H = −0.04), the sediment above the collar was quickly removed away in the beginning of the test. The maximum scour depth equaled to the value of h. With the increase of testing time, the maximum scour depth occurred at two side points outside the collar behind the pier, which was similar to that of the case h/H = 0. Therefore, the maximum scour depth of h/H = −0.04 condition at the beginning stage was larger, and then was smaller than that of h/H = 0. According to the comparison of final scour depth, the case with h/H = −0.04 has the best protective effect. Moreover, there was almost no scour around the collar edge except that the sediment on the upper part of collar was washed out at the beginning, when the anti-scour collar was embedded into the riverbed.
It should be noted that the anti-scour collar cannot be embedded too deep. Otherwise all the sediment above the collar will be removed. Because of the existence of general scour and natural evolution scour, it is suggested to install the anti-scour collar at the general scour line to prevent local scour as much as possible.
4.3. Effect of Collar External Diameter
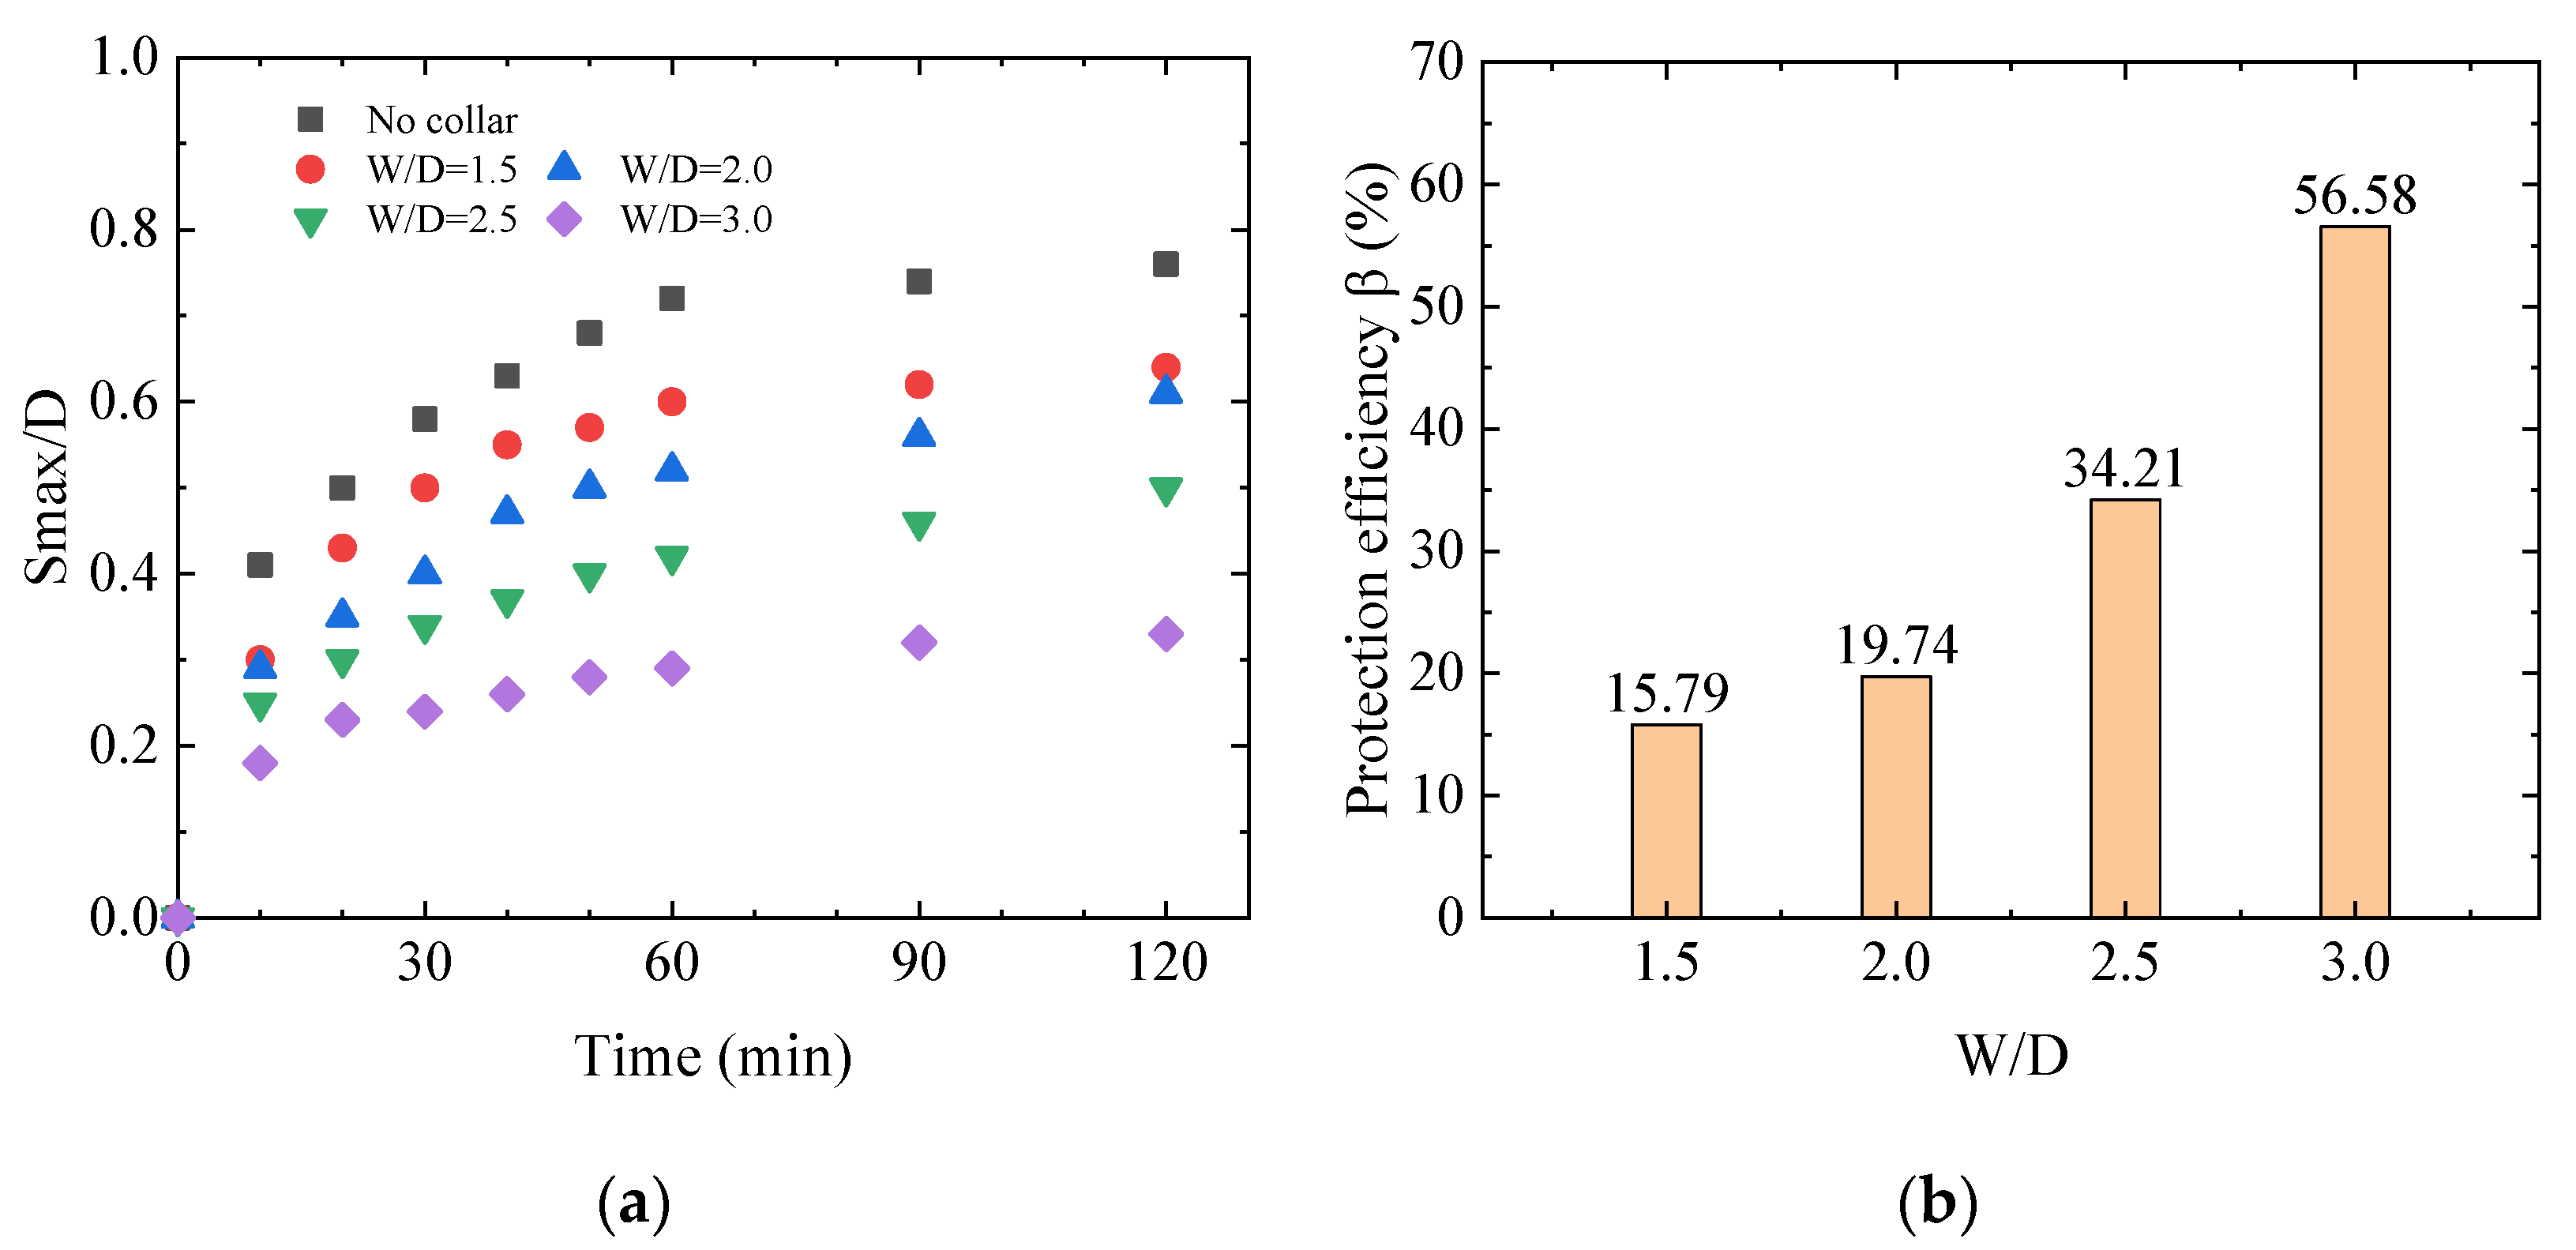
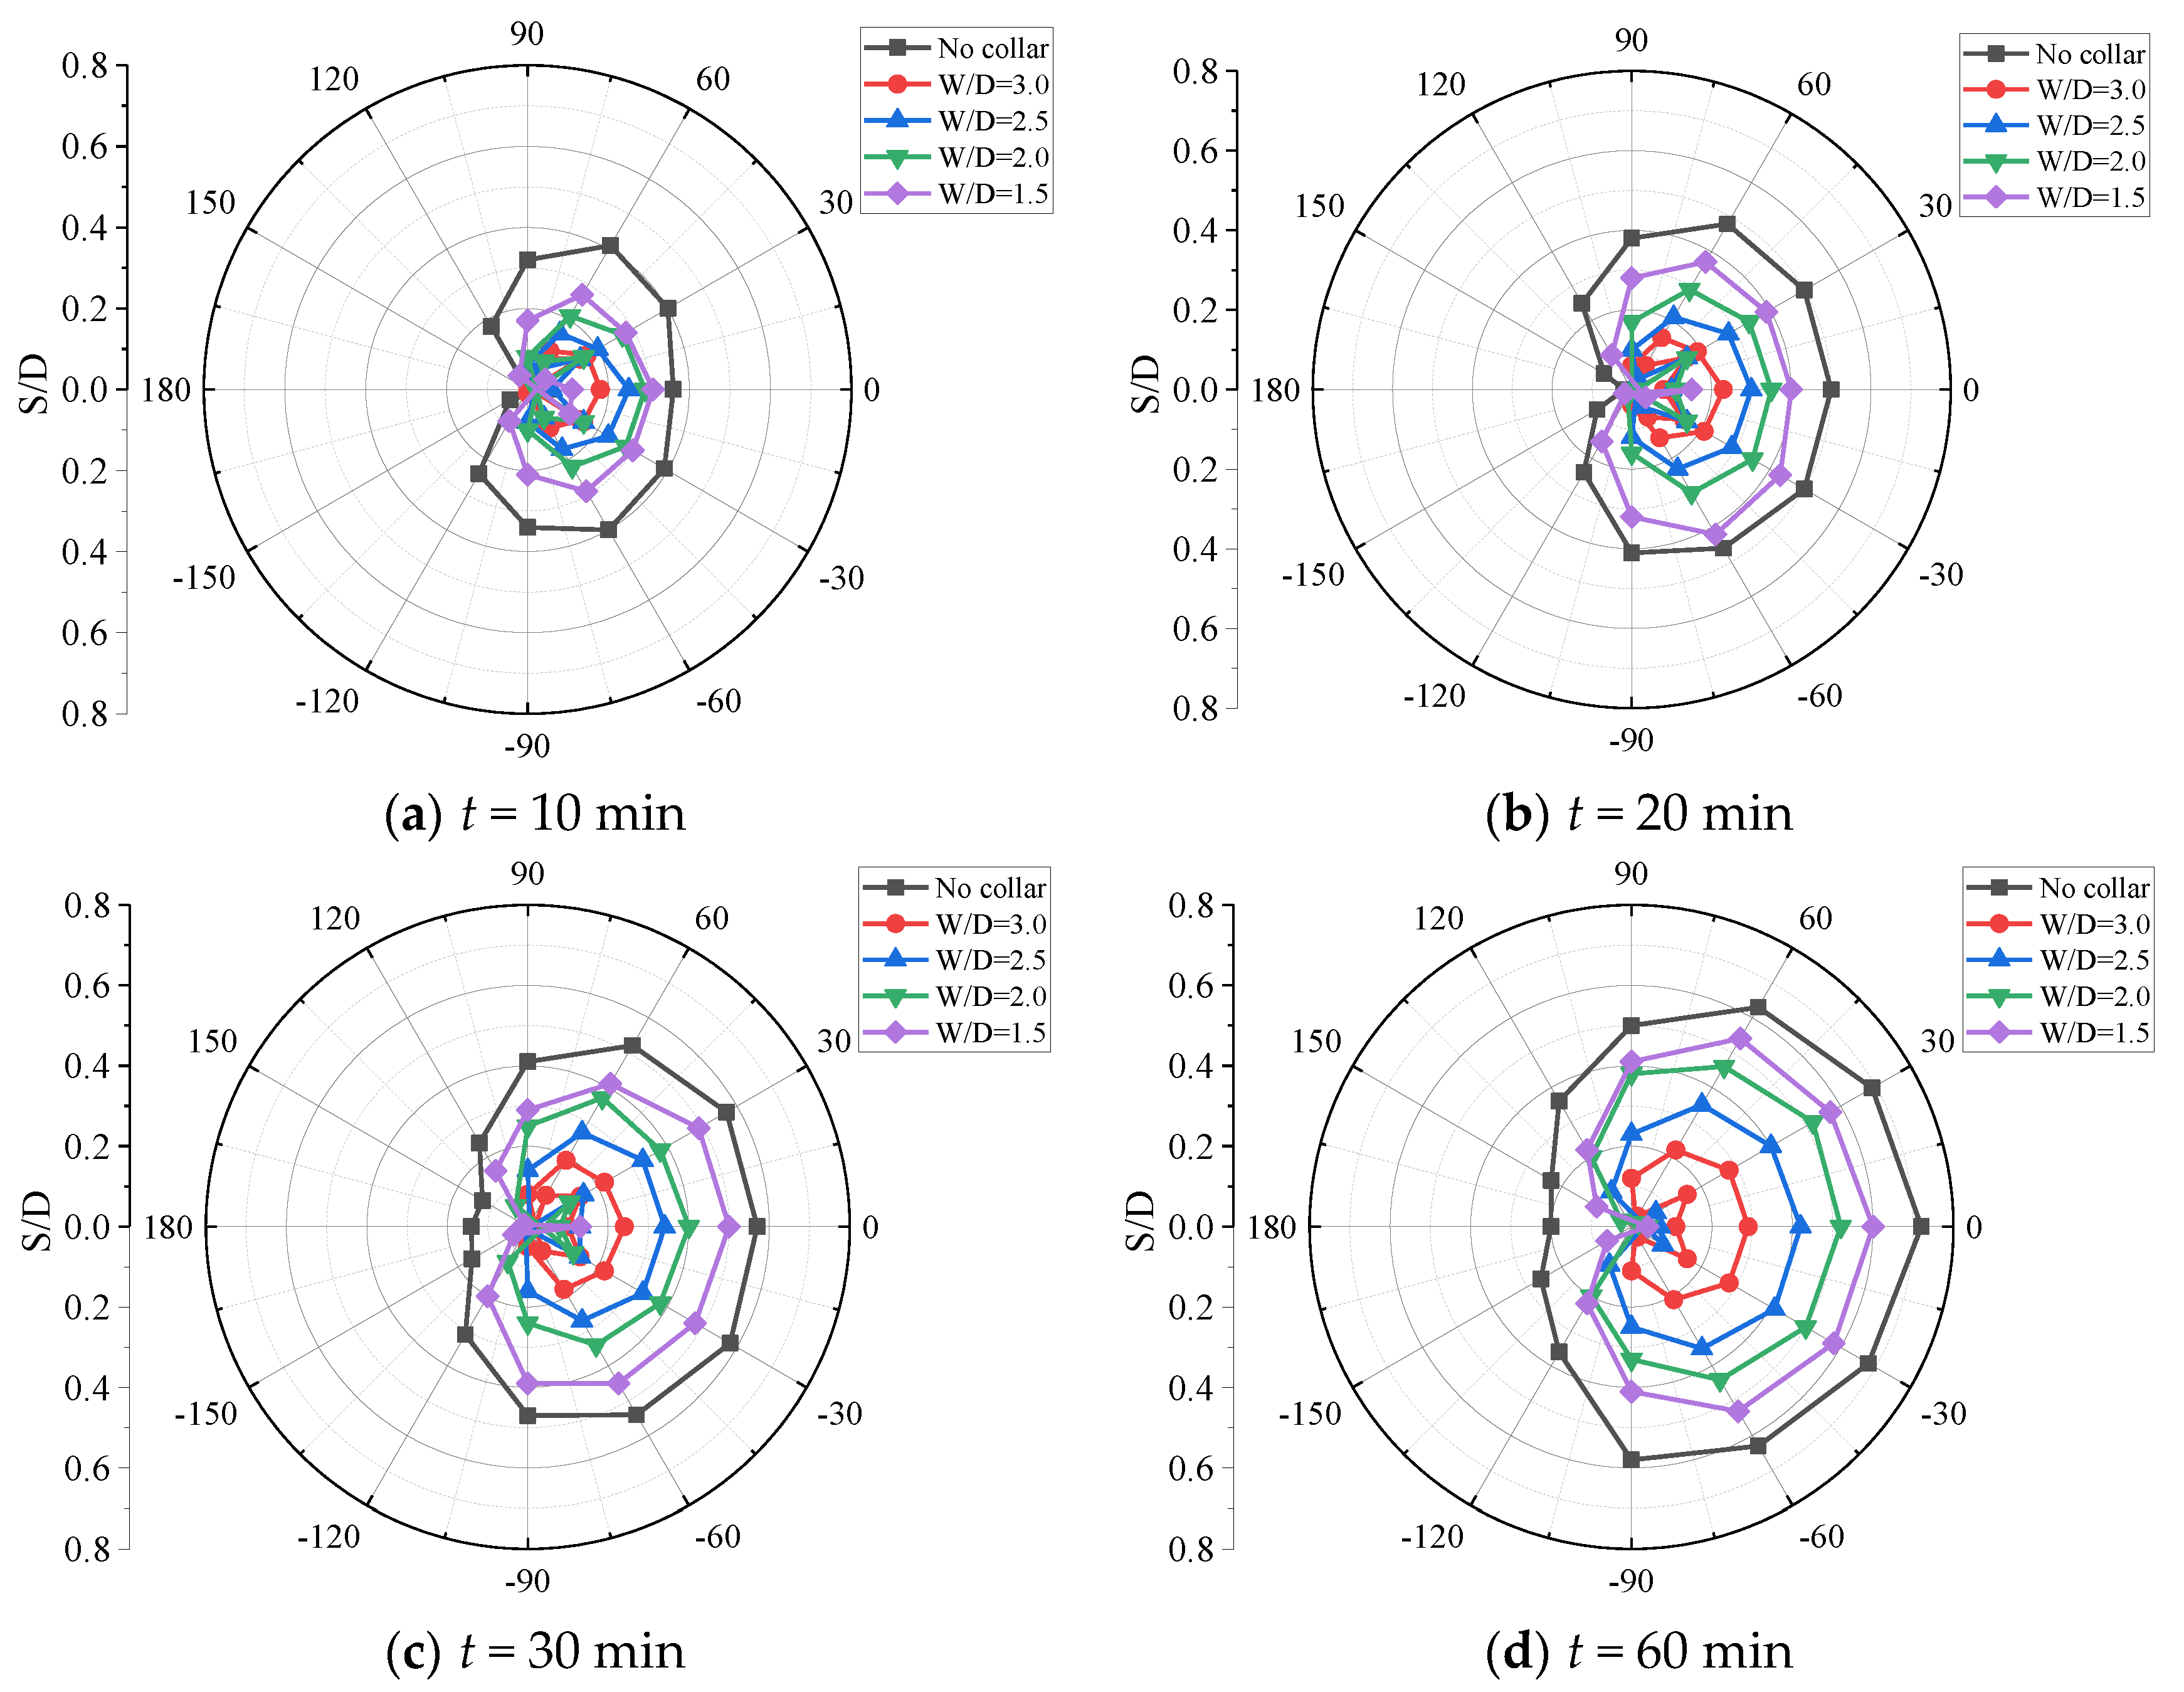
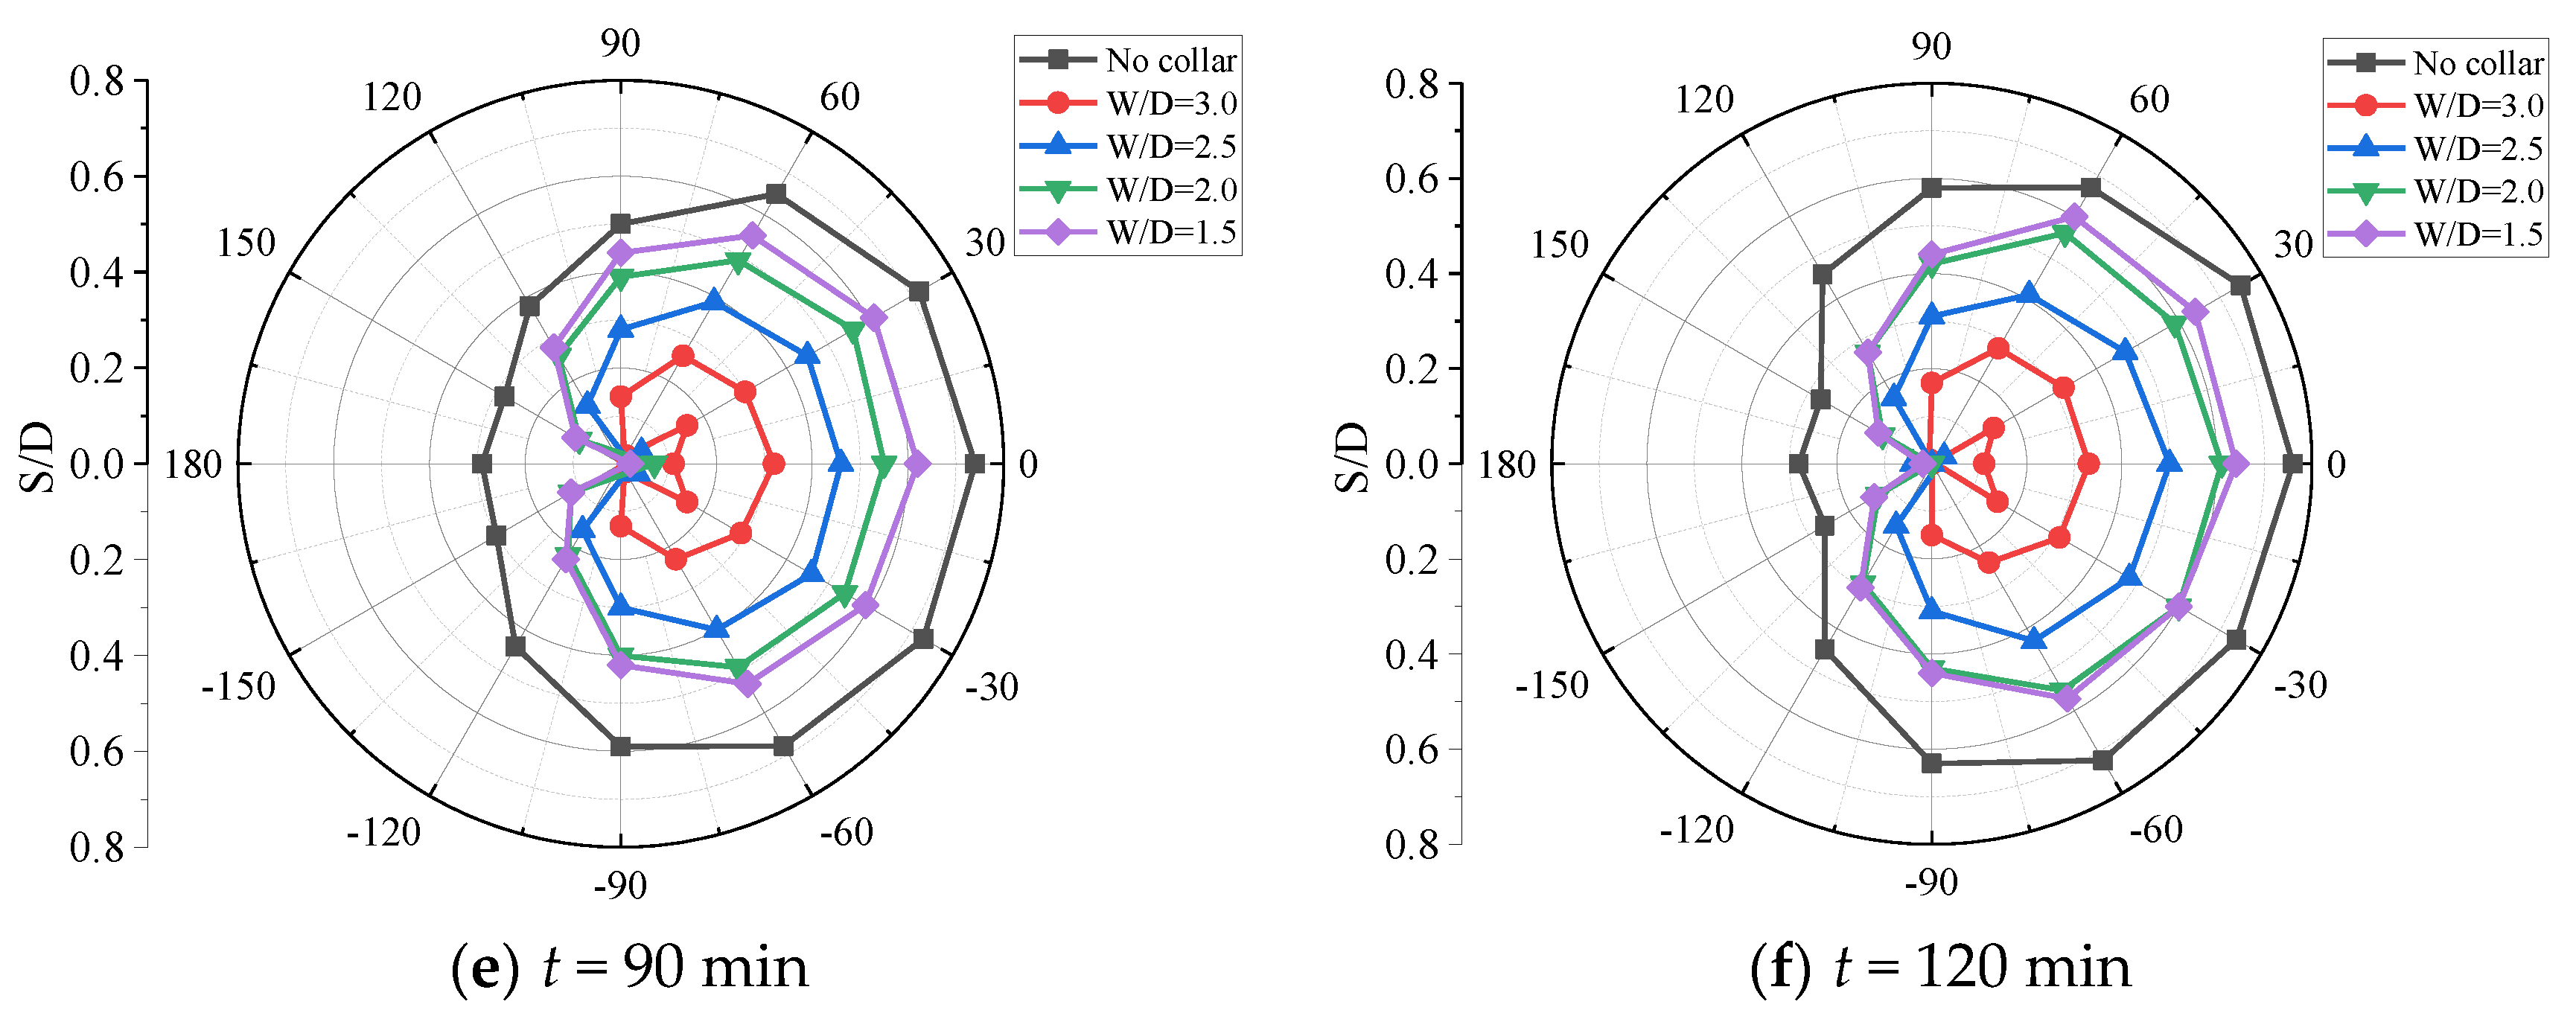
The effect of the collar external diameter on the scour protective effect was investigated experimentally at a certain collar installation height h/H = 0.04. Four anti-scour collars with different external diameters (W/D = 3.0, 2.5, 2.0 and 1.5) were considered. The development of maximum scour depth Smax/D as a function of the collar external diameter is plotted in Figure 12a. The protection efficiency factor β (defined as (St,max − Si)/St,max in above section) versus the external diameter is shown in Figure 12b. It is clear that the external diameter of anti-scour collar affects the scour protective effect significantly. The protective effect is increased with the increase of the collar external diameter for all twelve measuring points. The scour development related to the increase of collar external diameter has also been reported in the previous studies [33,34,35].
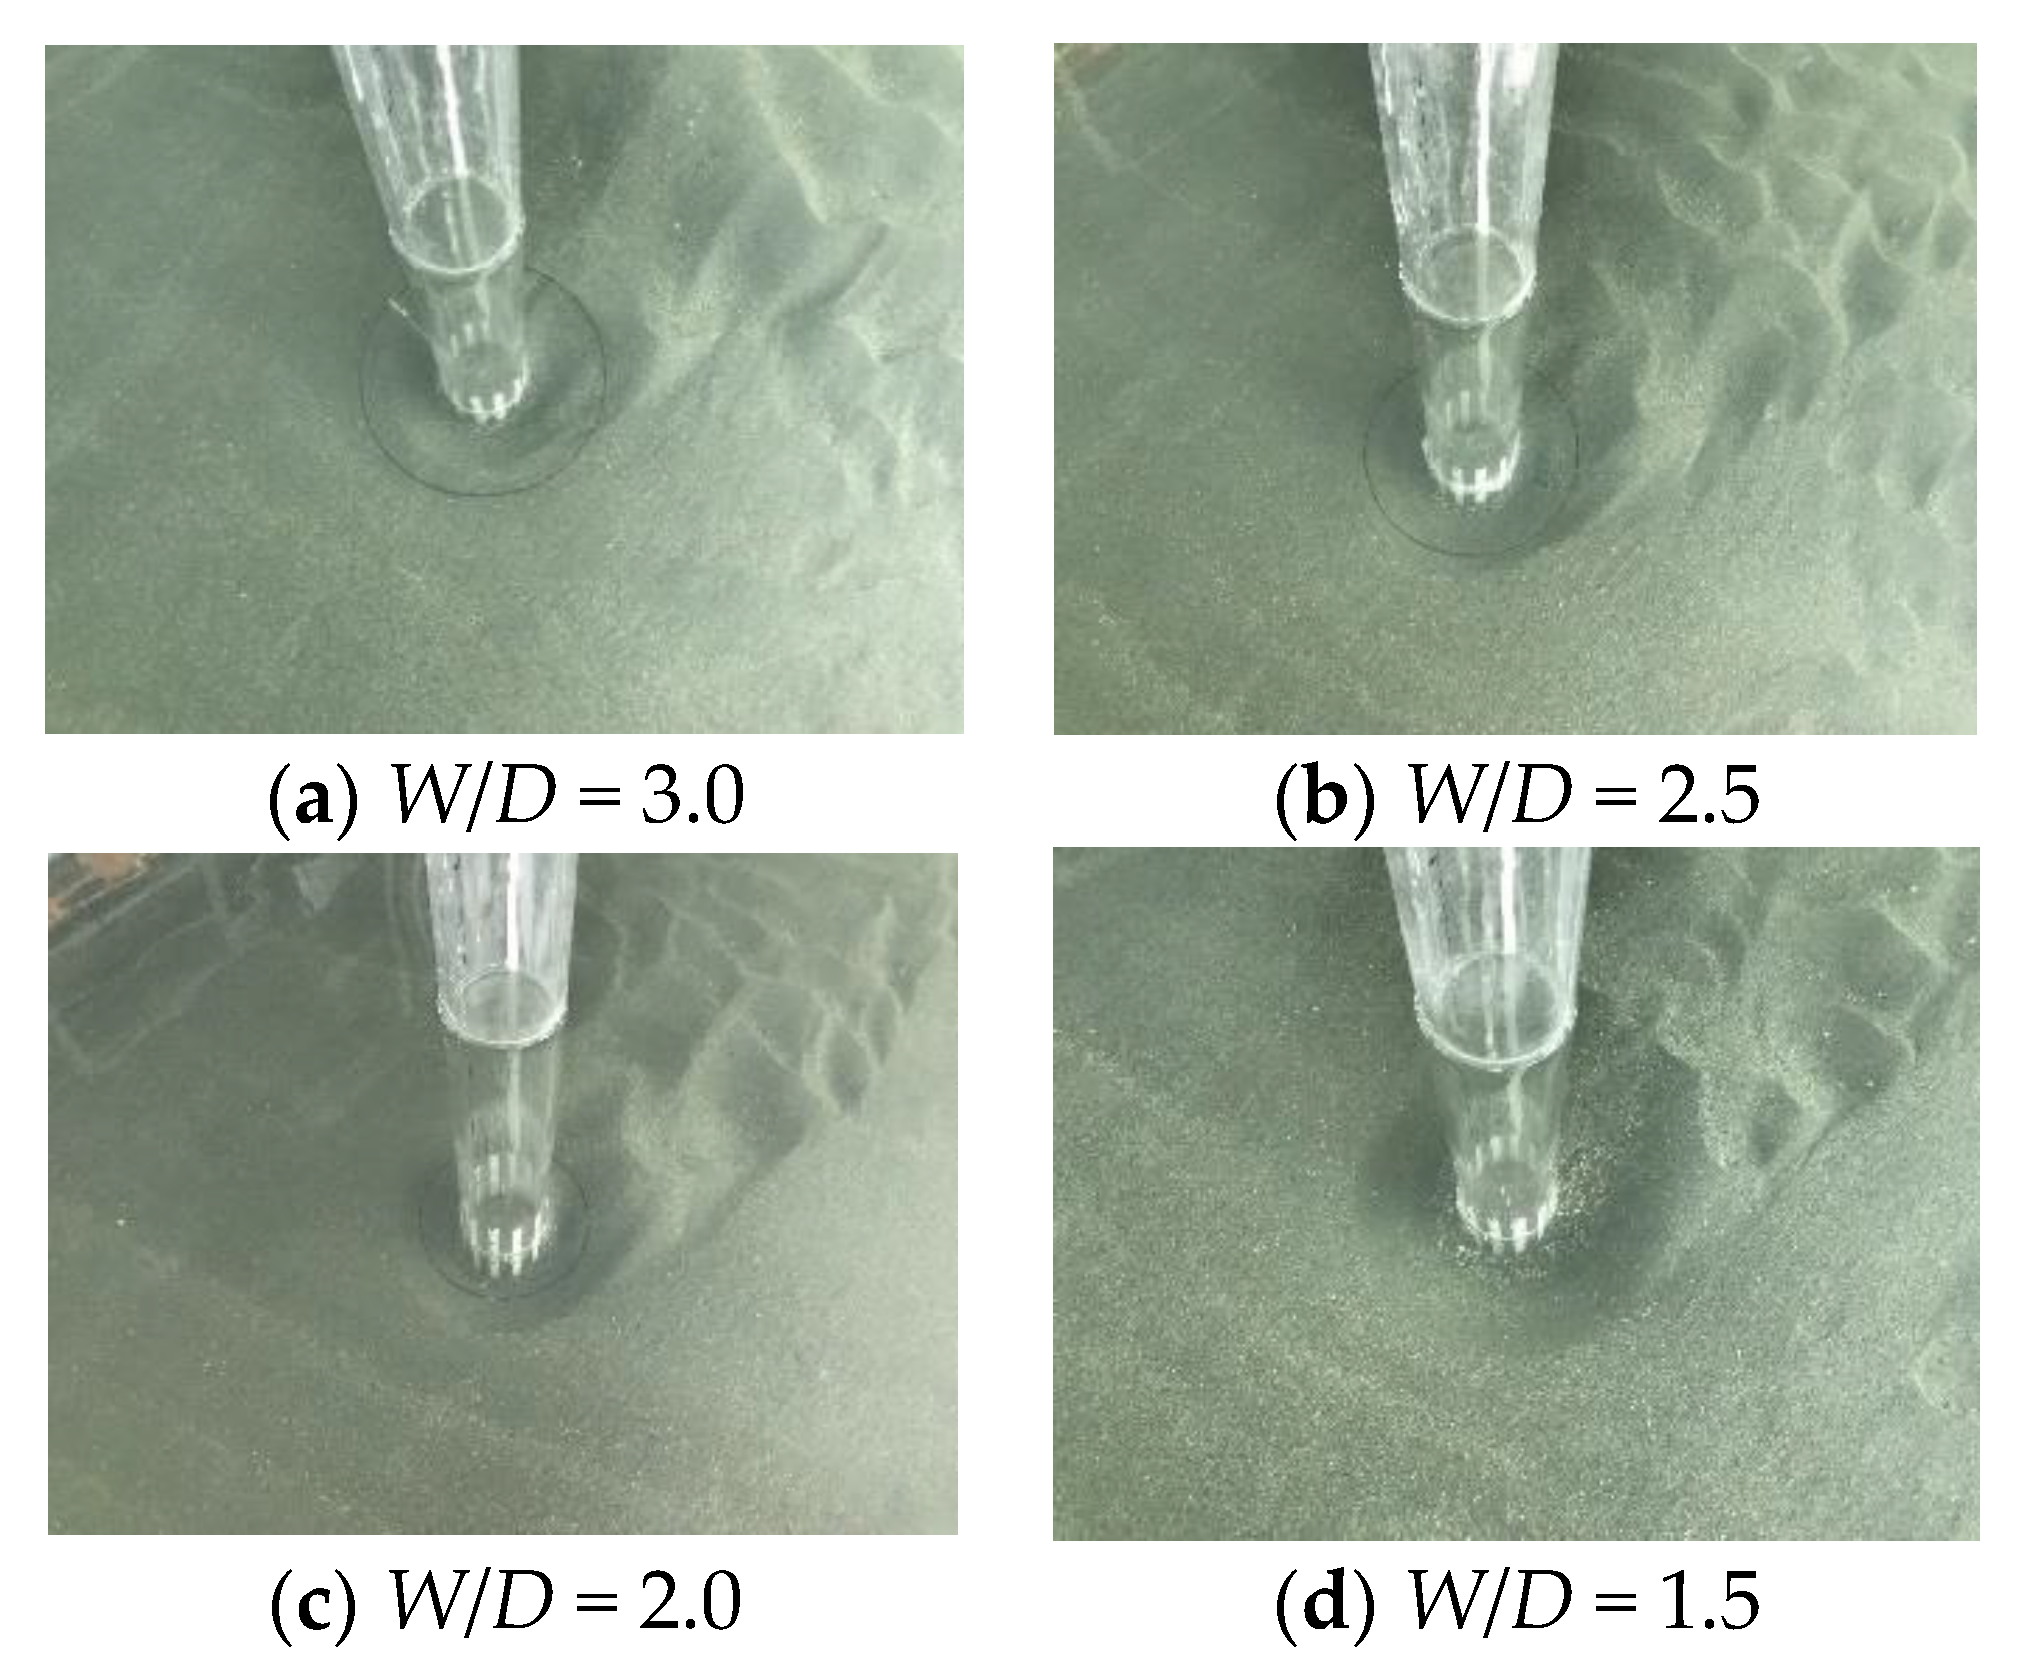
The photos of the scour hole at 120 min for four cases are given in Figure 13, respectively. According to Figure 14, the increase of the collar external diameter could reduce not only the maximum scour depth, but also the scour hole range. When the external diameter W/D was set to be 3.0, the edge of the scour hole was located inside the range of the collar. The sediment deposited behind the pier. With the decrease of the collar external diameter, its protective effect was decreased. When the collar external diameter W/D was 2.5, the scour hole range was similar with the collar size, which was larger than the case of 3.0 value diameter. With the collar external diameter decreasing, the scour hole was becoming larger than the collar size, and its range was larger.
The development of scour depth as a function of scouring time at twelve measuring points is shown in Figure 14 for different anti-scour collar external diameters, respectively. The maximum scour depth occurred in front of the pier regardless of the external diameter. Although anti-scour collars with larger diameters resulted in better protective effects, it is not possible to install a collar with infinite external diameter due to hydraulic and economic reasons. According to this study, an anti-scour collar with an external diameter that equals three times the diameter of the pier can reduce more than 50% of the scour for the pier without any protection. However, it should be noted that there should be a limit between the scour reduction and the cost due to the increase of collar diameter, especially when it is applied in the actual long-span bridge pier with a large diameter [47].
4.4. Effect of Collar Protection Range
Considering downward flow in front of the pier is one of the reasons that causes local scour of sediment. In the existing literature, there are many studies on the installation height and external diameter of anti-scour collars [24,25,27,29,30,31,32,33], but there are few studies focused on the protection range of anti-scour collars. It is interesting to determine if we can protect the sediment by reducing the protective range of the collar. In order to discuss the effect of the protective range of the collar, three protective ranges: 180 (half circle), 270 (3/4 circle) and 360 (full circle) are considered on the basis of anti-scour collars with installation height h/H = 0.1 and external diameter W/D = 2.5.
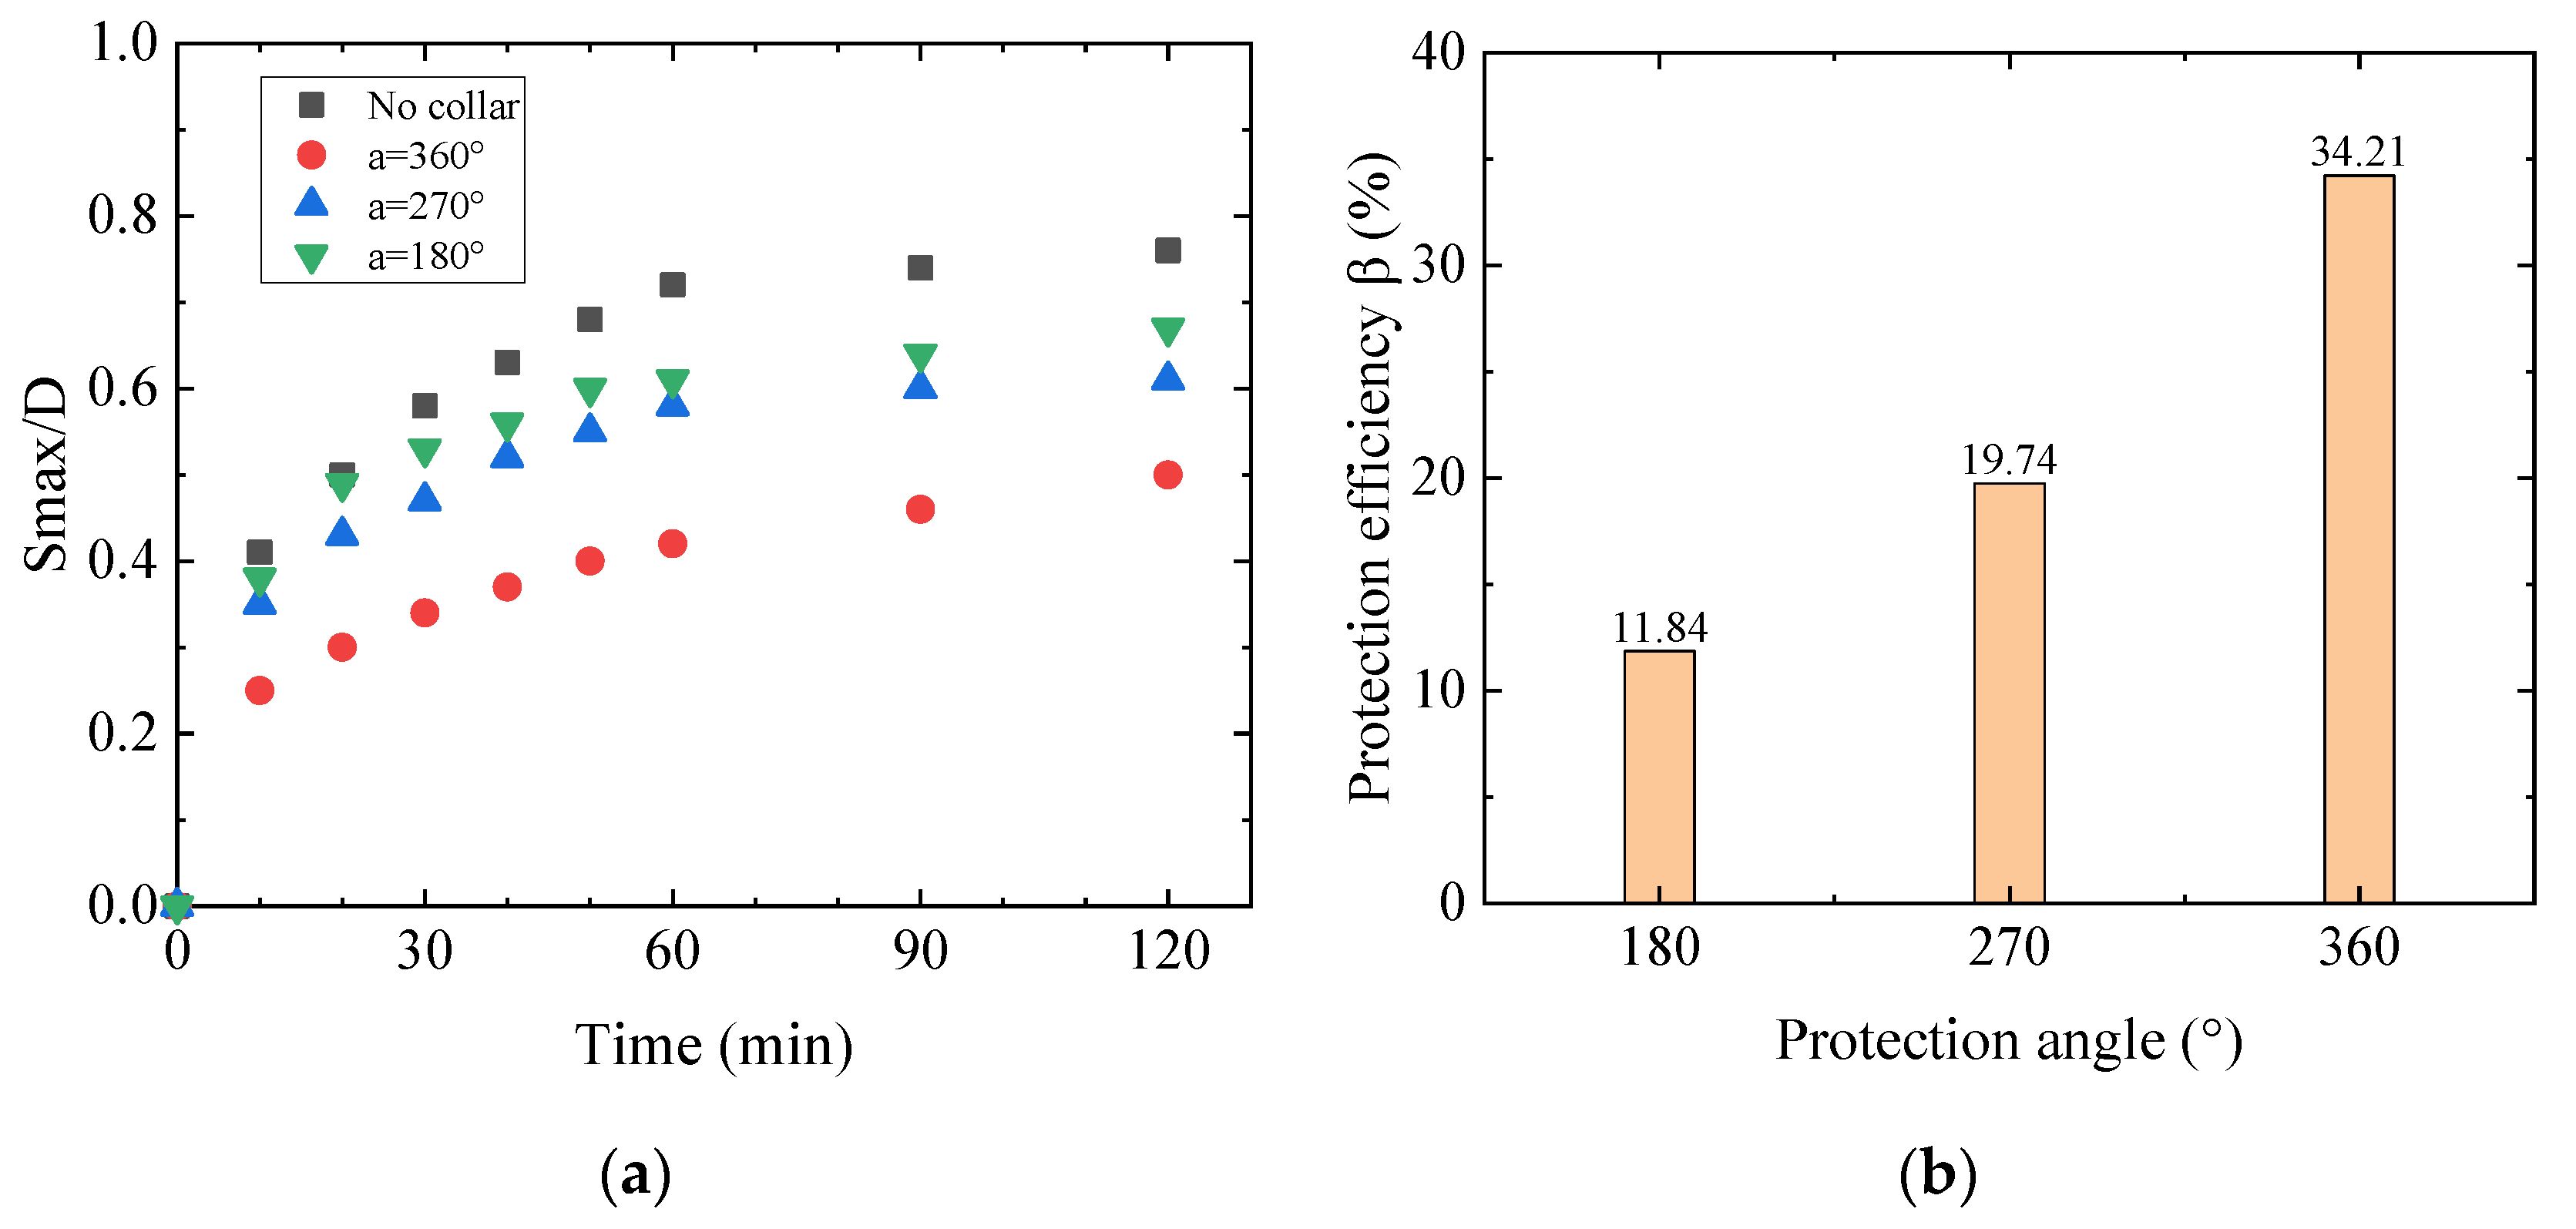
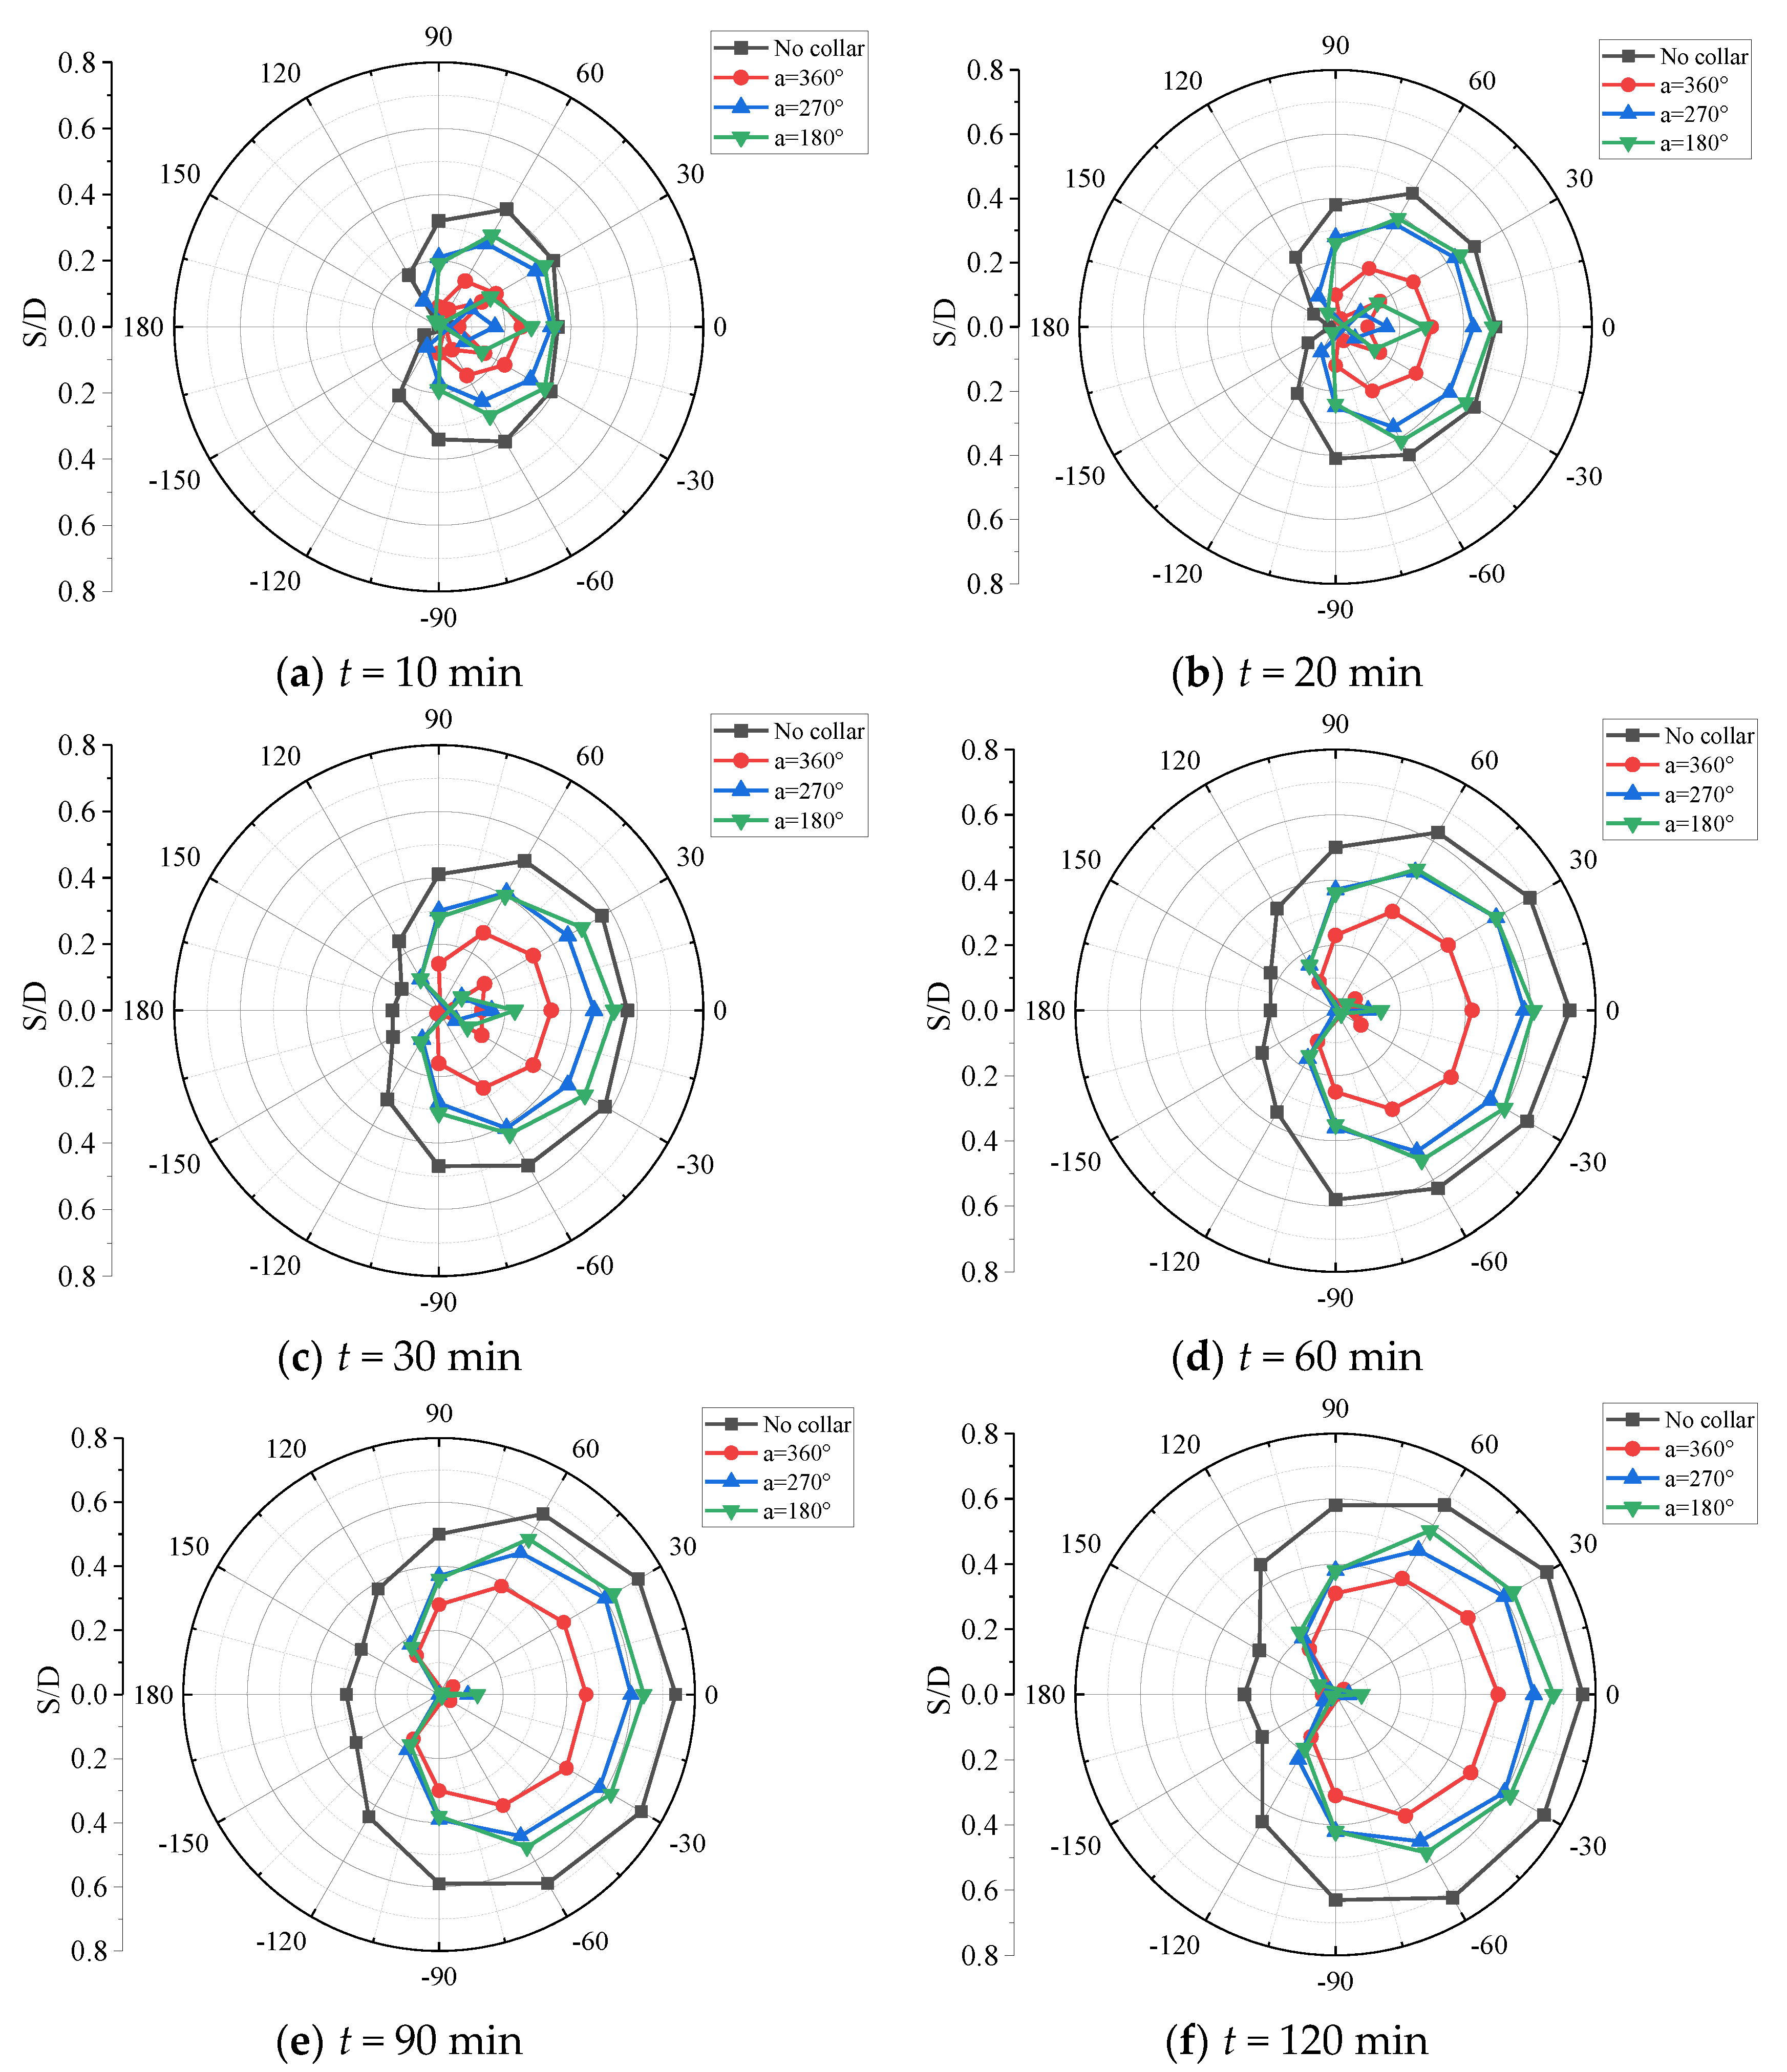
The development of maximum scour depth Smax/D for different collar protection ranges are given in Figure 15a. The protection efficiency factor β (=(St,max − Si)/St,max) versus the protection range of collars is shown in Figure 15b. It can be concluded from the results that the protection range affects the protective effect as well. The scour protective effect of the collar with 360° protection range was the best. With the decrease of protection range, the protection effect was weakened.
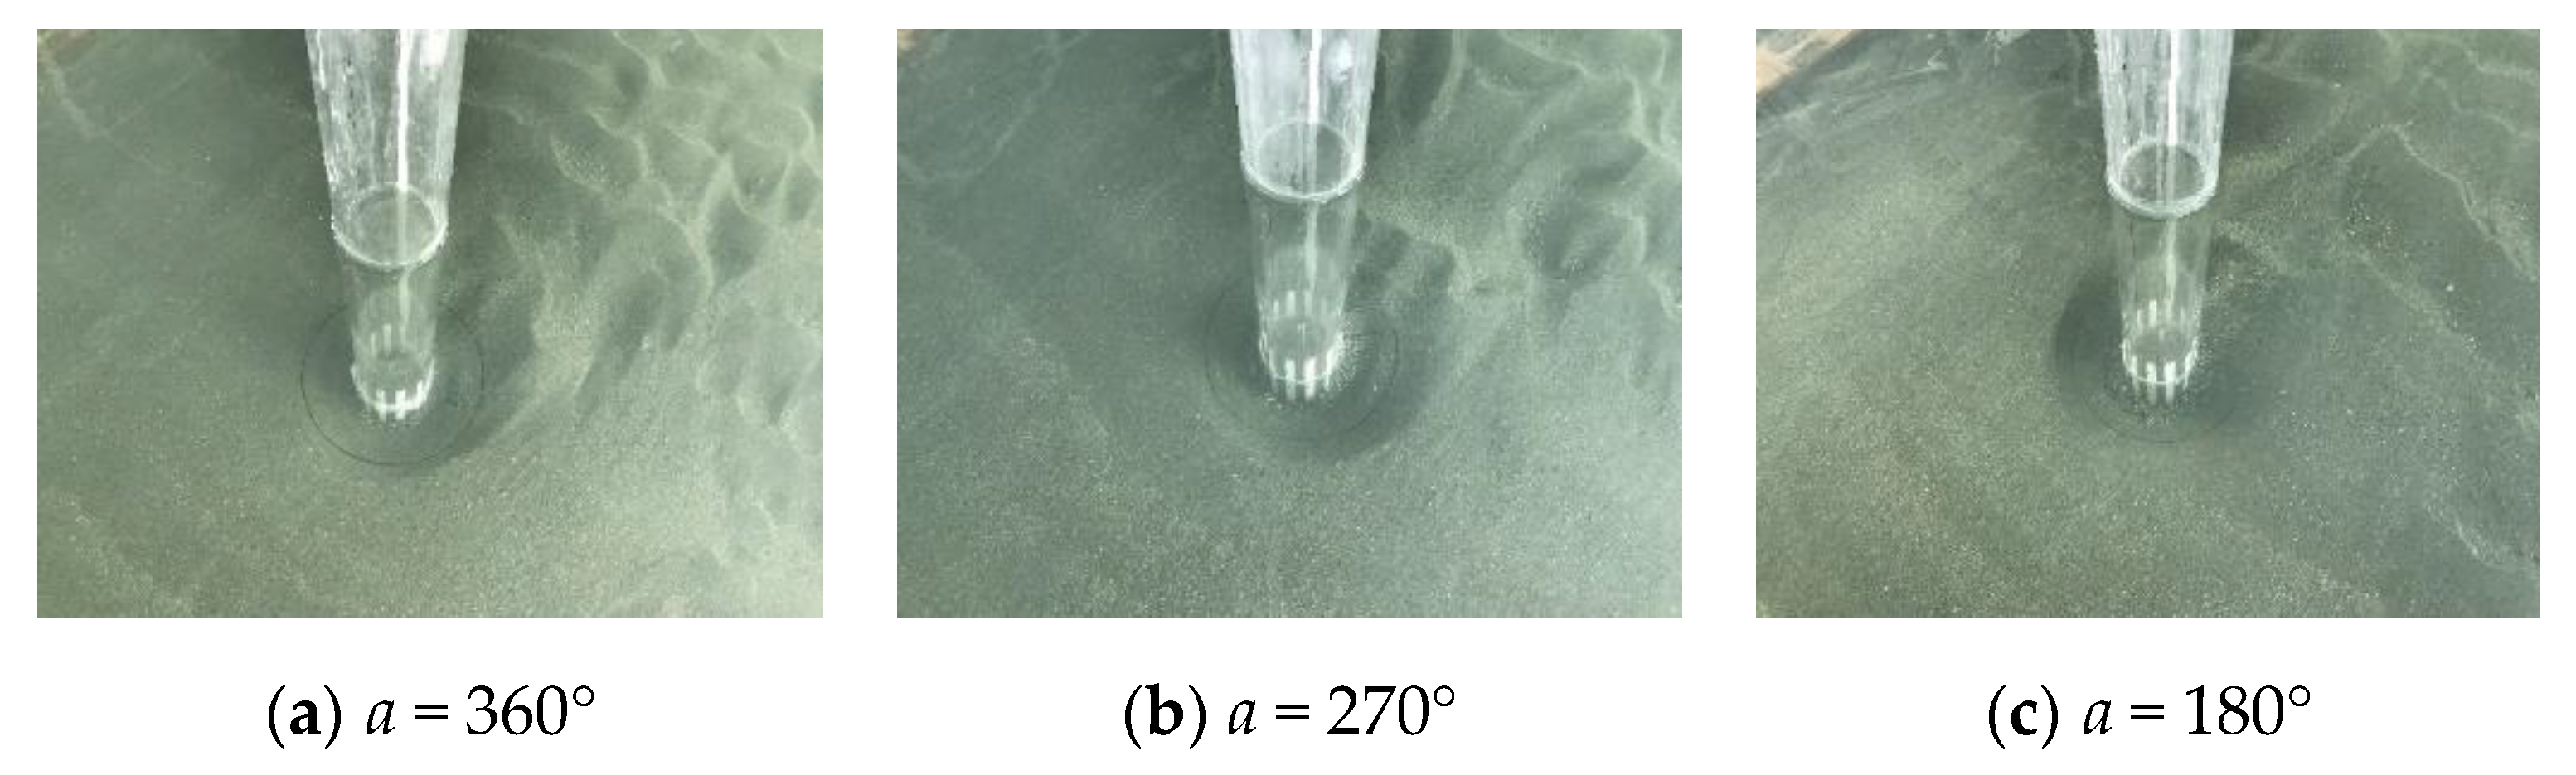
The scour holes formed at 120 min of different protection angles are shown in Figure 16. The photos of scour holes at 120 min for four collar protection ranges are given in Figure 15. The development of scour depth as a function of scouring time at twelve measuring points is shown in Figure 17. When the protection range of the collars decreased from 360° to 270°, the protective efficiency decreased distinctly. When it continued reducing from 270° to 180°, the decrease in protective effect did not greatly change. Therefore, it is recommended to use anti-scour collars with a full circle protection range.
5. Conclusions
Scour around single cylindrical piers and the effects of anti-scour collars were investigated by carrying out laboratory tests. The scour mechanism and the time-varied development of scour depth were studied. Experimental investigations regarding local scour using anti-scour collars on cylindrical piers were carried out. The protective efficiency of anti-scour collars with different design parameters, including collar installation height, collar external diameter and collar protection range, were investigated and discussed respectively. The main findings of this study can be summarized as follows:
- (1)
- In the scour test of a cylindrical pier without protection, the maximum scour depth first appears in the front side of the pier, then moves to the front of the pier, while the minimum scour depth appears in the downstream side of the pier. The shape of the local scour hole around the pier is approximately symmetric with the flow direction.
- (2)
- The anti-scour collar has clear protective effects on pier scour. The decrease of the installation height and the increase of both collar external diameter and the protection range all contribute to the increase the protection effect of the anti-scour collar.
- (3)
- Three design suggestions for improving the scour protective effect of anti-scour collars on piers are given based on the experimental results: (1) the collar is suggested to be embedded into the riverbed and installed under the general scour level; (2) the collar with an external diameter three times the pier diameter can reduce more than half of the scour depth of a pier without protection; (3) the protection range of the anti-scour collar is suggested to be a full circle of 360° for a better protective effect.
It should be noted that there are still many limitations in this study. The parametric study of anti-scour collars here is carried out only under one thickness of anti-scour collars and one constant current condition. The change of both flow velocity and water depth and the type of sand are not considered. The application of two or more collars is not considered as well. These limitations can be further addressed by experimental or numerical simulation study. Notwithstanding the shortcomings listed above, the experimental results of anti-scour collars are of great practical guiding significance to the optimal design of anti-scour collars and can provide a useful testing reference for further improvement of active scour countermeasures for bridges.
Author Contributions
S.W., K.W., Z.S., Q.X. designed and supervised the experiments; S.W. conducted the analysis on the experimental data; K.W. provided motivation and contributed interpretation of results; S.W. and K.W. wrote the paper; and all authors participated in final review and editing of the paper.
Funding
This research was funded by National Natural Science Foundation of China (Grants No. 51708455), the Fundamental Research Fund for Central Universities (A1920502051907-2-001) and Key Research and Development Project of Sichuan Province (2019YFG0460).
Acknowledgments
The authors sincerely thank the anonymous reviewers for their valuable suggestions in improving the manuscript.
Conflicts of Interest
The authors declare no conflict of interest.
References
- Barbhuiya, A.K.; Dey, S. Local scour at abutments: A review. Sadhana 2004, 29, 449–476. [Google Scholar] [CrossRef]
- Wang, C.; Yu, X.; Liang, F. A review of bridge scour: Mechanism, estimation, monitoring and countermeasures. Nat. Hazards 2017, 87, 1881–1906. [Google Scholar] [CrossRef]
- Richardson, E.V.; Harrison, L.J.; Richardson, J.R.; Davies, S.R. Evaluating Scour at Bridges; Publ. FHWA-IP-90-017, Federal Highway Administration, US Department of Transportation: Washington, DC, USA, 1993.
- Wardhana, K.; Hadipriono, F.C. Analysis of recent bridge failures in the United States. J. Perform. Constr. Facil. 2003, 17, 144–150. [Google Scholar] [CrossRef]
- Lagasse, P.F. 1998 Scanning Review of European Practice for Bridge Scour and Stream Instability Countermeasures; NCHRP Research Results Digest-241; Transportation Research Board: Washington, DC, USA, 1999. [Google Scholar]
- Yi, R.; Zhou, R. Reason and risk of bridge collapse in recent 15 years. Transp. Sci. Technol. 2015, 5, 61–64. (In Chinese) [Google Scholar]
- Federico, F.; Silvagni, G.; Volpi, F. Scour vulnerability of river bridge piers. J. Geotech. Geoenviron. Eng. 2003, 129, 890–899. [Google Scholar] [CrossRef]
- Ye, A.; Zhang, X.; Liu, W. Effects of riverbed scouring depth on the seismic response of bridges on pile foundations. China Civ. Eng. J. 2007, 40, 58–62. (In Chinese) [Google Scholar]
- Wang, Z.; Dueñas-Osorio, L.; Padgett, J.E. Influence of scour effects on the seismic response of reinforced concrete bridges. Eng. Struct. 2014, 76, 202–214. [Google Scholar] [CrossRef]
- Liang, F.; Zhang, H.; Huang, M. Influence of flood-induced scour on dynamic impedances of pile groups considering the stress history of undrained soft clay. Soil Dyn. Earthq. Eng. 2017, 96, 76–88. [Google Scholar] [CrossRef]
- Zhang, J.; Wei, K.; Qin, S. An efficient numerical model for hydrodynamic added mass of immersed column with arbitrary cross—Section. Ocean Eng. 2019, 187, 106192. [Google Scholar] [CrossRef]
- Melville, B.W.; Coleman, S.E. Bridge Scour; Water Resources Publication: Highlands Ranch, CO, USA, 2000. [Google Scholar]
- Ataie-Ashtiani, B.; Beheshti, A. Experimental investigation of clear-water local scour at pile groups. J. Hydraul. Eng. ASCE 2006, 132, 1100–1104. [Google Scholar] [CrossRef]
- Zhang, X.; LV, H.; Shen, B. Experimental studies on local scour mechanism of cylinder bridge piers. Hydro-Sci. Eng. 2012, 2, 34–41. (In Chinese) [Google Scholar]
- Khosronejad, A.; Kang, S.; Sotiropoulos, F. Experimental and computational investigation of local scour around bridge piers. Adv. Water Resour. 2012, 37, 73–85. [Google Scholar] [CrossRef]
- Sumer, B.M.; Whitehouse, R.J.; Tørum, A. Scour around coastal structures: A summary of recent research. Coast. Eng. 2001, 44, 153–190. [Google Scholar] [CrossRef]
- Sumer, B.M.; Fredsøe, J. Scour around pile in combined waves and current. J. Hydraul. Eng. 2001, 127, 403–411. [Google Scholar] [CrossRef]
- Bouratsis, P.; Diplas, P.; Dancey, C.L.; Apsilidis, N. Quantitative spatio-temporal characterization of scour at the base of a cylinder. Water 2017, 9, 227. [Google Scholar] [CrossRef]
- Parola, A.C.; Mahavadi, S.K.; Brown, B.M.; Khoury, A.E. Effects of rectangular foundation geometry on local pier scour. J. Hydraul. Eng. ASCE 1996, 122, 35–40. [Google Scholar] [CrossRef]
- Parker, G.; Toro-Escobar, C.; Voigt, R.L. Countermeasures to Protect Bridge Piers from Scour; NCHRP project 24-7, Transportation Research Board by St. Anthony Falls Laboratory; University of Minnesota: Minneapolis, MN, USA, 1998. [Google Scholar]
- Lagasse, P.F.; Zevenbergen, L.W.; Schall, J.D.; Clopper, P.E. Bridge Scour and Stream Instability Countermeasures: Experience, Selection, and Design Guidance, 2nd ed.; Technical Report of US. Department of Transportation; US Department of Transportation: Washington, DC, USA, 2001.
- Lauchlan, C.S.; Melville, B.W. Riprap protection at bridge piers. J. Hydraul. Eng. ASCE 2001, 127, 412–418. [Google Scholar] [CrossRef]
- Lagasse, P.F.; Clopper, P.E.; Zevenbergen, L.W.; Girard, L.W. Countermeasures to Protect Bridge Pier from Scour; NCHRP Report-593; Transportation Research Board: Washington, DC, USA, 2007. [Google Scholar]
- Chiew, Y.M. Scour protection at bridge piers. J. Hydraul. Eng. ASCE 1992, 118, 1260–1269. [Google Scholar] [CrossRef]
- Zarrati, A.R.; Gholami, H.; Mashahir, M.B. Application of collar to control scouring around rectangular bridge piers. J. Hydraul. Res. 2004, 42, 97–103. [Google Scholar] [CrossRef]
- Cheng, L.Y.; Mou, X.Y.; Wen, H.; Hao, L.Z. Experimental research on protection of ring-wing pier against local scour. Adv. Sci. Technol. Water Resour. 2012, 32, 14–19. (In Chinese) [Google Scholar]
- Kumar, V.; Raju, K.G.R.; Vittal, N. Reduction of local scour around bridge piers using slots and collars. J. Hydraul. Eng. ASCE 1999, 125, 1302–1305. [Google Scholar] [CrossRef]
- Melville, B.W.; Hadfield, A.C. Use of sacrificial piles as pier scour countermeasures. J. Hydraul. Eng. ASCE 1999, 125, 1221–1224. [Google Scholar] [CrossRef]
- Tafarojnoruz, A.; Gaudio, R.; Dey, S. Flow-altering countermeasures against scour at bridge piers: A review. J. Hydraul. Res. 2010, 48, 441–452. [Google Scholar] [CrossRef]
- Ettema, R. Scour at Bridge Piers; Report No. 216; School of Engineering, University of Auckland: Auckland, New Zealand, 1980. [Google Scholar]
- Chen, S.C.; Tfwala, S.; Wu, T.Y.; Chan, H.C.; Chou, H.T. A hooked-collar for bridge piers protection: Flow fields and scour. Water 2018, 10, 1251. [Google Scholar] [CrossRef]
- Gaudio, R.; Tafarojnoruz, A.; Calomino, F. Combined flow-altering countermeasures against bridge pier scour. J. Hydraul. Res. 2012, 50, 35–43. [Google Scholar] [CrossRef]
- Karami, H.; Hosseinjanzadeh, H.; Hosseini, K.; Ardeshir, A. Scour and three-dimensional flow field measurement around short vertical-wall abutment protected by collar. KSCE J. Civ. Eng. 2017, 22, 141–152. [Google Scholar] [CrossRef]
- Moncada-M, A.T.; Aguirre-Pe, J.; Bolivar, J.C.; Flores, E.J. Scour protection of circular bridge piers with collars and slots. J. Hydraul. Res. 2009, 47, 119–126. [Google Scholar] [CrossRef]
- Heidarpour, M.; Afzalimehr, H.; Izadinia, E. Reduction of local scour around bridge pier groups using collars. Int. J. Sediment Res. 2010, 25, 411–422. [Google Scholar] [CrossRef]
- Vasquez, J.A.; Walsh, B.W. CFD simulation of local scour in complex piers under tidal flow. In Proceedings of the 33rd IAHR Congress: Water Engineering for a Sustainable Environment, Vancouver, BC, Canada, 9–14 August 2009; pp. 913–920. [Google Scholar]
- Zhao, M.; Zhu, X.; Cheng, L.; Teng, B. Experimental study of local scour around subsea caissons in steady currents. Coast. Eng. 2012, 60, 30–40. [Google Scholar] [CrossRef]
- Soulsby, R.L.; Whitehouse, R.J.S. Threshold of sediment motion in coastal environments. In Proceedings of the 13th Australasian Coastal and Engineering Conference and 6th Australasian Port and Harbour Conference, Cristchurch, New Zealand, 7–11 September 1997. [Google Scholar]
- Soulsby, R. Dynamics of Marine Sands; Tomas Telford Ltd.: London, UK, 1997; 249p. [Google Scholar]
- Melville, B.W.; Chiew, Y.M. Time scale for local scour at bridge piers. J. Hydraul. Eng. 1999, 125, 59–65. [Google Scholar] [CrossRef]
- Bateni, S.M.; Jeng, D.S.; Melville, B.W. Bayesian neural networks for prediction of equilibrium and time-dependent scour depth around bridge piers. Adv. Eng. Softw. 2007, 38, 102–111. [Google Scholar] [CrossRef]
- Melville, B.M. Local Scour at Bridge Sites; University of Auckland, School of Engineering: Auckland, New Zealand, 1975. [Google Scholar]
- Sumer, B.M.; Christiansen, N.; Fredsoe, J. Time scale of scour around a vertical pile. In Proceedings of the 2nd International Offshore and Polar Engineering Conference, ISOPE, San Francisco, CA, USA, 14–19 June 1992; Volume 3, pp. 308–315. [Google Scholar]
- Yang, Y.; Qi, M.; Li, J.; Ma, X. Evolution of hydrodynamic characteristics with scour hole developing around a pile group. Water 2018, 10, 1632. [Google Scholar] [CrossRef]
- Zhang, Q.; Zhou, X.L.; Wang, J.H. Numerical investigation of local scour around three adjacent piles with different arrangements under current. Ocean Eng. 2017, 142, 625–638. [Google Scholar] [CrossRef]
- Melville, B.W.; Raudkivi, A.J. Effects of foundation geometry on bridge pier scour. J. Hydraul. Eng. 1996, 122, 203–209. [Google Scholar] [CrossRef]
- Ti, Z.; Zhang, M.; Li, Y.; Wei, K. Numerical study on the stochastic response of a long-span sea-crossing bridge subjected to extreme nonlinear wave loads. Eng. Struct. 2019, 196, 109287. [Google Scholar] [CrossRef]
Figure 1.
The testing facility: Photo and detail of the current flume.

Figure 2.
Layout of the testing facilities: (a) installation of test model; (b) Acoustic Doppler Velocimeter (ADV) flow velocity measurement; (c) velocity measurement probe details; (d) scour depth measurement by ADV; (e) depth measurement probe details.
Figure 2.
Layout of the testing facilities: (a) installation of test model; (b) Acoustic Doppler Velocimeter (ADV) flow velocity measurement; (c) velocity measurement probe details; (d) scour depth measurement by ADV; (e) depth measurement probe details.

Figure 3.
Schematic diagram of anti-scour collar: (a) the pier with 2 m diameter in highway bridges; (b) the installation of 360° collar in pier; and (c) indication of collar with a protection angle a (°).
Figure 3.
Schematic diagram of anti-scour collar: (a) the pier with 2 m diameter in highway bridges; (b) the installation of 360° collar in pier; and (c) indication of collar with a protection angle a (°).

Figure 4.
The flow velocity measurement by ADV: (a) determination of underwater 10 cm flow velocity; and (b) velocity distribution at different heights.
Figure 4.
The flow velocity measurement by ADV: (a) determination of underwater 10 cm flow velocity; and (b) velocity distribution at different heights.

Figure 5.
The threshold velocity of selected sediment at different water depths.

Figure 6.
The layout of measuring points around the cylindrical pier.

Figure 7.
Depth scour data of a single cylindrical pier: (a) the time-varied scour development at twelve measuring points; and (b) the maximum scour depth of a single pier.
Figure 7.
Depth scour data of a single cylindrical pier: (a) the time-varied scour development at twelve measuring points; and (b) the maximum scour depth of a single pier.

Figure 8.
The scour hole in the approximate equilibrium condition.

Figure 9.
Scour protection effect at different collar installation height h/H: (a) the maximum scour depth development; and (b) the protection efficiency.
Figure 9.
Scour protection effect at different collar installation height h/H: (a) the maximum scour depth development; and (b) the protection efficiency.

Figure 10.
The scour hole form of different collar installation height: (a–d).

Figure 11.
The dimensionless scour depth development of different collar installation height h/H at each measuring point.
Figure 11.
The dimensionless scour depth development of different collar installation height h/H at each measuring point.


Figure 12.
Scour protection effect at different collar external diameter W/D: (a) the maximum scour depth development; and (b) the protection efficiency.
Figure 12.
Scour protection effect at different collar external diameter W/D: (a) the maximum scour depth development; and (b) the protection efficiency.

Figure 13.
The scour hole form of different collar external diameters at 120 min.

Figure 14.
The dimensionless scour depth development of different collar external diameters W/D at each measuring point.
Figure 14.
The dimensionless scour depth development of different collar external diameters W/D at each measuring point.


Figure 15.
Scour protection effect at different collar protection range: (a) the maximum scour depth development; and (b) the protection efficiency.
Figure 15.
Scour protection effect at different collar protection range: (a) the maximum scour depth development; and (b) the protection efficiency.

Figure 16.
The scour hole form of different collar protection angle at 120 min.

Figure 17.
The scour depth development of different collar protection angles at each measuring point.
Figure 17.
The scour depth development of different collar protection angles at each measuring point.


Table 1.
Parameters of sediment used in the tests.
| Median particle size of sand d50 (mm) | 0.324 |
| d10 (mm) | 0.114 |
| d30 (mm) | 0.228 |
| d60 (mm) | 0.369 |
| Uniformity coefficient Cu = d60/d10 | 3.237 |
| Coefficient of curvature Cc = d302/(d60* d10) | 1.236 |
| Specific gravity s | 2.65 |
| Critical Shields parameter θcr | 0.036 |
| Water depth h (m) | 0.5 |
| Approximate depth averaged velocity Ū (m/s) | 0.325 (Maximum is 0.35) |
| Shields parameter due to skin friction θs | 0.041 |
| Logarithmic relationship CD | 0.002 |
| Roughness length for skin friction z0s (m) | 2.7 × 10⁻⁵ |
| Angle of repose ϕ (°) | 32.9 |
| Threshold velocity U (m/s) | 0.303 |
Table 2.
Parameters for the test conditions.
| Case | Anti-Scour Collar | Installation Height h/H | External Diameter W/D | Protection Angle a (°) |
|---|---|---|---|---|
| 1 | w/o. | —— | —— | —— |
| 2 | w. | 0.10 | 2.5 | 360 |
| 3 | w. | 0.04 | ||
| 4 | w. | 0 | ||
| 5 | w. | −0.04 | ||
| 6 | w. | 0.04 | 3.0 | 360 |
| 7 | w. | 2.0 | ||
| 8 | w. | 1.5 | ||
| 9 | w. | 0.04 | 2.5 | 270 |
| 10 | w. | 180 |
© 2019 by the authors. Licensee MDPI, Basel, Switzerland. This article is an open access article distributed under the terms and conditions of the Creative Commons Attribution (CC BY) license (http://creativecommons.org/licenses/by/4.0/).
Share and Cite
MDPI and ACS Style
Wang, S.; Wei, K.; Shen, Z.; Xiang, Q. Experimental Investigation of Local Scour Protection for Cylindrical Bridge Piers Using Anti-Scour Collars. Water 2019, 11, 1515. https://doi.org/10.3390/w11071515
AMA Style
Wang S, Wei K, Shen Z, Xiang Q. Experimental Investigation of Local Scour Protection for Cylindrical Bridge Piers Using Anti-Scour Collars. Water. 2019; 11(7):1515. https://doi.org/10.3390/w11071515
Chicago/Turabian StyleWang, Shunyi, Kai Wei, Zhonghui Shen, and Qiqi Xiang. 2019. "Experimental Investigation of Local Scour Protection for Cylindrical Bridge Piers Using Anti-Scour Collars" Water 11, no. 7: 1515. https://doi.org/10.3390/w11071515
Note that from the first issue of 2016, this journal uses article numbers instead of page numbers. See further details here.