Study on Characteristics of Nitrogen and Phosphorus Loss under an Improved Subsurface Drainage


1
State Key Laboratory of Simulation and Regulation of Water Cycle in River Basin, China Institute of Water Resources and Hydropower Research, Beijing 100038, China
2
Department of Irrigation and Drainage, China Institute of Water Resources and Hydropower Research, Beijing 100048, China
3
National Center of Efficient Irrigation Engineering and Technology Research—Beijing, Beijing 100048, China
*
Authors to whom correspondence should be addressed.
Water 2019, 11(7), 1467; https://doi.org/10.3390/w11071467
Submission received: 10 June 2019
/
Revised: 2 July 2019
/
Accepted: 10 July 2019
/
Published: 15 July 2019
(This article belongs to the Section Water Quality and Contamination)
Abstract
:Agricultural drainage plays an effective role in preventing waterlogging and salinity disasters and also is the main transport pathway for agricultural non-point source pollutants into rivers and lakes. Hence, the water quality of agricultural drainage should be a point of focus. In this paper, nitrogen and phosphorus loss under improved subsurface drainage with different filter materials (gravel, layered sand-gravel, mixed sand-gravel, straw) were studied by a three-year field experiment (2016–2018) compared with the conventional subsurface drainage. The pH values, total nitrogen, ammonia nitrogen, nitrate nitrogen, total phosphorus and soluble reactive phosphate were considered. The results showed that the nitrogen and phosphorus concentrations of drain outflow under improved subsurface drainage with gravel filter were larger than that with layered sand-gravel filter and mixed sand-gravel filter. The improved subsurface drainages with layered sand-gravel filter and mixed sand-gravel filter had an effect on reducing the ammonia nitrogen, total phosphorus and soluble reactive phosphate concentrations of the outflow. Meanwhile, the characteristics of nitrogen and phosphorus loss under the improved subsurface drainage with straw filter were different from that with layered sand-gravel filter and mixed sand-gravel filter. For the improved subsurface drainage with layered sand-gravel filter outflow, the ammonia nitrogen, total phosphorus, and soluble reactive phosphate concentrations were about 13%–78%, 38%–63%, 40%–68% less, and total nitrogen, nitrate nitrogen concentrations were 24%–80%,18%–96% more than that under conventional subsurface drainage. Meanwhile, for the improved subsurface drainage with straw filter outflow, compared with conventional subsurface drainage outflow, the percentage changes of the total nitrogen, nitrate nitrogen, ammonia nitrogen, total phosphorus and the soluble reactive phosphate concentrations were about −76%–62%, −77%–78%, −152%–−274%, −103%–−400% and −221%–−291%, respectively. Additionally, in the outflow of all subsurface drainage patterns, there were much higher total nitrogen and nitrate nitrogen concentrations which should be focused on and the agricultural water management should be adopted.
1. Introduction
Agricultural drainage is a main transport pathway for agricultural nutrient pollutants into rivers and lakes [1]. Nitrogen and phosphorus loss to a waterbody may cause its eutrophication [2,3,4] which is the primary cause of harmful algal blooms [5]. Agricultural drainage management should be examined considering the comprehensive conditions of agriculture food production promotion, environmental impact and water resources comprehensive utilization [6]. The improved subsurface drainage is a more efficient drainage system by laying high permeability materials as filters than the drains based on conventional subsurface drainage whose function is limited by soil hydraulic conductivity. The advantage in removing excess water from land surface and soil, which is better for agricultural production promotion, has been proven by laboratory experiment, field test and numerical simulation [7,8]. However, the characteristics of nitrogen and phosphorus loss under the improved subsurface drainage had not been studied. Overall, the filter materials of the improved subsurface drainage can be sand and gravel, zeolite, straw or woodchip. These materials may influence the processes of nitrogen and phosphorus transfer in the soil and have different effects on reducing the nitrogen and phosphorus contents in the drain outflow [9,10,11].
Subsurface drainage has been identified as a potentially significant source of nitrogen [12] and phosphorus [13]. Compared with surface drainage or non-drained plots, many researchers have previously reported that the conventional subsurface drainage can reduce the content of phosphorus effectively. Algoazany et al. [14] evaluated the content of soluble phosphorus (soluble P) through subsurface drainage and surface runoff by a long-term water quality monitoring program in the Little Vermilion River (LVR) watershed. The long-term average flow-weighted soluble P concentrations through subsurface drainage and surface runoff were about 86–194 mg/L and 250–572 mg/L respectively, which illustrated that the flow-weighted soluble P losses through subsurface drainage were less than that through surface runoff. Eastman et al. [15] presented that the subsurface drainage in sandy loam soils had a significant beneficial effect in minimizing surface runoff and total phosphorus losses from the field. Unlike the characteristic of phosphorus loss, there are no unanimous conclusions on the characteristic of nitrogen loss under subsurface drainage compared with surface drainage. The soils, weather, and management (cropping, tillage, chemical application practices, and drainage parameters) influenced the nitrate nitrogen leaching, comprehensively [16]. Bengtson [17] showed that subsurface drainage was more effective in reducing the nitrogen loss by 17% than surface drainage during the growing season in the Lower Mississippi Valley. Grazhdani [18] reported that the subsurface drainage contained significantly lower nitrate nitrogen and ammonium nitrogen concentrations with about 30% and 25% reduction respectively. However, Baker et al. [16] drew the conclusions that the ammonium nitrogen loss was decreased and the nitrate nitrogen loss was increased under subsurface drainage compared with surface drainage.
Additionally, different materials also have varied effects on the nitrogen and phosphorus transfer. Turtola and Paajanen [19] analyzed the influences of the subsurface drainage with topsoil or woodchips used as backfill in the drain trenches on phosphorus and nitrogen losses in a heavy clay soil and drew the conclusions that the subsurface drainage with topsoil or wood chips could clearly increase the discharge, the subsurface drainage with topsoil could reduce particulate P and dissolve orthophosphate P losses, and the subsurface drainage with wood chips would not reduce the particulate. Bruun et al. [20] used woodchips as a filter in subsurface flow-constructed wetlands and studied the effects of the hydraulic designs on nitrogen reduction. Results in Bruun’s paper showed that a longer solute residence time and the vertical downwards subsurface flow-constructed wetlands performed well in removing nitrogen. Wang et al. [21] analyzed the effects of different envelop materials including wheat straw, sawdust, ceramic, zeolite and fiber ball on nitrogen removal. Results showed that the inorganic material had a better ability to remove ammonium nitrogen, while organic material had a good ability to remove nitrate nitrogen. Additionally, Wang also revealed that there was a positive relationship between the nitrogen removal capacity and the thickness of the envelope material; when the thickness increased by 10 cm, the nitrogen removal efficiency of wheat straw and sawdust, ceramic and zeolite, and fiber ball increased by 6%–8%, 6%–28%, and 10%–20% respectively. Nie et al. [22] studied the long-term purification effect of rainwater runoff by different infiltration systems constructed with the natural soil, quartz sand, sawdust, and coal ash residues respectively and found that the coal ash residues did the best in removing ammonium nitrogen, the sawdust did the best in reducing total nitrogen for its ability of providing carbon source to the microorganism and all materials did well in removing total phosphorus.
The main objective of this paper was to study the characteristics of nitrogen and phosphorus loss under the improved subsurface drainage with different filter materials and conventional subsurface drainage based on three-year field experiments from 2016–2018. The concentrations of total nitrogen, ammonia nitrogen, nitrate-nitrogen, total phosphorus and soluble reactive phosphate in drain outflow were measured.
2. Materials and Methods
2.1. Field Experiment Design
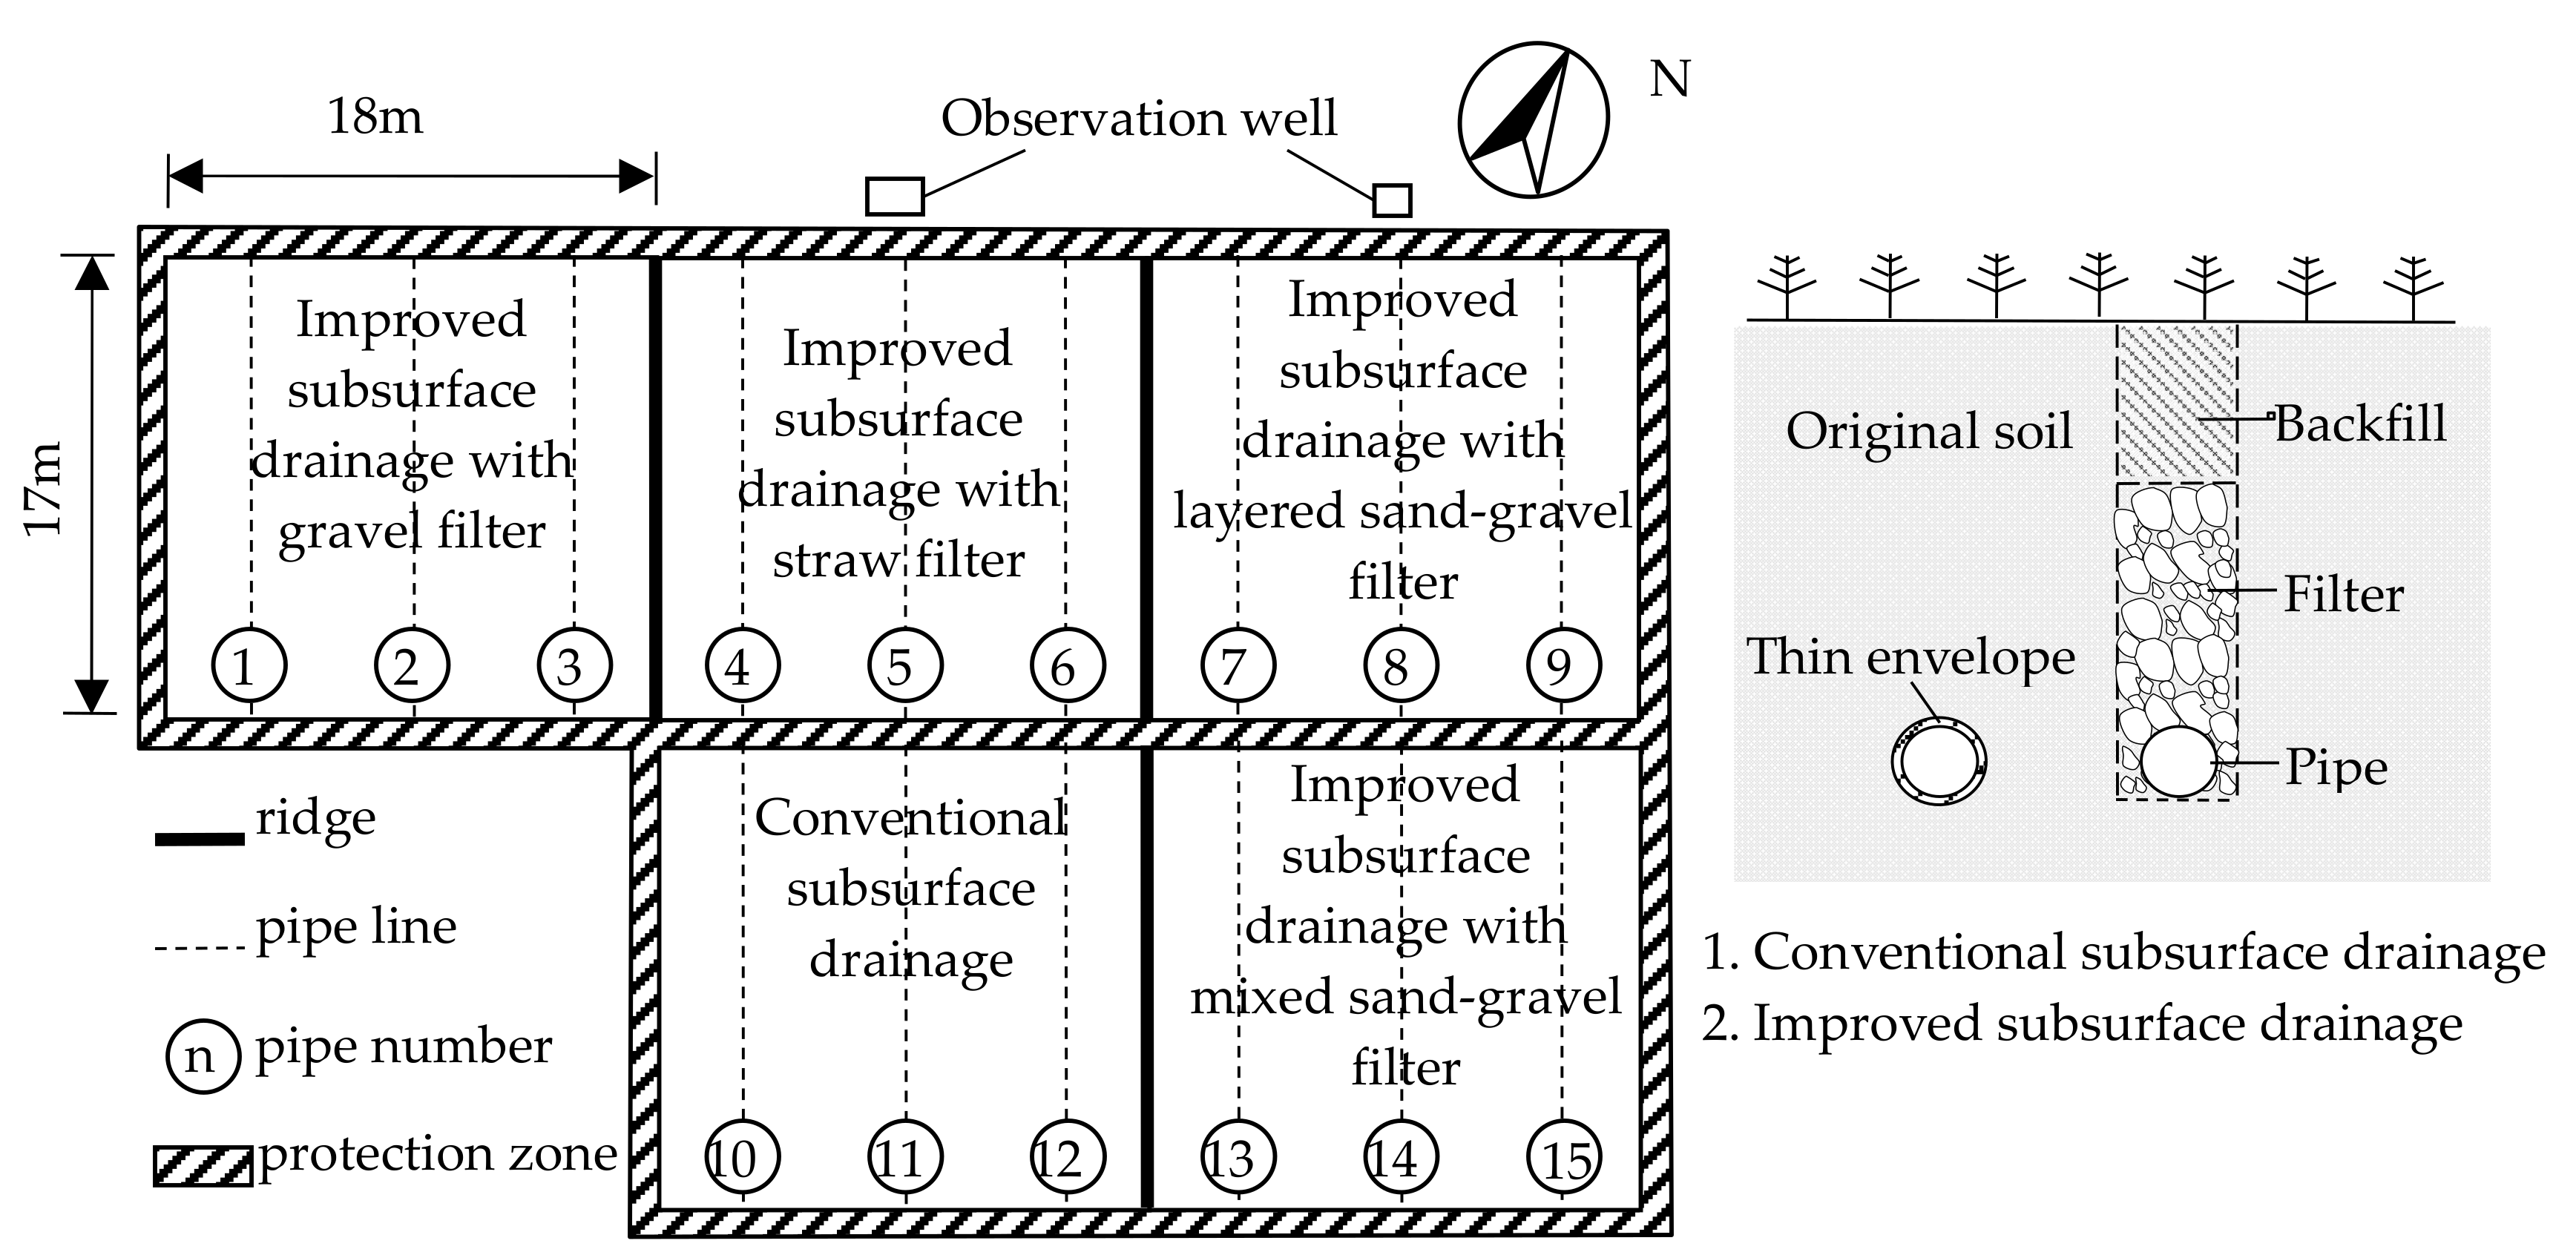
Field experiments were conducted at Xinmaqiao experiment station in Huaibei plain, China (117°22′ E, 33°09′ N) from 2016 to 2018. Five plots of conventional subsurface drainage, improved subsurface drainage with gravel filter, layered sand-gravel filter, mixed sand-gravel filter, and straw filter were set. Each plot contained three 75 mm diameter pipe drains. Drains were installed at 0.7625 m depth and 6 m spacing. Filter width and height of the improved subsurface drainage were 0.4 m and 0.5 m, respectively. For the layered sand-gravel filter, thickness of the upper fine-particle layer and lower coarse-particle layer were 0.2 m and 0.3 m. The drain outflows from each plot flowed directly into observation wells, shown in Figure 1.
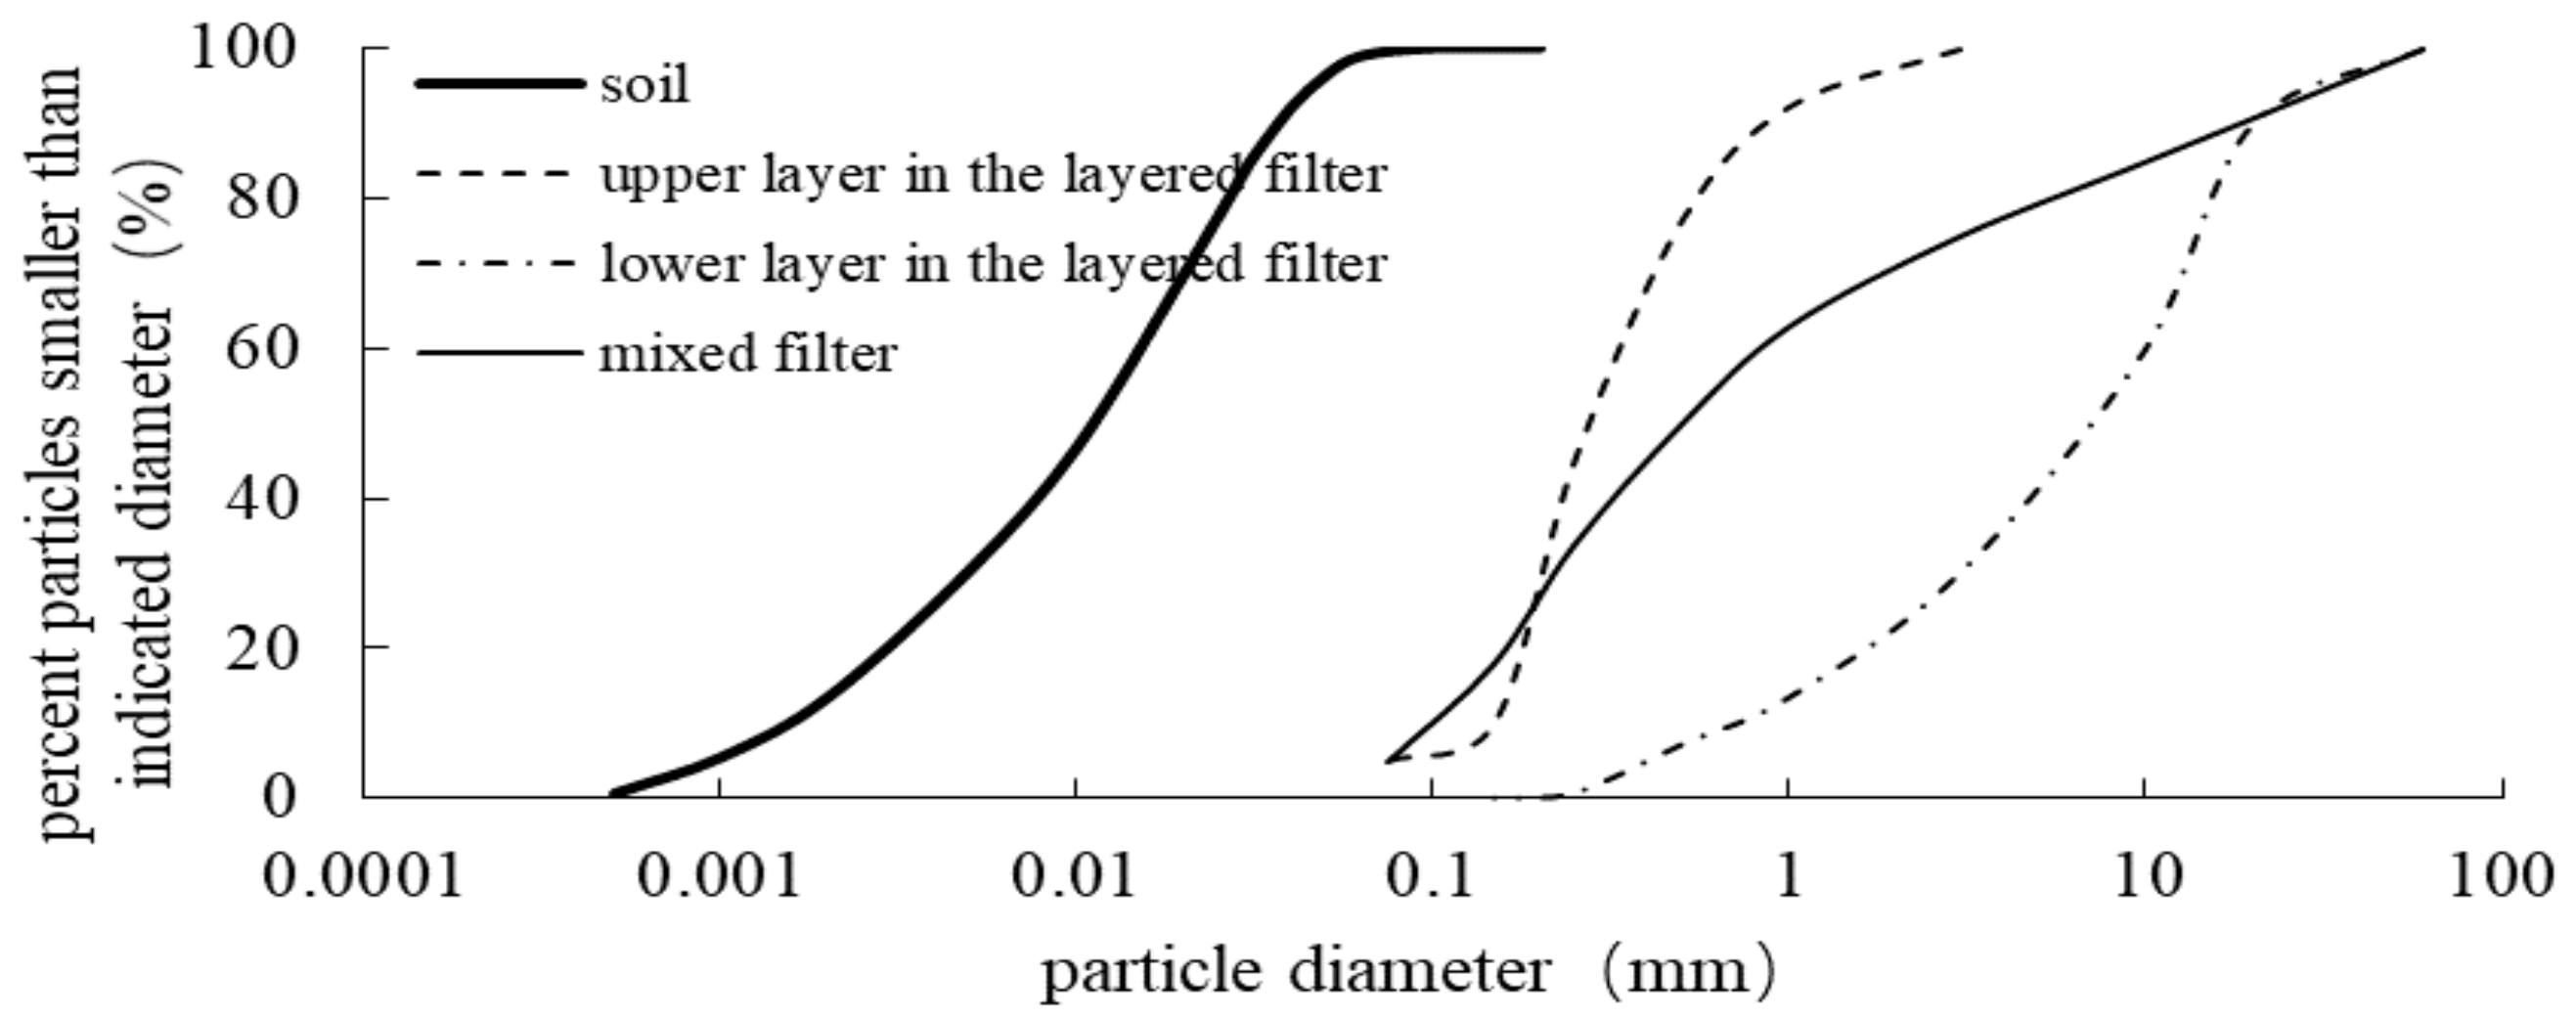
Diameters of the gravel varied from 1 cm to 5 cm and length of the straw was about 5 cm. The layered and mixed sand-gravel filters were mixed artificially based on the criteria of Terzaghi. Particle diameters of the soil and sand-gravel used in different filter were shown in Figure 2.
2.2. The Initial Soil Nitrogen and Phosphorus Contents
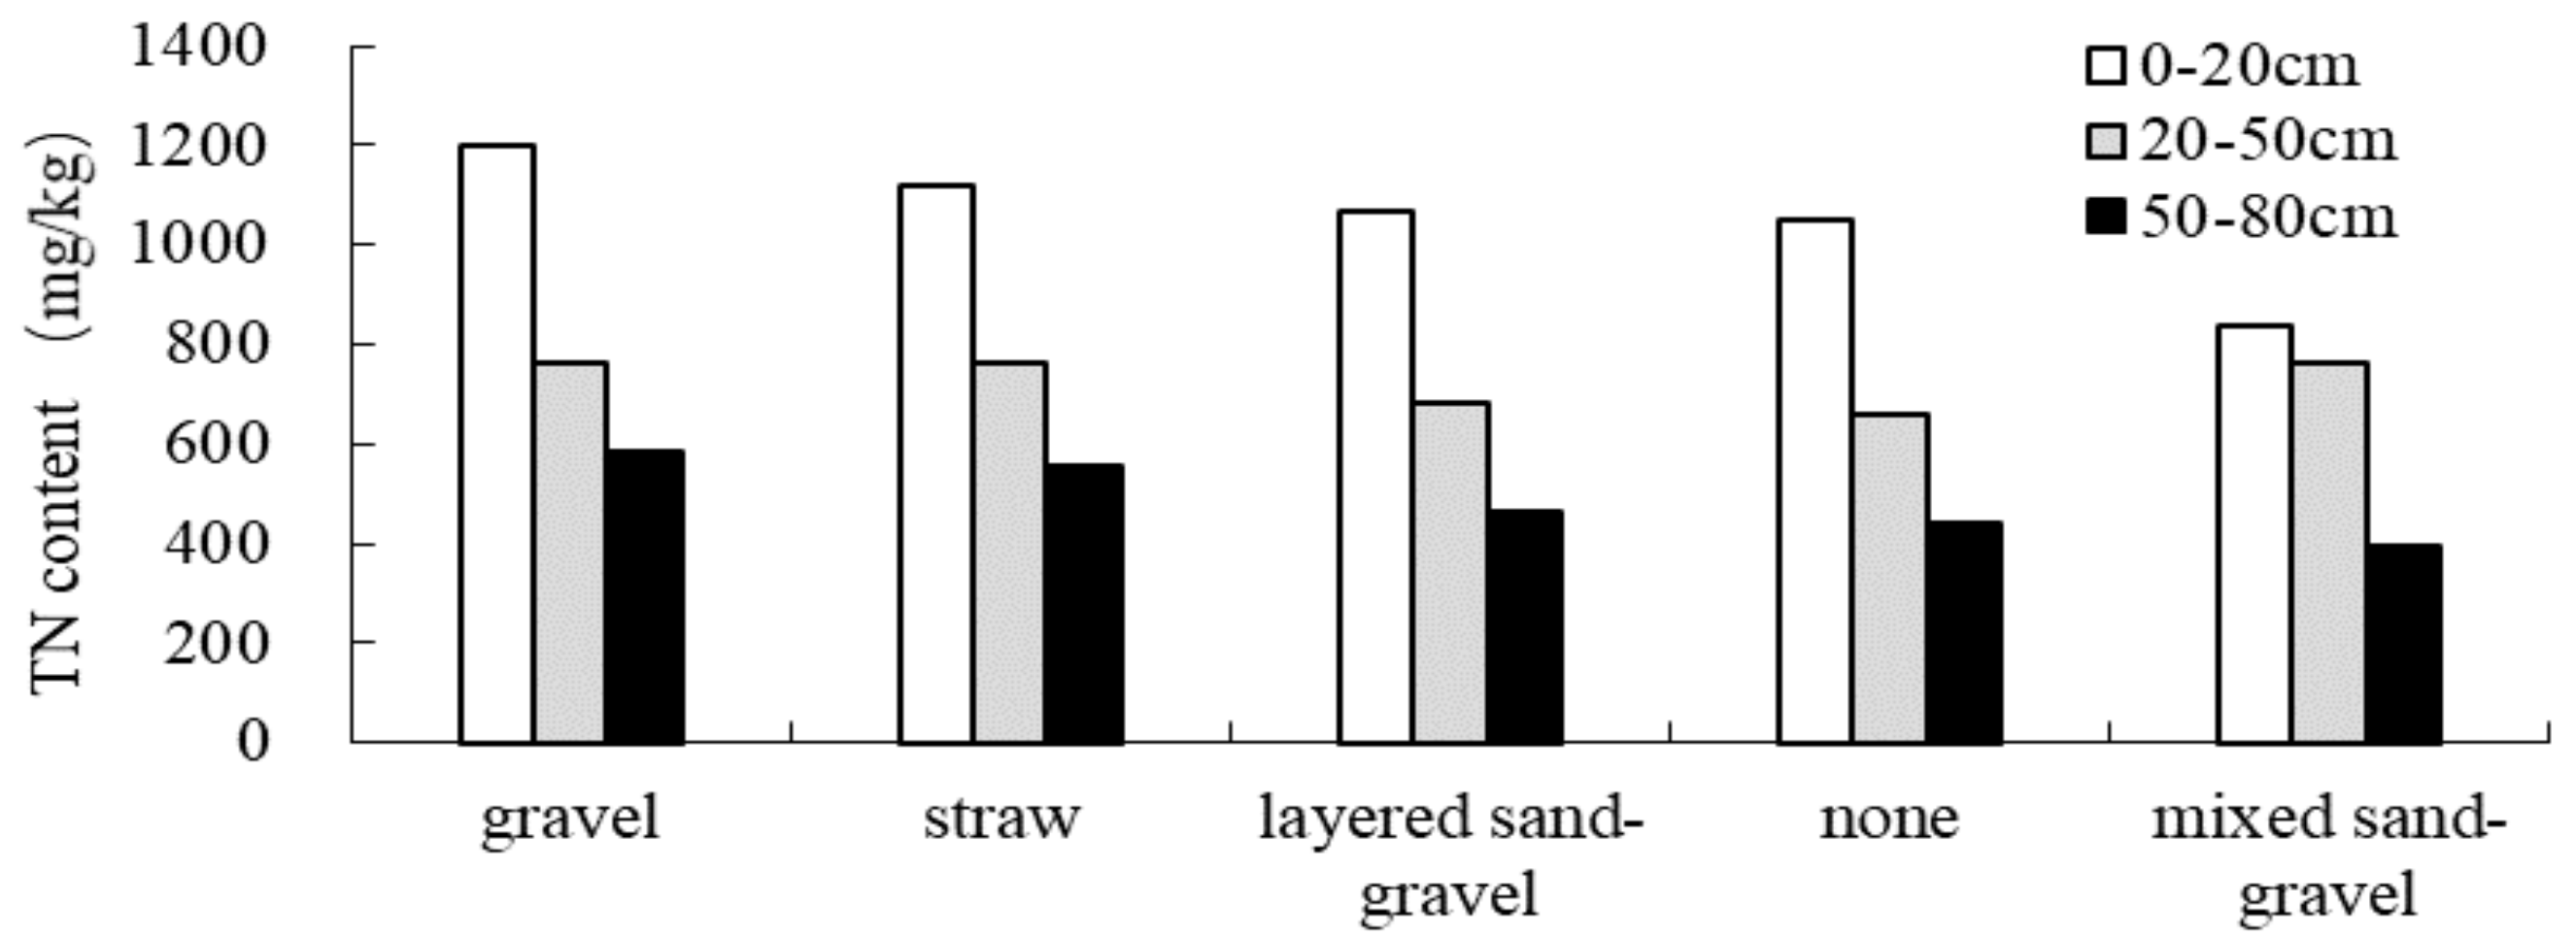
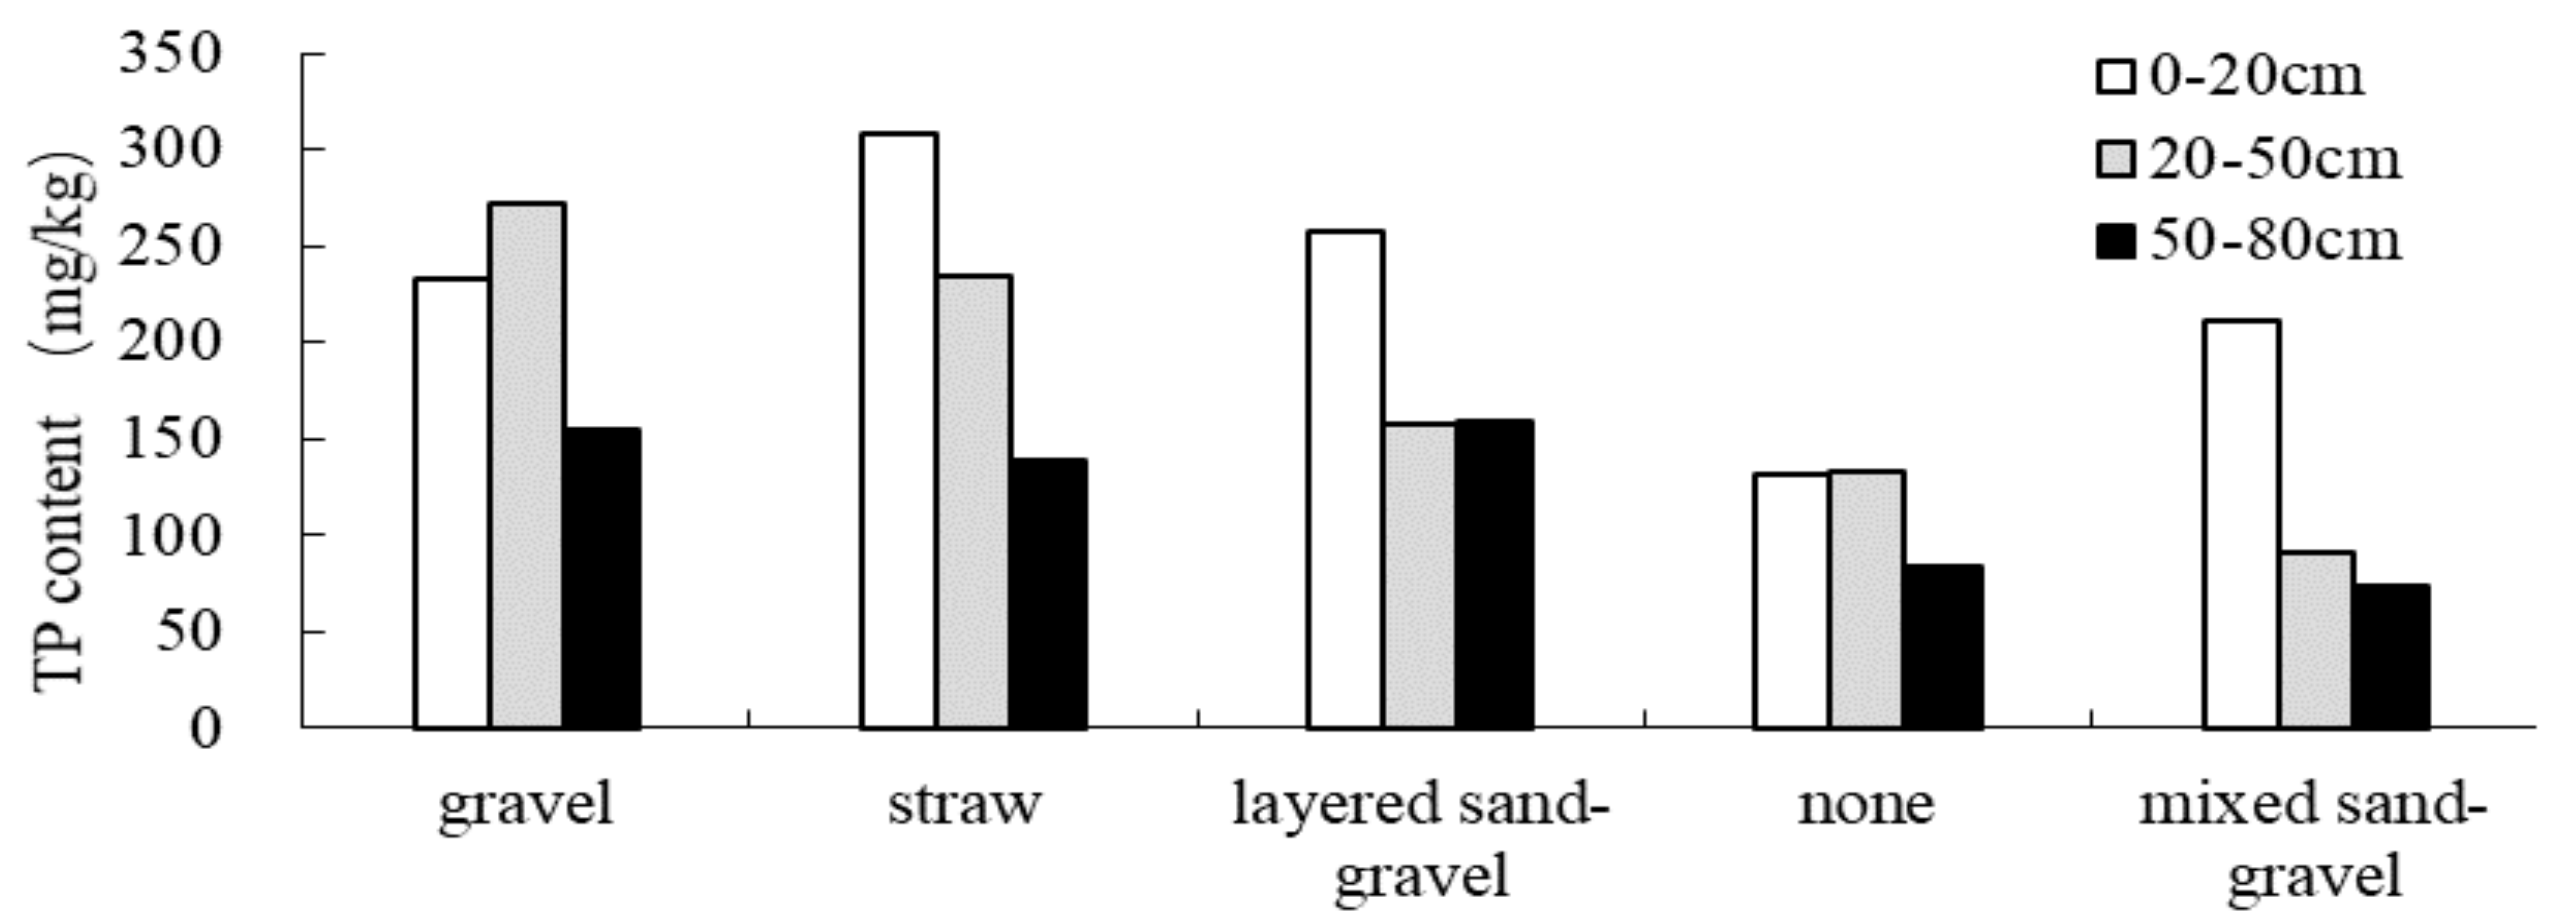
Before the drainage test in 2016, soil nitrogen and phosphorus contents were measured at three depths (0–20 cm, 20–50 cm, 50–80 cm). Five soil sample points were chosen randomly in each plot and the samples at the same depth were mixed into one sample to be tested. Additionally, the agricultural practices such as crop and fertilization and tillage method were the same in the five plots.
From Figure 3 it could be seen that the soil total nitrogen (TN) contents in plots of improved subsurface drainage with gravel, straw, layered sand-gravel filter and the conventional subsurface drainage were roughly equal at the same depth layer respectively, while the TN content at 0–20 cm depth in the mixed sand-gravel improved plot was smaller than that at the same layer in other plots and the TN content at 50–80 cm depth was almost the same as the conventional ones.
For the soil total phosphorus (TP) content (Figure 4), it could be seen that the TP contents were different at 0–20 cm and 20–50 cm depth in the five plots, especially for the 0–20 cm depth layer, while the TP contents at the 50–80 cm depth layer in plots of the improved subsurface drainage with gravel and straw and layered sand-gravel were roughly equal. Additionally, the TP contents in the plot of improved subsurface drainage with mixed sand-gravel were approximately equal to that in the conventional subsurface drainage plot.
2.3. Measuring Method of the Nitrogen and Phosphorus in Outflow
During 2016–2018, six field experiments were carried out and each experiment was observed within one day. The nitrogen and phosphorus concentration of the drain outflow were measured three times with about a 2–4 h interval, shown in Table 1. The pondus hydrogenii value (pH), total nitrogen (TN), ammonium-nitrogen (NH4+-N), nitrate-nitrogen (N03--N), total phosphate (TP), soluble reactive phosphate (SRP) were considered.
The total nitrogen, ammonia nitrogen, nitrate nitrogen, total phosphorous, and soluble reactive phosphate contents in drain outflow were determined by potassium persulfate digestion–UV spectrophotometry, salicylate method, spectrophotometric method for salicylic acid, ammonium molybdate spectrophotometry and Mo–Sb colorimetry respectively. The equipment employed to obtain water samples was an ultraviolet spectrophotometer.
3. Results
3.1. pH
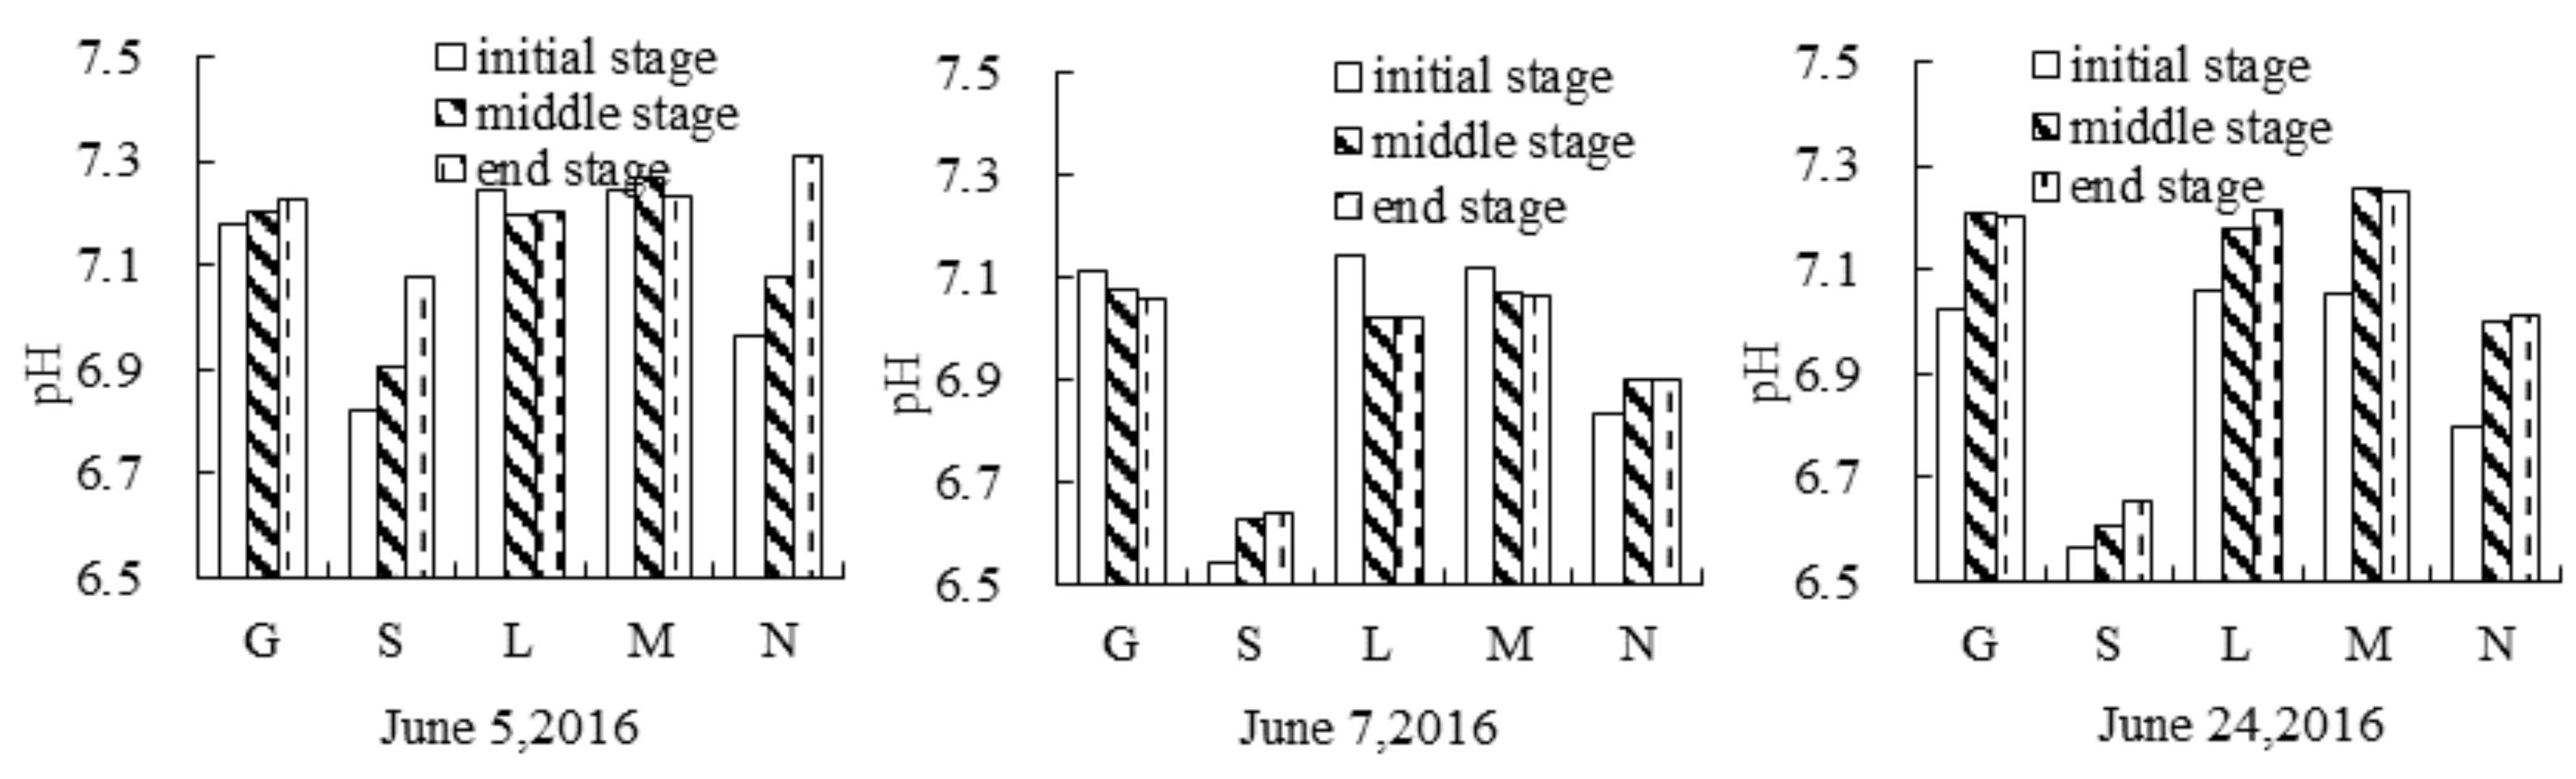
The pH of agriculture drainage, which affects the phosphorus and nitrogen release of the deposit sediment [23] and impacts eutrophication in river and lake, is very important for water environments [24]. Additionally, pH of the outflow can indirectly reflect the pH of the soil which will influence the migration and transformation of phosphorus and nitrogen in the soil [25]. Figure 5 showed the pH values of the outflow of different subsurface drainage patterns at the initial, middle and end stage of the test. In Figure 5, G/S/L/M/N stood for improved subsurface drainage with gravel filter, straw filter, layered sand-gravel filter, mixed sand-gravel filter and no filter (conventional subsurface drainage) respectively. From Figure 5, we could see that the pH values of all outflows varied from 6.5 to 7.4 which satisfied the requirement of Chinese National Environmental Standard for Surface Water Quality. Compared with conventional subsurface drainage, the pH values of the outflow under the improved subsurface drainage with gravel, layered sand-gravel, mixed sand-gravel filter were a little larger. While for the improved subsurface drainage with straw, the pH value of the outflow was obviously lower than the conventional ones which indicated that the straw filter could lower the pH of the soil. The straw was decomposed to generate the humic acid and organic acid in the soil [26].
3.2. Total Nitrogen
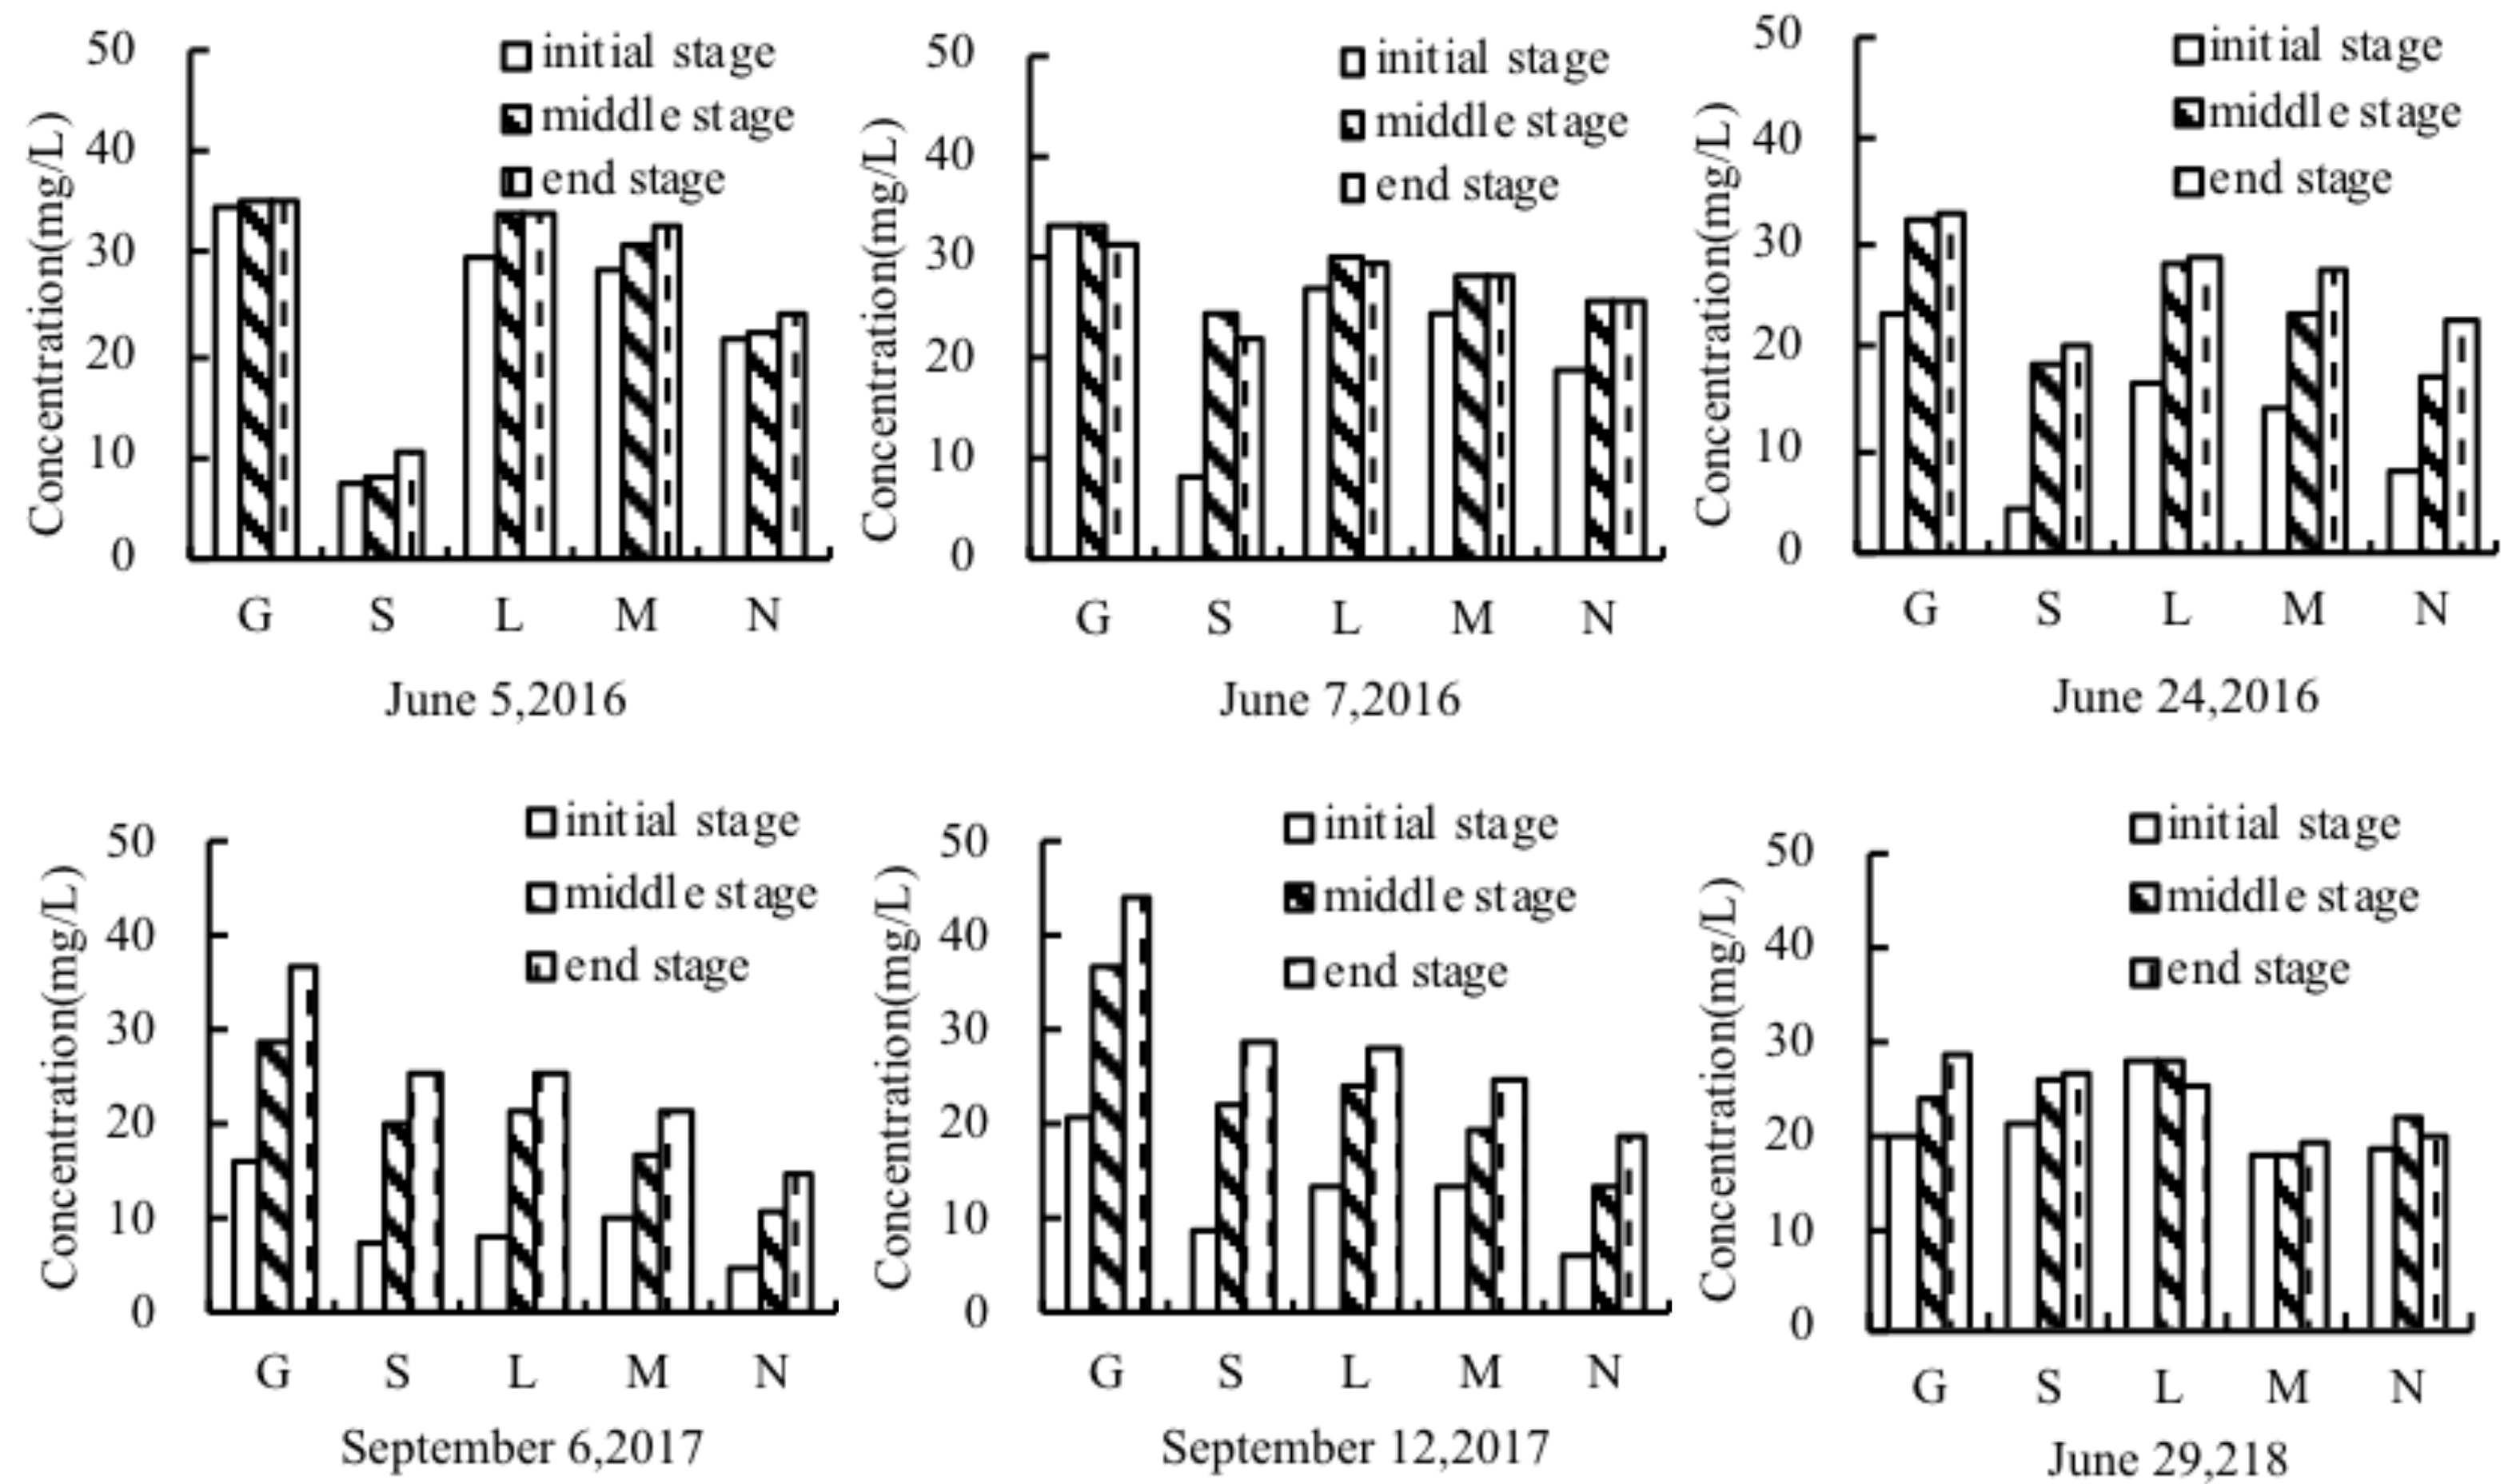
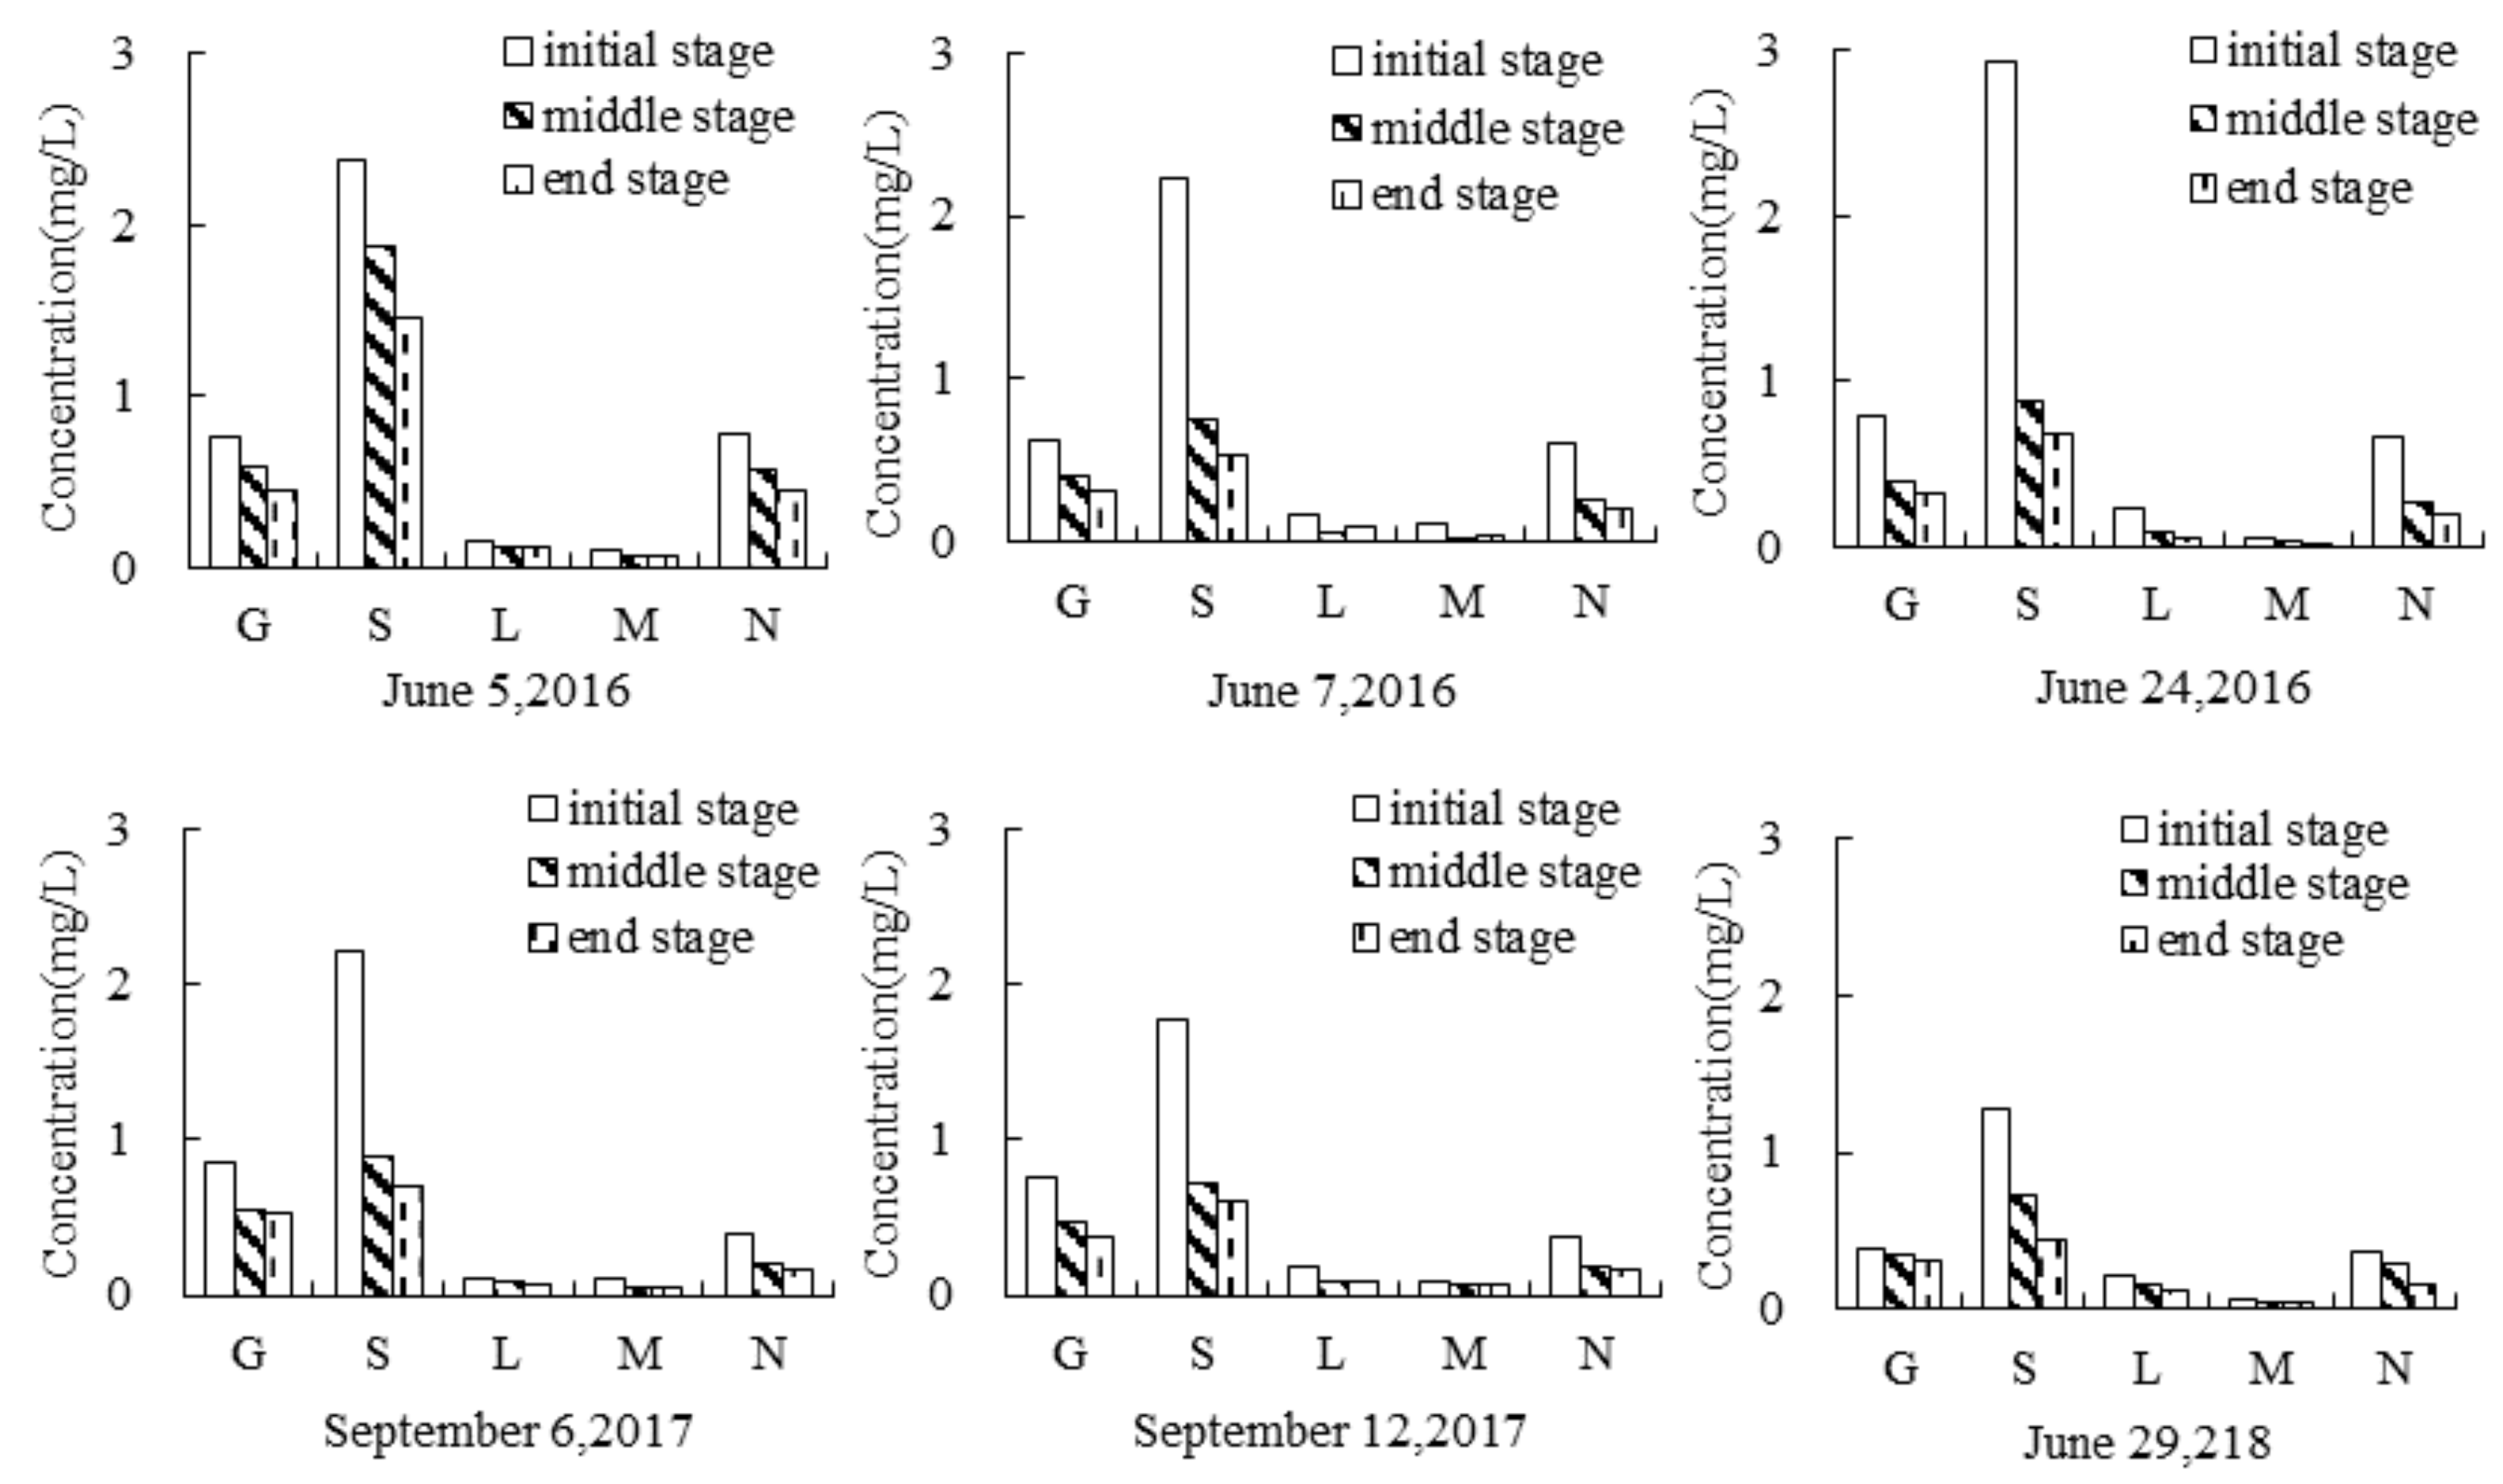
Variation tendency of total nitrogen concentrations of the outflow at initial, middle and end stage were the same for conventional subsurface drainage and improved subsurface drainage. The total nitrogen concentrations of the outflow at initial, middle and end stage were absent of clear rules. From Figure 6, we also could see that total nitrogen concentrations of the outflow under improved subsurface drainage with gravel filter, layered sand-gravel filter and mixed sand-gravel filter were larger than that under conventional subsurface drainage, respectively about 39%–78%, 24%–49% and 14%–34% more in 2016, 160%–163%, 68%–80%, 48%–58% more in 2017, and 20%, 32%, −7% more in 2018. Generally speaking, the total nitrogen concentrations of the outflow under the improved subsurface drainage with gravel filter, layered sand-gravel filter, and mixed sand-gravel decreased in turn. However, compared with conventional subsurface drainage, total nitrogen concentrations of improved subsurface drainage with straw filter outflow were 62%, 23%, and 15% less on June 5, June 7, and 24 June 2016, and 76% and 54% more on 6 September and 12 September 2017, and 21% more on 29 June 2018.
3.3. Ammonia Nitrogen
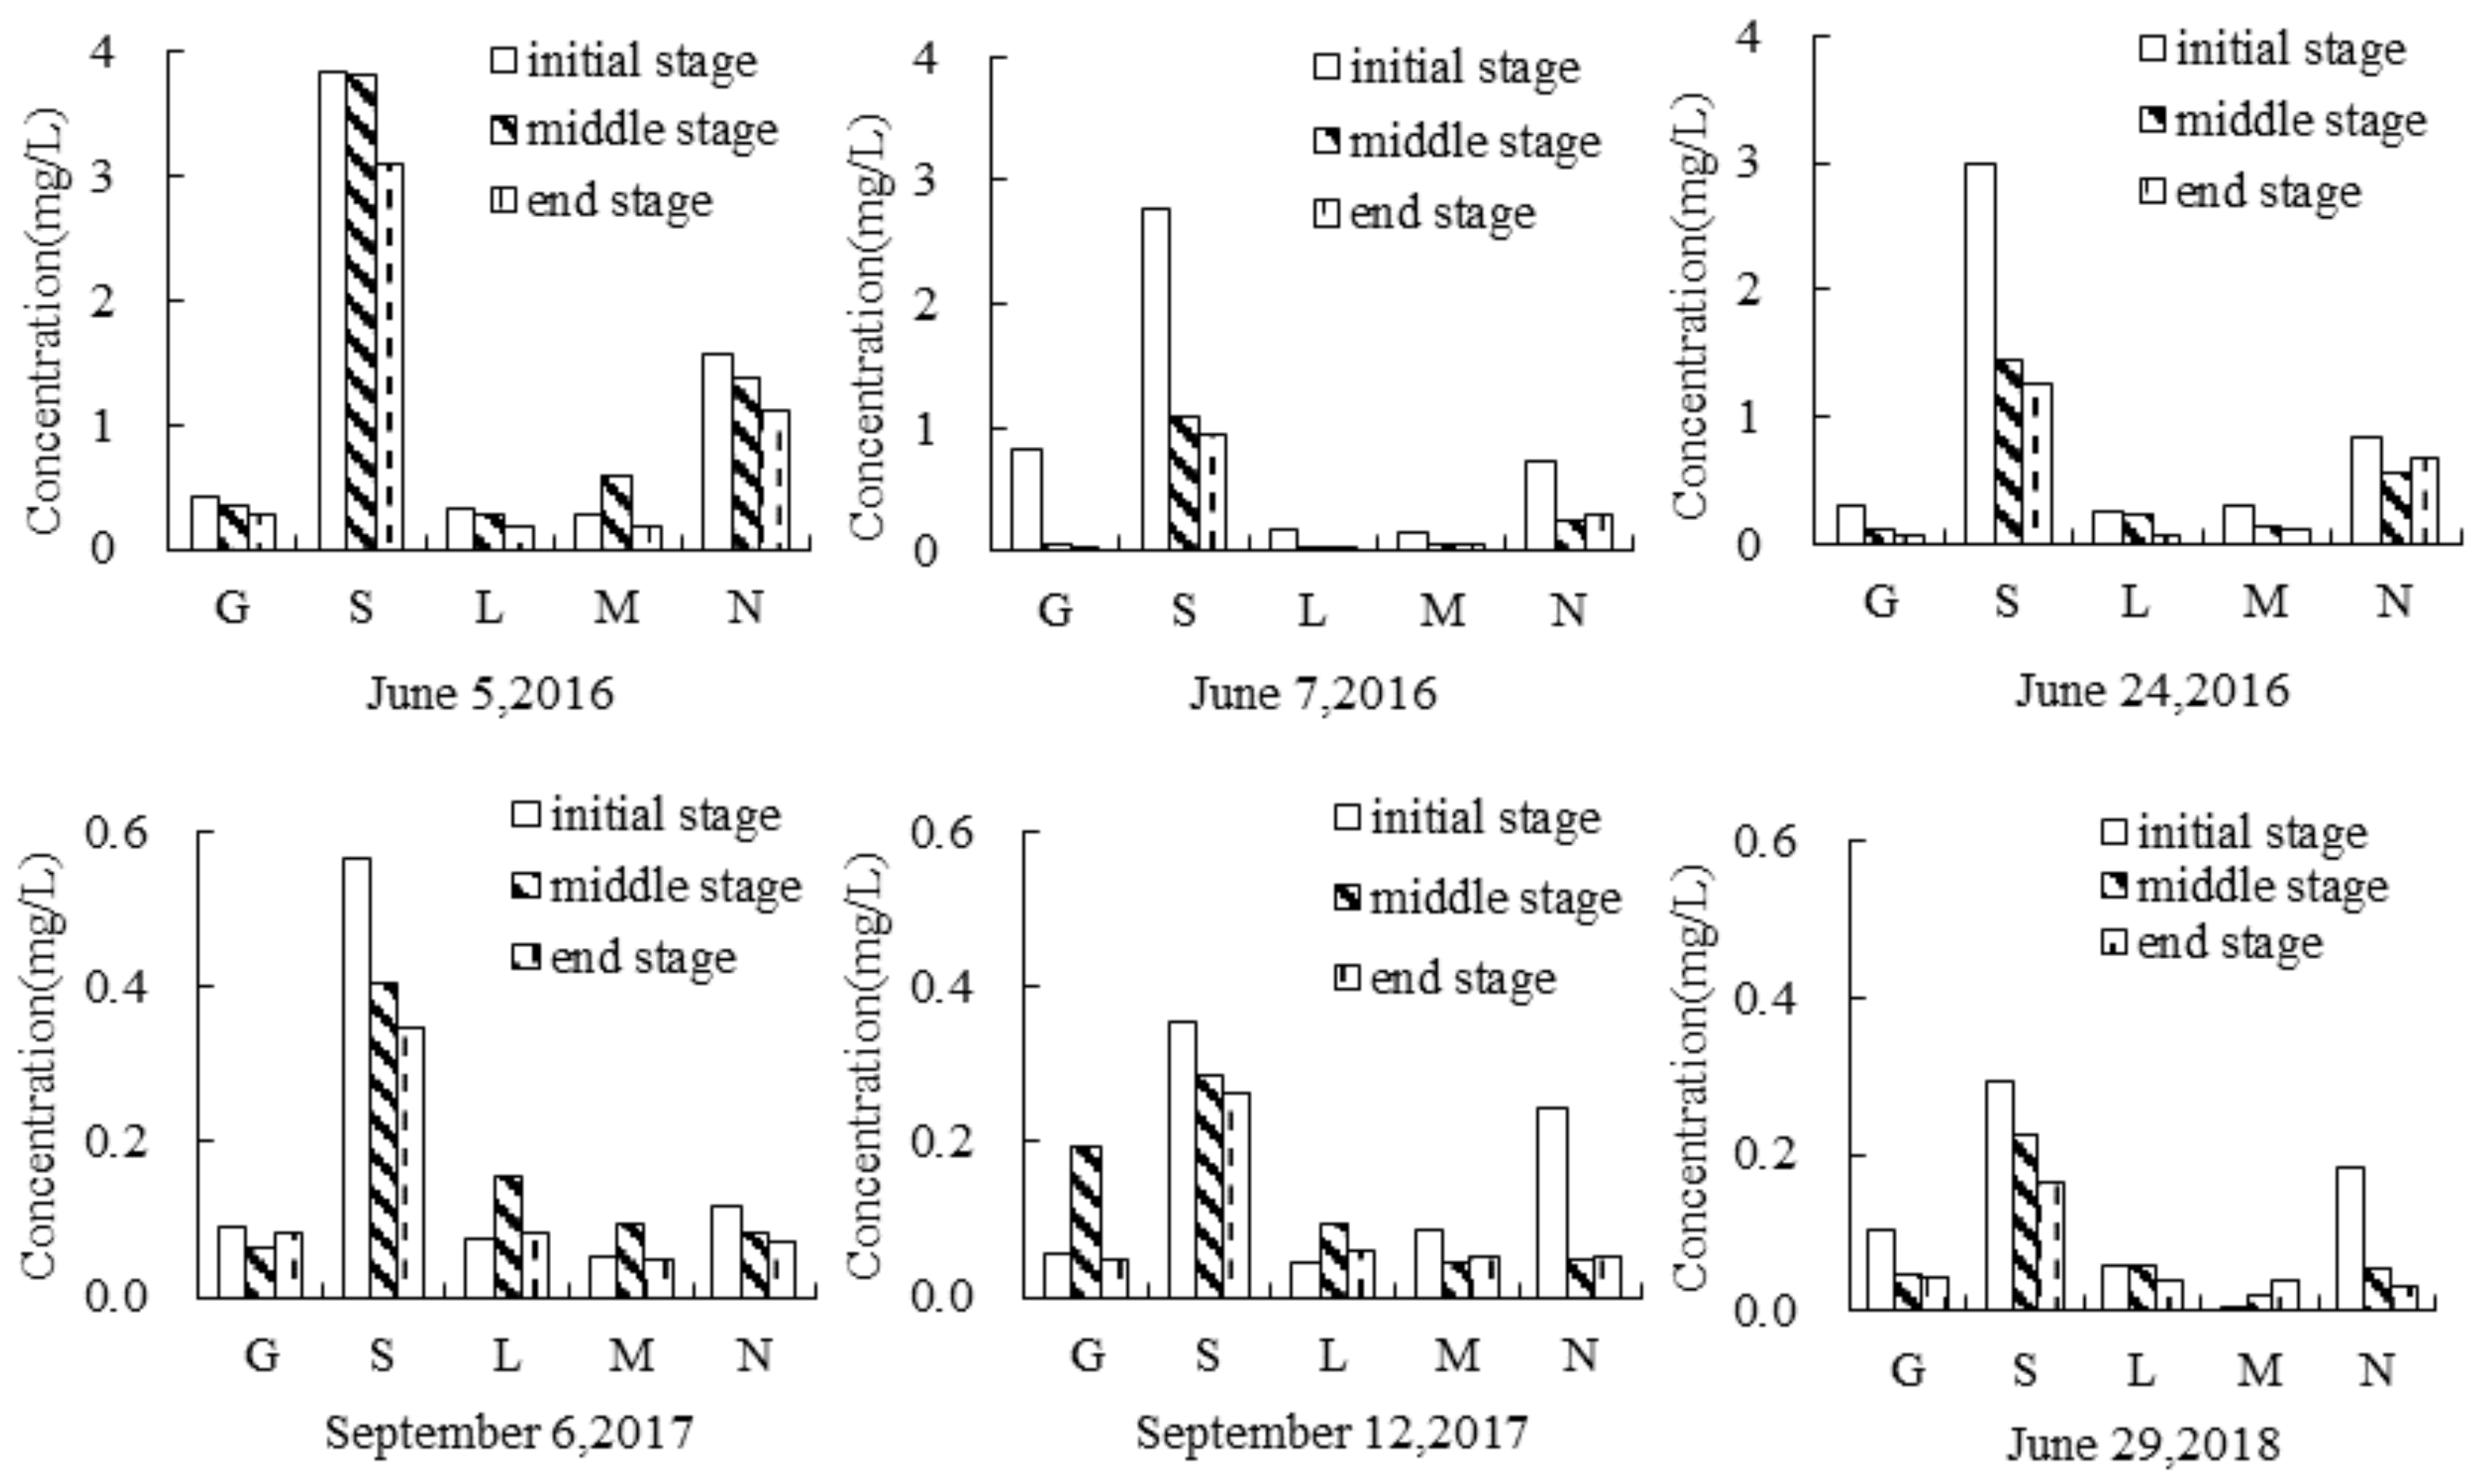
For conventional subsurface drainage, the ammonia nitrogen concentrations of outflow at initial, middle and end stage were respectively 1.57 mg/L, 1.38 mg/L and 1.10 mg/L at 5 June 2016, 0.116 mg/L, 0.084 mg/L and 0.072 mg/L at 6 September 2017, and 0.184 mg/L, 0.054 mg/L and 0.031 mg/L at 29 June 2018. The ammonia nitrogen concentrations of outflow at initial, middle and end stage of the test presented a decrease tendency (Figure 7). The reasons for this might be that the previous accumulation of the soil ammonium nitrogen around the pipe made the ammonia nitrogen concentration of the outflow large at initial stage and the ammonium nitrogen obtained by nitrogen mineralization was not enough to replace the loss of ammonium nitrogen within a short time. Hence, the ammonia nitrogen concentrations in 5 June and 7 June 2016 presented a decreasing tendency with average concentrations of 1.35 mg/L and 0.42 mg/L. Then with the temperature rising, the increasing nitrogen mineralization would produce more ammonia nitrogen [27], which might cause the phenomenon that ammonia nitrogen concentration of the outflow at 24 June 2016 was larger than that at 7 June 2016. Additionally, the ammonia nitrogen concentrations of the outflow in 2016, 2017 and 2018 reduced successively with about 1.35 mg/L, 0.091 mg/L and 0.09 mg/L on average respectively under conventional subsurface drainage (Figure 7). We could draw the conclusion that the ammonia nitrogen concentrations of the soil presented a decreasing tendency based on the background of the same agricultural practices which include crop species, fertilization usage and tillage method in these three years.
The improved subsurface drainage with different filter materials presented distinctive characteristics of ammonium nitrogen loss. Generally speaking, ammonium nitrogen concentrations of the outflow under the improved subsurface drainage with gravel filter, layered sand-gravel filter and mixed sand-gravel filter were smaller than that under conventional subsurface drainage, respectively about 60%, 78% and 76% less in 2016, 13%, 13%, and 30% less in 2017, and 30%, 43%, and 78% less in 2018. Two reasons might lead this case. Firstly, the organic nitrogen contents in sand and gravel were much less than that in the soil [28]. Hence, the ammonium nitrogen produced by nitrogen mineralization in sand and gravel were smaller than the soil, which would make the ammonium nitrogen amount around the pipe less than the conventional condition. Secondly, gas permeability of the soil under improved subsurface drainage was better than that under conventional subsurface drainage, which could increase soil nitrification rate and then decrease the soil ammonium nitrogen content.
Meanwhile, the improved subsurface drainage with straw filter presented an opposite conclusion that the ammonium nitrogen concentrations of the outflow were larger than the conventional subsurface drainage case. In 2016, ammonium nitrogen concentrations with straw filter were on average about 207% larger than that under conventional subsurface drainage. Correspondingly, the increasing percentage in 2017 and 2018 were 274% and 152% respectively. Decomposition of the straw could promote microbial activity which would increase the soil ammonium nitrogen content [29] and release of heat, which could reduce the ammonia nitrogen adsorption ability of the soil and make more ammonia nitrogen leach out. Furthermore, for the whole improved subsurface drainage patterns, the ammonia nitrogen concentrations of the outflow at initial, middle and end stage of the test also reduced in turn.
3.4. Nitrate Nitrogen
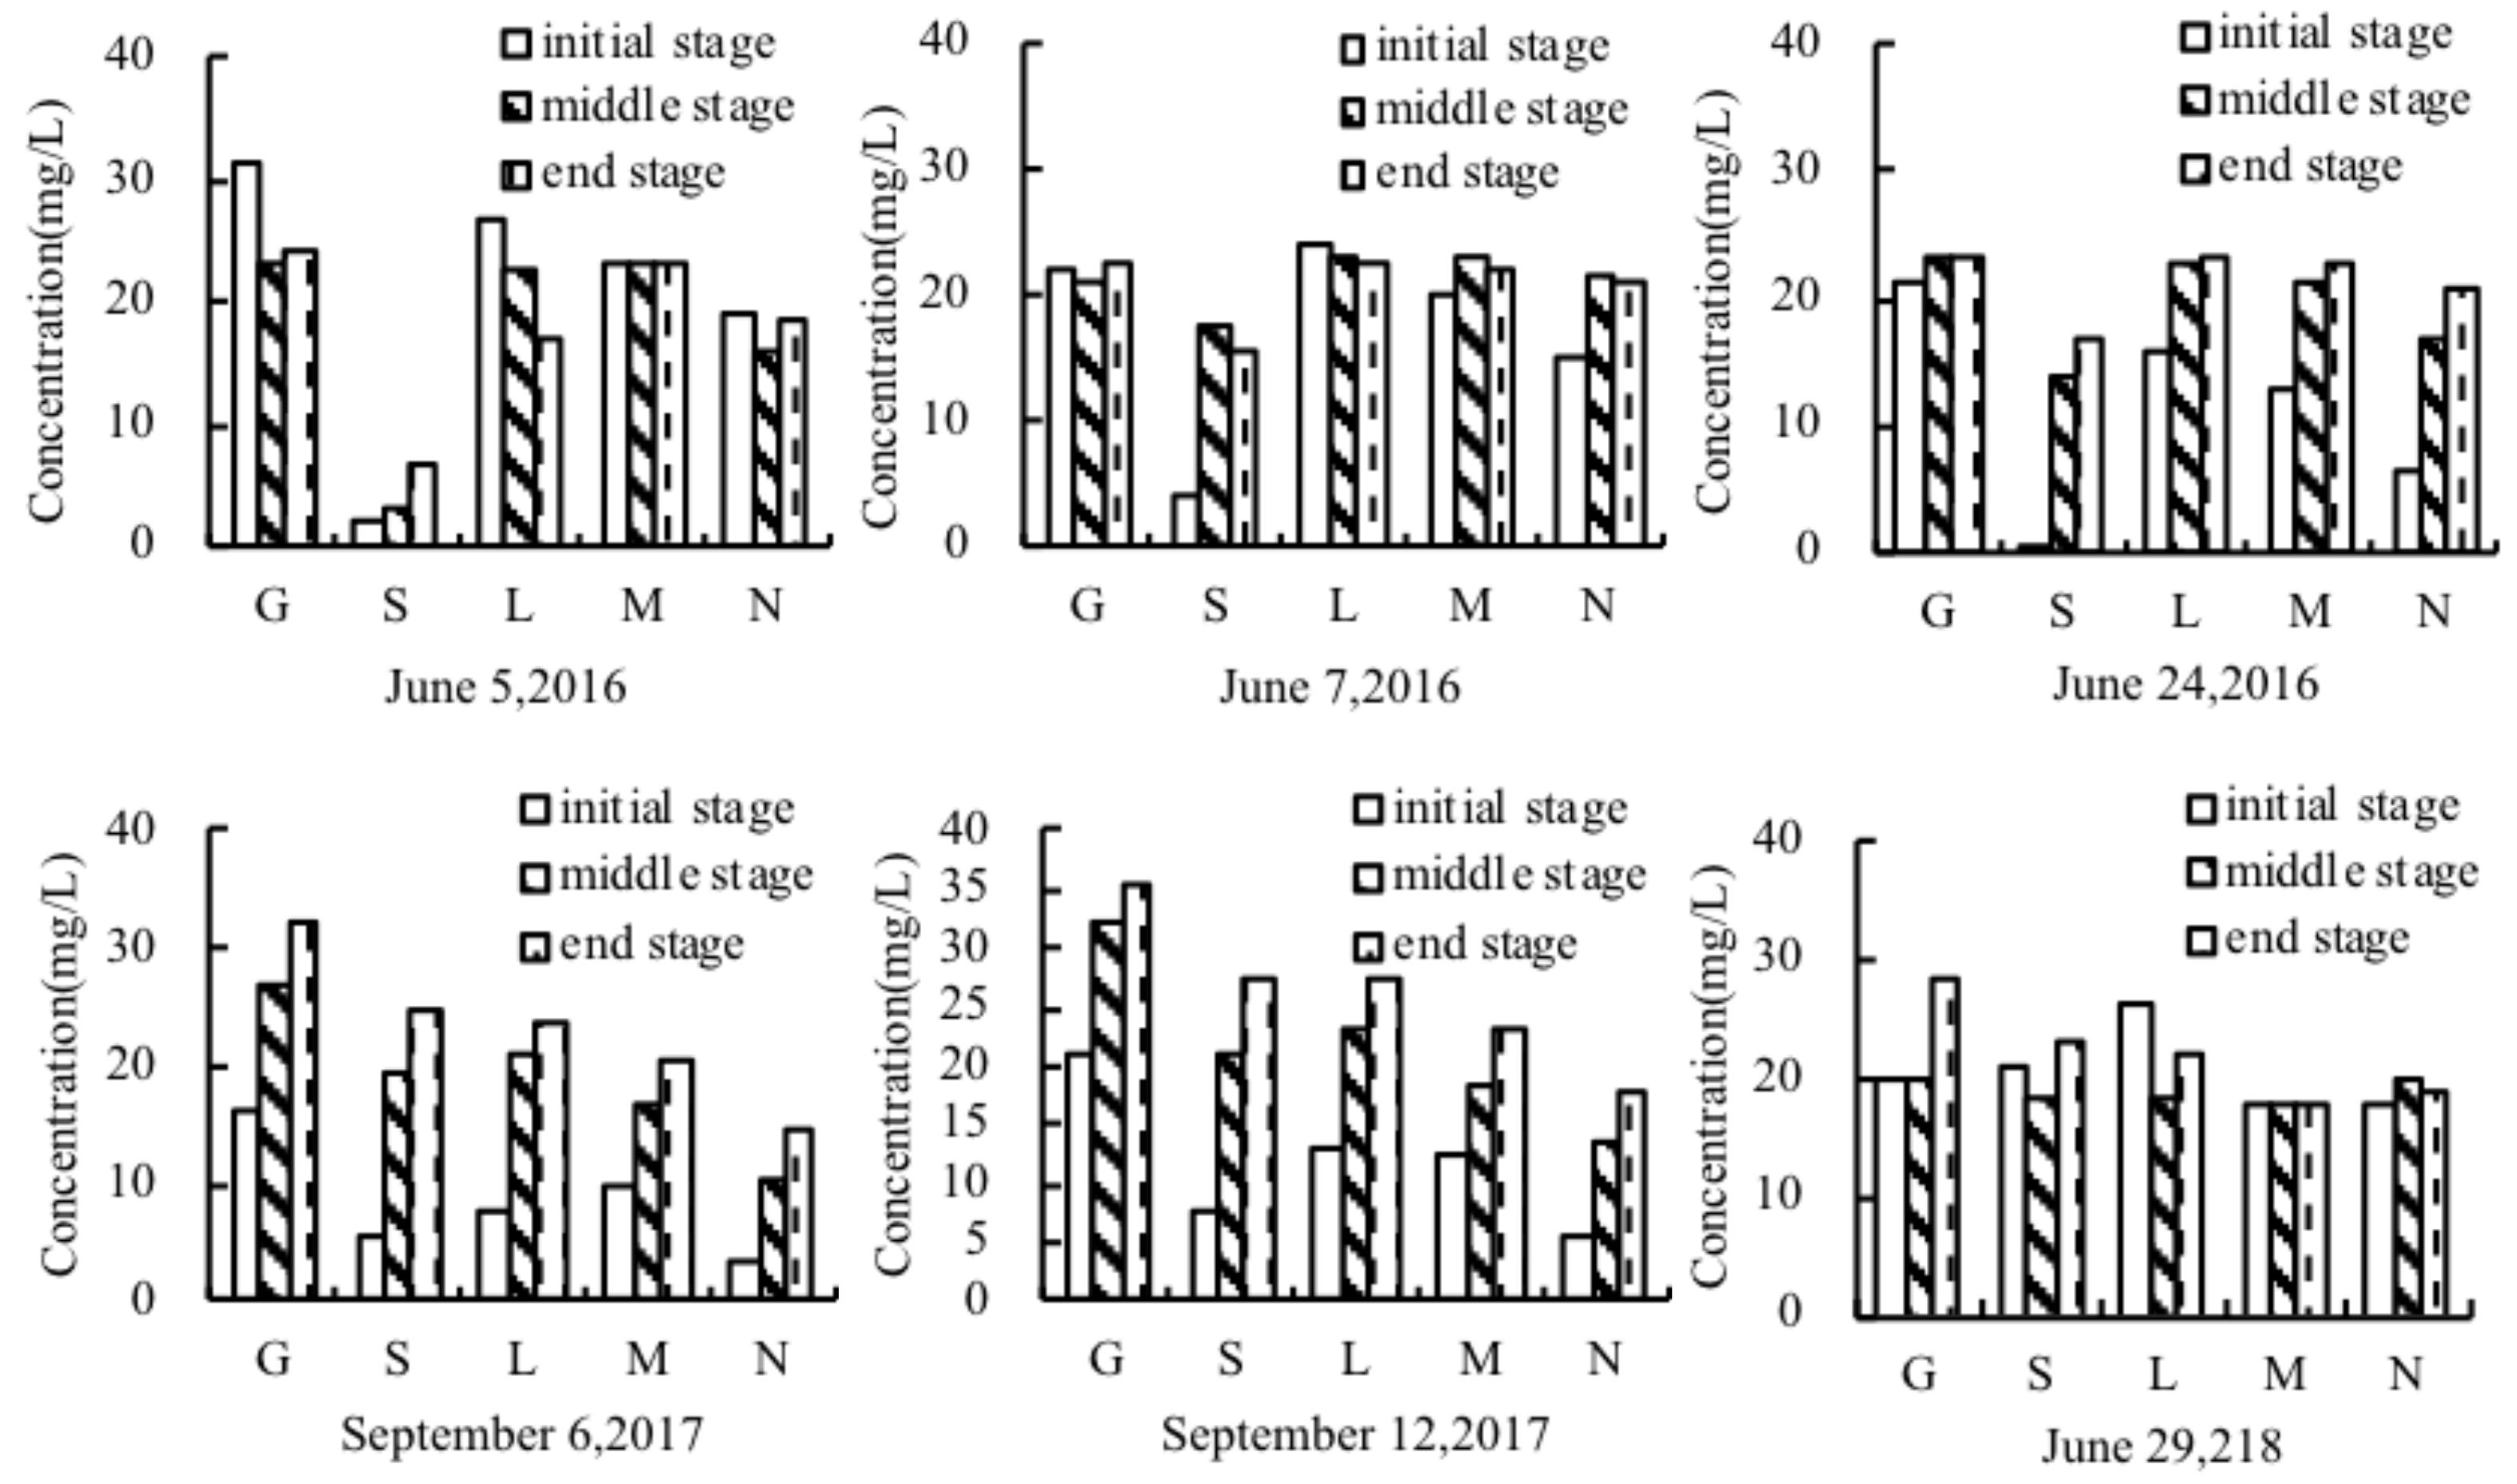
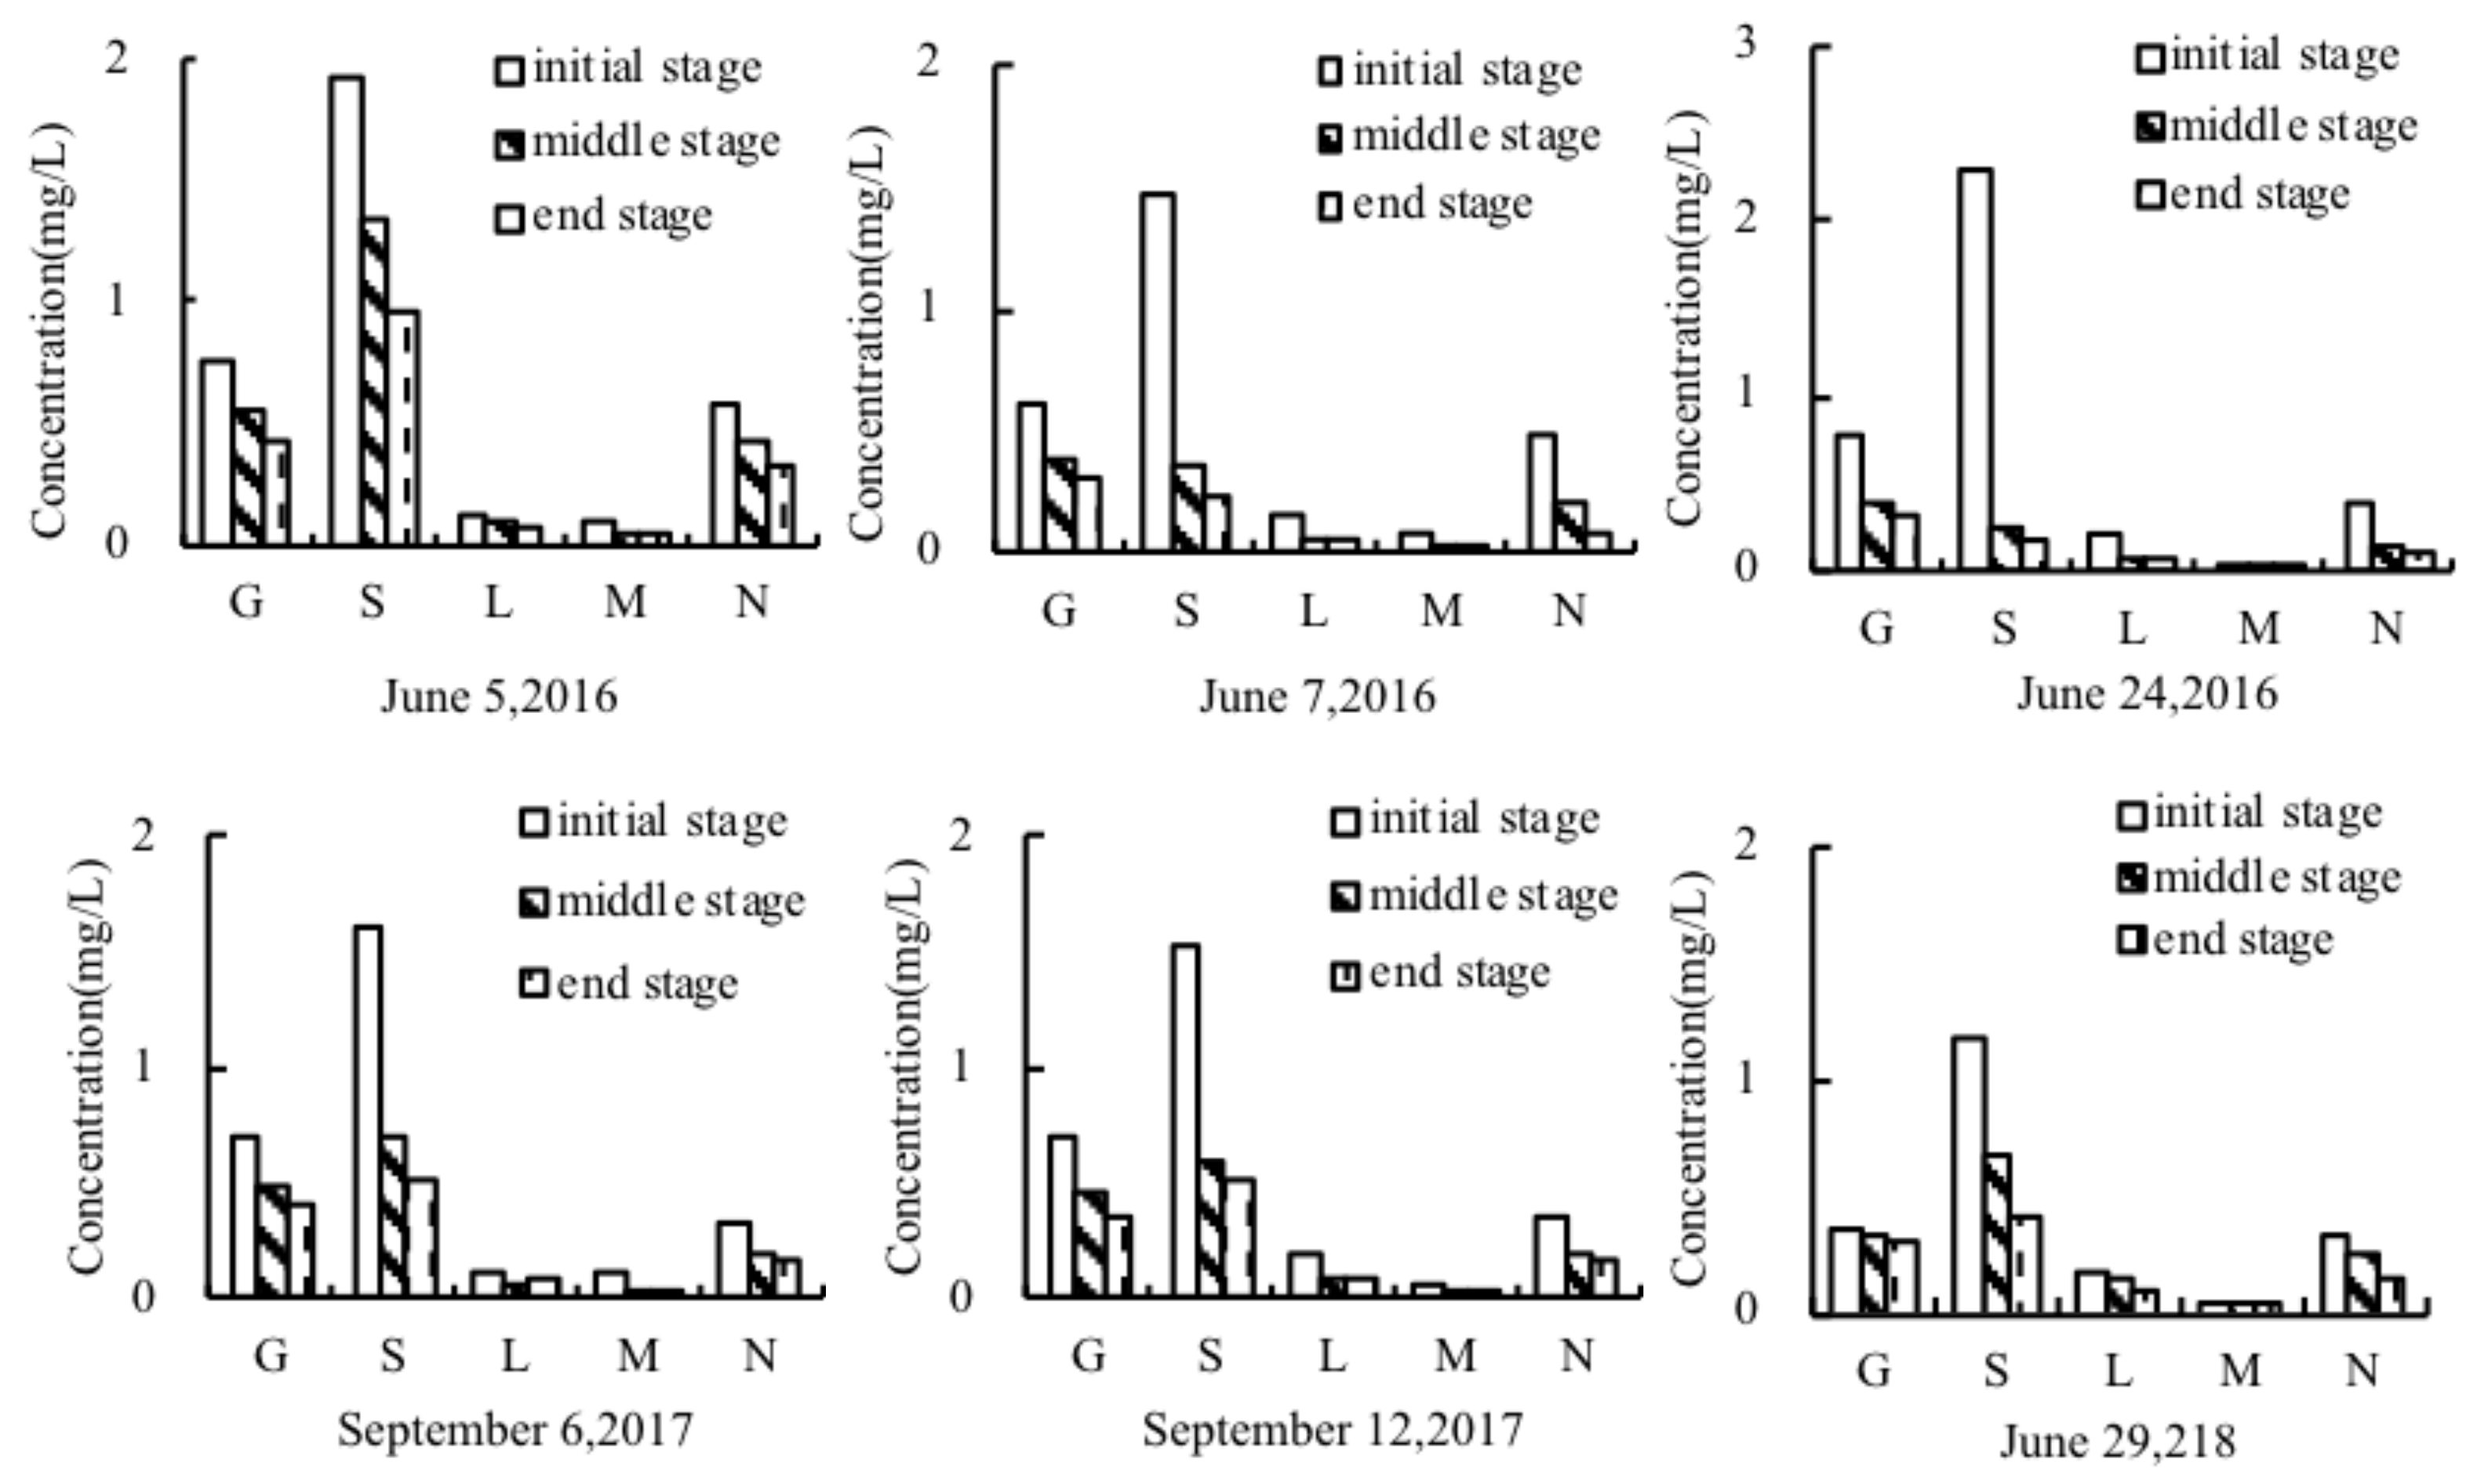
The variation tendency of nitrate nitrogen concentrations of the outflow at initial, middle and end stage were absent of clear rules for both conventional subsurface drainage and improved subsurface drainage, which was almost same as the total nitrogen (Figure 8). In all subsurface drainage outflows, the proportions of nitrate nitrogen concentrations in total nitrogen were more than 60%, except for the tests under the improved subsurface drainage in 5 June and 7 June 2016. The nitrate nitrogen concentrations at initial, middle and end stage decreased in 5 June 2016, and increased in 24 June 2016, 6 September 2017 and 12 September 2017. The mobility of nitrate nitrogen leads more nitrate nitrogen down to the pipe by rainfall. When the replenished nitrate nitrogen amount around the pipe is larger than the loss through subsurface drainage, the nitrate nitrogen concentrations at initial, middle and end stage would increase. Otherwise, the nitrate nitrogen concentrations at initial, middle and end stage would decrease.
From Figure 8, we also could see that nitrate nitrogen concentrations of the outflow under improved subsurface drainage with gravel filter, layered sand-gravel filter and mixed sand-gravel filter were larger than that under conventional subsurface drainage. In 2016, the average nitrate nitrogen concentrations under improved subsurface drainage with gravel filter, layered sand-gravel filter and mixed sand-gravel filter were about 14%–55%, 21%–41% and 12%–29% larger than that under conventional subsurface drainage. Correspondingly, the increased percentages were 140%–169%, 71%–96%, and 47%–70% in 2017, and 21%, 18%, and 5% in 2018 respectively. That many rainfall events had happened before tests in 2017, making the soil nitrate nitrogen move from upper layer down into the filter, was the main reason for the larger nitrate nitrogen concentrations. Other reasons might be as follows: (i) compared with conventional subsurface drainage, the improved subsurface drainage might improve the gas permeability of soil and strength the nitrification rate which would increase the soil nitrate nitrogen concentration; (ii) larger discharge of the improved subsurface drainage would make a larger driving force for the transfer of nitrate nitrogen. Additionally, the nitrate nitrogen concentrations of the outflow under the improved subsurface drainage with gravel filter, layered sand-gravel filter, and mixed sand-gravel were in descending order.
Meanwhile, for improved subsurface drainage with straw filter, compared with conventional subsurface drainage, nitrate nitrogen concentrations percentage of the outflow were respectively 78%, 36%, and 28% less at 5, 7, and 24 June 2016, 77% and 52% more at 6 and 12 September 2017 and 9% more at 29 June 2018. It could be seen that nitrate nitrogen concentrations under improved subsurface drainage with straw filter were smaller in the early stage of maize growth period and larger in the end of maize growth period than that under conventional subsurface drainage. The increased nitrate nitrogen concentrations percentage of improved subsurface drainage with straw filter outflow almost increased during the maize growth period. The reasons for this might be that straw decomposition consumed oxygen which would inhibit nitrification to reduce the nitrate nitrogen content and would make high soil microorganisms’ metabolism consume the nitrogen in the early growth period [30]. The amount of microorganisms would reduce in the end of growth period [31].
3.5. Total Phosphate
Total phosphate concentrations of the outflow at initial, middle and end stage decreased gradually, which was same as the variation tendency of ammonia nitrogen for both conventional subsurface drainage and improved subsurface drainage (Figure 9). The average total phosphate concentrations in the outflow under conventional subsurface drainage were 0.44 mg/L, 0.23 mg/L and 0.35 mg/L in 2016, 2017 and 2018. The average total phosphate concentrations of outflow under the improved subsurface drainage with layered sand-gravel filter and mixed sand-gravel filter were about 40%–79% and 68%–88% less than that under conventional subsurface drainage. Meanwhile, the average total phosphate concentrations under the improved subsurface drainage with gravel filter and straw filter were about 0–134% and 103%–400% more than that under conventional subsurface drainage.
3.6. Soluble Reactive Phosphate
Variation tendency of the soluble reactive phosphate concentrations of the outflow at initial, middle and end stage for conventional subsurface drainage and improved subsurface drainage were almost the same as the total phosphate (Figure 10). In the outflow, proportions of the soluble reactive phosphate concentrations in total phosphate concentrations were always more than 60%, which meant that the soluble reactive phosphate was the main form of the phosphate loss under subsurface drainage. Taking conventional subsurface drainage as example, soluble reactive phosphate concentrations of the outflow at initial, middle and end stage were 0.59 mg/L, 0.42 mg/L and 0.34 mg/L at 5 June 2016, 0.33 mg/L, 0.19 mg/L and 0.16 mg/L at 6 September 2017, and 0.32 mg/L, 0.24 mg/L and 0.15 mg/L at 29 June 2018, respectively. The reason might be that the migration of soluble reactive phosphate was slow, which was not enough to replenish the amount of soluble reactive phosphate drained out by the pipe.
In order to better describe the different effects of conventional subsurface drainage and improved subsurface drainage, average soluble reactive phosphate concentrations at initial, middle and end stage were compared. Generally speaking, soluble reactive phosphate concentrations of the outflow under improved subsurface drainage with layered sand-gravel filter and mixed sand-gravel filter, gravel filter and straw filter were respectively smaller and larger than the conventional subsurface drainage. The soluble reactive phosphate concentrations of outflow under improved subsurface drainage with layered sand-gravel filter and mixed sand-gravel filter were about 63% and 87%, 55% and 75%, and 38% and 84% less than that under conventional subsurface drainage in 2016, 2017 and 2018, respectively. This meant that the layered sand-gravel filter and mixed sand-gravel filter might function better on soluble reactive phosphate adsorption. Meanwhile, the soluble reactive phosphate concentrations with gravel filter and straw filter were about 80% and 240%, 126% and 297%, and 38% and 221% more than that under conventional subsurface drainage in 2016, 2017 and 2018. Larger particle sizes of the gravel filter reduce the adsorption of the soluble reactive phosphate which would lead more soluble reactive phosphate out. At the same time, the soluble reactive phosphate concentrations with straw filter was much larger, because straw decomposition would produce the phosphate and release heat which is bad for the adsorption of soluble reactive phosphate.
4. Discussion
From the above analysis, characteristics of nutrient contents of the improvement subsurface drainage outflow were obviously different. The ammonium nitrogen and total phosphate contents in outflow satisfy the standard of water environmental quality in China which do not need additional measures for pollution reduction except for the case of improved subsurface drainage with straw filter. Higher ammonium nitrogen was produced by improved subsurface drainage with straw filter at the initial stage drainage, which is the best time to do management. Total phosphate content of improved subsurface drainage with straw filter outflow should be a point of focus during the whole drainage process. Additionally, total nitrogen concentrations in the outflow under all subsurface drainage patterns are much larger in the test than the standard of water environmental quality in China. General reasons for this phenomenon are as follows. Firstly, a large amount of fertilizer usage with low efficiency makes more nutrients flow into underground and accumulate in the soil. In the test, we only considered the case under customary fertilization. The amount of fertilization is 900 kg per hectare, which is much larger. Secondly, the drain spacing is much smaller than the actual, which may produce large hydrodynamic force when water flows into the drain. Large hydrodynamic force may aggravate the nitrate nitrogen leaching loss. There are both advantages and disadvantages to large nitrogen leaching. On the one hand, large nitrogen content of the outflow has an adverse impact on a water environment. On the other hand, long-term accumulated nitrogen may affect the groundwater which is an indirect pollution on the environment.
To solve these problems, agricultural drainage management should be adopted [32]. It is important to improve the fertilizer management practices to realize a reasonable reduction of nitrogen and phosphate fertilizer use [33]. To reduce the ammonium nitrogen and total phosphate contents of the outflow, absorbing material such as pumice and biochar may be set near the outlet or at some place in the drainage path [34,35,36]. Nitrate nitrogen could be reduced by denitrifying bacteria, biozeolite and modified biochar, etc. [37]. Constructed wetland is an effective measure to achieve combined reduction of phosphorus and nitrogen [38]. Finally, the effective assessment of nitrogen and phosphorus loss should be considered under different measures of nutrient reduction, which can also guide the drainage management [39].
5. Conclusions
This study showed the characteristics of nitrogen and phosphorus loss under conventional subsurface drainage and improved subsurface drainage with different filter materials. Based on the experimental results, conclusions were drawn as follows.
Firstly, the improved subsurface drainage with gravel filter, layered sand-gravel filter, mixed sand-gravel filter and straw filter showed different features on nitrogen and phosphorus loss. Secondly, compared with conventional subsurface drainage, the improved subsurface drainage with layered sand-gravel filter and mixed sand-gravel filter had better function on reducing the ammonia nitrogen, soluble reactive phosphate and total phosphate concentrations of the outflow, but they increased the nitrate nitrogen and total nitrogen concentrations. The concentrations of nitrogen and phosphorus under the improved subsurface drainage with gravel filter are higher than that with layered sand-gravel filter and mixed sand-gravel filter. Thirdly, the concentrations of ammonia nitrogen, soluble reactive phosphate and total phosphorus under the improved subsurface drainage with straw filter were higher than the conventional subsurface drainage. Meanwhile, the nitrate nitrogen and total nitrogen concentrations under improved subsurface drainage with straw filter might be influenced by the crop growing season.
With the customary fertilization method, nitrate nitrogen and total nitrogen concentrations in the outflow under all subsurface drainage patterns in this paper are much larger than the standard of water environmental quality in China. Agricultural water management such as fertilization management, controlled drainage, drainage water reuse should be adopted to reduce the nitrogen loss especially at the early stage of the drainage. Additionally, it is very important to evaluate sustainable loads and the best management practices for drain regions. Based on the results of experiments in this paper, we will build a simulation model to conduct some further investigation.
Author Contributions
Y.T. and S.W. wrote the manuscript; X.G. and H.C. analyzed the data; D.X. and M.J. revised the manuscript.
Funding
This research was funded by Basic Research Fund of China Institute of Water Resources and Hydropower Research “ID 0145B092019”.
Acknowledgments
This work was supported by the National Key R&D Program of China (Grant Nos. 2018YFC1508304, 2018YFC0406502, 2017YFC0403503), National Natural Science Foundation Program of China (Grant Nos. 51779274, 51779273), Basic Research Fund of China Institute of Water Resources and Hydropower Research (Grant No. ID0145B092019), the Qinghai science and technology planning project(Grant No. 2017-NK-155), Major Project in Key Research and Development Program of the Ningxia Hui Autonomous Region (Grant No. 2018BBF02022).
Conflicts of Interest
The authors declare no conflict of interest.
References
- Skaggs, R.W.; Brevé, M.A.; Gilliam, J.W. Hydrologic and water quality impacts of agricultural drainage. Crit. Rev. Environ. Sci. Technol. 1994, 24, 1–32. [Google Scholar] [CrossRef]
- Faridmarandi, S.; Naja, G.M. Phosphorus and Water Budgets in an Agricultural Basin. Environ. Sci. Technol. 2014, 48, 8481–8490. [Google Scholar] [PubMed]
- Kaushal, S.S.; Groffman, P.M.; Band, L.E.; Elliott, E.M.; Shields, C.A.; Kendall, C. Tracking Nonpoint Source Nitrogen Pollution in Human-Impacted Watersheds. Environ. Sci. Technol. 2011, 45, 8225–8232. [Google Scholar] [CrossRef] [PubMed]
- Mrdjen, I.; Fennessy, S.; Schaal, A.; Dennis, R.; Slonczewski, J.L.; Lee, S.; Lee, J. Tile Drainage and Anthropogenic Land Use Contribute to Harmful Algal Blooms and Microbiota Shifts in Inland Water Bodies. Environ. Sci. Technol. 2018, 52, 8215–8223. [Google Scholar] [PubMed]
- Dodds, W.K.; Bouska, W.W.; Eitzmann, J.L.; Pilger, T.J.; Pitts, K.L.; Riley, A.J.; Schloesser, J.T.; Thornbrugh, D.J. Eutrophication of U.S. Freshwaters: Analysis of Potential Economic Damages. Environ. Sci. Technol. 2009, 43, 12–19. [Google Scholar] [CrossRef] [PubMed]
- Ritzema, H.P. Drainage Principles and Applications; International Institute for Land Reclamation and Improvement: Wageningen, The Netherlands, 2006. [Google Scholar]
- Tao, Y.; Wang, S.; Xu, D.; Qu, X. Experiment and analysis on flow rate of improved subsurface drainage with ponded water. Agric. Water Manag. 2016, 177, 1–9. [Google Scholar] [CrossRef]
- Tao, Y.; Wang, S.; Xu, D.; Yuan, H.; Chen, H. Field and numerical experiment of an improved subsurface drainage system in Huaibei plain. Agric. Water Manag. 2017, 194, 24–32. [Google Scholar] [CrossRef]
- Ibrahim, T.G.; Goutelle, A.; Healy, M.G.; Brennan, R.; Tuohy, P.; Humphreys, J.; Lanigan, G.; Brechignac, J.; Fenton, O. Mixed agricultural pollutant mitigation using woodchip/pea gravel and woodchip/zeolite permeable reactive interceptors. Water Air Soil Pollut. 2015, 226, 51. [Google Scholar] [CrossRef]
- Murnane, J.; Brennan, R.; Healy, M.; Fenton, O. Assessment of intermittently loaded woodchip and sand filters to treat dairy soiled water. Water Res. 2016, 103, 408–415. [Google Scholar] [CrossRef] [Green Version]
- Wang, J.; Wang, D.; Zhang, G.; Wang, Y.; Wang, C.; Teng, Y.; Christie, P. Nitrogen and phosphorus leaching losses from intensively managed paddy fields with straw retention. Agric. Water Manag. 2014, 141, 66–73. [Google Scholar] [CrossRef]
- Williams, M.R.; King, K.W.; Fausey, N.R. Contribution of tile drains to basin discharge and nitrogen export in a headwater agricultural watershed. Agric. Water Manag. 2015, 158, 42–50. [Google Scholar] [CrossRef]
- King, K.W.; Williams, M.R.; Macrae, M.L.; Fausey, N.R.; Frankenberger, J.; Smith, D.R.; Kleinman, P.J.; Brown, L.C. Phosphorus transport in agricultural subsurface drainage: A review. J. Environ. Qual. 2014, 44, 467. [Google Scholar]
- Algoazany, A.S.; Kalita, P.K.; Czapar, G.F.; Mitchell, J.K. Phosphorus transport through subsurface drainage and surface runoff from a flat watershed in east central Illinois, USA. J. Environ. Qual. 2007, 36, 681–693. [Google Scholar] [CrossRef] [PubMed]
- Eastman, M.; Gollamudi, A.; Stämpfli, N.; Madramootoo, C.A.; Sarangi, A. Comparative evaluation of phosphorus losses from subsurface and naturally drained agricultural fields in the Pike River watershed of Quebec, Canada. Agric. Water Manag. 2010, 97, 596–604. [Google Scholar] [CrossRef]
- Baker, J.L.; Melvin, S.W.; Lemke, D.W.; Lawlor, P.A.; Crumpton, W.G.; Helmers, M.J. Subsurface Drainage in Iowa and the Water Quality Benefits and Problem; American Society of Agricultural Engineers: St. Joseph, MI, USA, 2004; pp. 39–50. [Google Scholar]
- Bengtson, R.L. Agricultural Drainage and Water Quality in Mississippi Delta. J. Irrig. Drain. Eng. 1995, 121, 292–295. [Google Scholar] [CrossRef]
- Grazhdani, S.; Jacquin, F.; Sulçe, S. Effect of subsurface drainage on nutrient pollution of surface waters in south eastern Albania. Sci. Total Environ. 1996, 191, 15–21. [Google Scholar] [CrossRef]
- Turtola, E.; Paajanen, A. Influence of improved subsurface drainage on phosphorus losses and nitrogen leaching from a heavy clay soil. Agric. Water Manag. 1995, 28, 295–310. [Google Scholar] [CrossRef]
- Bruun, J.; Pugliese, L.; Hoffmann, C.C.; Kjaergaard, C. Solute transport and nitrate removal in full-scale subsurface flow constructed wetlands of various designs treating agricultural drainage water. Ecol. Eng. 2016, 97, 88–97. [Google Scholar] [CrossRef]
- Wang, S.; Zhou, M.; Liu, L. Experimental study on permeability and nitrogen removal of envelope materials for drainage pipe. J. Irrig. Drain. 2013, 32, 21–23. [Google Scholar]
- Nie, F.; Xiang, S.; Min, L.; Liu, J.; Wang, B. Simulation experiment of treating rainwater runoff with different inf’lltration media. Hubei Agric. Sci. 2012, 51, 5318–5323. [Google Scholar]
- Fisher, L.H. Effect of Water-Column pH on Sediment-Phosphorus Release Rates in Upper Klamath Lake, Oregon, 2001; U.S. Geological Survey: Reston, VA, USA, 2004.
- Kim, L.H.; Choi, E.; Stenstrom, M.K. Sediment characteristics, phosphorus types and phosphorus release rates between river and lake sediments. Chemosphere 2003, 50, 53–61. [Google Scholar] [CrossRef]
- Xu-Qian, L.I.; Zhu, Y.N.; Guang, Y.U.; Xie, X.; Song, S. Experimental study on migration and transformation of NH4+-N in aquitard under influence of pH. Water Resour. Prot. 2011, 15, 35–37. [Google Scholar]
- Cui, T.; Li, Z.; Wang, S. Effects of in-situ straw decomposition on composition of humus and structure of humic acid at different soil depths. J. Soils Sediments 2017, 17, 2391–2399. [Google Scholar] [CrossRef]
- Lin, J.J.; Zhang, S.; Liu, D.; Zhou, B.; Xiao, X.J.; Ma, H.Y.; Yu, Z.G. Effect of Seasonal Temperature Increasing on Nitrogen Mineralization in Soil of the Water Level Fluctuating Zone of Three Gorge Tributary During the Dry Period. Environ. Sci. 2016, 37, 697–702. [Google Scholar]
- Wang, L.; Zhao, L.; Bin, Z.; Wang, X. Characteristics and evaluation of matrix fertilities of the waste lands after construction of Ha-Tong expressway. Soil Fertil. Sci. China 2016, 3, 49-53; 66. [Google Scholar]
- Chen, S.; Ding, X.Q.; Zhu, Z.K.; Wang, J.; Peng, P.Q.; Ge, T.D.; Wu, J.S. Effect of Straw Application on the Dynamics of Exogenous Nitrogen and Microbial Activity in Paddy Soil. Environ. Sci. 2017, 38, 1613–1621. [Google Scholar]
- Lu, W. Form Distribution of Nitrogen and Phosphorus and Corn Growth Characteristics in the Straw Improved Soil. Ph.D. Thesis, College of Environment and Resources, Jilin University, Changchun, China, 2016. [Google Scholar]
- Chen, D. Studies on Effect of Soil Tillage and Straw Returning to Field in Multi-Cropping Paddy Field. Ph.D. Thesis, Agronomy College, Hunan Agricultural University, Changsha, China, 2009. [Google Scholar]
- Turpin, N.; Bontems, P.; Rotillon, G.; Bärlund, I.; Kaljonen, M.; Tattari, S.; Feichtinger, F.; Strauss, P.; Haverkamp, R.; Garnier, M.; et al. AgriBMPWater: Systems approach to environmentally acceptable farming. Environ. Model. Softw. 2005, 20, 187–196. [Google Scholar] [CrossRef]
- Xue, L.; Yu, Y.; Yang, L. Maintaining yields and reducing nitrogen loss in rice–wheat rotation system in Taihu Lake region with proper fertilizer management. Environ. Res. Lett. 2014, 9, 115010. [Google Scholar] [CrossRef]
- Kizito, S.; Wu, S.; Kipkemoi, K.; Lei, M.; Lu, Q.; Bah, H.; Dong, R. Evaluation of slow pyrolyzed wood and rice husks biochar for adsorption of ammonium nitrogen from piggery manure anaerobic digestate slurry. Sci. Total Environ. 2015, 505, 102–112. [Google Scholar] [CrossRef]
- Sarkhot, D.V.; Ghezzehei, T.A.; Berhe, A.A. Effectiveness of Biochar for Sorption of Ammonium and Phosphate from Dairy Effluent. J. Environ. Qual. 2013, 42, 1545. [Google Scholar] [CrossRef]
- Onar, A.N.; Ozturk, B. Adsorption of phosphate onto pumice powder. Environ. Technol. 1993, 14, 1081–1087. [Google Scholar] [CrossRef]
- Li, L.; Xu, C.H.E.N.; Dan, W.U. Adsorption of aqueous nitrate-N by immobilized modified biochar. J. Agro Environ. Sci. 2015, 34, 137–143. [Google Scholar]
- Kovacic, D.A.; David, M.B.; Gentry, L.E.; Starks, K.M.; Cooke, R.A. Effectiveness of Constructed Wetlands in Reducing Nitrogen and Phosphorus Export from Agricultural Tile Drainage. J. Environ. Qual. 2000, 29, 1262. [Google Scholar] [CrossRef]
- Leone, A.; Ripa, M.N.; Boccia, L.; Porto, A.L. Phosphorus export from agricultural land: A new simple quantitative methodology. Biosyst. Eng. 2008, 101, 270–280. [Google Scholar] [CrossRef]
Figure 1.
Layout of the field experiment.

Figure 2.
Distribution of soil particle size and sand-gravel size in different filter.

Figure 3.
Total nitrogen (TN) content of the soil before drainage.

Figure 4.
Total phosphorus (TP) content of the soil before drainage.

Figure 5.
Observed pH of the subsurface drainage outflow.

Figure 6.
Observed total nitrogen concentration of the subsurface drainage outflow.

Figure 7.
Observed ammonia nitrogen concentration of the subsurface drainage outflow.

Figure 8.
Observed nitrate nitrogen concentration of the subsurface drainage outflow.

Figure 9.
Observed total phosphate concentration of the subsurface drainage outflow.

Figure 10.
Observed soluble reactive phosphate concentration of the subsurface drainage outflow.


Table 1.
The sampling time after drainage (unit/min).
| 5 June 2016 | 7 June 2016 | 24 June 2016 | 6 September 2017 | 12 September 2017 | 29 June 2018 | |
|---|---|---|---|---|---|---|
| Initial stage | 20 | 20 | 40 | 60 | 70 | 100 |
| Middle stage | 120 | 140 | 260 | 220 | 260 | 240 |
| End stage | 340 | 480 | 530 | 380 | 440 | 510 |
© 2019 by the authors. Licensee MDPI, Basel, Switzerland. This article is an open access article distributed under the terms and conditions of the Creative Commons Attribution (CC BY) license (http://creativecommons.org/licenses/by/4.0/).
Share and Cite
MDPI and ACS Style
Tao, Y.; Wang, S.; Guan, X.; Xu, D.; Chen, H.; Ji, M. Study on Characteristics of Nitrogen and Phosphorus Loss under an Improved Subsurface Drainage. Water 2019, 11, 1467. https://doi.org/10.3390/w11071467
AMA Style
Tao Y, Wang S, Guan X, Xu D, Chen H, Ji M. Study on Characteristics of Nitrogen and Phosphorus Loss under an Improved Subsurface Drainage. Water. 2019; 11(7):1467. https://doi.org/10.3390/w11071467
Chicago/Turabian StyleTao, Yuan, Shaoli Wang, Xiaoyan Guan, Di Xu, Haorui Chen, and Mengzhe Ji. 2019. "Study on Characteristics of Nitrogen and Phosphorus Loss under an Improved Subsurface Drainage" Water 11, no. 7: 1467. https://doi.org/10.3390/w11071467
Note that from the first issue of 2016, this journal uses article numbers instead of page numbers. See further details here.