Spatial–Temporal Matching Characteristics between Agricultural Water and Land Resources in Ningxia, Northwest China


1
Key Laboratory of State Forestry Administration on Soil and Water Conservation, Beijing Engineering Research Center of Soil and Water Conservation, School of Soil and Water Conservation, Beijing Forestry University, Beijing 100083, China
2
State Key Laboratory of Simulation and Regulation of Water Cycle in River Basin, China Institute of Water Resources and Hydropower Research, Beijing 100038, China
*
Authors to whom correspondence should be addressed.
Water 2019, 11(7), 1460; https://doi.org/10.3390/w11071460
Submission received: 11 June 2019
/
Revised: 25 June 2019
/
Accepted: 13 July 2019
/
Published: 14 July 2019
(This article belongs to the Special Issue Soil-Water Management: An Essential Step towards Sustainable Intensification in Agriculture)
Abstract
:Agricultural water and land resources are key elements of human production and their unbalanced distribution has threatened the sustainable development of agriculture and regional food security. This study is aiming to investigate the spatial–temporal changes of matching characteristics between agricultural water and land resources in Ningxia during 2007 to 2017. The agricultural irrigation water (AIW), farmland area (FA) and effective irrigated area (EIA) were selected as quantity parameters for agricultural water and land resource. Results show that the gravity centers of AIW and EIA both moved in the southeast direction, while the gravity center of FA moved northwestward, which indicated a better spatial matching degree between AIW and EIA. According to the Gini coefficient and total spatial mismatch index, the spatial mismatch between AIW and FA of Ningxia was remedied and that of AIW and EIA was worse. Counties with sufficient and insufficient AIW were distributed in the north and the south of Ningxia, respectively. The sensitivity of agricultural irrigation water to land resources remarkably increased in the study period, particularly for the counties in northern area of Ningxia. The findings may provide implications for effective management of regional agricultural water and land resources.
1. Introduction
Agricultural water resources and land resources are the two most fundamental resources for humans around the world. The global per capita agricultural land is only about 0.7 hectares, accounting for 37.9% of the world’s per capita land area [1]. Farmland irrigation, as an important tool of achieving world food security, accounts for 20% of the total cultivated land and 40% of global agricultural productivity [2]. Under the impacts of climate change and land use change, the whole world will have more dependence on agricultural irrigation in the future [3]. Due to urbanization, environmental contamination, climate change and other factors [4,5], land resources and freshwater resources are becoming scarcer, which means a rising competition between agricultural, industrial and urban construction [6]. China has only 7% of the world’s cultivated land resources, but provide food for one-fifth of the world’s population [7]. As a major agricultural country, China’s agricultural water consumption accounts for more than 60% of total water consumption, of which irrigation water accounts for more than 90% of total agricultural water use [8,9,10]. With the rapid development of industrialization and urbanization in China, the trend of agricultural land and water resources being occupied is difficult to reverse, and the country’s food security faces enormous challenges [2,11,12].
In the present situation of uneven geographical distribution of water and land resources all over the world, issues such as resource grabbing [13] and transboundary water resources management [14], have become urgent problems to be solved. It also brings challenges for improving water efficient irrigation technology, selecting less water-intensive crops and building water projects, especially in arid and semiarid area [15]. Water and land resources are basic natural wealth for production and life, and the spatial–temporal matching degree between these two resources is directly related to the sustainable development of regional agriculture [16]. The rational utilization of water resources has direct correlation with the producing efficiency and utilization of land resources, and in turn, the exploitive extent of land resources limits the water use [17]. Therefore, conducting research on matching characteristics between water and land resources is of strategic significance for the efficient utilization of agricultural water and land resources, protecting regional food security.
Currently, matching analysis between water and land resources in China has been studied by many researchers. Wu and Bao [18] first developed a regional Lorenz Curve by water resources and cultivated land area, calculating the matching coefficients of water and land resources between provinces in China and between countries in the world, respectively. Liu et al. [19] proposed a quantitative relationship between water resources and land resources for agricultural production, and used it as a matching coefficient to analyze the agricultural land and water resources in Northeast China. Sun et al. [20] evaluated the matching degree of potential arable land resources with water resources in China, by using two indexed, i.e., Gini coefficient and water resource per unit area. In a comprehensive consideration of blue water and green water, a model for measuring the matching index between broadly defined agricultural water resources and land resources were constructed by Liu et al. [21] to estimate the matching degree between agricultural water and land resources in Jiansanjiang Administration, northeast China. Most previous studies focused on nationwide area or regions with abundant water resources and relatively good irrigation conditions. So far, however, few researches have detailed investigation of matching pattern between water and land resources in arid and semiarid areas of northwest China.
In regions with great natural differences such as climate and landforms, the irrigation conditions of agricultural land vary widely. How to evaluate the matching situation of agricultural land and water resources in irrigated lands in northwest China, where there is no agriculture without irrigation? In this regard, the indicator “effective irrigated area” can be introduced to related studies. Effective irrigated area, or the irrigated area of cultivated land, refers to the area of flat farmland which has fixed water sources, irrigation facilities, and the capacity of irrigation in normal circumstances. China’s grain output and irrigated area are growing simultaneously [22]. Therefore, effective irrigated area not only reflects the drought-resistant ability of arable land, but also an important guarantee for national food security. Each year, water department and agriculture department of China conduct statistics on this indicator in order to rationally allocate agricultural water [23].
Ningxia Hui Autonomous Region, located in western China, was taken as a study area in this paper to investigate the spatial–temporal variation of agricultural water and land resources from 2007 to 2017. The objectives of this research were to: (1) through the spatial center of gravity model, analyze the gravity center transfer of agricultural water and land resources in Ningxia; (2) examine the spatial–temporal variation characteristics of the matching degree of water and land resources by two different land resource indicators; (3) explore the response of agricultural water resources to farmland changes by using sensitivity analysis. It is hoped that this research can contribute to guide the development and utilization of agricultural water and land resources in macro view, in order to achieve effective management and policy-making of regional agricultural water and land resources.
2. Study Area
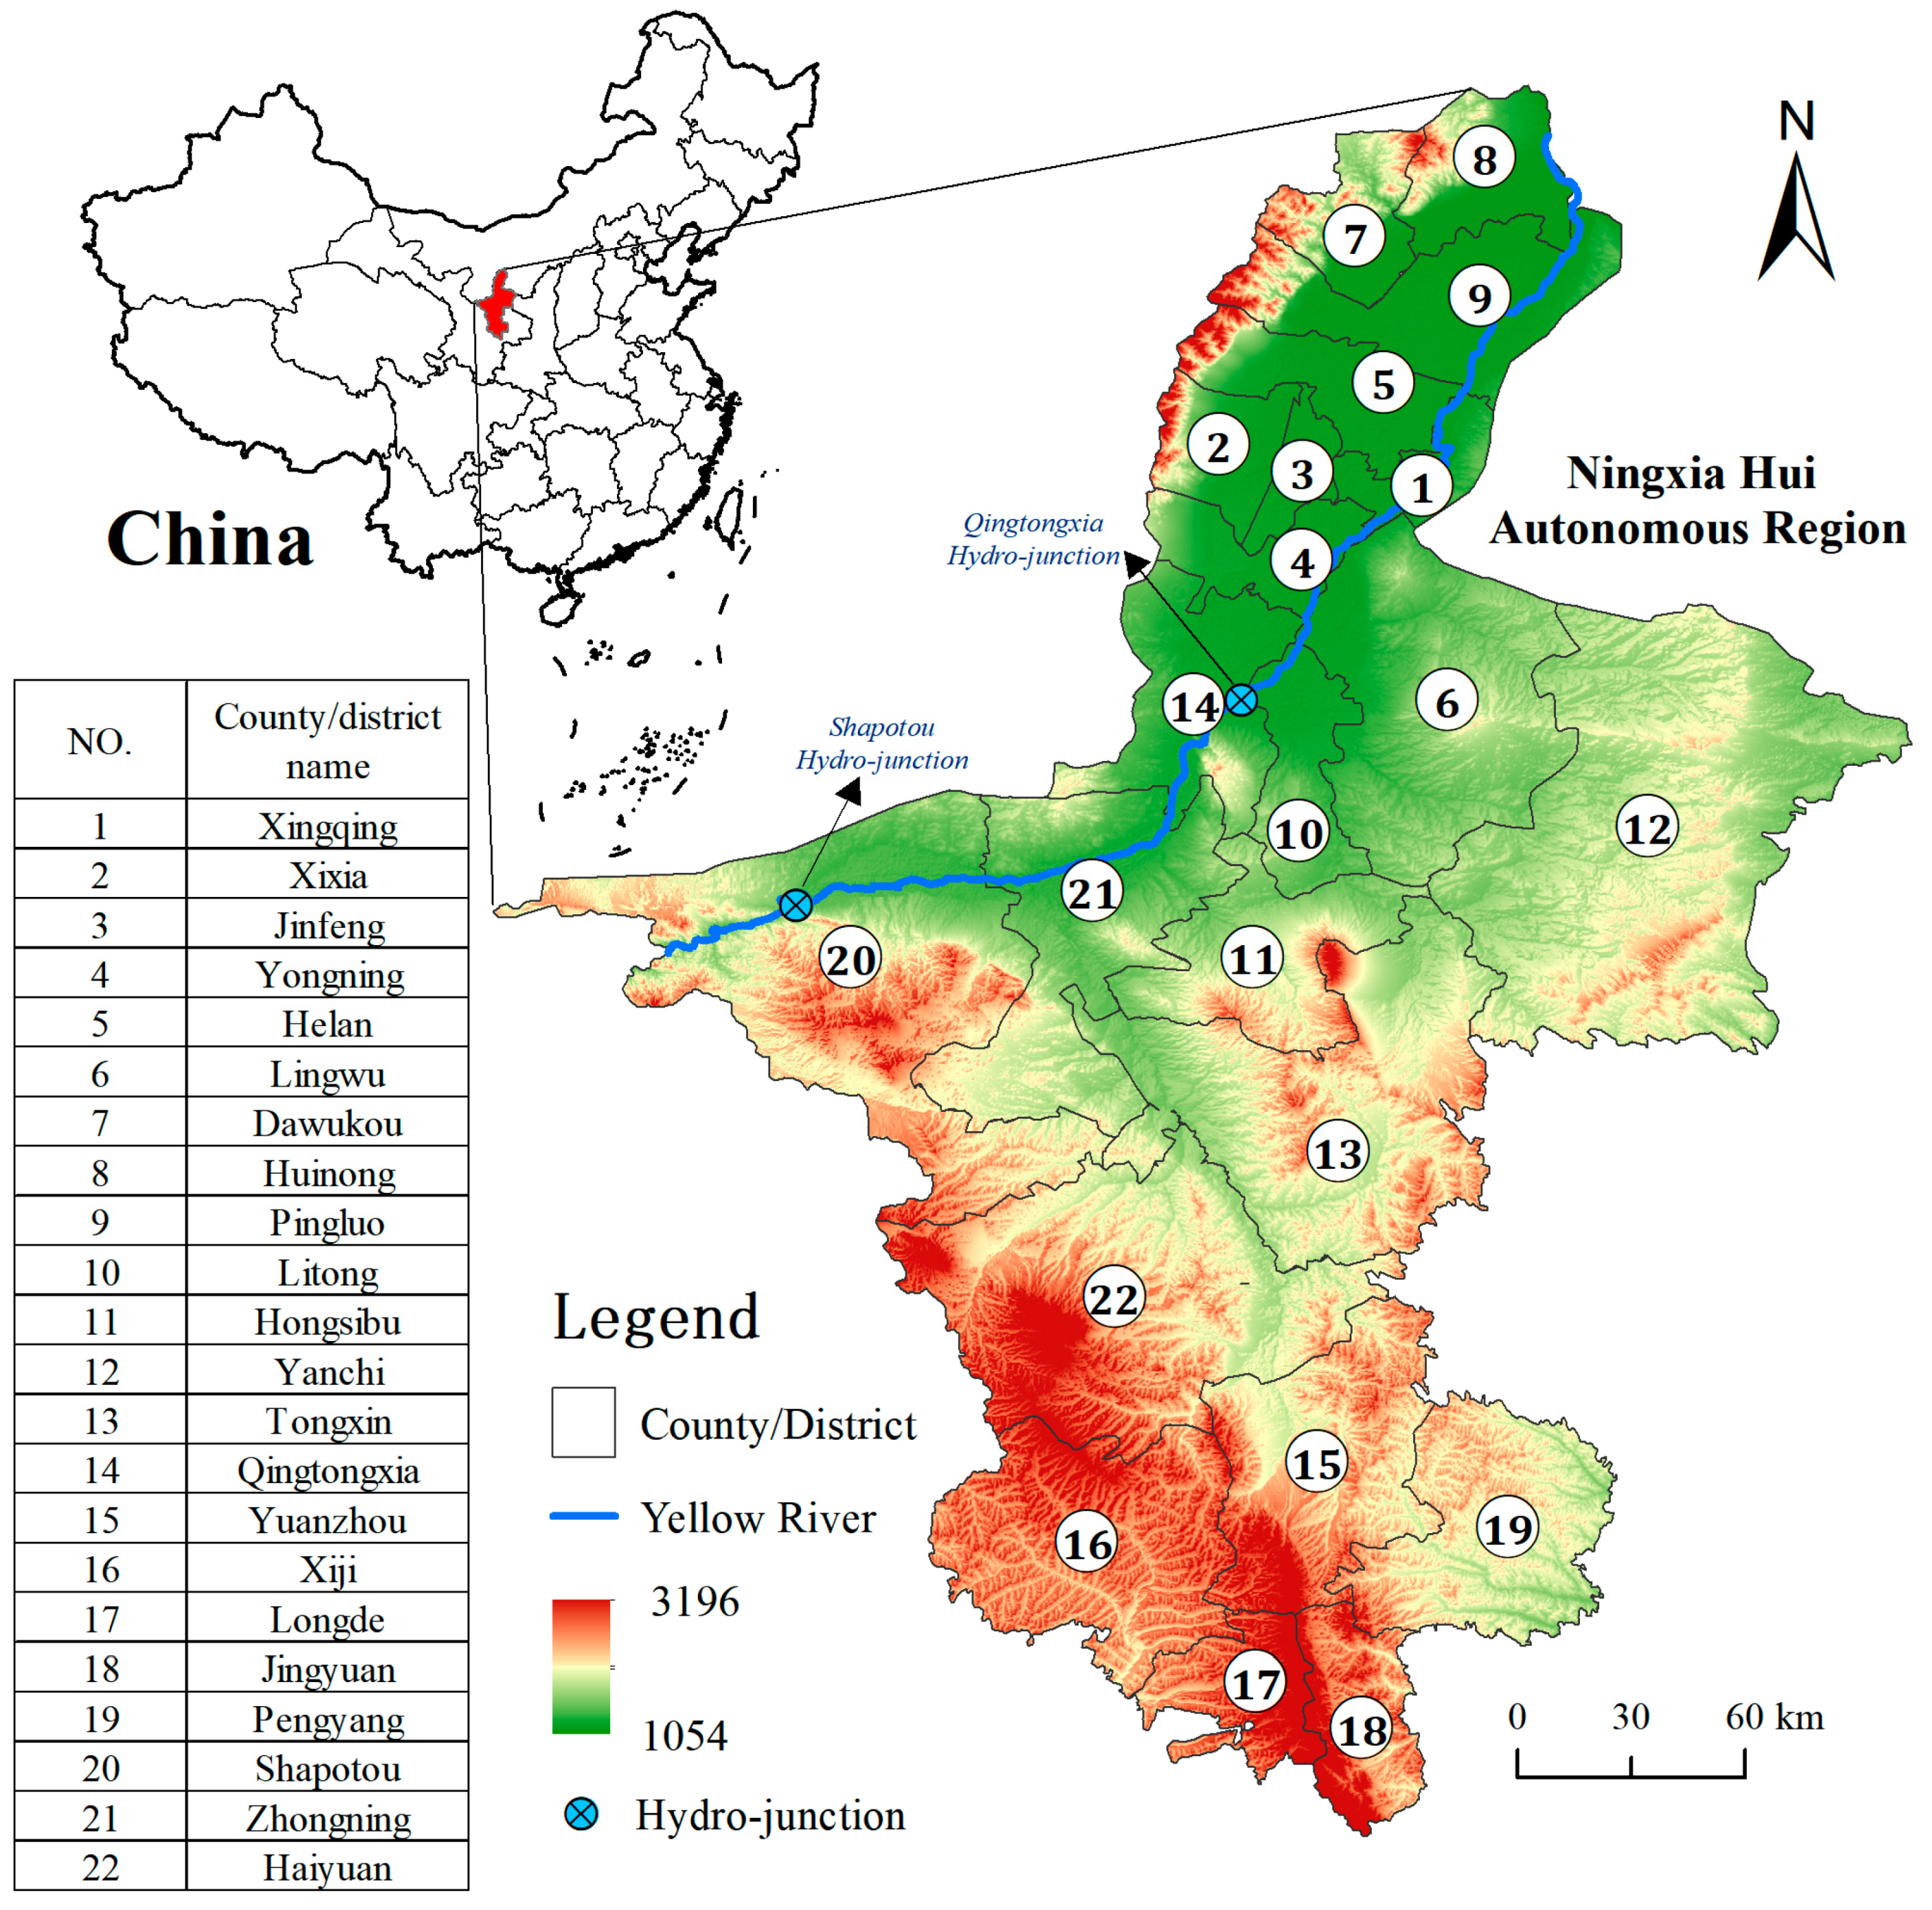
Ningxia Hui Autonomous Region (35°14′–39°23′ N, 104°17′–107°39′ E) is located in the upper reaches of the Yellow River Basin in western China, adjacent to Gansu Province, Inner Mongolia Autonomous Region and Shaanxi Province. It is about 45–250 km wide from east to west, and about 465 km long from north to south, with a land area of 66,400 km2. There are five prefecture-level cities and 22 counties or districts in Ningxia, as shown in Figure 1. Ningxia crosses the Loess Plateau and the Inner Mongolia Plateau, and the terrain is high in the south and low in the north. Ningxia is a temperate continental arid and semiarid climate [24], with annual precipitation ranging from 150 mm to 600 mm. The north-central region has abundant sunshine, scarce precipitation, and strong evaporation, while the climate in the southern Liupan Mountains is relatively humid. As the main grain producing area and ecological barrier zone in western China, food security is a key issue of regional development in Ningxia. The per capita cultivated area of Ningxia is 0.167 ha, and the per capita grain yield is 558 kg, which is higher than the national average. With a long history of irrigation, agricultural water use accounts for about 90% of the total. The irrigation area in Ningxia is divided into three categories according to the water-intake mode: the Yellow River irrigation district in the northern plain, the Yellow River pumping irrigation district in the arid sandy area of central Ningxia, and the reservoir-well irrigation district in the southern mountainous region. With the rapid development of the population and socioeconomy in Ningxia, resources and the environment have been over-exploited. As for agriculture, problems like uneven distribution of land and water resources, and low efficiency of agricultural water use have severely restricted regional development [25,26].
3. Materials and Methods
3.1. Data Sources
In this paper, we chose the years of 2007–2017 as the research period. In total, 22 counties and districts under the jurisdiction of five prefecture-level cities in Ningxia were involved. The data of farmland area, effective irrigated area and agricultural irrigation water consumption data of all counties and districts were obtained from the Ningxia Water Conservancy Statistical Bulletin, Ningxia Statistical Year Book and Ningxia Water Resources Bulletin. It should be noted that the Hongsibu District of Wuzhong City was established upon approval of the State Council in October 2009, so the data of Hongsibu from 2007 to 2009 was calculated based on the data after 2010 and combined with the statistical data of the adjacent counties.
3.2. Gravity Center Model
The gravity center model, or barycenter model, was introduced in this study to explore the overall changes of agricultural water and land resources in Ningxia. The model is derived from the concept of “center of gravity” or “center of mass”, and has been extensively used in many fields such as economy [27], energy [28,29], environment [30]. The deviation angle and moving distance of gravity center are expected to reflect the spatial change of the property in a certain region. In addition, the deviation angle and distance between the two properties reveal their spatial disequilibrium, which means that the greater the distance, the worse the spatial imbalance [31]. If the study area consists of n units and (xi, yi)t is the geometric coordinate for the position of i-th unit (i = 1, 2, 3, …, n) at time t, the position of the gravity center of the attribute at time t (, ) in the study area can be described as:
where refer to the attribute value of the i-th unit at time t.
The moving direction of the gravity center can be calculated by:
where refers to the deviation angle of the gravity center from time t1 to time t2. (, ) and (, ) represent the coordinated position of gravity center at time t1 and time t2, respectively. The adjustment coefficient k was assigned values as k = 0, 1, 2, to ensure that ∈ (−180°, 180°). It is defined that the anti-clockwise direction is the positive direction and the due east is 0°.
The moving distance of the gravity center can be calculated by:
where represents the moving distance of the gravity center, (, ) and (, ), respectively, refer to the coordinated position of gravity center at time t1 and time t2. is a constant, standing for the conversion coefficient from latitude and longitude coordinates on earth (°) to plane distance (km), with a value of 111.111.
3.3. Theory of Matching and Mismatching
3.3.1. Gini Coefficient
The Italian economist Gini Corrado proposed the concept of the Gini coefficient according to the Lorentz curve in 1912 [32]. To investigate the balanced state between agricultural water and land resources in Ningxia, the Gini coefficient can be calculated as:
where G represents the Gini coefficient, w and l refer to the proportion of agricultural irrigation water and agricultural land area in each county or district, respectively. The cumulative percentage of agricultural irrigation water of each county or district can be expressed as a. Generally, the Gini coefficient is between 0 and 1. A smaller Gini coefficient means a greater balance degree between agricultural water and land resources, and vice versa.
3.3.2. Spatial Mismatch Index
The spatial mismatch analysis can be used to reveal the nonlinear correlation between two objectives in space, which has been applied to economic and social fields such as agriculture, housing and employment [33,34,35,36]. In this paper, to figure out the spatial relationship between agricultural water and land resources in Ningxia, the spatial mismatch index of agricultural water-to-land (SMIWL) is calculated as follows:
where, represents the spatial balance between agricultural irrigation water (AIW) and farmland area (FA) and represents the spatial balance between agricultural irrigation water (AIW) and effective irrigated area (EIA). Wi, Fi and Ei are agricultural irrigation water (AIW), farmland area (FA) and effective irrigated area (EIA) of county or district i, respectively. () represents the total level of spatial mismatch between AIW and FA (EIA) in Ningxia. A higher value of SMIWL means the more sufficient irrigation water in unit land area, that is, more water and less land; conversely, a lower value of SMIWL means that huge tracts could not be irrigated. In order to judge the relative matching relationship between agricultural water and land resources in each county or district, we chose the Jenks Natural Breaks Classification to help us set standard value of the calculation results [37].
3.4. Sensitivity Analysis
To assess the potential impact of land resource changes on agricultural irrigation water use, a sensitivity index was introduced to analyze the sensitivity of agricultural irrigation water use to land change. As a quantitative analysis method, sensitivity analysis is used to study the effect of one variable on another or a set of key indicators [38]. In this study, the subject of sensitive analysis is AIW, and the sensitive factors are FA and EIA. The sensitivity index is calculated by:
where is the sensitivity index; and represent the AIW at the beginning and end of the study period, respectively, and , refer to the FA or EIA at the beginning and end of the study period, respectively. The higher the sensitivity index, the more the agricultural irrigation water use is sensitive to the change of land resources. In the study period, 2012 was selected as the dividing point to study the response of agricultural irrigation water consumption to agricultural land change before and after 2012.
4. Results
4.1. Spatial Distribution Characteristics and Gravity Center Change of Water and Land Resources
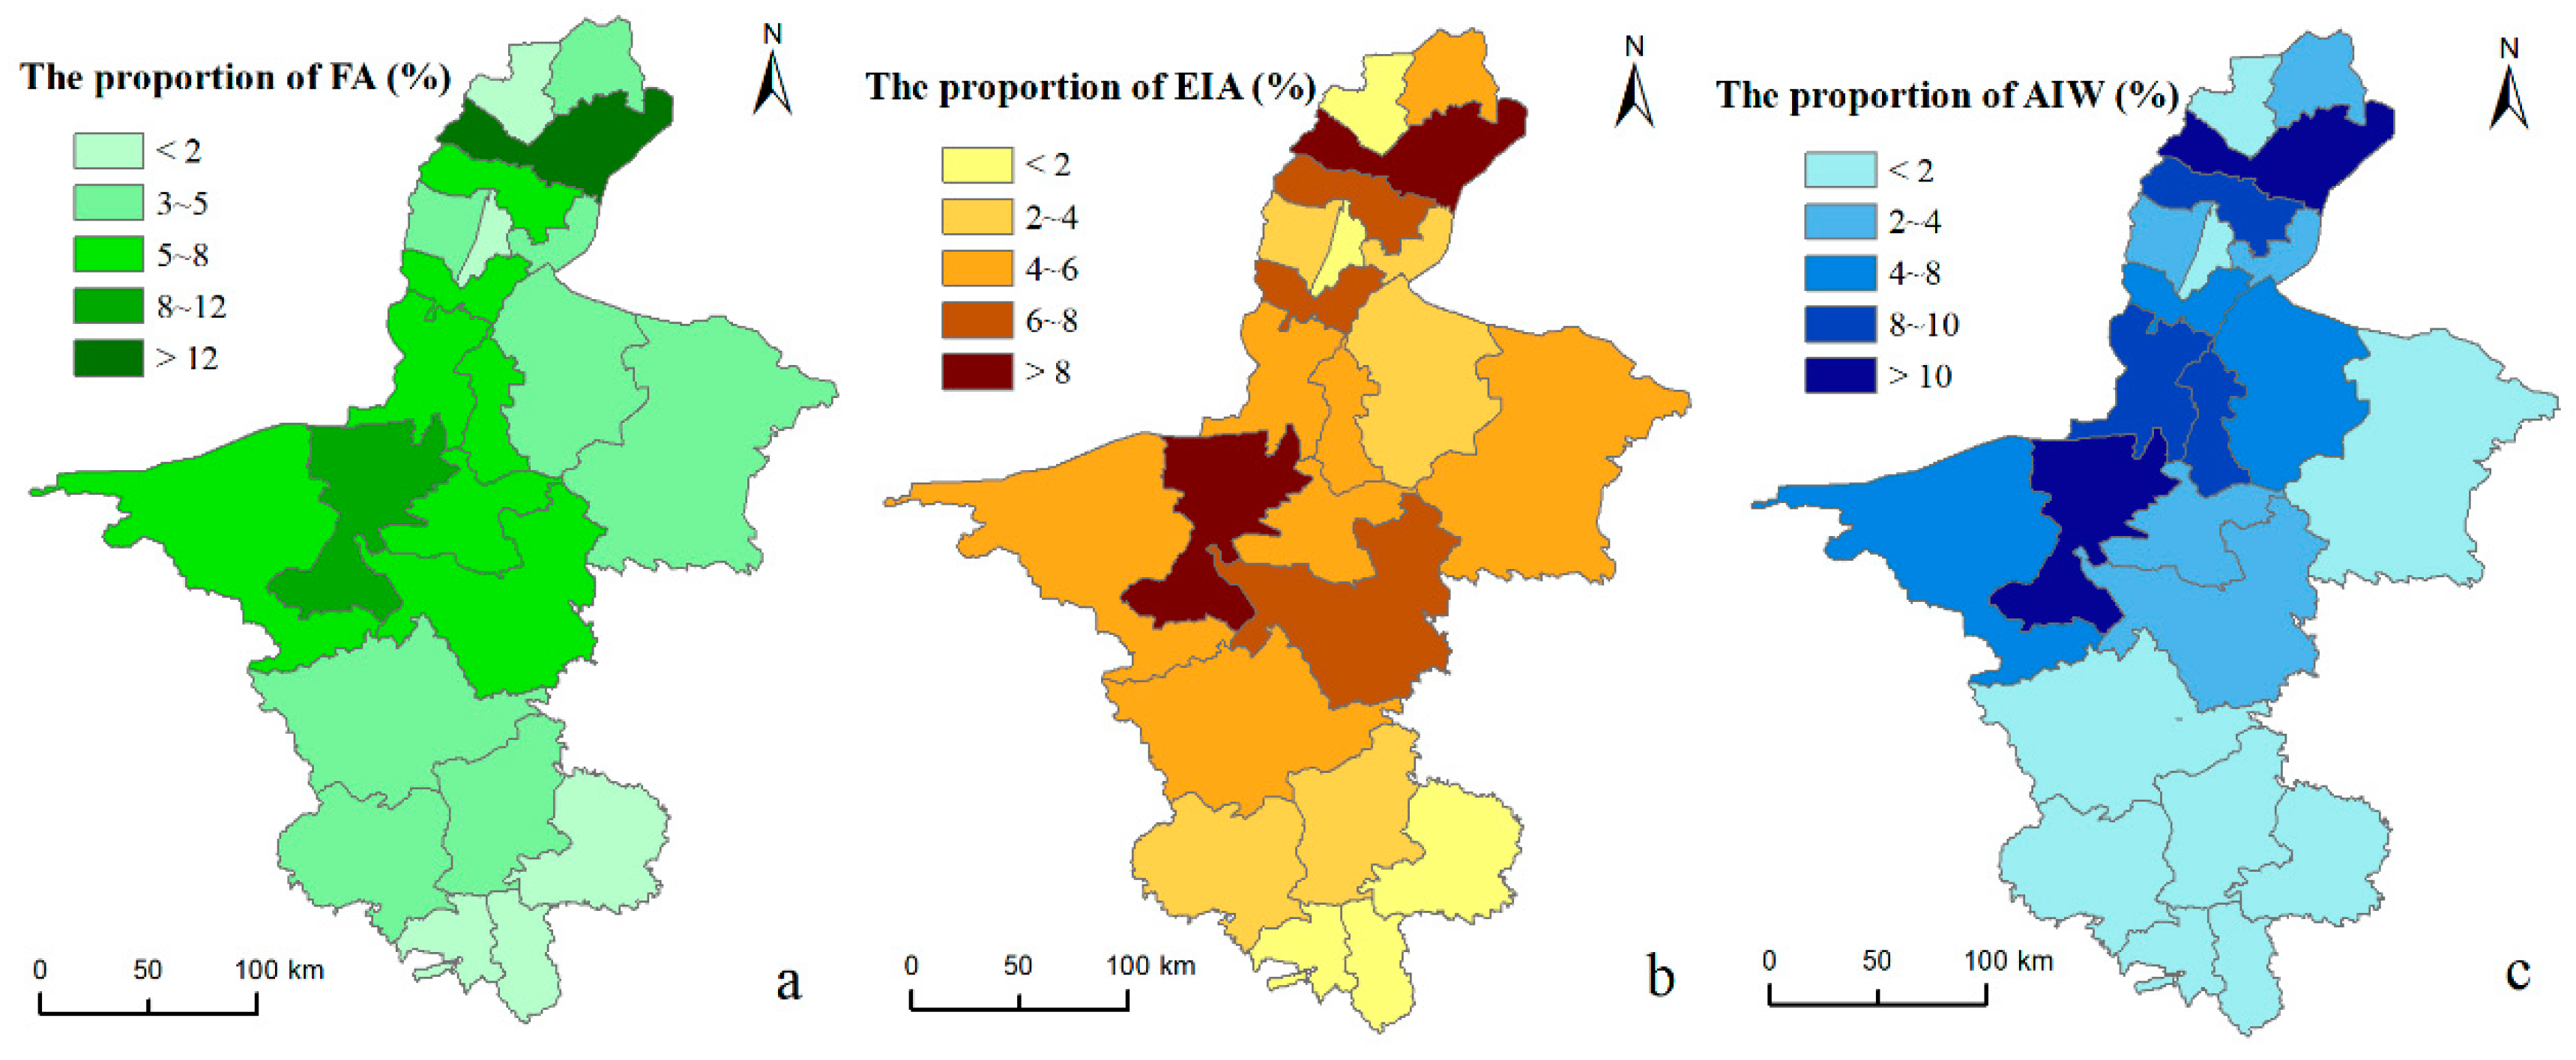
The average percentages of FA, EIA and AIW of each county or district from 2007 to 2017 among the total value of Ningxia were calculated to analyze the spatial distribution characteristics of agricultural water and land resources in Ningxia, as shown in Figure 2. Figure 2a,b reveal the proportion of FA and EIA in each county, respectively. Except for individual counties or districts in North Ningxia which account for a small proportion of FA and EIA because of small administrative area or urban place, most of FA and EIA are distributed in central-western and central-northern of Ningxia. On the contrary, most districts and counties in the east and south have larger areas, but the proportion of FA and EIA is small (<5%). It can be seen from the Figure 2c that the districts and counties with relatively larger proportion of AIW are mainly distributed in the Yellow River irrigated areas in the northern and central-western parts of Ningxia, while the AIW in the southern loess hilly region and the windy–arid areas of central-eastern of Ningxia have a smaller proportion. In general, the agricultural water and land resources of Ningxia are mainly distributed along the Yellow River.
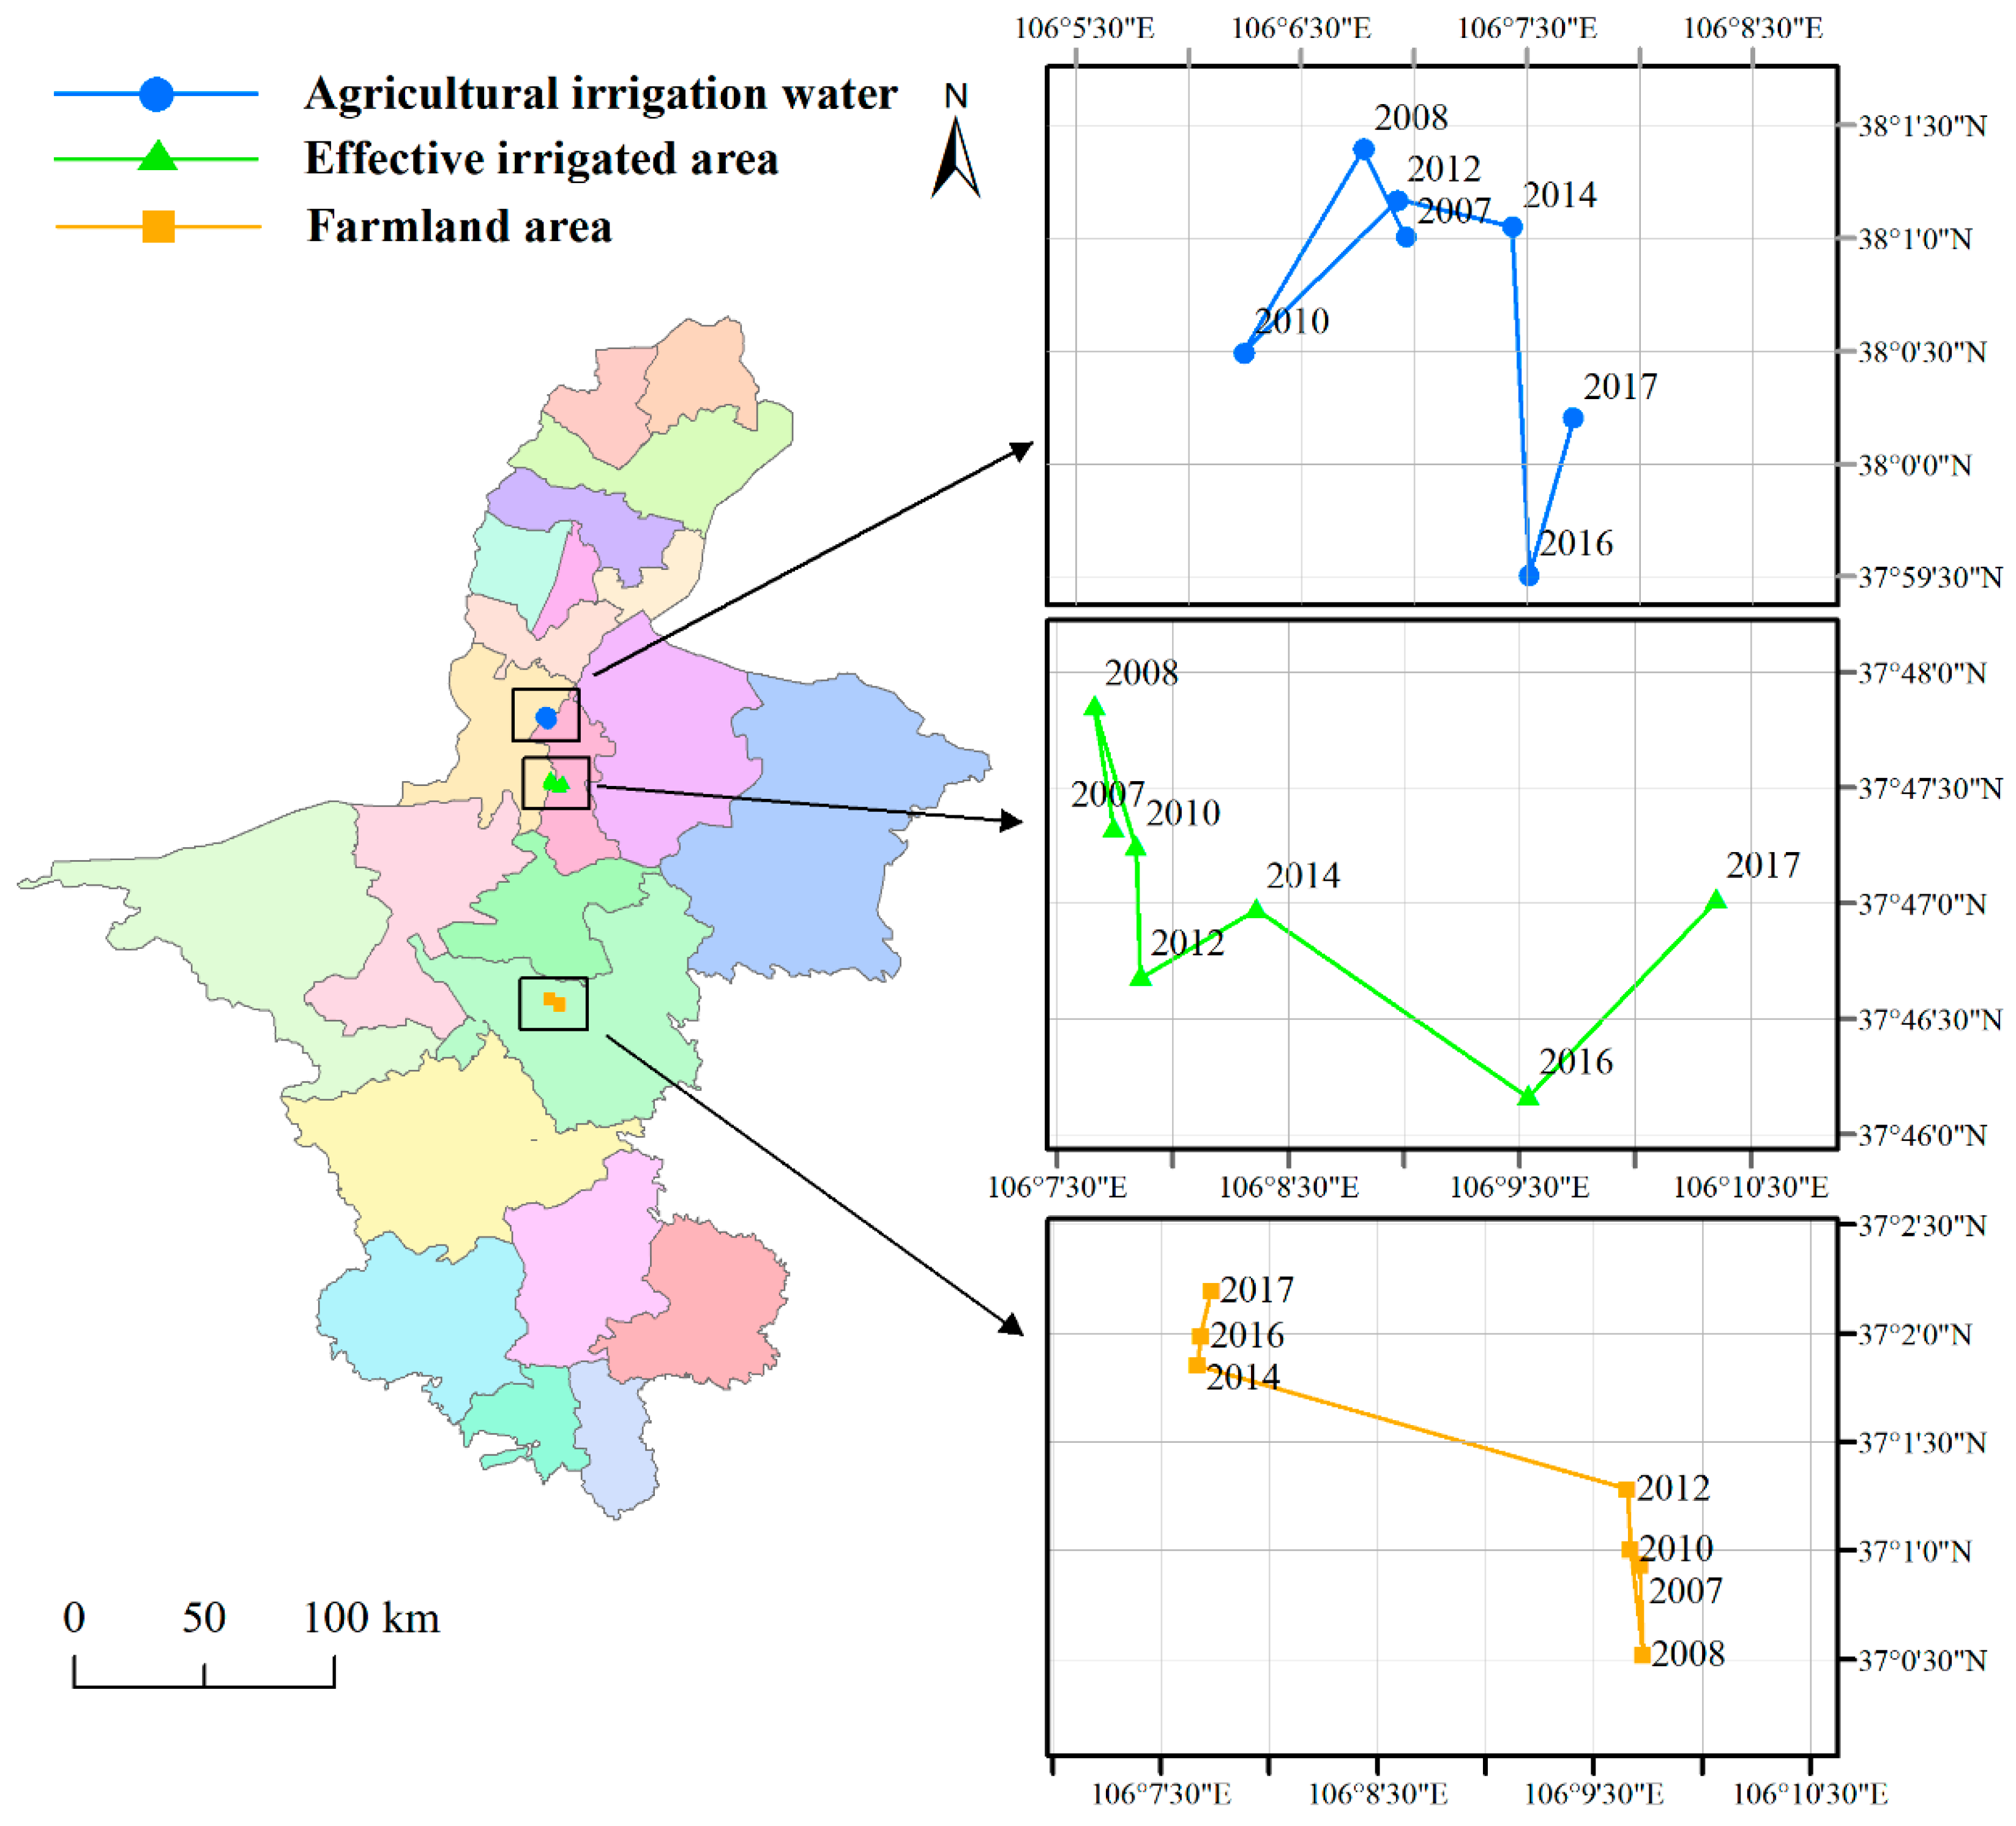
The change of trajectories of FA, EIA and AIW in Ningxia from 2007 to 2017 can be compared in Figure 3, according to Equation (3). In addition, moving distances and directions of gravity centers of FA, EIA and AIW were also calculated to better analyze the spatial change between agricultural water and land resources, as shown in Table 1. The gravity center of FA was located at Tongxin County of central Ningxia, while the gravity centers of EIA and AIW were located at the junction of Qingtongxia and Litong District, where around 100 km north of the gravity center of FA. The gravity centers of EIA and AIW were close and far away from the gravity center of FA, which means a relatively better degree of spatial balance between EIA and AIW. The gravity center of FA slightly fluctuated first in north-south direction from 2007 to 2012, then moved to northwest from 2012 to 2014, and finally remained stable. Overall, the gravity center of FA was shifted about 4.35 km northwestward during the study period of 2007–2017. The gravity center of EIA gradually moved southward and eastward since 2010 and moved 6.7° and 4.86 km to the southeast during the entire 11 years. By comparison, the trajectory of the gravity center of AIW was relatively messy, but still showed a moving distance of 1.99 km to the southeast from 2007 to 2017. The position and the movement of AIW’s gravity center was more consistent with that of EIA, which indicated that, at the scale of Ningxia, AIW had a better spatial matching relationship with EIA, instead of FA.
4.2. Spatial Matching Pattern between Water and Land Resources Based on the Gini Coefficient and Spatial Mismatch Index
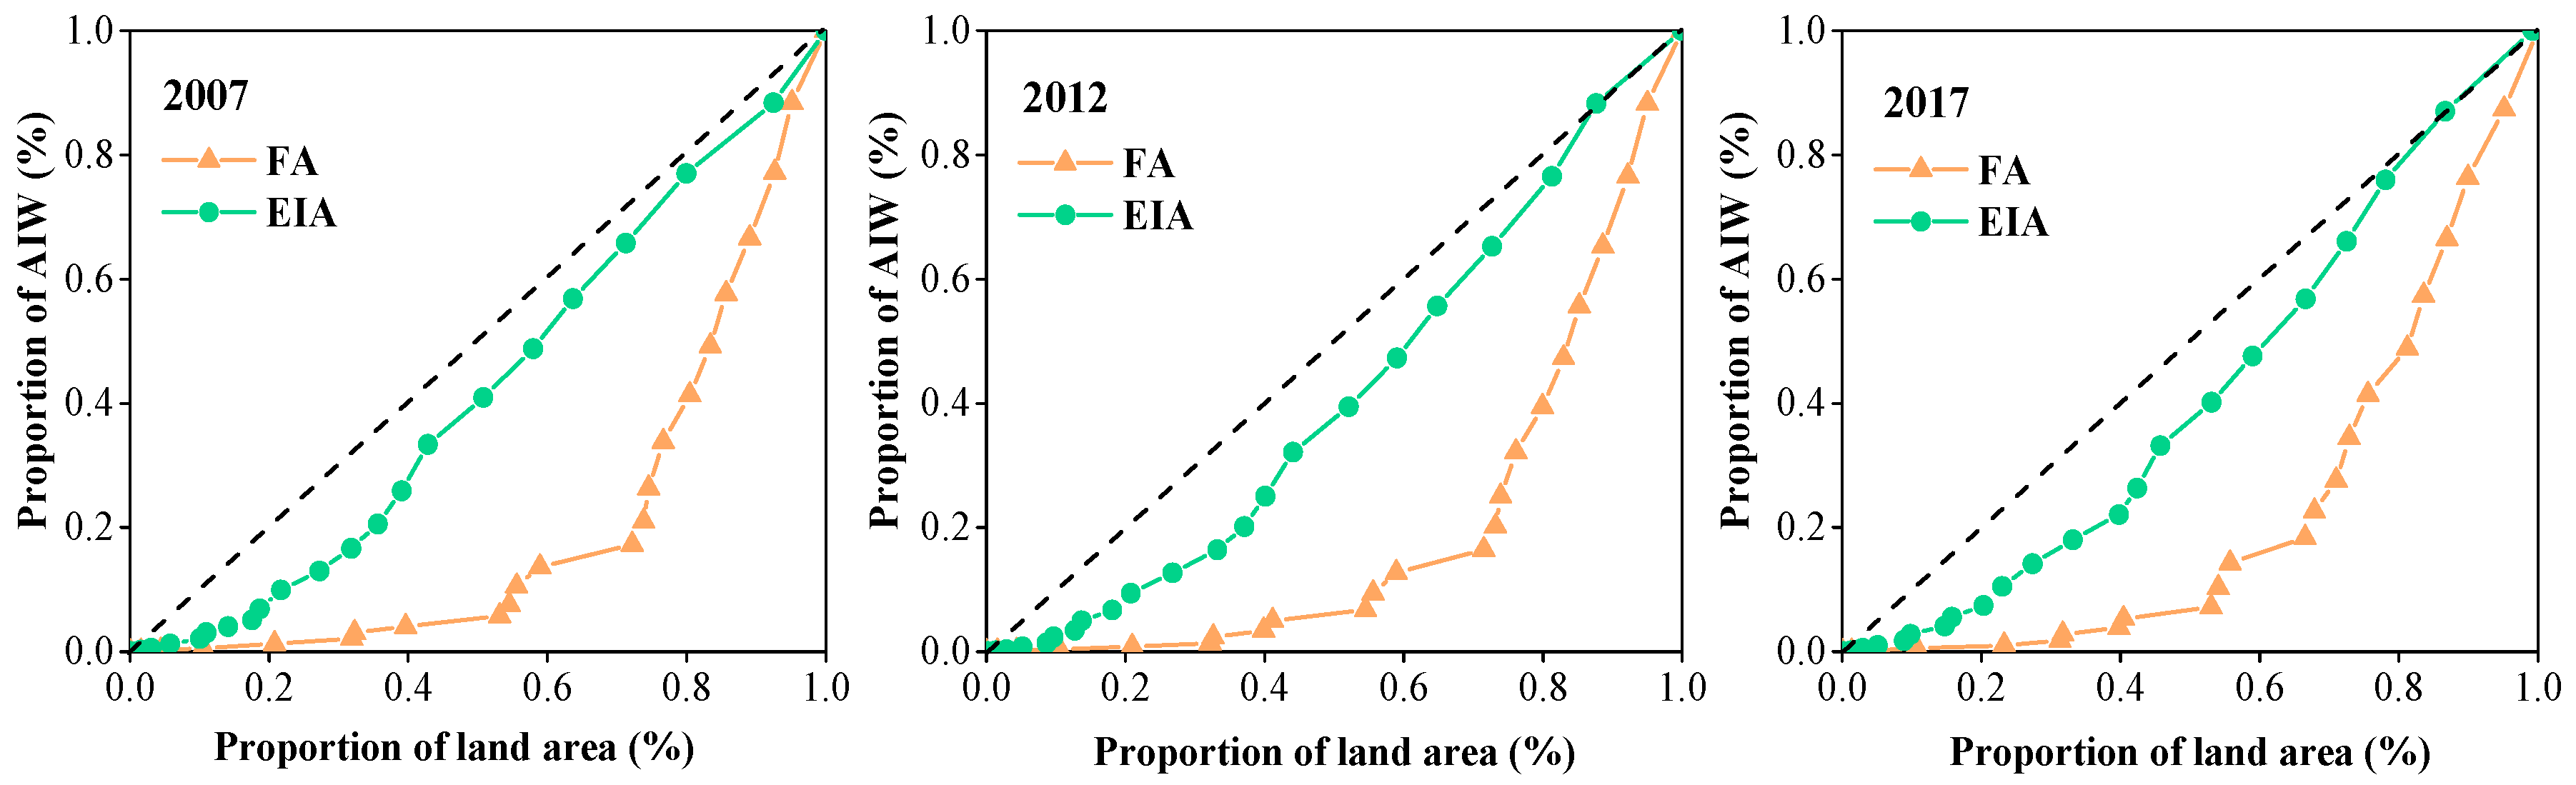
Taking the case of 2007, 2012 and 2017 as examples, the cumulative proportion of AIW at each county among the total AIW and the cumulative percentage of agricultural land area at each county among the total cultivated area of Ningxia were calculated, which were plotted in Lorentz curves, as shown in Figure 4. The larger the area between the Lorentz curve and the absolute equality curve (1:1 curve) is, the higher the Gini coefficient is. Similarly, the distance between two Lorentz curves show their bias of matching condition [21,39]. In selected three years, the Lorentz curve curvature of FA were much bigger than that of EIA, which means a higher Gini coefficient of AIW and FA.
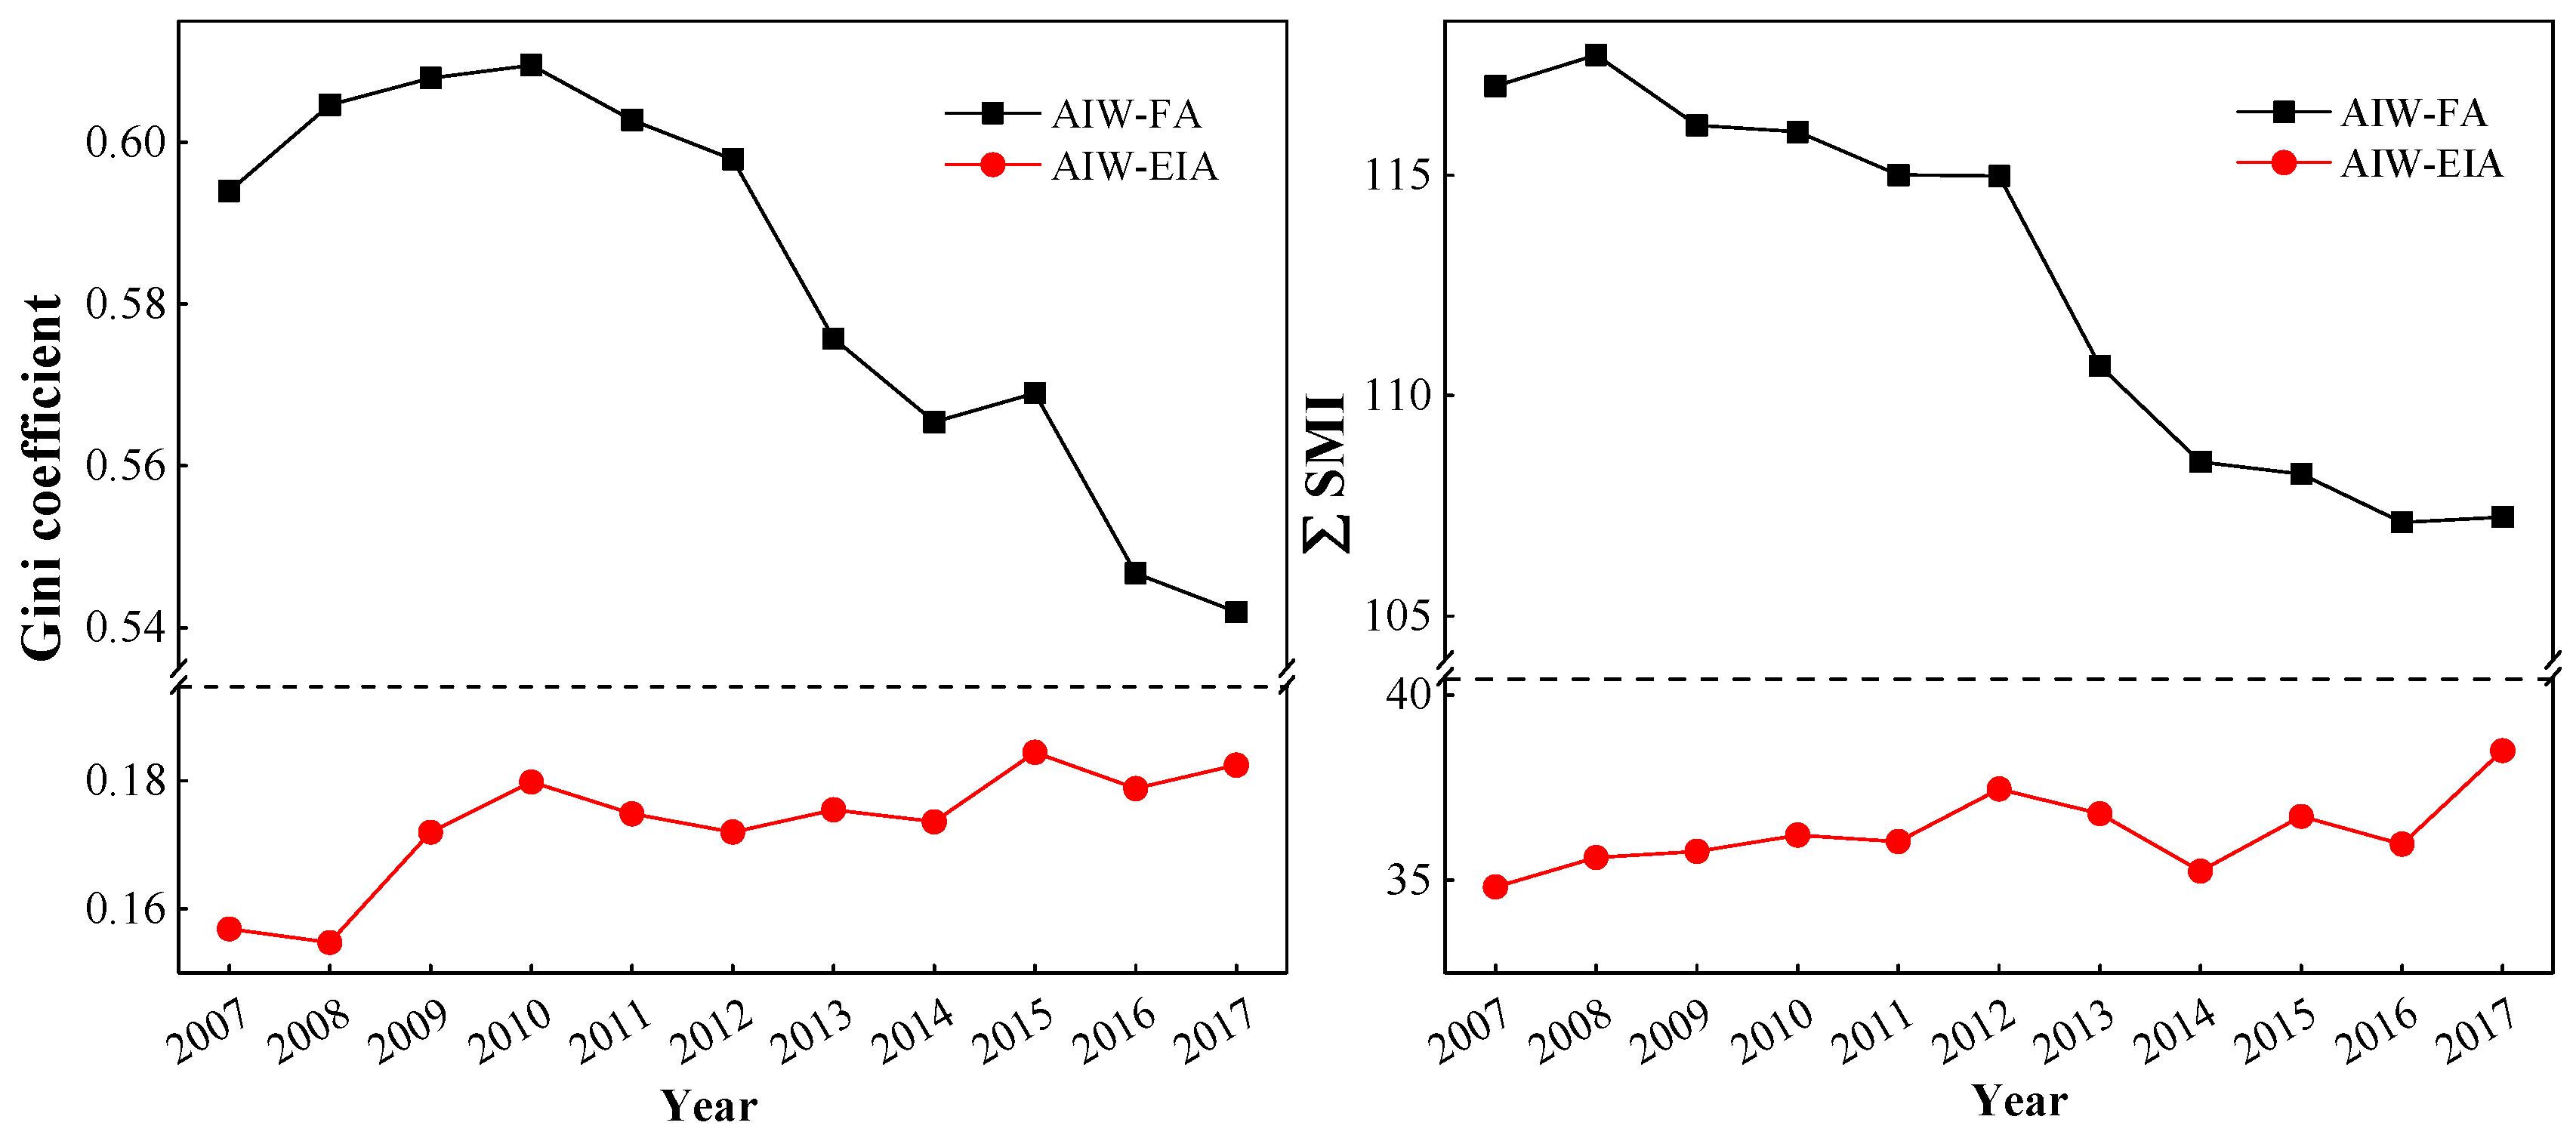
In order to evaluate the spatial matching degree of agricultural water and land resources in Ningxia from 2007 to 2017, the Gini coefficient and total spatial mismatch index of agricultural water and land resources () were calculated, respectively, as shown in Figure 5. It can be seen from the Figure 5 that the Gini coefficient of AIW–EIA was between 0.155 and 0.184 during 11 years, which was <0.2, indicating that the matching degree between AIW and EIA is high. Whereas the Gini coefficient of AIW–FA was >0.5, which indicates a poor matching relationship between AIW and FA. Similarly, the value of was less than 39 while the value of was greater than 107, which could illustrate that the disequilibrium level between AIW and FA is much higher than that of AIW and EIA. From 2007 to 2010, the Gini coefficient of AIW–FA slowly increased and then continuously declined after 2010; also showed a consecutive downward trend during the study period, suggesting that the spatial mismatch between AIW and FA was gradually remedied. Oppositely, both the Gini coefficient of AIW–EIA and showed a gradual increase, indicating a reduction of the matching degree between AIW and EIA during the study period.
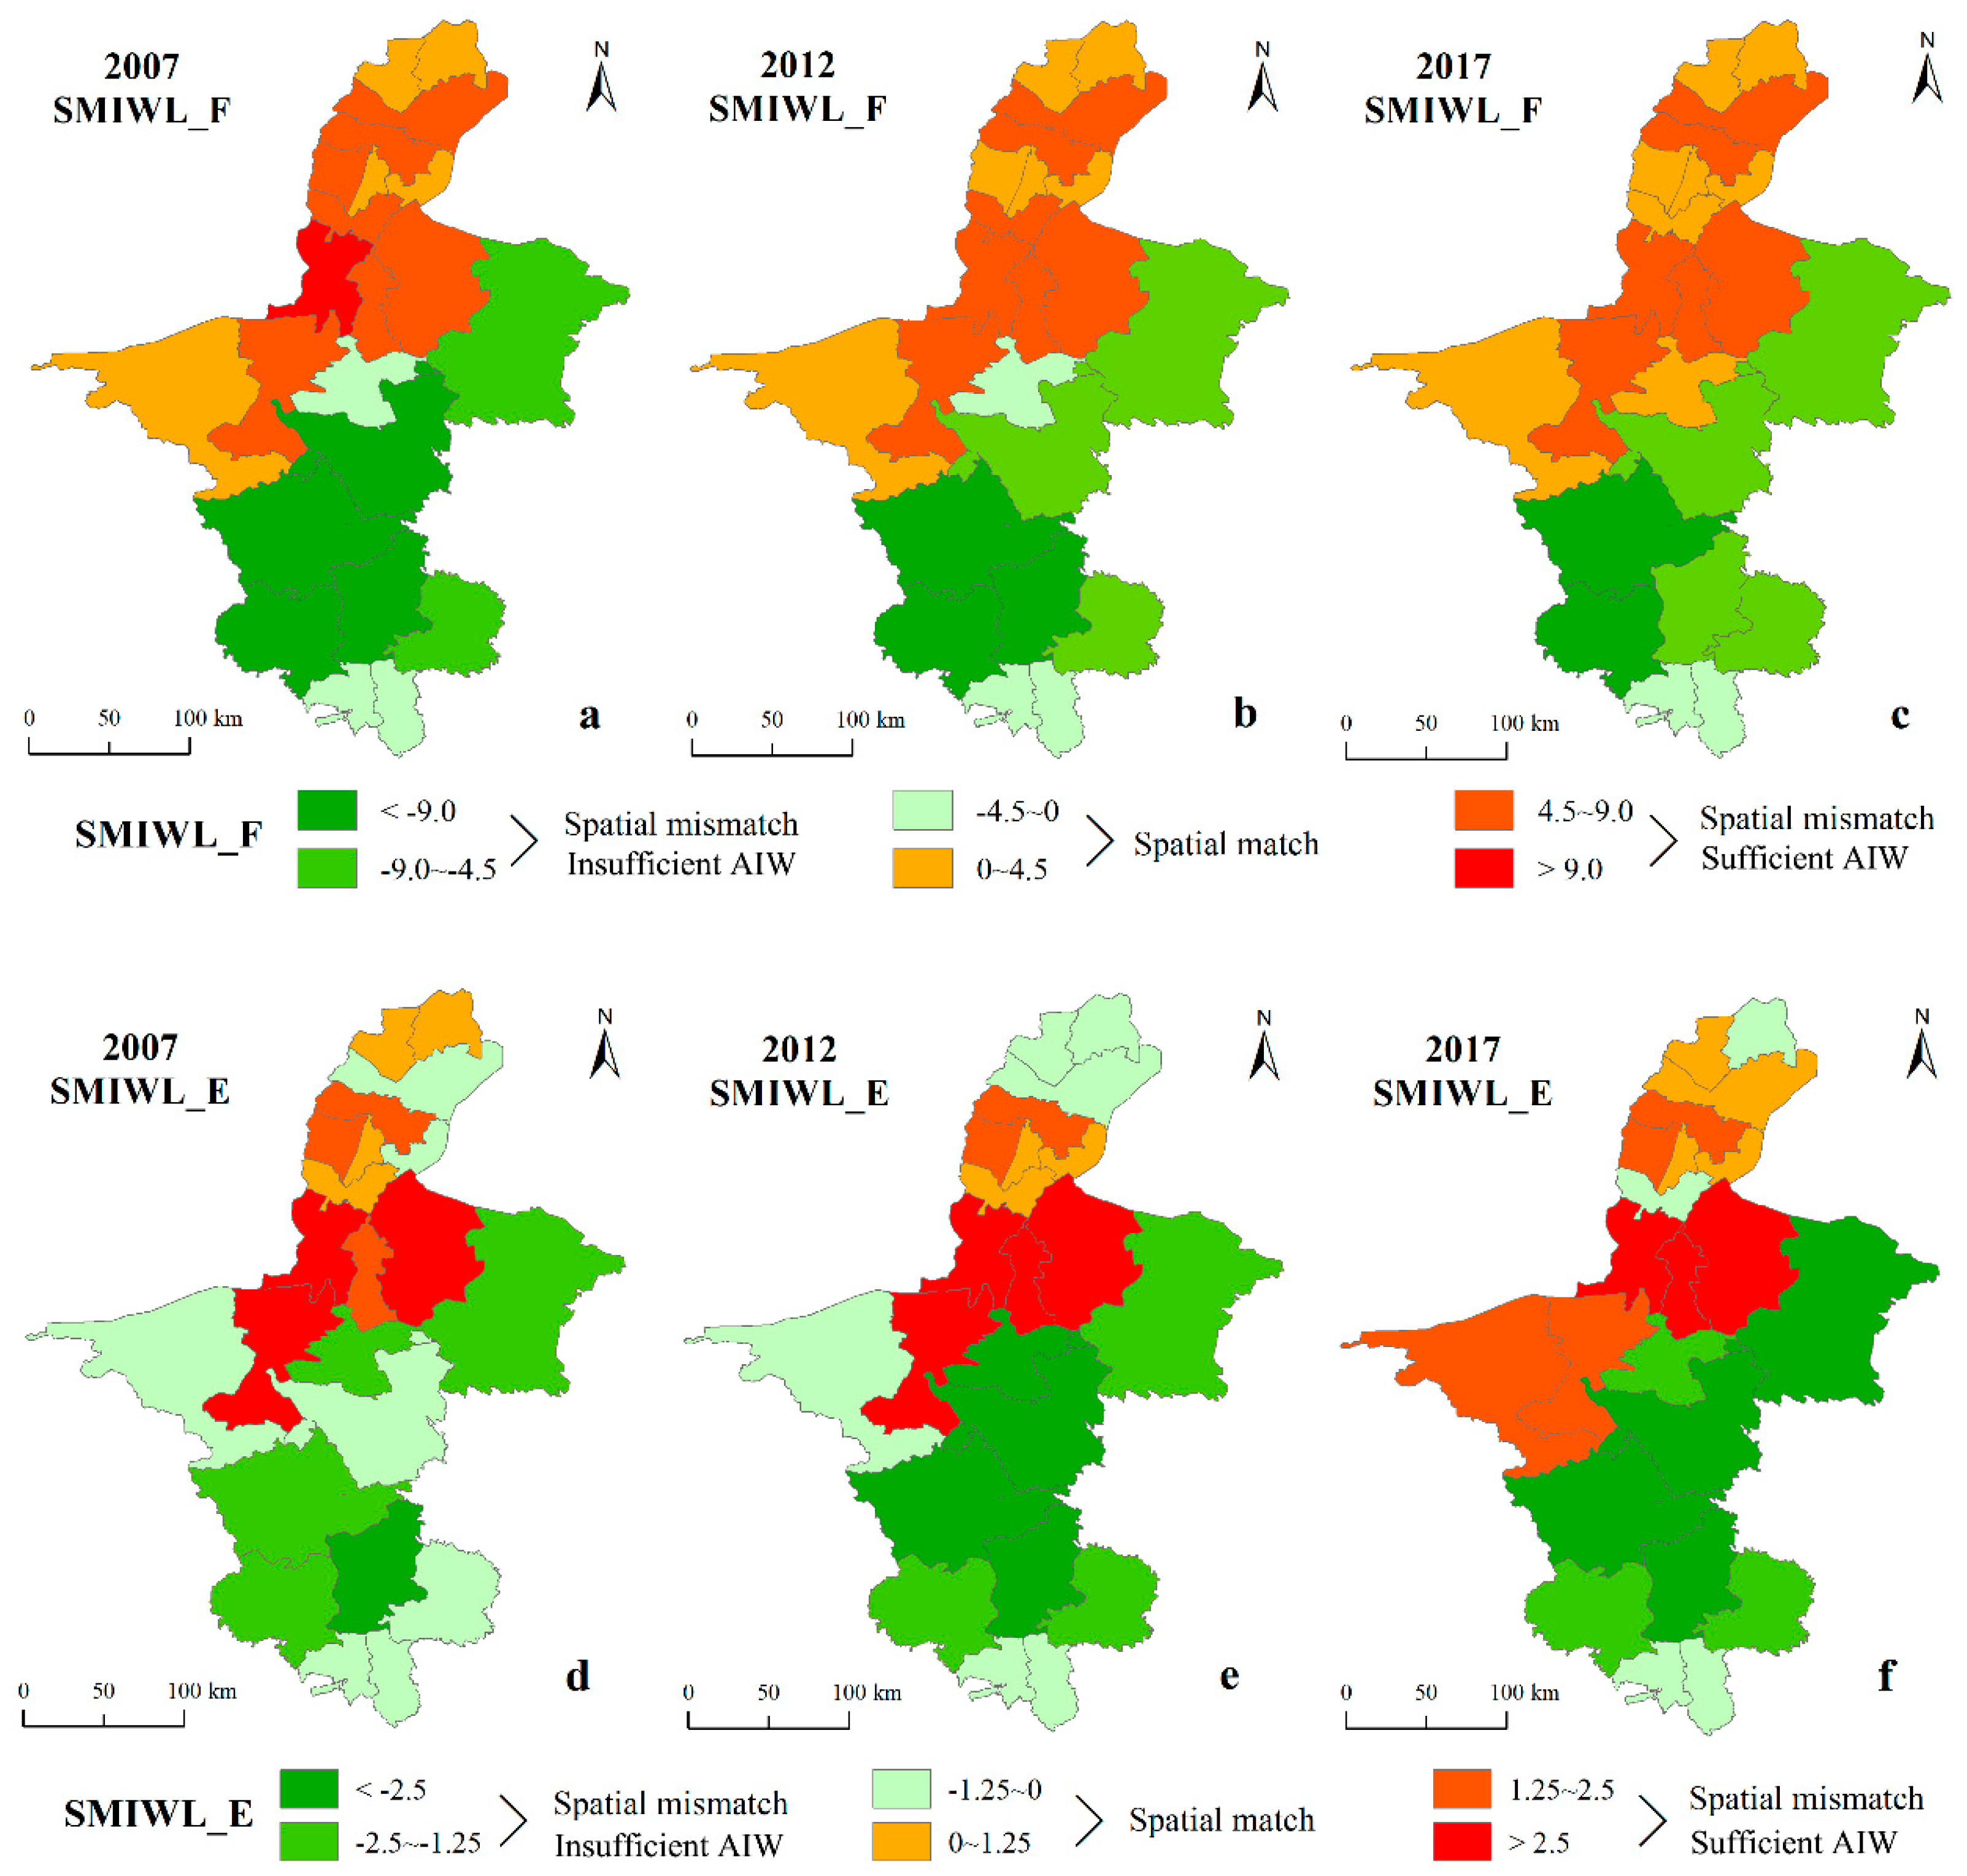
To analyze the spatial–temporal variation of matching characteristics of agricultural water and land resources in each single county in Ningxia, we calculated and of each county and district in 2007, 2012 and 2017, according to Equations (6) and (7). Based on the Jenks Natural Breaks Classification in ArcGIS software, we set −4.5 and 4.5 as critical values to determine whether the relationship between AIW and FA is spatial match or mismatch. In the same way, −1.25 and 1.25 were set as the standard values to evaluate the matching condition between AIW and EIA, as shown in Figure 6.
In terms of FA, most counties with sufficient irrigation were in central-northern Ningxia, such as Qingtongxia, Pingluo and Zhongning, as shown in Figure 6a–c. On the contrary, areas where AIW is scarce were mainly distributed in the southeastern part of Ningxia. For example, Yuanzhou, Xiji and Haiyuan have deficient irrigation and be exposed to the most serious problem of more FA and less AIW. From 2007 to 2017, the spatial matching situation between AIW and FA was improved. For instance, the absolute values of SMIWL_F decreased in Qingtongxia, Tongxin and Yuanzhou, which showed a modified spatial balance between AIW and FA. As for EIA, counties with sufficient irrigation were mainly distributed in Zhongning, Qingtongxia, Litong and Lingwu. The same as FA, areas where AIW is scarce were mainly distributed in the south and east part of Ningxia. The number of counties with spatial matching relationship between AIW and EIA is more than that of AIW and FA, which means a better spatial matching degree between AIW and EIA in Ningxia. Nevertheless, many counties led a worse spatial matching condition between AIW and EIA during the study area. For example, sufficiently irrigated counties had more AIW such as Shapotou and Litong, and counties in eastern and southern Ningxia like Yanchi, Tongxin and Haiyuan had more FA and relatively less AIW.
4.3. Sensitivity Analysis of Agricultural Irrigation Water to Land Resource
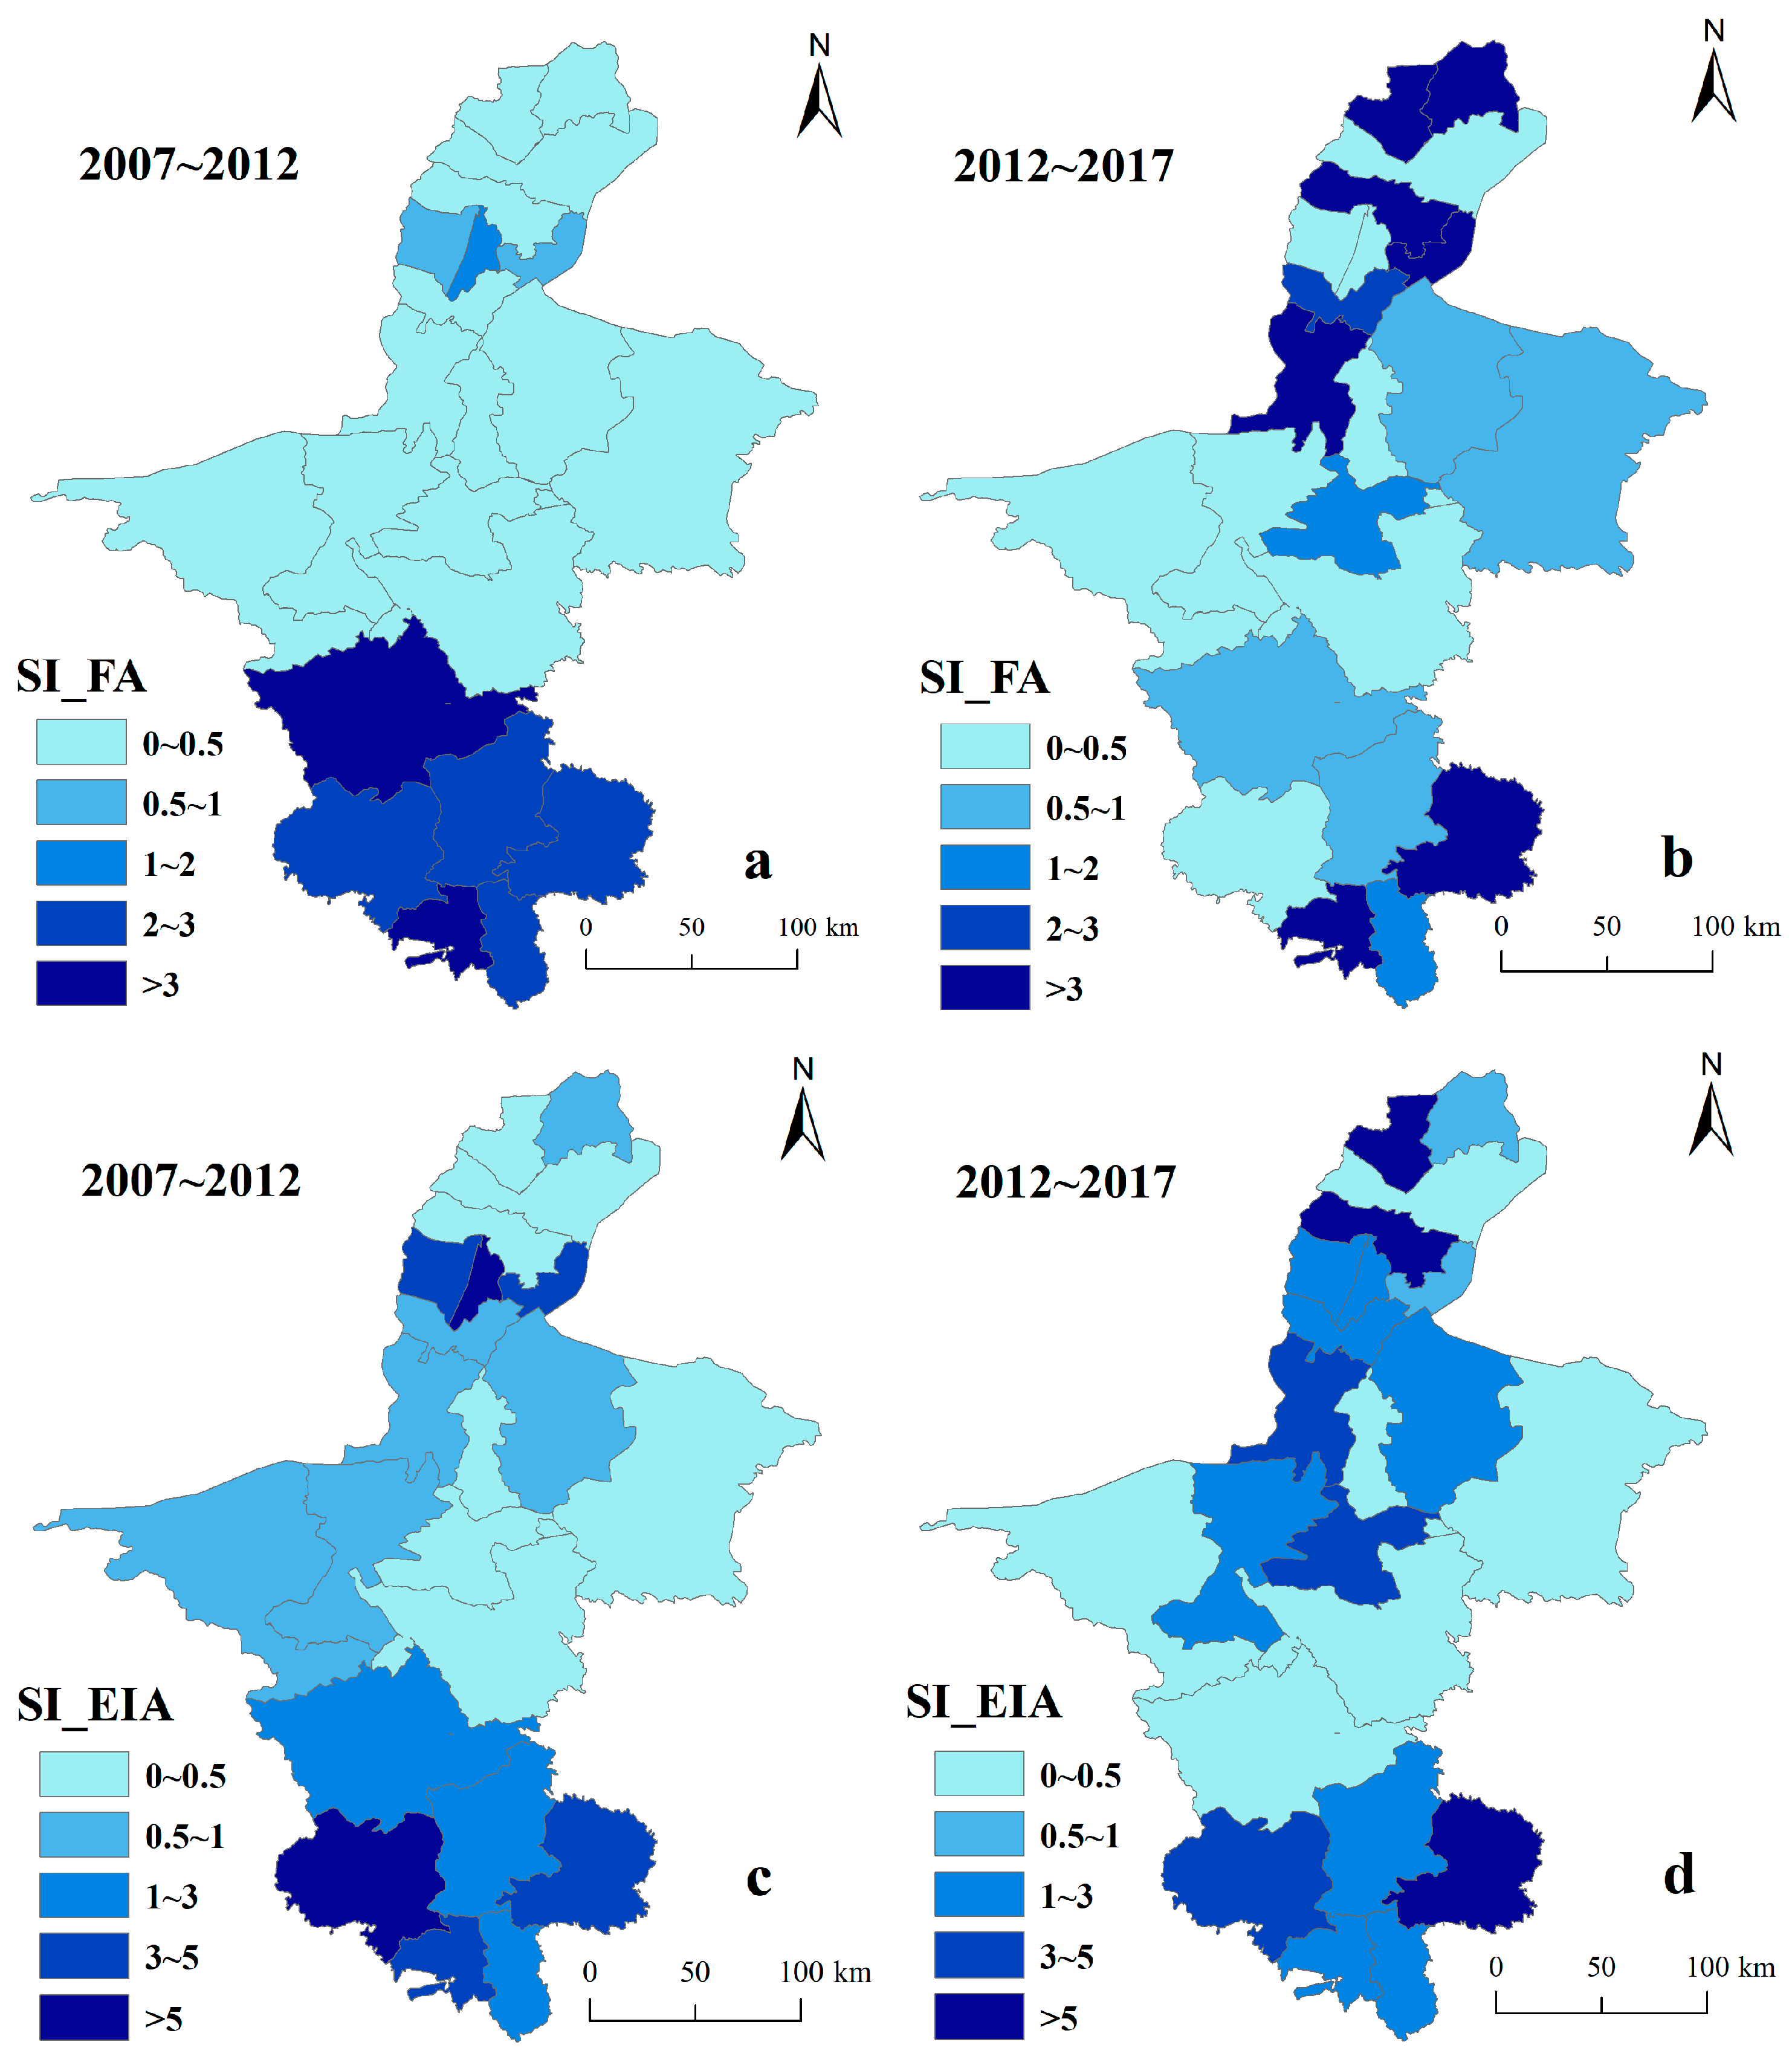
According to Equation (10), we calculated the sensitivity index of agricultural irrigation water use. The results showed that the sensitivity index of AIW to FA in Ningxia was 0.319 and 17.901 from 2007 to 2012 and 2012 to 2017, respectively. This indicates that for every 1% change in FA, AIW fluctuated by an average of 0.319% and 17.901%. Similarly, the sensitivity index of AIW to EIA increased from 0.525 in 2007~2012 to 2.374 in 2012~2017. Taken together, these results suggested that the sensitivity of agricultural irrigation water use to agricultural land resources had obviously increase in these 11 years.
The distribution of sensitivity index of agricultural irrigation water use to agricultural land resources in each county or district of Ningxia is shown in Figure 7. From 2007 to 2012, the sensitivity of AIW to FA was higher in southern part of Ningxia. After 2012, counties in the central-east, especially in northern area of Ningxia represented remarkable increased sensitivity of AIW to FA, while the southern region of Ningxia showed the opposite trend. In a similar way, counties with higher sensitivity of AIW to EIA showed a trend of moving northwards.
5. Discussion
5.1. Comparison of Methods for Matching Characteristics between Water and Land Resources
As a relative concept, the Gini coefficient reflects the overall matching level of the region by hierarchically ordering the subunits. The results of water and land resources matching based on Gini coefficient considerably varied in different regions and at different scales. Liu et al. [21] found that the matching degree of agricultural water and land resources was very high (G < 0.1) in Jiansanjiang Administration of Heilongjiang Province, China. Chen et al. [40] reported that the matching situation of water and land resources in China was continued poor during 2009 to 2016, with a Gini coefficient of farmland and water resource increased from 0.411 to 0.478. Most current studies taken farmland area as indicator of land resource and the indicator of water resource were determined by different research purposes. In this paper, AIW was selected as the index of agricultural water resource and the Gini coefficient of AIW and EIA (G = 0.173) was much lower than that of AIW and FA (G = 0.583). This finding has an important implication that AIW and EIA are direct reflection of hydraulic engineering construction such as water storage projects, diversion projects and pumping projects, etc. The matching degree between AIW and EIA could better explain the development and utilization level of irrigation agriculture. SMIWL refers to the mismatch situation between water and land resources’ location quotient in each unit, which is, essentially, a relative concept. Therefore, the results of the two evaluative methods in this study were in accordance.
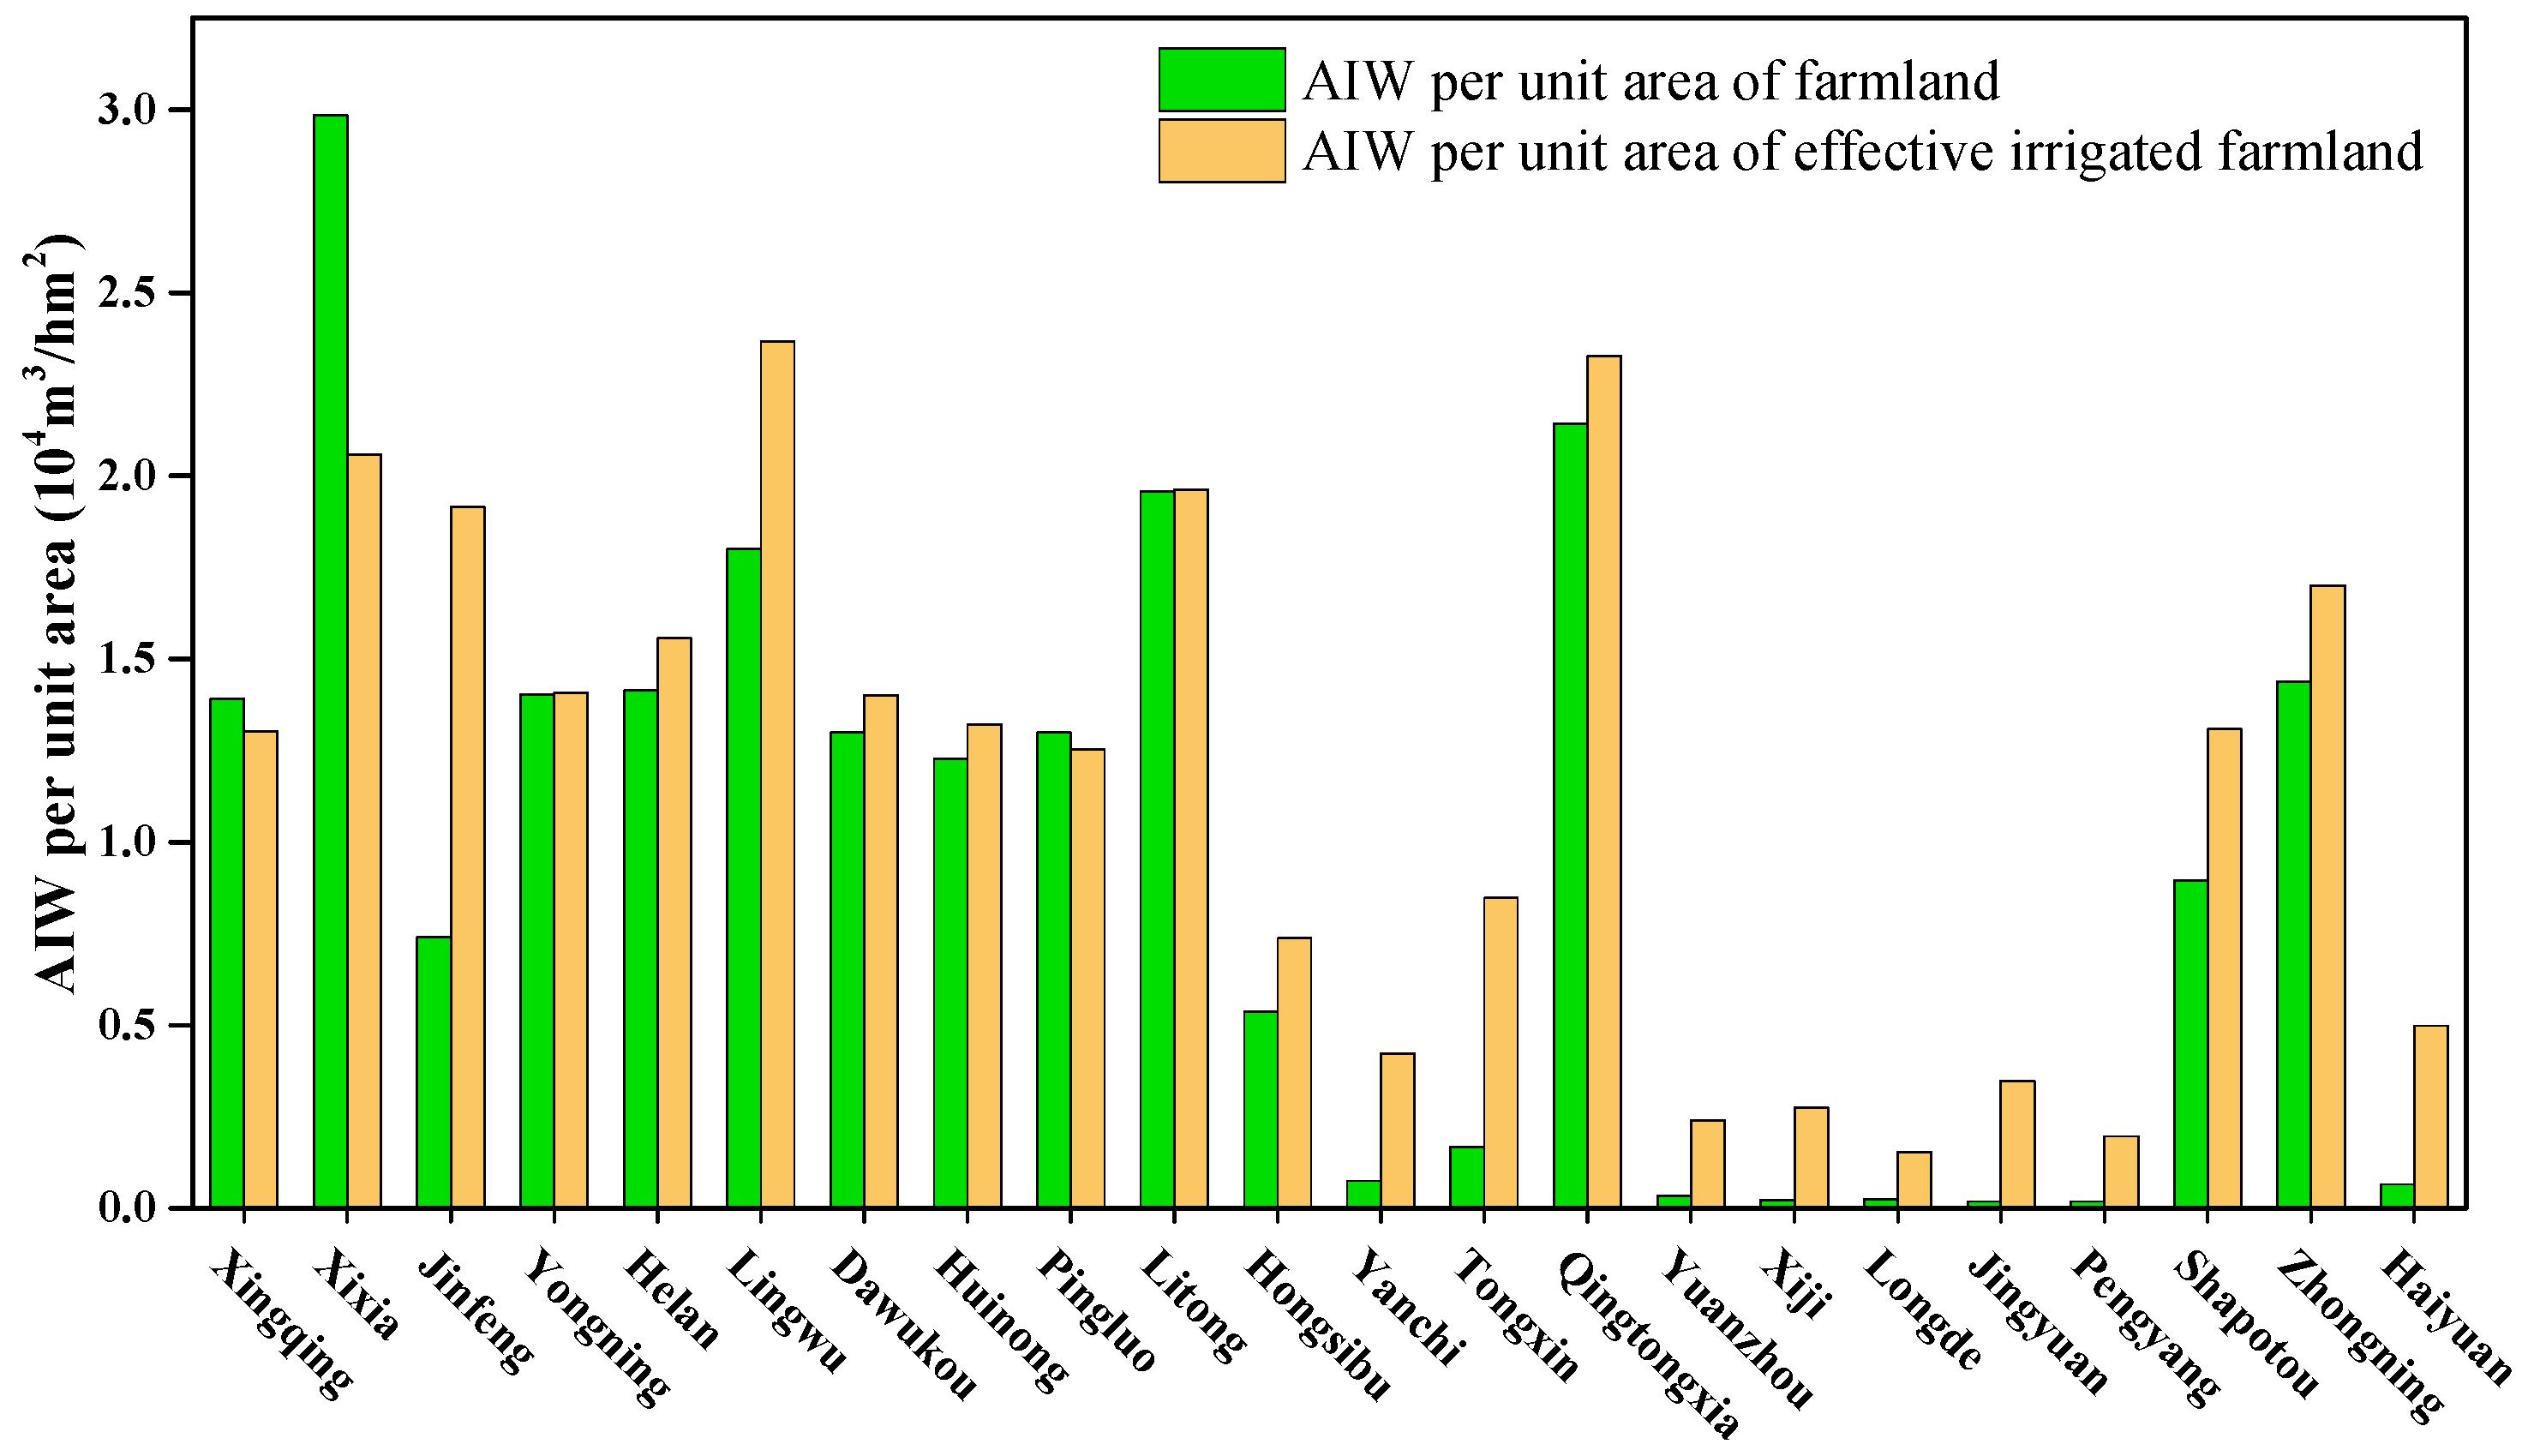
However, unlike the above calculation methods based on relative concepts, many scholars chosen the water resource volume per unit area to distinguish the matching degree between water and land resources [11,21,41,42]. We also used this method to calculate the average AIW per unit of FA and per unit of EIA each county in Ningxia from 2007 to 2017, as shown in Figure 8. In the north of Ningxia, counties in gravity irrigation zone along Yellow River had both greater than 1.0 × 10⁴ m3 AIW per unit FA and per unit of EIA, which is far more than that of counties in the arid sandy area of central-eastern Ningxia and hilly region of southern Ningxia. Except for individual counties or districts such as Xixia and Jinfeng, the AIW per unit FA and AIW per unit EIA showed very closed values in northern Ningxia, which could, from another perspective, demonstrated that the matching degree between FA and EIA is very high and cultivated land have good irrigation condition in self-flow irrigation zone of Yellow River. On the contrary, for counties in central and southern Ningxia, the value of AIW per unit EIA is considerably higher than AIW per unit FA, indicating further water conservancy works are still needed in these regions. The unit area method could directly compare the possessive quantity of water resource among subunits, but could not precisely illustrate whether or not the water and land resources are in matching situation. In addition, the higher the water resource per unit area does not explain the higher matching degree between water and land resources. For instance, there is a very high AIW per unit area in the Yellow River irrigation district, northern Ningxia, which may not be a good sign. Agricultural water is being wasted because of low coefficient of irrigation water utilization, and soil salinization caused by flooding irrigation deteriorates the quality of agricultural water and land resources. It can therefore be concluded that the method calculated by unit area is not applicable for areas where natural conditions and resource allocation are in widely differ in the interior.
One limitation of this study is that only the amount of agricultural irrigation water is considered, and it may not be accurate to describe the agricultural water for some rain-fed agricultural regions in southern Ningxia. Further research should also be undertaken to investigate the matching characteristics between water and land resources by considering crop water requirement and actual irrigation water supply [43].
5.2. Analysis and Suggestions of Spatial Matching Pattern between Water and Land Resources in Ningxia
According to statistical data, the area of cultivated land in Ningxia sharply declined due to various types of construction in the first decade of the 21st century, such as building land expansion, Grain for Green Project, and natural forest protection projects [44,45]. Until 2012, because of the implementation of the farmland protection policy, the farmland area has increased and subsequently remained stable [46]. In particular, non-cultivated land improvement management performed in the blowing sand region of middle Ningxia like Shapotou and Zhongning have effectively increased the farmland area. Besides, in order to achieve the balance of requisition–compensation of farmland, new land have been cultivated in the Yellow River irrigated area of northern Ningxia. These measurements may explain why the gravity center of FA moved northwestward. In recent years, many projects such as ecomigration projects, Tongxin pumping-irrigation engineering of Yellow River and Yan-Huan-Ding pumping-irrigation project of Yellow River have been constantly improved in ecological fragile areas, which led the gravity center of EIA move to the southeast. EIA is an important indicator for the development of water irrigation, and its position and trend of gravity center are more consistent with AIW.
During the study period, the value of FA and EIA significantly increased. However, their balanced relationship with AIW showed the opposite trend. The matching degree between AIW and EIA has been reduced, which could be attributed to the aging irrigation facilities and attenuate irrigation benefits. The matching status between water and land resources varies greatly among different counties in Ningxia, especially for counties in zone along Yellow River and other regions. Most newly replenished arable land is of poor quality [47] and has not been effectively utilized; thus, the key measure for farmland protection is to protect existing high-quality farmland instead of reclaiming new farmland [48]. Due to the combined effects of climate change and human activities, runoff of the Yellow River is declining. Besides, water use competition is becoming increasingly fierce between different regions and different sectors [49,50], so agricultural water consumption in Ningxia is also decreasing year by year. Meanwhile, in the case of gross water control, the trend of reducing agricultural water use in Ningxia is difficult to reverse in the short term. Therefore, the development of irrigated area should be strictly constrained, and the supporting projects for irrigated areas and water-saving modification projects should be vigorously carried out. For mountainous area of southern Ningxia, making full use of rainfall resource is an efficient way to solve the problem of water shortage. In the future, the management of agricultural water and land resources in Ningxia should comprehensively consider adjusting the cropping structure and industrial distribution, and pursuing the high efficiency, high quality and sustainable development of water and land resources.
6. Conclusions
In this paper, the spatial–temporal matching characteristics of agricultural water and land resources in Ningxia Hui Autonomous Region, China, was examined from the period of 2007 to 2017. FA and EIA were chosen as two indicators of land resources and gravity center model, Gini coefficient and spatial mismatch index were introduced to explore the matching degree and its change spatially and temporally. The conclusions of this study are as follows:
In general, the agricultural water and land resources of Ningxia are mainly distributed along the Yellow River. The gravity centers of EIA and AIW are close and far away from the gravity center of FA, which means a relatively better degree of spatial balance between EIA and AIW. Moreover, the gravity center of EIA moved southeastward by 4.86 km and that of AIW moved southeastward by 1.99 km during 2007 to 2017, while the gravity center of FA moved 147.49° in the northwest, indicating that AIW had a better spatial matching relationship with EIA, rather than FA.
Both the Gini coefficient and total spatial mismatch index of AIW–FA showed a declined trend and those of AIW–EIA presented the reverse trend, which illustrated that the spatial mismatch between AIW and FA was remedied and that of AIW and EIA was worse in the whole region. According to the spatial mismatch index, counties with sufficient irrigation were mainly distributed in central-northern Ningxia, while areas where AIW is scarce were mainly distributed in the south and east part of Ningxia. The number of counties under spatial matching between AIW and EIA is more than that of AIW and FA, which also means a better spatial matching degree between AIW and EIA.
The sensitivity of agricultural irrigation water volume to agricultural land resources obviously increased from 2007 to 2017. Besides, counties with higher sensitivity of AIW to FA or EIA showed a trend of moving northwards. EIA is an important indicator to reflect the water irrigation development, the matching degree between AIW and EIA could better explain the utilization level of irrigation agriculture. In the further work, the balance between water demand and water supply of agriculture should be considered to achieve the efficient management of agricultural water and land resources in Ningxia, northwest China.
Author Contributions
J.D. and Z.Y. wrote the main manuscript text and prepared the figures. H.W. and G.Y. advised the study design and data analysis. S.L. collected the data and provide shapefiles of figures. All authors reviewed and agreed on the content of the paper.
Funding
This research was supported by Key Research and Development Plan of Ningxia Hui Autonomous Region (2018BBF02022), the National Natural Science Foundation of China (Grant No. 51509266), National Key Research and Development Plan (2017 YFC0404405, 2018YFC0407705), and Ministry of Water Resources Finance Project Resources Water Resources Management (Grant No. 02001904).
Acknowledgments
We would like to thank Juncang Tian for his help in data collection. Also, we thank reviewers and the editor for their valuable and constructive suggestions.
Conflicts of Interest
The authors declare no conflicts of interest.
References
- Land Use, Irrigation and Agricultural Practices. Available online: http://www.fao.org/economic/ess/environment/data/land-use/en/ (accessed on 10 June 2019).
- Schultz, B.; Thatte, C.D.; Labhsetwar, V.K. Irrigation and drainage. Main contributors to global food production. Irrig. Drain. 2005, 54, 263–278. [Google Scholar] [CrossRef]
- Huang, Z.; Hejazi, M.; Tang, Q.; Vernon, C.R.; Liu, Y.; Chen, M.; Calvin, K. Global agricultural green and blue water consumption under future climate and land use changes. J. Hydrol. 2019, 574, 242–256. [Google Scholar] [CrossRef]
- Singh, A. Groundwater resources management through the applications of simulation modeling: A review. Sci. Total Environ. 2014, 499, 414–423. [Google Scholar] [CrossRef] [PubMed]
- Taye, M.; Dyer, E.; Hirpa, F.; Charles, K. Climate Change Impact on Water Resources in the Awash Basin, Ethiopia. Water 2018, 10, 1560. [Google Scholar] [CrossRef]
- FAO. The State of the World’s Land and Water Resources for Food and Agriculture: Managing Systems at Risk; Earthscan: Abingdon, UK, 2011. [Google Scholar]
- Huang, Z.; Du, X.; Castillo, C.S.Z. How does urbanization affect farmland protection? Evidence from China. Resour. Conserv. Recy. 2019, 145, 139–147. [Google Scholar] [CrossRef] [Green Version]
- Feng, B.Q. Study on the evaluation and management of irrigation water use efficiency for different scales in countrywide. Ph.D. Thesis, China Institute of Water Resources and Hydropower Research, Beijing, China, June 2013. [Google Scholar]
- Hu, Z.; Chen, Y.; Yao, L.; Wei, C.; Li, C. Optimal allocation of regional water resources: From a perspective of equity–efficiency tradeoff. Resour. Conserv. Recy. 2016, 109, 102–113. [Google Scholar] [CrossRef]
- Fan, L.; Liu, G.; Wang, F.; Ritsema, C.J.; Geissen, V. Domestic Water Consumption under Intermittent and Continuous Modes of Water Supply. Water Resour. Manag. 2014, 28, 853–865. [Google Scholar] [CrossRef]
- Liu, Y.S.; Wu, C.J. Situation of land-water resources and analysis of sustainable food security in China. J. Nat. Resour. 2002, 3, 270–275. (In Chinese) [Google Scholar]
- Zhuo, L.; Mekonnen, M.M.; Hoekstra, A.Y. The effect of inter-annual variability of consumption, production, trade and climate on crop-related green and blue water footprints and inter-regional virtual water trade: A study for China (1978–2008). Water Res. 2016, 94, 73–85. [Google Scholar] [CrossRef] [PubMed]
- Rulli, M.C.; Saviori, A.; D’Odorico, P. Global land and water grabbing. PNAS 2013, 110, 892–897. [Google Scholar] [CrossRef] [Green Version]
- Voss, K.A.; Famiglietti, J.S.; Lo, M.; de Linage, C.; Rodell, M.; Swenson, S.C. Groundwater depletion in the Middle East from GRACE with implications for transboundary water management in the Tigris-Euphrates-Western Iran region. Water Resour. Res. 2013, 49, 904–914. [Google Scholar] [CrossRef] [PubMed] [Green Version]
- Jin, L.; Young, W. Water use in agriculture in China: Importance, challenges, and implications for policy. Water Policy 2001, 3, 215–228. [Google Scholar] [CrossRef]
- Zhang, J.; Feng, Z.M.; Yang, Y.Z. Study on the balance of agricultural water and land resources in Ningxia Plain. J. Arid Land Resour. Environ. 2007, 21, 60–65. (In Chinese) [Google Scholar]
- Bekchanov, M.; Karimov, A.; Lamers, J.P.A. Impact of Water Availability on Land and Water Productivity: A Temporal and Spatial Analysis of the Case Study Region Khorezm, Uzbekistan. Water 2010, 2, 668–684. [Google Scholar] [CrossRef] [Green Version]
- Wu, Y.Z.; Bao, H.J. Regional Gini coefficient and tis used in analyzing to balance between water and soil. J. Soil Water Conserv. 2003, 17, 123–125. (In Chinese) [Google Scholar]
- Liu, Y.S.; Gan, H.; Zhang, F.G. Analysis of the Matching patterns of land and water resources in Northeast China. Acta Geogr. Sin. 2006, 61, 847–854. (In Chinese) [Google Scholar]
- Sun, Z.; Jia, S.F.; Yan, J.B.; Zhu, W.B.; Liang, Y. Study on the matching pattern of water and potential arable land resources in China. J. Nat. Resour. 2018, 33, 2057–2066. (In Chinese) [Google Scholar]
- Liu, D.; Liu, C.; Fu, Q.; Li, M.; Faiz, M.A.; Khan, M.I.; Li, T.; Cui, S. Construction and application of a refined index for measuring the regional matching characteristics between water and land resources. Ecol. Indic. 2018, 91, 203–211. [Google Scholar] [CrossRef]
- Wang, H.; Wang, L.; Yang, G.Y.; Jia, L.; Yao, Y.Z.; Zhang, Y.T. Agricultural water resources in China and strategic measures for its efficient utilization. Engin. Sci. 2018, 20, 9–15. (In Chinese) [Google Scholar] [CrossRef]
- Chen, J.L. Grey Logistic Model to Predict the Effective Irrigation Area in Liaoning Province. Appl. Mech. Mater. 2014, 641–642, 179–182. [Google Scholar] [CrossRef]
- Tan, C.; Yang, J.; Li, M. Temporal-Spatial Variation of Drought Indicated by SPI and SPEI in Ningxia Hui Autonomous Region, China. Atmosphere 2015, 6, 1399–1421. [Google Scholar] [CrossRef] [Green Version]
- Wang, F.; Yu, C.; Xiong, L.; Chang, Y. How can agricultural water use efficiency be promoted in China? A spatial–temporal analysis. Resour. Conserv. Recy. 2019, 145, 411–418. [Google Scholar] [CrossRef]
- Sun, J.; Yu, X.; Xiao, Q.; Song, J.; Sun, S. Utilization Characteristics and Sustainability Evaluation of Water Resources in China. Water 2018, 10, 1142. [Google Scholar] [CrossRef]
- Klein, L.; Salvatore, D. Shift in the world economic center of gravity from G7 to G20. J. Policy Model. 2013, 35, 416–424. [Google Scholar] [CrossRef]
- Zhang, Y.; Zhang, J.; Yang, Z.; Li, J. Analysis of the distribution and evolution of energy supply and demand centers of gravity in China. Energy Policy 2012, 49, 695–706. [Google Scholar] [CrossRef]
- Li, X.; Xiong, S.; Li, Z.; Zhou, M.; Li, H. Variation of global fossil-energy carbon footprints based on regional net primary productivity and the gravity model. J. Clean Prod. 2019, 213, 225–241. [Google Scholar] [CrossRef]
- Li, M.; Ren, X.; Zhou, L.; Zhang, F. Spatial mismatch between pollutant emission and environmental quality in China—A case study of NOx. Atmos. Pollut. Res. 2016, 7, 294–302. [Google Scholar] [CrossRef]
- Hui, Y.; Liu, S.Q.; Zhang, H.Q.; Guo, S.L. The Dynamic Evolution Track and the Coupling Mode Analysis for Economic Gravity Center and Population Gravity Center in the Contiguous Areas of Sichuan, Yunnan and Guizhou Province. Energy Procedia 2011, 13, 10052–10060. [Google Scholar]
- Gini, C. Measurement of Inequality of Income. J. Econ. Theory Econom. 1921, 31, 124–126. [Google Scholar] [CrossRef]
- Fan, Y.; Allen, R.; Sun, T. Spatial mismatch in Beijing, China: Implications of job accessibility for Chinese low-wage workers. Habitat Int. 2014, 44, 202–210. [Google Scholar] [CrossRef]
- Chai, J.; Wang, Z.; Yang, J.; Zhang, L. Analysis for spatial–temporal changes of grain production and farmland resource: Evidence from Hubei Province, central China. J. Clean Prod. 2019, 207, 474–482. [Google Scholar] [CrossRef]
- Li, T.; Long, H.; Zhang, Y.; Tu, S.; Ge, D.; Li, Y.; Hu, B. Analysis of the spatial mismatch of grain production and farmland resources in China based on the potential crop rotation system. Land Use Policy 2017, 60, 26–36. [Google Scholar] [CrossRef]
- Cho-yam Lau, J. Spatial mismatch and the affordability of public transport for the poor in Singapore’s new towns. Cities 2011, 28, 230–237. [Google Scholar] [CrossRef]
- Naghibi, S.A.; Moghaddam, D.D.; Kalantar, B.; Pradhan, B.; Kisi, O. A comparative assessment of GIS-based data mining models and a novel ensemble model in groundwater well potential mapping. J. Hydrol. 2017, 548, 471–483. [Google Scholar] [CrossRef]
- Han, Z.; Song, W.; Deng, X. Responses of Ecosystem Service to Land Use Change in Qinghai Province. Energies 2016, 9, 303. [Google Scholar] [CrossRef]
- Mehan, S.; Gitau, M.; Flanagan, D. Reliable Future Climatic Projections for Sustainable Hydro-Meteorological Assessments in the Western Lake Erie Basin. Water 2019, 11, 581. [Google Scholar] [CrossRef]
- Chen, Z.X.; Chen, Y.H.; Lei, T.J. Study on variation of cultivated land and matching of cultivated land with water resources. Water Resour. Hydropower Eng. 2019, 50, 69–78. (In Chinese) [Google Scholar]
- Tao, G.F.; Jiang, Z.H.; Qin, L.J. Analysis of balance between water and land resources in Tonghua region using Gini coefficient. Chin. J. Agric. Resour. Reg. Plan. 2012, 33, 67–71. (In Chinese) [Google Scholar]
- Geng, Q.L. Research on Zoning of Agricultural Water and Land Resources Utilization and Their Matching Characteristics in Arid Areas of Northwest of China Research Center for Eco-environments and Soil and Water Conservation. Ph.D. Thesis, Chinese Academy of Sciences & Ministry of Education, Yangling, China, June 2014. [Google Scholar]
- Tan, M. Mismatch between crop water requirements and irrigation in Heihe River Basin, Northwestern China. Irrig. Sci. 2019, 37, 95–103. [Google Scholar] [CrossRef]
- Feng, Z.; Yang, Y.; Zhang, Y.; Zhang, P.; Li, Y. Grain-for-green policy and its impacts on grain supply in West China. Land Use Policy 2005, 22, 301–312. [Google Scholar] [CrossRef]
- Wang, J.; Liu, Y.; Liu, Z. Spatio-Temporal Patterns of Cropland Conversion in Response to the “Grain for Green Project” in China’s Loess Hilly Region of Yanchuan County. Remote Sens. 2013, 11, 5642–5661. [Google Scholar] [CrossRef]
- Wu, X.; Wang, S.R.; Shang, H.Y.; Wang, C.J. Analysis of dynamic change and driving factors of cultivated land in Ningxia During the past 18 years. Chin. J. Agric. Resour. Reg. Plan. 2017, 38, 98–104. (In Chinese) [Google Scholar]
- Xie, T.S. Efficient utilization of cultivated land resources in Ningxia Hui Autonomous Region. J. Arid Land Resour. Environ. 2017, 178–184. (In Chinese) [Google Scholar] [CrossRef]
- Xin, L.; Li, X. China should not massively reclaim new farmland. Land Use Policy 2018, 72, 12–15. [Google Scholar] [CrossRef]
- Kong, D.; Miao, C.; Wu, J.; Duan, Q. Impact assessment of climate change and human activities on net runoff in the Yellow River Basin from 1951 to 2012. Ecol. Eng. 2016, 91, 566–573. [Google Scholar] [CrossRef]
- Yin, Y.; Tang, Q.; Liu, X.; Zhang, X. Water scarcity under various socio-economic pathways and its potential effects on food production in the Yellow River basin. Hydrol. Earth Syst. Sci. 2017, 21, 791–804. [Google Scholar] [CrossRef] [Green Version]
Figure 1.
The location of Ningxia in China and distribution of counties and districts in Ningxia.

Figure 2.
The distribution of annual mean agricultural water and land resources in Ningxia. (a) The proportion of farmland area (FA); (b) The proportion of effective irrigated area (EIA); (c) The proportion of agricultural irrigation water (AIW).
Figure 2.
The distribution of annual mean agricultural water and land resources in Ningxia. (a) The proportion of farmland area (FA); (b) The proportion of effective irrigated area (EIA); (c) The proportion of agricultural irrigation water (AIW).

Figure 3.
Change trajectories of gravity centers of agricultural water and land resources in Ningxia during 2007 to 2017.
Figure 3.
Change trajectories of gravity centers of agricultural water and land resources in Ningxia during 2007 to 2017.

Figure 4.
Lorentz curves of agricultural water and land resource matching in Ningxia.

Figure 5.
The Gini coefficient and spatial mismatch index of agricultural water and land resources.

Figure 6.
The spatial–temporal distribution of spatial mismatch index from 2007 to 2017. (a–c) represent of each county and district in 2007, 2012 and 2017, respectively; (d–f) represent of each county and district in 2007, 2012 and 2017, respectively.
Figure 6.
The spatial–temporal distribution of spatial mismatch index from 2007 to 2017. (a–c) represent of each county and district in 2007, 2012 and 2017, respectively; (d–f) represent of each county and district in 2007, 2012 and 2017, respectively.

Figure 7.
Sensitivity of irrigation water use during 2007–2012 and 2012–2017. (a,b) represent sensitivity index of AIW to FA, respectively; (c,d) represent sensitivity index of AIW to EIA, respectively.
Figure 7.
Sensitivity of irrigation water use during 2007–2012 and 2012–2017. (a,b) represent sensitivity index of AIW to FA, respectively; (c,d) represent sensitivity index of AIW to EIA, respectively.

Figure 8.
Annual mean agricultural irrigation water use per unit area.


Table 1.
Moving distances and directions of gravity centers.
| Period (year) | Gravity Center of FA | Gravity Center of EIA | Gravity Center of AIW | |||
|---|---|---|---|---|---|---|
| Direction (°) | Distance (km) | Direction (°) | Distance (km) | Direction (°) | Distance (km) | |
| 2007~2012 | 99.60 | 0.65 | −79.68 | 1.20 | 104.33 | 0.30 |
| 2012~2014 | 163.99 | 3.83 | 30.07 | 1.07 | −12.72 | 0.96 |
| 2014~2017 | 79.25 | 0.65 | 1.28 | 3.69 | −72.50 | 1.63 |
| 2007~2017 | 147.49 | 4.35 | −6.70 | 4.86 | −47.40 | 1.99 |
© 2019 by the authors. Licensee MDPI, Basel, Switzerland. This article is an open access article distributed under the terms and conditions of the Creative Commons Attribution (CC BY) license (http://creativecommons.org/licenses/by/4.0/).
Share and Cite
MDPI and ACS Style
Du, J.; Yang, Z.; Wang, H.; Yang, G.; Li, S. Spatial–Temporal Matching Characteristics between Agricultural Water and Land Resources in Ningxia, Northwest China. Water 2019, 11, 1460. https://doi.org/10.3390/w11071460
AMA Style
Du J, Yang Z, Wang H, Yang G, Li S. Spatial–Temporal Matching Characteristics between Agricultural Water and Land Resources in Ningxia, Northwest China. Water. 2019; 11(7):1460. https://doi.org/10.3390/w11071460
Chicago/Turabian StyleDu, Jie, Zhaohui Yang, Hao Wang, Guiyu Yang, and Shuoyang Li. 2019. "Spatial–Temporal Matching Characteristics between Agricultural Water and Land Resources in Ningxia, Northwest China" Water 11, no. 7: 1460. https://doi.org/10.3390/w11071460
Note that from the first issue of 2016, this journal uses article numbers instead of page numbers. See further details here.