Economic Impact of Overtopping and Adaptation Measures in Catalan Ports Due to Sea Level Rise


1
Laboratori d’Enginyeria Marítima, Universitat Politècnica de Catalunya BarcelonaTech, Jordi Girona 1-3, Mòdul D1, Campus Nord, 08034 Barcelona, Catalonia, Spain
2
Centre Internacional d’Investigació dels Recursos Costaners (CIIRC), Jordi Girona 1-3, Mòdul D1, Campus Nord, 08034 Barcelona, Catalonia, Spain
Water 2019, 11(7), 1440; https://doi.org/10.3390/w11071440
Submission received: 5 June 2019
/
Revised: 9 July 2019
/
Accepted: 11 July 2019
/
Published: 12 July 2019
(This article belongs to the Special Issue Effect of Climate Change on Coastal Hydrodynamics)
Abstract
:In this paper, the impact of sea level rise (SLR) throughout the 21st century in the overtopping of port breakwaters is analyzed at a regional scale, focusing on the Catalan coast (NW Mediterranean). The study is made considering three scenarios of SLR and two levels of storminess, computing the overtopping discharges in 47 ports to assess those exceeding a tolerable threshold and to roughly estimate the monetary value of the consequences of such discharges. Possible adaptation measures are examined, selecting the most cost-effective and assessing the cost of its implementation for the different scenarios and two damage levels. Results show that, as it could be expected, the number of ports affected by overtopping will increase with SLR, as well as the economic impact. Another remarkable finding of this paper is the significant savings in adaptation measures achieved allowing a minimum level of damage in contrast to the zero-damage option.
1. Introduction
Climate change has become a major focus of attention for the media and society in general, due to its possible impacts on the environment. Systems like coasts, which are particularly vulnerable, may be exposed to severe hazards [1,2,3]. In coastal areas, one of the best-known consequences of global warming is the sea level rise (SLR) and its effects on coastal communities [4]. The study of SLR impacts has focused on its effects on beaches [5,6], coastal defense structures [7,8,9], coastal ecosystems [10], coastal areas [11,12,13,14,15,16] including flooding of urban areas [17,18], or coastal energy infrastructure [19].
Port activities, however, have received less attention in such impact analysis [20], even though seaports are located on the coast or in estuaries and therefore they are prone to being affected by SLR. A higher mean sea level may jeopardize port exploitation due to the reduction of dock freeboard. In addition, SLR will increase the water depth around and inside the harbor, modifying wave propagation patterns. This could affect processes like wave agitation (oscillations within the port), siltation, or structure stability [21]. The impacts may be either positive or negative, i.e., they can improve or worsen ports’ operability. This represents a potential climatic risk in coastal zones, since seaports play a crucial role in the global economy as transportation hubs, and their contribution to economic activity in the coastal fringe and their hinterland is significant [22].
Despite this, the studies addressing the impacts of climate change on harbors [20,23] are few compared with the numerous assessments of such impacts on coastal areas [24]. Some studies have analyzed the impact of changes in wave patterns due to climate change on wave agitation in ports [24,25,26], the consequences of climate change on port breakwater stability [27,28], and the effect of SLR on port breakwater overtopping [29].
One of the greatest potential impacts of SLR on seaports is wave overtopping, as SLR reduces the port breakwater freeboard, facilitating that waves pass over such structures and, hence, increasing overtopping discharges. This could lead to damage to assets located at the breakwater lee side such as goods, boats, or warehouses [20].
The aim of this paper is to assess (at a regional scale and during the 21st century) the economic impact of port breakwater overtopping, and which are the possible adaptation measures that could be applied. The analysis consists of quantifying in a rough manner (i.e., to obtain orders of magnitude) the expected overtopping discharges under different SLR scenarios and their evolution during the 21st century. The effect of eventual changes in wave patterns (whose expected magnitude is limited as indicated in [30]) is not considered, although their combination with SLR could modify breakwater overtopping discharges, being these changes either positive (reducing overtopping discharge) or negative (enhancing discharges). The study focuses on the harbors located on the Catalan coast (NW Mediterranean). The vulnerability of these ports to overtopping in the year 2100 was previously estimated in [29], considering three scenarios of SLR. In this paper, the decadal evolution of overtopping and the resulting impacts are assessed during the 21st century. In addition, in this case, all the ports located on the Catalan coast (47) are analyzed instead of the 43 studied in that previous work and, as additional contributions, damage costs due to overtopping are estimated, adaptation measures are proposed, and their cost assessed.
2. Study Area
The Catalan coast (NW Mediterranean) is about 700 km long and extends from latitude 40°45′ N to 42°25′ N and from longitude 0°45′ E to 3°15′ E. This area is a microtidal environment, with tidal ranges of about 20 cm [24].
The climatic features of the NW Mediterranean are modulated by its complexity (e.g., veering winds, orography, bathymetry) and semi-enclosed character, which lead to large seasonal variability [20]. There exist local high and low atmospheric pressure systems, which are controlled by orographic barriers like the Pyrenees, conditioning the spatial distribution of winds and, therefore, the wave climate. In general, the average winds are of low to medium intensity, with some extreme synoptic events occurring [31].
With regard to the wave climate, the highest waves come from the E or E-NE, where the longest fetches and stronger winds coincide [31]. Concerning the directional distribution of waves, at the southern and northern sections of the area waves from NW and N prevail, while in the central part of this coast E and S wave conditions are dominating. These wave climate conditions are necessary to assess port overtopping.
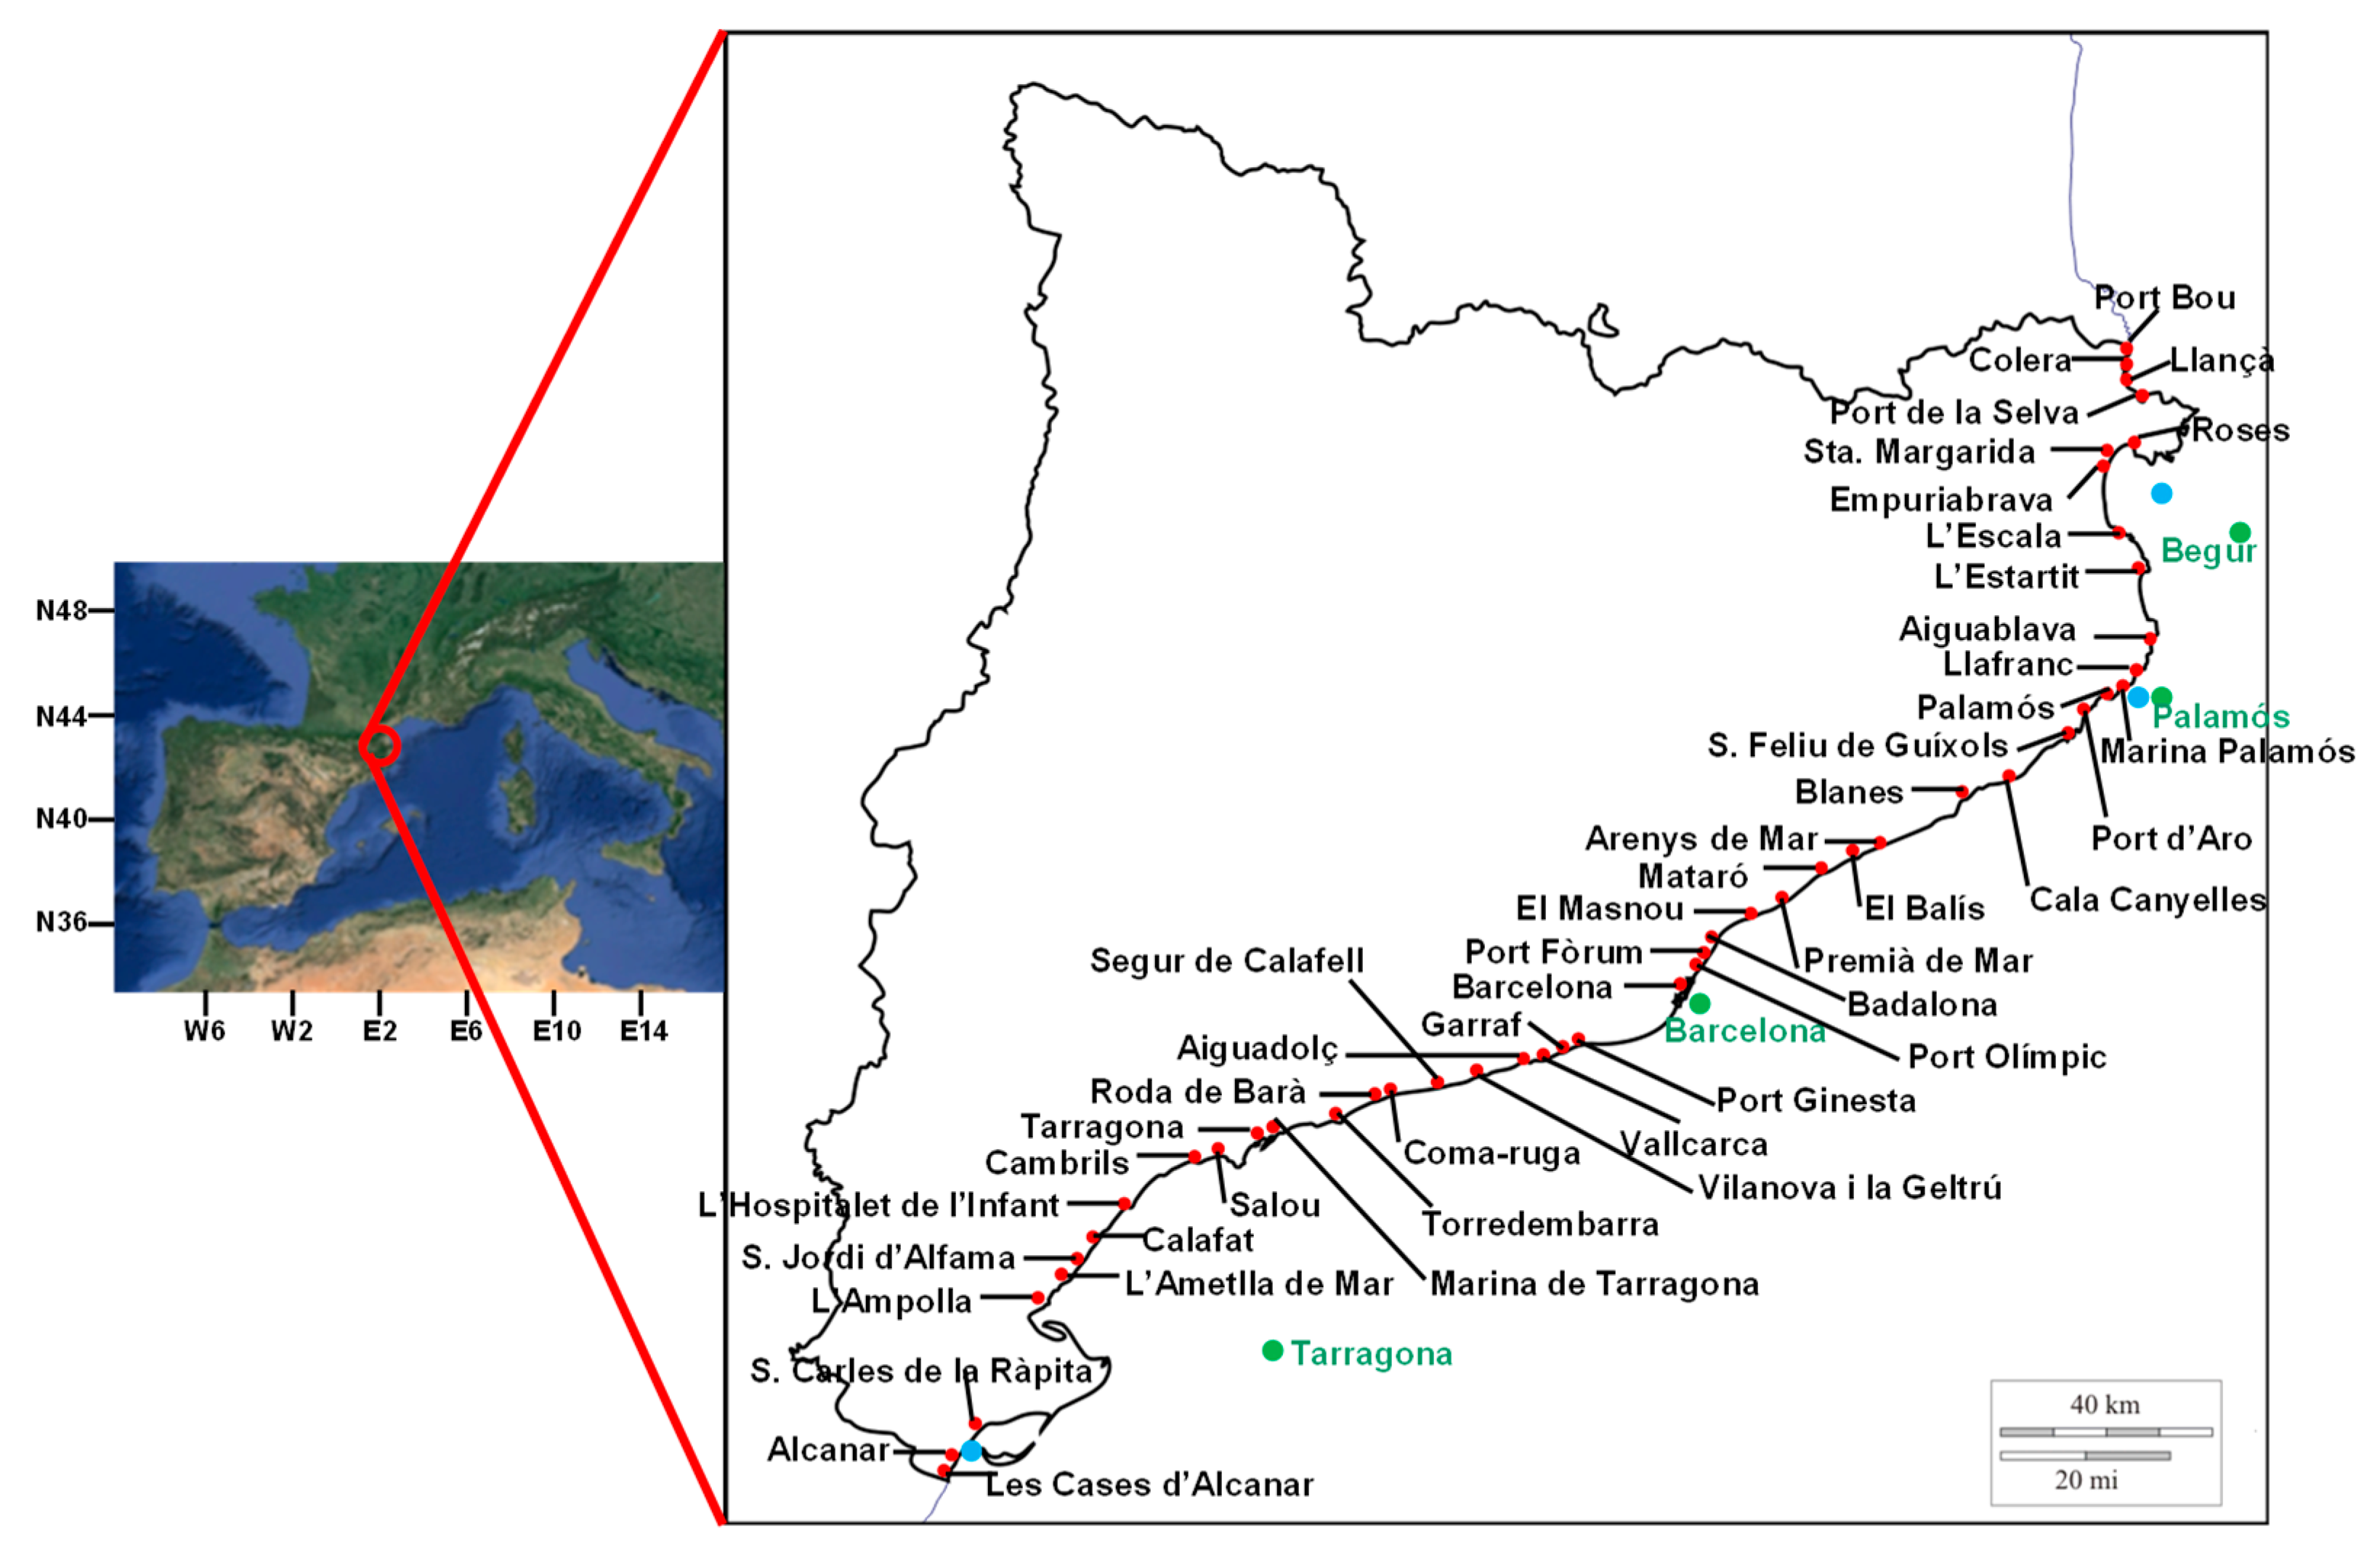
Along the Catalan coast, there are 47 seaports, distributed as follows: two are large commercial harbors (Barcelona and Tarragona), three are small commercial (including facilities for leisure and fishing boats), two are industrial, 18 are mixed (fishing and leisure), and 22 are marinas. The location of all ports (object of this study) is shown in Figure 1.
3. Materials and Methods
To study wave overtopping on port breakwater related to climate change, it is necessary to gather information about port features, water levels, expected SLR and waves. Concerning the ports, the following data have been collected: cross-section features (freeboard, slope, width, and number of layers), breakwater orientation, water depth at the breakwater toe, and slope of the sea bottom in front of the breakwater. From the 47 studied ports, four (Roses, Aiguablava, Port Fòrum, and Port Olímpic) have a vertical breakwater, three (Blanes, Barcelona, and Tarragona) present stretches of both vertical and rubble mound breakwater, while the other 40 have a rubble mound breakwater.
Concerning water levels, the two main drivers are tides and storm surge (variations of sea level due to wind and atmospheric pressure gradients). The studied area is a microtidal environment, with average tidal ranges of 20 cm [24], so its influence on overtopping is very limited. In addition, since storms can take place at high, mean or low tide, overtopping discharges could be slightly greater, slightly smaller or equal than those computed assuming the mean tide level. Therefore, overall a neutral impact of tides on overtopping can be assumed. For this reason and their limited impact on the magnitude of discharges, tidal oscillations are not considered in this study.
On the contrary, the effect of storm surges may be relevant. As pointed out by [32], the magnitude of a storm surge depends on the wind velocity, atmospheric pressure gradients, and the morphology of the continental shelf. The wider and shallower the continental shelf, the greater the water elevation generated by a storm surge. In the case of the Catalan coast, the continental shelf is narrow although with variable width and depth. In addition, in this area there is no correlation between storm surge and wave heights and, in general, severe storms can be present with or without an associated surge [33]. Hence, due to the large variability of storm surges along the coast and among storms and their limited magnitude due to the coastal features, the effect of storm surges has not been considered. This means that overtopping discharges computed may be underpredicted. Therefore, the overtopping results presented here must be considered a lower bound of the discharges that could be expected in the different scenarios analyzed.
With respect to SLR, two of the Intergovernmental Panel on Climate Change (IPCC) scenarios from its 5th Assessment Report, AR5 [34], have been considered: RCP4.5 and RCP8.5. For RCP4.5, the central values of SLR throughout the 21st century have been selected, while for RCP8.5, high-end 95% percentile has been chosen, to include in the analysis the most unfavorable conditions projected by IPCC. Moreover, since other studies [35,36,37,38,39] suggest much higher SLRs (up to 2 m by 2100), a high-end scenario (HES) representative of very extreme SLR, physically feasible although with a very low probability of occurrence (less than 5% by 2100 [40]) has also been taken into account.
On the other hand, AR5 projections indicate that SLR in the Mediterranean Sea will be slightly lower than the SLR global average. This is because sea level is expected to decrease in semi-enclosed and inland seas (e.g., Mediterranean Sea, Black Sea) due to the increase in excess of evaporation [41]. Therefore, considering the estimations of Vousdoukas et al. [14], an SLR 10% smaller than the global averages has been considered for the three mentioned scenarios. In addition, homogeneous values of SLR along the whole Catalan coast have been assumed, due to the limited scale of the studied area and the lack of accurate projections for local variations. Figure 2 shows the SLR evolution during this century for the three scenarios considered. Notice that only RCP4.5 gives similar values to those observed by 2020 (about 6 cm), while RCP8.5 and, in particular, HES clearly overpredict the SLR recorded to date.
In addition, SLR has been accounted for both freeboard reduction and variation of water depth in the port and surrounding areas. This last point cannot be neglected because changes in water depth modify wave propagation patterns. Indeed, processes associated with wave propagation, like shoaling and refraction, strongly depend on the water depth at the location of each breakwater. Moreover, since in the study area a number of breakwaters are located at relatively shallow waters, many times the highest waves break before reaching the breakwater. With greater water depths, higher waves can reach the structure before breaking.
Additionally, since two ports (Barcelona and Sant Carles de la Ràpita) are located in two deltas, with subsidence rates of 5 mm/year and 1.75 mm/year, respectively [29], the total subsidence values at each year of computation of the overtopping discharge have been added to the SLR to obtain the relative sea level rise (RSLR) in the three future scenarios. For both mentioned ports, the subsidence values considered, and, as a consequence, the corresponding decrease in their breakwater freeboards and increase in water depth, are indicated in Table 1.
Regarding waves, as mentioned before, the aim of the paper is to study only the effect of SLR on overtopping discharges. Due to the small magnitude of the expected variations in wave climate and their large uncertainty in both magnitude and direction that even may give opposite trends in changes of these parameters [30], the same wave climate has been assumed for present and future conditions. Wave data have been acquired from four buoys (Begur, Palamos, Barcelona, and Tarragona, see Figure 1) located offshore of the Catalan coast and managed by the Spanish Harbor Authority (Puertos del Estado). Three buoys record directional wave data, while the Palamos buoy is scalar. Therefore, the wave data from this buoy have been complemented with directional information obtained from the closest forecasting data point (shown in Figure 1). The overtopping at each port has been estimated using the extreme wave climate at the closest wave buoy. Thus, the overtopping discharges have been computed using wave data from Begur buoy for harbors between Port Bou and Aiguablava, Palamos buoy for ports between Llafranc and Blanes, Barcelona buoy for harbors between Arenys de Mar and Vilanova i la Geltrú, and Tarragona buoy for ports between Segur de Calafell and Cases d’Alcanar. There are two exceptions, the ports of Roses and S. Carles de la Ràpita, which are located within bays and only receive waves generated by local wind. In these two ports, wave parameters are calculated directly from fetch and wind (obtained at the closest forecasting points, see Figure 1) and they are not propagated.
To make the analysis with different storminess intensities, two different return periods TR have been considered for all directions affecting each port. These return periods have been selected because they correspond to storms relatively intense (TR = 5 years) and exceptional (TR = 50 years) in terms of port engineering. Wave data have been clustered in 16 directional sectors and have been propagated from the buoys to each harbor using linear theory to obtain wave features at the port breakwater location. For more details about the data used, the hypothesis assumed and the advantages and limitations of using linear theory, see Sierra et al. [29].
To assess the overtopping discharges at each port, the equations of the Empirical Methods proposed by the European Overtopping Manual [42] are used. Detailed studies using numerical models for each individual port have not been possible due to the large number of ports analyzed. For more details about the expressions used, see Sierra et al. [29].
To assess the overtopping impact and to design adaptation measures, the tolerable discharge (i.e., the amount of water allowed to pass over the structure) must be defined. The acceptable overtopping levels assumed in this work are based on those suggested in the European Overtopping Manual [42], considering the activities and assets located at the lee side of the port breakwater. The discharge limits imposed are:
- 200 l/s/m: ports in which there is nothing behind the breakwater six cases: Sta. Margarida, Empuriabrava, Port d’Aro, Premià de Mar, Port Fòrum, S. Jordi Alfama).
- 10 l/s/m: harbors with small boats berthed at the lee side of the breakwater (the 34 ports not included in the other categories).
- 1 l/s/m: harbors where there are buildings on the dock behind the breakwater (four ports: Barcelona, Vilanova i la Geltrú, Tarragona, S. Carles de la Ràpita).
- 0.4 l/s/m: ports where there are goods or other equipment on the dock behind the breakwater (three cases: Arenys de Mar, Coma-ruga, Cambrils).
To assess in a rough manner the economic impact of overtopping on these ports, the five levels of vulnerability defined in Sierra et al. [29] have been considered. These vulnerability levels depend on the magnitude in which the overtopping discharge (q) exceeds the tolerable one (qt).
- Very low vulnerability, when qt < q ≤ 1.2qt
- Low vulnerability, when 1.2qt < q ≤ 2qt
- Medium vulnerability, when 2qt < q ≤ 5qt
- High vulnerability, when 5qt < q ≤ 10qt
- Very high vulnerability, when q > 10qt
Nevertheless, an accurate assessment of the economic impact is very difficult because in each case it will depend on the storm properties (wave height, period and direction), the breakwater features and the value of the assets located at the lee side of the breakwater at each port. Despite this, to have a rough idea of the order of magnitude of the overtopping damages in the Catalan ports, the following scale (based on media reports and conversations with port authorities) has been adopted:
- Very low vulnerability: No damage, 0 €.
- Low vulnerability: Very small damage, of the order of 103 €.
- Medium vulnerability: Appreciable damage, of the order of 104 €.
- High vulnerability: Large damage, of the order of 105 €.
- Very high vulnerability: Very large damage, of the order of 106 €.
This last number agrees broadly, according to the media, with the damages recorded in several Catalan ports during the large storms of November 2001 and December 2008. These values refer only to direct damages and do not take into account other indirect costs such as those derived from port activity disruption that can be much larger.
4. Results of Port Overtopping Due to SLR
The overtopping discharges for each port have been computed at 2000 (considered as present situation) and every 10 years between 2020 and 2100, taking into account the values of RSLR at each instant. These discharges have been compared with the tolerable ones to detect the ports with excessive overtopping. Figure 3 and Figure 4 show the evolution during the century of the number of ports exceeding the tolerable overtopping discharges for the three SLR scenarios and for return periods of 5 and 50 years, respectively.
For relatively intense storms (TR = 5 years) the number of ports with excessive overtopping currently is five. For the mild scenario RCP4.5, this number is the same until 2030, increasing to seven in 2040 and remaining constant from then until the end of the century. In the case of the extreme scenario RCP8.5, the number of affected ports increases to six in 2030 and to seven in 2040, remaining constant until 2100, when it amounts to eight. For the very extreme HES, the number of affected ports would be six in 2020, seven between 2030 and 2060, increasing throughout the rest of the century to 12 in 2100.
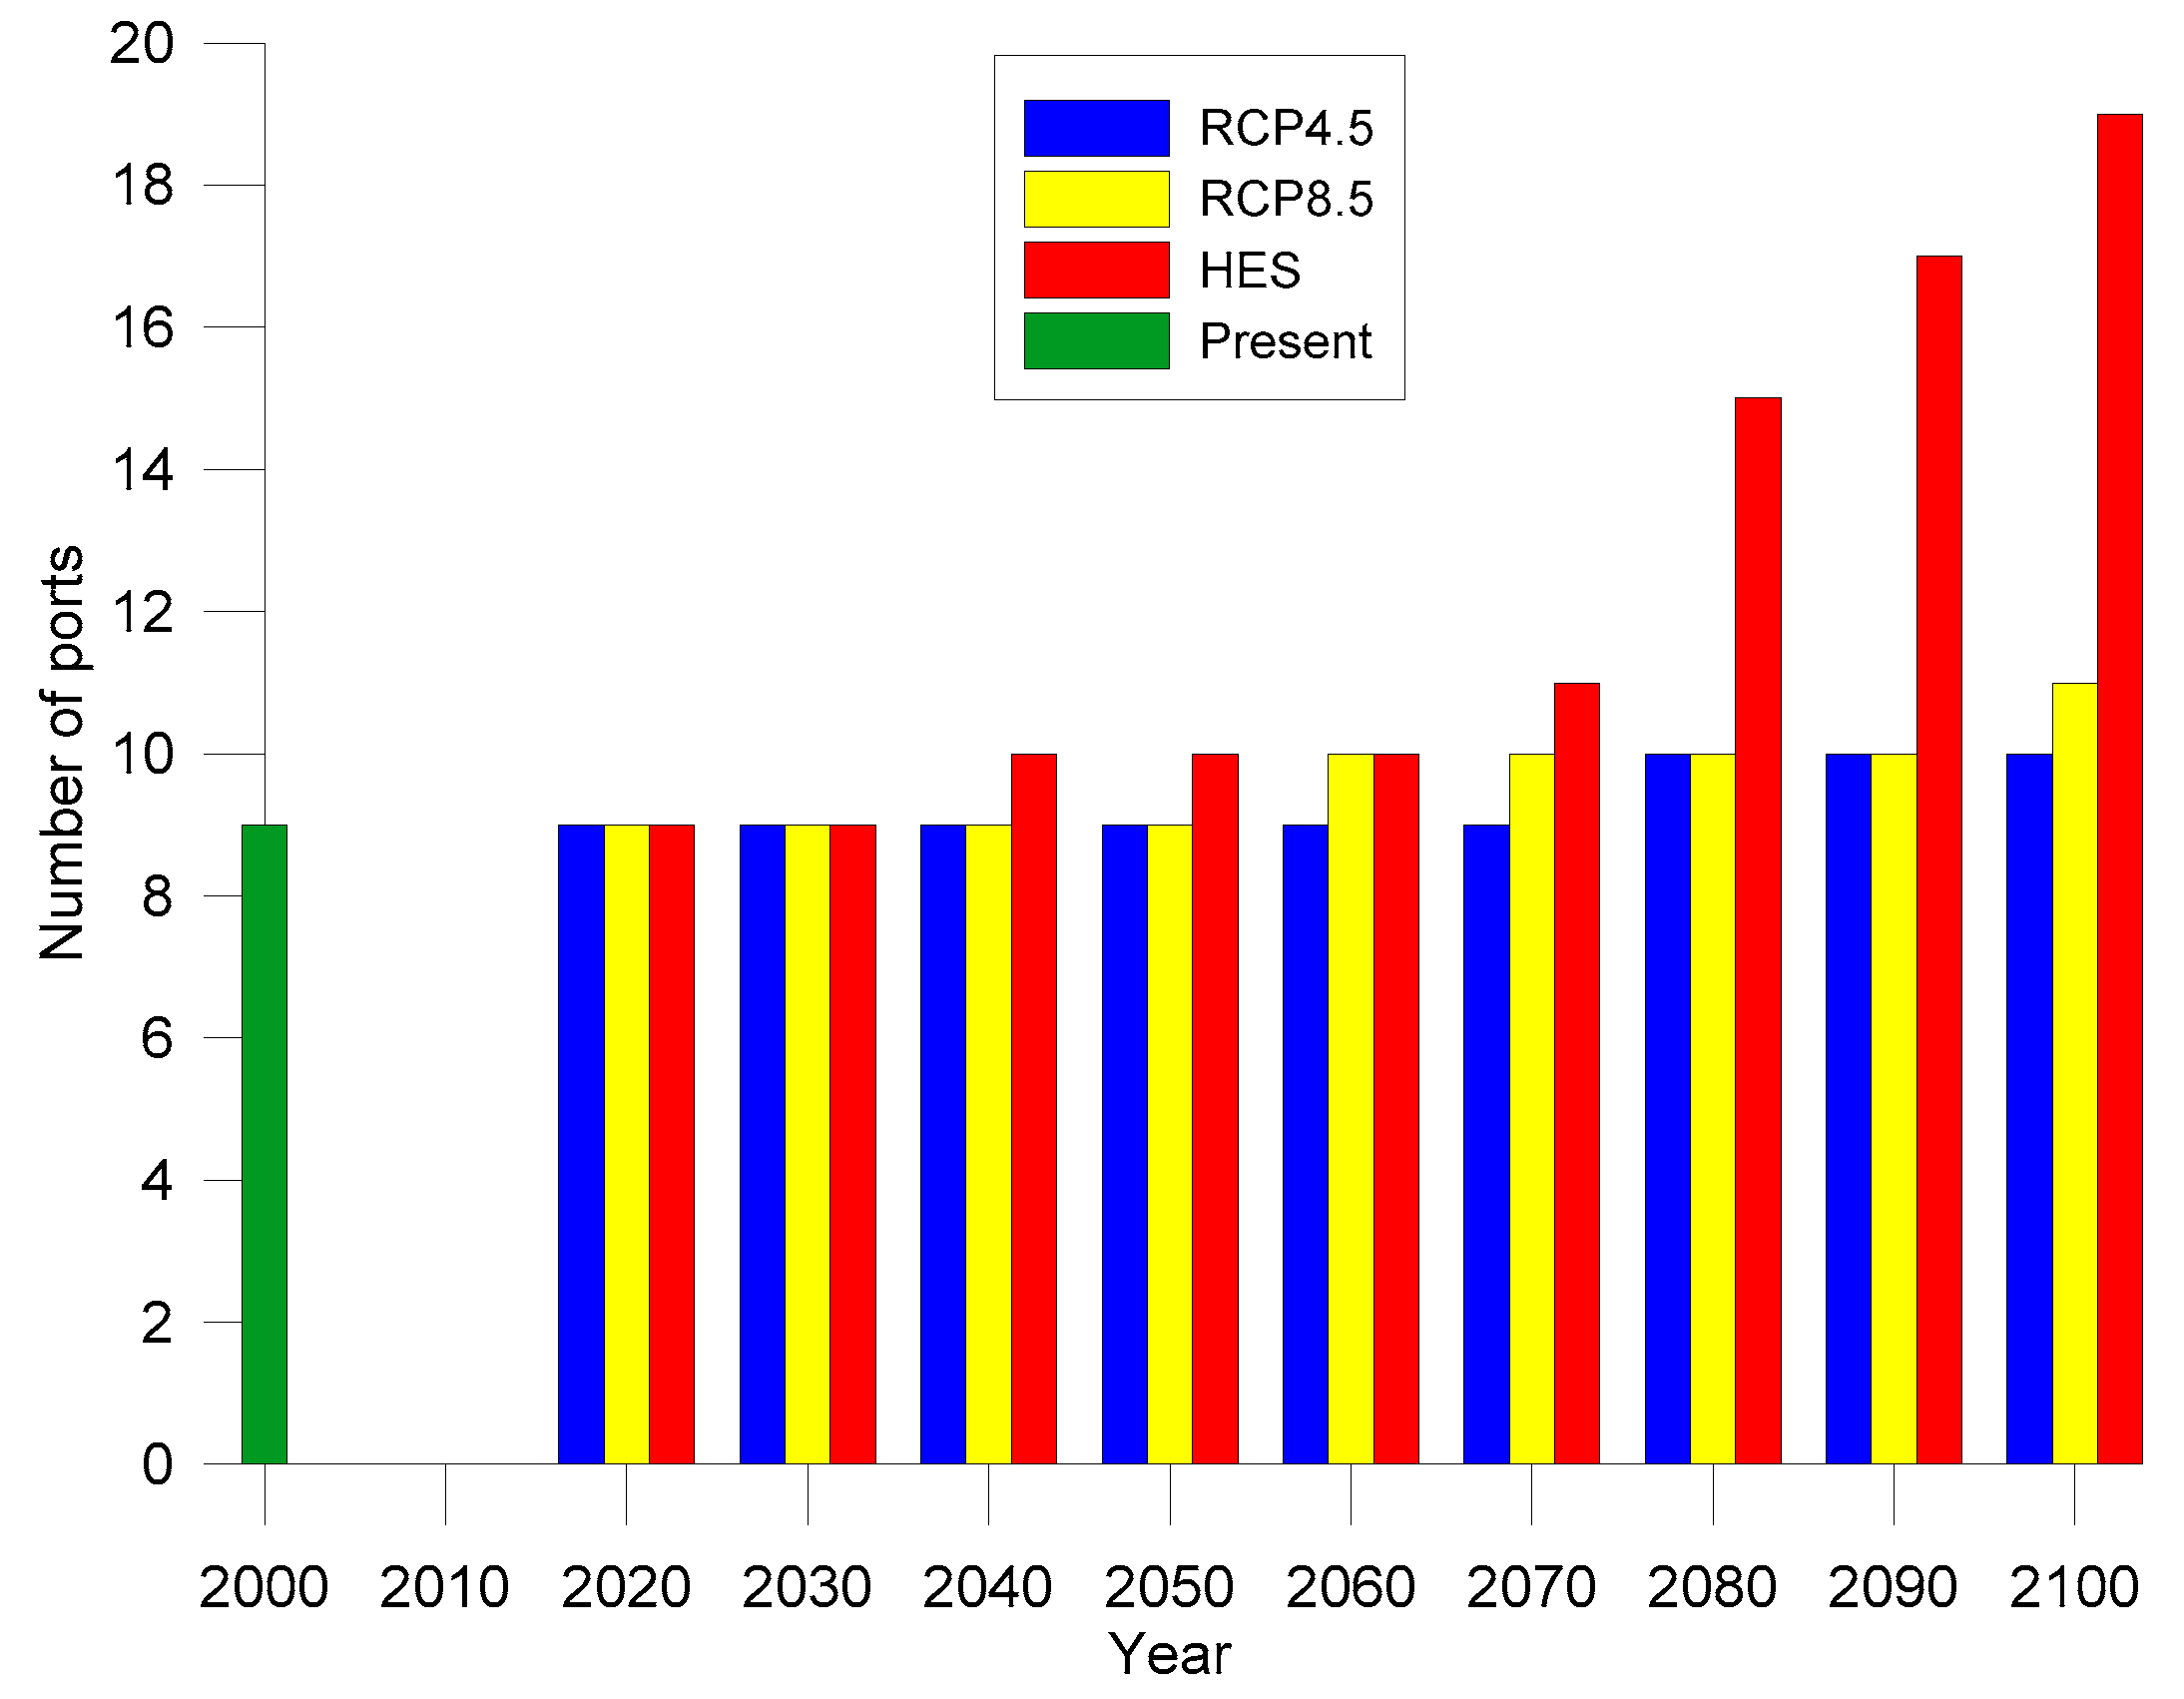
For exceptional storms (TR = 50 years), at present, the number of ports with overtopping problems is nine. For the RCP4.5 scenario, this number is the same until 2080. In that year it rises to 10, the number of ports affected staying the same until the end of the century. For RCP8.5 scenario, the number of ports with excessive overtopping is the same until 2060, when it increases to 10, remaining constant until 2100 when it rises to 11. For HES, the ports affected are nine until 2030, 10 between 2040 and 2060, 11 in 2070, and after this year the number of ports with excessive overtopping sharply increases up to 19 in 2100.
Regarding damages generated by overtopping, as shown in Figure 5, for relatively intense storms (TR = 5 years), in the RCP4.5 scenario, the level of damage remains very low during all the century, being smaller than 35,000 € for the set of all ports. For the RCP8.5 scenario, the economic value of damages is low and similar to that of RCP4.5 until 2080, then it increases reaching values up to 142,000 € at the end of the century. For HES, the economic impact of overtopping is very low and of similar value until 2050 (total damage smaller than 35,000 €), having a certain increase between 2050 and 2070 (up to 152,000 €) and a large growth after, exceeding 1 M€.
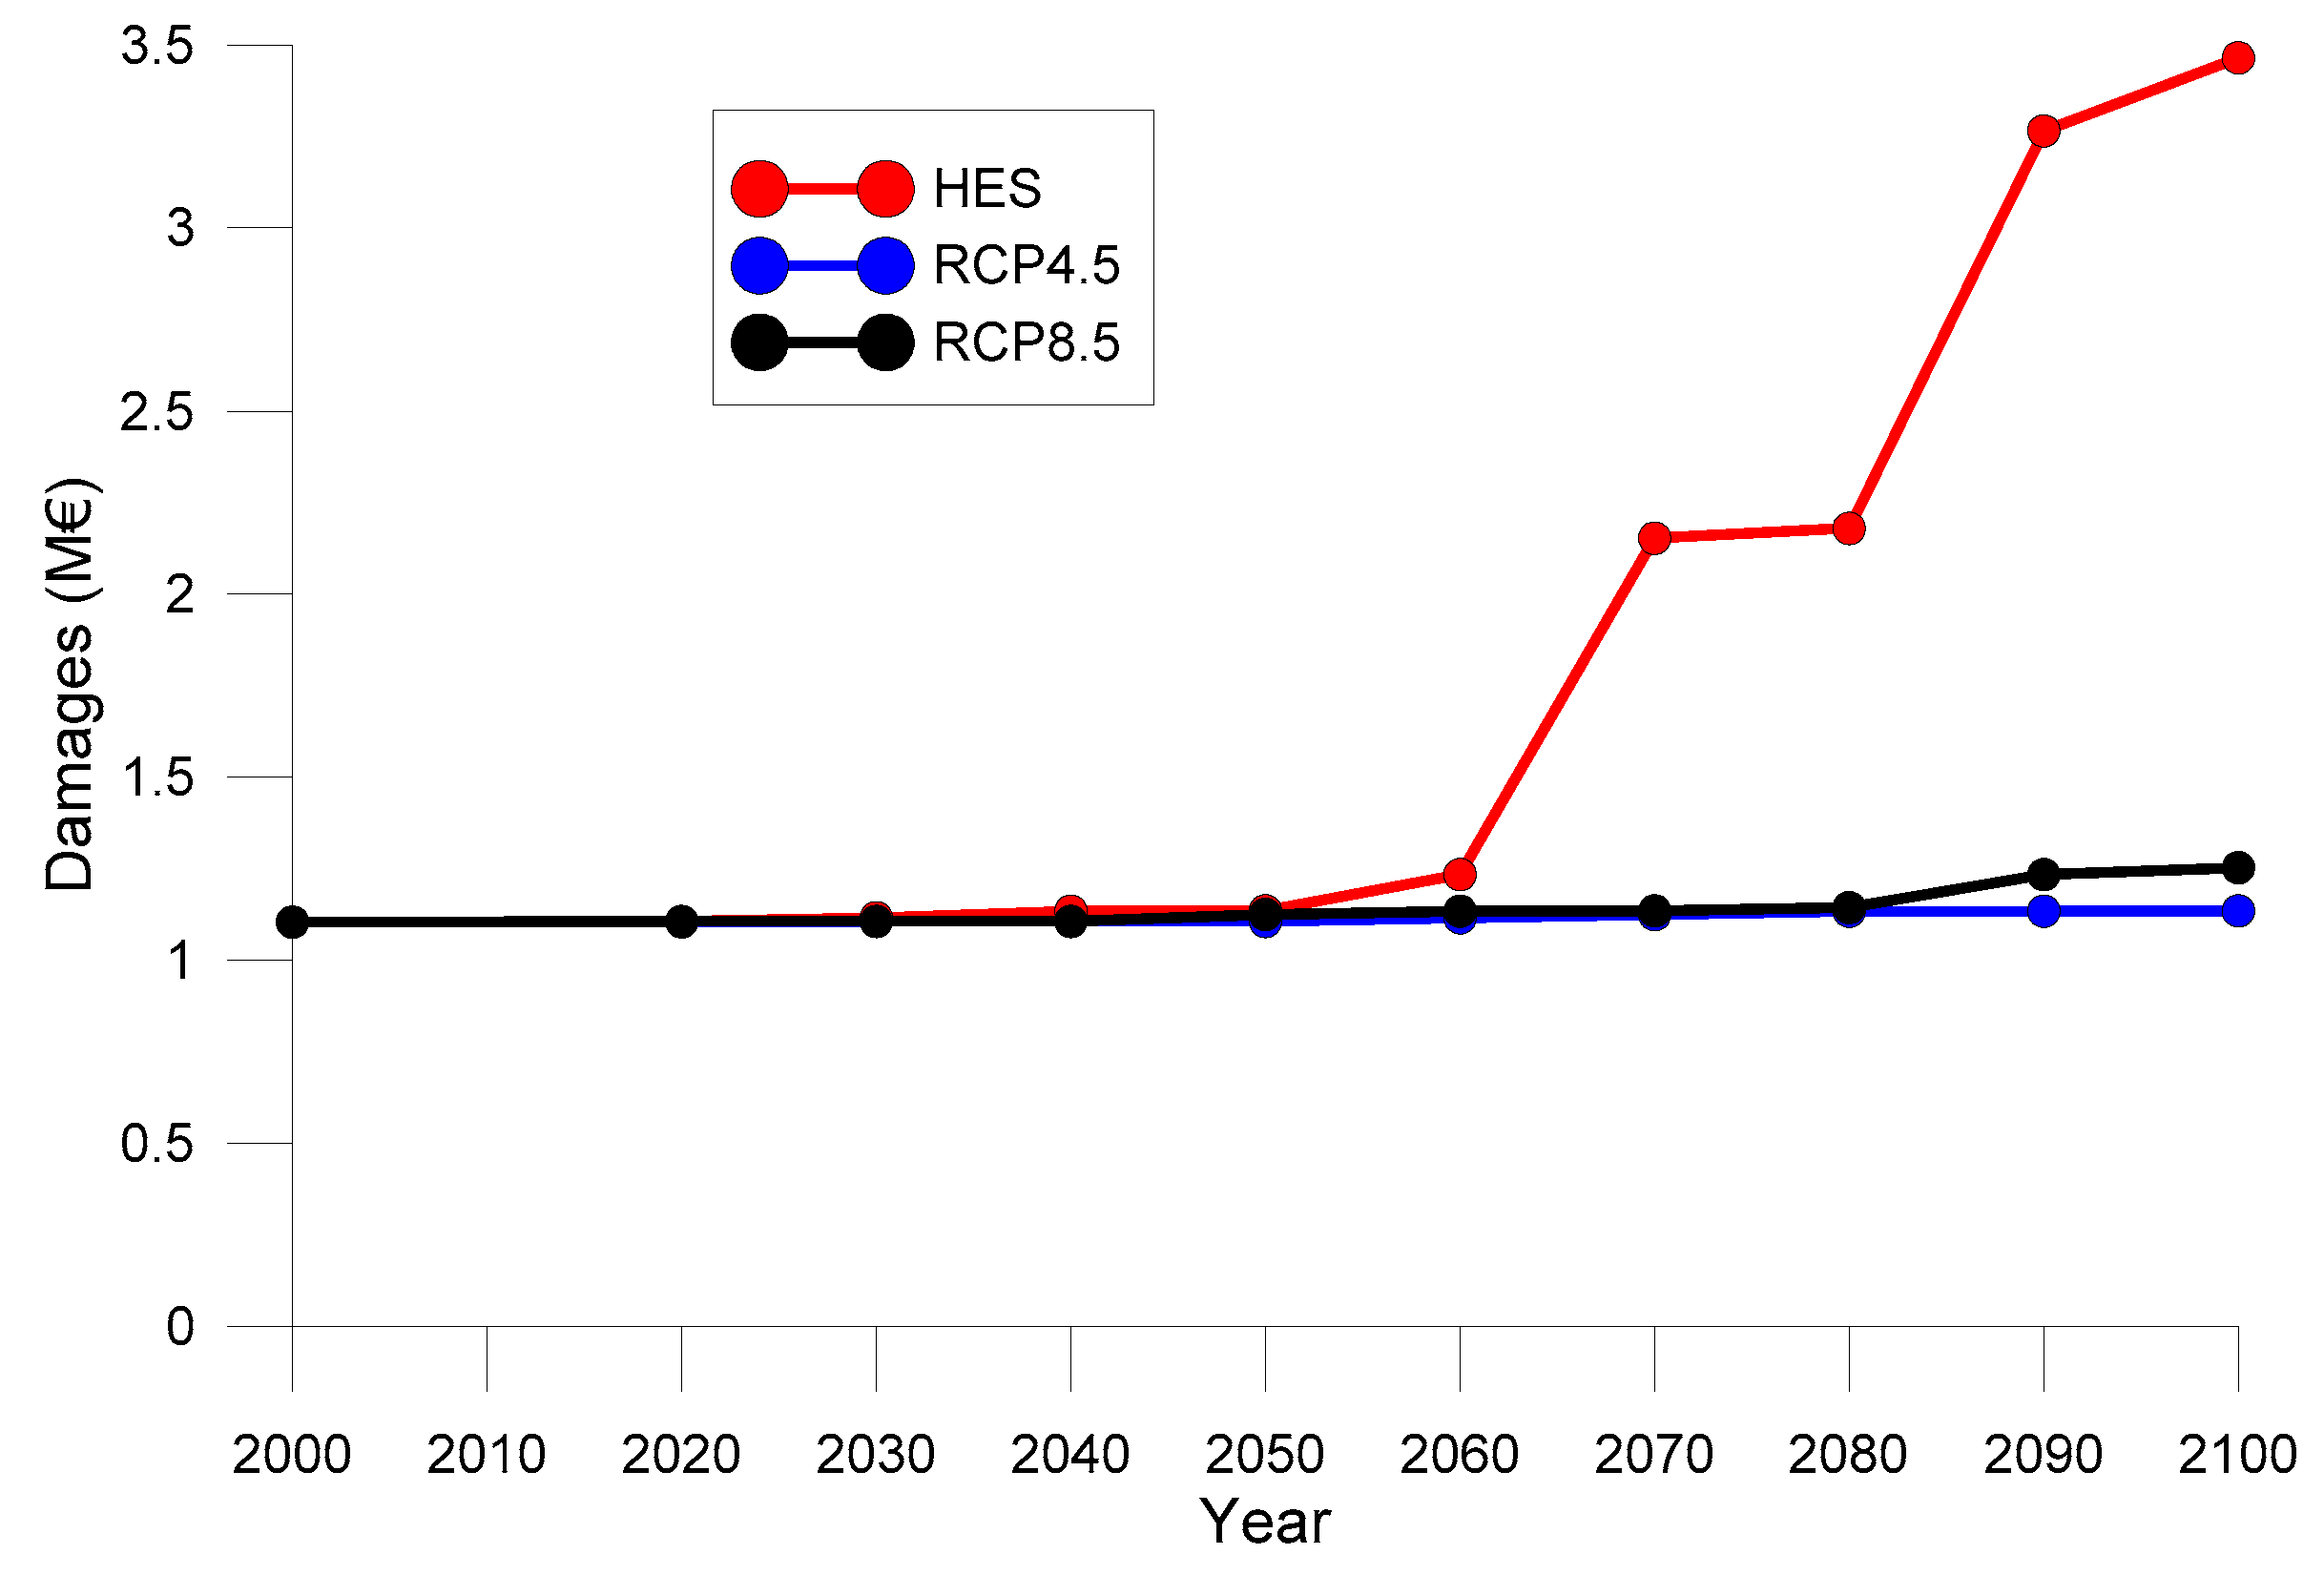
For exceptional storms (TR = 50 years), the cost of the impacts follows a similar pattern to the previous, but with greater values (see Figure 6). This means unappreciable changes for RCP4.5 throughout all the century (<1.14 M€), and slight increases after 2080 for RCP8.5 (up to 1.25 M€). For HES, there is a slight increment between 2050 and 2060 and a sharp increase after 2060, reaching a maximum of about 3.5 M€.
Therefore, for both levels of storminess, the total damages generated in the RCP4.5 scenario practically do not change during the 21st century, as in the case of RCP8.5, in which slight increases are obtained after 2080. On the contrary, for HES, the damages recorded at the set of Catalan ports increase dramatically after 2060.
5. Adaptation Measures for Port Overtopping
To lessen the impacts of climate change on coastal areas, many studies have proposed adaptation measures [43,44]. Most of the proposed measures are “grey” solutions, which correspond to conventional civil engineering works, such as increasing the breakwater height or structure reinforcement. These measures provide immediate adaptation but with high costs and rigidity as a drawback. For this reason, other types of measures that take advantage of natural processes have been proposed [45]. Thus, for example, vegetated areas, such as salt marshes or wetlands, break incoming waves, reduce wavelength and velocity, dissipate wave energy, and function as a natural beach defense [46]. Taking this into account, Sierra et al. [47] made a preliminary assessment of natural solutions such as vegetation for reducing the impact of climate change on ports, focusing on the reduction of port agitation and breakwater overtopping.
Although these green measures may be cost-effective for coastal protection, in the case of ports they can hardly be applied. To get a significant wave attenuation the submergence ratio α = hs/d (where hs is the height of seagrass and d the water depth) must be greater than 0.3 [48]. Since the two species of seagrass most frequent in the Mediterranean Sea are the Posidonia Oceanica (with hs of up to 1 m) and Zoostera Marina (with hs of up to 1.5 m) only those ports located in shallow waters (d ≤ 5 m) could use seagrass to reduce the height of the waves arriving to their breakwaters. From the 47 analyzed ports, only seven (15%) have their main breakwater totally located at water depths less than or equal to 5 m. Another 16 (34%) have some stretches of their breakwater located at those shallow depths and other at greater depths. Considering the 19 ports susceptible of being affected by overtopping, only two (10.5%) have their breakwater totally located at d ≤ 5 m, while five (26.3%) have their protection structures partially at these shallow depths.
In addition, in a context of SLR, water depths will increase reducing the effectivity of this type of measures. Using as horizon the year 2100, for scenarios RCP4.5 and RCP8.5, the number of ports with the breakwater located totally or partially at d ≤ 5 m would be reduced to three and two, respectively. If HES is considered, in 2100 only one port would continue having their breakwater totally located at waters shallower than 5 m, while another would partially fulfil this condition. Therefore, for most ports, the use of such green measures to reduce future overtopping discharges is not possible, and adaptations to SLR must be done using conventional (grey) structural measures or relocating activities, terminals or even the complete harbor [49].
Among the grey engineering measures that can be used to reduce overtopping discharge, the most effective are:
- To build berms in the exposed side of the breakwater, which break the highest waves reaching the structure.
- To build submerged breakwaters in front of the main port breakwater to reduce the energy of the incoming waves breaking also the highest ones.
- To increase the width of the port breakwater for slightly reducing the overtopping flow.
- To rise the breakwater height. This can be done adding rocks or blocks (in the case of rubble mound structures) or building a crown wall at the top of the breakwater.
From these solutions, the building of a breakwater crown wall is the one that, by far, requires less material and less technical means to reduce overtopping to a certain level. Therefore, it is the cheapest and the most cost-effective alternative. This solution is usually applied because of its easy construction and immediate solution for engineering [50,51]. Many of the studied ports (30 of the 47) already have a breakwater crown wall, with different heights and with widths ranging between 0.5 and 1.5 m. Taking this into account, an average width of 1 m has been assumed for all the crown walls that should be built to reduce overtopping discharges.
To assess the cost of this adaptation measure at a regional scale, the necessary volume of crown wall is computed by multiplying the breakwater length of each affected port by the width of the crown wall (1 m) and by its height (which is variable for each port and may change with time depending on the overtopping flow). The necessary crown wall height has been determined by increasing it (in all the ports with problems) at intervals of 0.5 m, reducing the overtopping discharge. Once the discharge corresponding to the desired level of vulnerability is attained at a certain port, the crown wall height necessary for obtaining such discharge is adopted for this port and this instant.
This wall height has been estimated for two different levels of damage: zero-damage, which corresponds to all ports a condition of no vulnerability or very low vulnerability, and minimum damage, which is similar to the previous one but also including the low vulnerability level. The underlying idea is that allowing a low level of damage (that corresponding to low vulnerability, which is of the order of 103 €), the investments necessary for adaptation are significantly reduced. This can be done without generating disruption of port activities and at an affordable cost in terms of assets or services affected, being, therefore, worthwhile from an economic point of view.
Once the necessary volumes of the crown wall have been computed for the four cases (two levels of damage and two levels of storminess) and all instants, these volumes are multiplied by the cost of building a cubic meter of such structure. This price is very variable since it depends on many factors, but analyzing several projects in the Spanish Mediterranean Coast, this price has been rounded to 500 €/m3, including profits and taxes. With this price, the adaptation cost has been estimated in the four cases, in terms of present monetary units. The results are shown in Figure 7 and Figure 8. These values are not cumulative costs and they correspond to the costs of performing the necessary adaptation for all ports at a certain year.
In the case of TR = 5 years (Figure 7) and zero-damage level, for RCP4.5, the costs are practically constant (less than 2 M€) until 2040, growing to around 3M€ between 2050 and 2090, rising to just over 4 M€ in 2100. For RCP8.5, the pattern followed by the adaptation costs is very similar, but the first increase takes place 10 years before and the costs are a little greater (0.27 M€ in average). For HES, the adaptation costs rise throughout all the century, at a smaller rate until 2030 and then more quickly, reaching a maximum of 7.38 M€ in 2100.
In the case of minimum damage and return period of 5 years (Figure 7), the adaptation costs follow similar trends but with lower values, which are zero at the beginning of the century (until 2040 for RCP4.5, 2030 for RCP8.3, and 2020 for HES). During the rest of the studied period, the adaptation costs decrease between 55% and 68% for RCP4.5, between 46% and 66% for RCP8.5 (except in 2040 in which the attained reduction is 90%), and between 37% and 66% for HES (except in 2030 that is 88%).
Therefore, the savings in adaptation costs vary (depending on the time horizon) between 1.84 and 2.23 M€ for RCP4.5, between 1.62 and 2.47 M€ for RCP8.5, and between 1.90 and 2.80 M€ for HES, if this policy of minimum damage is adopted instead of that of zero damage. This means to assume the cost of a few thousand euros in several ports once every five years on average. The damage and adaptation costs in the case of TR = 5 years are summarized in Table 2.
In this case, adaptation costs (for zero-damage option) are greater than the economic value of direct damages during all of the century. In the case of minimum damage option, adaptation costs are greater than damages in 2050 (RCP4.5), 2040 (RCP8.5) or 2030 (HES). According to these data, apparently, the adaptation options are not cost-effective because their cost is much greater (more than triple by the end of the century) than the value of prevented damages. Nevertheless, as indicated before, the value of damages only covers the direct damages and other possible economic impacts, such as those derived from traffic disruption are not considered, so these damages are clearly underpredicted.
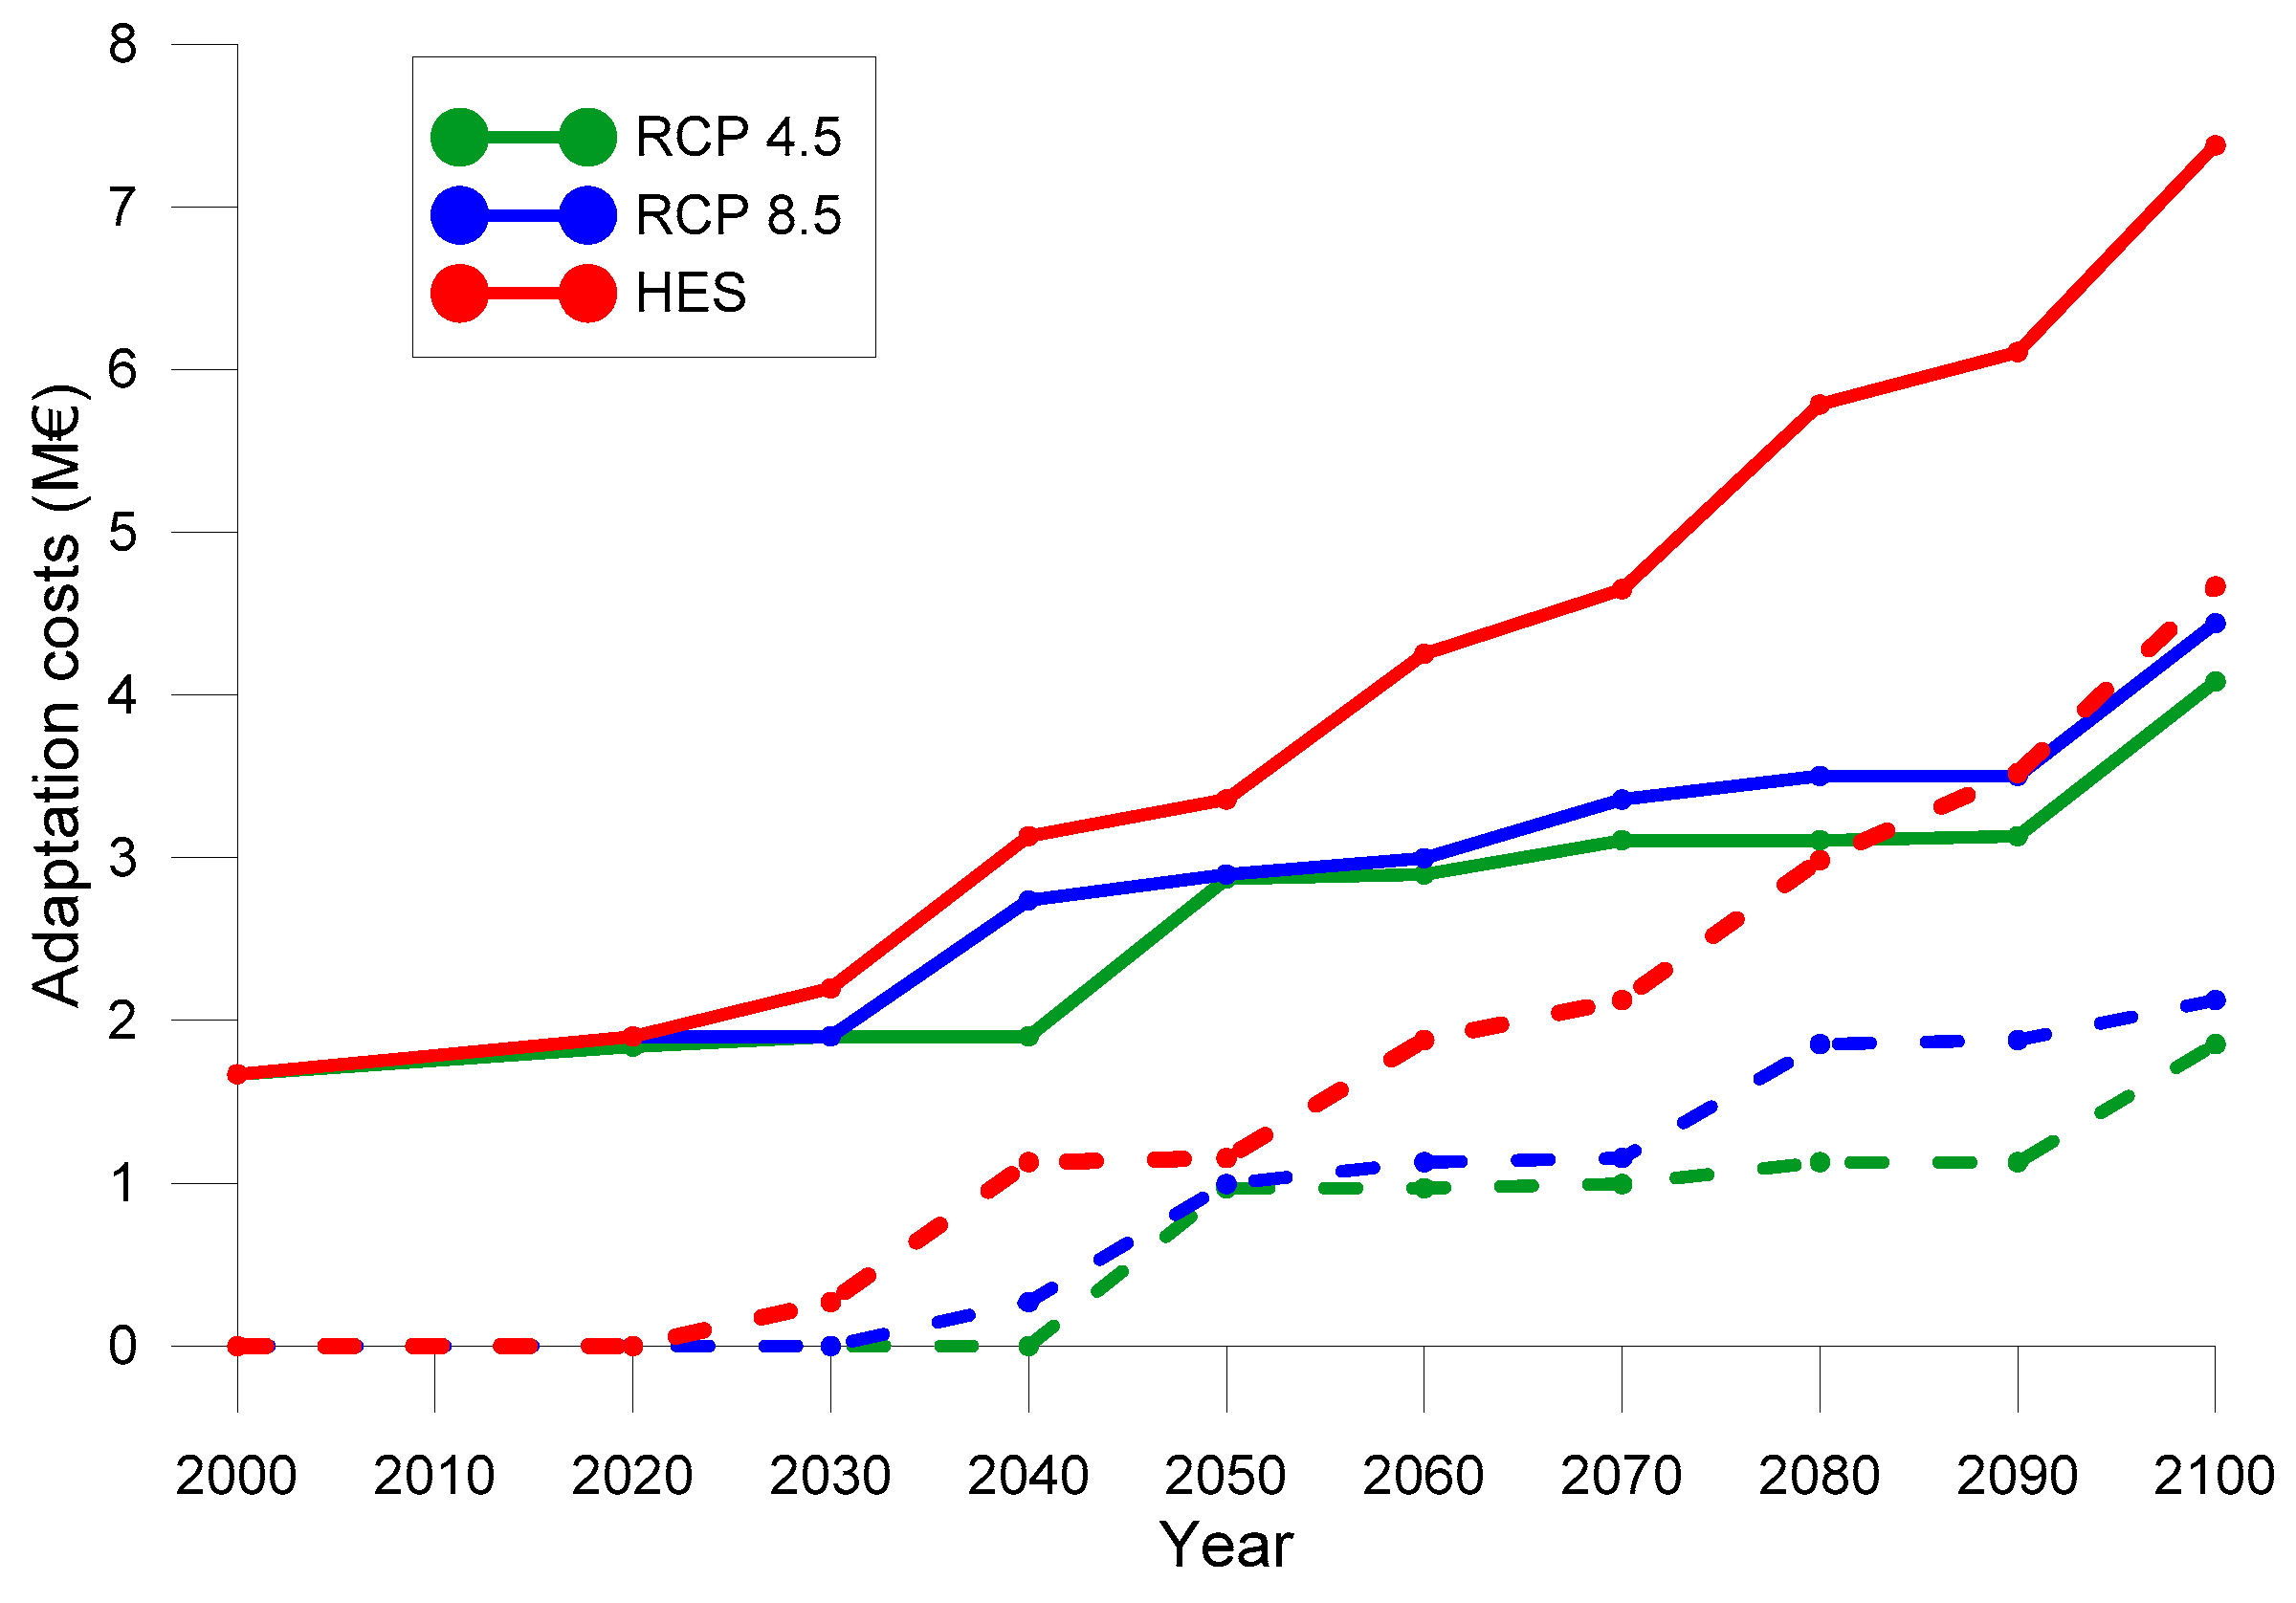
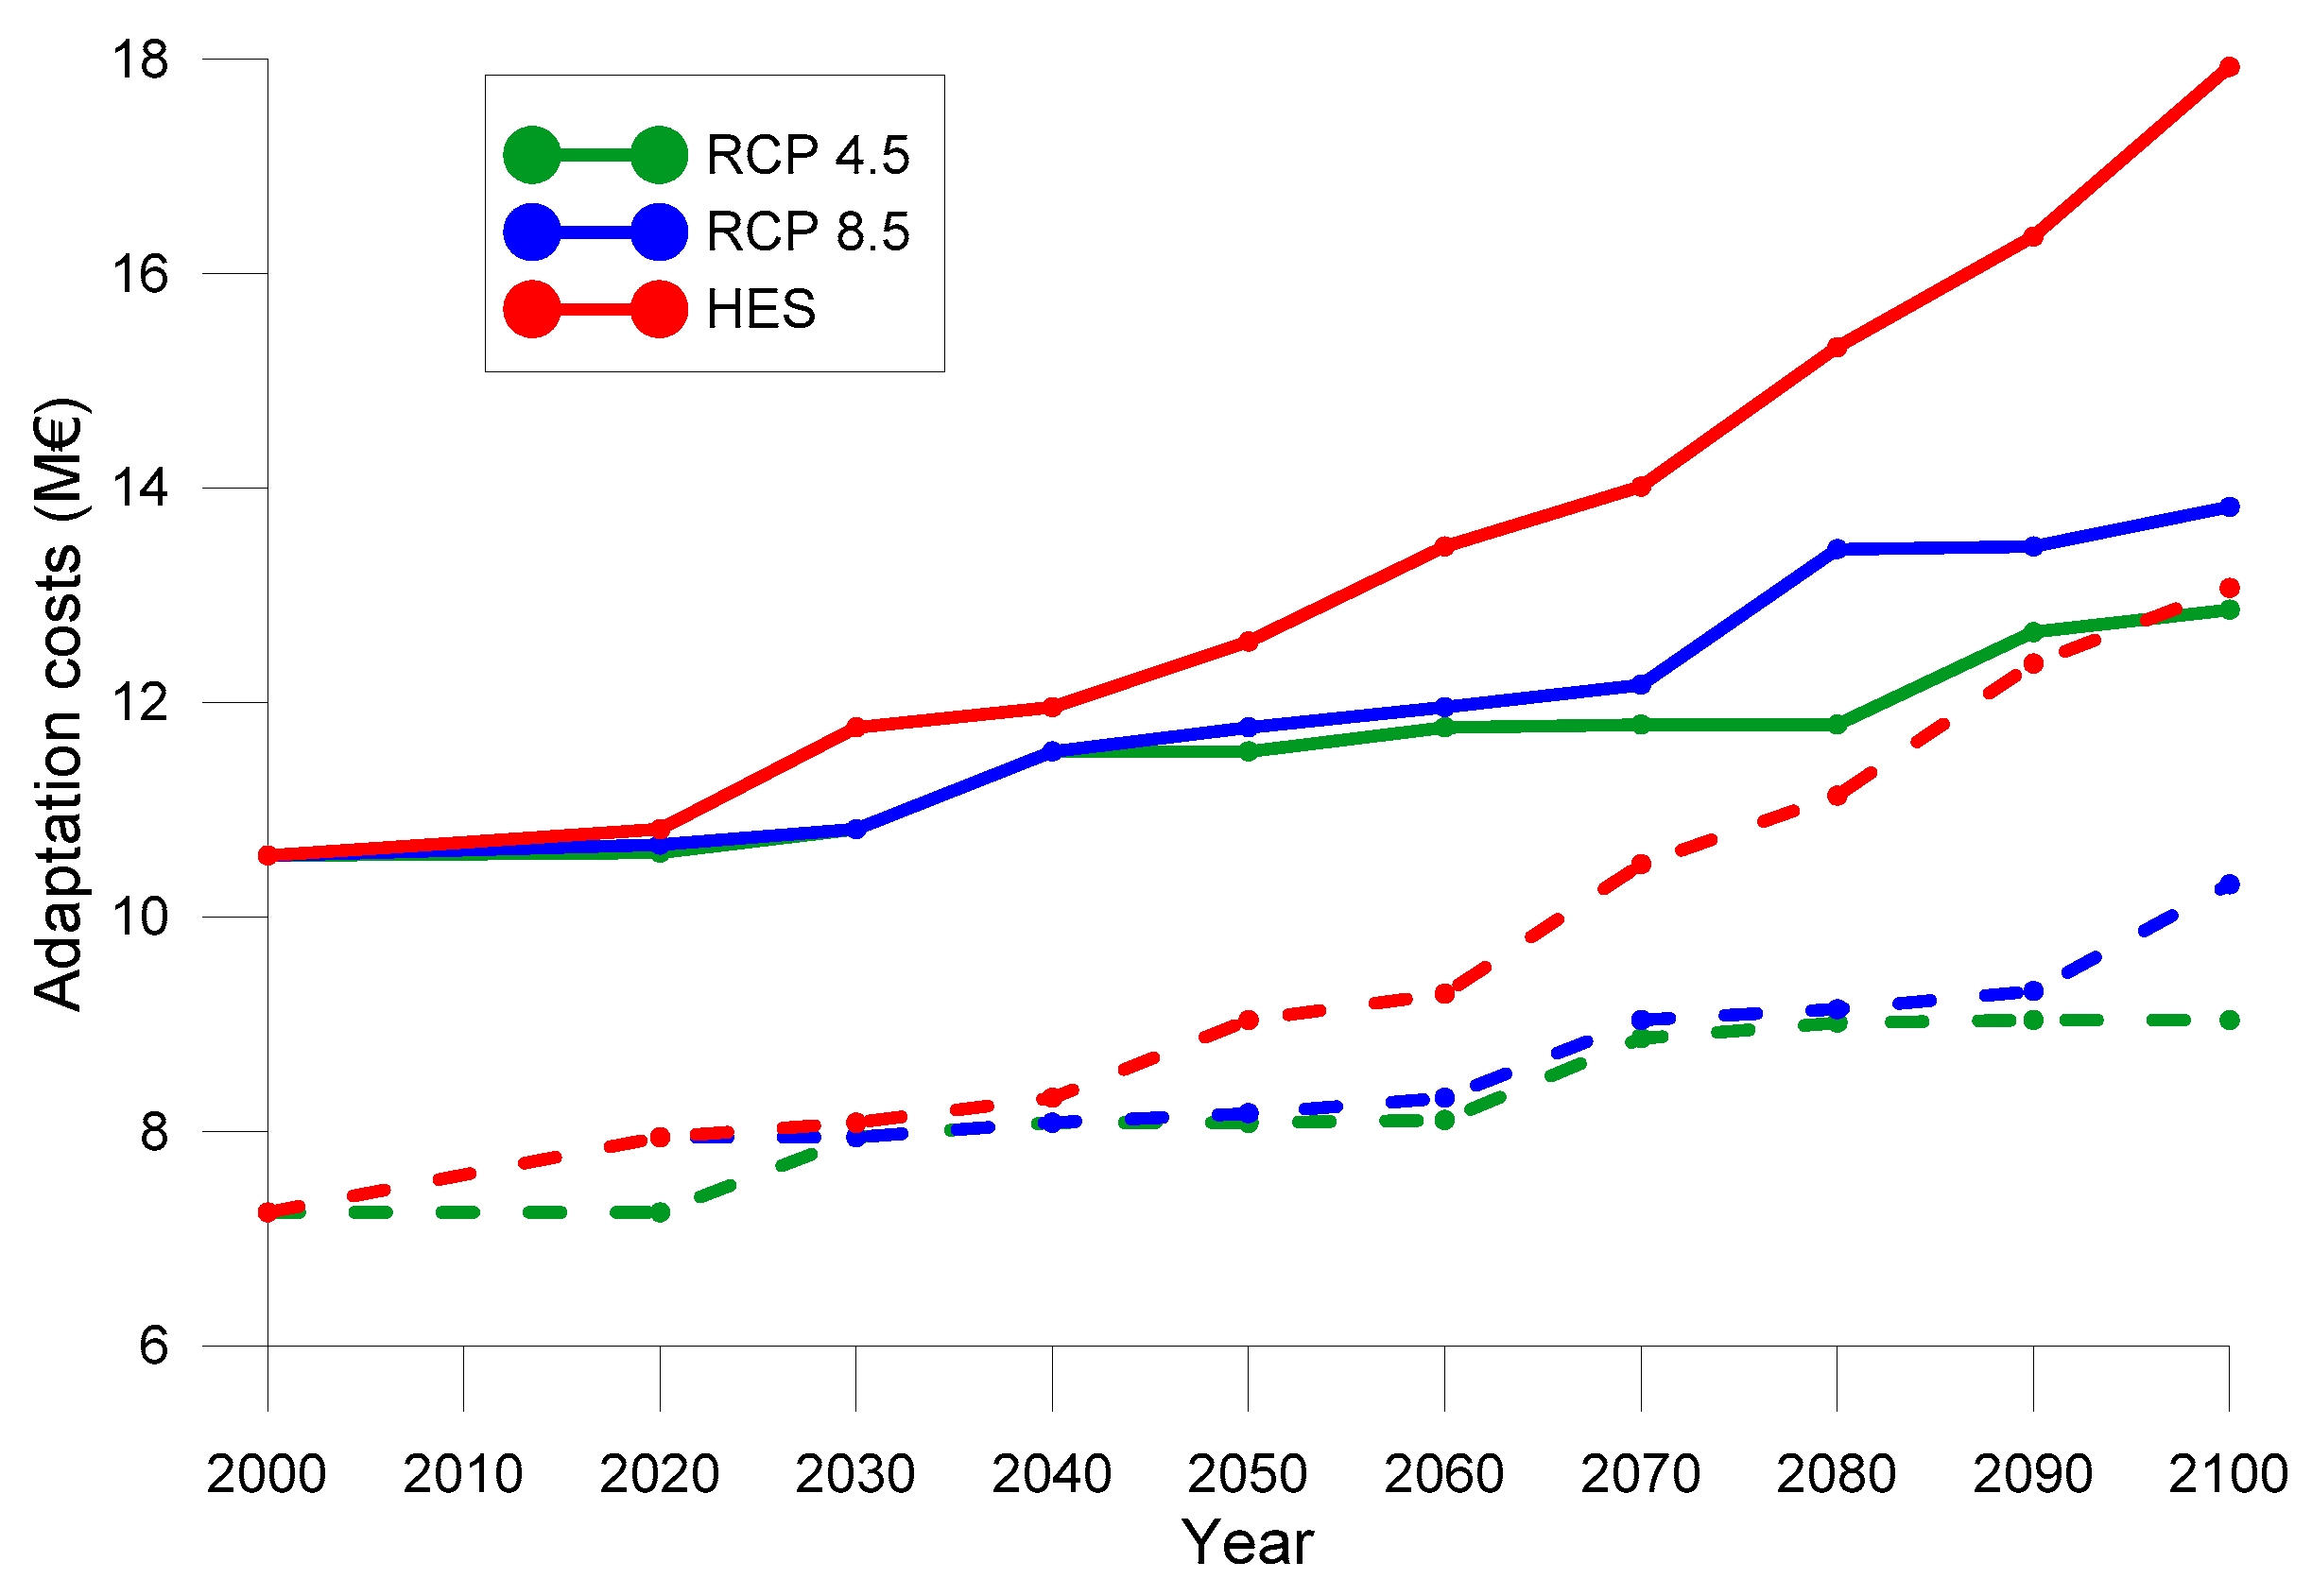
In the case of exceptional storms (TR = 50 years, Figure 8), the adaptation costs to endure the overtopping generated are obviously much higher than in the previous case. Notice that at 2020 (almost present time) the adaptation costs are different for each scenario. This is due to the overprediction of SLR from scenarios RCP8.5 and HES with respect to the observed values, which are similar to RCP4.5 projections at this year.
For the zero-damage level, this cost presently is 10.60 M€. For RCP4.5, it varies very little throughout the century except in 2040 and 2090, when there are two steps, reaching 12.87 M€ in 2100. For RCP8.5, the adaptation cost increases slightly throughout the century, with also two steps in 2030 and 2090, reaching 13.83 M€ in 2100. For HES, this cost increases continuously during the studied period and at a higher rate. In 2100, the cost for this option would be 17.93 M€, 70% more than now, 40% more than for RCP4.5, and 30% more than for RCP8.5.
For the minimum-damage option (Figure 8), in the three scenarios, the trends are similar with slight changes in the location of the steps (for RCP8.5) and smaller values. The adaptation costs are reduced between 24% and 32% for the three scenarios, with savings between 2.78 and 3.83 M€ for RCP4.5, between 2.73 and 4.29 M€ for RCP8.5, and between 2.87 and 4.86 M€ for HES. Once again, significant adaptation cost reductions can be achieved if certain overtopping discharge is allowed, which only generates negligible perturbations in port activities with minimal damages to assets and infrastructure. According to Hall et al. [52], the willingness to pay for adaptation should be up to a point at which the marginal benefit of an increment of risk reduction is equal to the cost of buying that increment. Evidently, the marginal benefits of the zero-damage option are beyond that point. This issue is very meaningful, since in civil engineering reaching the zero-risk solution can be very expensive and, therefore, the balance between costs and effects must always be taken into account. The damage and adaptation costs in the case of TR = 50 years are summarized in Table 3.
In this case, even for the best option (adaptation with minimum damage), the adaptation costs largely exceed the value of prevented damages (between four and eight times) although, as indicated before, these damages are clearly underpredicted. In addition, the adaptation costs, even in the worst case, represent a very small part (<1%) of the total cost of port breakwaters. Moreover, these adaptation costs are smaller than the annual investment in infrastructure of Catalan ports (67.3 M€ in 2017 [53,54,55]) and they are affordable without major problems.
Therefore, although the cost of adaptation measures is relatively large with respect to direct damages, the clear underprediction of the total damages, the benefits for port traffic and services derived from preventing overtopping and the relatively small cost of such measures in terms of port investment, indicate that such measures might be worthwhile.
6. Conclusions
The effects of SLR throughout the 21st century on overtopping in the 47 Catalan ports have been studied, including a rough estimation (order of magnitude) of the economic impacts generated by this overtopping and the adaptation costs to overcome this problem.
In the current conditions, there are already several ports affected by excessive overtopping and this number varies very little during the century for RCP4.5 and RCP8.5 scenarios. On the contrary, for HES this number sharply increases by the end of the century (after 2080 for TR = 5 years and 2070 for TR = 50 years).
The damages generated by overtopping discharges exceeding the tolerable thresholds, for TR = 5 years are very small throughout the century for RCP4.5 and RCP8.5, although in this last case, a slight increase is observed after 2080. In the case of HES, there is a slight increment by the middle of the century and an abrupt rise of these costs after 2070 (for TR = 5 years) and 2060 (for TR = 50 years). Nevertheless, the methodology to assess such damages is limited because it only estimates direct damages and does not consider other damages such as those derived from traffic disruption (which are very difficult to estimate).
Regarding the adaptation to overtopping originated by SLR, the construction or elevation of crown walls seems the most cost-effective measure and the easiest to implement. To estimate the necessary height of these walls to be built at each port, two damage levels have been assumed: zero-damage, in which the cost of damages generated by overtopping is zero in all ports, and minimum damage, in which small damages (of the order of 103 €) are allowed. This last criterion contributes to reducing the necessary height of the crown walls to achieve the desired level of overtopping discharges and, therefore, the adaptation costs are significantly reduced. Thus, for storms with TR = 5 years, the savings in adaptation costs range between 37% and 100% (in the first years of the century no adaptation measure is necessary). In the case of storms with TR = 50 years, the adaptation cost reductions are lower in percentage, varying between 24% and 32%, but are larger in magnitude, implying savings between 2.73 and 4.86 M€. Therefore, allowing a minimum level of damage, which would not generate perturbations in port activities, could be a preferable option with respect to the zero-damage alternative, from an engineering point of view.
Even considering this minimum-damage alternative, the adaptation costs are much greater (between three and eight times) than the value of prevented direct damages. Nevertheless, considering the underprediction of the total damages, the benefits for port traffic and services derived from preventing overtopping and the relatively small cost of such measures in terms of port investment, such measures might be worthwhile. Nevertheless, an accurate estimation of the indirect damages would be necessary to determine if such measures are cost-effective.
Several general conclusions (e.g., increase of damage cost and number of ports affected by the end of the century due to SLR, important savings allowing certain damage level) probably may be extrapolated to other zones of the Mediterranean coast, although detailed studies particularized for each area are necessary.
Funding
This research was funded by the European Union’s Seventh Framework Programme through the grant to the Collaborative Project RISES-AM-, Contract FP7-ENV-2013-two-stage-603396 and the Spanish Ministry of Economy and Competitiveness, through the project COBALTO (Ref.CTM2017-88036-R). The support of the Secretaria d’Universitats i Recerca del Dpt. d’Economia i Coneixement de la Generalitat de Catalunya (Ref 2014SGR1253) is also acknowledged.
Acknowledgments
The author is grateful to the Organismo Público Puertos del Estado (Spanish Ports and Harbors Authority) for providing wave data.
Conflicts of Interest
The author declares no conflict of interest.
References
- Nicholls, R.J.; Cazenave, A. Sea-level rise and its impact on coastal zones. Science 2010, 328, 1517–1520. [Google Scholar] [CrossRef] [PubMed]
- Sánchez-Arcilla, A.; Mösso, C.; Sierra, J.P.; Mestres, M.; Harzallah, A.; Senouci, M.; El Rahey, M. Climate drivers of potential hazards in Mediterranean coasts. Reg. Environ. Chang. 2011, 11, 617–636. [Google Scholar] [CrossRef]
- Thompson, D.A.; Karunarathna, H.; Reeve, D.E. Modelling extreme wave overtopping at Aberystwyth promenade. Water 2017, 9, 663. [Google Scholar] [CrossRef]
- Nicholls, R.J.; Marinova, N.; Lowe, J.A.; Brown, S.; Gusmao, D.; Hinkel, J.; Tol, R.S.J. Sea-level rise and its possible impacts given a ‘beyond 4 °C world’ in the twenty-first century. Philos. Trans. R. Soc. A Math. Phys. Eng. Sci. 2011, 369, 161–181. [Google Scholar] [CrossRef] [PubMed]
- Revell, D.L.; Battalio, R.; Spear, B.; Ruggiero, P.; Vandever, J. A methodology for predicting future coastal hazards due to sea level rise on the California Coast. Clim. Chang. 2011, 109, 251–276. [Google Scholar] [CrossRef]
- Hinkel, J.; Brown, S.; Exner, L.; Nicholls, R.J.; Vafeidis, A.T.; Kebede, A.S. Sea level rise impacts on Africa and the effects of mitigation and adaptation: An application of DIVA. Reg. Environ. Chang. 2012, 12, 207–224. [Google Scholar] [CrossRef]
- Isobe, M. Impact of global warming on coastal structures in shallow water. Ocean Eng. 2013, 71, 51–57. [Google Scholar] [CrossRef]
- Burcharth, H.F.; Andersen, T.L.; Lara, J.L. Upgrade of coastal defence structures against increased loadings caused by climate change: A first methodological approach. Coast. Eng. 2014, 87, 112–121. [Google Scholar] [CrossRef]
- Chen, X.; Jonkman, S.N.; Pasterkamp, S.; Suzuki, T.; Altomare, C. Vulnerability of buildings on coastal dikes due to wave overtopping. Water 2017, 9, 394. [Google Scholar] [CrossRef]
- Kane, H.H.; Fletcher, C.H.; Frazer, L.N.; Barbee, M.M. Critical elevation levels for flooding due to sea-level rise in Hawaii. Reg. Environ. Chang. 2015, 15, 1679–1687. [Google Scholar] [CrossRef]
- Wadey, M.P.; Nicholls, R.J.; Hutton, C. Coastal flooding in the Solent: An integrated analysis of defences and inundation. Water 2012, 4, 430–459. [Google Scholar] [CrossRef]
- Hsu, T.-W.; Shih, D.-S.; Li, C.-Y.; Lan, Y.-J.; Lin, Y.-C. A study on coastal flooding and risk assessment under climate change in the mid-western coast of Taiwan. Water 2017, 9, 390. [Google Scholar] [CrossRef]
- Du, J.; Shen, J.; Zhang, I.J.; Ye, F.; Liu, Z.; Wang, Z.; Wang, Y.P.; Yu, X.; Sisson, M.; Wang, H.V. Tidal response to sea-level rise in different types of estuaries: The importance of length, bathymetry and geometry. Geophys. Res. Lett. 2017, 45, 227–235. [Google Scholar] [CrossRef]
- Vousdoukas, M.I.; Mentaschi, L.; Voukouvalas, E.; Verlaan, M.; Jevrekeva, S.; Jackson, L.P.; Feyen, L. Global probabilistic projections of extreme sea levels show intensification of coastal flood hazard. Nat. Commun. 2018, 9, 2360. [Google Scholar] [CrossRef] [PubMed]
- Cioffi, F.; De Bonis Trapella, A.; Conticello, F.R. Efficiency assessment of existing pumping/hydraulic network systems to mitigate flooding in low-lying coastal regions under different scenarios of sea level rise: The Mazzocchio area study case. Water 2018, 10, 820. [Google Scholar] [CrossRef]
- Orton, P.M.; Conticello, F.R.; Cioffi, F.; Hall, T.M.; Georgas, N.; Lall, U.; Blumberg, A.F.; MacManus, K. Flood hazard assessment from storm tides, rain and sea level rise for a tidal estuary. Nat. Hazards 2018. [Google Scholar] [CrossRef]
- Hallegatte, S.; Ranger, N.; Mestre, O.; Dumas, P.; Corfee-Morlot, J.; Herweijer, C.; Wood, R.M. Assessing climate change impacts, sea level rise and storm surge risk in port cities: A case study on Copenhagen. Clim. Chang. 2011, 104, 113–137. [Google Scholar] [CrossRef]
- Paudel, Y.; Botzen, W.J.W.; Aerts, J.C.J.H. Influence of climate change and socio-economic development on catastrophe insurance: A case study of flood risk scenarios in the Netherlands. Reg. Environ. Chang. 2015, 15, 1717–1729. [Google Scholar] [CrossRef]
- Brown, S.; Hanson, S.; Nicholls, R.J. Implications of sea-level rise and extreme events around Europe: A review of coastal energy infrastructure. Clim. Chang. 2014, 122, 81–95. [Google Scholar] [CrossRef]
- Sánchez-Arcilla, A.; Sierra, J.P.; Brown, S.; Casas-Prat, M.; Nicholls, R.J.; Lionello, P.; Conte, D. A review of potential physical impacts on harbours in the Mediterranean Sea under climate change. Reg. Environ. Chang. 2016, 16, 2471–2484. [Google Scholar] [CrossRef] [Green Version]
- Sierra, J.P.; Casas-Prat, M. Analysis of potential impacts on coastal areas due to changes in wave conditions. Clim. Chang. 2014, 124, 861–876. [Google Scholar] [CrossRef] [Green Version]
- Becker, A.; Inoue, S.; Fisher, N.; Schwegler, B. Climate change impact on international seaports: Knowledge, perceptions, and planning efforts among port administrators. Clim. Chang. 2012, 110, 5–29. [Google Scholar] [CrossRef]
- Messner, S.; Moran, L.; Reub, G.; Campbell, J. Climate change and sea level rise impacts at ports and a consistent methodology to evaluate vulnerability and risk. WIT Trans. Ecol. Environ. 2013, 169, 141–153. [Google Scholar] [Green Version]
- Sierra, J.P.; Genius, A.; Lionello, P.; Mestres, M.; Mösso, C.; Marzo, L. Modelling the impact of climate change on harbour operability: The Barcelona port case study. Ocean Eng. 2017, 141, 64–78. [Google Scholar] [CrossRef] [Green Version]
- Casas-Prat, M.; Sierra, J.P. Trend analysis of wave direction and associated impacts on the Catalan Coast. Clim. Chang. 2012, 115, 667–691. [Google Scholar] [CrossRef]
- Sierra, J.P.; Casas-Prat, M.; Virgili, M.; Mösso, C.; Sánchez-Arcilla, A. Impacts on wave-driven harbour agitation due to climate change in Catalan ports. Nat. Hazard Earth Syst. Sci. 2015, 15, 1695–1709. [Google Scholar] [CrossRef] [Green Version]
- Mase, H.; Tsujio, D.; Yasuda, T.; Mori, N. Stability analysis of composite breakwater with wave-dissipating blocks considering increase in sea levels, surges and waves due to climate change. Ocean Eng. 2013, 71, 58–65. [Google Scholar] [CrossRef] [Green Version]
- Suh, K.-D.; Kim, S.-W.; Kim, S.; Cheon, S. Effects of climate change on stability of caisson breakwaters in different water depths. Ocean Eng. 2013, 71, 103–112. [Google Scholar] [CrossRef]
- Sierra, J.P.; Casanovas, I.; Mösso, C.; Mestres, M.; Sánchez-Arcilla, A. Vulnerability of Catalan (NW Mediterranean) ports to wave overtopping due to different scenarios of sea level rise. Reg. Environ. Chang. 2016, 16, 1457–1468. [Google Scholar] [CrossRef]
- Casas-Prat, M.; Sierra, J.P. Projected future wave climate in the NW Mediterranean Sea. J. Geophys. Res. Oceans 2013, 118, 3548–3568. [Google Scholar] [CrossRef]
- Sánchez-Arcilla, A.; Gonzalez-Marco, D.; Bolaños, R. A review of wave climate and prediction along the Spanish Mediterranean coast. Nat. Hazards Earth Syst. Sci. 2008, 8, 1217–1228. [Google Scholar] [CrossRef]
- Sorensen, R.M. Basic Coastal Engineering, 3rd ed.; Springer: New York, NY, USA, 2006; pp. 138–149. [Google Scholar]
- Mendoza, E.T.; Jiménez, J.A. Storm-induced beach erosion potential on the Catalonian coast. J. Coast. Res. 2006, 48, 81–88. [Google Scholar]
- Church, J.A.; Clark, P.U.; Cazenave, A.; Gregory, J.M.; Jevrejeva, S.; Levermann, A.; Merrifield, M.A.; Milne, G.A.; Nerem, R.S. Sea level change. In Climate Change 2013: The Physical Science Basis; Stocker, T.F., Qin, D., Plattner, G.-K., Tignor, M., Allen, S.K., Boschung, J., Nauels, A., Xia, Y., Bex, V., Midgley, P.M., Eds.; Contribution of Working Group I to the Fifth Assessment Report of the Intergovernmental Panel on Climate Change; Cambridge University Press: Cambridge, UK; New York, NY, USA, 2013. [Google Scholar]
- Jevrejeva, S.; Moore, J.C.; Grinsted, A. Sea level projections to AD2500 with a new generation of climate change scenarios. Glob. Planet. Chang. 2012, 80–81, 14–20. [Google Scholar] [CrossRef]
- Mori, N.; Shimura, T.; Yasuda, T.; Mase, H. Multi-model climate projections of ocean surface variables under different climate scenarios—Future change of waves, sea level and wind. Ocean Eng. 2013, 71, 122–129. [Google Scholar] [CrossRef]
- Kopp, R.E.; Horton, R.M.; Little, C.M.; Mitrovica, J.X.; Oppenheimer, M.; Rasmussen, D.J.; Strauss, B.H.; Tebaldi, C. Probabilistic 21st and 22nd century sea-level projections at a global network of tide-gauge sites. Earths Future 2014, 2, 383–406. [Google Scholar] [CrossRef]
- Bamber, J.L.; Oppenheimer, M.; Kopp, R.E.; Aspinall, W.P.; Cooke, R.M. Ice sheet contributions to future sea-level rise from structured expert judgment. Proc. Natl. Acad. Sci. USA 2019, 116, 11195–11200. [Google Scholar] [CrossRef] [Green Version]
- Nauels, A.; Rogelj, J.; Schleussner, C.-F.; Meinshausen, M.; Mengel, M. Linking sea level rise and socioeconomic indicators under the Shared Socioeconomic Pathways. Environ. Res. Lett. 2017, 12, 114002. [Google Scholar] [CrossRef] [Green Version]
- Jevrejeva, S.; Grinsted, A.; Moore, J.C. Upper limit for sea level projections by 2100. Environ. Res. Lett. 2014, 9, 104008. [Google Scholar] [CrossRef] [Green Version]
- Yin, J.; Griffies, S.M.; Stouffer, R.J. Spatial variability of sea level rise in twenty-first century projections. J. Climate 2010, 23, 4585–4607. [Google Scholar] [CrossRef]
- Pullen, T.; Allsop, N.W.H.; Bruce, T.; Kortenhaus, A.; Scüttrumpf, H.; van der Meer, J.W. EurOtop Wave Overtopping of Sea Defences and Related Structures—Assessment Manual; Kuratorium für Forschung in Küsteningenieurwesen: Heide, Germany, 2007. [Google Scholar]
- Linham, M.M.; Nicholls, R.J. Adaptation technologies for coastal erosion and flooding: A review. Proc. Inst. Civil Eng. Marit. Eng. 2012, 165, 95–112. [Google Scholar] [CrossRef]
- Hinkel, J.; van Vuuren, D.P.; Nicholls, R.J.; Klein, R.J.T. The effects of mitigation and adaptation on coastal impacts in the 21st century. Clim. Chang. 2013, 117, 783–794. [Google Scholar] [CrossRef]
- Van Loon-Steensma, J. Salt marshes to adapt the flood defences along the Dutch Wadden Sea coast. Mitig. Adapt. Strateg. Glob. Chang. 2015, 20, 929–948. [Google Scholar] [CrossRef] [PubMed] [Green Version]
- Vuik, V.; Jonkman, S.N.; Borsje, B.W.; Suzuki, T. Nature-based flood protection: The efficiency of vegetated foreshores for reducing wave loads on coastal dikes. Coast. Eng. 2016, 116, 42–56. [Google Scholar] [CrossRef] [Green Version]
- Sierra, J.P.; Garcia-León, M.; Gracia, V.; Sánchez-Arcilla, A. Green measures for Mediterranean harbours under a changing climate. Proc. Inst. Civ. Eng. Marit. Eng. 2017, 170, 55–66. [Google Scholar] [CrossRef] [Green Version]
- Koftis, T.; Prinos, P.; Stratigaki, V. Wave damping over artificial Posidonia oceanica meadow: A large scale experimental study. Coast. Eng. 2013, 73, 71–83. [Google Scholar] [CrossRef]
- Becker, A.H.; Acciaro, M.; Asariotis, R.; Cabrera, E.; Cretegny, L.; Crist, P.; Esteban, M.; Mather, A.; Messner, S.; Naruse, S.; et al. A note on climate change adaptation for seaports: A challenge for global ports, a challenge for global society. Clim. Chang. 2013, 120, 683–695. [Google Scholar] [CrossRef]
- Nguyen, D.I.; Brossard, J. Adaptation of existing breakwaters to sea level rise-overtopping effect. In Proceedings of the 33rd International Conference on Coastal Engineering, Santander, Spain, 1–6 July 2012. [Google Scholar]
- Zviely, D.; Bitan, M.; DiSegni, D.M. The effect of sea-level rise in the 21st century on marine structures along the Mediterranean coast of Israel: An evaluation of physical damage and adaptation cost. Appl. Geogr. 2012, 57, 154–162. [Google Scholar] [CrossRef]
- Hall, J.W.; Brown, S.; Nicholls, R.J.; Pidgeon, N.F.; Watson, R.T. Proportionate adaptation. Nat. Clim. Chang. 2012, 2, 833–834. [Google Scholar] [CrossRef]
- PG. Memoria Econòmica I D’activitats 2017; Ports de la Generalitat: Barcelona, Spain, 2018. [Google Scholar]
- APB. Annual Report 2017; Port de Barcelona: Barcelona, Spain, 2018. [Google Scholar]
- APT. Annual Report 2017; Port de Tarragona: Tarragona, Spain, 2018. [Google Scholar]
Figure 1.
Location of the 47 analyzed ports, the four buoys and the three forecasting points used in the study.
Figure 1.
Location of the 47 analyzed ports, the four buoys and the three forecasting points used in the study.

Figure 2.
Evolution of sea level rise (SLR) during the 21st century for the three scenarios considered.
Figure 2.
Evolution of sea level rise (SLR) during the 21st century for the three scenarios considered.

Figure 3.
Number of ports with overtopping discharges greater than the tolerable ones, for the three SLR scenarios and for a return period of 5 years.
Figure 3.
Number of ports with overtopping discharges greater than the tolerable ones, for the three SLR scenarios and for a return period of 5 years.

Figure 4.
Number of ports with overtopping discharges greater than the tolerable ones, for the three SLR scenarios and for a return period of 50 years.
Figure 4.
Number of ports with overtopping discharges greater than the tolerable ones, for the three SLR scenarios and for a return period of 50 years.

Figure 5.
Estimation of damages (in millions of euros) in Catalan ports due to overtopping for the three SLR scenarios and for a return period of 5 years.
Figure 5.
Estimation of damages (in millions of euros) in Catalan ports due to overtopping for the three SLR scenarios and for a return period of 5 years.

Figure 6.
Estimation of damages (in millions of euros) in Catalan ports due to overtopping for the three SLR scenarios and for a return period of 50 years.
Figure 6.
Estimation of damages (in millions of euros) in Catalan ports due to overtopping for the three SLR scenarios and for a return period of 50 years.

Figure 7.
Estimation of adaptation costs (in millions of euros) of Catalan ports to overtopping for the three SLR scenarios and for a return period of 5 years. Filled lines indicate the cost of zero damage option and dashed lines correspond to the costs of minimum damage alternative.
Figure 7.
Estimation of adaptation costs (in millions of euros) of Catalan ports to overtopping for the three SLR scenarios and for a return period of 5 years. Filled lines indicate the cost of zero damage option and dashed lines correspond to the costs of minimum damage alternative.

Figure 8.
Estimation of adaptation costs (in millions of euros) of Catalan ports to overtopping for the three SLR scenarios and for a return period of 50 years. Filled lines indicate the cost of zero damage option and dashed lines correspond to the costs of minimum damage alternative.
Figure 8.
Estimation of adaptation costs (in millions of euros) of Catalan ports to overtopping for the three SLR scenarios and for a return period of 50 years. Filled lines indicate the cost of zero damage option and dashed lines correspond to the costs of minimum damage alternative.


Table 1.
Subsidence values (in cm) applied to the two ports located in deltas.
| Year | Barcelona | S. Carles de la Ràpita |
|---|---|---|
| 2020 | 10.0 | 3.50 |
| 2030 | 15.0 | 5.25 |
| 2040 | 20.0 | 7.00 |
| 2050 | 25.0 | 8.75 |
| 2060 | 30.0 | 10.50 |
| 2070 | 35.0 | 12.25 |
| 2080 | 40.0 | 14.00 |
| 2090 | 45.0 | 15.75 |
| 2100 | 50.0 | 17.50 |
Table 2.
Damage and adaptation costs (in M€) for TR = 5 years. DD: Direct damages; AC0D: adaptation costs with 0 damage; ACMD: adaptation costs with minimum damage.
Table 2.
Damage and adaptation costs (in M€) for TR = 5 years. DD: Direct damages; AC0D: adaptation costs with 0 damage; ACMD: adaptation costs with minimum damage.
| Year | RCP4.5 | RCP8.5 | HES | ||||||
|---|---|---|---|---|---|---|---|---|---|
| DD | AC0D | ACMD | DD | AC0D | ACMD | DD | AC0D | ACMD | |
| 2020 | 0.004 | 1.840 | 0.000 | 0.004 | 1.903 | 0.000 | 0.005 | 1.903 | 0.000 |
| 2030 | 0.005 | 1.903 | 0.000 | 0.005 | 1.903 | 0.000 | 0.014 | 2.198 | 0.270 |
| 2040 | 0.005 | 1.903 | 0.000 | 0.014 | 2.738 | 0.270 | 0.033 | 3.133 | 1.130 |
| 2050 | 0.023 | 2.873 | 0.970 | 0.032 | 2.898 | 0.995 | 0.034 | 3.358 | 1.155 |
| 2060 | 0.023 | 2.898 | 0.970 | 0.033 | 2.998 | 1.130 | 0.124 | 4.253 | 1.880 |
| 2070 | 0.033 | 3.108 | 0.995 | 0.034 | 3.358 | 1.155 | 0.152 | 4.650 | 2.125 |
| 2080 | 0.033 | 3.108 | 1.130 | 0.034 | 3.503 | 1.855 | 1.043 | 5.785 | 2.985 |
| 2090 | 0.033 | 3.133 | 1.130 | 0.124 | 3.503 | 1.880 | 1.161 | 6.108 | 3.520 |
| 2100 | 0.034 | 4.083 | 1.855 | 0.142 | 4.440 | 2.125 | 1.352 | 7.378 | 4.668 |
Table 3.
Damage and adaptation costs (in M€) for TR = 50 years. DD: Direct damages; AC0D: adaptation costs with 0 damage; ACMD: adaptation costs with minimum damage.
Table 3.
Damage and adaptation costs (in M€) for TR = 50 years. DD: Direct damages; AC0D: adaptation costs with 0 damage; ACMD: adaptation costs with minimum damage.
| Year | RCP4.5 | RCP8.5 | HES | ||||||
|---|---|---|---|---|---|---|---|---|---|
| DD | AC0D | ACMD | DD | AC0D | ACMD | DD | AC0D | ACMD | |
| 2020 | 1.105 | 10.598 | 7.245 | 1.106 | 10.673 | 7.945 | 1.106 | 10.818 | 7.945 |
| 2030 | 1.106 | 10.818 | 7.945 | 1.106 | 10.818 | 7.945 | 1.116 | 11.768 | 8.080 |
| 2040 | 1.106 | 11.543 | 8.080 | 1.106 | 11.543 | 8.080 | 1.134 | 11.955 | 8.313 |
| 2050 | 1.106 | 11.543 | 8.080 | 1.125 | 11.768 | 8.168 | 1.135 | 12.568 | 9.038 |
| 2060 | 1.116 | 11.768 | 8.105 | 1.134 | 11.955 | 8.313 | 1.234 | 13.455 | 9.283 |
| 2070 | 1.125 | 11.793 | 8.868 | 1.135 | 12.165 | 9.038 | 2.153 | 14.013 | 10.490 |
| 2080 | 1.134 | 11.793 | 9.013 | 1.144 | 13.430 | 9.138 | 2.180 | 15.313 | 11.130 |
| 2090 | 1.134 | 12.655 | 9.038 | 1.234 | 13.455 | 9.308 | 3.265 | 16.345 | 12.363 |
| 2100 | 1.135 | 12.865 | 9.038 | 1.253 | 13.825 | 10.303 | 3.465 | 17.928 | 13.068 |
© 2019 by the author. Licensee MDPI, Basel, Switzerland. This article is an open access article distributed under the terms and conditions of the Creative Commons Attribution (CC BY) license (http://creativecommons.org/licenses/by/4.0/).
Share and Cite
MDPI and ACS Style
Sierra, J.P. Economic Impact of Overtopping and Adaptation Measures in Catalan Ports Due to Sea Level Rise. Water 2019, 11, 1440. https://doi.org/10.3390/w11071440
AMA Style
Sierra JP. Economic Impact of Overtopping and Adaptation Measures in Catalan Ports Due to Sea Level Rise. Water. 2019; 11(7):1440. https://doi.org/10.3390/w11071440
Chicago/Turabian StyleSierra, Joan Pau. 2019. "Economic Impact of Overtopping and Adaptation Measures in Catalan Ports Due to Sea Level Rise" Water 11, no. 7: 1440. https://doi.org/10.3390/w11071440
Note that from the first issue of 2016, this journal uses article numbers instead of page numbers. See further details here.