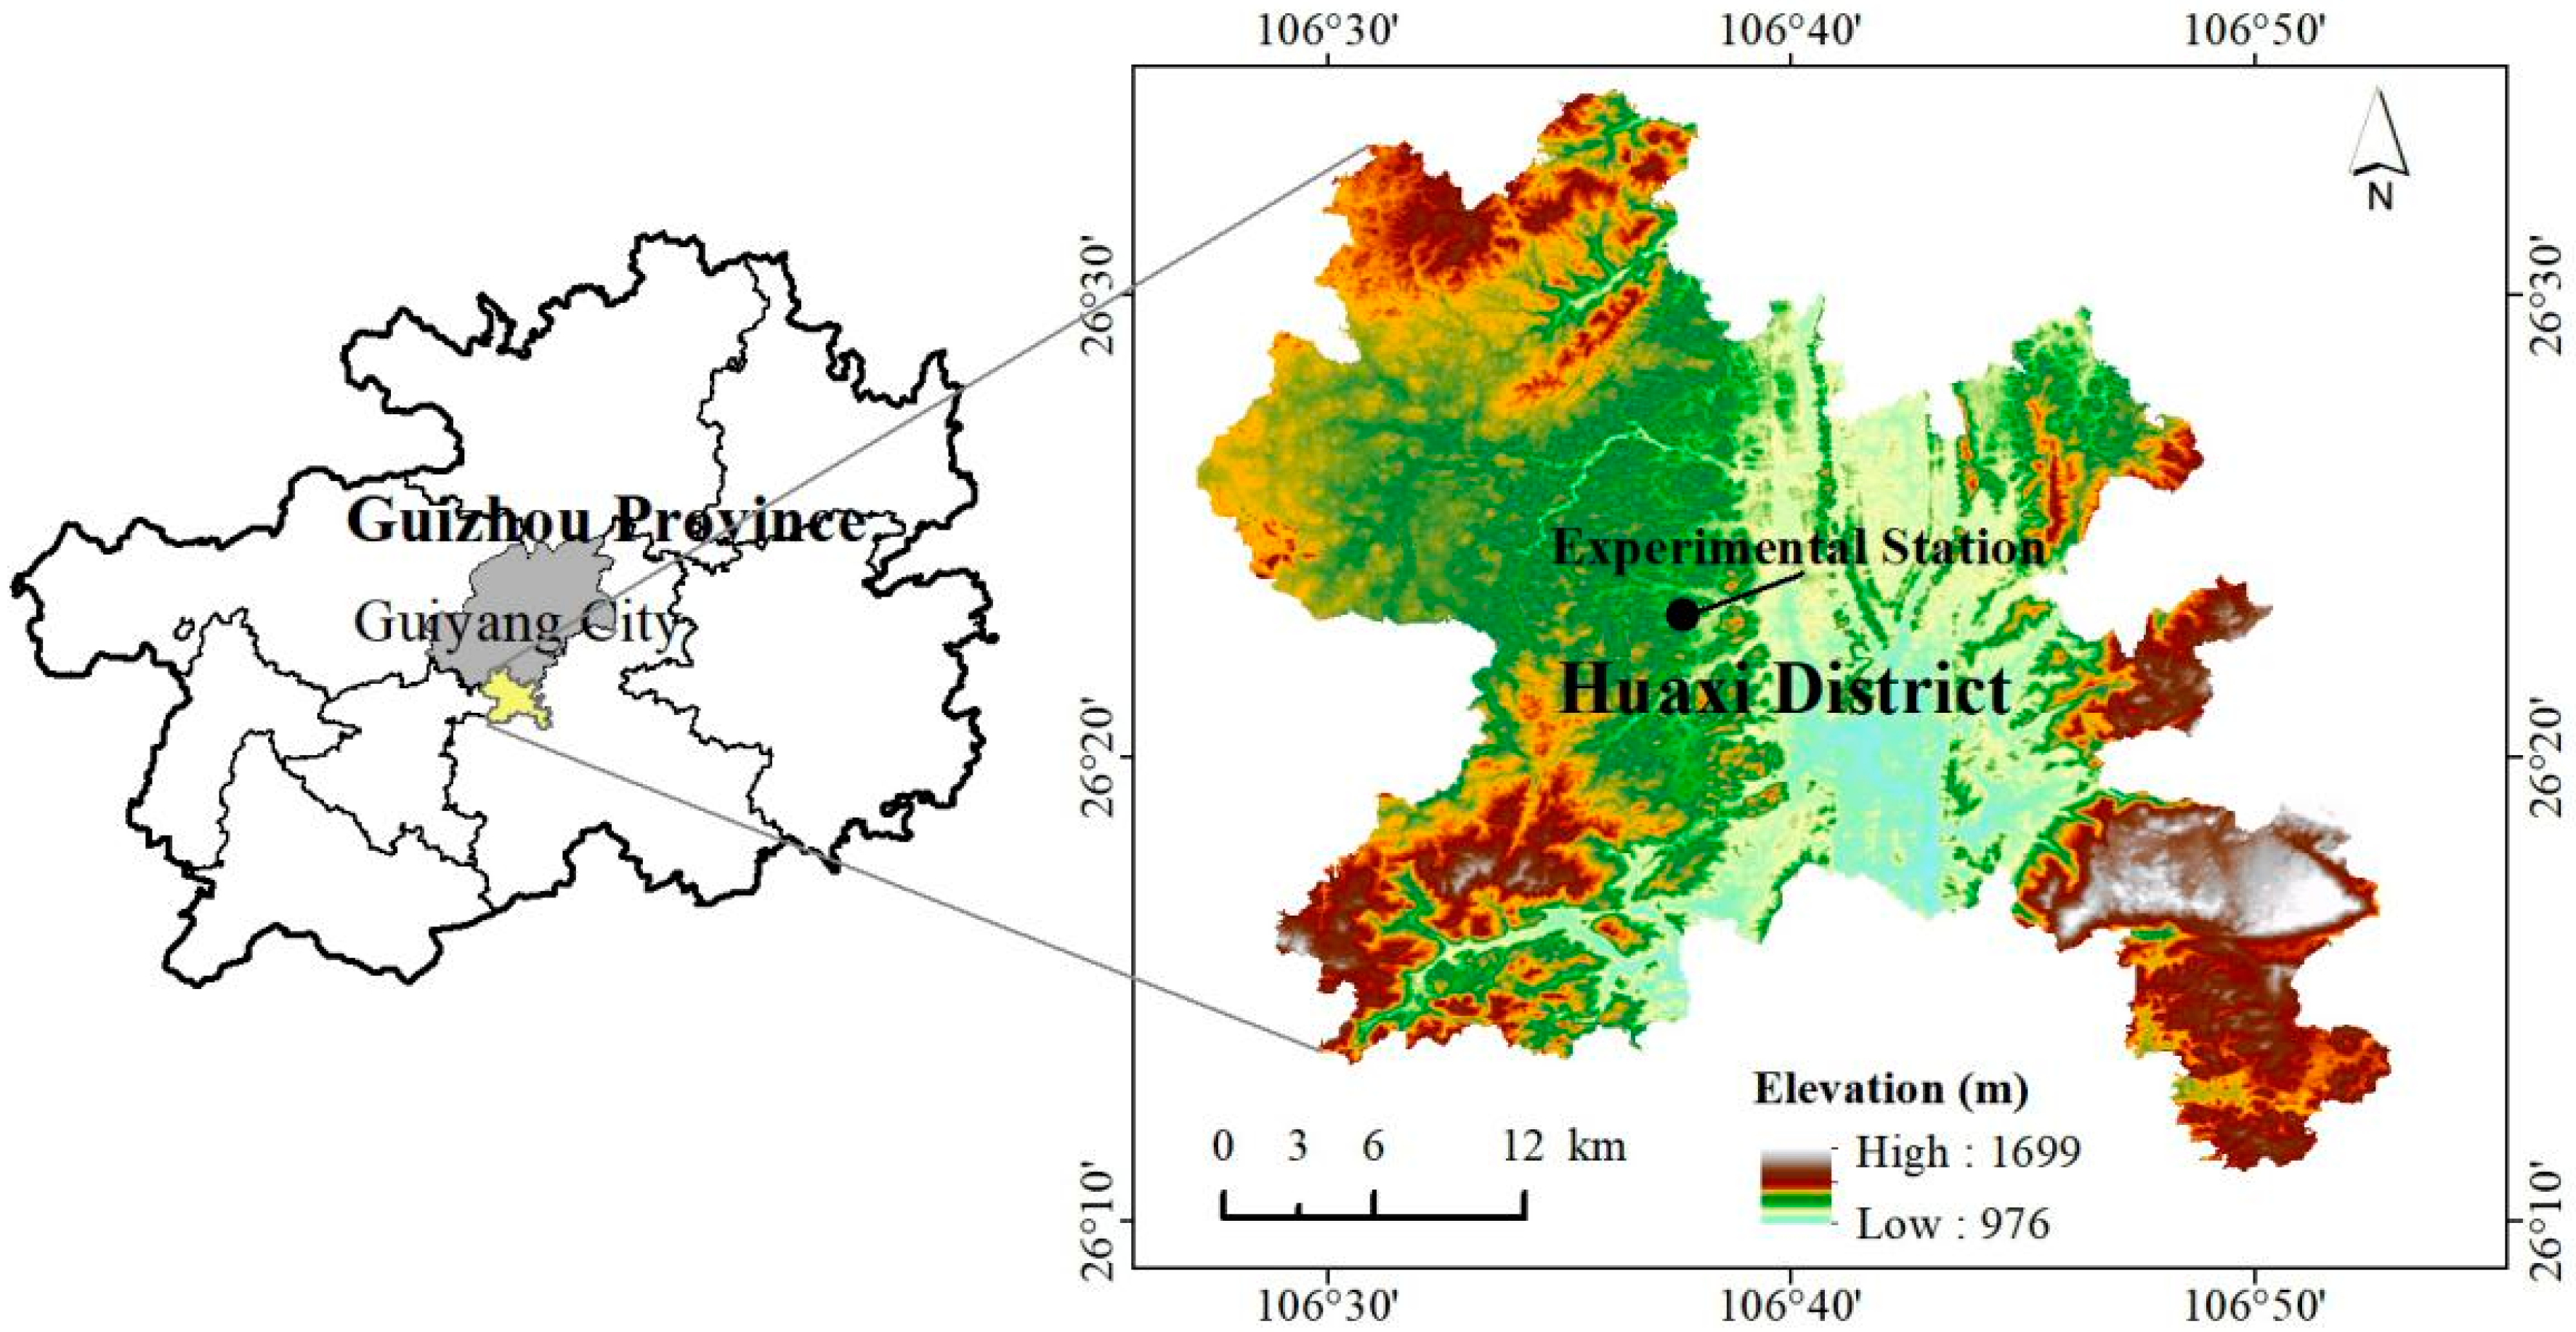
Article

Temporal Soil Moisture Variations in Different Vegetation Cover Types in Karst Areas of Southwest China: A Plot Scale Case Study

1
School of Geography and Environmental Science, Guizhou Normal University, Guiyang 550001, China
2
Pearl River Hydraulic Research Institute, Pearl River Water Resources Commission of the Ministry of Water Resources, Guangzhou 510611, China
*
Author to whom correspondence should be addressed.
Water 2019, 11(7), 1423; https://doi.org/10.3390/w11071423
Submission received: 26 April 2019 / Revised: 30 June 2019 / Accepted: 8 July 2019 / Published: 11 July 2019

Abstract

:
For different vegetation types, soil moisture content shows varying characteristics in different seasons and under different precipitation conditions. However, these characteristics have not been extensively analyzed in karst regions of southwest China. In this study, the soil moisture content of four plots of bare land, grassland, shrubland, and forestland was monitored, and the soil moisture content and corresponding meteorological data for each plot were analyzed. The results indicate that the average soil moisture content in grassland was the highest with weak temporal variation and that in bare, shrub, and forest lands soil moisture content was low with moderate temporal variation. The average soil moisture content in bare, grass, and forest lands was higher in the rainy season than in the dry season, whereas in shrubland, the soil moisture content was higher in the dry season than in the rainy season. Increase in soil moisture content during each precipitation event correlated with the rainfall amount. With increasing rainfall amount, soil moisture content in forest and shrub lands increased more than in bare and grass lands. The peak soil moisture time in each vegetation type plot varied and the peak soil moisture time was related to soil moisture content before a rainfall event. Temperature showed a strong negative correlation with soil moisture content for all vegetation cover types in both the dry and rainy season. Wind speed also showed a strong negative correlation with soil moisture content for all vegetation types during the dry season. Relative humidity had a strong positive correlation with soil moisture content in bare, shrub, and forest lands during the dry season as well as in the four vegetation types during the rainy season. These results demonstrate the variations in soil water characteristics across different vegetation types in karst regions of southwest China.

1. Introduction

Soil water is not only one of the main factors influencing hydrological and soil erosion processes, vegetation growth, and restoration, but also circulates material in the soil system, which has an important influence on regional microclimates [1,2]. The environmental factors that affect soil moisture content mainly include rainfall, land use, vegetation cover, topography, physical and chemical properties of soil, and soil thickness [3,4,5,6]. As an important environmental factor, vegetation cover effectively intercepts, blocks, and consumes rainfall [7]. Furthermore, vegetation cover indirectly affects the soil moisture content by influencing other environmental factors such as temperature, wind speed, and the physical and chemical properties of the soil. Numerous studies have shown that, with exposure to different vegetation cover or land use conditions, changes in soil moisture content have varying characteristics [7,8,9].
Due to a wide distribution of carbonate rocks, which have strong dissolution kinetics, karst areas are common geological features that are characterized by unique water cycle processes [10]. Affected by factors such as complex topography, shallow and discontinuous soil layers, and lack of surface water, the soil properties, vegetation type, and growth conditions, karst areas are different from non-karst areas [11,12]. With exposure to different vegetation cover conditions, soil moisture in karst areas is different from other areas. In addition, due to serious surface water leakage in karst areas and difficulties associated with the use of groundwater resources, soil water is an important water resource in southwest China [13,14,15]. Therefore, studying the relationship between soil moisture and vegetation cover types in karst areas is critical for hydrological processes, prevention of rocky desertification, and vegetation restoration in these areas [16,17].
At present, studies on soil moisture conditions under different vegetation cover types have focused more on non-karst areas [4,18]. These studies mainly analyze semi-arid or arid regions, such as the Loess Plateau in China, with extremely few studies analyzing karst areas [7,8,9,19,20,21]. Research on the factors that affect soil moisture in karst areas mainly involves topography, lithology, land use, and vegetation type. For example, Xie et al. [5] studied changes in the physical properties, available water content, water holding capacity, and water supply capacity of soil during successions of agricultural land, abandoned farmland, shrubland, sparse forest, and secondary forest vegetation. Li et al. [17] compared soil moisture in different directions around the rocks in typical rocky karst desertification areas, studying the effects of rock volume and shape on soil moisture. Fu et al. [22] studied changes in soil moisture with altitude and topography in a small karst catchment. Studies on the effects of vegetation types on soil water in karst areas have mainly focused on profile characteristics and spatial patterns in soil moisture [16,23,24,25,26]. For example, Li et al. [23] studied soil moisture profile characteristics in farmland and grassland in typical karst peak clusters. Li et al. [25] used soil moisture and meteorological data at different time scales, i.e., 1–64 days, to analyze soil moisture time series correlations between arbor forest, grass, and agricultural lands as well as soil moisture time series correlations with different soil depths. Chen et al. [26] analyzed temporal soil moisture dynamics at depths 0–10 cm and the relationships between the mean and coefficient of variation of moisture under different land uses at karst hill slopes. These studies have advanced the understanding of soil moisture content distributions in horizontal and vertical directions in karst areas. However, these studies do not reflect changes in soil moisture content across fine time scales and variations in soil moisture content during individual rainfall events. Therefore, temporal variations in soil moisture content under different vegetation cover types in karst areas still pose a number of worthy scientific questions.
We hypothesize that the effect of specific vegetation types on soil moisture characteristics is different due to the vegetation type-specific effect on soil water circulation. We hypothesized that the impact of a specific vegetation type can be assessed by investigating the variation of soil moisture content due to the response to main meteorological factors. The purpose of this study is to understand the characteristics of soil moisture content over time under different vegetation cover types in karst areas. In this study, there are four vegetation cover type plots, i.e., bare land, grassland, shrubland, and forestland in karst areas of southwest China. Soil moisture content was monitored from February to March (dry season) and July to August (rainy season) at hourly scales. The time series of soil moisture data was not enough, such that this work was a preliminary study. The differences in soil moisture content under the different vegetation cover types during the study period (rainy and dry season) were analyzed and compared, taking into account the effect of meteorological factors, such as temperature, wind speed, and relative humidity. This study will enable improvements in our understanding of hydrological processes in karst areas based on apparent vegetation restoration in karst areas of southwest China.

2. Materials and Methods

2.1. Study Area

The plots analyzed in this study are located in the Huaxi District of Guiyang City (106°37′ E, 26°23′ N). This area is approximately 1200 m above sea level and is dominated by mountains and hills (Figure 1). Triassic limestone is widely distributed throughout this area, which is characterized by shallow soil layers (several tens of centimeters). The region has a subtropical monsoon climate with an average annual temperature of 14.9 °C, a maximum temperature of 35.1 °C, a minimum annual temperature of −7.3 °C, and an annual rainfall of 1178.3 mm [27]. Precipitation mainly occurs in summer, with annual evaporation at 738 mm and heavy vegetation coverage. According to relevant research, average annual potential evapotranspiration in Guizhou province is about 844.32 mm [28]. The main vegetation types include trees, such as Pinus massoniana (Pinus massoniana Lamb), German oak (Quercus acutissima Carruth), Cinnamomum glanduliferum (Cinnamomum glanduliferum (Wall.) Nees), and Chinese sweet gum (Liquidambar formosana Hance), as well as shrubs and barren hills. Bedrock is composed of limestone and the soil type is predominantly Rendzic Leptosols with small soil thicknesses, between 10 and 30 cm. Although rainfall is abundant, Guizhou still lacks surface water resources due to large amounts of underground leakage. Destructive human activities, such as logging and farming, result in the distributions of secondary forests, shrubs, and grasses.

2.2. Experimental Plot Setting and Data Acquisition

In this study, a total of four plots was implemented, i.e., bare land, grassland, shrubland, and forestland. Soil type in plots was Rendzic Leptosols. The size of every plot was 10 m × 10 m. To ensure similarity of other environment factors such as slope and aspect of ground among these plots to eliminate influence of these factors, these four plots were set on the same slope and closed to each other (distance between each plots was about 15 m). The thickness of soil layer in these plots was about 20–30 cm. These plots were set on the same hill slope. The slope of plots in bare land, grassland, shrubland, and forestland were 30°, 30°, 10°, and 15° respectively. Runoff generated when there was a large rainfall.
These plots have been changed from farmland to woodland 10 years ago. All vegetation in these plots was grown naturally to various secondary vegetation. To compare characteristics of soil moisture between “bare land” and ground covered by vegetation, one of the plots was wiped out to become a “bare land”. The monitor of soil moisture began half year after the wiping out of grass. The height of vegetation in grassland, shrubland, and forestland were 0.4 m, 2.2 m, and 23 m respectively. The depth of roots in grassland was about 15 cm. The depth of roots in shrubland and forestland were more than 20 cm and deeper than soil layer. The vegetation coverage in grassland, shrubland, and forestland was 55%, 75%, and 95%, respectively. Vegetation species in grassland mainly included fernbrake (Pteridium aquilinum (L.) Kuhn. var. latiusculum (Desv.) Underw. ex Heller), hispid arthraxon (Arthraxon hispidus (Thunb.) Makino), and Ficus tikoua (Ficus tikoua Bur.). Vegetation species in shrubland mainly included Chinese Silvergrass (Miscanthus sinensis.), cinnamon (Cinnamomum cassia Presl), holly (Ilex chinensis Sims), and hackberry (Celtis sinensis Pers.). Vegetation species in forestland mainly included Pinus massoniana (Pinus massoniana Lamb), German oak (Quercus acutissima Carruth), Common Nandina (Nandina domestica), and Ampelopsis sinica (Ampelopsis sinica (Mig.) W.T.Wang.).
Volumetric soil moisture content was measured with time domain reflector (TDR) probes (soil moisture smart sensor (S-SMx-M005), onset computer corporation, Bourne, MA, USA) with a measurement accuracy of ±3 vol % and an operating temperature range from −40 °C to 85 °C. The probe-connected data collectors continuously and automatically recorded data. Three sample points were randomly selected in each plot. The probes, installed in July 2017, were placed 15 and 20 cm below the surface. Meteorological data, such as rainfall, temperature, relative humidity, and wind speed, were recorded using an automatic weather station, which was installed approximately 50–100 m away from the sample sites. The collection frequency of the soil moisture content and meteorological data was set to one-hour intervals. The bulk soil density, saturated water content, saturated hydraulic conductivity, and field water holding capacity were measured using the ring knife method with a sampling depth of 15–20 cm. Soil sample was sieved <2 mm and the particle size distribution of the sieved soil sample was measured using the hydrometer method (Table 1).

2.3. Data Collation and Classification

Soil moisture content was monitored in February and March (dry season) and July and August (rainy season) of 2018. The average soil moisture content measured by the three probes at a depth of 15 cm was set as the 15 cm soil moisture content for each plot. The average soil moisture content from the three probes at 20 cm was used as the 20 cm soil moisture content for each plot. The average soil moisture content from the six probes at each plot was used as the plot’s average soil moisture content.
When rainfall occurs, rainwater replenishes soil water and obvious variation of soil moisture content occurs. Therefore, we analyzed soil moisture content data collected during the period with rainfall-impact and the period without rainfall-impact separately. Since dynamic changes in soil moisture content during rainfall account for the soil moisture content before rainfall were analyzed rainfall periods in this study began at 1 h before the actual rainfall event. Because the soil moisture content response to rainfall usually lags behind rainfall, this study used a delay of 12 h after the end of an individual precipitation event as the end of the rainfall impact period. Such that the period with rainfall impact was from 1 h before the rainfall event to 12 h after the rainfall event. If the interval between discontinuous rainfall events is less than 12 h, we analyze these events as the same rainfall event. Other period was taken as the period without rainfall impact. We first selected the soil moisture content data for all rainfall-impact periods and then selected the soil moisture content that was noticeably affected by rainfall (i.e., increases in soil moisture content that were greater than 1 vol %). We used the following equation to calculate increases in soil moisture content:
Δ S M = S M p S M s ,
where SMp is the maximum soil moisture content observed for each rainfall event, SMs is the initial soil moisture content for each rainfall event, and ΔSM is the magnitude of the increase in soil moisture content per rainfall event.

2.4. Soil Moisture Content Data Statistics

To study the effects of the four different vegetation cover types on the average level and time variability of soil moisture content, we analyzed the soil moisture content time series data from all the plots and different depths by statistical means, including the mean value, standard deviation, and coefficient of variation. The study area is located in the subtropical monsoon region and seasonal differences in meteorological factors, such as temperature and precipitation. Due to the large scale of the study area, we separately counted the soil moisture content data for the entire study period, i.e., between the rainy and dry seasons, and we analyzed the differences in soil moisture content between the different seasons in various vegetation cover conditions.
Since a small amount of rainfall has no noticeable effect on soil moisture content, the observed soil moisture content data were divided into two types: Rainfall-impact type and no-rainfall-impact type. The screening method is as follows: First, we calculated the increase in soil moisture content per rainfall event. Then, we used the rainfall event characterized by an increase in soil moisture content of more than 1 vol % as the rainfall event that affects soil moisture content.
The linear regression method was used to analyze changes in soil moisture content trends with increasing rainfall, which was then used to compare differences in soil moisture content response to rainfall with exposure to the various vegetation cover types.
The time at which the peak of soil moisture content appears may reflect the response of the soil moisture content to rainfall in each plot. Therefore, we defined a cumulative peak time (CPT) to measure how quick soil moisture content responds to rainfall. The CPT is the sum of the time at which the soil moisture peak appears in each rainfall event. We use the following equation to calculate CPT:
CPT = P T j ,
where PTj is the time at which the peak soil moisture occurs for the jth rainfall and CPT is the cumulative soil moisture peak time.
Compared with other meteorological factors, rainfall has a greater impact on soil moisture content. Therefore, we calculated the change per hour in the amount of soil moisture content when rainfall was zero. We then performed a Spearman correlation analysis with temperature, wind speed, and relative humidity. The following equation was used to calculate the amount of change in soil moisture content per hour:
Δ S M i = S M i + 1 S M i ,
where SMi is the soil moisture content at time i, SMi+1 is the soil moisture content at time i + 1, and ΔSMi is the amount of soil moisture content change at time i.

3. Results

3.1. General Soil Moisture Content Characteristics in Different Vegetation Cover Types

Figure 2 shows the average soil moisture content for each plot during the study period. Average soil moisture content of bare land, grassland, shrubland, forestland was 34.7 vol %, 42.2 vol %, 34.2 vol % and 36.1 vol % respectively. The coefficient of variation of soil moisture content of these four plots was 10%, 6%, 12% and 12%, respectively. In each plot, the average grassland soil moisture content was the highest, whereas the other three plots had a similar soil moisture content, which was ranked as follows: Grassland > forestland > bare land > shrubland. According to the Mann–Whitney’s U test with Bonferroni correction (Table 2), every soil moisture content data series under each vegetation cover types were significantly different from that of every other vegetation cover types (p < 0.05). The CV (coefficient of variation) of soil moisture content of the grassland was the lowest with high time stability. The CV of soil moisture content of the other three plots was similar, which was ranked as follows: Grassland < bare land < shrubland = forestland. The results above indicate that grassland can more efficiently hold soil water. In contrast, shrubland showed the least ability to hold soil water, due to both low average soil moisture content and its instability.
As shown in Figure 3, the average soil moisture content in different soil depths was higher at 20 cm than at 15 cm. The difference in soil moisture content at two depths across shrubland was slightly larger than that of the other plots. According to the Mann–Whitney’s U test with Bonferroni correction, soil moisture content data series at 15 cm were significantly different from that at 20 cm under each vegetation cover types (p < 0.001). Grassland soil moisture content was higher than that of other plots at 15 and 20 cm. The other plots were ranked at a depth of 15 cm in the following order: Forestland > bare land > shrubland. At a depth of 20 cm, they were ranked in the following order: Shrubland > forestland > bare land. The soil depth coefficient of variation for the different plots was greater at 15 cm than at 20 cm and the differences in soil depth for shrubland were slightly larger than that in the other plots. The grassland coefficient of variation was lower than that of other plots at 15 and 20 cm. At a soil depth of 15 cm, the other plots were ranked as bare land < forestland < shrubland and, at a soil depth of 20 cm, as bare land < shrubland < forestland. The soil moisture content and the CV of soil moisture content between the plots varied obviously at soil depths of 15 cm, whereas the coefficient at soil depths of 20 cm was small.

3.2. Seasonal Differences in Soil Moisture Content under Different Vegetation Cover Types

As shown in Figure 4, rainfall caused noticeable changes in soil moisture content in both the dry and rainy season. Soil moisture content increases when a large rainfall event occurs, while, with no or little rainfall, soil moisture content mainly declines. Based on a comparison of the four plots, we found that soil moisture content was the highest in grassland for most of the study period, with minimal fluctuations over time. The difference of soil moisture content and time variation characteristics among bare land, shrubland, and forestland was less obvious than the difference between grassland and other plots. From February to early March, there were less rainfall events and precipitation and the soil moisture content time curve was smoother. The number of rainfall events began to increase at the end of March and was greater in the rainy season. The amount of precipitation was also larger, which yielded more fluctuations in the soil moisture content time curve. Table 3 lists the seasonal differences in meteorological factors for the study area, which all have varying effects on soil moisture content. Based on a comparison of meteorological data from different seasons, there was more rainfall in the rainy season than in the dry season, such that there was a corresponding decline in the soil moisture content in dry season. However, the average temperature in the dry season was lower than that of the rainy season, which caused higher soil evapotranspiration in the rainy season than in the dry season. The greater wind speed and the lower relative humidity in the dry season also led to soil evapotranspiration in the dry season higher than rainy season. Therefore, soil moisture content in the rainy season declined more quickly when there was no rainfall.
Figure 5 shows the soil moisture content for each month. During the study period, the grassland soil moisture content was higher than that of the other plots in each month, followed by forestland. The soil moisture content in both bare and shrubland was low. By comparing the differences in soil moisture content from each plot with the meteorological data listed in Table 4, we observe that the grassland soil moisture content can be ranked as August > March > July > February, which was consistent with the amount of total rainfall that occurs in each of those months. The monthly soil moisture content and rainfall rankings for the other plots were not completely consistent. The soil moisture content of bare land was the largest in August, followed by February > July and March with the lowest soil moisture content, whereas that in shrubland was the highest in March, followed by August and February, and was the lowest in July. Forestland had the highest soil moisture content in August, followed by February and March and the lowest soil moisture content in July. According to the Mann–Whitney’s U test with Bonferroni correction (Table 5), soil moisture content data series in every mouths were significantly different from soil moisture data series in every other mouths (p < 0.05). Inconsistent characteristics for soil moisture content and changes in rainfall were related to the different responses that soil moisture content had to meteorological factors and the differences in vegetation growth dependent on the type of vegetation.

3.3. Characteristics of the Changes in Soil Moisture Content During the Rainfall Impact Period

There were 16 rainfall events where the soil moisture content increased by more than 1 vol % in an individual plot, which were selected to analyze changes in soil moisture content during a rainfall event. Figure 6 shows the soil moisture peak and initial soil moisture content for each plot. The type of vegetation cover and initial soil moisture content affects the response of the soil moisture content to rainfall. When the average soil moisture content is low before a rainfall event, the grassland peak time usually has a delayed response. When the average soil moisture content is high before a rainfall event, the grassland peak time usually occurs earlier. The rank of CPT (cumulative soil moisture peak time) of these plots turned out to be different when the initial soil moisture content varied. Therefore, the rainfalls were classified based on initial soil water content with 39 vol % as threshold value, as at 39 vol % the difference of rank between the two categories was the most distinct. Therefore, the initial soil moisture content data was divided into two categories with a demarcation point of 39 vol % and the CPT was calculated separately. Based on Table 6, it was observed that the grassland soil moisture content was highest before a rainfall event, followed by forestland while bare and shrub lands were lower. When the average soil moisture content before a rainfall event was <39 vol %, the difference in soil moisture content among these vegetation cover types before a rainfall event was great. The CPT order, from low to high, was forestland, shrubland, bare land, and grassland. When the average soil moisture content before a rainfall event was ≥39 vol %, the difference in soil moisture content before a rainfall event was small. The CPT order, from low to high, was grassland, forestland, shrubland, and bare land. According to the Mann–Whitney’s U test with Bonferroni correction (Table 7), difference of peak soil moisture times between bare land and shrubland, between bare land and forestland, and between grassland and forestland was significant (p < 0.05), while the differences of peak soil moisture times between any two other plots were not significant (p > 0.05) when average initial soil moisture content was smaller than 39 vol %. The difference of peak soil moisture content times between any two other plots were not significant (p > 0.05) when average initial soil moisture content was larger than 39 vol %.
Figure 7 shows trends of the increase in soil moisture content with each rainfall event. The increase in soil moisture content could increase less with increase of rainfall until it became stable (non-linear). When antecedent soil moisture was high, the increase if soil moisture could be little. When antecedent soil moisture was saturated, increase of soil moisture could be 0%. Therefore, the trend line in this figure suggested the difference of response of soil moisture among these plots. Table 8 lists the results of the Spearman correlation and regression analysis. The increase in soil moisture content per rainfall event correlates significantly with the amount of rainfall (p = 0.05). By comparing the slopes obtained from the linear regression analysis, we observed that as the amount of rainfall increased, soil moisture content increased in the forest and shrub lands, followed by bare land, and grassland had the smallest increase. A comparison of the R2 values from the linear regression analysis indicates that the correlation between the increase in soil moisture content and rainfall was the largest in shrubland, followed by bare land and forestland, while grassland had the smallest R2 value. According to the Mann–Whitney’s U test with Bonferroni correction (Table 9), the difference of increase of soil moisture content between any two vegetation cover types was not significant (p > 0.05). Therefore, the regression analysis was used to compare extent of response of soil moisture among different plots merely.

3.4. Characteristics of the Changes in Soil Moisture Content without Rainfall

Figure 8 shows the soil moisture content variation per hour with meteorological factors. Based on the results of the Spearman correlation analysis (Table 10; p = 0.05), changes in the soil moisture content for bare land had a strong negative correlation with temperature and wind speed. The changes in soil moisture content for grassland had a strong negative correlation with relative humidity. The amount of change in the soil moisture content for shrubland and forestland had a strong negative correlation with temperature and relative humidity. Based on the results of regression analysis (Table 11), variation of soil moisture content with temperature was larger. When correlations between a soil moisture content data series and a meteorological factors were not significant, the regression analysis was not been carried out. Figure 9 shows the soil moisture content variation per hour with meteorological factors variation per hour. Based on the results of the Spearman correlation analysis (Table 12; p = 0.05), soil moisture content variation per hour in shrubland had a strong correlation with variation of temperature and relative humidity per hour and soil moisture content variation per hour had a strong correlation with variation of relative humidity per hour. Correlation between soil moisture variation per hour in other plots and variation of other meteorological factors per hour were not significant. According to the significance level in Table 12, the regression analysis between soil moisture content variation in shrubland and variation of temperature, between soil moisture content variation in shrubland and variation of relative humidity and between soil moisture content variation in forestland and variation of relative humidity were carried out. The slopes of the three regressions were −0.016, 0.002, and 0.001, respectively. The intercepts of the three regression analyses were −0.025, −0.025, and −0.019, respectively. The R2 of the three regression analysis were 0.023, 0.007, and smaller than 0.001, respectively.
Based on the Spearman correlation analysis results listed in Table 13 (p = 0.05), soil moisture content in the bare, grass, shrub, and forest lands had a strong negative correlation with temperature and wind speed in dry season. There was a significant positive correlation between soil moisture content and relative humidity in bare, shrub, and forest lands. Soil moisture content in bare, grass, shrub, and forest lands had a strong negative correlation with temperature and a positive correlation with relative humidity in rainy season. Figure 10 shows the soil moisture content with meteorological factors. Overall, in both the rainy and dry seasons, temperature had a strong negative correlation with soil moisture content for each plot. The soil moisture content had a strong positive (or nearly positive) correlation with relative humidity. The main difference between the rainy and dry season was that the soil moisture content in each plot in the dry season had a strong negative correlation with wind speed. The Spearman correlation coefficient between soil moisture content and wind speed for each plot in the rainy season did not pass the significance test at p = 0.05. In general, the correlation coefficient between soil moisture content of bare land and temperature in dry season was the largest. Further, the correlation coefficients between soil moisture content of grassland and meteorological factors in the dry season were smaller than that of other plots. Based on the regression analysis results listed in Table 14, the extent of soil moisture variation with meteorological factors was not different obviously according to slopes. The R2 were low in all plots, which was consistent with Figure 10.

4. Discussion

4.1. Effects of Different Vegetation Cover Types on Overall Soil Moisture Content Characteristics

Grassland soil moisture content was the highest during the study period (Table 1). In terms of soil water replenishment, grassland vegetation results in a dense cover of the surface and has a retarding effect on rainfall, such that surface rainwater is not quickly lost and root systems promote rainwater seepage, which is beneficial to soil water recharge from rainfall. In terms of soil water consumption, grassland vegetation distributed densely and soil water evaporation may, to some extent, decrease due to reduced wind speed and solar radiation. In addition, the clay content of the grassland site was slightly greater than that of the other sites, which may increase the water holding capacity and explain the smaller hydraulic conductivity. The average soil moisture content in bare land was less than that in grassland because there was no vegetation cover on bare ground resulting in rainwater quickly flew away during a precipitation event [29]. Due to the absence of vegetation roots, it is relatively unfavorable for rainwater seepage. When no rainfall occurs, the absence of surface vegetation cover led to faster soil water evaporation. The average soil moisture content in shrub and forest lands was lower than that of grassland because of the fact that the extent of above-ground biomass, stand height, vegetation coverage, and leaf area index were all obviously higher than that of grassland, which results in increased rainfall interception compared with grassland areas. In addition, the amount of water consumed by other vegetation types was usually larger than the amount of water consumed by grassland vegetation, such that soil moisture content was lower than in grassland. The average soil moisture content was larger at 20 cm than at 15 cm (Figure 2) due to soil water evaporation in the topsoil. Wang et al. [20] studied soil moisture in China’s Loess Plateau during the months of July and August, with an average monthly rainfall of 113.5 mm, which is similar to the monthly rainfall of the area studied here (117.61 mm). Results from Wang et al. [20] showed that soil moisture in grassland was the highest, followed by forest and shrub lands, which is consistent with the results of this study. Mei et al. [21] studied soil moisture in vegetation restoration areas of the Loess Plateau in western Shanxi, China, concluding that soil moisture of natural grassland is higher than that of artificial and natural forestland. According to these studies, grassland is an appropriate vegetation type to hold soil water. Xie et al. [5] studied ecological efficiency changes of soil moisture in karst areas with different land type uses and found that soil moisture efficiency was closely related to soil properties such as content of soil clays and porosity, which is consistent with the results of this study. However, this research concluded that water holding capacity was the best of forest land and abandoned farmland and the poorest of shrub land, close to sparse wood land, which is inconsistent with this study. The reason of this is that the rank of content of soil clay in condition of these vegetation cover types is different from this study. Fu et al. [22] found that soil texture was one of the main influence factors of soil moisture content, which was consistent with the result of this study. Canton et al. [30] found that clay content, surface cover had effect on soil moisture on a Mediterranean karst hillslope, and high clay content could explain the increase of soil moisture content. In conclusion, soil texture and natural vegetation cover type could influence each other, such that different vegetation cover types are related to different soil texture and the vegetation cover type could influence soil moisture content by influencing soil texture.
As mentioned above, grassland soil moisture content maintained an elevated level for an extended period of time, such that the soil moisture content before a rainfall event was higher and was closed to saturated water content. Therefore, the soil infiltration velocity was smaller, and the rainwater seepage rate was slower, which resulted in a reduced increase in soil moisture content during a rainfall event. Therefore, the coefficient of variation is minimal (Figure 3). Soil moisture content in bare land before a rainfall event was less than that of grassland but the amount of increase in soil moisture content during a rainfall event was less than that of shrubland and forestland. After a rainfall event, soil water evaporated quickly but the vegetation does not consume water, which resulted in a moderate coefficient of variation. Low soil moisture content before a rainfall event in shrub and forest lands resulted in a large increase in soil moisture content during a rainfall event. During periods of no rainfall, vegetation transpiration in shrub and forest lands was more than that of bare and grass lands, which resulted in the largest coefficient of variation. We obtained the coefficient of variation for soil moisture content at 15 and 20 cm (Figure 3), which indicated that the soil moisture content coefficient of variation for each plot was greater at 15 cm than at 20 cm. This is due to the fact that upper soil water is directly affected by rainfall, which eventually evaporates and is more susceptible to changes in surface environments.

4.2. Reasons for Seasonal Differences in Soil Moisture Content

Soil moisture content in March, July, and August for grassland was slightly higher than that in February (Figure 5), which was due to the more rainfall in March, July, and August (Table 4). In contrast, there was not an obvious increase in soil moisture content in March, July, and August for bare land, shrubland, and forestland. The reason for bare land is that surface rainwater lost quickly, causing a lesser impact of rainfall in grassland, and the higher temperature in March, July, and August makes evapotranspiration quicker than that for grassland due to no vegetation. The reason for shrubland and forestland is more evaporation and transpiration in March, July, and August. Soils in karst areas are shallow and have a low water holding capacity. The soil water evaporation rate and infiltration rate are faster when soil moisture content was high during and after rainfall, which was also an important reason that explains the low amount of soil moisture content in March, July, and August. In contrast, non-karst areas usually have thicker soil layers and soil moisture content in the rainy season was normally higher than in the dry season. In addition, temperature in February was lower than that of other months, which could result in lower evapotranspiration and consumption of water by vegetation. Therefore, the soil moisture content was not smaller than that of other months obviously, although the rainfall differences were very large.

4.3. Differences in Soil Moisture Content Response to Rainfall for Different Vegetation Cover Types

When the average soil moisture content in each plot before a rainfall event was small (<39 vol %), the grassland soil moisture content was noticeably larger than that of the other plots, which results in a reduced soil infiltration capacity in grassland, slower surface water seepage velocities, and, therefore, the soil moisture content response time to rainfall has the largest delay in grassland compared with the other vegetation cover types. Before a rainfall event, the soil moisture content in bare land was low and there was an absence of vegetation interception. Rainfall reaches nearly all land surfaces, such that the rainfall response time was slightly earlier for bare land than that for grassland. Trunks and roots in shrubland and forestland promote infiltration. Compared with grassland, the average soil moisture content before rainfall in shrubland and forestland areas was lower and surface water infiltration rates were faster than in grassland. Therefore, the response time of shrub and forest lands to rainfall was earlier than that of grass and bare lands. When the average soil moisture content was high (≥39 vol %) before a rainfall event, there was a smaller difference among soil moisture content of each plot before the rainfall event and the soil infiltration capacity and the infiltration velocity was decreased. The influence from the differences in the infiltration capacity on the response time became weaker, such that the response time was mainly affected by the effects that different vegetation types had on rainfall. The grassland interception capacity was small and the vegetation consumes less water than shrub and forestland. Therefore, grassland had the earliest response to rainfall, followed by forestland and shrubland. Due to the existence of a surface crust on bare land, rainwater quickly runs off and the absence of vegetation roots promote rainwater infiltration, such that the soil moisture content response to rainfall was the most delayed (Table 6).
Jin et al. [8] found that the accumulated rainfall amount required to trigger a soil moisture response at depth 10 cm at the grassland site and the forestland uphill-slope site was smaller than that for the forestland gully site covered by dense undergrowth and trees. This conclusion was consistent with the result of this study that the response to rainfall for grassland was earlier than that for forestland and shrubland when soil was wet (average initial soil moisture content in these plots ≥39 vol %). Zheng et al. [19] studied the differences in soil moisture content under three vegetation cover conditions in Inner Mongolia, China, and concluded that the peak start time for grassland was earlier than that of the other two types of arbor covered plots. The results from Zheng et al. [19] are also consistent with the soil moisture content observed before rainfall event at a CPT ≥39 vol % in this study, whereas they are inconsistent with the soil moisture content at <39 vol % before a rainfall event. The reason is that rainfall on the Chinese Loess Plateau and Inner Mongolia, China was less, such that soil moisture was smaller and did not differ obviously in grassland and arbor forestland. Response of soil moisture content was mainly affected by water interception of vegetation. In addition, Karst areas are characterized by a poor water holding capacity. Moreover, bare soil water evaporates faster, whereas shrubland and forestland consume more water. Therefore, when there is relatively little rainfall, grassland soil moisture content before a rainfall event is noticeably higher than that of other vegetation cover types, which results in the most delayed response of grassland soil moisture content to rainfall. In general, the response to rainfall of soil moisture content in grassland is earlier than that in forestland when initial soil moisture in the condition of different vegetation cover type is not different obviously.

4.4. Influence of Other Meteorological Factors on Soil Moisture Content

When there was no rainfall, temperature had a strong negative correlation with soil moisture content for most vegetation cover types. This correlation was more significant than the correlations with other meteorological factors (Table 13). This is due to the fact that temperature had the greatest impact on soil water evapotranspiration and vegetation water consumption, as temperature could indirectly affect soil water evapotranspiration by influencing the soil temperature. In addition, there are obvious changes in temperature during different weather conditions and during the day, such that the degree of changes in soil moisture content with temperature and, therefore, correlation analysis results can explain the effect of temperature on soil moisture content. The correlation between temperature and soil moisture content in bare land during the dry season was the most noticeable. This correlation occurred because the occlusion of the vegetation reduced the near-surface temperature, whereas the near-surface temperature in bare land was relatively high, which caused the temperature to obviously affect soil water evaporation in bare land. Moreover, there is little rainfall in the dry season and, therefore, rainfall had a minor effect on changes in soil water. In conclusion, temperature was correlated with soil moisture content more significantly, and the significant level affected by season and vegetation cover. This phenomenon is due to a thin soil layer and weak water holding capacity result in quicker evaporation, which makes soil moisture content affected by influence factors of evaporation such as meteorological factors, season, vegetation cover types more significantly than that of non-karst. Wind velocity and relative humidity only had significant correlations with soil moisture content in a small number of plots but the correlation coefficients were low. This is possibly due to the interaction between various meteorological factors (Figure 11) and environmental processes associated with soil moisture content; their combined effects on soil moisture content are complex. Li et al. [23] found that the relative humidity and precipitation had a greater effect than air temperature controlling the change of soil moisture at larger scales in farmland and grassland in karst catchments of southwestern China. Zhang et al. [25] found that the dominant influencing factors on the variability of surface soil moisture were rainfall and land use types in a depression area of karst region. In general, the effect of rainfall on soil moisture is greater in the karst area.
Based on the correlation analysis of the change in soil moisture content and meteorological factors, the change in soil moisture content in bare, shrub, and forest lands has a strong negative correlation with temperature. Due to less soil water evapotranspiration and vegetation water consumption in grassland compared with bare land, effect of temperature on evapotranspiration and water consumption was less significant, which reduced the correlation between changes in soil moisture content and temperature in grassland. Only changes in soil moisture content in bare land had a significant negative correlation with wind speed, which was due to vegetation in the other three plots that blocked or reduced near-surface wind speeds.
Wind speed had a significant negative correlation with soil moisture content in the dry season, whereas the correlation between soil moisture content and wind speed in the rainy season was not significant. This is due to high temperatures in the rainy season and heavy rainfall, which had a great impact on soil moisture content and led to a relative reduction in the influence that wind speed had on soil moisture content. Except for grassland in the dry season, the relative humidity of air and soil moisture content had significant correlations in both the dry and rainy seasons, the reason for which can be divided into two main aspects. On one hand, when the relative humidity is high, soil water evaporates slowly and air moisture also replenishes the soil water. On the other hand, increase of temperature and wind speed decreased not only soil moisture content but also relative humidity. A period without rainfall in dry season from 3–27 February was chosen to explain this correlation (Figure 11). Therefore, the effect of relative humidity on soil moisture content was synchronous with the effect of temperature and wind velocity on soil moisture content, which made correlation between relative humidity and soil moisture content more significant. In addition, soil moisture content decreased more quickly in karst area than in non-karst area when temperature increased, which caused a correlation between temperature and soil moisture content to be more significant.
As there are many other factors such as initial soil moisture content and seasonal change influencing soil moisture content, and the mechanism of these factor was complicated, such as the effect of temperature and wind velocity on relative humidity (Figure 11), no defined correlation between temperature, wind velocity, and relative humidity and soil moisture was found as can be seen in Figure 8, Figure 9 and Figure 10. Therefore, a period without rainfall with obvious variation of temperature and wind velocity in the dry season (from 3–27 February) was selected to investigate the effect of temperature and wind velocity on soil moisture content. And a period with little rainfall and distinct variation of relative humidity in the rainy season (from 12–19 July) was selected to investigate the effect of relative humidity on soil moisture content. Between temperature and soil moisture content a correlation could be found (Figure 12 and Table 15), while correlation between wind velocity and soil moisture content was similar to result in Table 13, and correlation between relative humidity and soil moisture content was less obviously than result in Table 13. Therefore, the regression analysis between soil moisture content in each plot and temperature in this period were carried out. The result suggested that slopes of one-dimensional linear regression equation in bare land, grassland, shrubland, and forestland were −0.151, −0.109, −0.211, and −0.115, respectively. Intercepts were 36.954, 40.874, 36.241, and 36.781, respectively. R2 were 0.132, 0.414, 0.340, and 0.199, respectively. Due to correlations between soil moisture content and wind velocity and between soil moisture content and relative humidity were not improved obviously in the selected period, the regression analysis between them was not carried out.
The period without rainfall in the dry season (from 3–27 February) was selected to investigate the delay of response of soil moisture to the meteorological variables variation per hour. The soil moisture content data was delayed 1 and 5 h compared to each meteorological factors respectively. According to Figure 13 and Table 16, correlations between meteorological factors and soil moisture content with delayed time of 1 or 5 h was still not more obvious than correlations with no delay of response time (Table 15). Therefore, there could not be hysteresis of response of soil moisture to these meteorological factors.

4.5. Limitation of Soil Moisture Content Data

The monitoring period of soil moisture content in this work included four mouths with February and March representing dry season and July and August representing rainy season. There were differences of meteorological factors among different mouths in the whole year, such that two months was not representative enough for the whole dry season or the whole rainy season. Extreme weather and outlier value of soil moisture content could have a greater effect on results of analysis due to the limited data series. Furthermore, there was fewer times of rainfall events in this limited data series, such that the investigation of response of soil moisture to rainfall was not accuracy enough. Therefore, the time series of soil moisture data was not enough to investigate the characteristics of soil moisture content very accurately, such that studies with the longer soil moisture content data series in karst area is needed to investigate the characteristics of soil moisture content in karst area.

5. Conclusions

In this study, our results indicate that soil moisture content was higher at 20 cm than that at 15 cm and the CV of soil moisture content was larger at 15 cm than that at 20 cm. Soil moisture of grassland was higher in March, July, and August than that in February, which was caused by rainfall in different season. The increase of soil moisture content of grassland is more than that of other vegetation types when there was more monthly rainfall. Increase of soil moisture content of forestland and shrubland was larger and was affected by precipitation more significantly than that of grassland and bare land. Based on a comparison of peak soil moisture content times, response of soil moisture content of bare land was later than that of shrubland and forestland. The hysteresis phenomenon of the response of soil moisture content was also affected by initial soil moisture content before a rainfall event. Higher initial soil moisture made the hysteresis phenomenon of response of soil moisture content to rainfall more obvious. The correlation between soil moisture content and meteorological factors in bare land, shrubland, and forestland was more significant than that in grassland, especially the correlation between temperature and soil moisture content. Further, the correlation between temperature and soil moisture content was more significant than that between wind velocity and soil moisture content and that between relative humidity and soil moisture content. The correlation between soil moisture content and meteorological factors such as temperature, wind velocity, and relative humidity was more significant in dry season. In conclusion, soil moisture content in grassland was higher and more stable than that in bare land, shrubland, and forestland. Grass is a vegetation type beneficial to holding soil water according to this work. Information of effects of vegetation cover types on soil moisture provides very valuable information for ecological and hydrological process research, the use and management of water resources and strategies of vegetation recovery in karst area.

Author Contributions

Q.Z. and X.L. conceived and designed the experiments; X.W., Z.P., C.Y. and Y.L. conducted the experiments; Z.S. analyzed the data; Q.Z. wrote the paper.

Funding

This research was funded by the National Science Foundation of China (grant numbers 41761003, 41601471); the Basic Research Program of Guizhou Province (grant number Qiankehe Jichu [2019]1433 and [2017]1131); the Foundation Program for Outstanding Talents in Higher Education Institutions of Guizhou Province (grant number [2018]042); the Science and Technology Support Program of Guizhou Province (grant number Qiankehe Zhicheng [2017]2855); the Project of Social Development of Guizhou Province (grant number [2013]3127); and the Project for National Top Discipline Construction of Guizhou Province: Geography in Guizhou Normal University (grant number 85-01 2017 Qianjiao Keyan Fa).

Acknowledgments

We are deeply grateful to the reviewers for his/her insight and careful review.

Conflicts of Interest

The authors declare no conflict of interest.

References

  1. Peters-Lidard, C.D.; Pan, F.; Wood, E.F. A re-examination of modeled and measured soil moisture spatial variability and its implications for land surface modeling. Adv. Water Resour. 2001, 24, 1069–1083. [Google Scholar] [CrossRef]
  2. Zhu, Y.; Shao, M. Variability and pattern of surface moisture on a small-scale hillslope in Liudaogou catchment on the northern Loess Plateau of China. Geoderma 2008, 147, 185–191. [Google Scholar] [CrossRef]
  3. Baroni, G.; Ortuani, B.; Facchi, A.; Gandolfi, C. The role of vegetation and soil properties on the spatio-temporal variability of the surface soil moisture in a maize-cropped field. J. Hydrol. 2013, 489, 148–159. [Google Scholar] [CrossRef]
  4. Liu, Q.; Hao, Y.; Stebler, E.; Tanaka, N.; Zou, C.B. Impact of Plant Functional Types on Coherence Between Precipitation and Soil Moisture: A Wavelet Analysis. Geophys. Res. Lett. 2017, 44, 12197–12207. [Google Scholar] [CrossRef]
  5. Xie, S.; Ren, W. Soil Moisture Characteristics in Karst Area with Different Land Use Types. Agric. Sci. Technol. 2013, 14, 1856–1860. [Google Scholar]
  6. Guo, L.; Lin, H. Addressing Two Bottlenecks to Advance the Understanding of Preferential Flow in Soils. In Advances in Agronomy; Academic Press: Cambridge, MA, USA, 2018; Volume 147, pp. 61–117. [Google Scholar]
  7. English, N.B.; Weltzin, J.F.; Fravolini, A.; Thomas, L.; Williams, D.G. The influence of soil texture and vegetation on soil moisture under rainout shelters in a semi-desert grassland. J. Arid Environ. 2005, 63, 324–343. [Google Scholar] [CrossRef]
  8. Jin, Z.; Guo, L.; Lin, H.; Wang, Y.; Yu, Y.; Chu, G.; Zhang, J. Soil moisture response to rainfall on the Chinese Loess Plateau after a long-term vegetation rehabilitation. Hydrol. Process. 2018, 32, 1738–1754. [Google Scholar] [CrossRef]
  9. Feng, T.J.; Wei, W.; Chen, L.D.; Keesstra, S.D.; Yang, Y. Effects of land preparation and plantings of vegetation on soil moisture in a hilly loess catchment in China. Land Degrad. Dev. 2018, 29, 1427–1441. [Google Scholar]
  10. Coz, M.L.; Bodin, J.; Renard, P. On the use of multiple-point statistics to improve groundwater flow modeling in karst aquifers: A case study from the Hydrogeological Experimental Site of Poitiers, France. J. Hydrol. 2017, 545, 109–119. [Google Scholar] [CrossRef]
  11. Zhou, Q.; Luo, Y.; Zhou, X.; Cai, M.; Zhao, C. Response of vegetation to water balance conditions at different time scales across the karst area of southwestern China—A remote sensing approach. Sci. Total Environ. 2018, 645, 460–470. [Google Scholar] [CrossRef]
  12. Zhou, Q.; Keith, D.M.; Zhou, X.; Cai, M.; Cui, X.; Wei, X.; Luo, Y. Comparing the Water-holding Characteristics of Broadleaved, Coniferous, and Mixed Forest Litter Layers in a Karst Region. Mt. Res. Dev. 2018, 38, 220–229. [Google Scholar] [CrossRef]
  13. Qin, L.; Bai, X.; Wang, S.; Zhou, D.; Li, Y.; Peng, T.; Tian, Y.; Luo, G. Major problems and solutions on surface water resource utilisation in karst mountainous areas. Agric. Water Manag. 2015, 159, 55–65. [Google Scholar] [CrossRef]
  14. Huang, W.; Ho, H.C.; Peng, Y.; Li, L. Qualitative risk assessment of soil erosion for karst landforms in Chahe town, Southwest China: A hazard index approach. Catena 2016, 144, 184–193. [Google Scholar] [CrossRef]
  15. Zhang, R.; Xu, X.; Liu, M.; Zhang, Y.; Xu, C.; Yi, R.; Luo, W. Comparing evapotranspiration characteristics and environmental controls for three agroforestry ecosystems in a subtropical humid karst area. J. Hydrol. 2018, 563, 1042–1050. [Google Scholar] [CrossRef]
  16. Zhang, J.G.; Chen, H.S.; Su, Y.R.; Kong, X.L.; Zhang, W.; Shi, Y.; Shen, G.M. Spatial variability and patterns of surface soil moisture in a field plot of karst area in southwest China. Plant Soil Environ. 2011, 57, 409–417. [Google Scholar] [CrossRef] [Green Version]
  17. Li, S.; Ren, H.D.; Xue, L.; Chang, J.; Yao, X.H. Influence of bare rocks on surrounding soil moisture in the karst rocky desertification regions under drought conditions. Catena 2014, 116, 157–162. [Google Scholar] [CrossRef]
  18. Li, Q.; Zhu, Q.; Zheng, J. Soil moisture response to rainfall in forestland and vegetable plot in Taihu Lake Basin, China. Chin. Geogr. Sci. 2015, 25, 426–437. [Google Scholar] [CrossRef]
  19. Zheng, H.; Gao, J.; Teng, Y.; Feng, C.; Tian, M. Temporal variations in soil moisture for three typical vegetation types in inner Mongolia, northern China. PLoS ONE 2015, 10, e0118964. [Google Scholar] [CrossRef]
  20. Wang, S.; Fu, B.; Gao, G.; Liu, Y.; Zhou, J. Responses of soil moisture in different land cover types to rainfall events in a re-vegetation catchment area of the Loess Plateau, China. Catena 2013, 101, 122–128. [Google Scholar] [CrossRef]
  21. Mei, X.M.; Ma, L.; Zhu, Q.K.; Wang, S.; Zhang, D.; Wang, Y. Responses of soil moisture to vegetation restoration type and slope length on the loess hillslope. J. Mt. Sci. 2018, 15, 548–562. [Google Scholar] [CrossRef]
  22. Fu, T.G.; Chen, H.S.; Fu, Z.Y.; Wang, K. Surface soil water content and its controlling factors in a small karst catchment. Environ. Earth Sci. 2016, 75, 1406. [Google Scholar] [CrossRef]
  23. Li, X.Z.; Xu, X.L.; Liu, W.; He, L.; Zhang, R.; Xu, C.; Wang, K. Similarity of the temporal pattern of soil moisture across soil profile in karst catchments of southwestern China. J. Hydrol. 2017, 555, 659–669. [Google Scholar] [CrossRef]
  24. Li, X.Z.; Xu, X.L.; Liu, W.; Xu, C.; Zhang, R.; Wang, K. Prediction of profile soil moisture for one land use using measurements at a soil depth of other land uses in a karst depression. J. Soils Sediments 2019, 19, 1479–1489. [Google Scholar] [CrossRef]
  25. Zhang, J.G.; Chen, H.S.; Su, Y.R.; Shi, Y.; Zhang, W.; Kong, X. Spatial Variability of Surface Soil Moisture in a Depression Area of Karst Region. Clean-Soil Air Water 2011, 39, 619–625. [Google Scholar] [CrossRef]
  26. Chen, H.S.; Zhang, W.; Wang, K.L.; Fu, W. Soil moisture dynamics under different land uses on karst hillslope in northwest Guangxi, China. Environ. Earth Sci. 2010, 61, 1105–1111. [Google Scholar] [CrossRef]
  27. Zhou, Q.; Zhou, X.; Luo, Y.; Cai, M. The Effects of Litter Layer and Topsoil on Surface Runoff during Simulated Rainfall in Guizhou Province, China: A Plot Scale Case Study. Water 2018, 10, 915. [Google Scholar] [CrossRef]
  28. Qin, N.X.; Chen, X.; Xue, X.W.; Ling, M.H.; Zhang, Z.C. Anapplicability study of potential evapotranspiration models in Guizhou province. Adv. Water Sci. 2010, 21, 357–363. [Google Scholar]
  29. She, D.; Liu, D.; Xia, Y.; Shao, M. A Modeling Effects of Land use and Vegetation Density on Soil Water Dynamics: Implications on Water Resource Management. Water Resour. Manag. 2014, 28, 2063–2076. [Google Scholar] [CrossRef]
  30. Canton, Y.; Emilio, R.C.; Contreras, S.; Villagarcia, L.; Li, X.Y.; Solé-Benet, A.; Domingo, F. Vertical and lateral soil moisture patterns on a Mediterranean karst hillslope. J. Hydrol. Hydromech. 2016, 64, 209–217. [Google Scholar] [CrossRef] [Green Version]
Figure 1. The study area and the geographic location of the experimental station of this study.
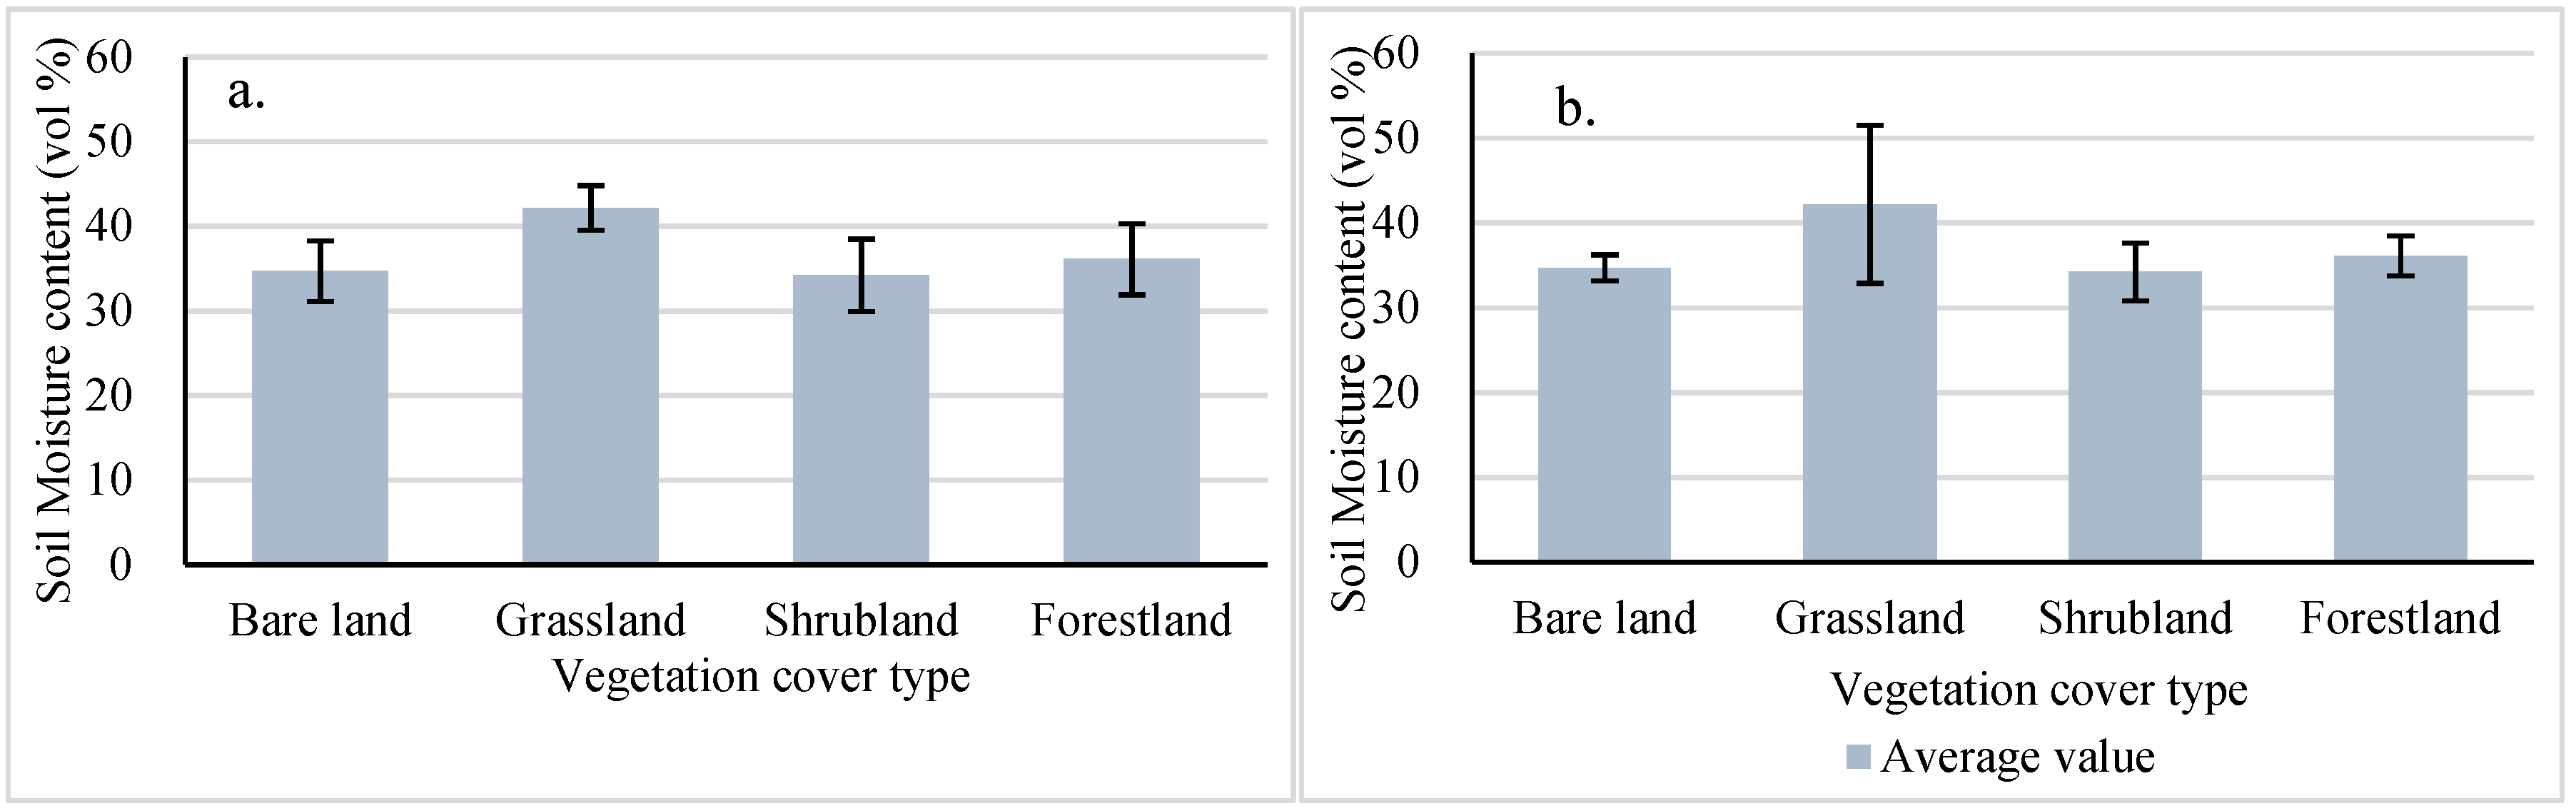
Water 11 01423 g001
Figure 2. Mean levels and temporal variations in volumetric soil moisture content with respect to different vegetation cover types. Error bars refer to the temporal standard deviations of soil moisture content (a) and the standard deviations of three repetitions (b), which reflect the temporal variations in soil moisture content and the errors of three repetitions respectively.
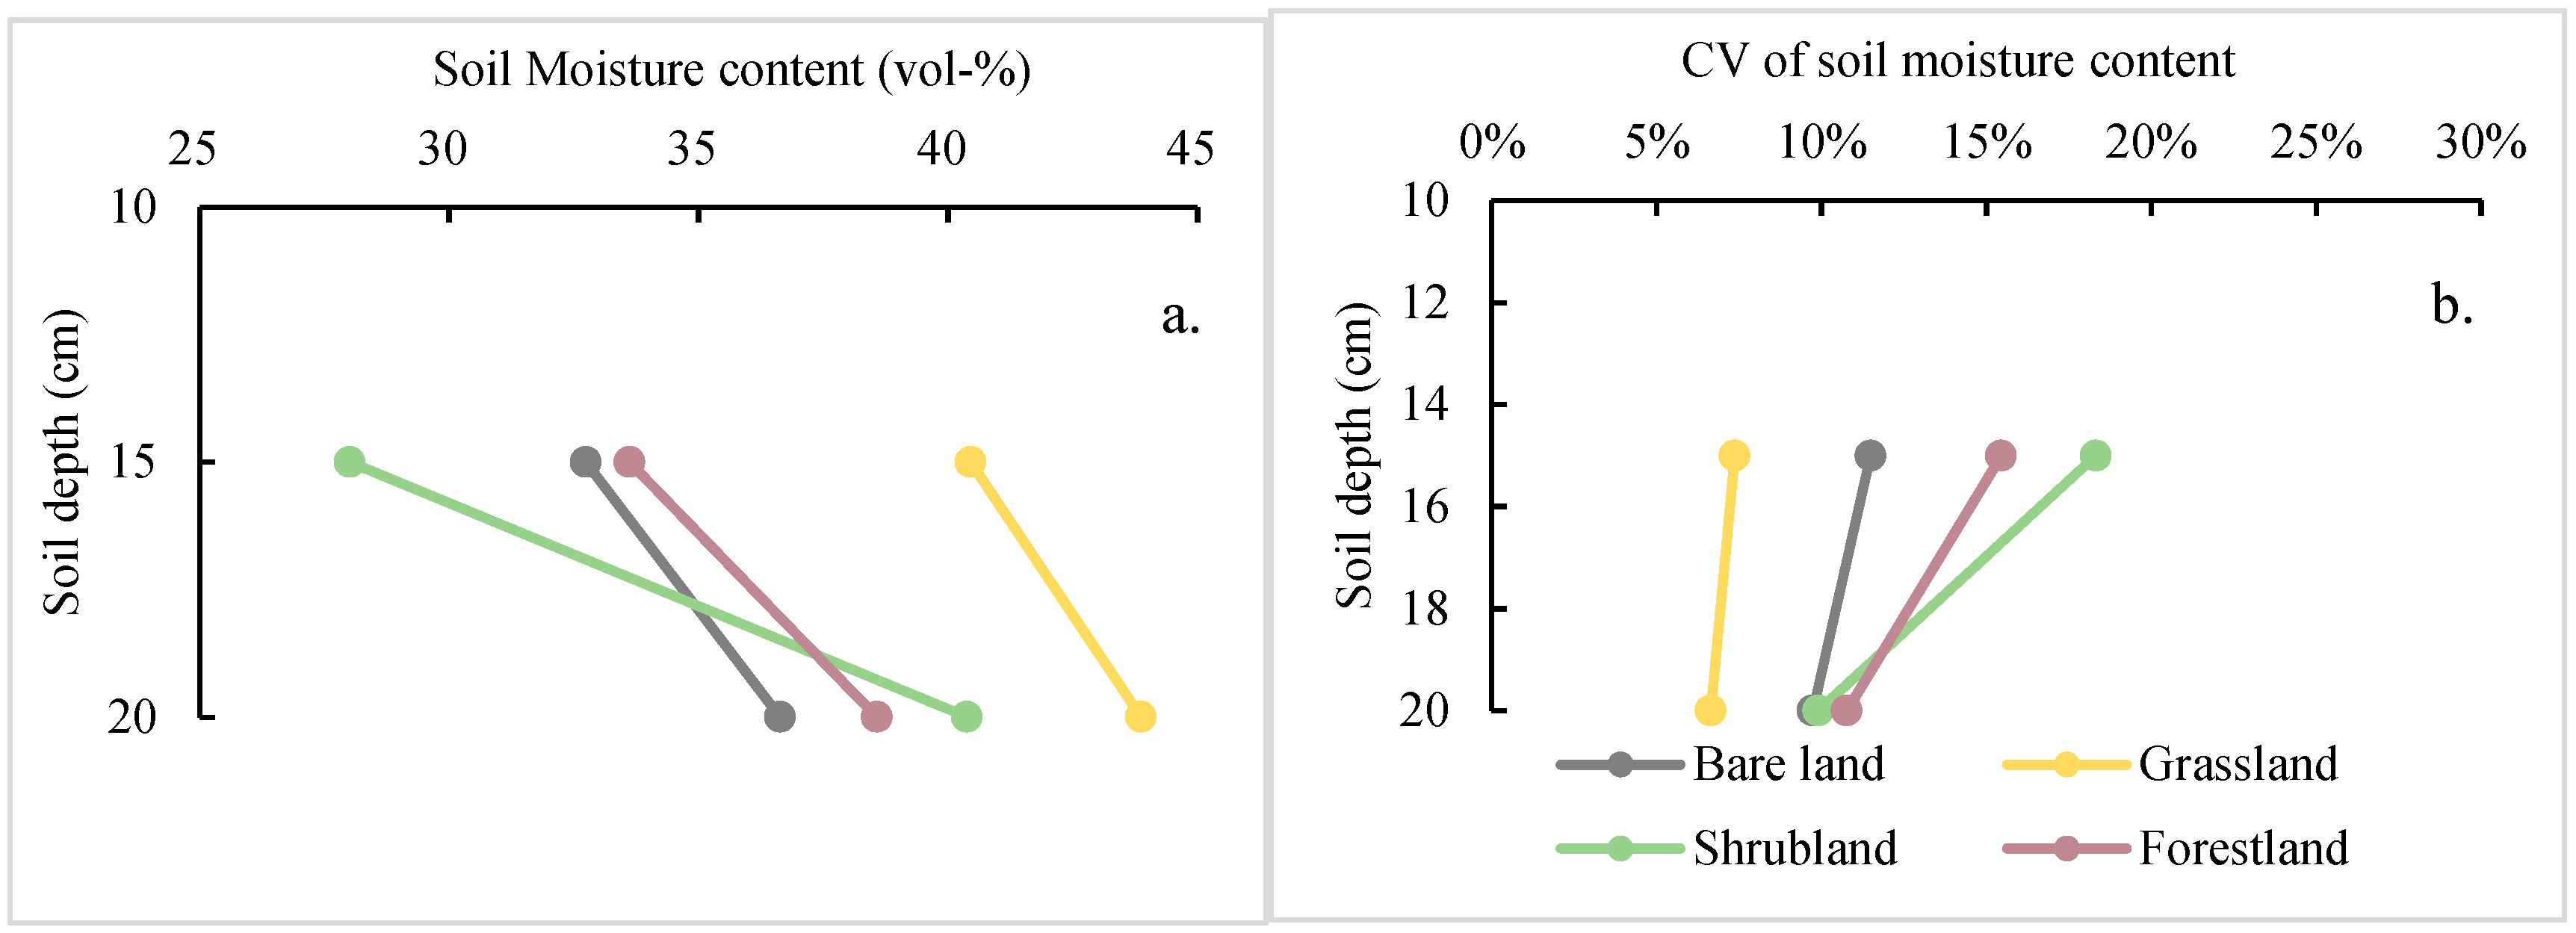
Water 11 01423 g002
Figure 3. Average value (a) and CV (b) of volumetric soil moisture content at different soil depths.
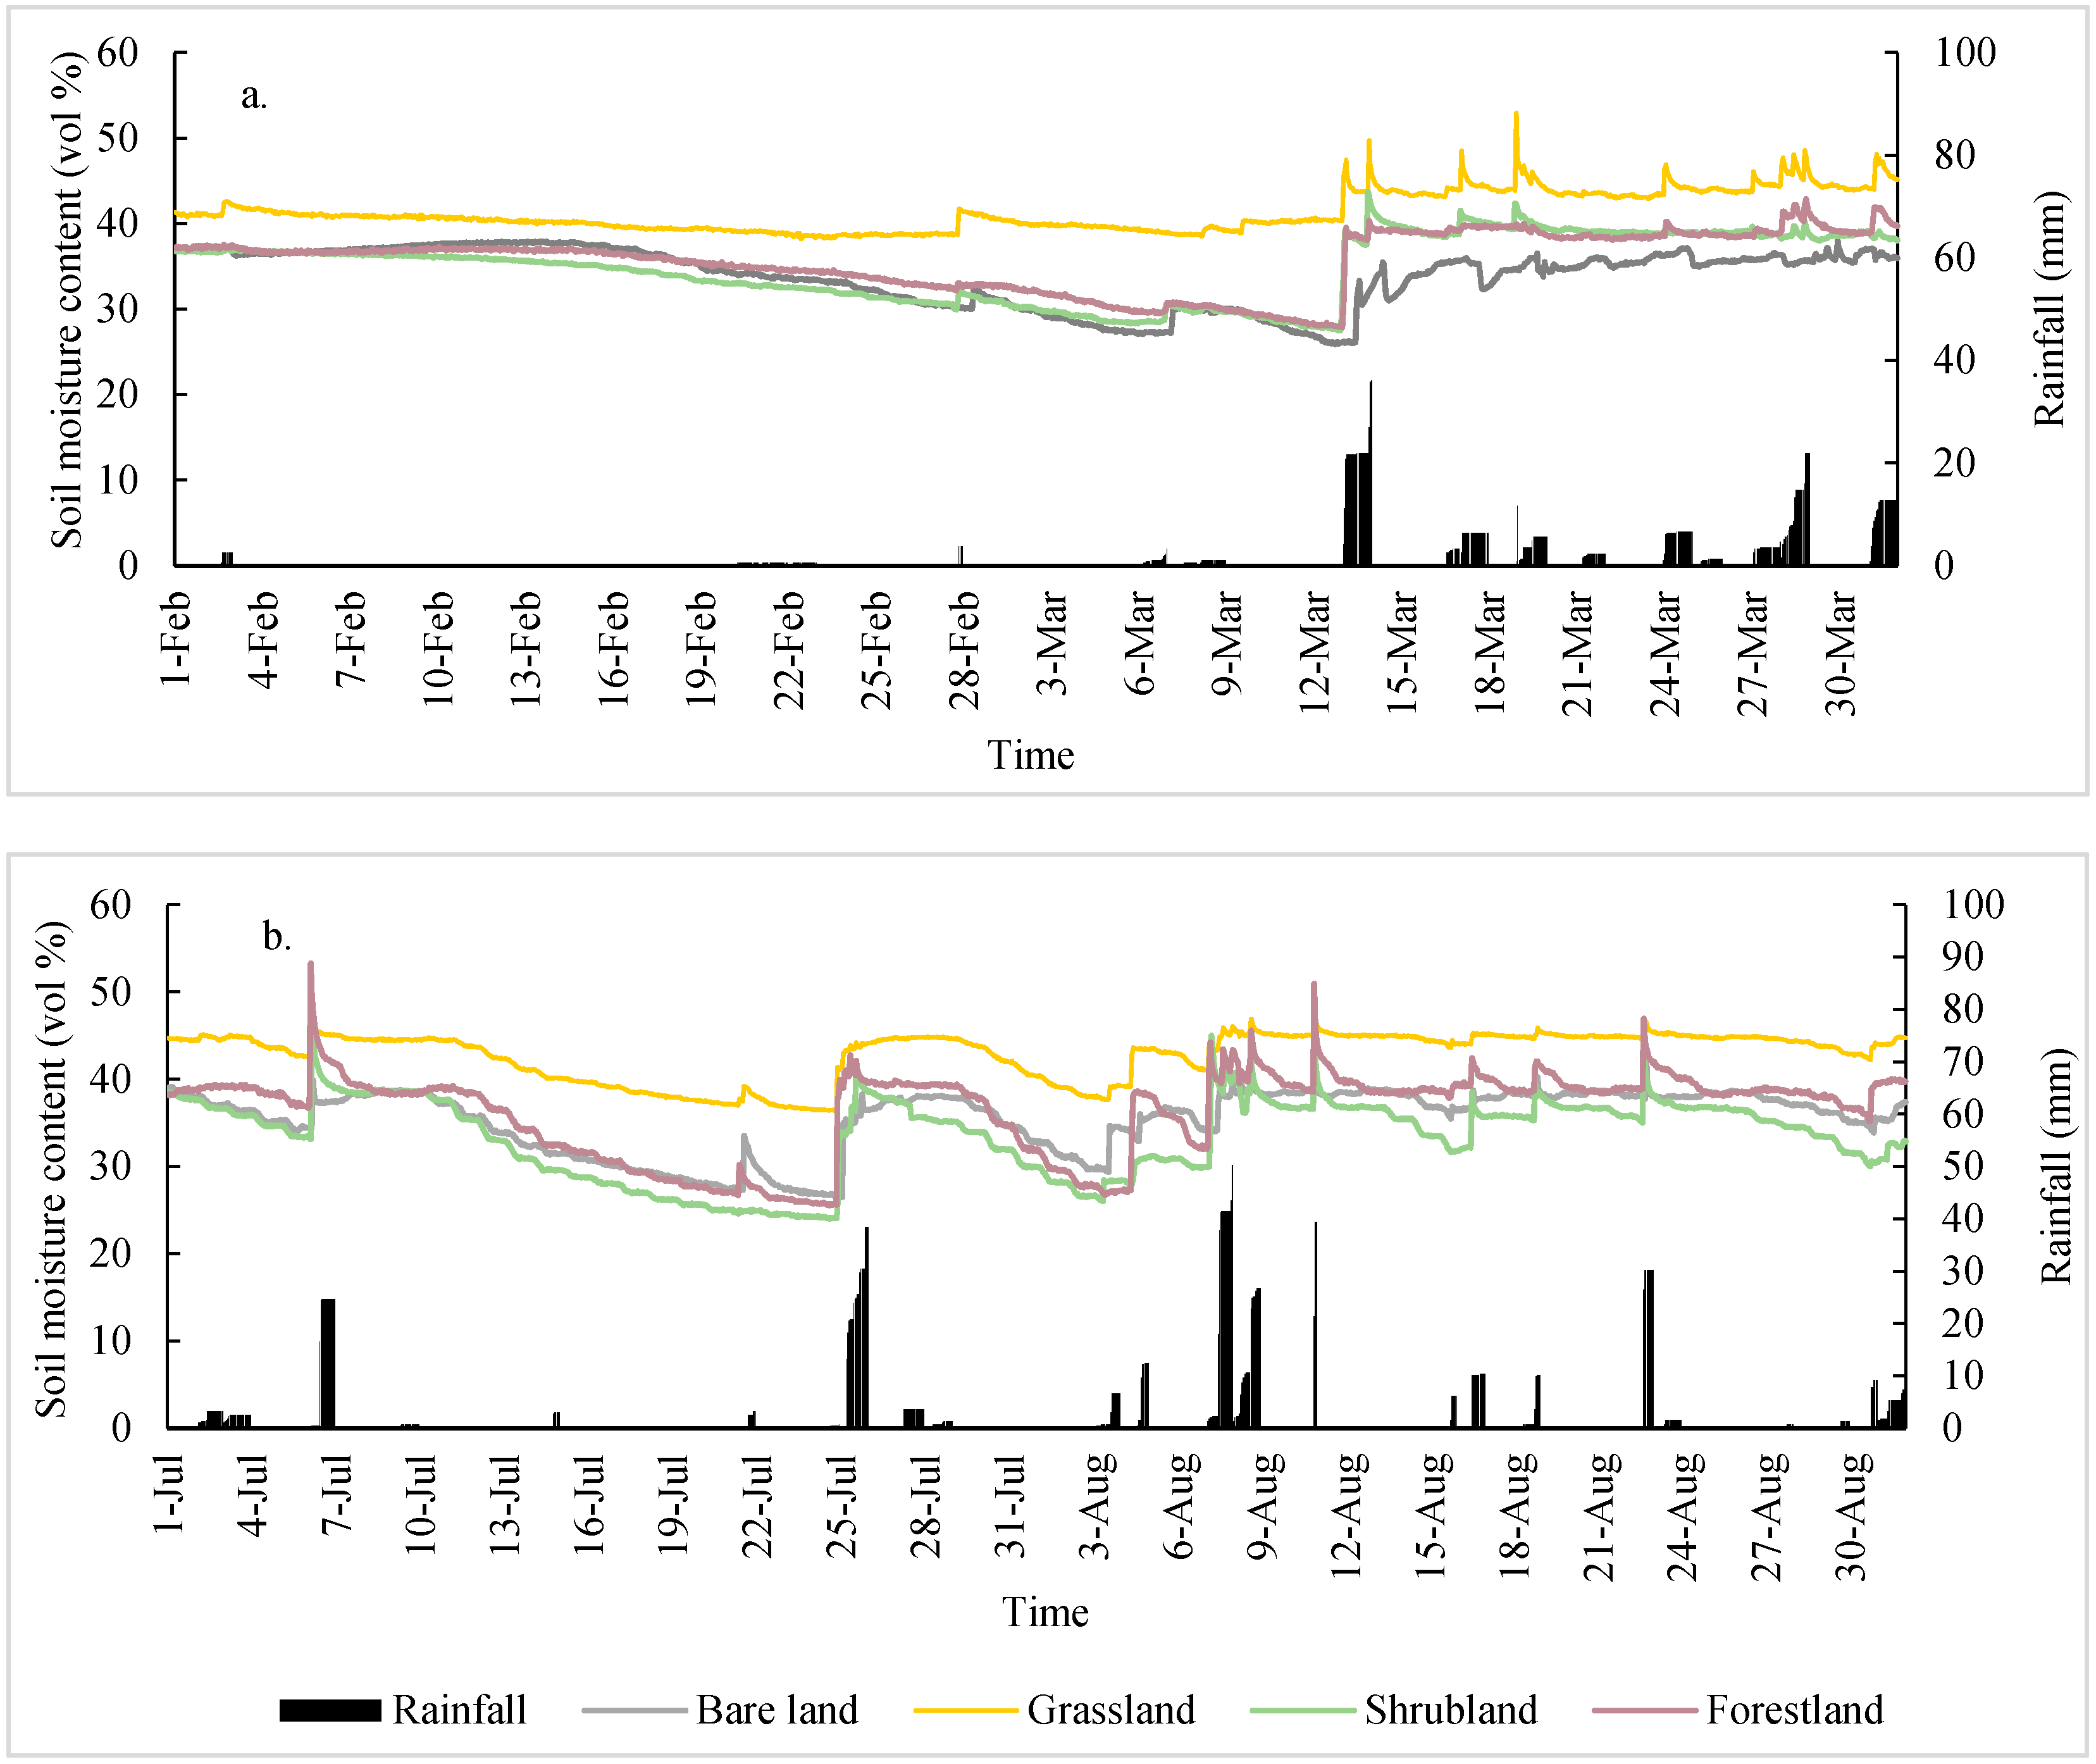
Water 11 01423 g003
Figure 4. Temporal variations in volumetric soil moisture content with rainfall for the dry (a) and the rainy (b) season.
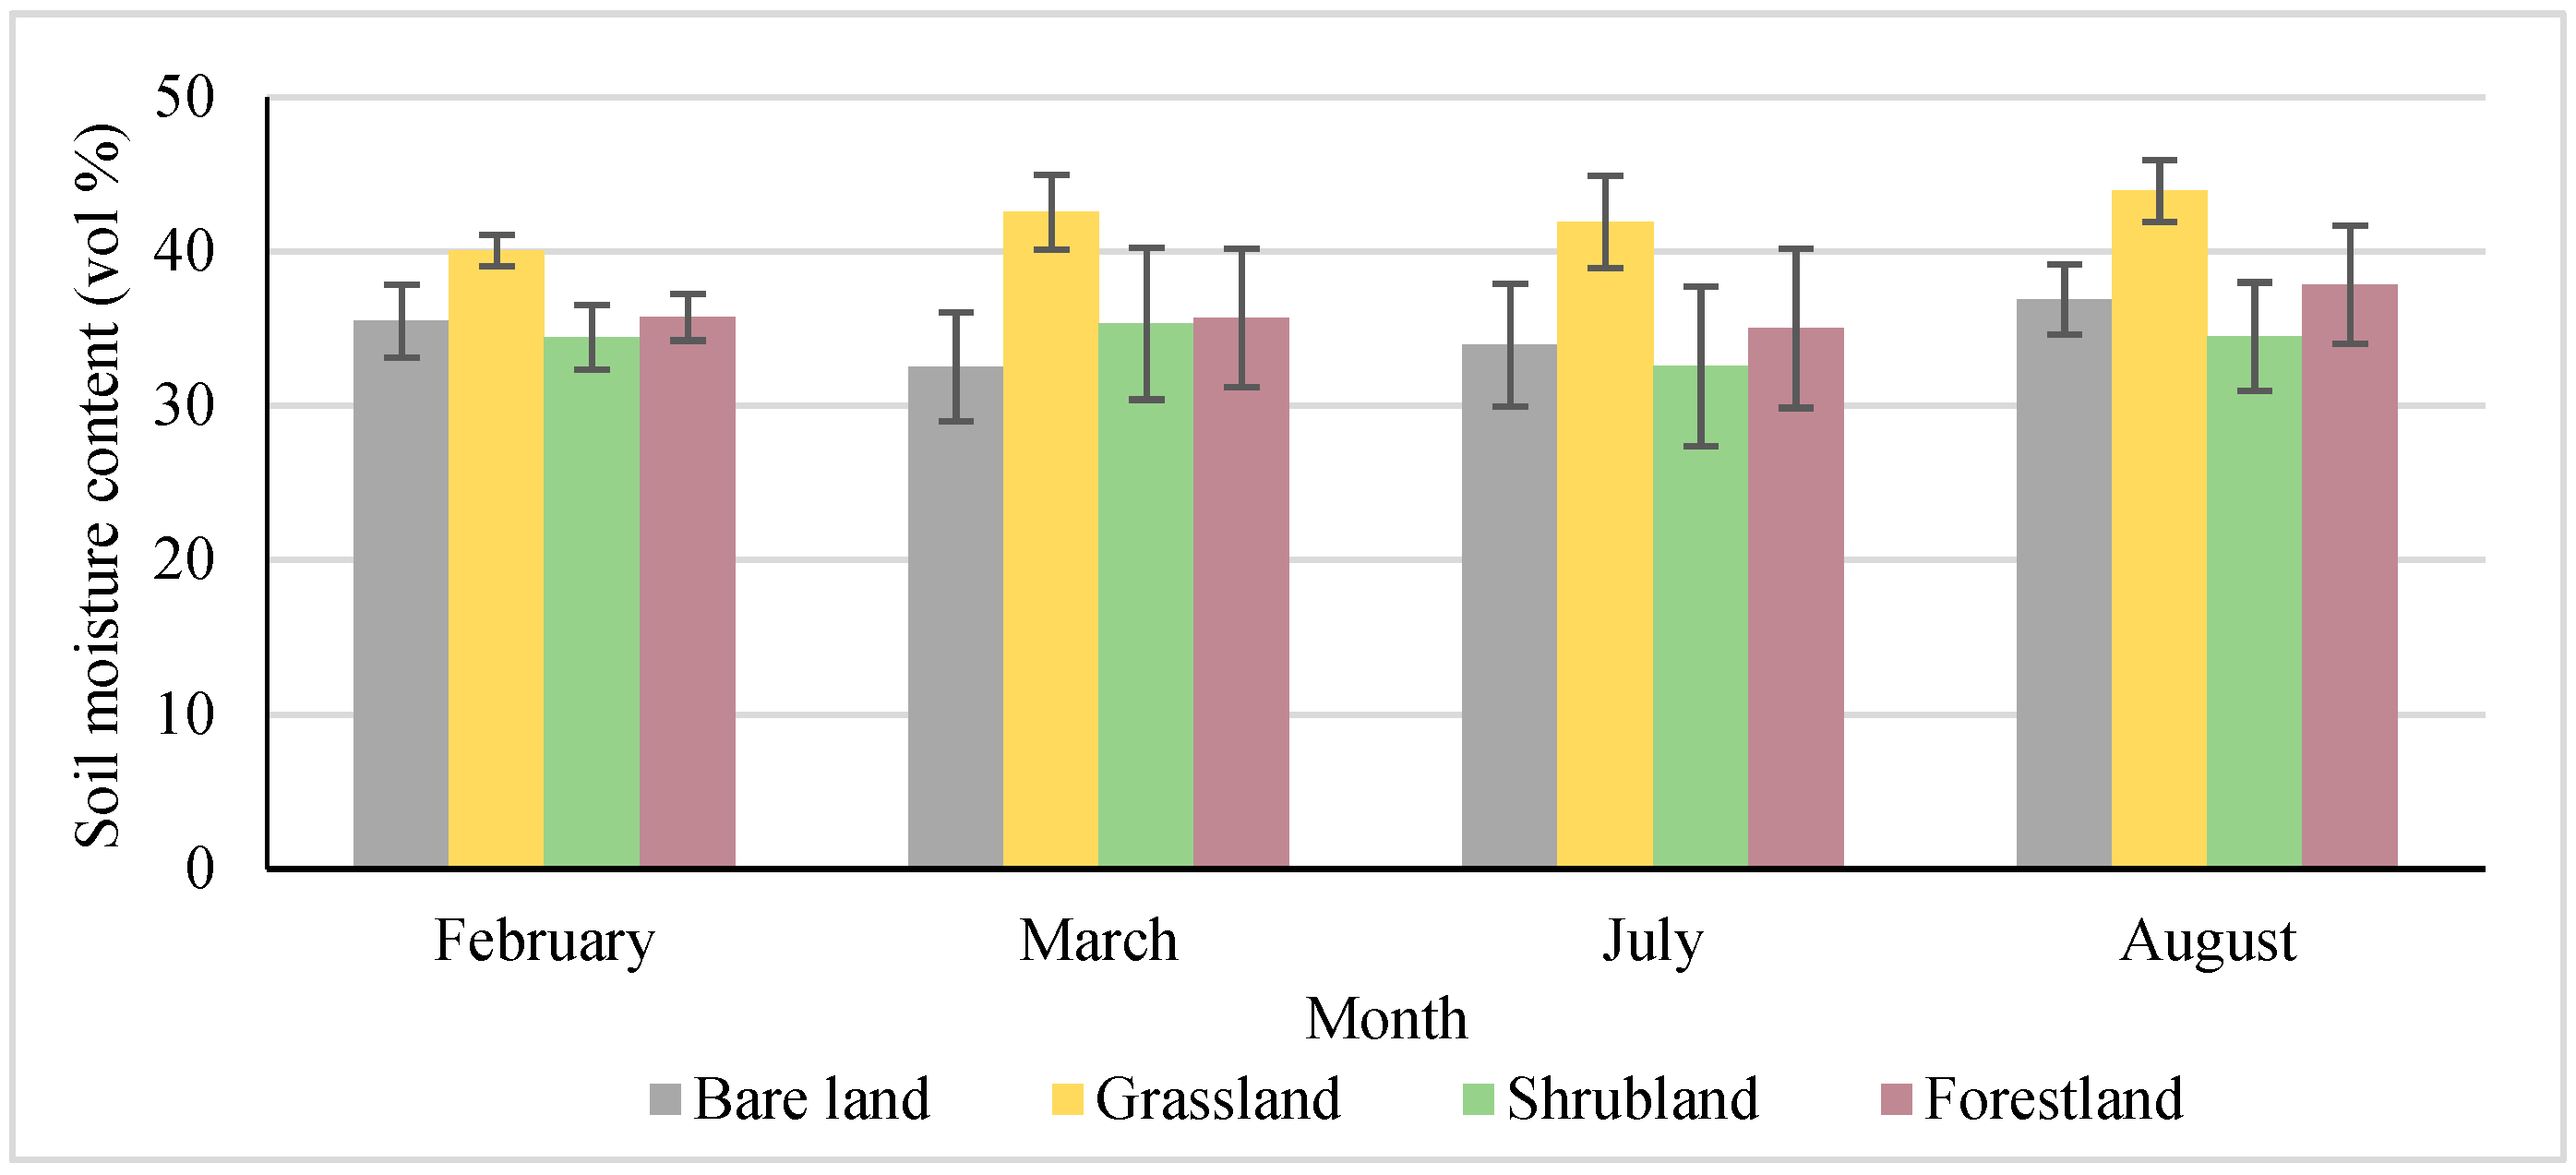
Water 11 01423 g004
Figure 5. Average volumetric soil moisture content and temporal variations with respect to different vegetation types in February, March, July, and August.
Water 11 01423 g005
Figure 6. Comparison of peak volumetric soil moisture times of the different vegetation types.
Water 11 01423 g006
Figure 7. Correlation between increasing volumetric soil moisture content and rainfall.
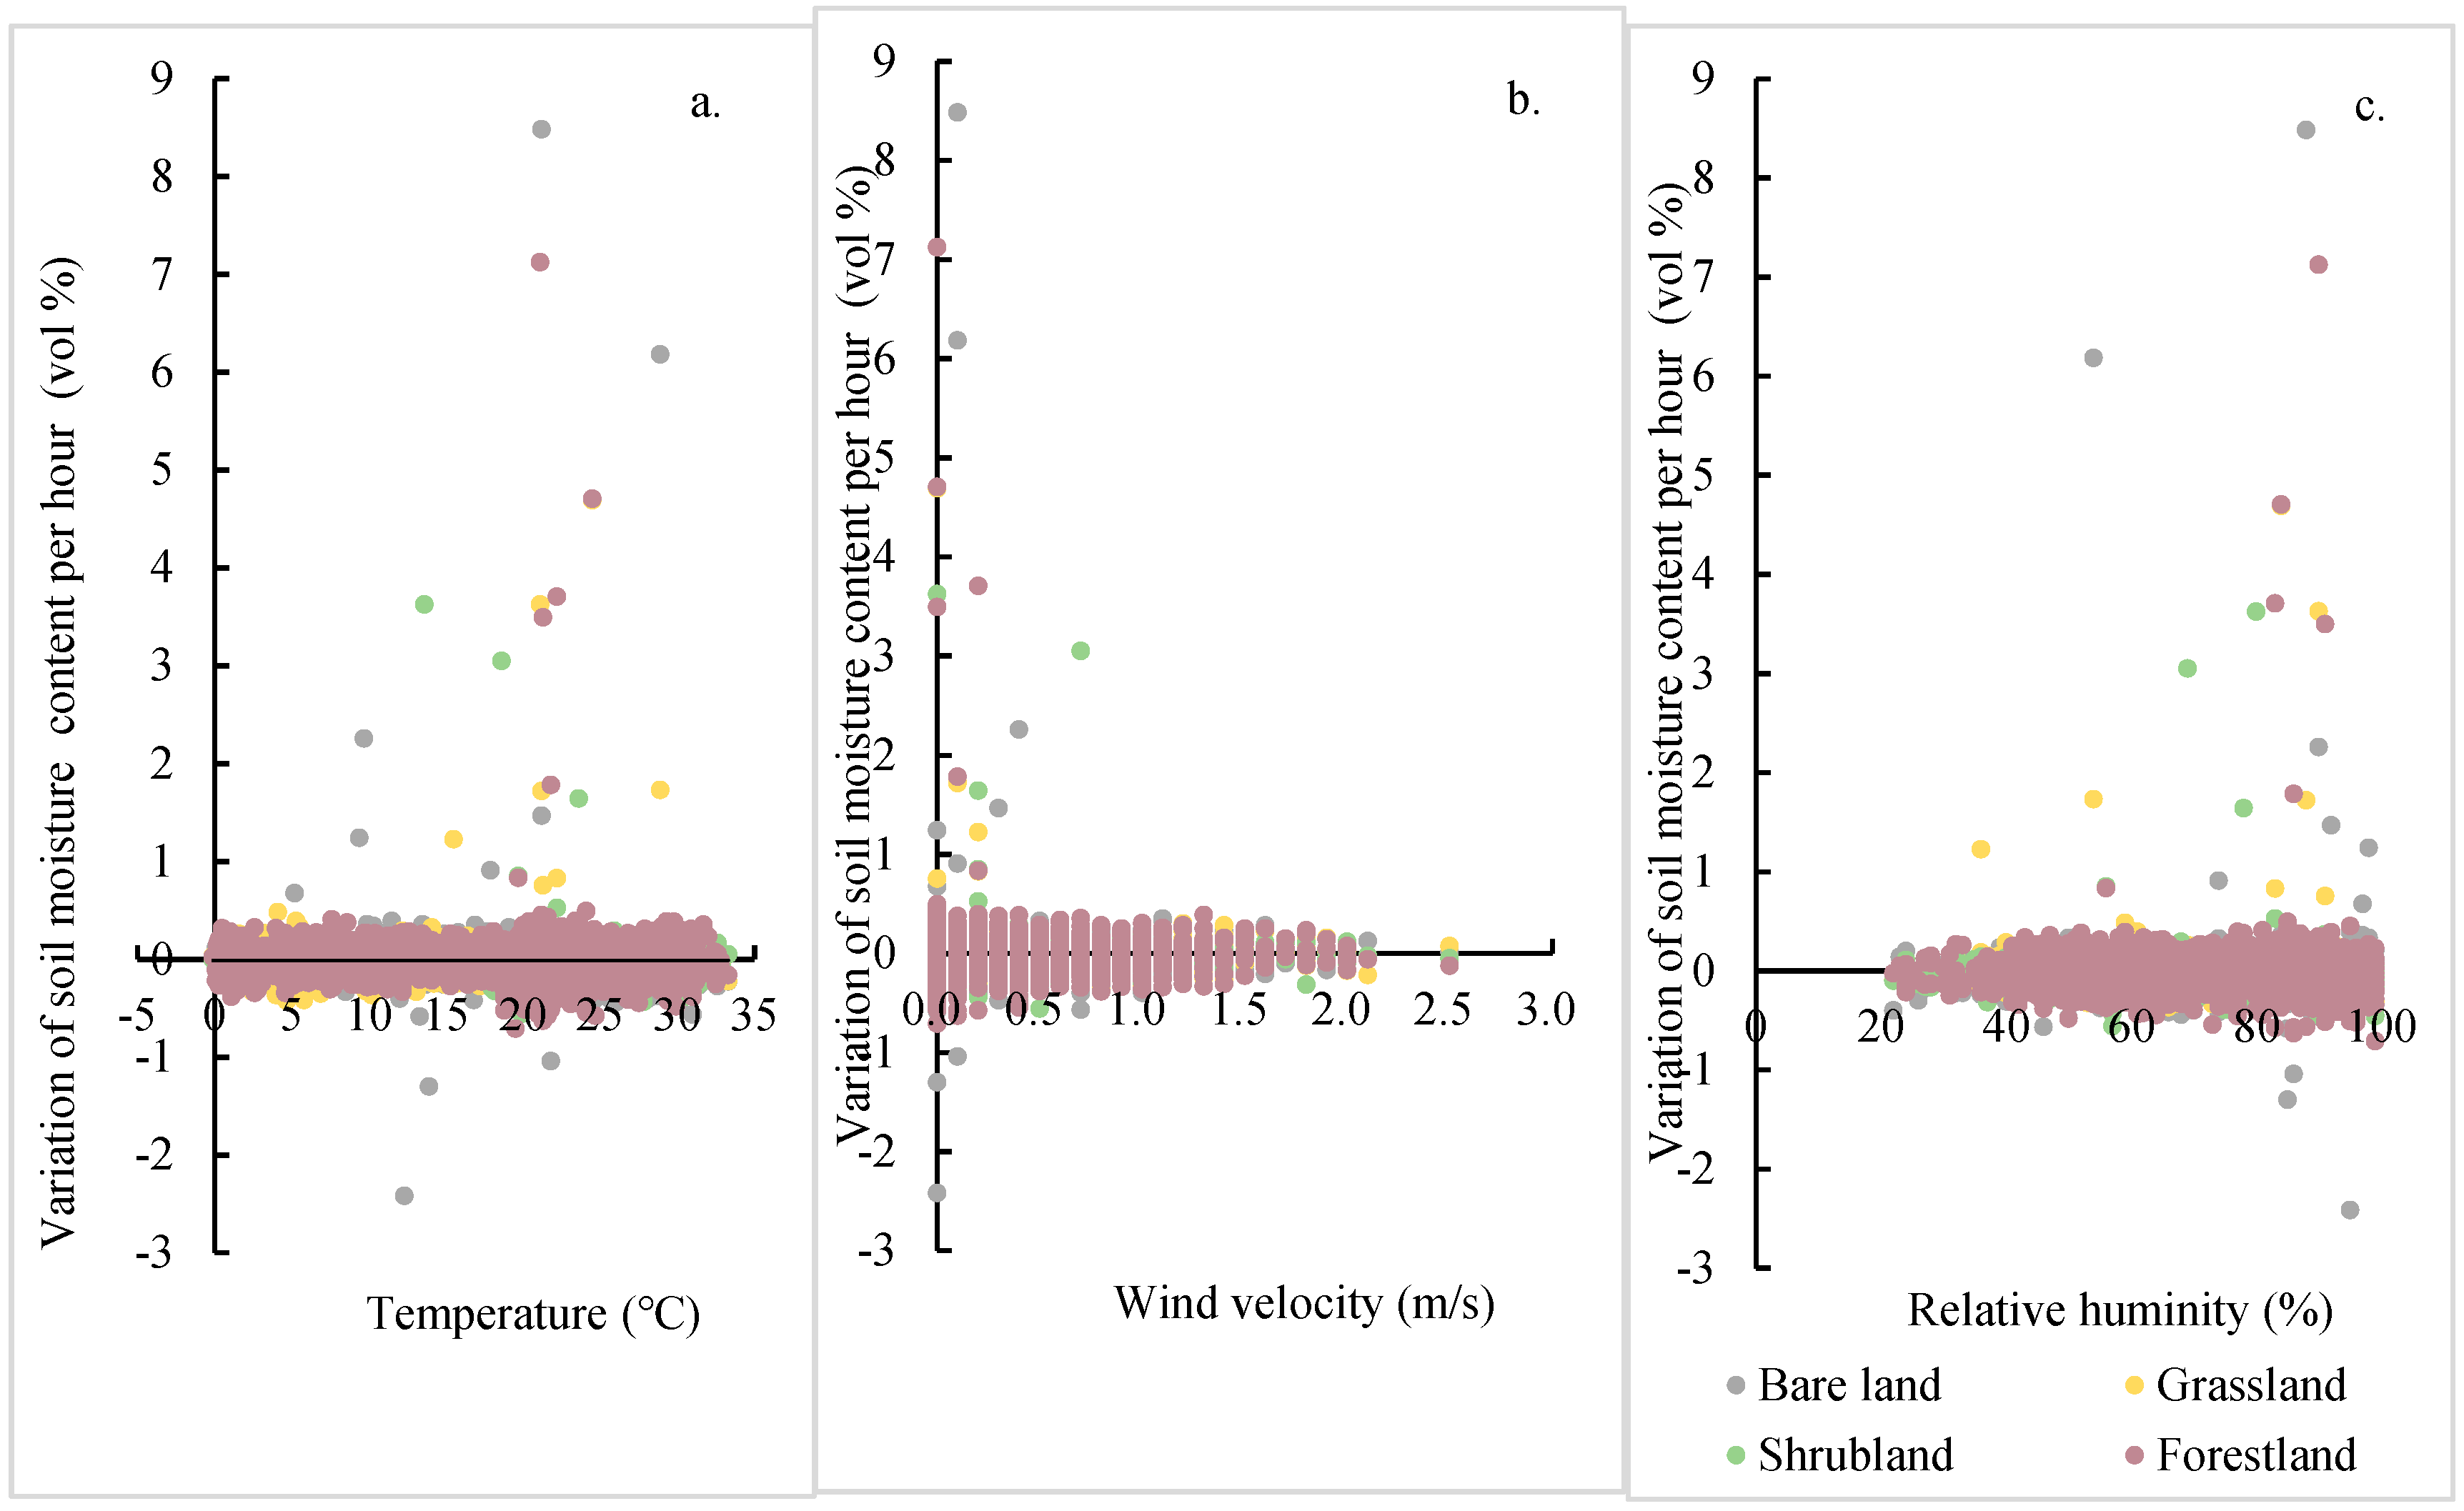
Water 11 01423 g007
Figure 8. Volumetric soil moisture content variation per hour, with temperature (a), wind velocity (b), and relative humidity (c) during a period without rainfall.
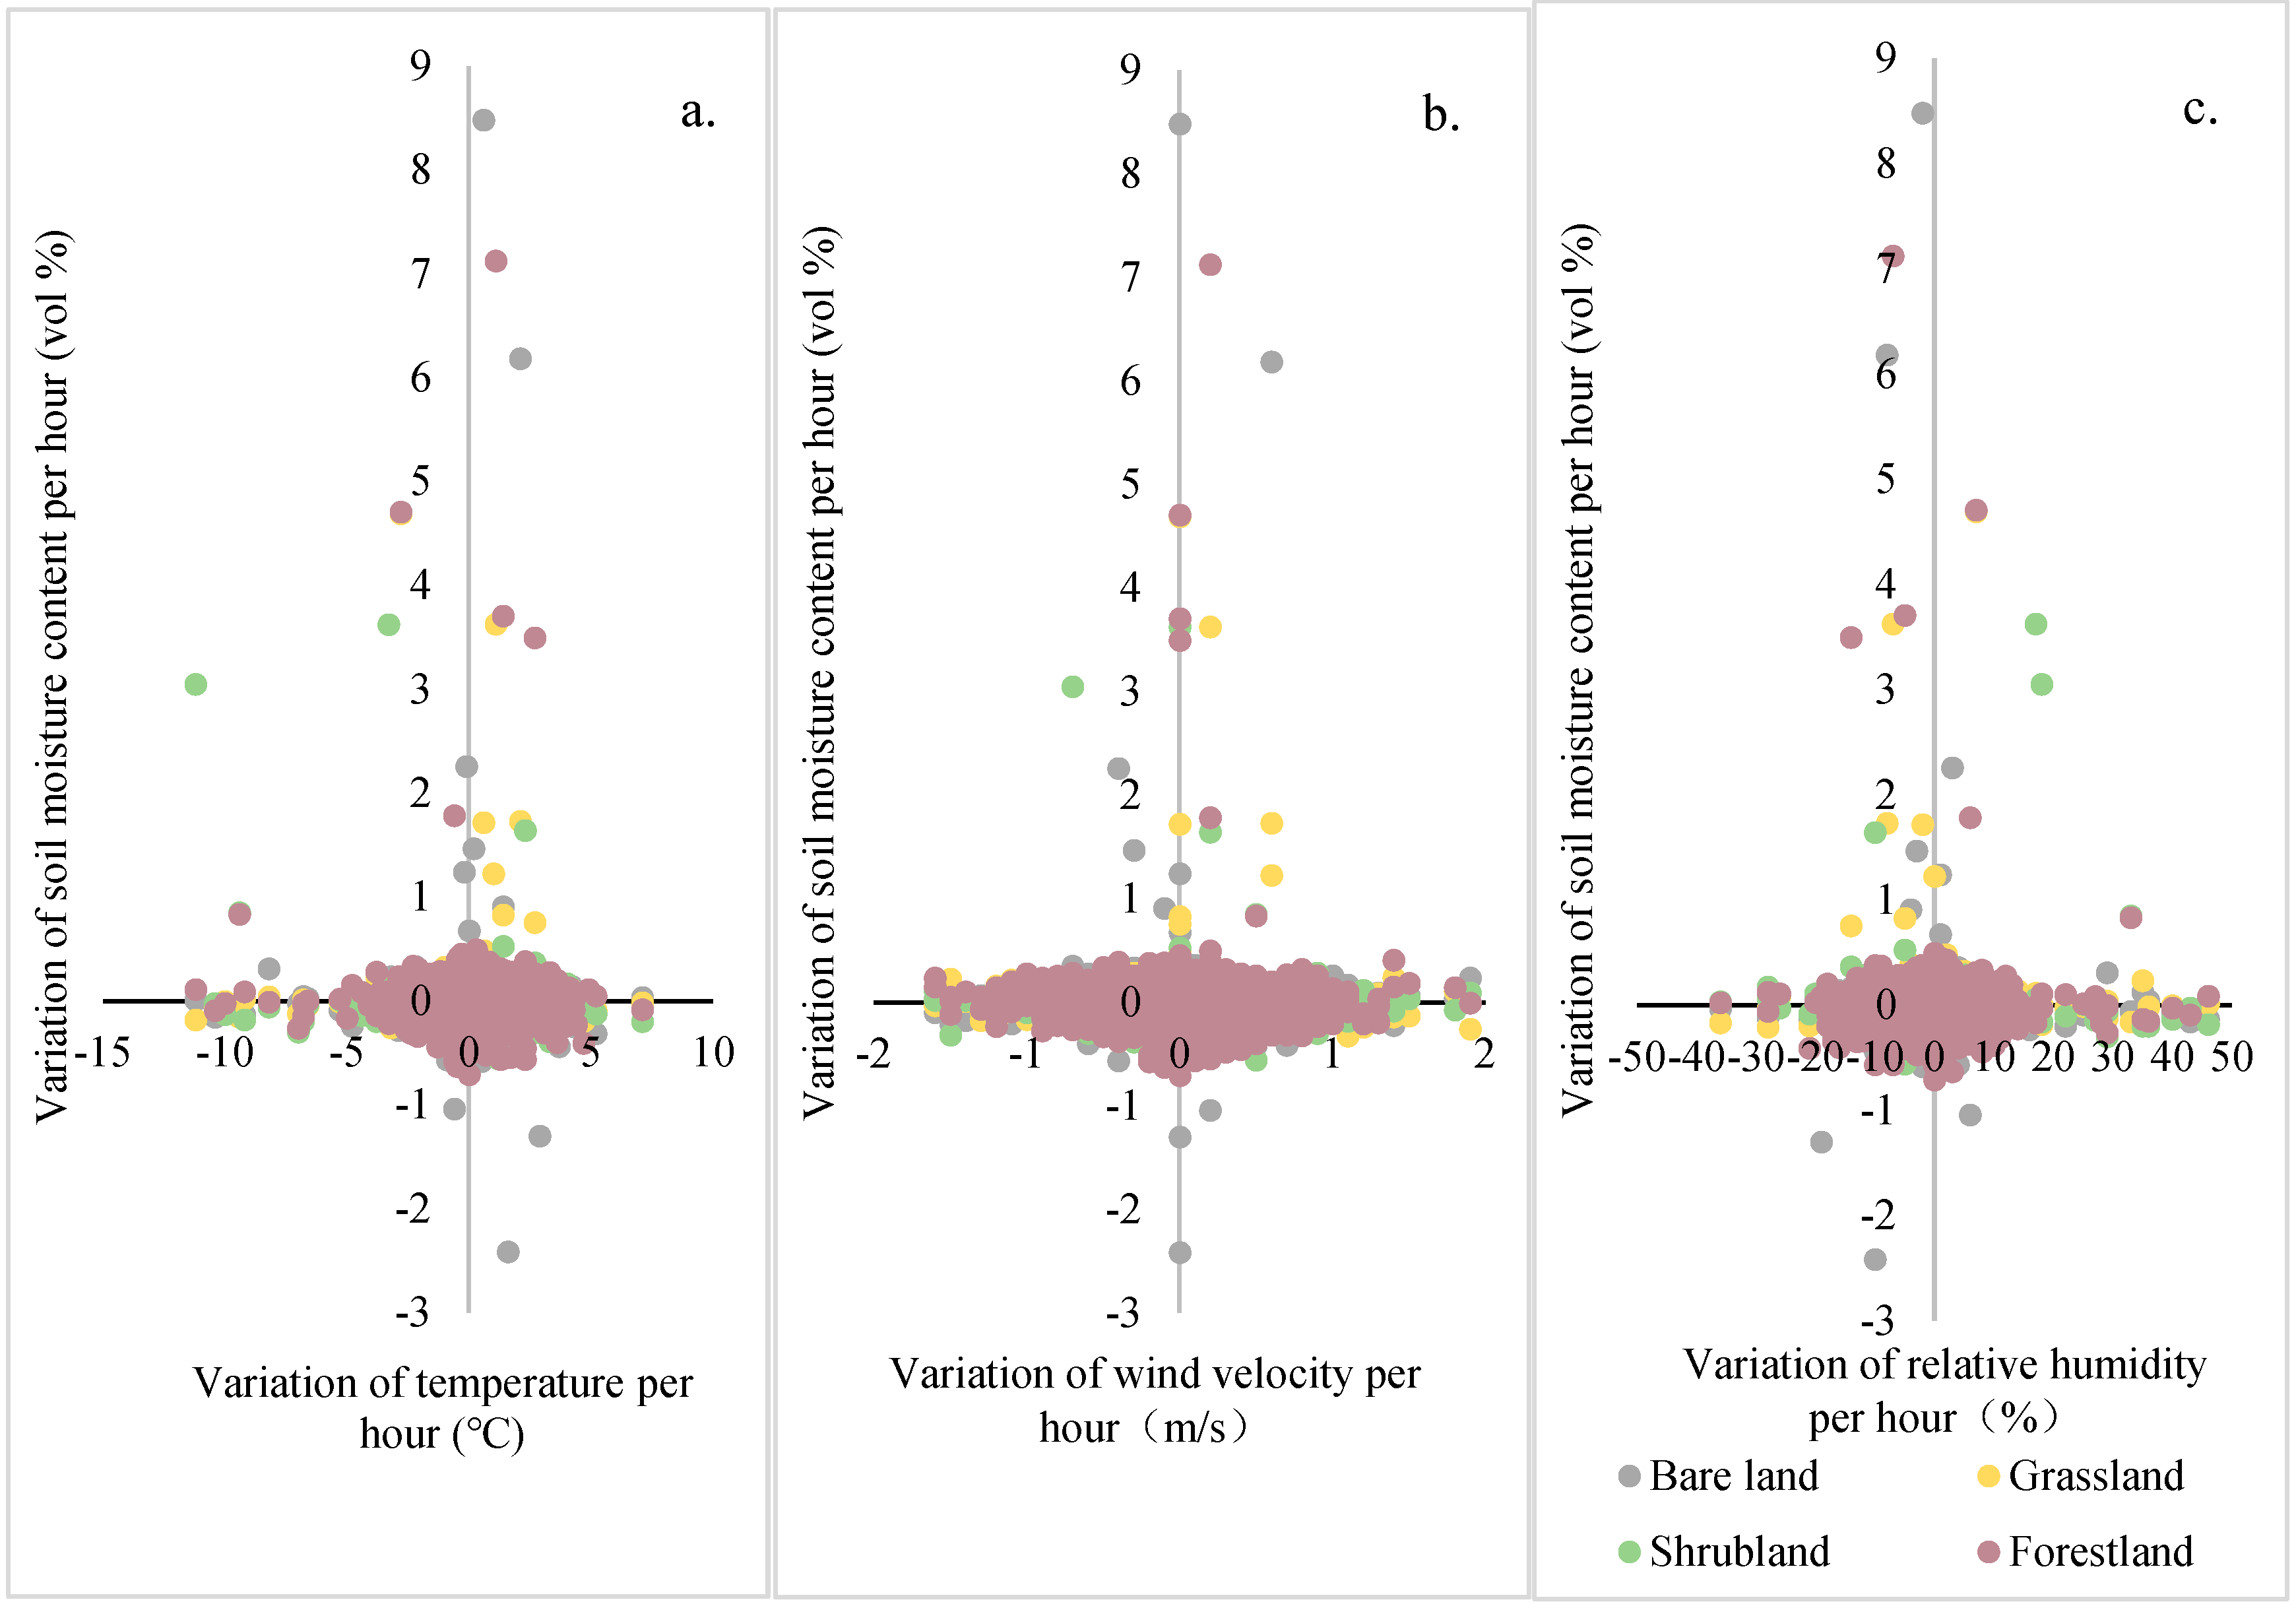
Water 11 01423 g008
Figure 9. Volumetric soil moisture content variation per hour, with variation of temperature (a), wind velocity (b), and relative humidity (c) per hour during a period without rainfall.
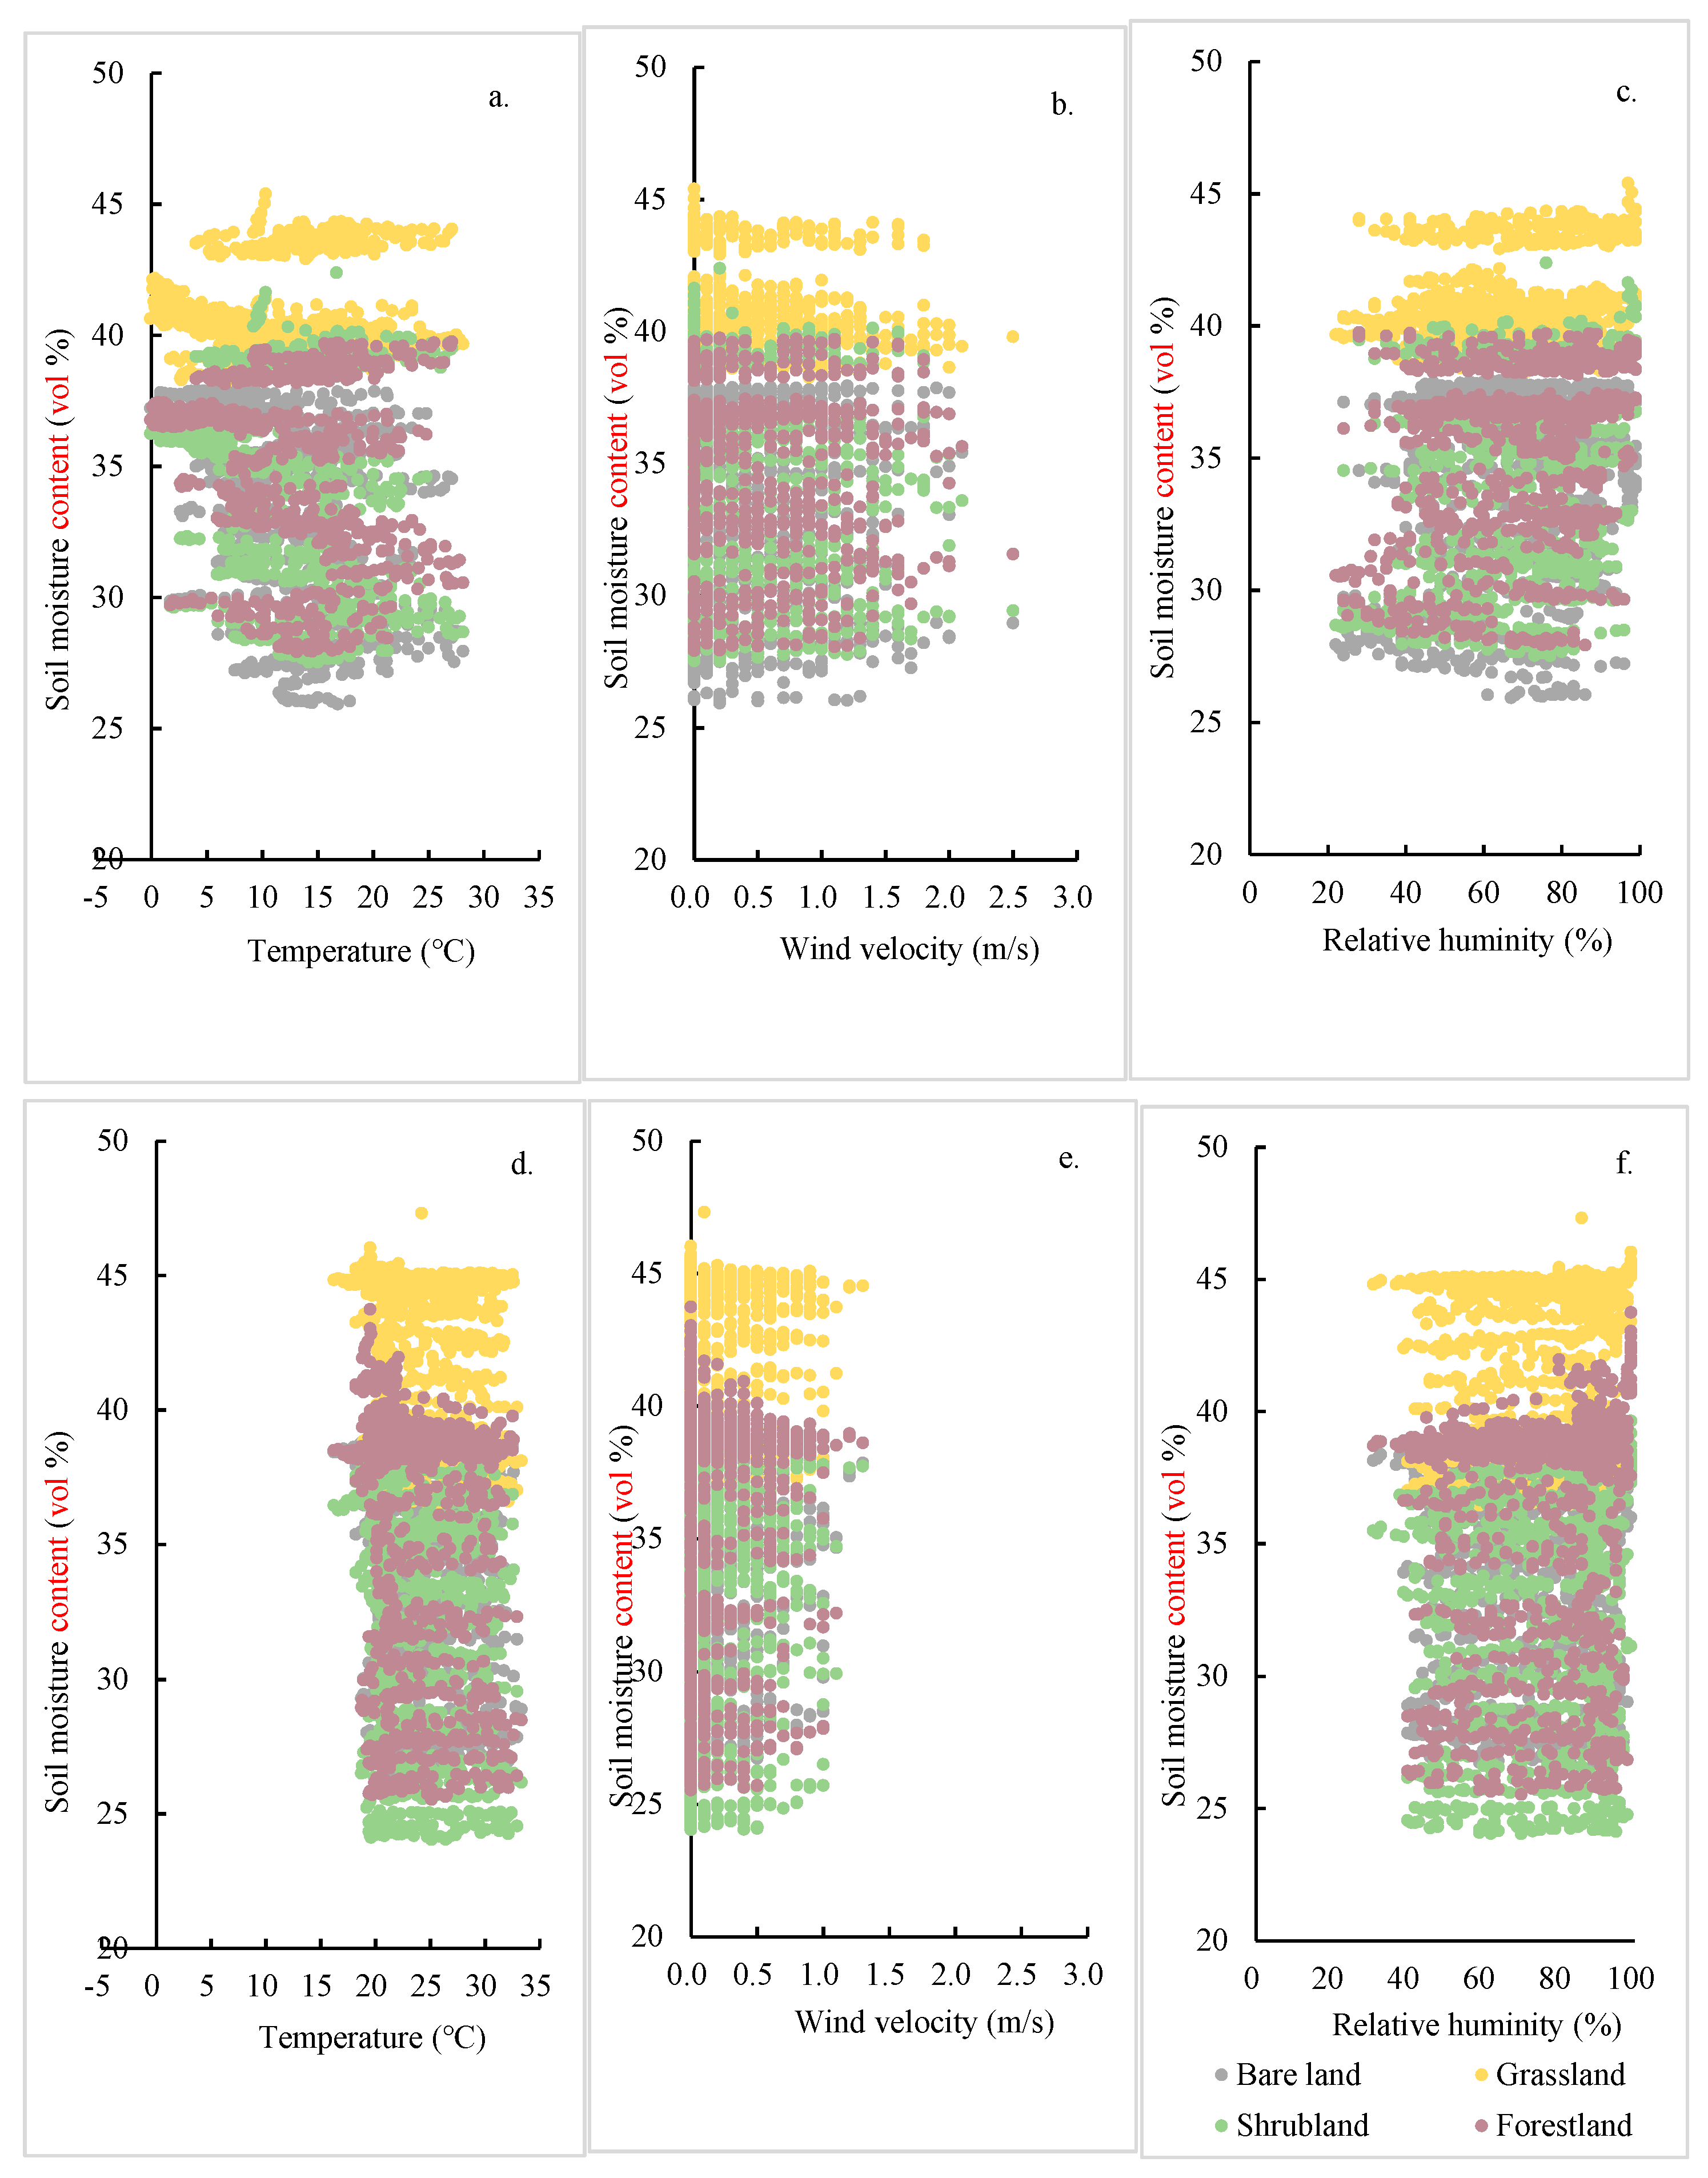
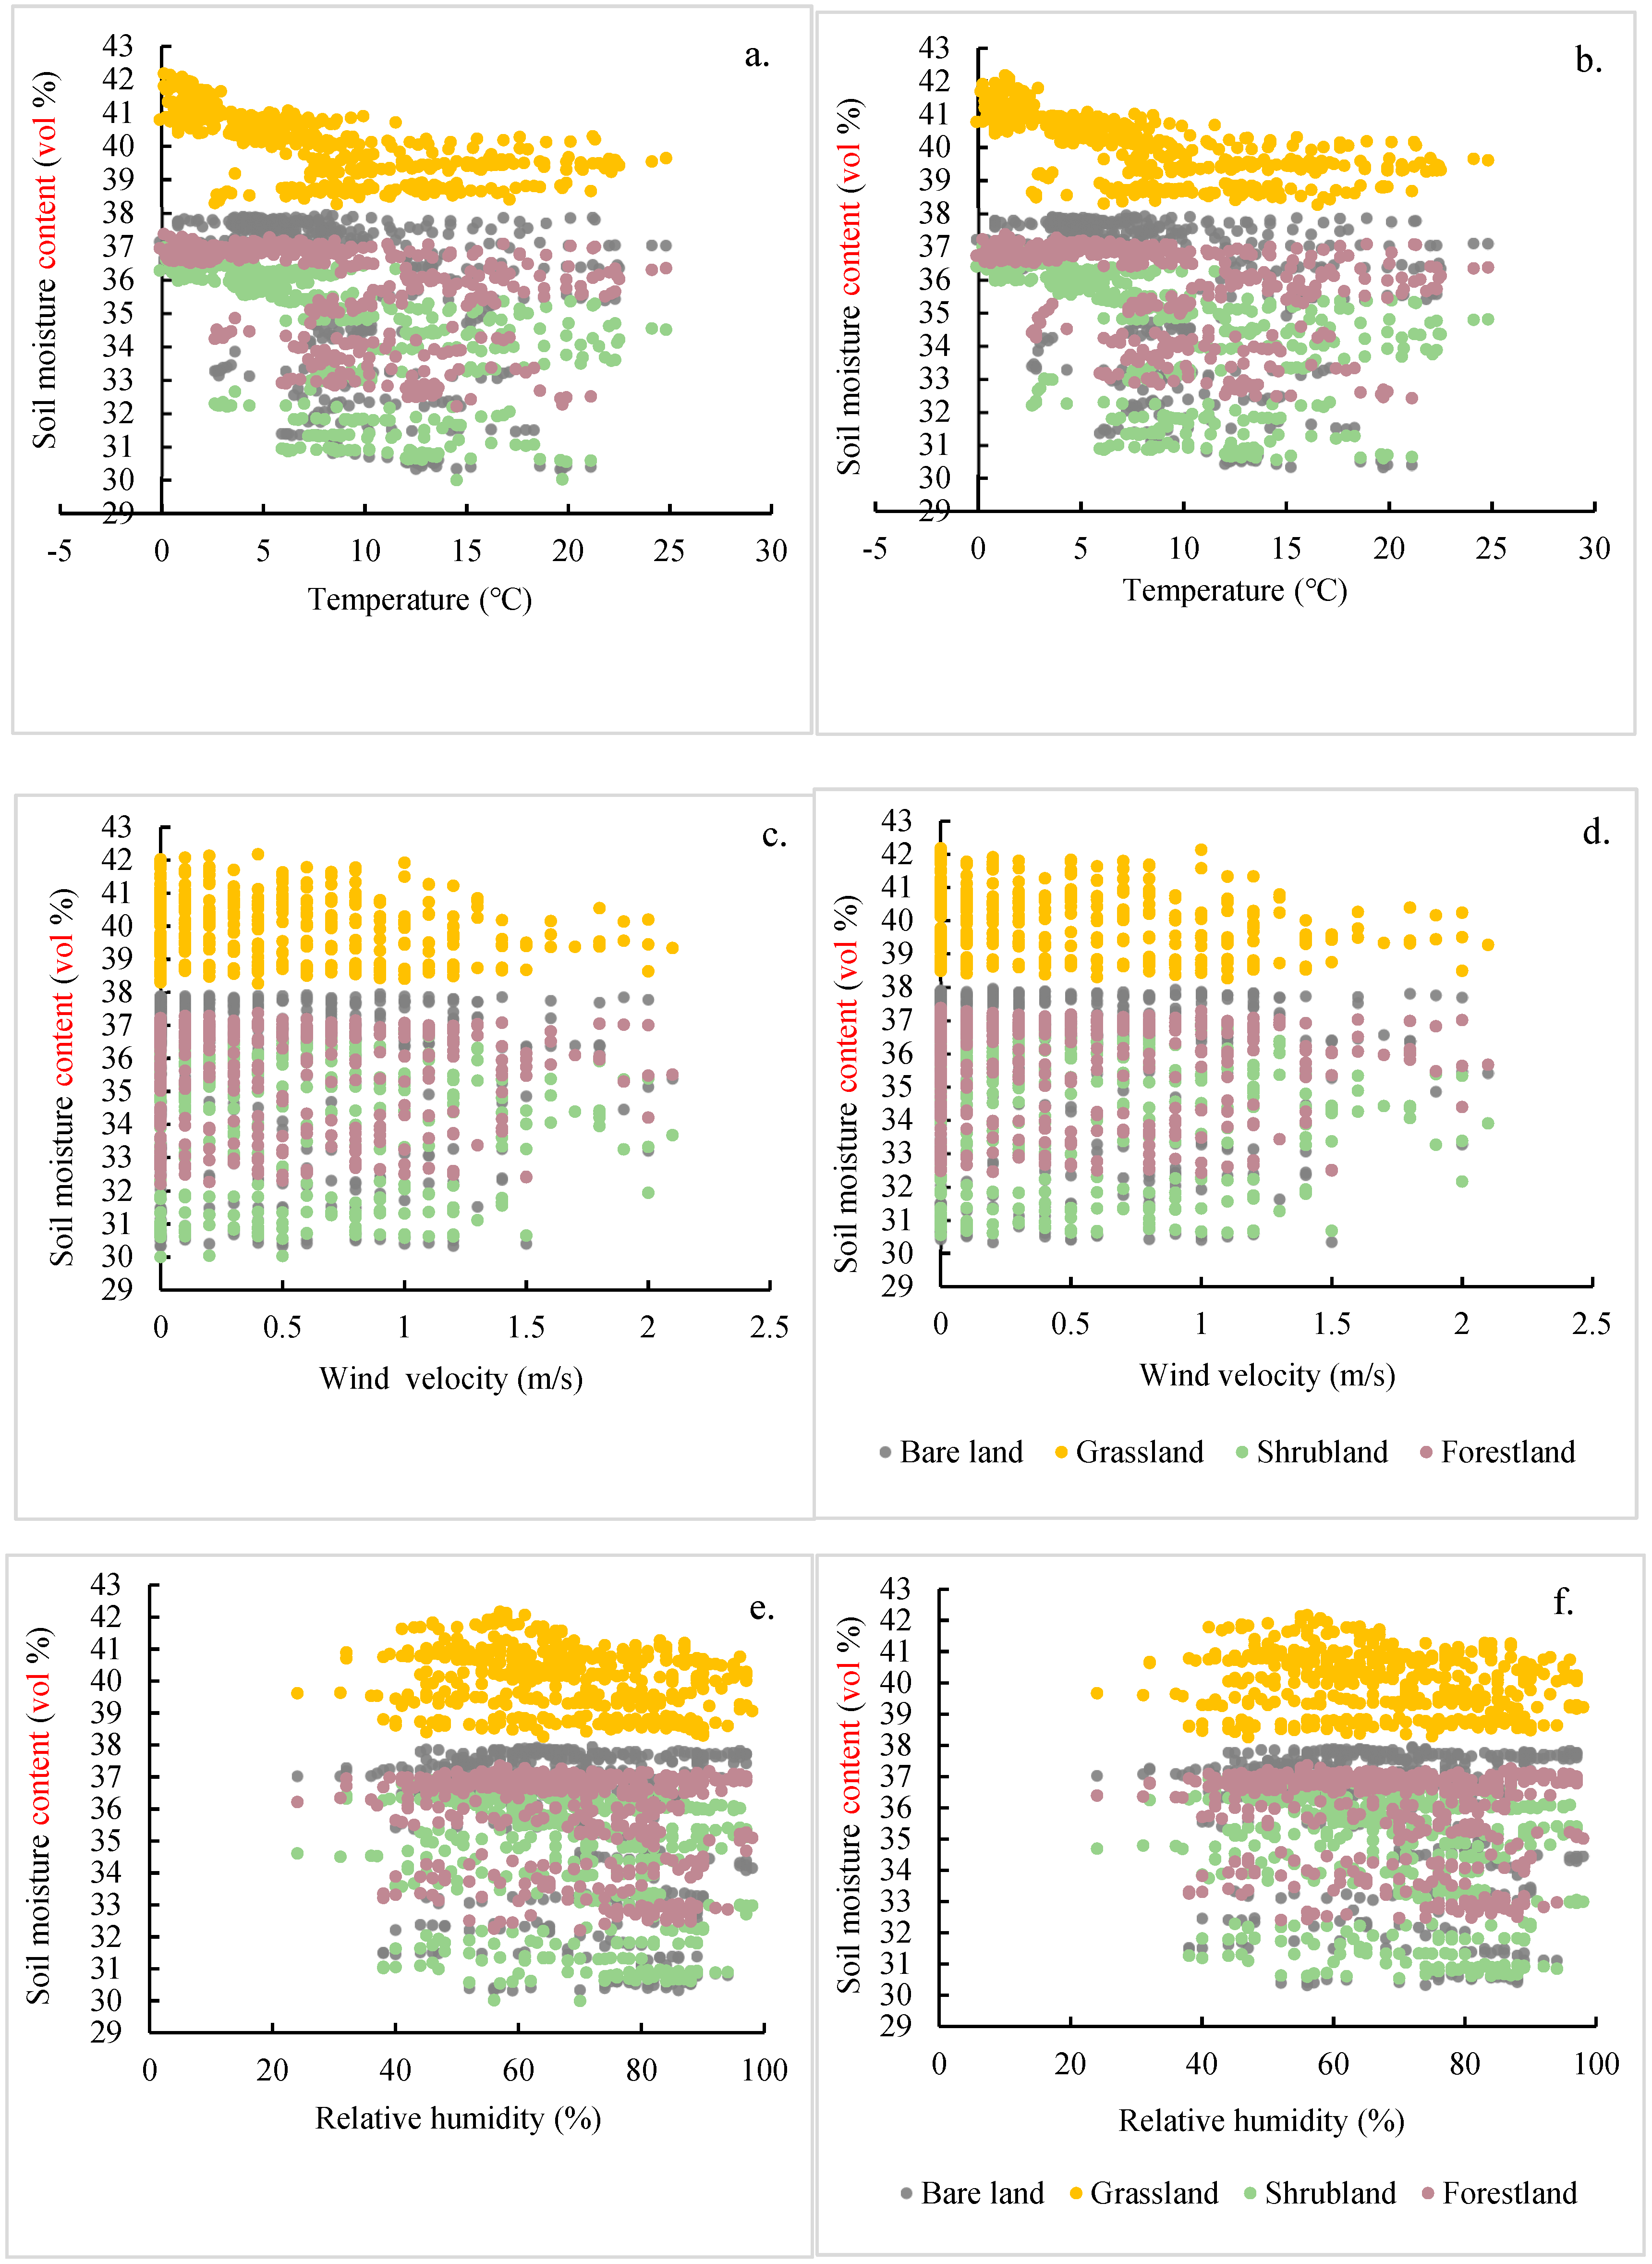
Water 11 01423 g009
Figure 10. Volumetric soil moisture content, with temperature in the dry season (a), wind velocity in the dry season (b), relative humidity in the dry season (c), temperature in the rainy season (d), wind velocity in the rainy season (e), and relative humidity in the rainy season (f) in a period without rainfall.
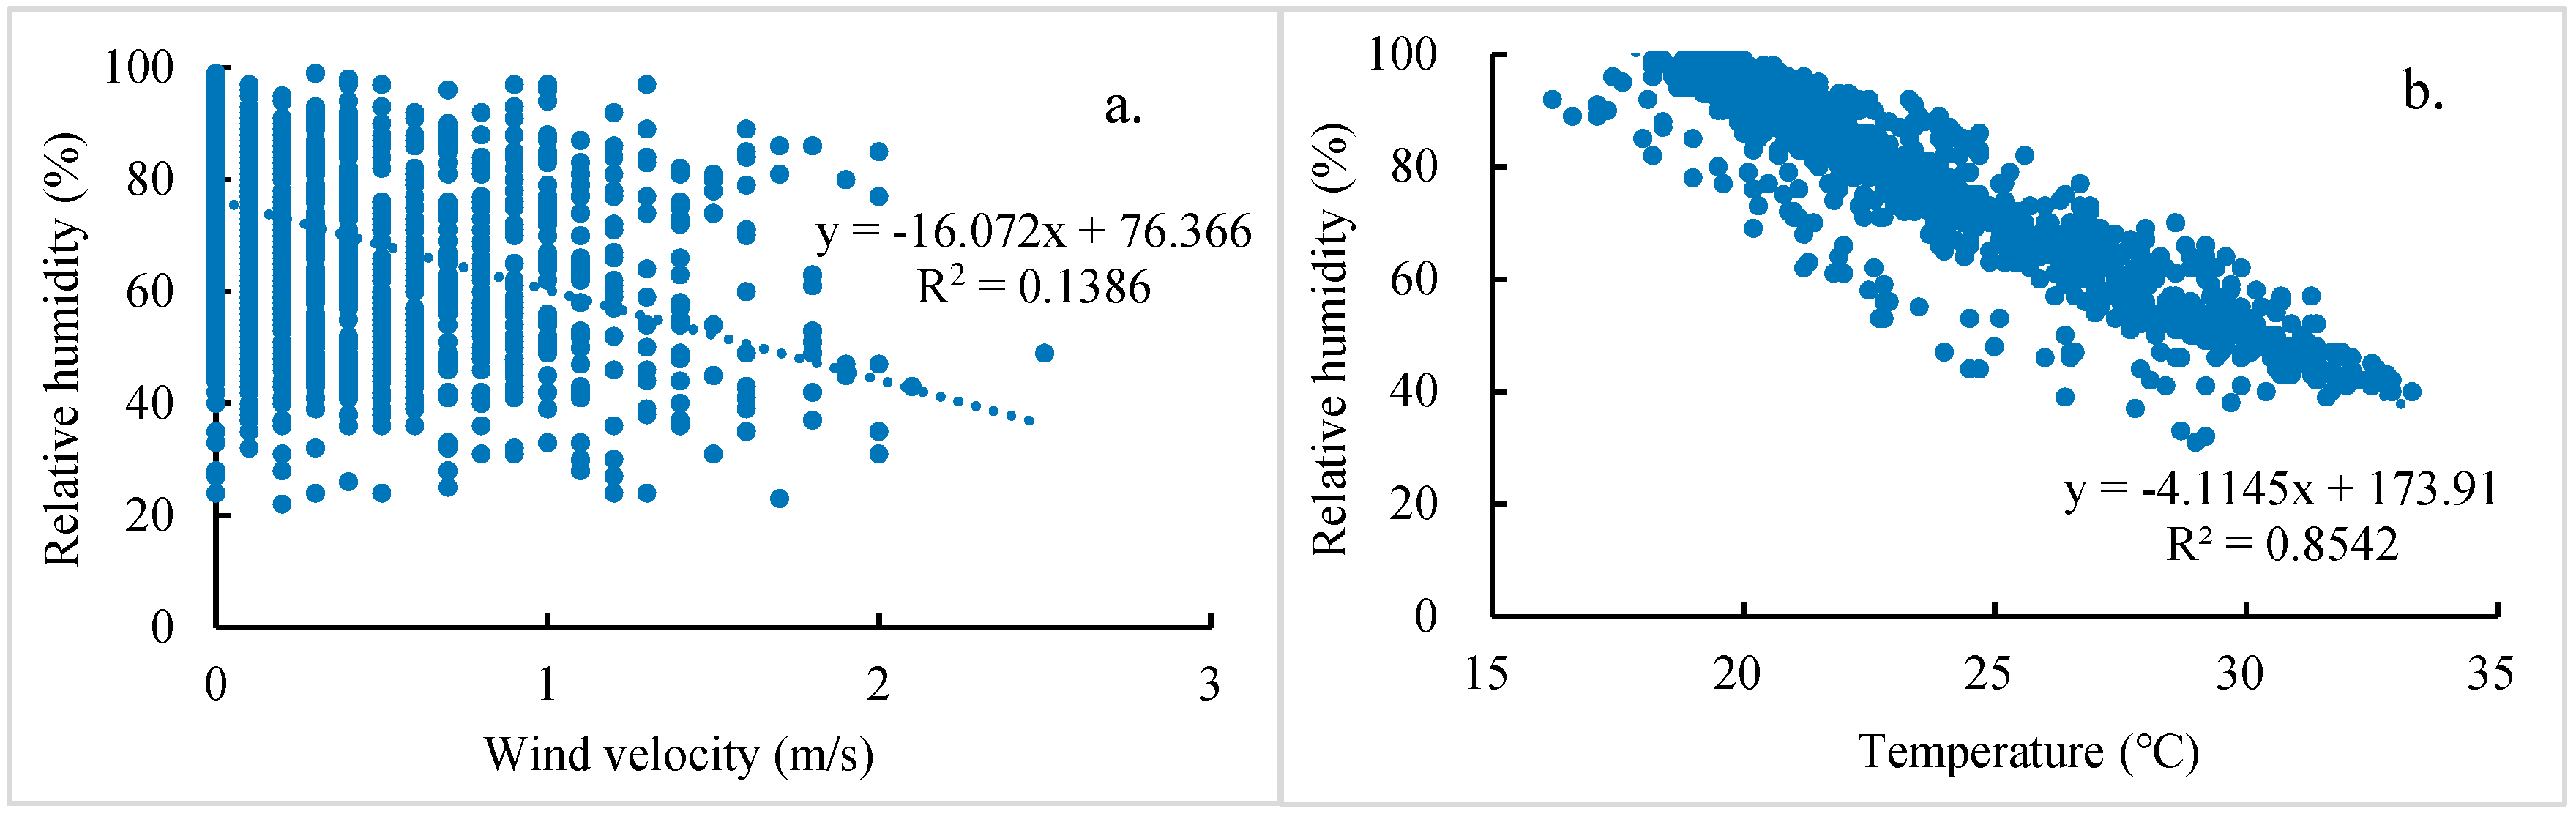
Water 11 01423 g010
Figure 11. Correlation between wind velocity and relative humidity (a) and correlation between temperature and relative humidity (b).
Water 11 01423 g011
Figure 12. Volumetric soil moisture content, with temperature (a) and wind velocity (b) in a continuous period without rainfall in the dry season, and with relative humidity in a period with little rainfall in the rainy season (c).
Water 11 01423 g012
Figure 13. Volumetric soil moisture content, with meteorological factors in a continuous period without rainfall in the dry season with 1 h for hysteresis of temperature (a), 5 h for hysteresis of temperature (b), 1 h for hysteresis of wind velocity (c), 5 h for hysteresis of wind velocity (d), 1 h for hysteresis of relative humidity (e), and 5 h for hysteresis of relative humidity (f).
Water 11 01423 g013
Table 1. Attributes of soil in each plots.
Vegetation Cover TypeSWC (vol %)FC (vol %)BD (g/cm3)SHC (cm/h)Soil Particle Size Distribution (vol %)
SandSiltClay
≥0.05 mm0.01–0.05 mm0.005–0.01 mm0.001–0.005 mm<0.001 mm
Bare land52.3235.671.080.6033.88 17.52 7.94 19.86 20.79
Grassland56.2042.701.010.1526.54 17.16 8.24 18.08 29.98
Shrubland58.2840.720.831.0133.25 14.95 10.57 17.78 23.45
Forestland57.4237.980.851.2333.74 15.02 7.88 17.73 25.62
SWC = saturated water content, FC = field capacity, BD = bulk density, SHC = saturated hydraulic conductivity.
Table 2. Comparison of soil moisture content data under different vegetation cover types based on the Mann–Whitney’s U test with Bonferroni correction (p-value).
Vegetation Cover TypeBare LandGrasslandShrublandForestland
Bare land-p < 0.001p < 0.001p < 0.001
Grasslandp < 0.001-p < 0.001p < 0.001
Shrublandp < 0.001p < 0.001-p < 0.001
Forestlandp < 0.001p < 0.001p < 0.001-
Table 3. Meteorological data of the dry and rainy seasons.
SeasonRainfall (mm)Average Temperature (°C)Average Wind Velocity (m/s)Average Relative Humidity (vol %)
Dry season178.6111.060.3871.62
Rainy season291.8223.730.1877.74
Table 4. Meteorological data from February, March, July, and August.
SeasonRainfall (mm)Average Temperature (°C)Average Wind Velocity (m/s)Average Relative Humidity (vol %)
February7.377.410.3870.08
March171.2514.350.3973.01
July110.6224.180.2177.07
August181.223.270.1578.40
Table 5. Comparison of soil moisture content data in different mouths based on the Mann–Whitney’s U test with Bonferroni correction under different vegetation cover types (p-value).
Vegetation Cover TypeMouthFebruaryMarchJulyAugust
Bare landFebruary-p < 0.001p < 0.001p < 0.001
Marchp < 0.001-p < 0.001p < 0.001
Julyp < 0.001p < 0.001-p < 0.001
Augustp < 0.001p < 0.001p < 0.001-
GrasslandFebruary-p < 0.001p < 0.001p < 0.001
Marchp < 0.001-0.021p < 0.001
Julyp < 0.0010.021-p < 0.001
Augustp < 0.001p < 0.001p < 0.001-
ShrublandFebruary-p < 0.001p < 0.001p < 0.001
Marchp < 0.001-p < 0.001p < 0.001
Julyp < 0.001p < 0.001-p < 0.001
Augustp < 0.001p < 0.001p < 0.001-
ForestlandFebruary-p < 0.001p < 0.001p < 0.001
Marchp < 0.001-p < 0.001p < 0.001
Julyp < 0.001p < 0.001-p < 0.001
Augustp < 0.001p < 0.001p < 0.001-
Table 6. A comparison of peak volumetric soil moisture times of the different vegetation types when the average initial volumetric soil moisture content is larger than the cumulative peak time (CPT; i.e., ≥39) and smaller than the CPT (i.e., <39).
Vegetation Cover TypeAverage Initial Soil Moisture Content (vol %)CPT (h)
<39 vol %≥39 vol %<39 vol %≥39 vol %
Bare land31.5737.18229.50105.67
Grassland40.4844.20257.5061.00
Shrubland30.4137.34143.3373.00
Forestland32.8038.70107.7074.00
Average value33.8239.36
Table 7. Comparison of peak volumetric soil moisture times under different vegetation cover types based on the Mann–Whitney’s U test with Bonferroni correction (p-value).
Initial Soil Moisture ContentVegetation Cover TypeBare LandGrasslandShrublandForestland
<39 vol %Bare land-0.1230.0470.017
Grassland0.123-0.1050.041
Shrubland0.0470.105-0.080
Forestland0.0170.0410.080-
>39 vol %Bare land 0.0980.0660.080
Grassland0.098 0.1170.167
Shrubland0.0660.117 0.137
Forestland0.0800.1670.137
Table 8. Significance level of Spearman correlation and regression analysis between increases in volumetric soil moisture content and the amount of rainfall per precipitation event.
Vegetation Cover Typep-ValueSlopeInterceptR2
Bare land0.0260.0901.810.48
Grassland0.0140.0592.690.28
Shrubland0.0110.1671.770.56
Forestland0.0050.1752.150.45
Table 9. Comparison of increase of soil moisture content under different vegetation cover types based on the Mann–Whitney’s U test with Bonferroni correction (p-value).
Vegetation Cover TypeBare LandGrasslandShrublandForestland
Bare land-0.1240.0910.097
Grassland0.124-0.0940.116
Shrubland0.0910.094-0.152
Forestland0.0970.1160.152-
Table 10. Results of the Spearman correlation coefficient and significance level between volumetric soil moisture content variations, per hour, and temperature, wind velocity, and relative humidity in a period without rainfall.
Meteorological ElementBare LandGrasslandShrublandForestland
Cp-ValueCp-ValueCp-ValueCp-Value
Temperature−0.104p < 0.001−0.0290.193−0.111p < 0.001−0.0750.001
Wind velocity−0.0580.0090.0400.0720.0090.6860.0260.241
Relative humidity0.0350.112−0.096p < 0.001−0.0570.010−0.0680.002
C = Correlation coefficient.
Table 11. Results of the regression analysis between volumetric soil moisture content variations, per hour, and temperature, wind velocity, and relative humidity in a period without rainfall.
Meteorological ElementRegression AnalysisBare LandGrasslandShrublandForestland
TemperatureSlope−0.001-−0.001−0.001
Intercept0.007-Intercept < 0.001−0.003
R20.001-0.0070.001
Wind velocitySlope−0.016---
Intercept−0.007---
R20.001---
Relative humiditySlope-Slope < 0.001Slope < 0.001Slope < 0.001
Intercept-0.014−0.005−0.010
R2-0.0010.001R2 < 0.001
Table 12. Results of the Spearman correlation coefficient and significance level between volumetric soil moisture content variations, per hour, and variation of temperature, wind velocity, and relative humidity per hour in a period without rainfall.
Meteorological ElementBare LandGrasslandShrublandForestland
Cp-ValueCp-ValueCp-ValueCp-Value
Temperature−0.0310.1620.0070.739−0.083p < 0.001−0.0340.124
Wind velocity0.0170.4510.0260.247−0.0090.686−0.0120.576
Relative humidity0.0420.061−0.0030.8800.0720.0010.0590.008
C = Correlation coefficient.
Table 13. Results of the Spearman correlation coefficient (C) and significance level (p) between volumetric soil moisture content, and temperature, wind velocity, and relative humidity in a period without rainfall.
Meteorological ElementBare LandGrasslandShrublandForestland
Cp-ValueCp-ValueCp-ValueCp-Value
Dry season
Temperature−0.545p < 0.001−0.0870.006−0.263p < 0.001−0.200p < 0.001
Wind velocity−0.140p < 0.001−0.187p < 0.001−0.217p < 0.001−0.192p < 0.001
Relative humidity0.0770.0150.0600.0580.177p < 0.0010.211p < 0.001
Rainy season
Temperature−0.128p < 0.001−0.158p < 0.001−0.127p < 0.001−0.167p < 0.001
Wind velocity−0.0350.257−0.0350.2520.0180.5680.0220.483
Relative humidity0.1050.0010.124p < 0.0010.143p < 0.0010.178p < 0.001
C = Correlation coefficient.
Table 14. Results of the regression analysis between volumetric soil moisture content and temperature, wind velocity, and relative humidity in a period without rainfall.
Meteorological ElementRegression AnalysisBare LandGrasslandShrublandForestland
Dry season
TemperatureSlope−0.2650.019−0.149−0.122
Intercept36.84640.62336.01836.604
R20.2490.0060.0710.065
Wind velocitySlope−0.073−0.557−1.474−0.996
Intercept34.36741.05834.97035.657
R20.0230.0280.0380.024
Relative humiditySlope0.030-0.0450.042
Intercept31.922-31.32332.400
R20.022-0.0450.053
Rainy season
TemperatureSlope−0.144−0.106−0.171−0.186
Intercept38.40645.02736.88040.033
R20.0200.0190.0200.022
Wind velocitySlope----
Intercept----
R2----
Relative humiditySlope0.0260.0190.0340.037
Intercept33.00741.05330.21232.735
R20.0130.0120.0160.017
Table 15. Results of the Spearman correlation analysis and the significance level of the relation between volumetric soil moisture content and temperature and wind velocity in a continuous period without rainfall in the dry season, and relative humidity in a period with little rainfall in the rainy season.
Meteorological ElementBare LandGrasslandShrublandForestland
Cp-ValueCp-ValueCp-ValueCp-Value
Temperature−0.349p < 0.001−0.716p < 0.001−0.768p < 0.001−0.534p < 0.001
Wind velocity−0.0980.026−0.170p < 0.001−0.194p < 0.001−0.1180.007
Relative humidity0.0500.5000.0400.5920.0340.6450.0390.593
C = Correlation coefficient.
Table 16. Results of the Spearman correlation analysis between soil moisture content and meteorological factors with 1 h and 5 h for hysteresis respectively in a continuous period without rainfall in the dry season.
Meteorological ElementBare LandGrasslandShrublandForestland
Cp-ValueCp-ValueCp-ValueCp-Value
1 h delayed
Temperature−0.343p < 0.001−0.723p < 0.001−0.766p < 0.001−0.530p < 0.001
Wind velocity−0.0900.041−0.187p < 0.001−0.195p < 0.001−0.1240.005
Relative humidity−0.1260.004−0.288p < 0.001−0.294p < 0.001−0.196p < 0.001
5 h delayed
Temperature−0.325p < 0.001−0.744p < 0.001−0.759p < 0.001−0.522p < 0.001
Wind velocity−0.0970.028−0.217p < 0.001−0.193p < 0.001−0.1350.002
Relative humidity−0.1100.013−0.243p < 0.001−0.295p < 0.001−0.184p < 0.001
C = Correlation coefficient.

