Flood-Landscape Ecological Risk Assessment under the Background of Urbanization


1
College of Water Conservancy and Hydropower Engineering, Hohai University, Nanjing 210098, China
2
Institute of Environmental Engineering, ETH Zurich, 8093 Zurich, Switzerland
*
Authors to whom correspondence should be addressed.
Water 2019, 11(7), 1418; https://doi.org/10.3390/w11071418
Submission received: 7 June 2019
/
Revised: 29 June 2019
/
Accepted: 8 July 2019
/
Published: 10 July 2019
(This article belongs to the Section Hydrology)
Abstract
:The Hydrologic Modeling System (HEC-HMS) and statistical analysis method were used to analyze the relationship between flood eigenvalues (i.e., flood volume and peak flow) and landscape pattern metrics. Then, the flood-landscape ecological risk index (ERI_FL) was proposed and constructed to quantitatively assess the flood-landscape ecological risk (FLER). The semivariogram method was used to spatialize the ERI_FL values. Lastly, this study analyzed the spatial–temporal change of FLER at watershed scale and at sub-basin scale, respectively. Two historical landscape distributions (i.e., 2003 and 2017) of Qinhuai River basin were used to perform this study. The results showed that there were certain relationships between landscape pattern and flood eigenvalues, and for different landscapes, the response metrics and degrees were different. FLER increased as urbanization increased. FLER change magnitude had a positive relationship with urban land percentage change magnitude. The distribution of FLER and the distribution of FLER change both showed spatial differences at watershed scale. The structural features of landscape pattern had significant effects on regional floods. In the urbanization process, avoiding forming large-scale landscape patches, improving landscape abundance, and increasing contact area between different types of landscape patches were helpful to reduce the negative effects caused by the increase of urban landscape area on flood.
1. Introduction
Since 1960, the world population has increased by 3 billion, and the UN Population Organization predicts that it will increase to 11.2 billion by 2100 [1]. Huge population growth results in rapid urbanization on a global scale. For a watershed, urbanization has significant effects on hydrological process [2], especially at shorter time-scale [3]. It means that flood response to urbanization is more pronounced than annual runoff response. In developed regions, dense population and high-developed economy make the regional flood risk caused by urbanization more serious [4]. There have been many researches examining the flood response to urbanization around the world, and most results have indicated that urbanization significantly increases flood volume and peak flow, and the potential change shows a linear relationship [2,3,5].
In the urbanization process, there are quick and significant changes on the areas and distributions of various landscapes, which lead to the landscape pattern change on landscape level and class level. These changes mainly reflect on shape, structure, and connectivity, etc. [6]. Feng et al. [7] studied the spatiotemporal variation of landscape patterns and their spatial determinants in Shanghai and concluded that the distances to outer-ring expressway and subway stations inside the outer-ring expressway are the most influential urbanization factors that affect regional landscape pattern. Dadashpoor et al. [8] analyzed the relationships among land-use change, urbanization, and landscape pattern in Tabriz metropolitan area and concluded that various land uses changes increased fragmentation and reduced aggregation. Landscape pattern change also has significant effects on regional hydrological process [9,10]. Kim and Park [11] analyzed the regional runoff response to urban green infrastructure landscape pattern change in the four largest metropolitan areas in Texas and proposed that larger, less fragmented, and more connected landscape patterns are likely to mediate the average annual peak runoff and reduce the negative effects caused by the increase of urban landscape area on flood.
Based on the above introduction, at present, the research on the hydrological response to urbanization mainly focuses on the relationship between landscape area change and hydrological process. For the landscape pattern change, researchers mainly focus on the characteristics of regional landscape pattern change and the relationship between landscape pattern and hydrological process for some specific landscapes. However, in the urbanization process, the relationship between different kinds of landscapes and flood process has not been clearly illustrated yet [12].
Environmental pollution, human activities, and natural disasters can have significant negative impacts on ecosystem [13]. Regional ecological risk assessment is important and essential to describe and assess the possibility and the degree of the negative influence at a regional scale. At present, most researchers concentrate on assessing ecological risk caused by natural and human activities, such as extreme weather and landscape change [14]. Peng et al. [15] analyzed land use change in Shenzhen City, linked ecological risk to the identification of ecological security patterns, and proposed that the forest lands, orchards, and water bodies are the main ecological security sources. Jin et al. [16] assessed the ecological risk change in Delingha City on the Tibetan plateau based on landscape pattern change. With the acceleration of urbanization, the complexity of the regional landscape pattern is gradually increasing, and the ecological processes and functions affected by the pattern are also constantly changing, which significantly affect the regional ecological security [17].
From the above analyses, the following three conclusions can be drawn: urbanization has significant effects on hydrological process and landscape pattern, there is a certain relationship between landscape pattern and hydrological process, and there is also a certain relationship between landscape pattern change and ecological risk. These factors result in an inevitable relationship between flood disasters and regional ecological risk under the background of urbanization. However, the method of analyzing the relationship among landscape pattern, flood disasters, and ecological risk at watershed scale, and a quantitative analysis method of assessing the flood ecological risk based on landscape pattern characteristics have not been proposed yet [18], which need further discussion.
The main objective of this study is to assess the flood-landscape ecological risk (FLER) under the background of urbanization, which was achieved by the following five phases: (1) to establish an HEC-HMS hydrological model to simulate the flood processes under two history landscape distribution patterns (i.e., 2003 and 2017); (2) to analyze the relationship between flood characteristics and landscape pattern by using Spearman rank correlation analysis method and multiple linear regression analysis method; (3) to propose the flood-landscape ecological risk index (ERI_FL) to calculate the regional FLER; (4) to analyze the spatial–temporal change of FLER at a whole watershed scale; and (5) to comparatively analyze the FLER change at sub-basin scale.
2. Materials and Methods
2.1. Study Area and Data
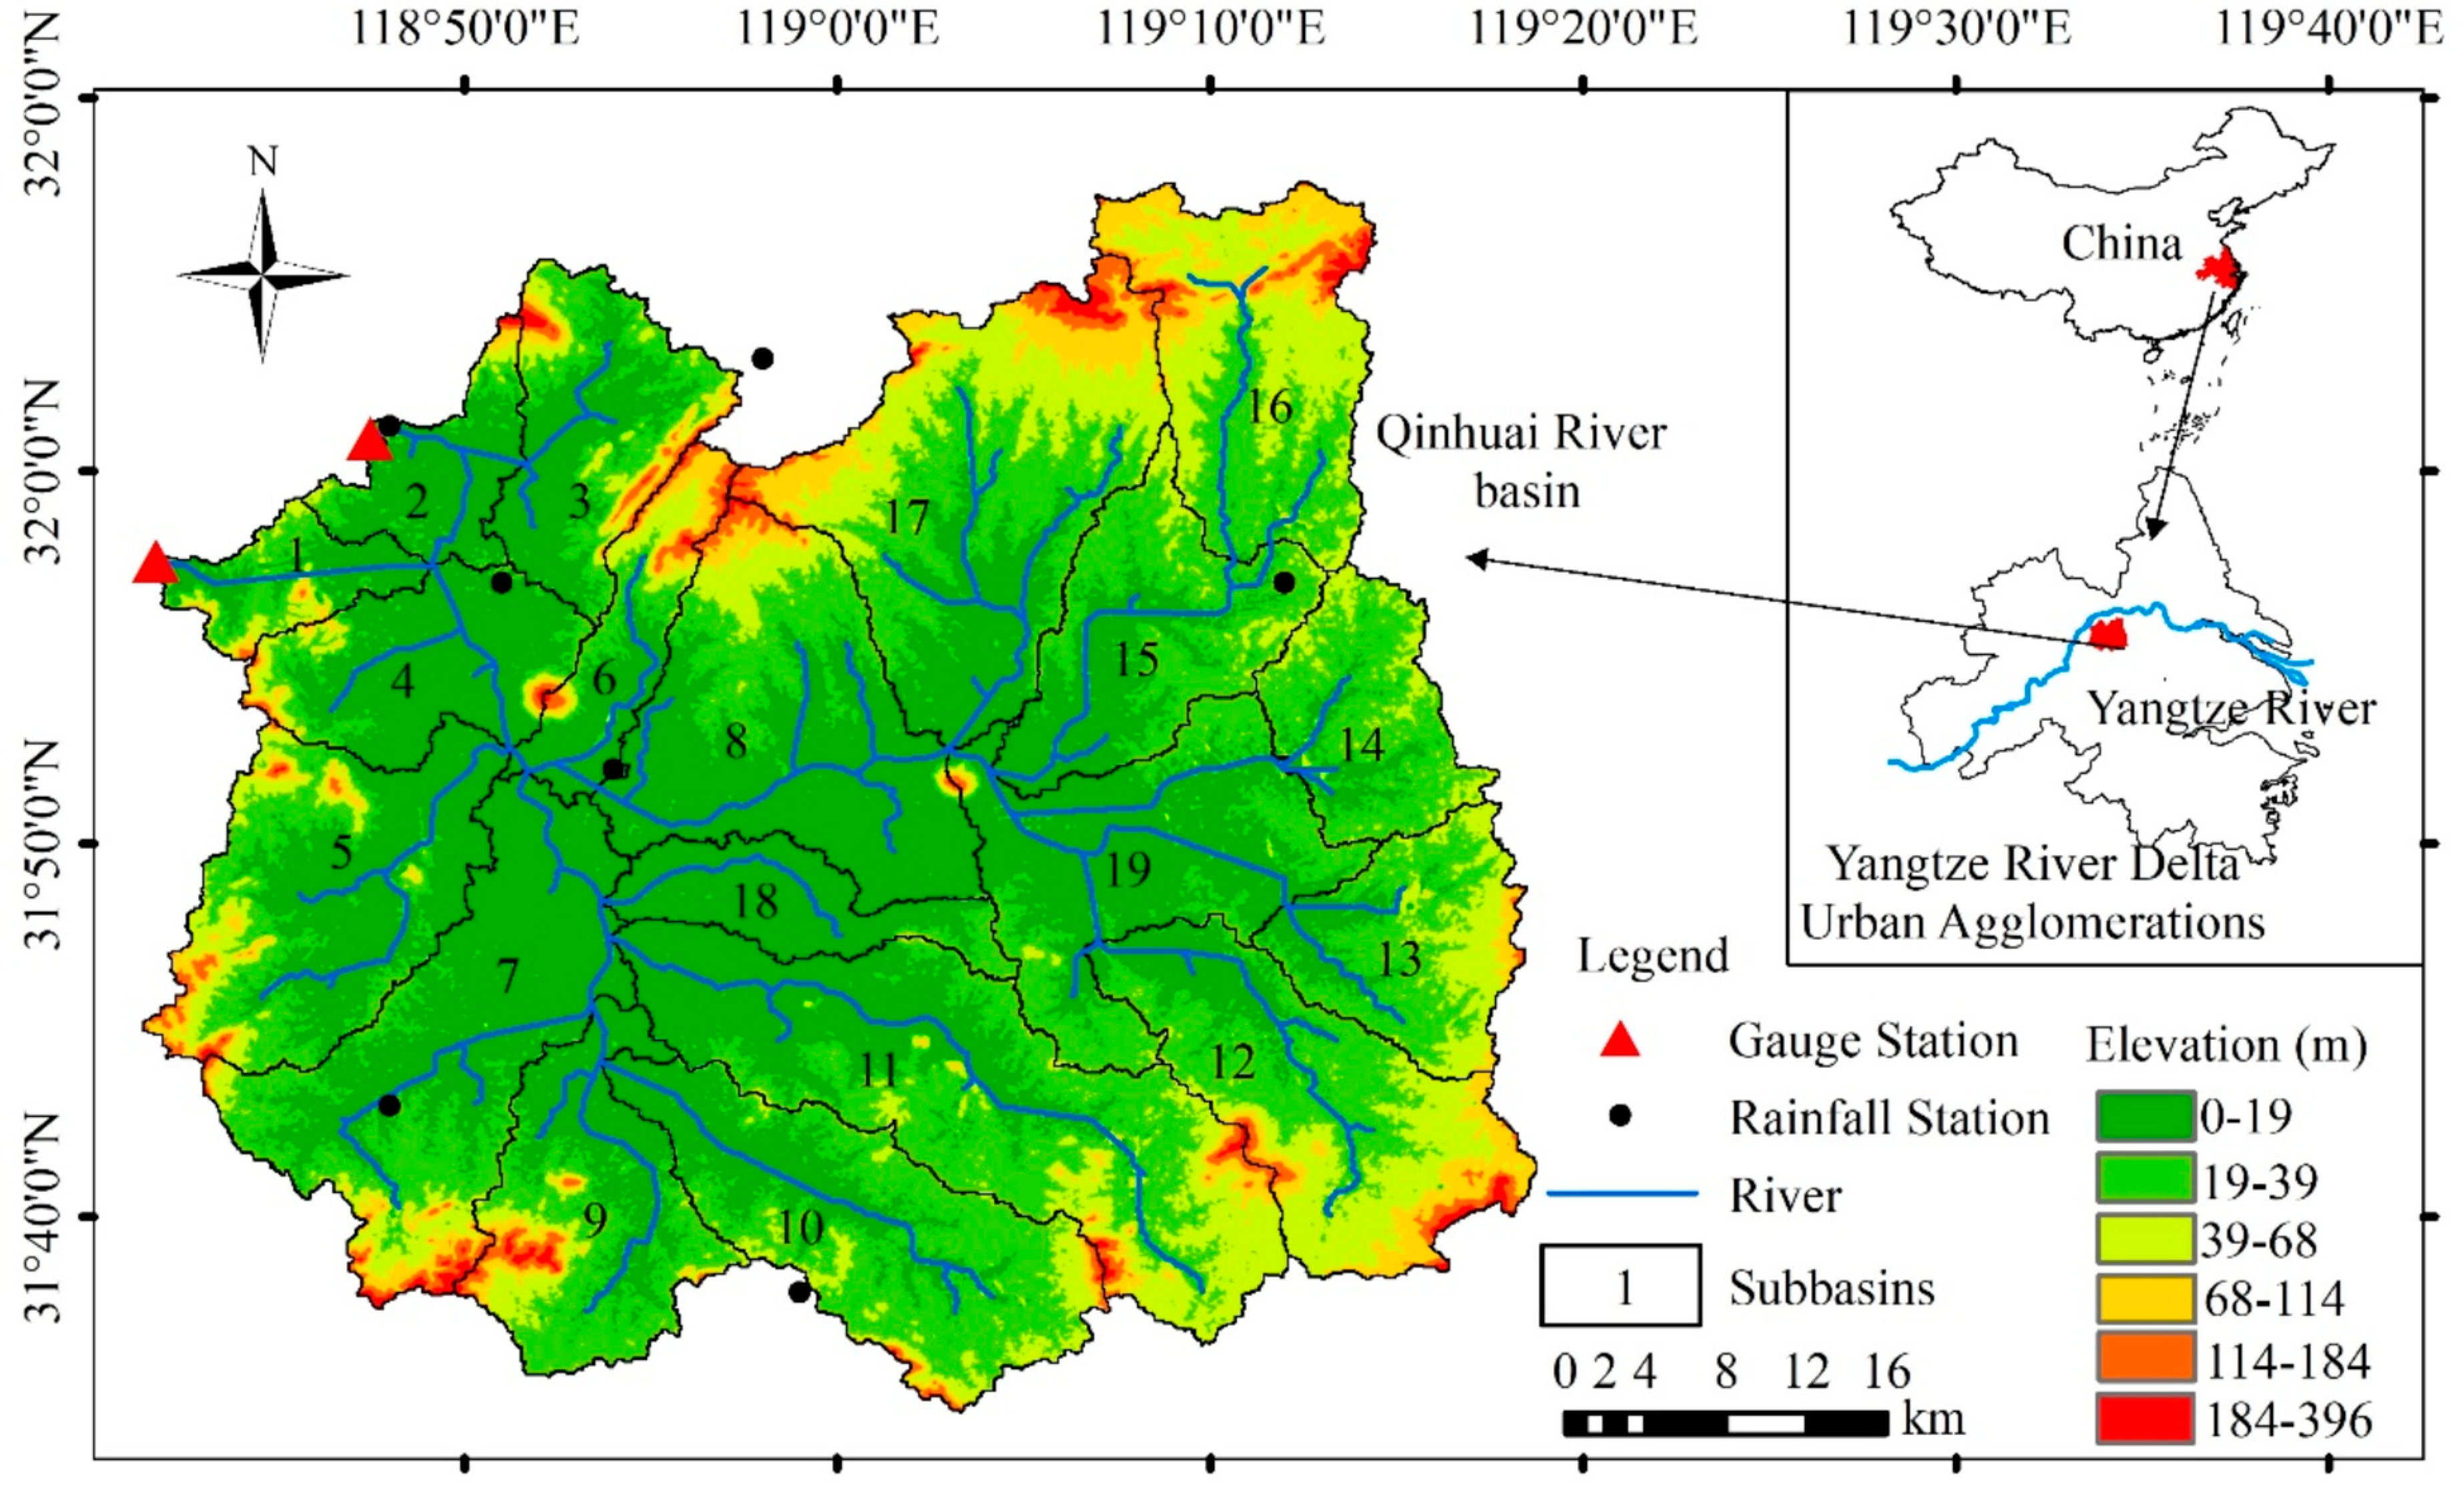
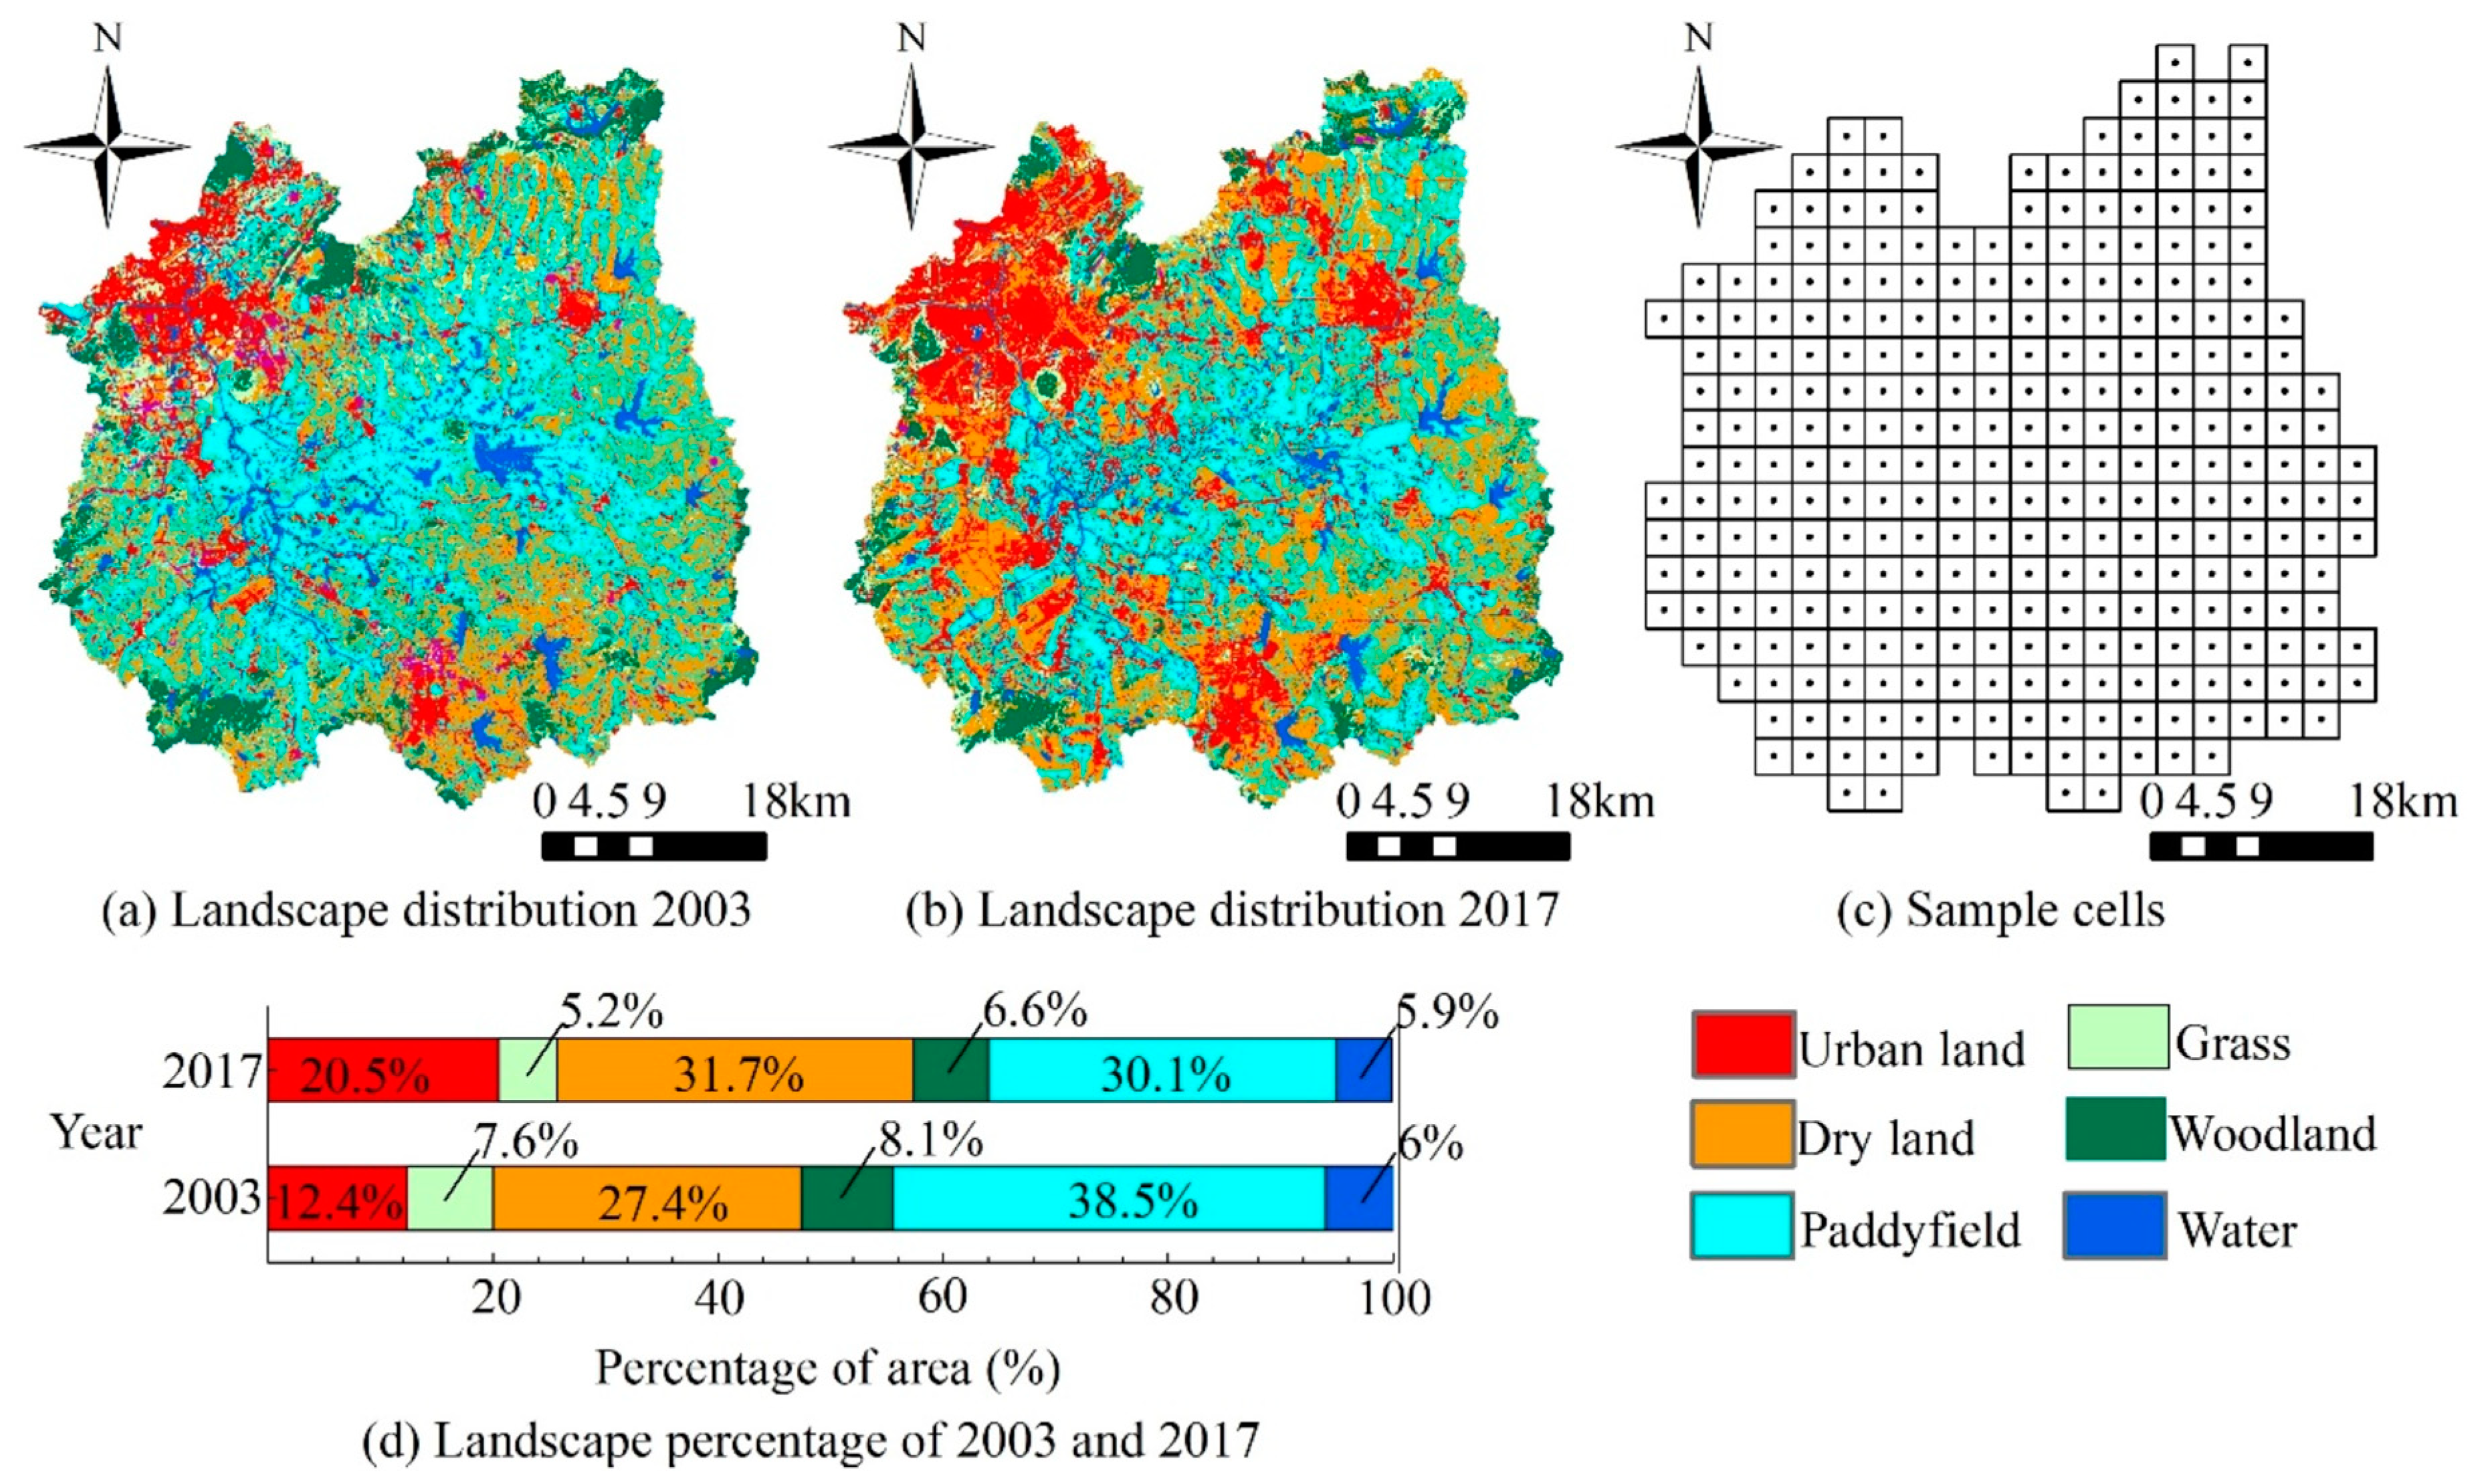
Qinhuai River basin, with the area of 2631 km2, is located in the south bank of Yangtze River. The basin belongs to the subtropical monsoon climate region, with an average annual temperature of 15.4 °C and an average annual precipitation of 1047 mm. And the basin is located in the eastern hilly area of China, with low-lying plains in the center and hilly areas surrounded. Figure 1 shows the location, river system, and evolution distribution of Qinhuai River basin. The basin was divided into nineteen sub-basins based on the evolution distribution and river system. The distribution of the sub-basins can also be seen in Figure 1. There are three cities in the basin, which are Nanjing City, Jurong City, and Lishui City. The basin has two outlets. Both of the outlets are located in the northwest of the basin, which is the central part of Nanjing City. Jurong City locates in the east of the basin, and Lishui City locates in the south. Figure 2a,b show the landscape distributions, and Figure 2d shows the landscape percentage of Qinhuai River basin for 2003 and 2017. The main landscapes include dryland, paddy field, and urban land. Owing to the climate and terrain characteristics, the flood disaster occurs frequently in Qinhuai River basin [19], mainly in the rainy season (April to September).
Table 1 shows the data used in this study.
2.2. Methods
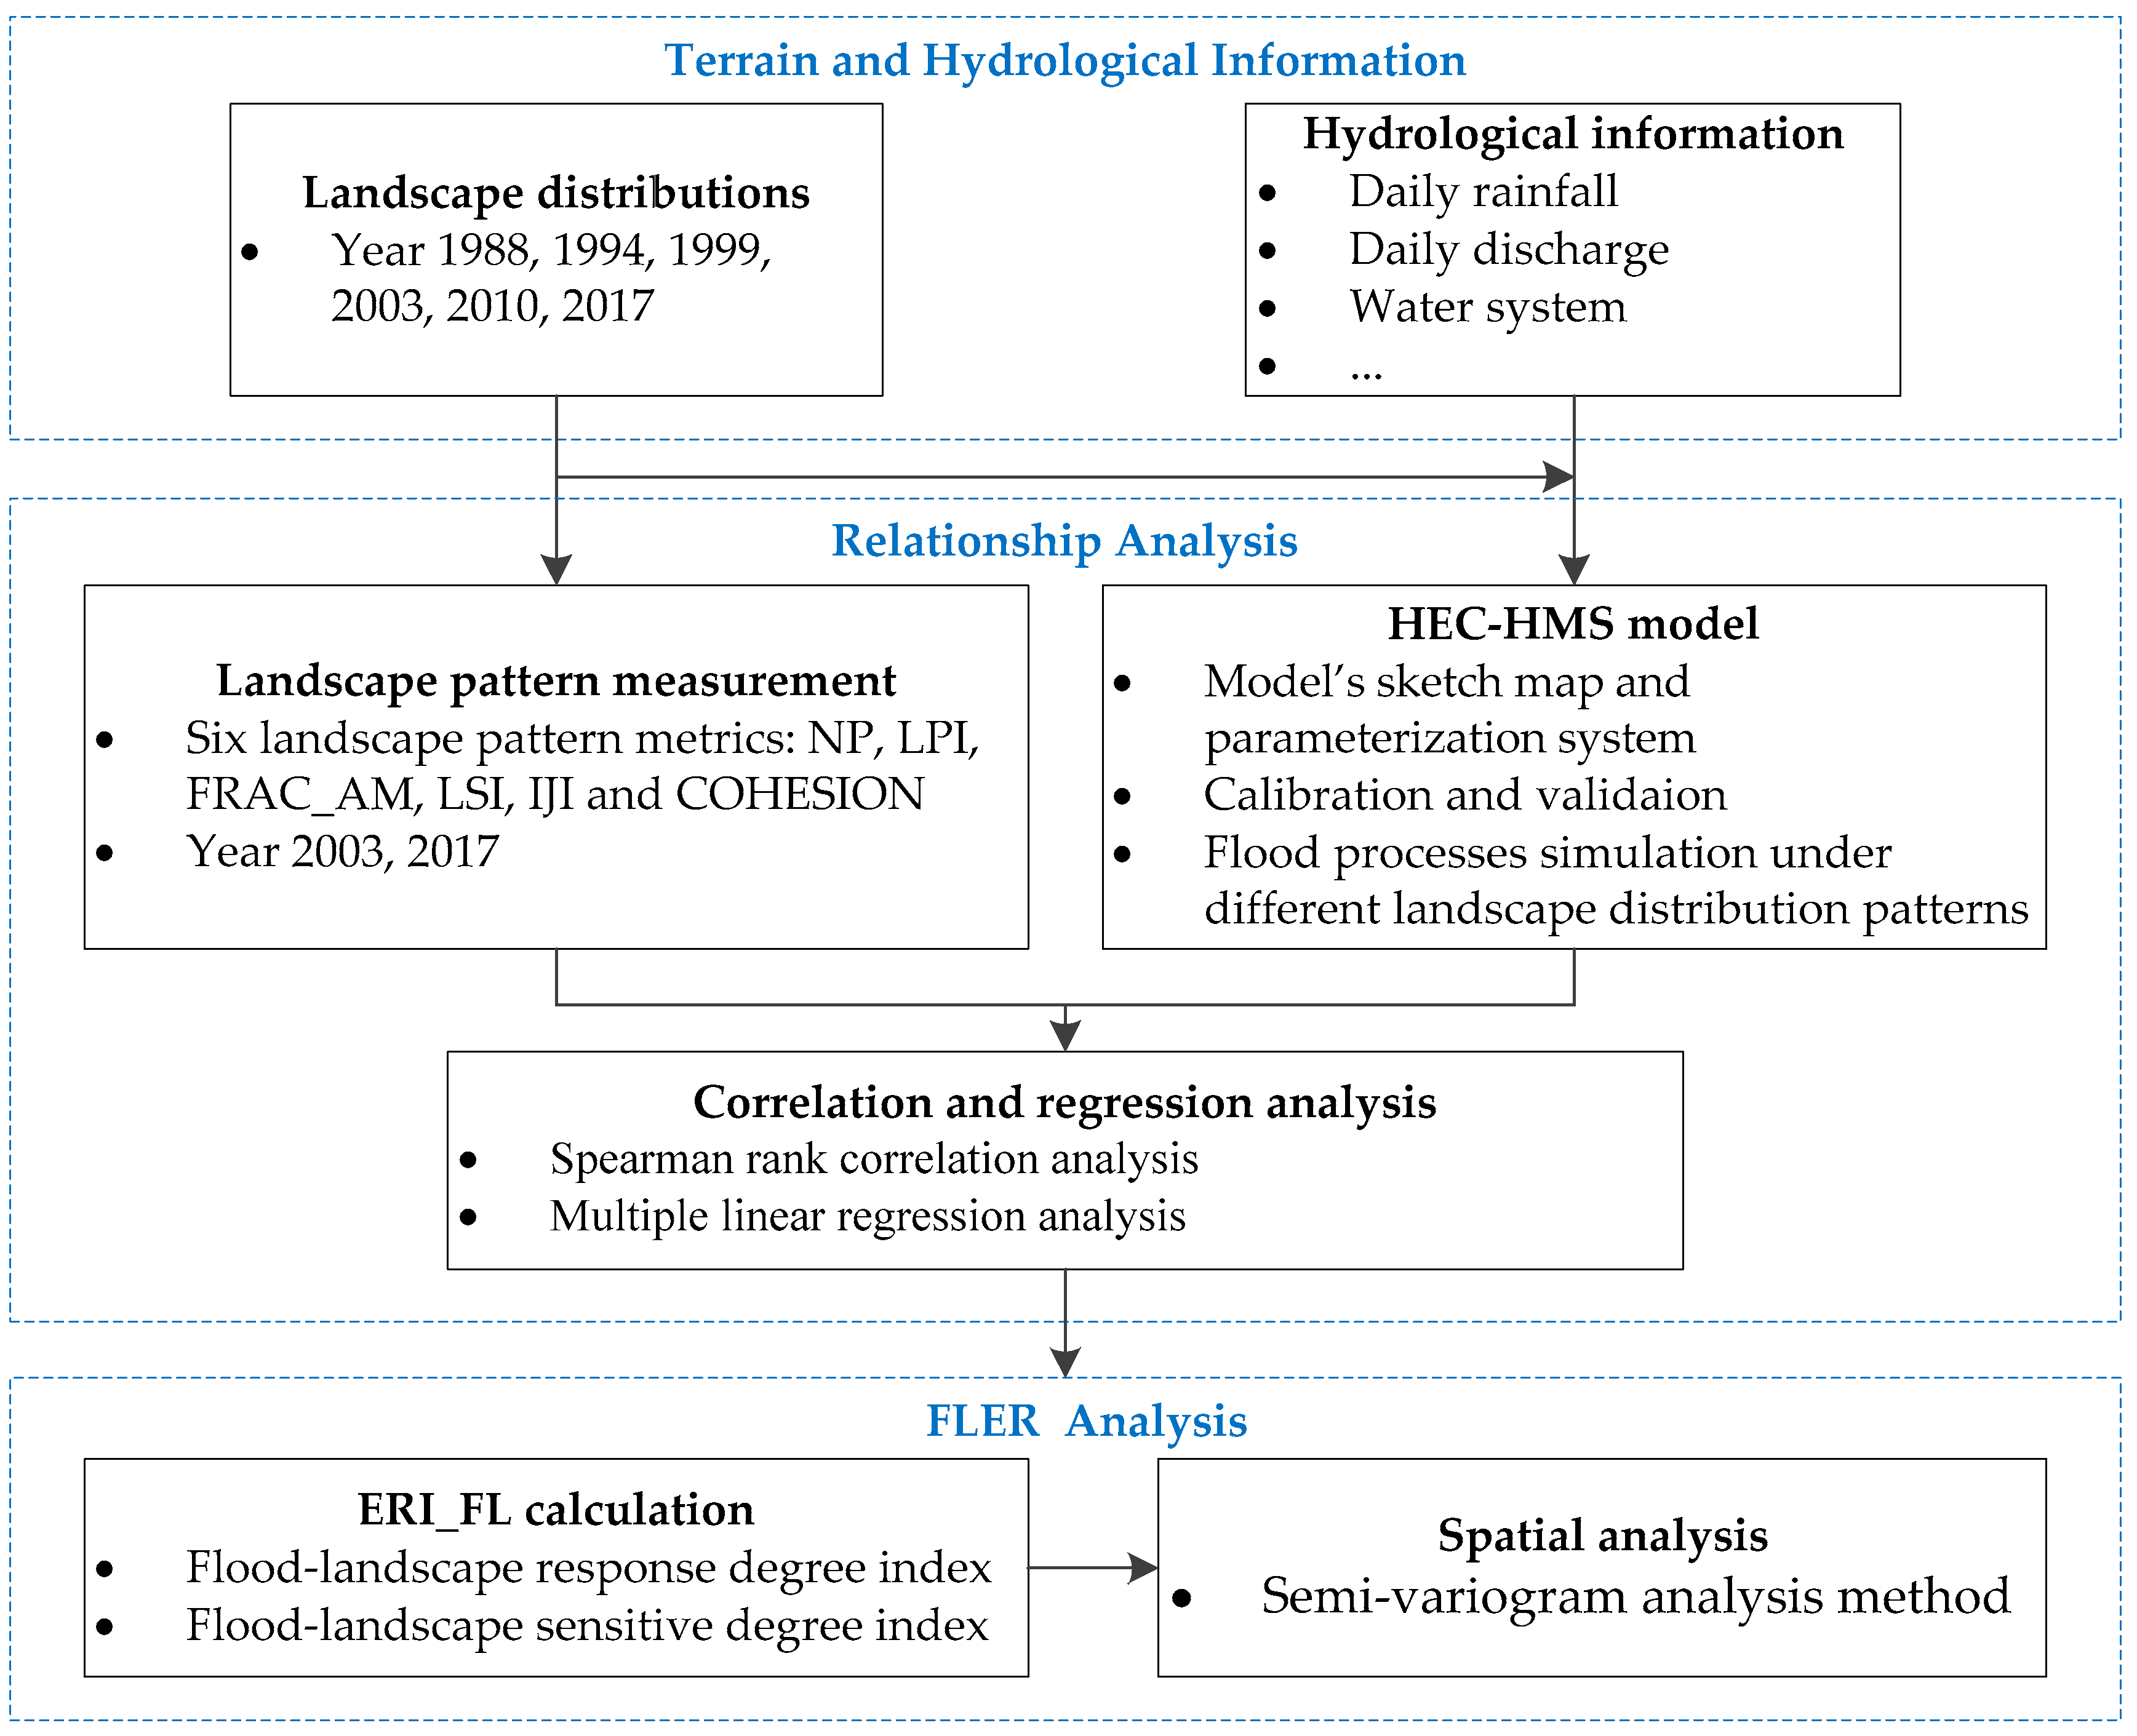
Figure 3 presents a spatial modeling framework that integrates a set of models and indexes to enable the spatial evaluation of FLER. Specifically, this framework consists of four key components: (1) HEC-HMS model construction to simulate the flood processes under different landscape distribution patterns; (2) correlation and regression analysis between flood eigenvalues and landscape pattern characteristics; (3) calculation of ERI_FL, and (4) spatial analysis of FLER.
2.2.1. HEC-HMS Model Implementation
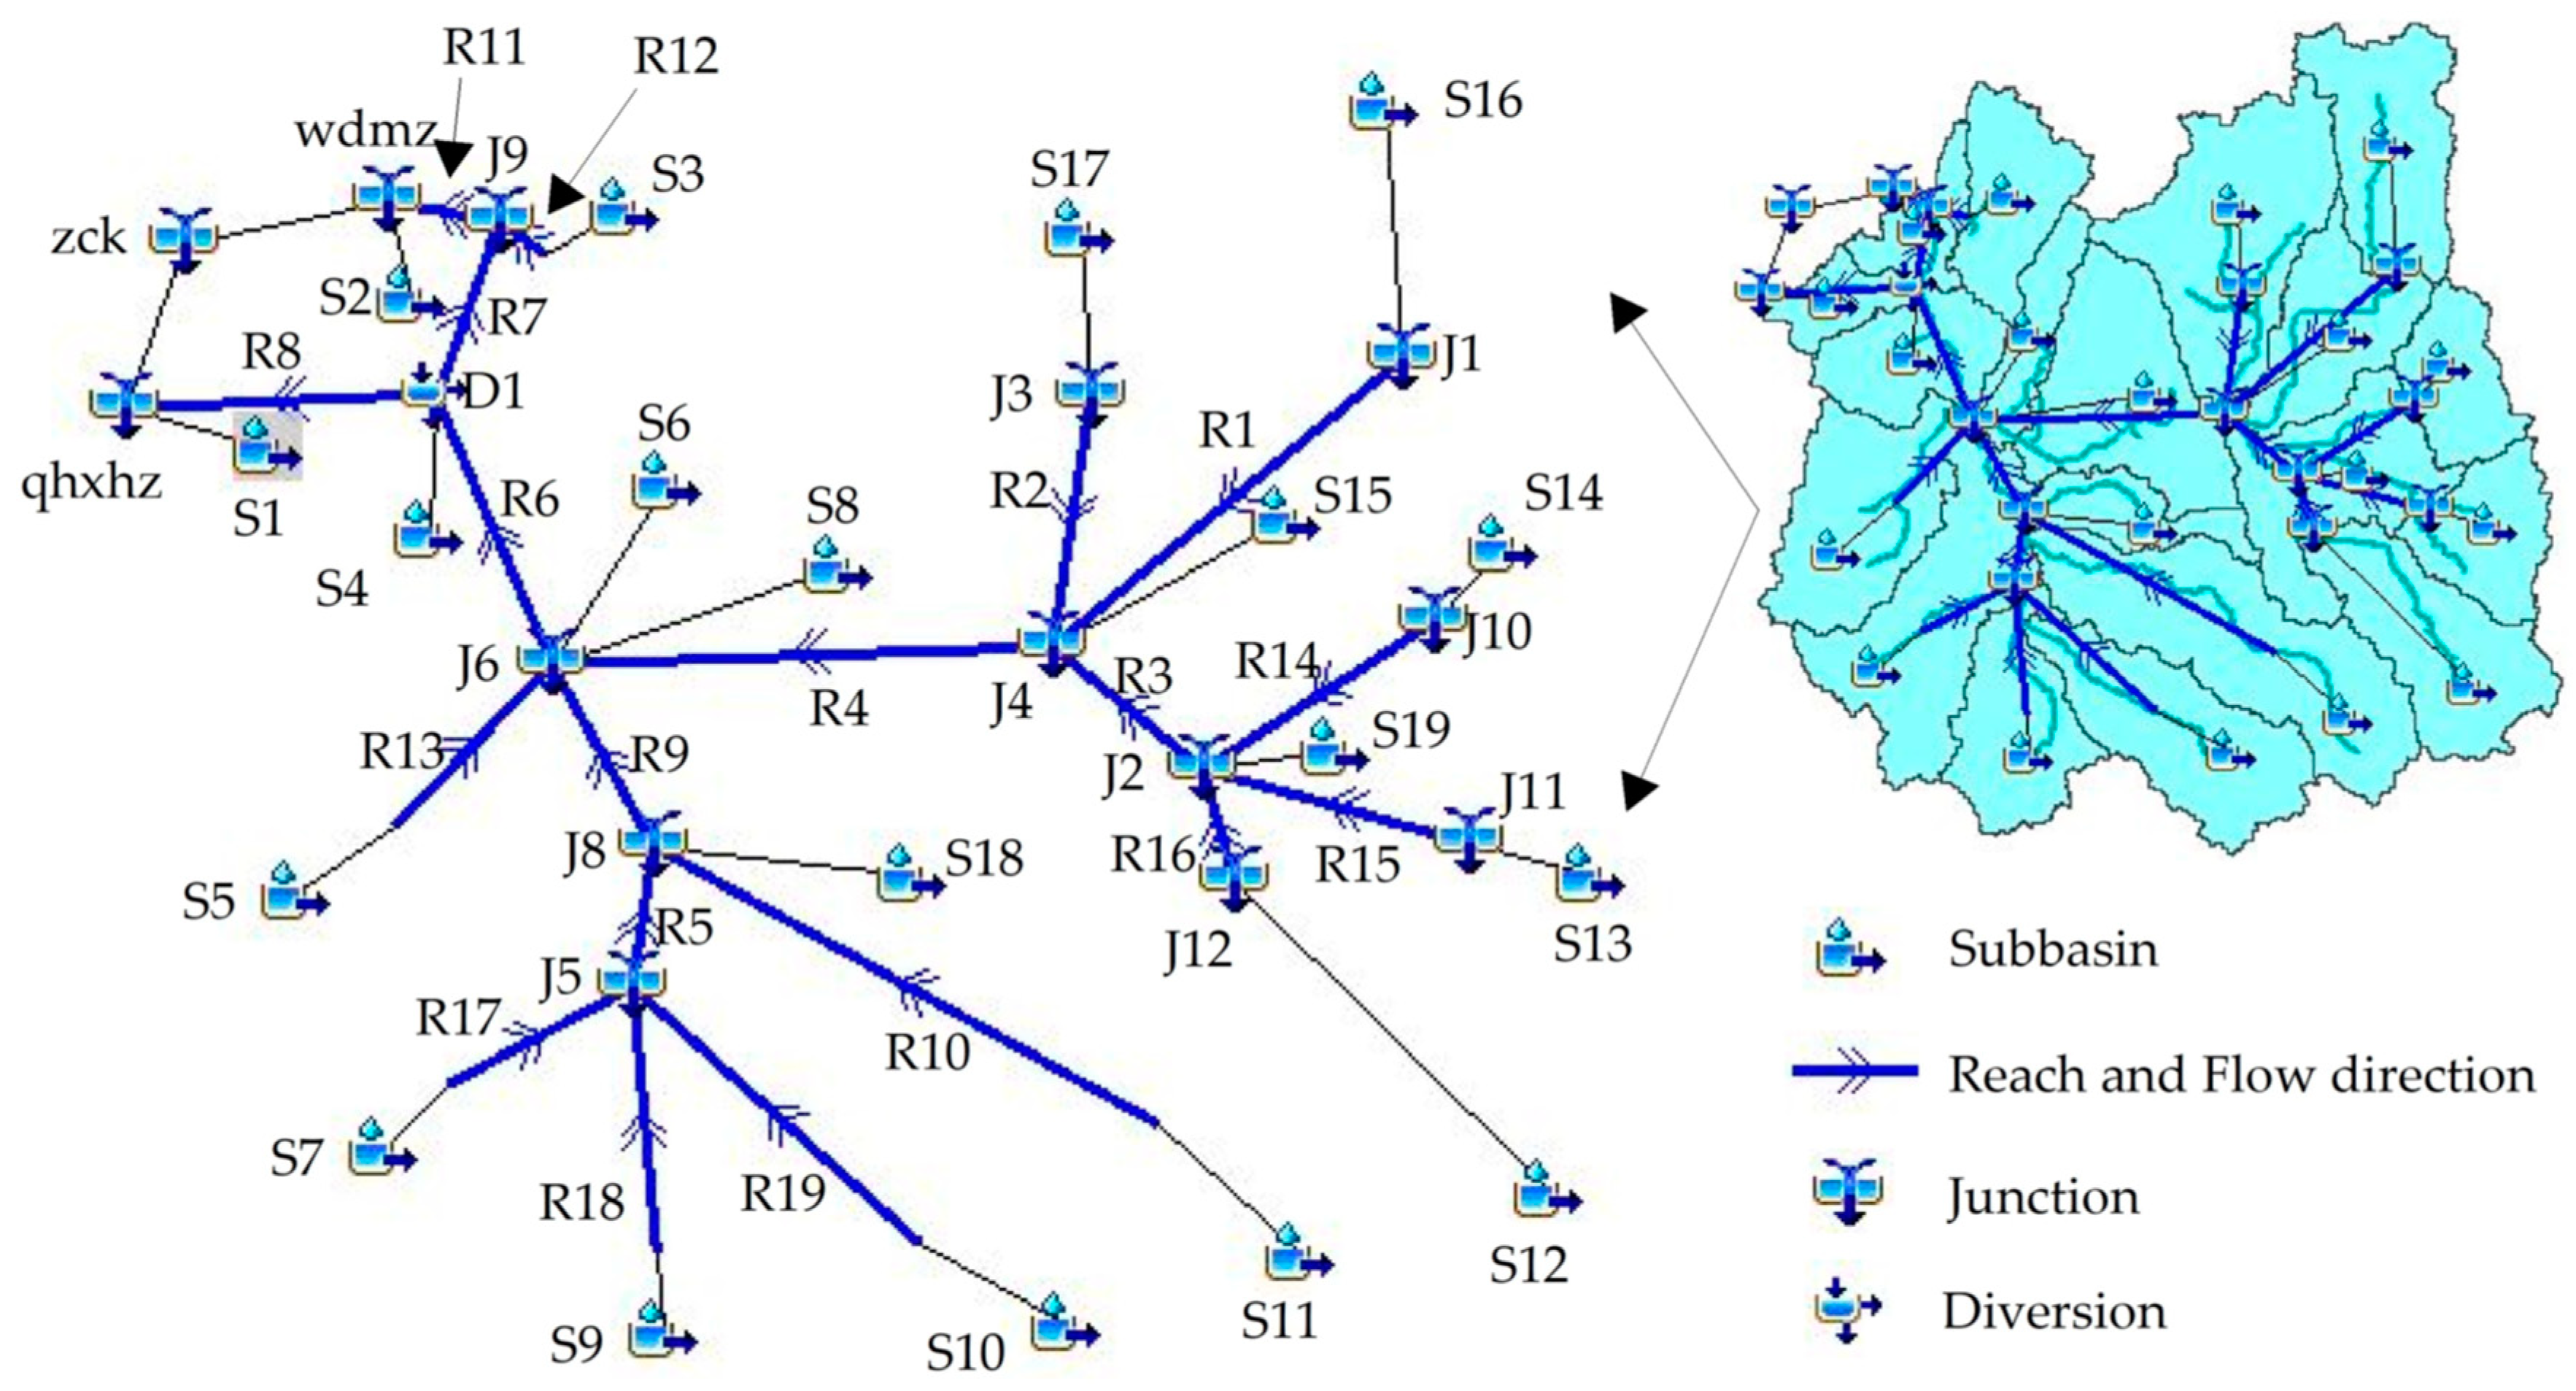
The HEC-HMS model was used in this research to simulate the rainfall-runoff process. HEC-HMS is a wildly used hydrological model for flood events simulation [20,21,22,23]. The model’s sketch map and parameterization system for Qinhuai River basin was constructed in our previous research [24], which are available in this study. There are mainly four kinds of hydrological elements (i.e., Sub-basins, Reach, Junction, and Diversion) in the model’s sketch map of Qinhuai River basin. Nineteen sub-basins, nineteen reaches, fourteen junctions, and one diversion were defined in the model. Figure 4 shows the sketch map. In the parameterization, the Natural Resources Conservation Service curve number method was used to calculate the surface runoff, and the Curve Number (CN) value and impervious rate were calculated based on the landscape and soil distributions. Direct runoff, baseflow, and channel flow were estimated by the unit hydrograph method, the recession model, and the Muskingum method, respectively.
Four evaluation criteria (i.e., correlation coefficient (R), Nash–Sutcliffe efficiency (NSE), relative flood volume error (Dv), and relative peak flow error (Dp)) were used to quantify the model performance. The acceptable ranges for R and NSE are greater than 0.75, and the absolute values for Dv and Dp are less than 30% [25]. The equations for the criterial are as follows:
where Qsi and Qoi are the ith simulated and observed stream flows at time i, and are the average simulated and observed stream flows, Qsp and Qop are the peak flows of simulated and observed hydrographs of the simulated flood events.
2.2.2. Landscape Metrics
Six landscape metrics (i.e., NP, LPI, FRAC_AM, LSI, IJI, and COHESION) were selected in this study to identify the patterns and characteristics of different landscape types. The ecological significances of these metrics are as follows [26]. NP shows the extent of subdivision or fragmentation of a patch type. LPI is used to measure the percentage of total landscape area comprised by the largest patch, which reflects connectivity. FRAC_AM is the area-weighted mean of FRAC, which reflects complexity. LSI is a standardized measure of total edge or edge density that adjusts for the size of the landscape, which is also a reflection of complexity. IJI is used to measure the contact between one type of patch and other types of patch, which reflects fragmentation. COHESION is a measure of physical connectedness of the corresponding patch type, which is also a reflection of connectivity. The software FRAGSTATS 4.2 (Zurich, Switzerland) was used to measure these metrics. The calculation formulas of these metrics can refer to the FRAGSTATS Technical Manual [27].
2.2.3. Correlation and Regression Analysis
The association between flood eigenvalues and landscape pattern was analyzed by two steps. Firstly, the Spearman rank correlation analysis was used to analyze the correlation degrees between flood eigenvalues and landscape pattern metrics of different landscapes and find out the metrics with high correlation degree. Rank correlation coefficient (α) was used to test the correlation degree. The value of α ranges from −1 to 1, and |α| > 0.4 means that there is moderate or higher correlations between flood eigenvalues and corresponding metrics [9]. In this research, the landscape metric, which satisfied the above requirement, was defined as the relevant landscape metric.
Then, the multiple linear regression analysis was used to assess the effects of relevant landscape metrics on flood eigenvalues. The flood eigenvalues were set as dependent values, the relevant landscape metrics of different landscapes were set as independent values. The standardized regression coefficient (β) was used to qualify the results. When β > 0, the increase of the corresponding landscape metric increases flood volume or peak flow, when β < 0, the effect is opposite [11]. The larger the value of |β|, the more significant the effect is.
The Spearman rank correlation analysis and the multiple linear regression analysis were performed in the software SPSS 22.0 (Zurich, Switzerland).
In Qinhuai River basin, due to the construction of water conservancy projects, such as river dikes, water-gates, and dams etc., the area, distribution, and structure of the water landscape have basically remained unchanged since the year of 2000 [25]. Because of this, this study mainly analyzed the effects of the landscape pattern change of urban land, dry land, paddy field, woodland, and grassland on flood.
2.2.4. Flood-Landscape Ecological Risk Index (ERI_FL)
1. Flood-landscape response degree index (Ei)
The Ei reflects the response degree of flood to landscape pattern change of different landscapes. The larger the Ei, the higher the FLER is. Combining the association between flood eigenvalues and landscape pattern discussed above, this study built the Ei calculation method as follows:
where Xij is the jth landscape metric of the ith landscape, 1 ≤ j ≤ mi, and mi is the number of the relevant landscape metrics of the ith landscape. and are the standardized regression coefficient of the jth landscape metric of the ith landscape on flood volume and peak flow, respectively. and are the weights of the jth landscape metric of the ith landscape types on flood volume and peak flow, respectively, and . Uij is the min–max normalized result of , considering that the increase of urban land area leads to the increase of flood volume and peak flow, while the other landscapes have opposite effects [24], in this research, for urban land, when βj < 0, q = 1, when βj ≥0, q = 2; for other landscapes, when βj > 0, q = 1, when βj ≤ 0, q = 2.
2. Flood-landscape sensitive degree index (Fi)
The Fi reflects the sensitive degree (Si) of flood to landscape pattern of different landscapes. The larger the Fi, the easier the flood generated on the corresponding landscape and the higher the FLER is. The Si of urban land, paddy field, dry land, woodland, and grassland were set as 6, 4, 3, 2, and 2 in this research, respectively [9,10]. The Fi of different landscapes are the min–max normalized result of Si.
3. Calculation of ERI_FL
From the perspective of the landscape pattern of the regional ecosystem, considering the response and the sensitive relationship between landscape pattern and flood and the area ratios of different landscapes, the ERI_FL was constructed as follows:
where ERI_FLk is the index of the kth risk region. Aki is the area of the ith landscape in the kth risk region. Ak is the area of the kth risk region. Eki is the flood-landscape response degree index of the ith landscape in kth risk region.
2.2.5. Spatial Analysis Method
To obtain spatial expression of the ERI_FL, a sampling interval system was applied. With comprehensive consideration of topographic and geomorphic factors, Qinhuai River basin was divided into 303 sample cells (3 km × 3 km). Figure 2c shows the sampling result. The ERI_FL value of each cell was calculated, and the value was assigned to the central point of the cell. Semivariogram method [16] was used to interpolate the ERI_FL into the whole research area. The regional analysis was realized by using geostatistical analysis method and GIS technique. The semivariance (δ) was constructed as follows:
where h is the step length of sampling, N(h) is the interval distance of the sample logarithm, Z(xi + h) and Z(xi) is the calculated value of ERI_FL on the spatial location of xi + h and xi.
The kriging interpolation of semivariogram analysis was used to realize the spatialization of ERI_FL [28]. And this research classified the ERI_FL of the whole basin into five risk groups: very low risk (0 < ERI_FL ≤ 1), low risk (1 < ERI_FL ≤ 3), medium risk (3 < ERI_FL ≤ 5), high risk (5 < ERI_FL ≤ 7), very high risk (7 < ERI_FL).
3. Results and Discussion
3.1. Validation of HEC-HMS Model
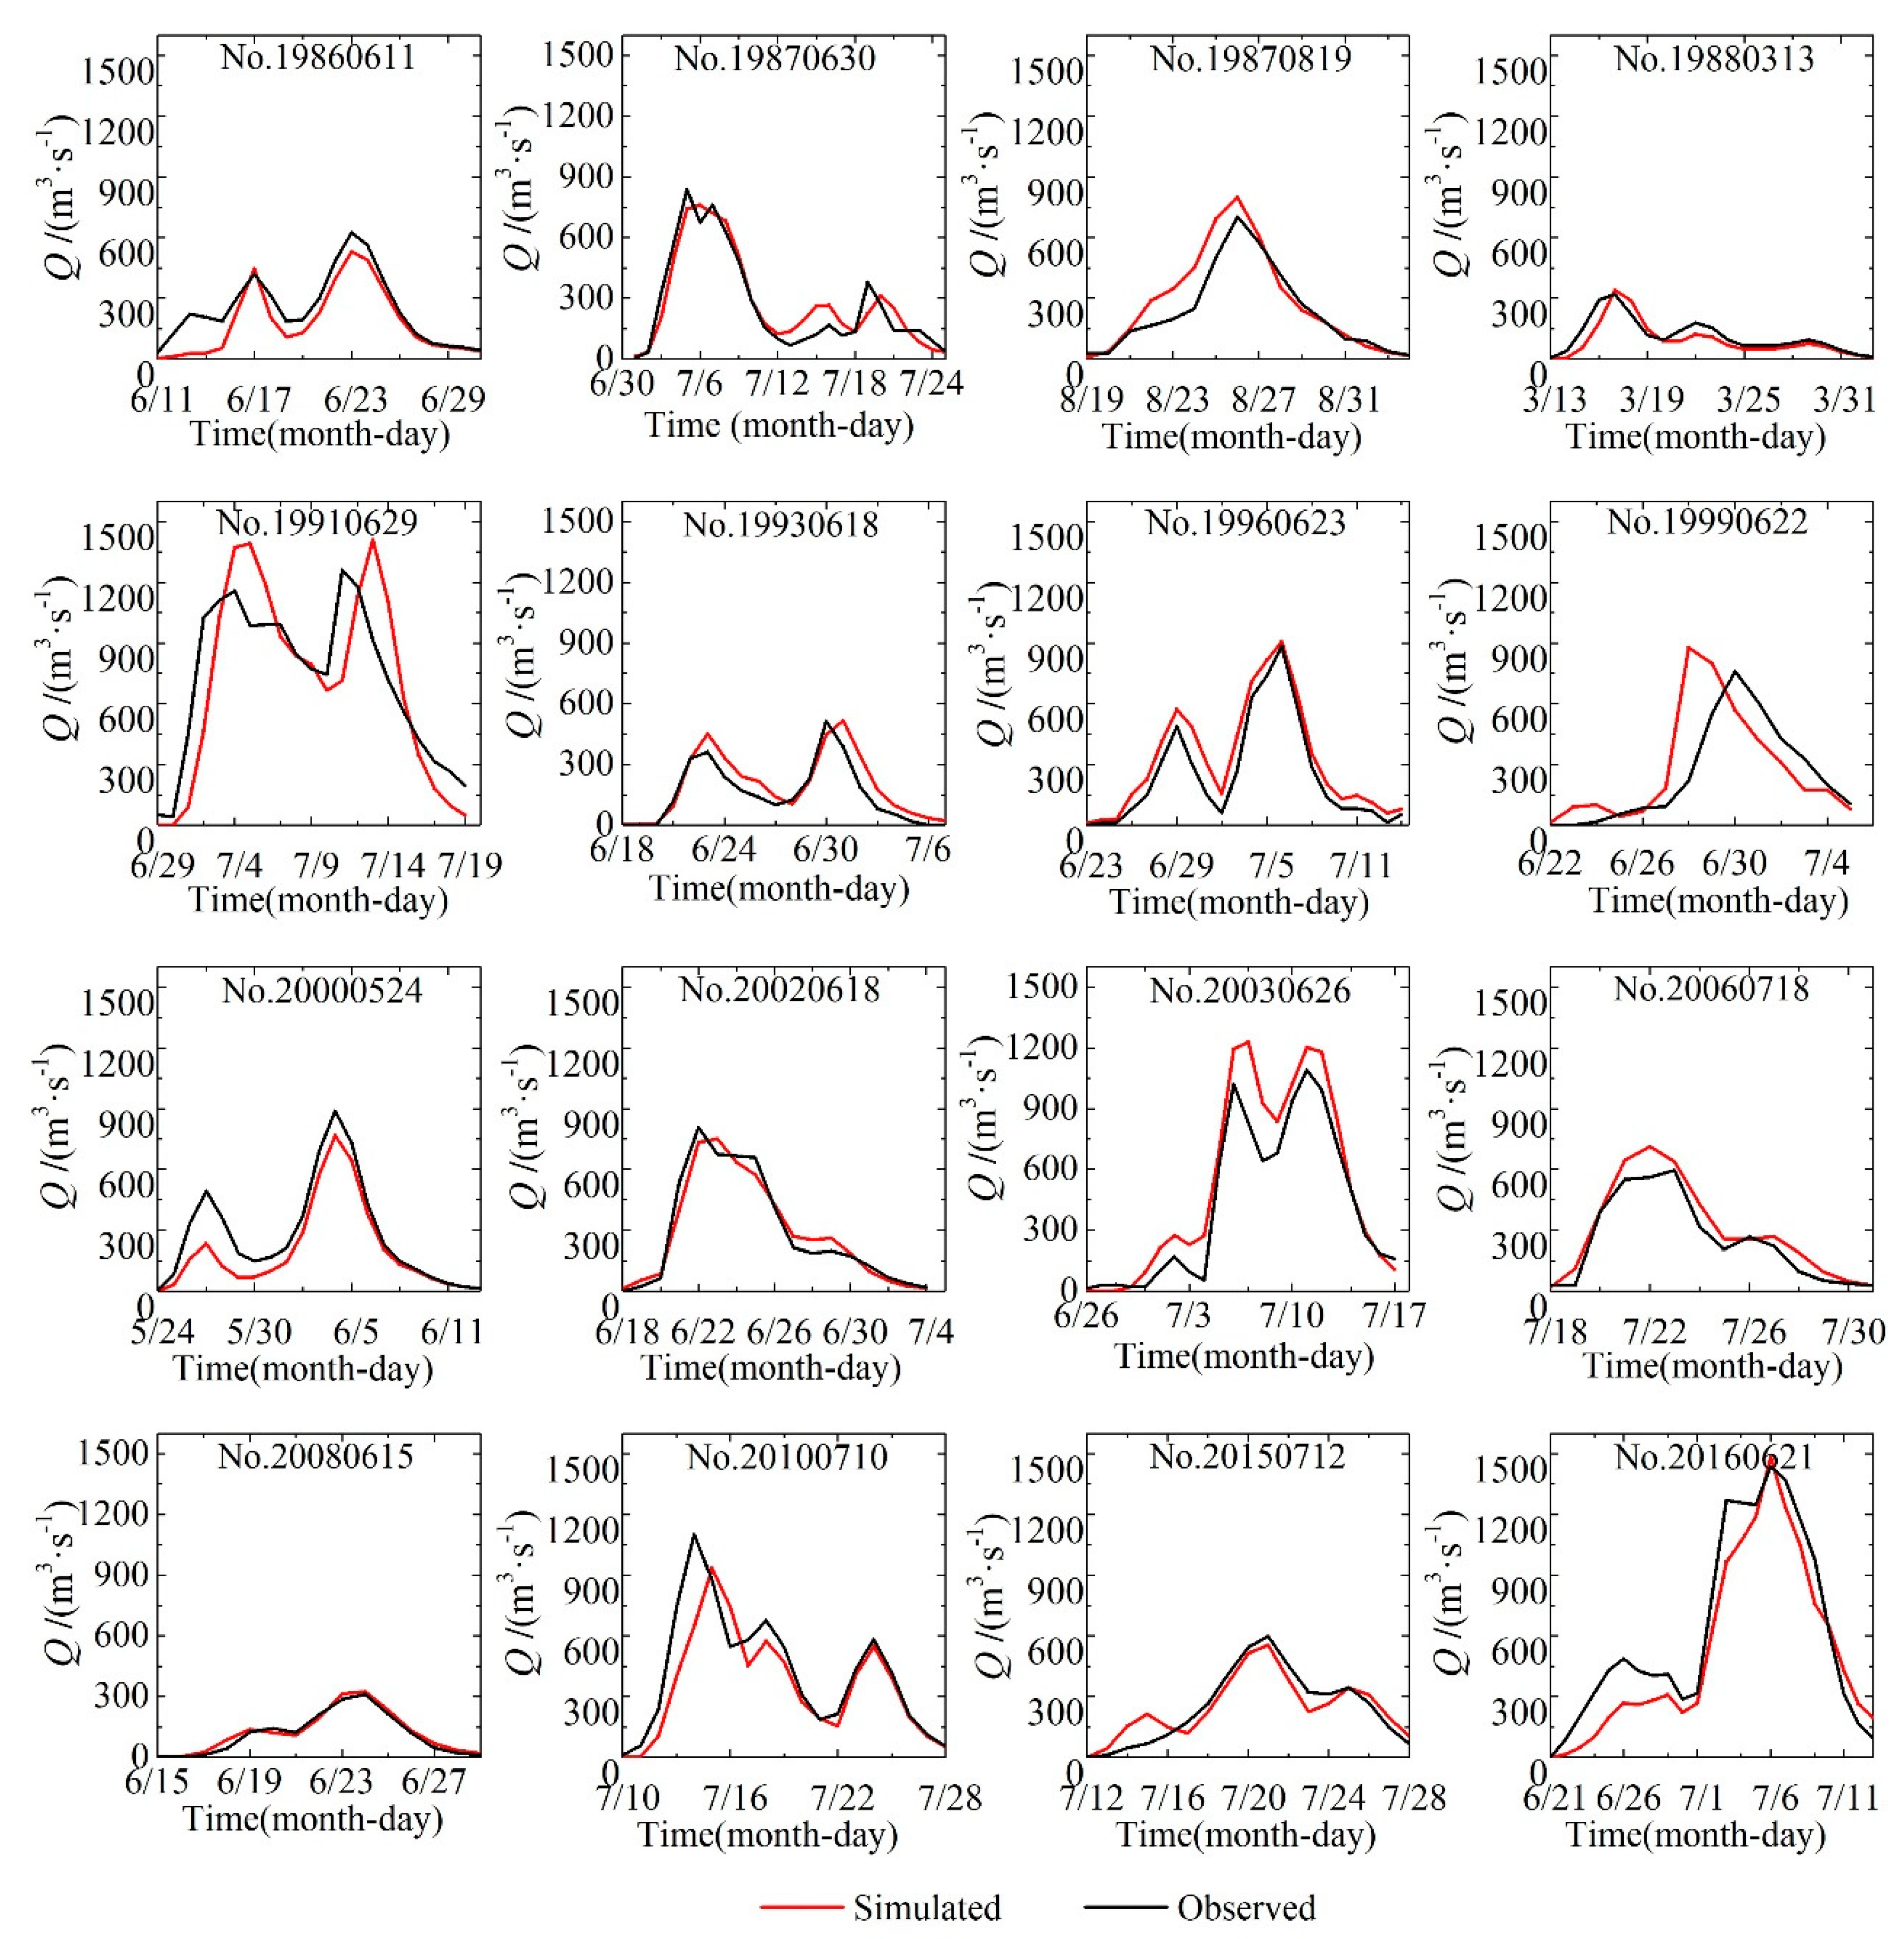
Sixteen historical flood events, with different magnitudes and characteristics, were used in this research to re-validate the model. Table 2 shows the corresponding landscape distribution and values of R, NSE, Dv, and Dp for each selected historical flood event. And Figure 5 shows the comparison of simulated and observed hydrographs. For the sixteen flood events, the computed flood hydrographs agreed well with the observed hydrographs for most flood events, except flood 19990622. The R values were all above 0.75. The NSE values were above 0.75 for most flood events, except floods 19880313, 19990622, and 20100711. The Dv and Dp absolute values were below 30% for most flood events, except flood 19860611. The mean R value was 0.95, and in 11 of the 16 floods was higher than the mean value. The Mean NSE value was 0.84, and in 8 of the16 floods was higher than the mean value. Based on the above results, the HEC-HMS is applicable to the Qinhuai River basin for flood events simulation in this research.
3.2. Correlation Analysis between Flood and Landscape Pattern
Sixty-two flood events were used to perform the relationship analysis between landscape pattern metrics of different landscapes and flood eigenvalues. Each data series included the relative changes (from 2003 to 2017) of nineteen sub-basins.
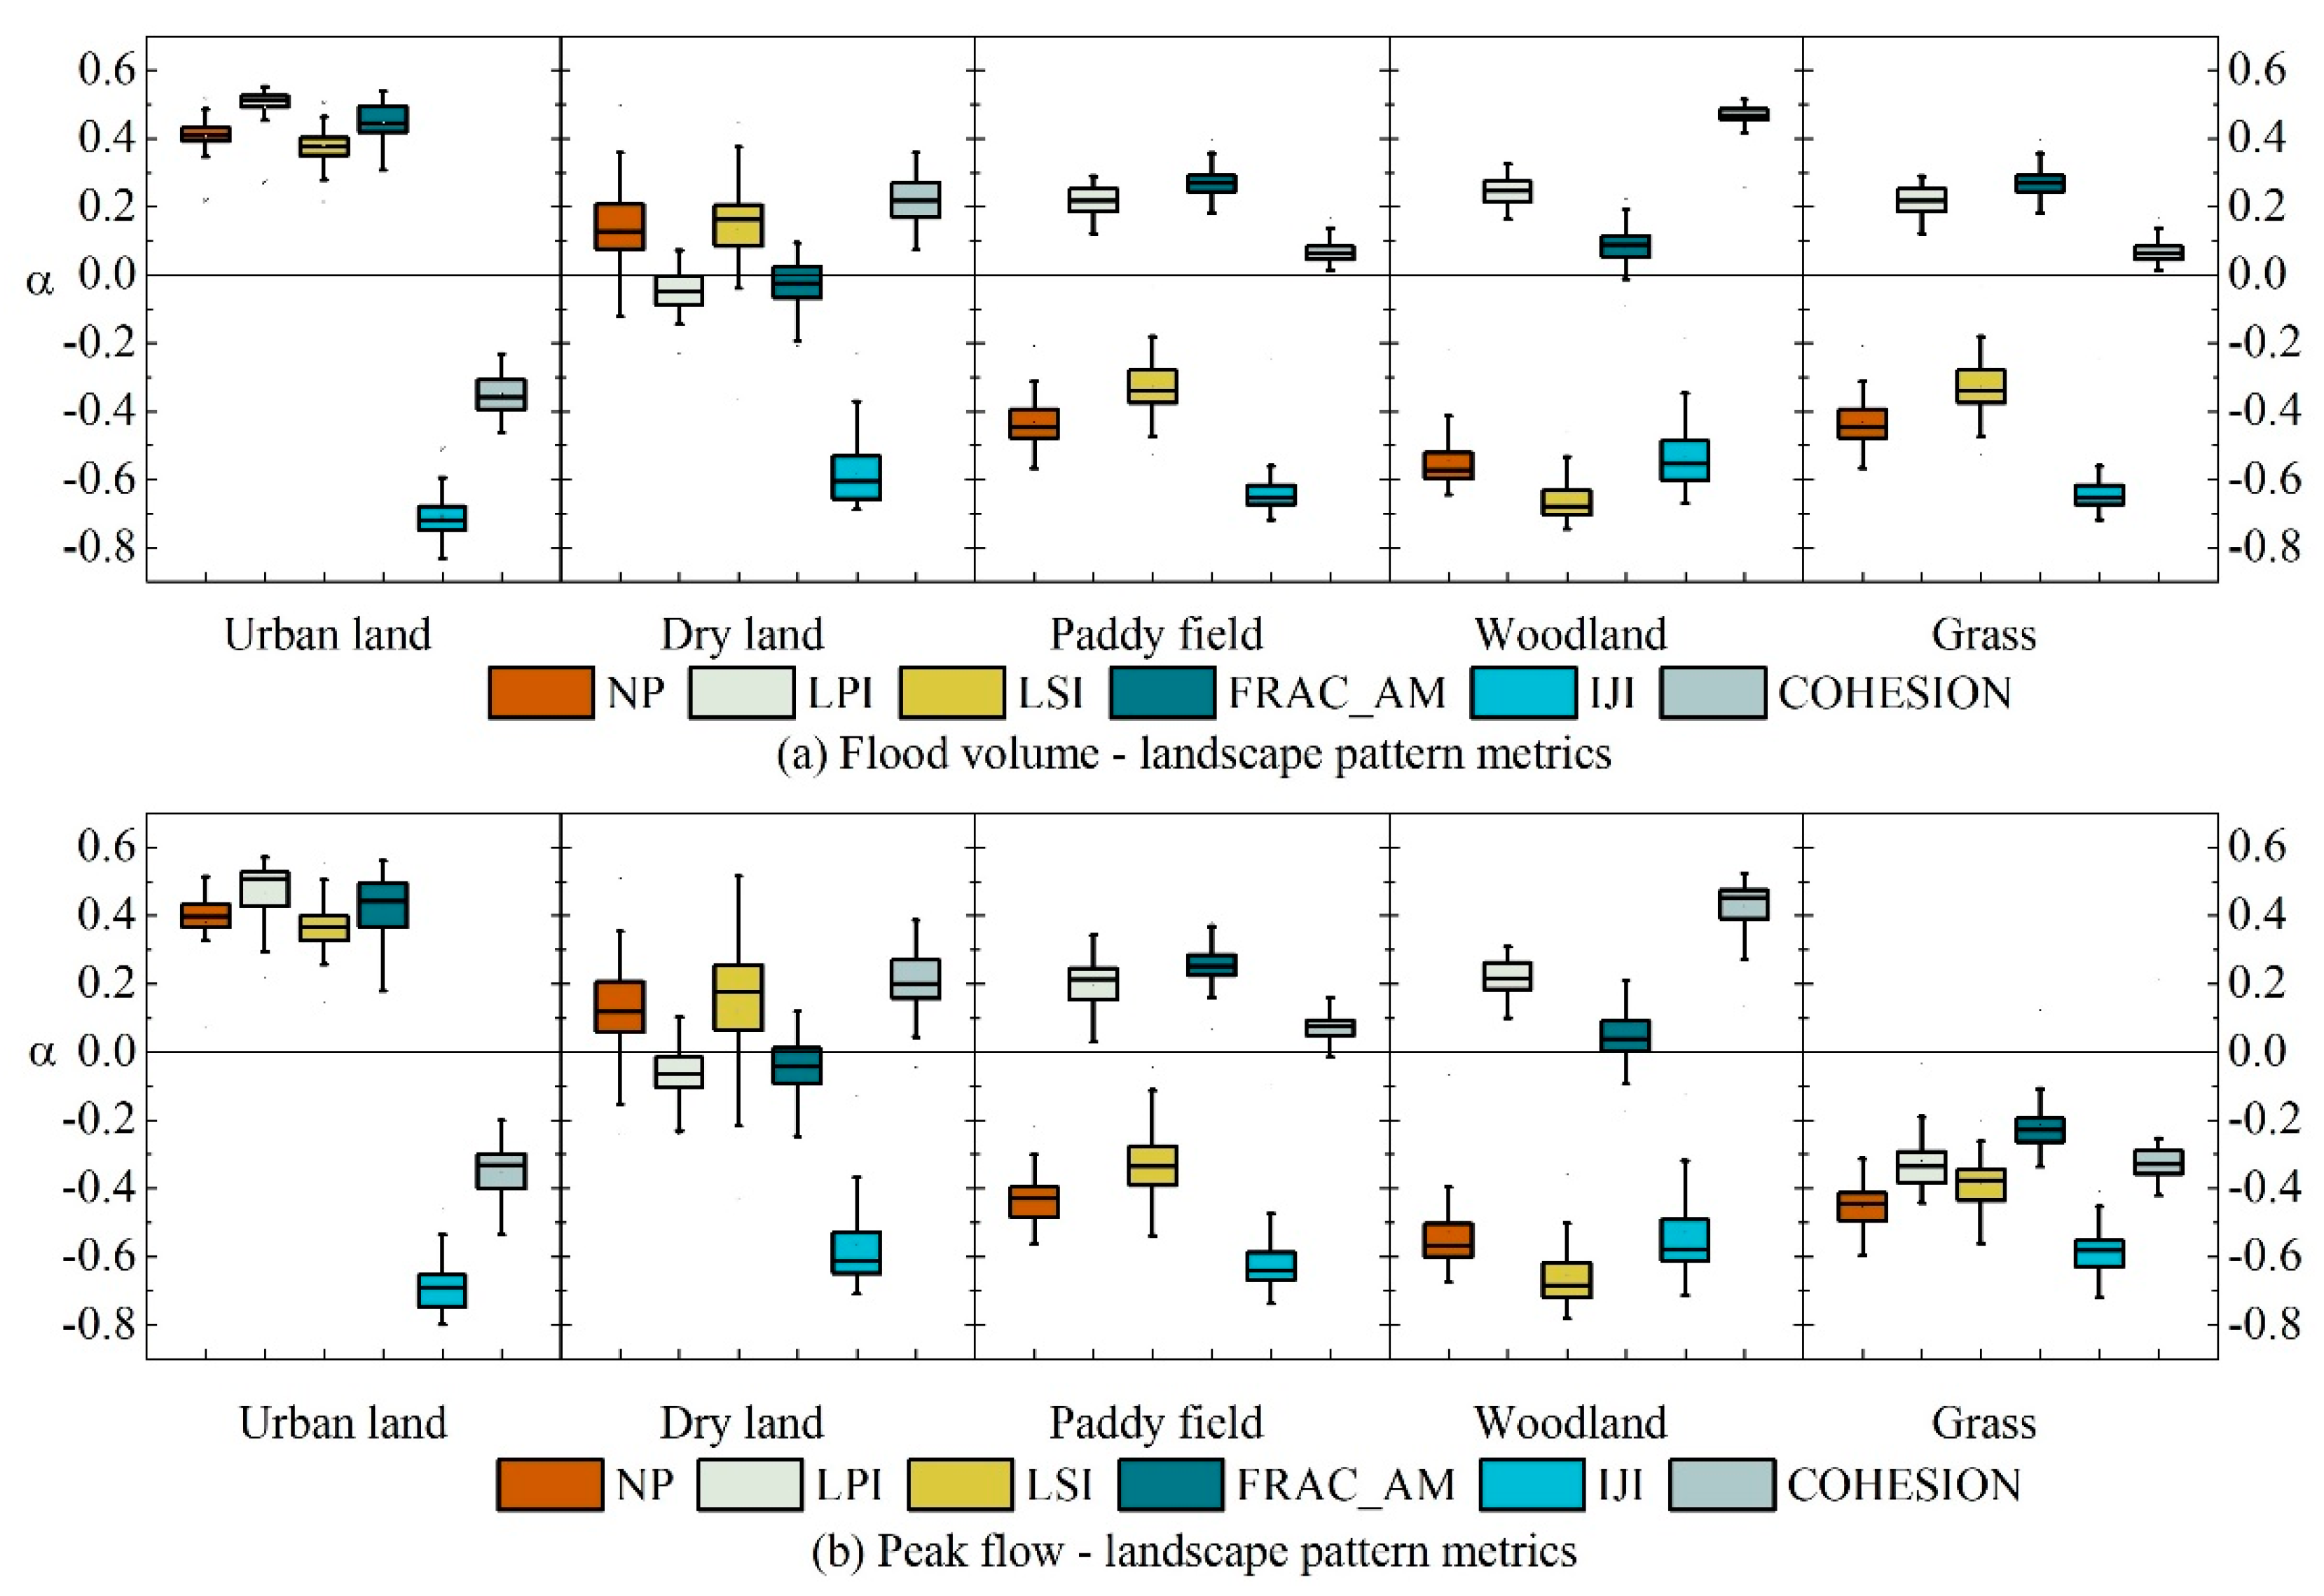
Figure 6a shows the box diagrams of the correlation analysis results between flood volume and landscape metrics, and Figure 6b shows the results of peak flow. From Figure 6a, for urban land, the values of |α| between flood volume and LPI, FRAC_AM, and IJI were all above 0.4 for most flood events, but the values of |α| between flood volume and NP, LSI, COHESION could not satisfy the requirement. That is, for urban land, LPI, FRAC_AM, IJI are relevant landscape metrics of flood volume. It can also be concluded that IJI is the relevant landscape metric of flood volume for dry land, NP and IJI are the relevant landscape metrics of flood volume for paddy field, NP, LSI, IJI, and COHESION are the relevant landscape metrics of flood volume for woodland, NP and IJI are the relevant landscape metrics of flood volume for grassland. For different landscapes, the relevant landscape metrics of flood are different. Comparing Figure 6a,b, it can be concluded that, for the same landscape, the relevant landscape metrics of flood volume and peak flow are the same, although there were slight differences in the statistical results of box diagrams.
3.3. Regression Analysis between Flood and Landscape Pattern
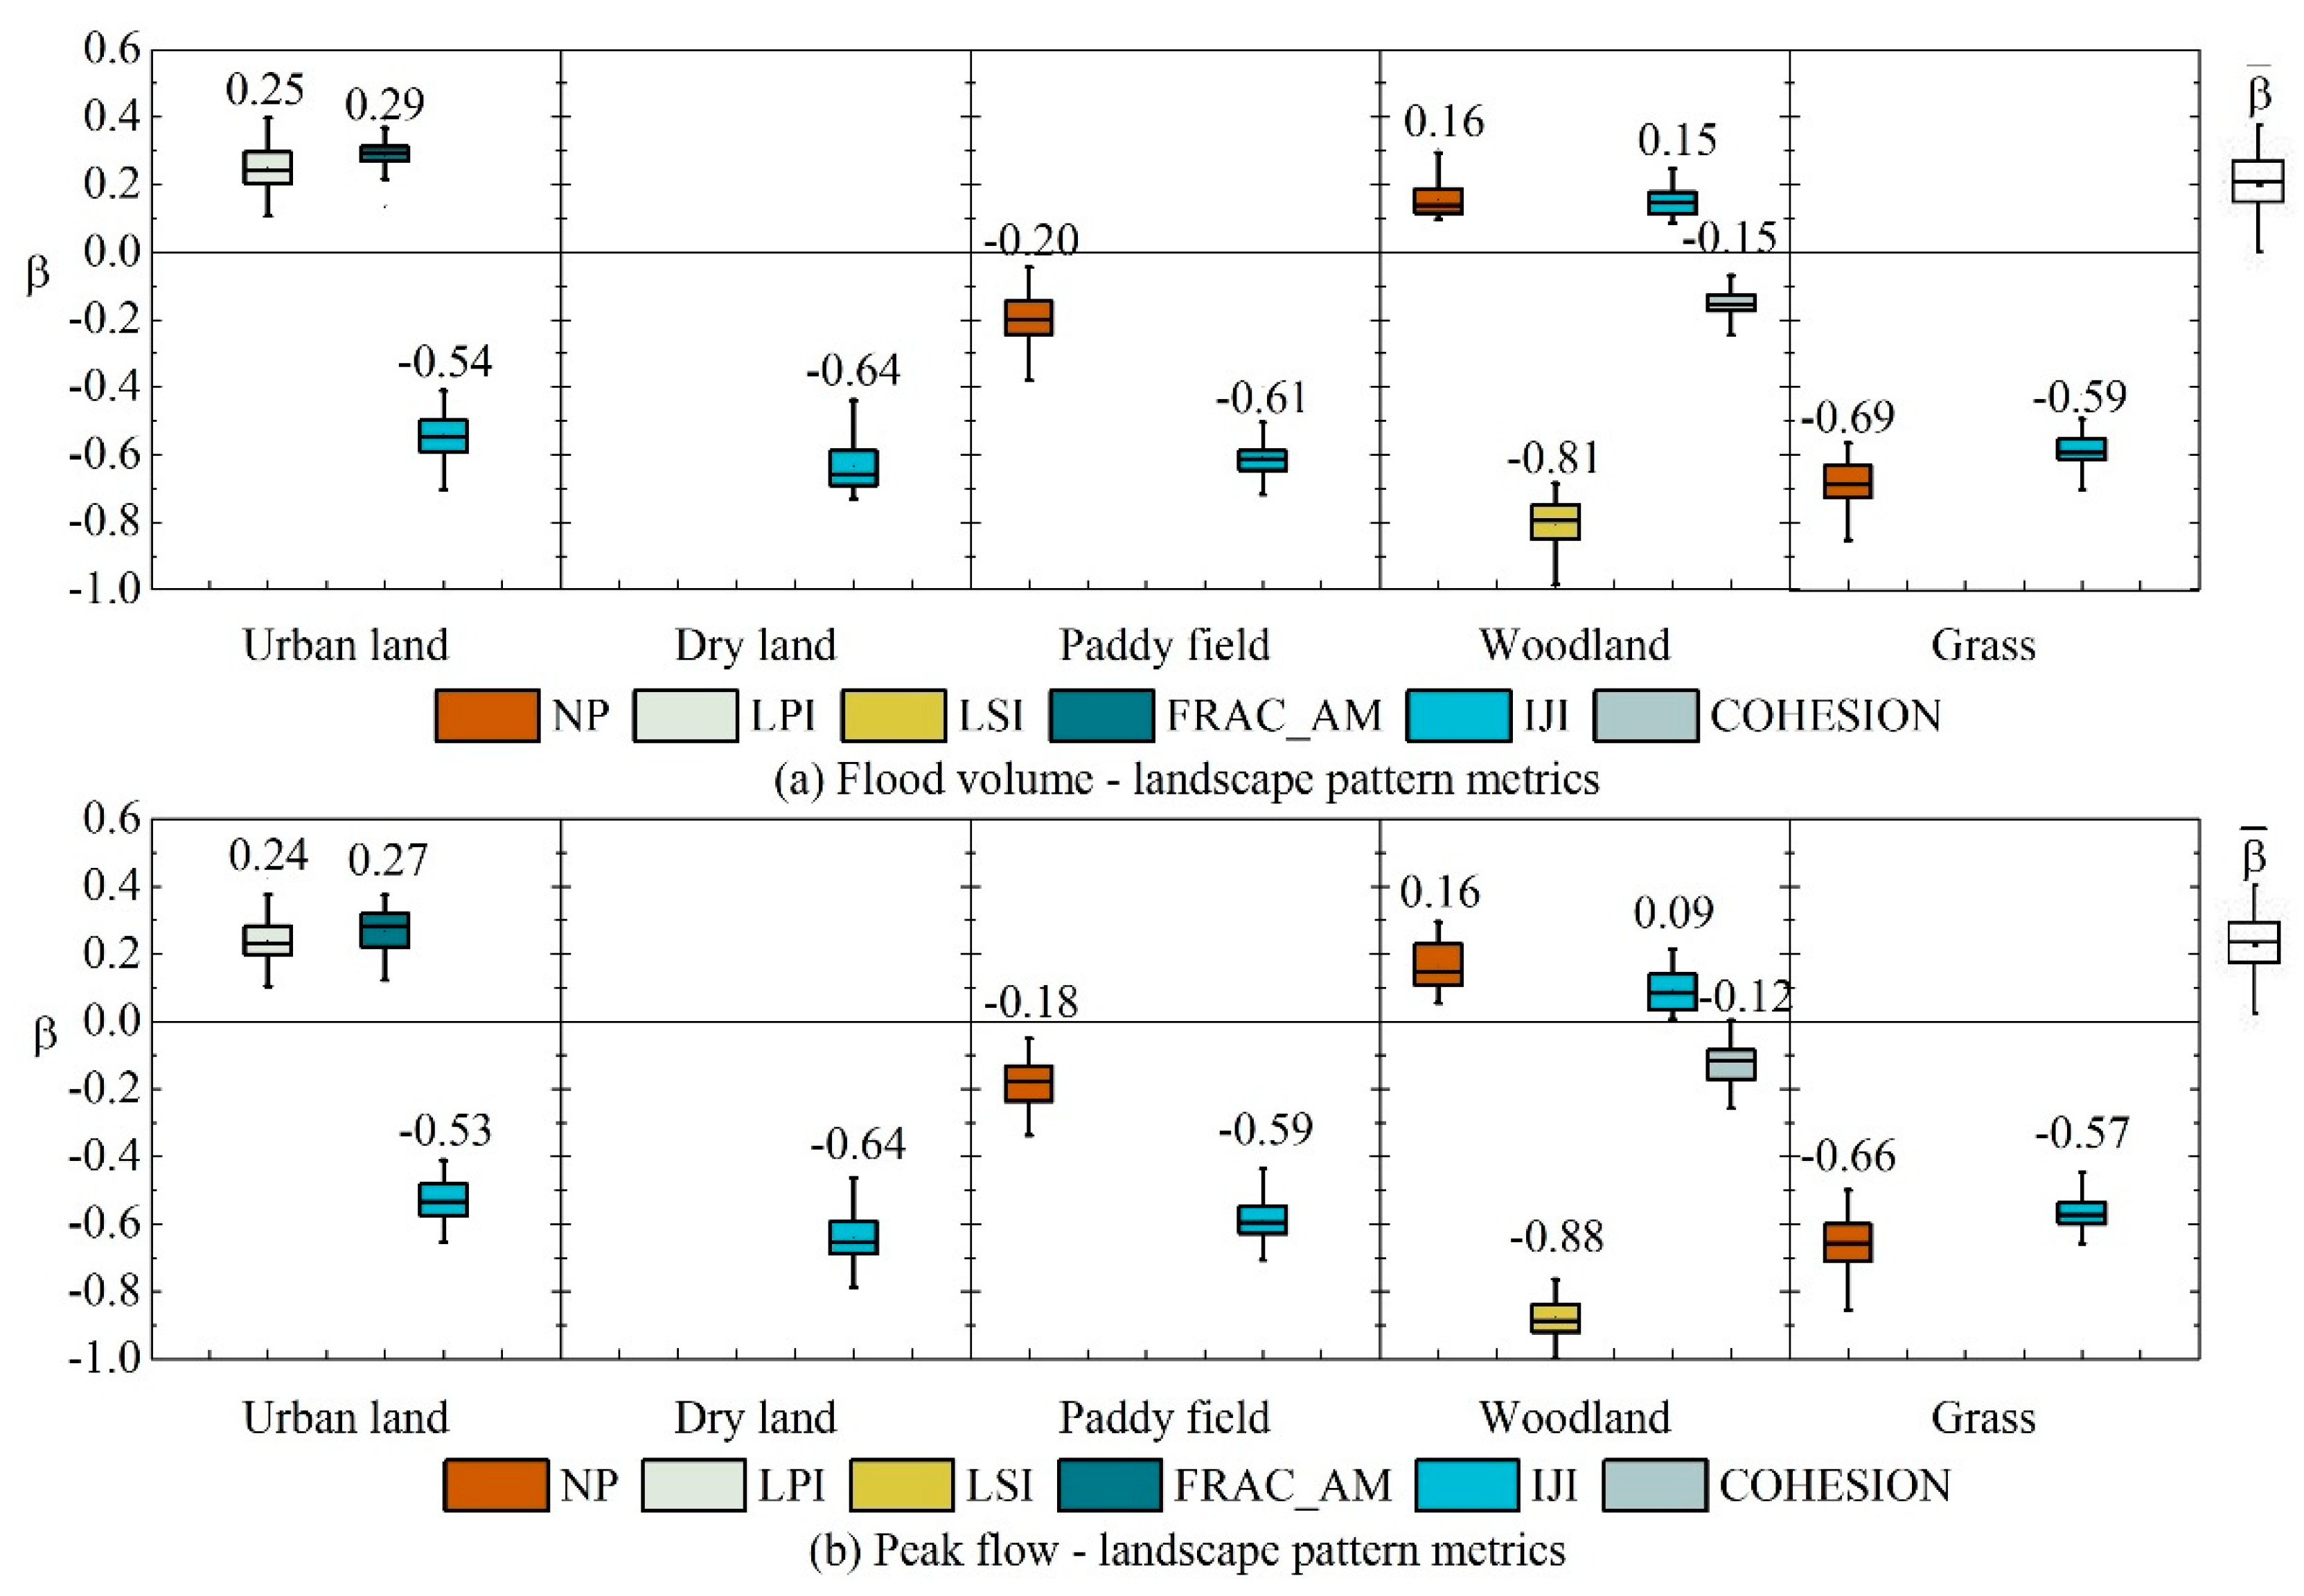
Based on the above correlation analysis results, the multiple linear regression analysis was performed. Figure 7 shows the statistical regression analysis results between flood and the relevant landscape metrics of different landscapes. was used to measure the effect degree.
Taking urban land as an example, for flood volume, = 0.25, = 0.29, = −0.54, for peak flow, = 0.24, = 0.27, = −0.53, which means, with the urban land area increase, the increase of LPI and FRAC_AM and the decrease of IJI have positive relationships with the increase of flood volume and peak flow. In the urbanization process, combining the ecological significance of the landscape metrics [27], the increase of LPI reflects the increase of connectivity, which is mainly caused by the increase of urban land area and the construction of roads. The increase of FRAC_AM reflects the increase of complexity of the urban land boundary, which is mainly caused by the expansion of urban land to other landscape types. The decrease of IJI reflects the decrease of contact area between urban landscape patches and other types of patches, which is mainly caused by the distribution of urban landscape patches gradually centralized from scattered, large urban landscape patches formed, landscape types around urban landscape decreased and regional landscape simplified. The above urban landscape pattern changes increase the runoff yield and flow concentration efficiency on urban land, weaken the effect of friction between urban land and other landscapes on the flood evolution, and reduce the loss and infiltration in the process of evolution. Besides, was larger than and , which means that the urban landscape pattern characteristic reflected by IJI has a more significant effect on flood than the characteristics reflected by LPI and FRAC_AM.
3.4. ERI_FL Change at Watershed Scale
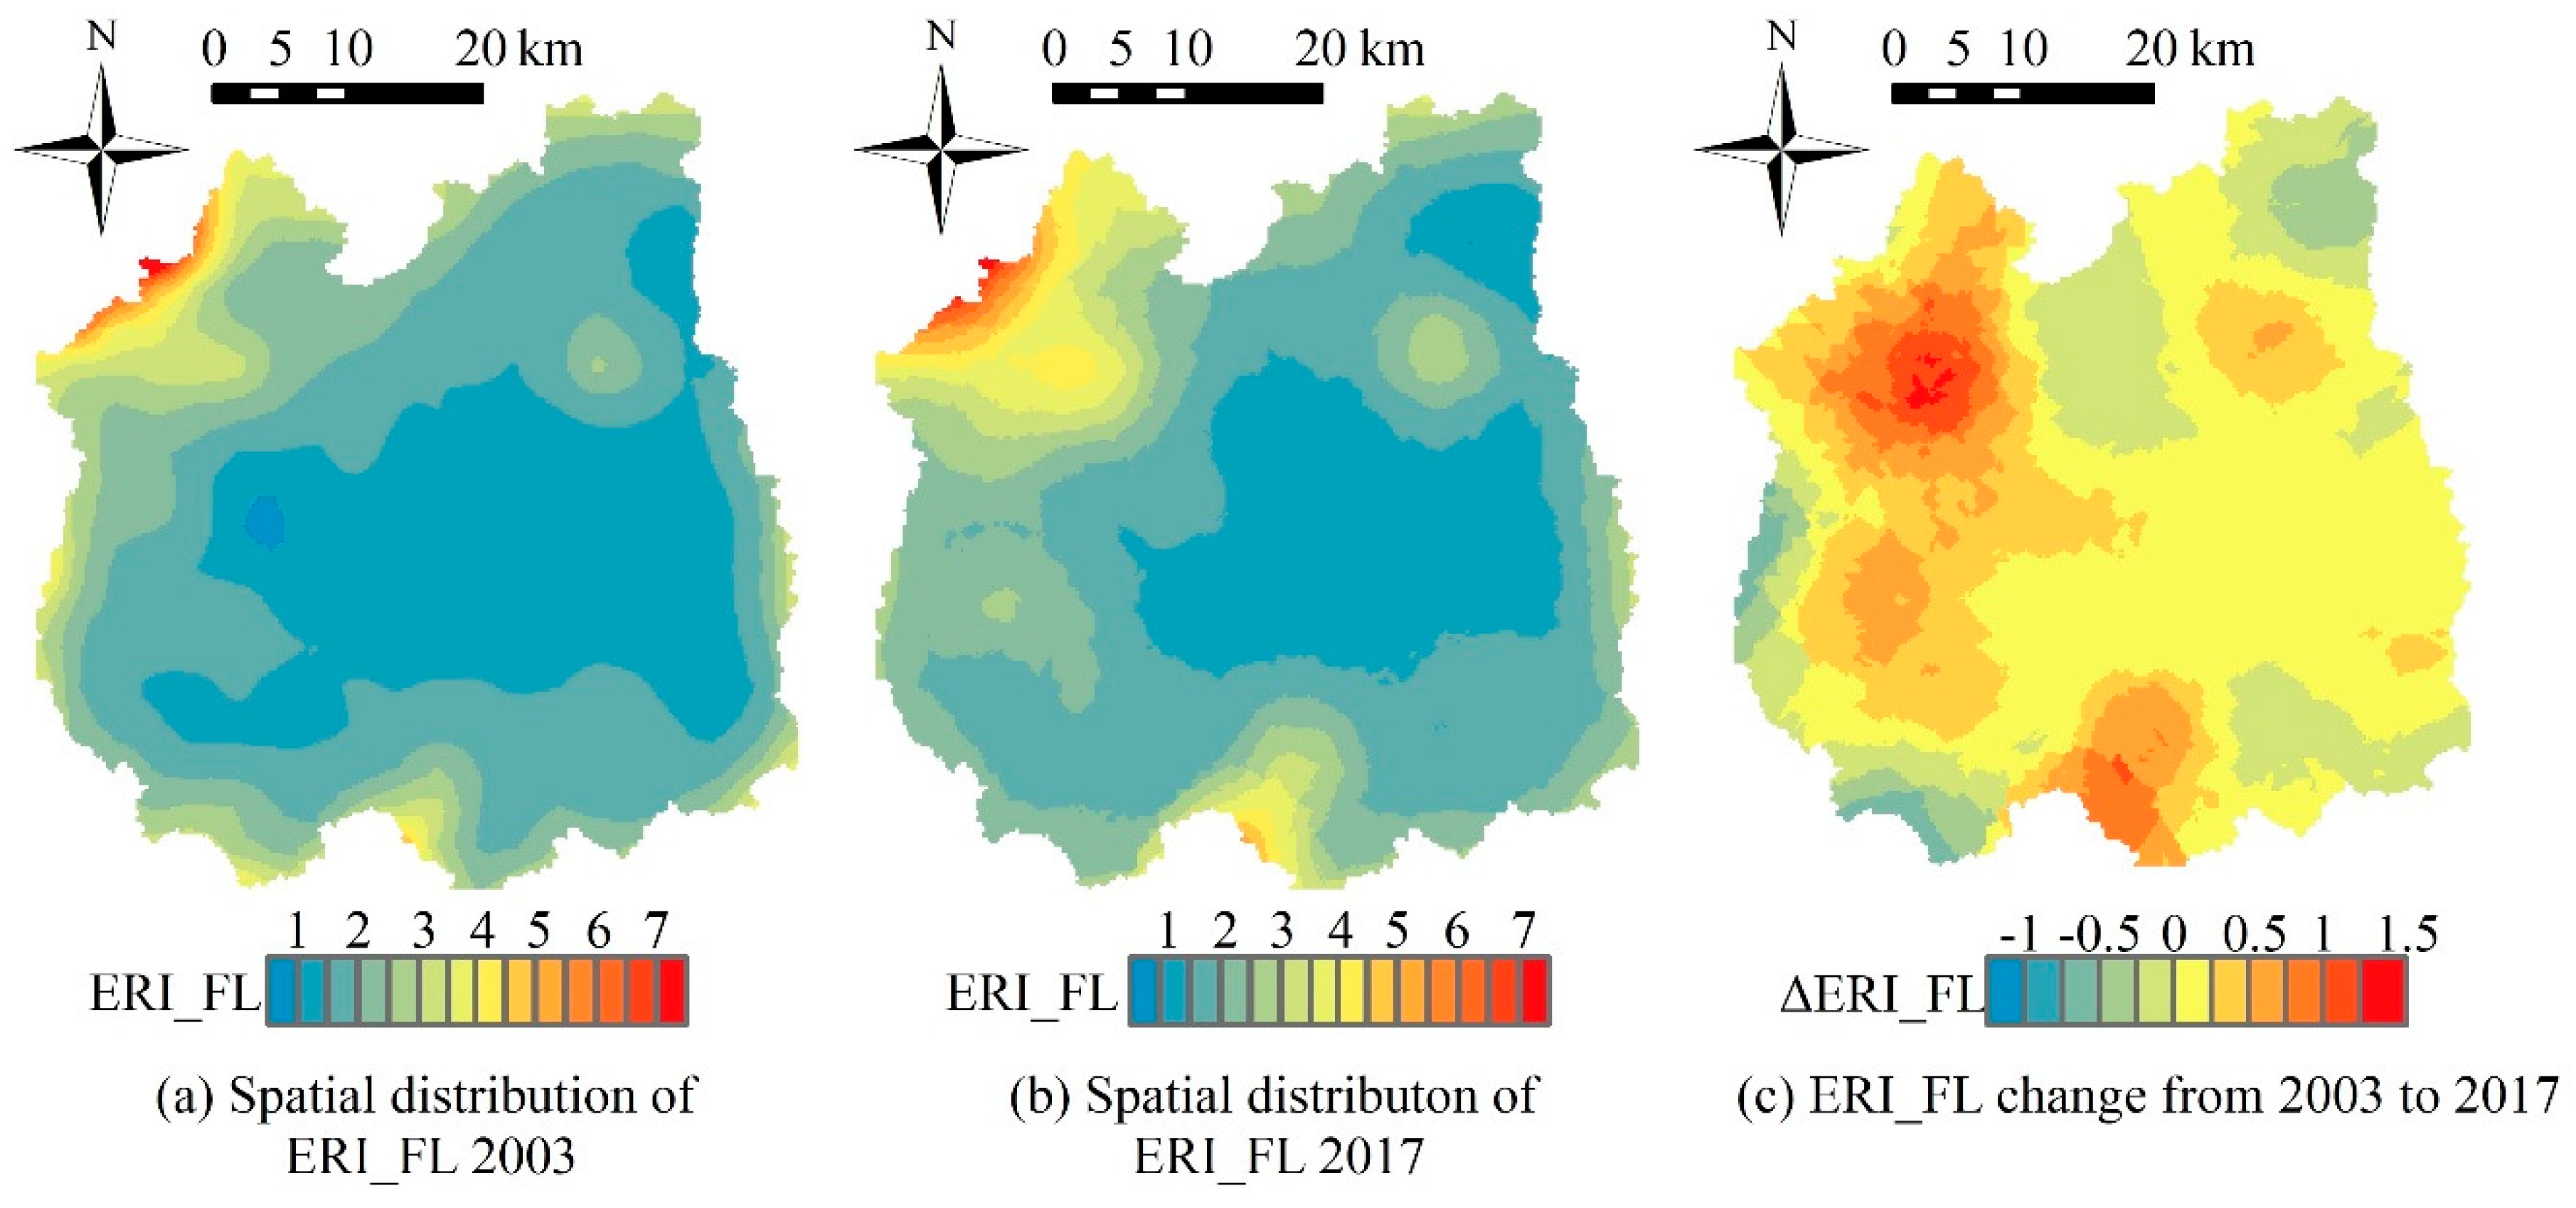
The ERI_FL of all sample cells for 2003 and 2017 were calculated based on the calculation method constructed in Section 2.2.4 and the results from Section 3.3. Then, the spatial distributions of ERI_FL for 2003 (Figure 8a) and 2017 (Figure 8b) were drawn by using kriging interpolation. The average value of ERI_FL for 2003 was 2.13, and for 2017 was 2.74. The percentage of urban land area for 2003 was 12.4%, and for 2017 was 20.5%. In 2003, most parts of the study area were at low risk, the medium and higher risk zones were mainly located in the northwest of the basin (central part of Nanjing City) and some regions in the upper reaches (central parts of Jurong City and Lishui City). From Figure 2a, it was clear to see that the above three regions were the main distribution areas of urban land in Qinhuai River basin. In 2017, most parts were still at low risk, the areas of the medium and higher risk zones were increased, which were mainly expanded from the medium and higher risk zones of 2003. FLER increased as the urbanization increased, and the distribution of FLER showed spatial difference at watershed scale.
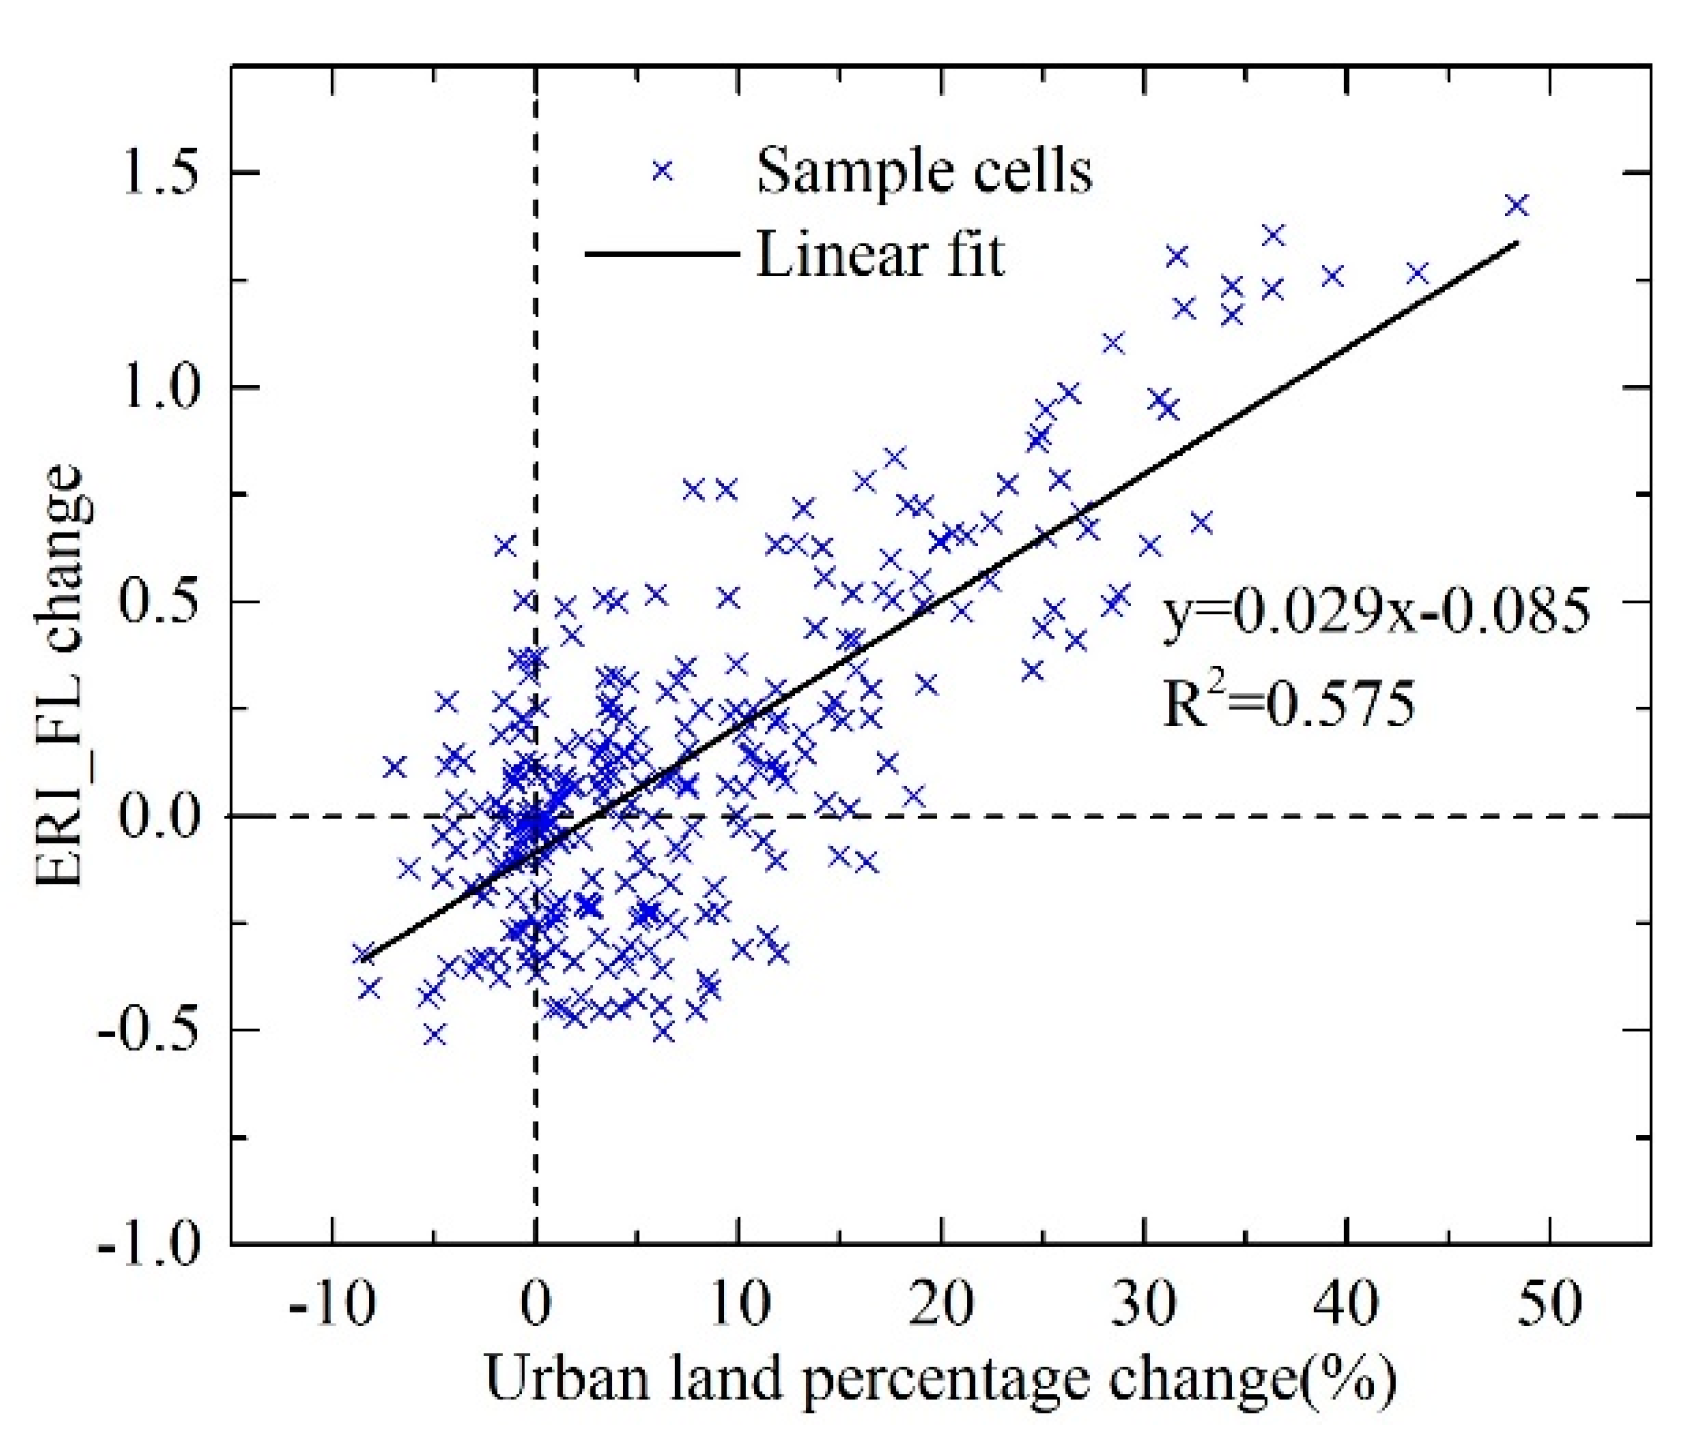
Figure 8c shows the spatial change of ERI_FL from 2003 to 2017. There were mainly four increase regions of ERI_FL value, which were located in the northeast, south, west, and northwest of the basin, respectively. But for most parts of the basin, the ERI_FL absolute value change was insignificant (less than 0.5). Figure 9 shows the urban land percentage change and ERI_FL value change of all the sample cells and the linear fitting result between them. The R-square value of the linear fitting result was 0.575, which is acceptable [17]. The FLER change magnitude had a positive relationship with urban land percentage change magnitude, and the distribution of FLER change also showed spatial differences at watershed scale.
3.5. Comparative Analysis of ERI_FL Change at Sub-Basin Scale
In order to further discuss the effects of structural features of landscape pattern on the spatial distribution of ERI_FL, this section selected sub-basin 7 and sub-basin 8 of Qinhuai River basin to perform the study. Figure 10a,c show the 2017 landscape distributions and the proportions of different landscapes of the two sub-basins. The areas of sub-basin 7 (193 km2) and sub-basin 8 (189 km2) were similar, and the proportions of different landscapes of the two sub-basins for 2017 were also similar. Urban land, paddy field, and dry land are the main landscape types in the two sub-basins.
According to Figure 10a,c, for sub-basin 7, urban land and paddy field mainly clustered in the middle and north regions, dry land mainly clustered in the middle region and partly scattered in the south. For sub-basin 8, compared with sub-basin 7, the distribution of urban land, paddy field, and dry land was relatively scattered on the whole area. Figure 10b,d show the ERI_FL spatial distributions of the two sub-basins. The average value of ERI_FL for sub-basin 7 was 2.24, while for sub-basin 8 was 1.60. In general, the FLER of the whole region for sub-basin 7 was higher than that for sub-basin 8, even the areas of the two sub-basins and proportions of different landscapes of the two sub-basins for 2017 were similar. For sub-basin 7, the risk in the middle region was higher, and for sub-basin 8, the higher risk zones were located in the northwestern region; both of the above regions were the regional clustered areas of urban land. For sub-basin 8, the middle-southern region was also the regional clustered area of urban land, but the northwestern region was the boundary of Nanjing City, which means that the northwest was near the large urban land patch, so that the risk in the middle south was lower than that in the northwest. The risk in the southwestern region of sub-basin 7 was also higher, and the possible reason is that this region is the edge of Qinhuai River basin, with higher area of blank in the sample cells, and higher calculation error is caused by this.
Based on the above analysis, under the condition that the areas of different landscapes are basically the same, the structure of landscape pattern has an important impact on the regional FLER. In the urbanization process, avoiding forming large-scale landscape patches, improving landscape abundance around landscapes patches, and increasing contact area among different kinds of landscape patches can be helpful to reduce the negative effects caused by the increase of urban landscape area on flood ecological risk and make full use of the positive ecological effects of landscape on hydrological process.
4. Summary and Conclusions
This study constructed a spatial modeling framework for the assessment of FLER, which includes the following aspects. The HEC-HMS hydrological model is used to simulate the flood process under different landscape distribution scenarios. Six landscape metrics are selected to measure the regional historical landscape patterns. Based on the correlation and regression analysis method, the relationship between landscape metrics and flood eigenvalues are constructed. The ERI_FL index is proposed and constructed to quantify the FLER. The semivariogram analysis method is used to interpolate the ERI_FL values into the whole watershed to analyze the FLER change at a spatial scale. The 2003 and 2017 historical landscape distributions of Qinhuai River basin were used as a case study to perform the FLER analysis. The results were summarized as follows:
Firstly, there was a certain relationship between landscape pattern and flood eigenvalues, for different landscape, the response metrics and degrees were different.
Secondly, with the improvement of urbanization level, FLER increased and showed significant spatial difference at a watershed scale. The FLER change magnitude had a positive relationship with urban land percentage change magnitude, and distribution of FLER change also showed spatial difference at a watershed scale.
Thirdly, under the condition that the areas of different landscapes were basically the same, the structure of landscape pattern had an important impact on the regional FLER. In the urbanization process, avoiding forming large-scale landscape patches, improving landscape abundance around landscapes patches, and increasing contact area among different kinds of landscape patches can be helpful to reduce the negative effects caused by the increase of urban landscape area on flood ecological risk and make full use of the positive ecological effects of landscape on hydrological process.
For decreasing the flood and ecological risks caused by the change of landscape pattern in the urbanization process, the speed of urbanization needs to be slowed down, and unified, long-term planning is necessary to guide urban construction. Urban construction should be proceeded within a defined framework, rather than via large-scaled or random, scattered construction. For example, some researchers have proposed that the idea of green infrastructure is a useful tool [29,30]. A well-designed green infrastructure can play a positive role in regional FLER control. On the one hand, green infrastructure can be helpful in absorbing and storing rain, and thus reduce surface runoff and mitigate flood. On the other hand, it can improve landscape connectivity and diversity by bridging different patches of green landscape and connecting green landscape with other landscapes.
Besides, as for the researches on analyzing the relationship among landscape pattern, flood disasters, and ecological risk at a watershed scale and quantitatively assessing the flood ecological risk based on landscape pattern characteristics, the modeling framework constructed in this study can provide a useful reference and new perspective. The results concluded in this study can also provide useful information on regional landscape planning and flood control planning at a watershed scale.
Author Contributions
Conceptualization, Y.Y.; Data curation, Y.Y. and M.Y.; Formal analysis, Y.Y. and M.Y.; Funding acquisition, Y.Y. and G.F.; Investigation, Y.Y. and Z.D.; Methodology, Y.Y. and Z.D.; Project administration, Y.Y.; Resources, Y.Y.; Software, Y.Y. and C.S.; Supervision, G.F.; Validation, Y.Y. and C.L.; Visualization, Z.D.; Writing—original draft, Y.Y.; Writing—review & editing, G.F. and C.S.
Funding
This research was funded by the Fundamental Research Funds for the Central Universities (No. 2017B686X14), the Postgraduate Research & Practice Innovation Program of Jiangsu Province (KYCX17_0427), the program of China Scholarships Council (No. 201806710033), the Priority Academic Program Development of Jiangsu Higher Education Institutions.
Conflicts of Interest
The authors declare no conflict of interest.
References
- Zlotnik, H. World Urbanization: Trends and Prospects. New Forms of Urbanization; Routledge: London, UK, 2017; pp. 43–64. [Google Scholar]
- Du, J.; Qian, L.; Rui, H.; Zuo, T.; Zheng, D.; Xu, Y.; Xu, C.Y. Assessing The Effects of Urbanization on Annual Runoff and Flood Events Using An Integrated Hydrological Modeling System for Qinhuai River Basin, China. J. Hydrol. 2012, 464–465, 127–139. [Google Scholar] [CrossRef]
- Zhou, F.; Xu, Y.; Chen, Y.; Xu, C.Y.; Gao, Y.; Du, J. Hydrological Response to Urbanization at Different Spatio-Temporal Scales Simulated by Coupling of Clue-S and the Swat Model in the Yangtze River Delta Region. J. Hydrol. 2013, 485, 113–125. [Google Scholar] [CrossRef]
- Salvadore, E.; Bronders, J.; Batelaan, O. Hydrological Modelling of Urbanized Catchments: A Review and Future Directions. J. Hydrol. 2015, 529, 62–81. [Google Scholar] [CrossRef]
- Zhang, W.; Villarini, G.; Vecchi, G.A.; Smith, J.A. Urbanization Exacerbated the Rainfall and Flooding Caused by Hurricane Harvey in Houston. Nature 2018, 563, 384. [Google Scholar] [CrossRef] [PubMed]
- Lee, Y.-C.; Ahern, J.; Yeh, C.-T. Ecosystem Services in Peri-Urban Landscapes: The Effects of Agricultural Landscape Change on Ecosystem Services in Taiwan’s Western Coastal Plain. Landsc. Urban Plan. 2015, 139, 137–148. [Google Scholar] [CrossRef]
- Feng, Y.; Liu, Y.; Tong, X. Spatiotemporal Variation of Landscape Patterns and Their Spatial Determinants in Shanghai, China. Ecol. Indic. 2018, 87, 22–32. [Google Scholar] [CrossRef]
- Dadashpoor, H.; Azizi, P.; Moghadasi, M. Land Use Change, Urbanization, and Change in Landscape Pattern in A Metropolitan Area. Sci. Total Environ. 2019, 655, 707–719. [Google Scholar] [CrossRef]
- Zhou, Z.X.; Li, J. The Correlation Analysis on the Landscape Pattern Index and Hydrological Processes in the Yanhe Watershed, China. J. Hydrol. 2015, 524, 417–426. [Google Scholar] [CrossRef]
- Peng, Y.; Wang, Q.; Wang, H.; Lin, Y.; Song, J.; Cui, T.; Fan, M. Does Landscape Pattern Influence the Intensity of Drought and Flood? Ecol. Indic. 2019, 103, 173–181. [Google Scholar] [CrossRef]
- Kim, H.W.; Park, Y. Urban Green Infrastructure and Local Flooding: The Impact of Landscape Patterns on Peak Runoff in Four Texas Msas. Appl. Geogr. 2016, 77, 72–81. [Google Scholar] [CrossRef]
- Xue, X.; Qian, H. Advance and Current Core Issues in Riverscape Ecology. Adv. Water Sci. 2018, 29, 887–897. [Google Scholar]
- Burley, J.B.; Wang, Y.; Loures, L. New Ecologies: Emergence of the Urban Savanna and Cliff Detritus in A Post Post-Modern Era. In New Models for Innovative Management Urban Dynamics; Universidade do Algarve: Faro, Portugal, 2009; pp. 10–18. [Google Scholar]
- Chen, F.; Li, H.; Zhang, A. Ecological Risk Assessment Based on Terrestrial Ecosystem Services in China. Acta Geogr. Sin. 2019, 74, 432–445. [Google Scholar]
- Peng, J.; Pan, Y.; Liu, Y.; Zhao, H.; Wang, Y. Linking Ecological Degradation Risk to Identify Ecological Security Patterns in A Rapidly Urbanizing Landscape. Habitat Int. 2018, 71, 110–124. [Google Scholar] [CrossRef]
- Jin, X.; Jin, Y.; Mao, X. Ecological Risk Assessment of Cities on the Tibetan Plateau Based on Land Use/Land Cover Changes—Case Study of Delingha City. Ecol. Indic. 2019, 101, 185–191. [Google Scholar] [CrossRef]
- Hu, H.; Liu, H.; Hao, J. The Urbanization Effects on Watershed Landscape Structure and Their Ecological Risk Assessment. Acta Ecol. Sin. 2011, 31, 3432–3440. [Google Scholar]
- Xue, L.; Zhu, B.; Wu, Y.; Wei, G.; Liao, S.; Yang, C.; Wang, J.; Zhang, H.; Ren, L.; Han, Q. Dynamic Projection of Ecological Risk in the Manas River Basin Based on Terrain Gradients. Sci. Total Environ. 2019, 653, 283–293. [Google Scholar] [CrossRef] [PubMed]
- Gao, Y.; Guo, Z.; Wang, D.; Zhang, Z.; Liu, Y. Multivariate Flood Risk Analysis at A Watershed Scale Considering Climatic Factors. Water 2018, 10, 1821. [Google Scholar] [CrossRef]
- Halwatura, D.; Najim, M. Application of the Hec-Hms Model for Runoff Simulation in A Tropical Catchment. Environ. Model. Softw. 2013, 46, 155–162. [Google Scholar] [CrossRef]
- Meenu, R.; Rehana, S.; Mujumdar, P.P. Assessment of Hydrologic Impacts of Climate Change in Tunga-Bhadra Basin, India with Hec-Hms and Sdsm. Hydrol. Process. 2013, 27, 1572–1589. [Google Scholar] [CrossRef]
- Yuan, Y.; Gao, Y.; Wu, X. Flood Simulation of Flood Control Model for Polder Type Based on Hec_Hms Hydrological Model in Qinhuai River Basin. J. China Three Gorges Univ. Nat. Sci. 2015, 37, 34–39. [Google Scholar]
- Yusop, Z.; Chan, C.H.; Katimon, A. Runoff Characteristics and Application of Hec-Hms for Modelling Stormflow Hydrograph in An Oil Palm Catchment. Water Sci. Technol. 2011, 56, 41–48. [Google Scholar] [CrossRef]
- Fang, G.; Yuan, Y.; Gao, Y.; Huang, X.; Guo, Y. Assessing The Effects of Urbanization on Flood Events with Urban Agglomeration Polders Type of Flood Control Pattern Using the Hec-Hms Model in the Qinhuai River Basin, China. Water 2018, 10, 1003. [Google Scholar] [CrossRef]
- Gao, Y.; Yuan, Y.; Wang, H.; Schmidt, A.R.; Wang, K.; Ye, L. Examining the Effects of Urban Agglomeration Polders on Flood Events in Qinhuai River Basin, China with Hec-Hms Model. Water Sci. Technol. 2017, 75, 2130–2138. [Google Scholar] [CrossRef]
- Song, M.; Du, J.; Zheng, W.; Li, C.; Bian, G. Quantifying the Spatial-Temporal Changes of Impervious Surface Landscape Pattern from1988 to 2015 in Qinhuai River Basin. J. Geo-Inf. Sci. 2017, 19, 238–247. [Google Scholar]
- Mcgarigal, K. Fragstats Help; Documentation for Fragstats; Department of Environmental Conservation of University of Massachusetts: Amherst, MA, USA, 2014. [Google Scholar]
- Yang, Y.; Shang, S.; Li, C. Correcting the Smoothing Effect of Ordinary Kriging Estimates in Soil Moisture Interpolation. Adv. Water Sci. 2010, 21, 208–213. [Google Scholar]
- Su, M.; Zheng, Y.; Hao, Y.; Chen, Q.; Chen, S.; Chen, Z.; Xie, H. The Influence of Landscape Pattern on the Risk of Urban Water-Logging and Flood Disaster. Ecol. Indic. 2018, 92, 133–140. [Google Scholar] [CrossRef]
- Ernstson, H. The Social Production of Ecosystem Services: A Framework for Studying Environmental Justice and Ecological Complexity in Urbanized Landscapes. Landsc. Urban Plan. 2013, 109, 7–17. [Google Scholar] [CrossRef]
Figure 1.
Location of Qinhuai River basin and distribution of sub-basins.

Figure 2.
Landscape distribution maps and the sample cells.

Figure 3.
Spatial modeling framework for the evaluation of FLER (flood-landscape ecological risk). ERI_FL: flood-landscape ecological risk index.
Figure 3.
Spatial modeling framework for the evaluation of FLER (flood-landscape ecological risk). ERI_FL: flood-landscape ecological risk index.

Figure 4.
Sketch map of HEC-HMS model for Qinhuai River basin.

Figure 5.
The comparison of simulated and observed hydrographs.

Figure 6.
Box diagrams of correlation analysis results.

Figure 7.
Box diagrams of regression analysis results.

Figure 8.
Spatial distributions of ERI_FL for 2003 and 2017, and ERI_FL change from 2003 to 2017.

Figure 9.
The relationship between ERI_FL change and urban land percentage change from 2003 to 2017.
Figure 9.
The relationship between ERI_FL change and urban land percentage change from 2003 to 2017.

Figure 10.
Landscape and FLER distributions of no. 7 and 8 sub-basins.


Table 1.
The data used in the study.
| Data Types | Time Period | Resolution | Sources |
|---|---|---|---|
| Daily rainfall | 1986–2016 | 1 day | Resource and Environment Data Cloud Platform (http://www.resdc.cn) |
| Daily discharge | 1986–2016 | 1 day | |
| Soil data | 2009 | 1 km | Harmonized World Soil Database (Version 1.1) |
| Digital Elevation Model (DEM) | 2009 | 30 m | Geospatial Data Cloud site, Computer Network Information Center, Chinese Academy of Sciences (http://www.gscloud.cn) |
| Landscape distribution images | 1988, 1994, 1999, 2003, 2010, 2017 | 30 m |
Table 2.
Summary of validation results for flood simulation at daily step.
| Flood no. | Landscape Distribution Year | R | NSE | Dv | Dp |
|---|---|---|---|---|---|
| 19860611 | 1988 | 0.94 | 0.76 | 36.34% | 6.43% |
| 19870630 | 0.96 | 0.87 | 3.53% | −9.23% | |
| 19870819 | 0.95 | 0.80 | 18.27% | 13.64% | |
| 19880313 | 0.90 | 0.73 | −18.75% | 6.41% | |
| 19910629 | 0.83 | 0.83 | −3.81% | 20.21% | |
| 19930618 | 1994 | 0.94 | 0.79 | 25.44% | 0.39% |
| 19960623 | 0.99 | 0.89 | 29.32% | 2.60% | |
| 19990622 | 1999 | 0.95 | 0.70 | 11.66% | 15.37% |
| 20000524 | 0.96 | 0.82 | −27.46% | −13.81% | |
| 20020618 | 2003 | 0.98 | 0.98 | −0.29% | −6.95% |
| 20030626 | 0.98 | 0.85 | 22.88% | 12.84% | |
| 20060718 | 0.98 | 0.88 | 21.11% | 19.50% | |
| 20080615 | 2010 | 0.99 | 0.97 | 7.66% | 3.85% |
| 20100711 | 0.89 | 0.74 | −15.78% | −15.36% | |
| 20150712 | 2017 | 0.95 | 0.88 | 0.77% | −7.36% |
| 20160622 | 0.97 | 0.89 | −15.86% | 3.26% | |
| Average | 0.95 | 0.84 |
© 2019 by the authors. Licensee MDPI, Basel, Switzerland. This article is an open access article distributed under the terms and conditions of the Creative Commons Attribution (CC BY) license (http://creativecommons.org/licenses/by/4.0/).
Share and Cite
MDPI and ACS Style
Yuan, Y.; Fang, G.; Yan, M.; Sui, C.; Ding, Z.; Lu, C. Flood-Landscape Ecological Risk Assessment under the Background of Urbanization. Water 2019, 11, 1418. https://doi.org/10.3390/w11071418
AMA Style
Yuan Y, Fang G, Yan M, Sui C, Ding Z, Lu C. Flood-Landscape Ecological Risk Assessment under the Background of Urbanization. Water. 2019; 11(7):1418. https://doi.org/10.3390/w11071418
Chicago/Turabian StyleYuan, Yu, Guohua Fang, Min Yan, Chunming Sui, Ziyu Ding, and Chengxuan Lu. 2019. "Flood-Landscape Ecological Risk Assessment under the Background of Urbanization" Water 11, no. 7: 1418. https://doi.org/10.3390/w11071418
Note that from the first issue of 2016, this journal uses article numbers instead of page numbers. See further details here.