Different Stages of Aquatic Vegetation Succession Driven by Environmental Disturbance in the Last 38 Years
by
Hongwei Yu
1,2, 
Weixiao Qi
1,
Chunhua Liu
2,
Lei Yang
2,
Ligong Wang
2,
Tian Lv
2 and
Jianfeng Peng
1,* 1
Center for Water and Ecology, State Key Joint Laboratory of Environment Simulation and Pollution Control, School of Environment, Tsinghua University, Beijing 100084, China
2
The National Field Station of Freshwater Ecosystem of Liangzi Lake, Department of Ecology, College of Life Sciences, Wuhan University, Wuhan 430072, China
*
Author to whom correspondence should be addressed.
Water 2019, 11(7), 1412; https://doi.org/10.3390/w11071412
Submission received: 17 June 2019
/
Revised: 6 July 2019
/
Accepted: 8 July 2019
/
Published: 10 July 2019
(This article belongs to the Section Water Quality and Contamination)
Abstract
:In recent years, investigating the trend of aquatic plant diversity in response to different disturbance events has received increasing interest. However, there is limited knowledge of the different stages of aquatic vegetation succession over a long period in eutrophic lakes. In this study, we analyzed aquatic plant species richness and its relation to the physical and chemical characteristics of water in Chenghai Lake for the period of 1980–2018. This study shows that the richness and distribution of aquatic vegetation in Chenghai Lake are related to chlorophyll-a concentration, dissolved nutrients, base cations, and micronutrients. The results show that the long-term succession of aquatic plants in this lake classified in different stages: (I) A peak in species richness occurred at an intermediate stage that lasted from 1980 to 1992, and this was caused by more aquatic species being able to coexist since the competition for resources was lower; (II) after 26 years of secondary succession (1992–2018), the diversity and distribution area of aquatic plants gradually declined because pioneer species or human activities may have altered habitat conditions to render habitats less beneficial to pioneer species and more suitable for new aquatic plant species. Thus, species diversity and growth performance of aquatic plants in their communities may be useful indicators of Chenghai Lake’s trophic status, especially during the transition period from a mesotrophic lake to a eutrophic one.
1. Introduction
Aquatic macrophytes play an important role in the structure and function of lake ecosystems [1,2]. These plants include free-floating macrophytes, floating-leaved macrophytes, submersed macrophytes, and emergent macrophytes [3]. Aquatic macrophyte species are particularly important to aquatic environments because they provide energy to food-webs [4], promote sediment deposition [5], increase water clarity [6], facilitate nutrient cycling [7], and serve as habitats for a wide diversity of organisms [8]. Thus, aquatic macrophytes are particularly important to aquatic ecosystems for their contribution to ecosystem service functions and as ecosystem engineers [9,10]. However, the distribution and abundance of aquatic macrophytes have been significantly affected by environmental conditions and anthropogenic activities [11]. In addition, aquatic plants expand to new habitats by propagating [12]; for example, the facilitation of dispersal by hydrologic connectivity may result in aquatic plants having relatively easy access to different habitat [13].
It is important to understand the effect of disturbances (floods, drawdowns, etc.) on aquatic ecosystems. This is because human activity and climate change are altering disturbance regimes and placing increasing pressure on aquatic ecosystem construction and biodiversity [14,15]. Firstly, the important environmental factors for aquatic plants are ambient temperature, light, nutrients, and hydrology [11,16]. For example, stabilization of river water levels may negatively affect vegetation composition and succession in floodplain lakes because fluctuating water levels can promote propagation and diffusion of propagules [17]. Species richness in aquatic plant communities is most strongly related to nutrients or water temperature [18,19], and the community structure is also affected by variations in nutrient levels [11,20]. In general, the greatest species richness should occur in mesotrophic and eutrophic habits [18,21,22], but high nutrient levels may lead to the destruction of species richness because of competition for nutrients [7,23]. Thus, exploring the relationship between aquatic plants and the external environment is a complex problem.
There are many theories about the dynamics of species composition. For example, the intermediate disturbance hypothesis (IDH) is frequently invoked to explain the coexistence of a great number of plant species with intermediate levels of disturbance in natural communities [24]. While the IDH has been widely tested, there remains considerable discussion about the coexistence patterns of species after a disturbance [25,26,27]. As correlation with a disturbance may be dependent on its frequency, extent, intensity, and duration [28], and many hypotheses have been proposed to predict or explain successional pathways and explain patterns of biological diversity [15]. However, these hypothetical theories have different scopes of application [15]. Clarifying the process is further hampered by the complexity and variability of the ecosystems and disturbance events involved [15,29], as well as the fact that plant succession is a long-term dynamic process [30]. Thus, in order to predict the result of plant succession with more accuracy, we need to understand how species diversity is likely to change as disturbance regimes change over a long period of time.
In recent years, environmental problems have become increasingly serious. Environmentalists are interested in restoring the function of lake ecosystems by investigating the relationship between environmental factors and aquatic plant species richness and succession. Most studies on vegetation succession have mainly focused on terrestrial ecosystems [26,27,28]. Few studies have been conducted to verify the succession of aquatic vegetation [25], particularly by comparing long-term succession. To fill this research gap, we attempted to clarify several of these scientific problems in Chenghai Lake by (i) assessing the relationship between habitat conditions and aquatic plant species richness, (ii) exploring the mechanism of succession of aquatic vegetation, and (iii) predicting the changing trends of aquatic vegetation in the future. These data provide basic information for the monitoring, management, and control of aquatic ecosystems in Chenghai Lake.
2. Methods
2.1. Study Sites
Lake Chenghai (26°25′ N, 100°03′ E) in Yunnan Province, China, is a warm monomictic plateau lake (lake elevation: 1501 m; lake area: 78.8 km2; average width: 4.3 km; average depth: 25.7 m; maximum depth: 35.1 m; storage of lake: 1.98 billion m3). The lake basin is surrounded on three sides by mountain ranges (2300–2600 m a.s.l.) and a wide valley on its Southern side. The average annual rainfall in the region is 733 mm, most of which occurs between July and October during the summer monsoon period in Southwest Asia [31]. The lake was formed in the middle of the third generation of the Cenozoic era during the Himalayan period. The orogeny formed a fault graben, which was trapped in low water and then became a lake. The lake used to be an outflow lake and flowed Southward through the Cheng River and more than 30 km into the Jinsha River. Around 1690, the water level of Chenghai Lake suddenly and rapidly decreased, and it became an inland lake [32].
In recent years, the human induced economic development has produced negative effects on Chenghai Lake’s ecosystem. For example, the water quality of Chenghai Lake has gradually decreased, so the coverage and diversity of aquatic vegetation has declined. In addition, the invasion of Neosalanx taihuensis has led to the rapid disappearance of native fish species. The shore of Chenghai Lake has been affected by industrial production and other human activities. Pollution caused by agricultural and rural sources along the lakeside has caused serious destruction to the lakeside environment. Among the adverse effects, the decline of submerged macrophytes and the invasion of N. taihuensis are the most prominent problems in the ecosystem of Chenghai Lake.
2.2. Field Surveys
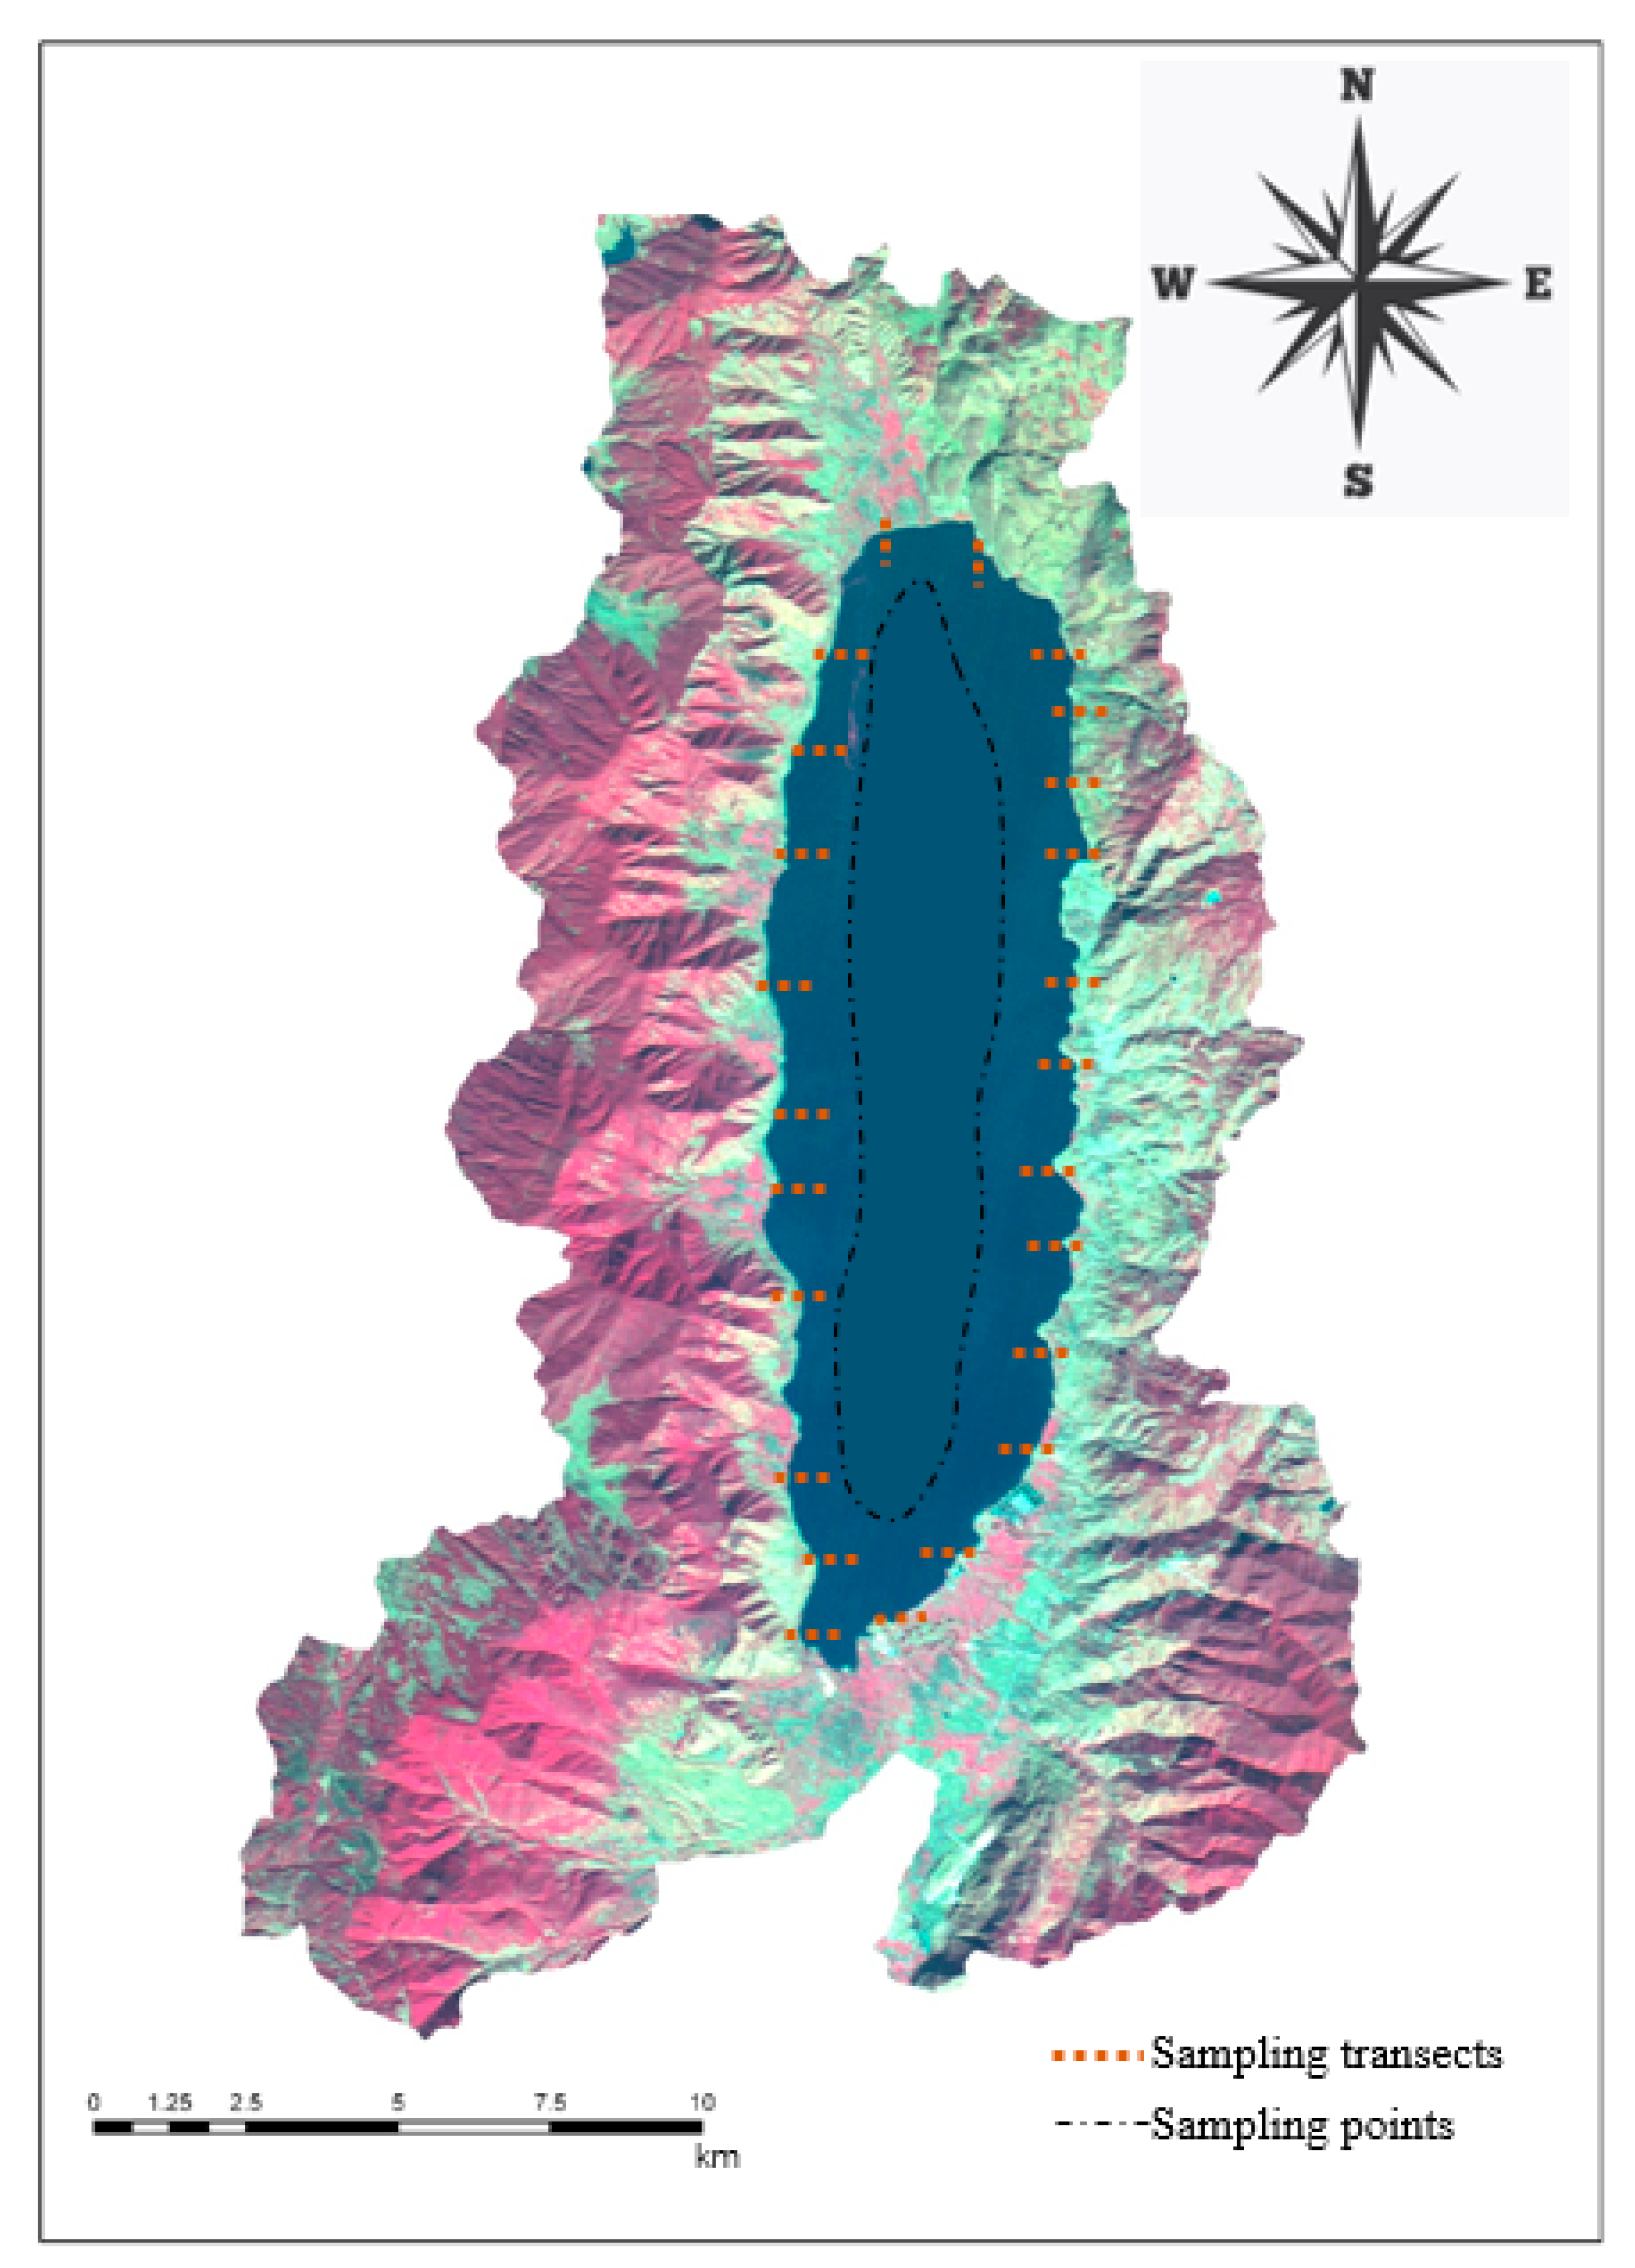
From June to August 2018, a field survey of the distribution of aquatic vegetation was performed along Chenghai Lake. We set up 24 transects along the lakeshore zone (Figure 1) for sampling. Each transect contained 4–6 quadrats (1 m × 1 m), and for each quadrat, the identities of all plants (including aboveground and belowground parts) were recorded. In addition, we used a professional submersed rake (diameter = 0.5 m, area = 0.2 m2) to collect aquatic vegetation from the deep-water area. We set up 69 sampling points along the deep-water area of the lake (Figure 1). The majority of individual plants of all species were uprooted in the mud within the sampling points. After the specimens were washed, those that were intact and healthy were carefully sorted and then stored in special sampling bags until all measurements were completed. We recorded the aquatic plants’ growth traits (coverage, phenological phase, plant height, and fresh weight, which were measured according to classic ecological methods [33,34]) in the quadrats, while the physical and chemical characteristics of the water were measured using a Professional Plus multiparameter instrument (YSI Incorporated, Ohio, OH, USA) and a portable turbidimeter (2100Q, HACH, Loveland, CO, USA). The typical process involved collecting water samples from quadrats and measuring the values of the nutrients and heavy metals in the laboratory. All plant samples were dried at 70 °C for >48 h to determine the total biomass.
2.3. Data Collection
2.4. Data Analyses
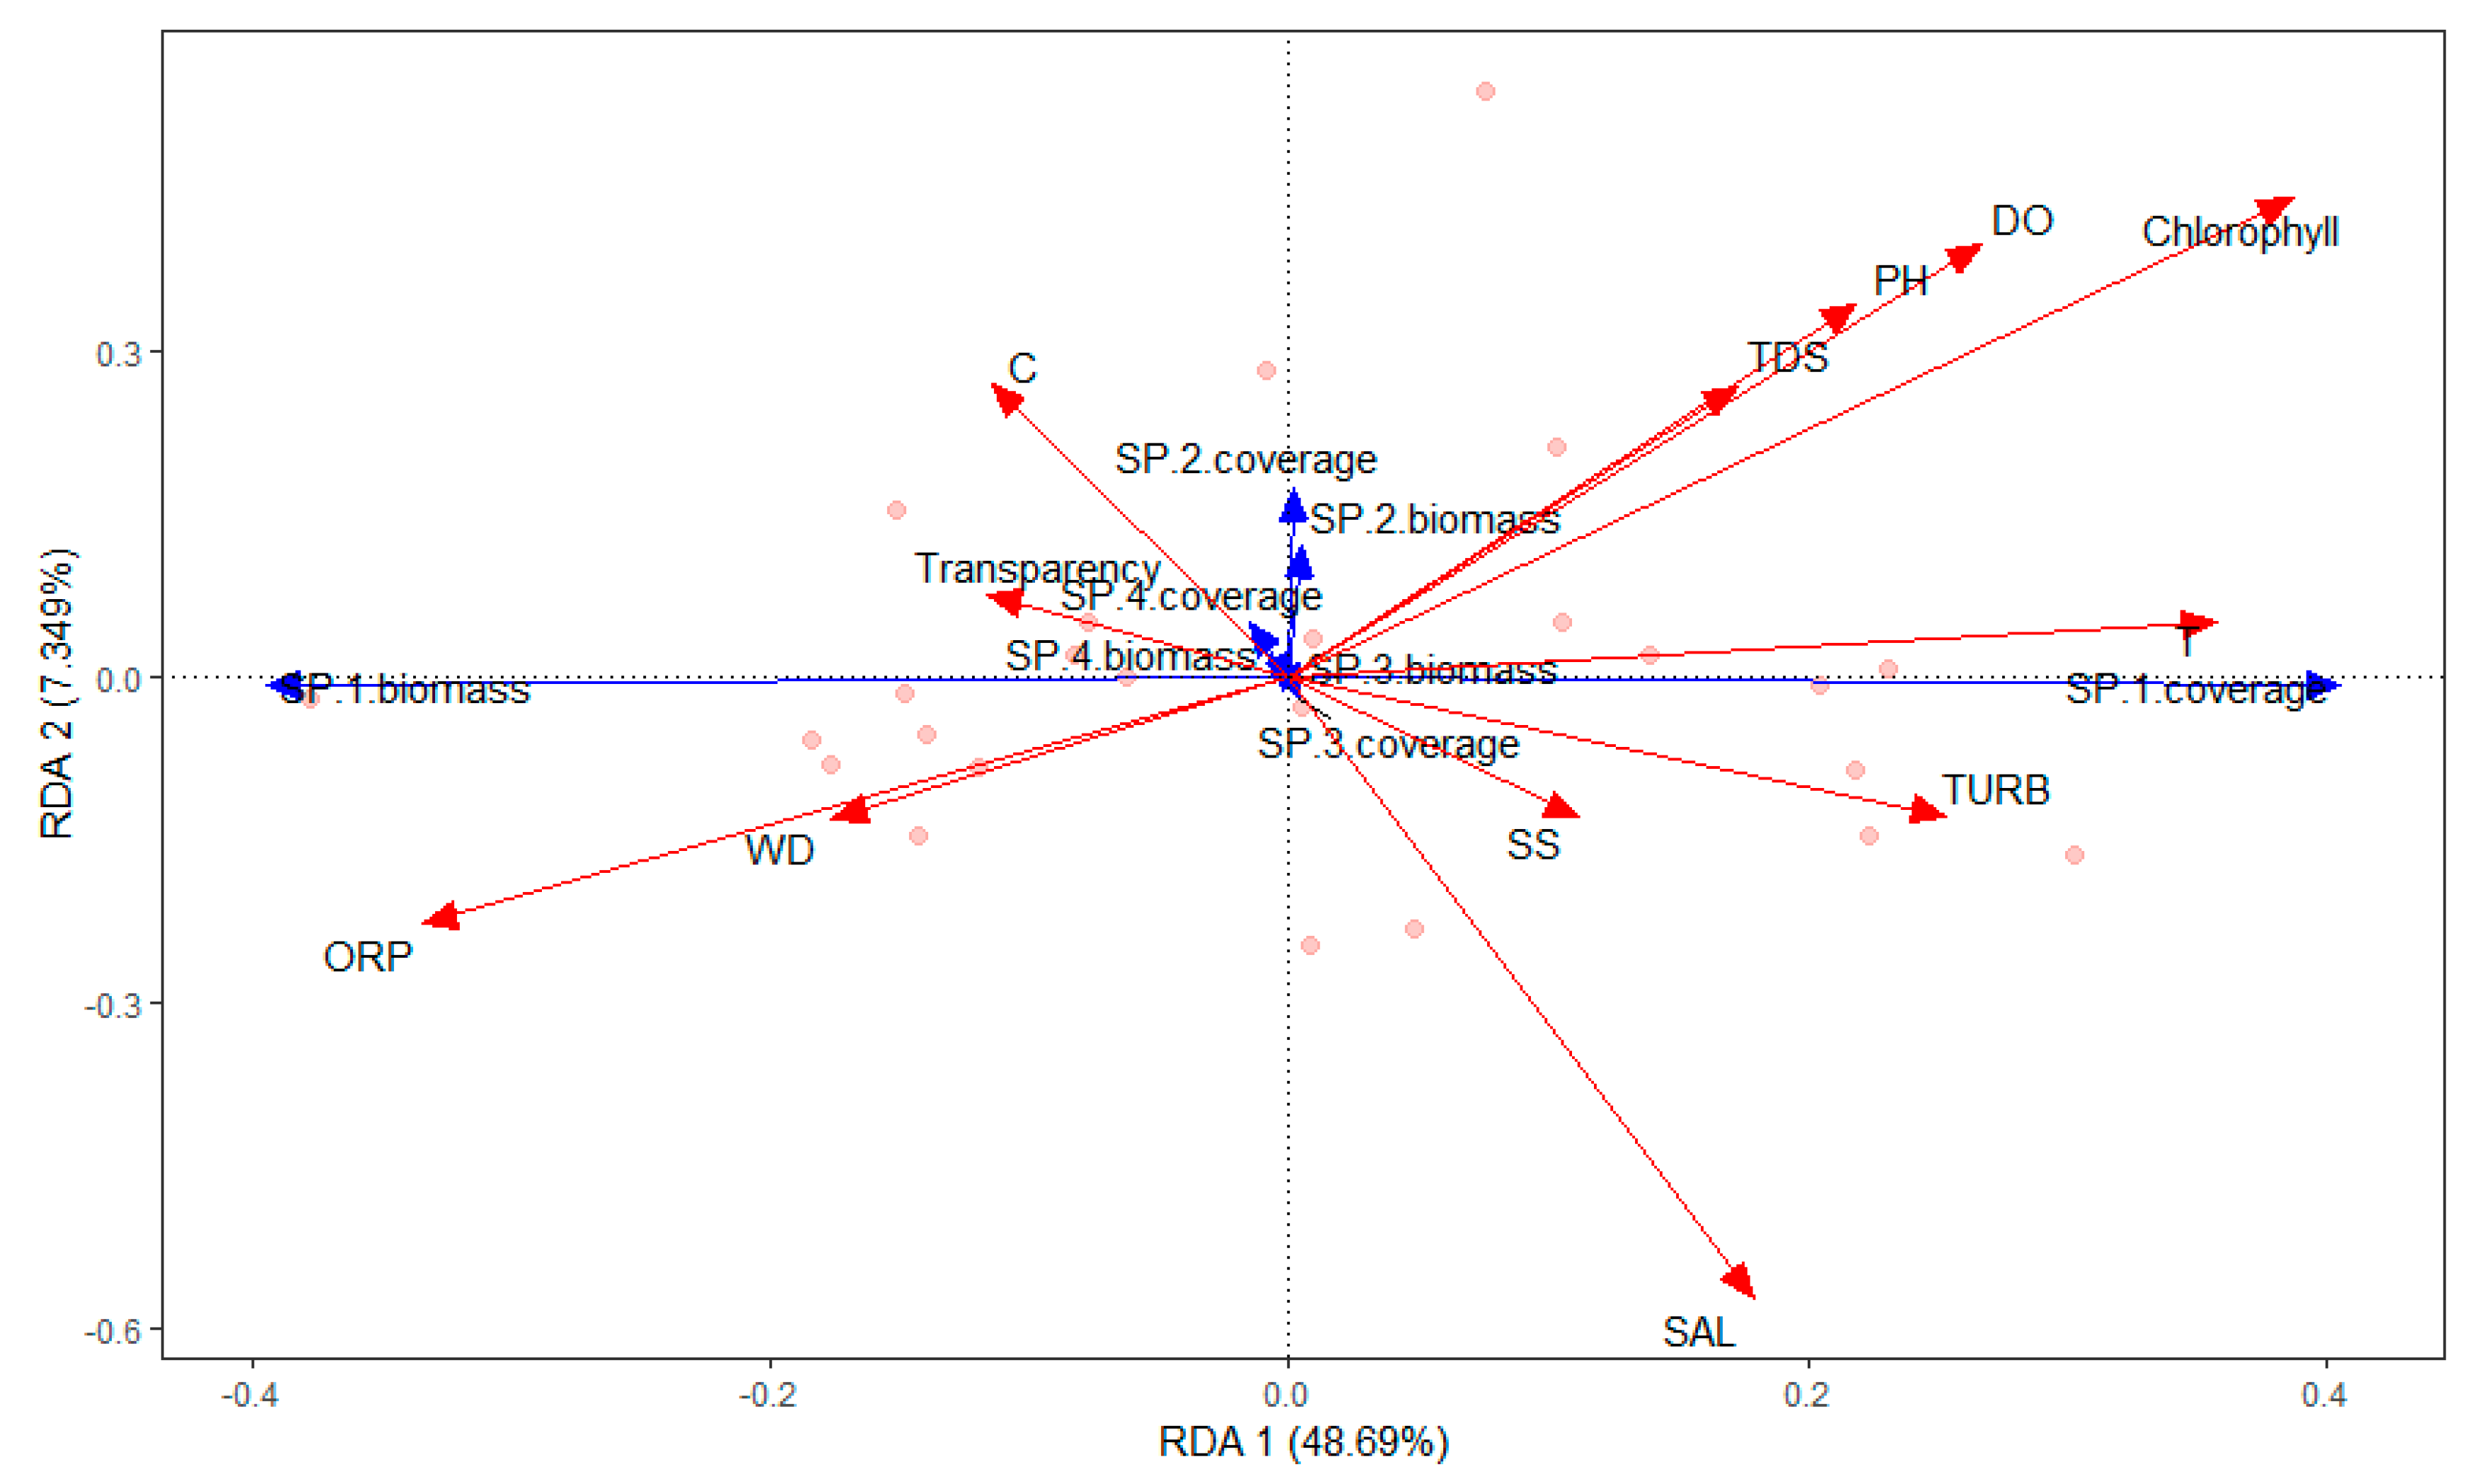
The variation in aquatic plant diversity and water quality from 1980 to 2018 was analyzed. Of the 175 quadrats, 25 were vegetated, and 150 were unvegetated. In 2018, redundancy analysis (RDA) was used to analyze the relationships between the different vegetation types (coverage, biomass) and abiotic water characteristics I: temperature (T), conductivity (C), dissolved oxygen (DO), total dissolved solids (TDS), pH, transparency, salinity (Sal), suspended solids (SS), oxidation–reduction potential (ORP), water depth (WD), turbidity (Turb), and chlorophyll-a; II: Cr, Ca, Zn, Cu, As, Na, Mg, and K; III: F−, SO42−, Br−, PO43−, NO3−, and Cl−; IV: Total organic carbon (TOC), chemical oxygen demand (COD), CaO, NH4-N, total dissolved phosphorus (TDP), total phosphorus (TP), total nitrogen (TN), and total dissolved nitrogen (TDN). RDAs were performed using the package “vegan” in R 3.4.2. We performed a standardized transformation of species data. Detrended correspondence analysis (DCA) was used to determine the RDA model. Variance inflation factor (Vif) analysis was applied to remove collinearity factors and gradually remove environmental factors (Vif > 10) from largest to smallest until all environmental factor Vif values were less than 10. The most suitable RDA model for the minimum AIC value was selected gradually by RDA. The result was plotted using “ggplot2” in R.
3. Results
3.1. Historical Data
3.1.1. Water Quality
3.1.2. Aquatic Macrophytes
The number of aquatic plant species over time was four (1980), five (1992), two (2010), and four (2018). Submerged vegetation types were dominated by Vallisneria natans in 1980. After 12 years, the dominant species were V. natans, Potamogeton crispus, and Potamogeton pectinatus, and the species richness peaked in 1992 (Table 1). However, the coverage and diversity of aquatic species declined sharply from 1992 to 2018. The survey found that new aquatic plants emerged (free-floating macrophytes: Lemna minor; submerged macrophytes: Zannichellia palustris), and the dominant species in 2018 was P. pectinatus (Table 1). The coverage of aquatic plants gradually declined between 1992 and 2018 (5.278–0.17 km2; Table 1). Thus, the composition and coverage of vegetation in the Chenghai Lake samples changed during the 38-year study period.
3.2. The Relationship between Aquatic Species and Water Quality in 2018
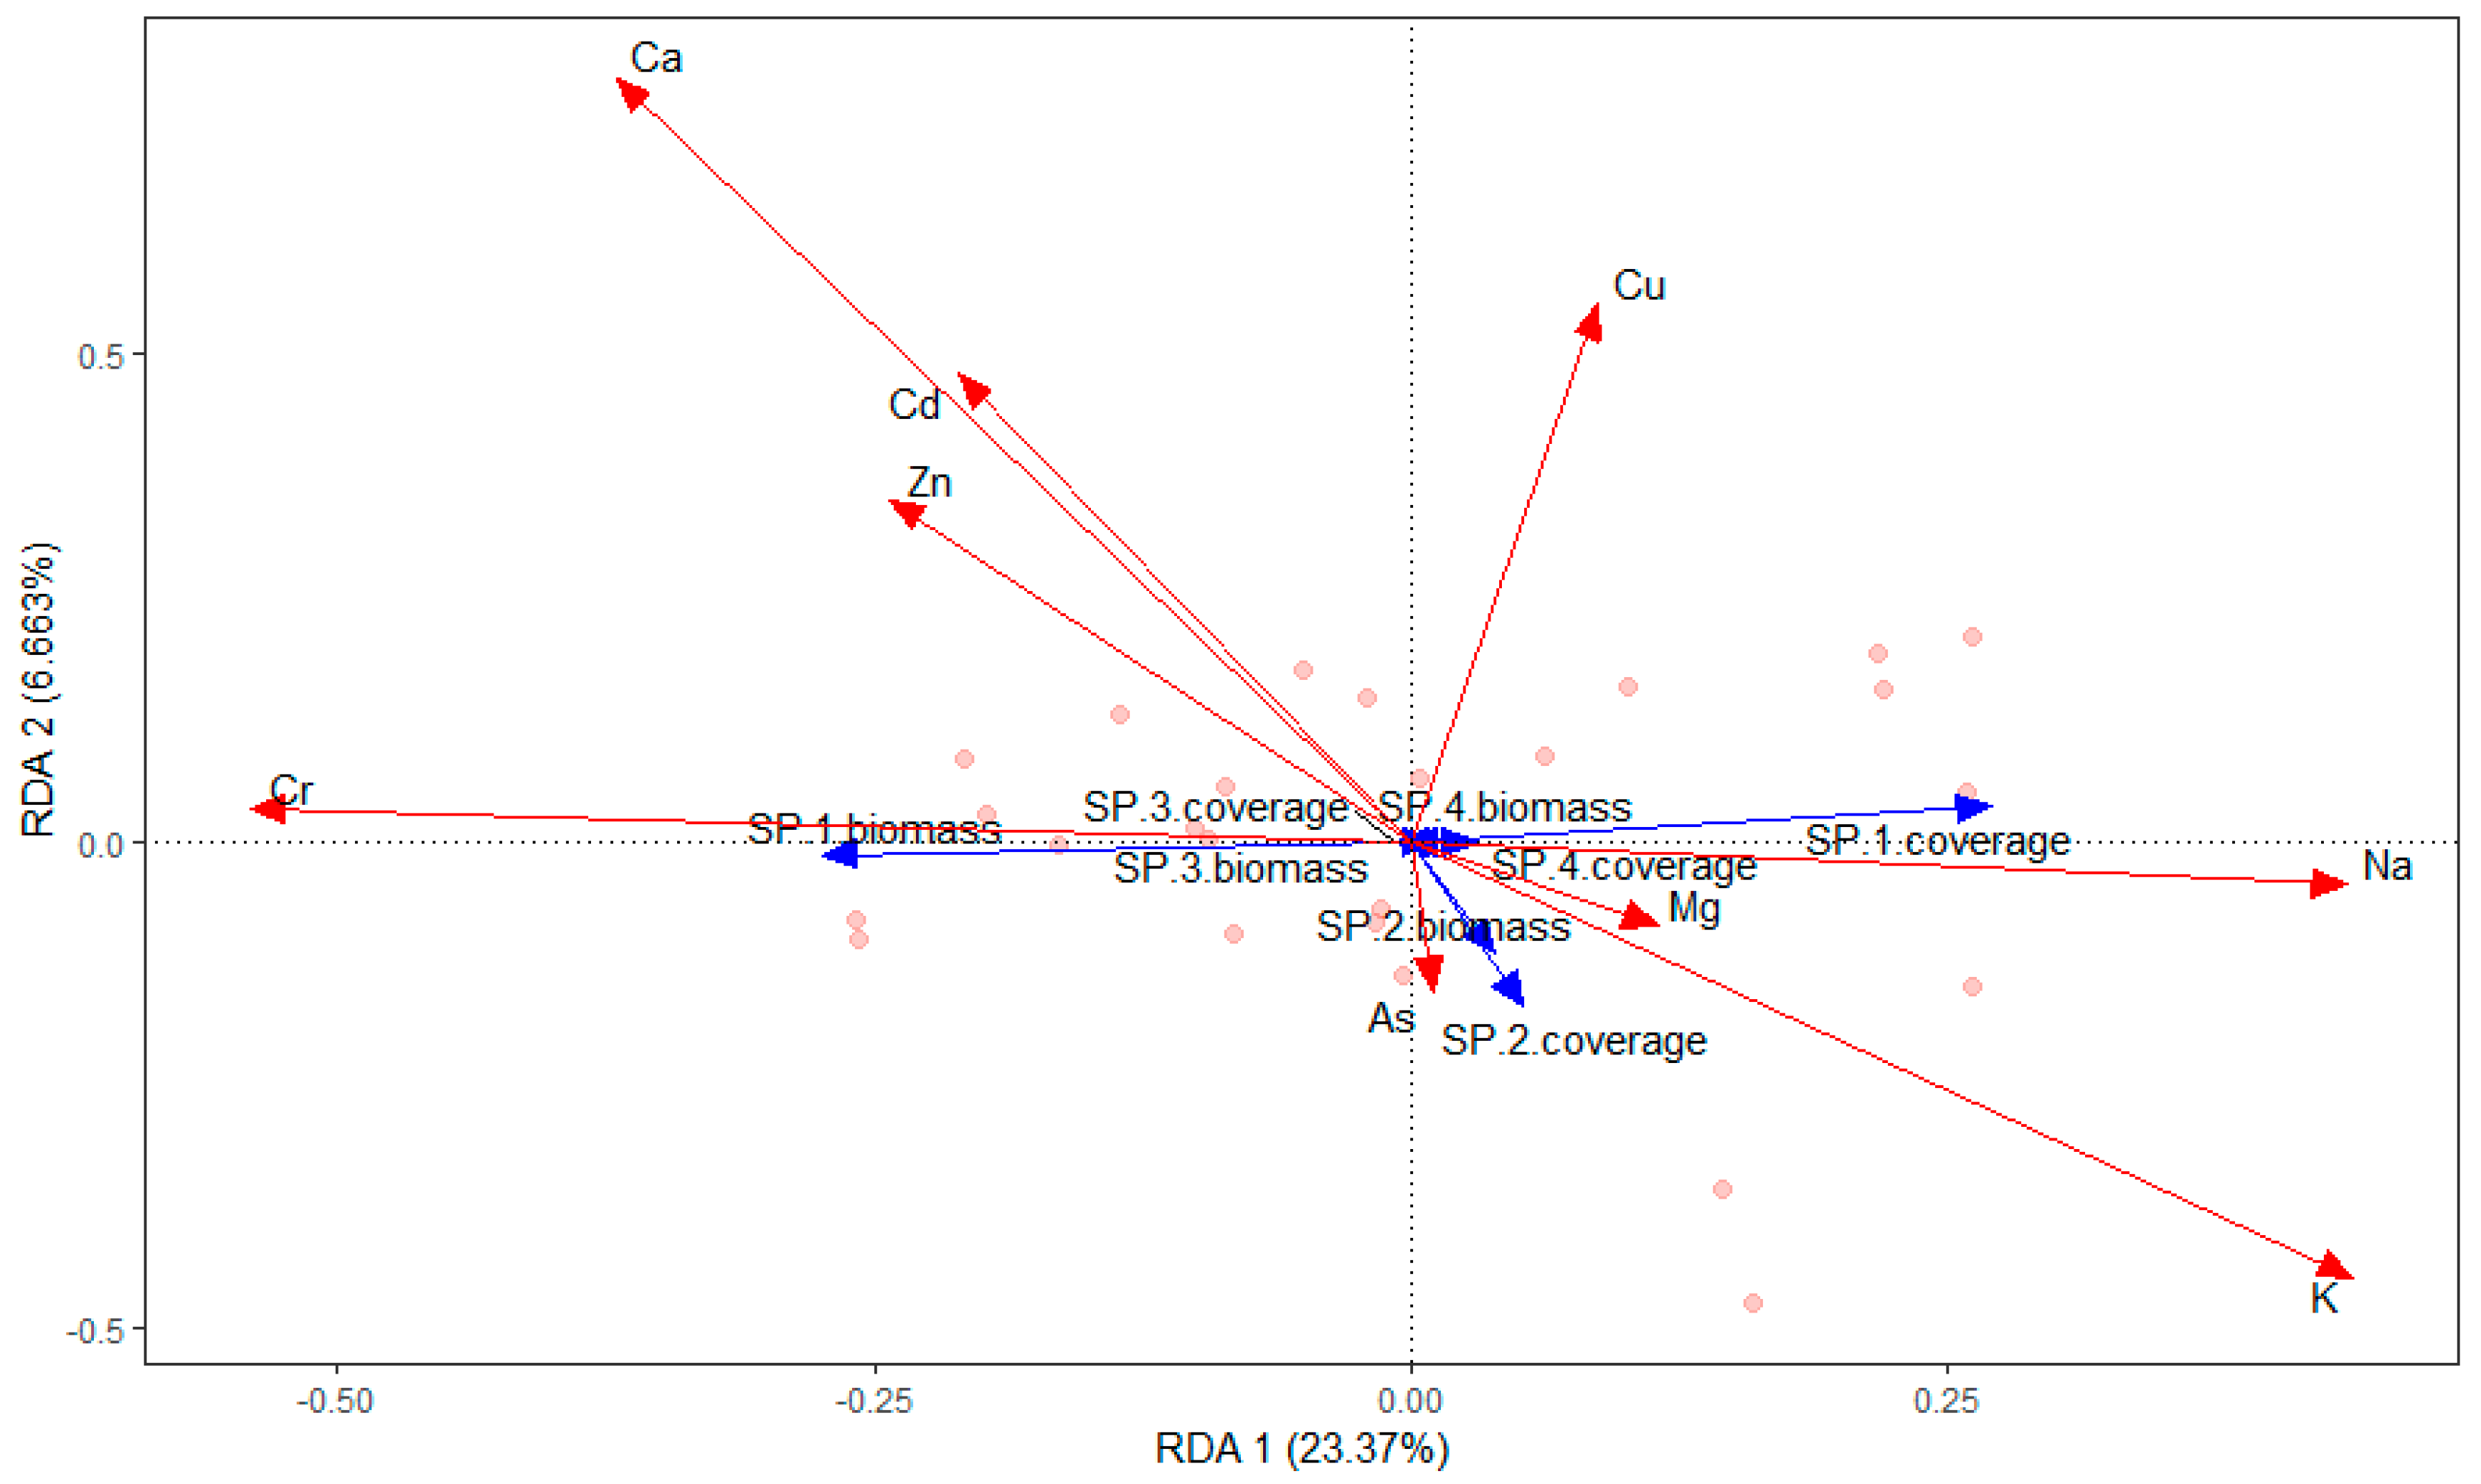
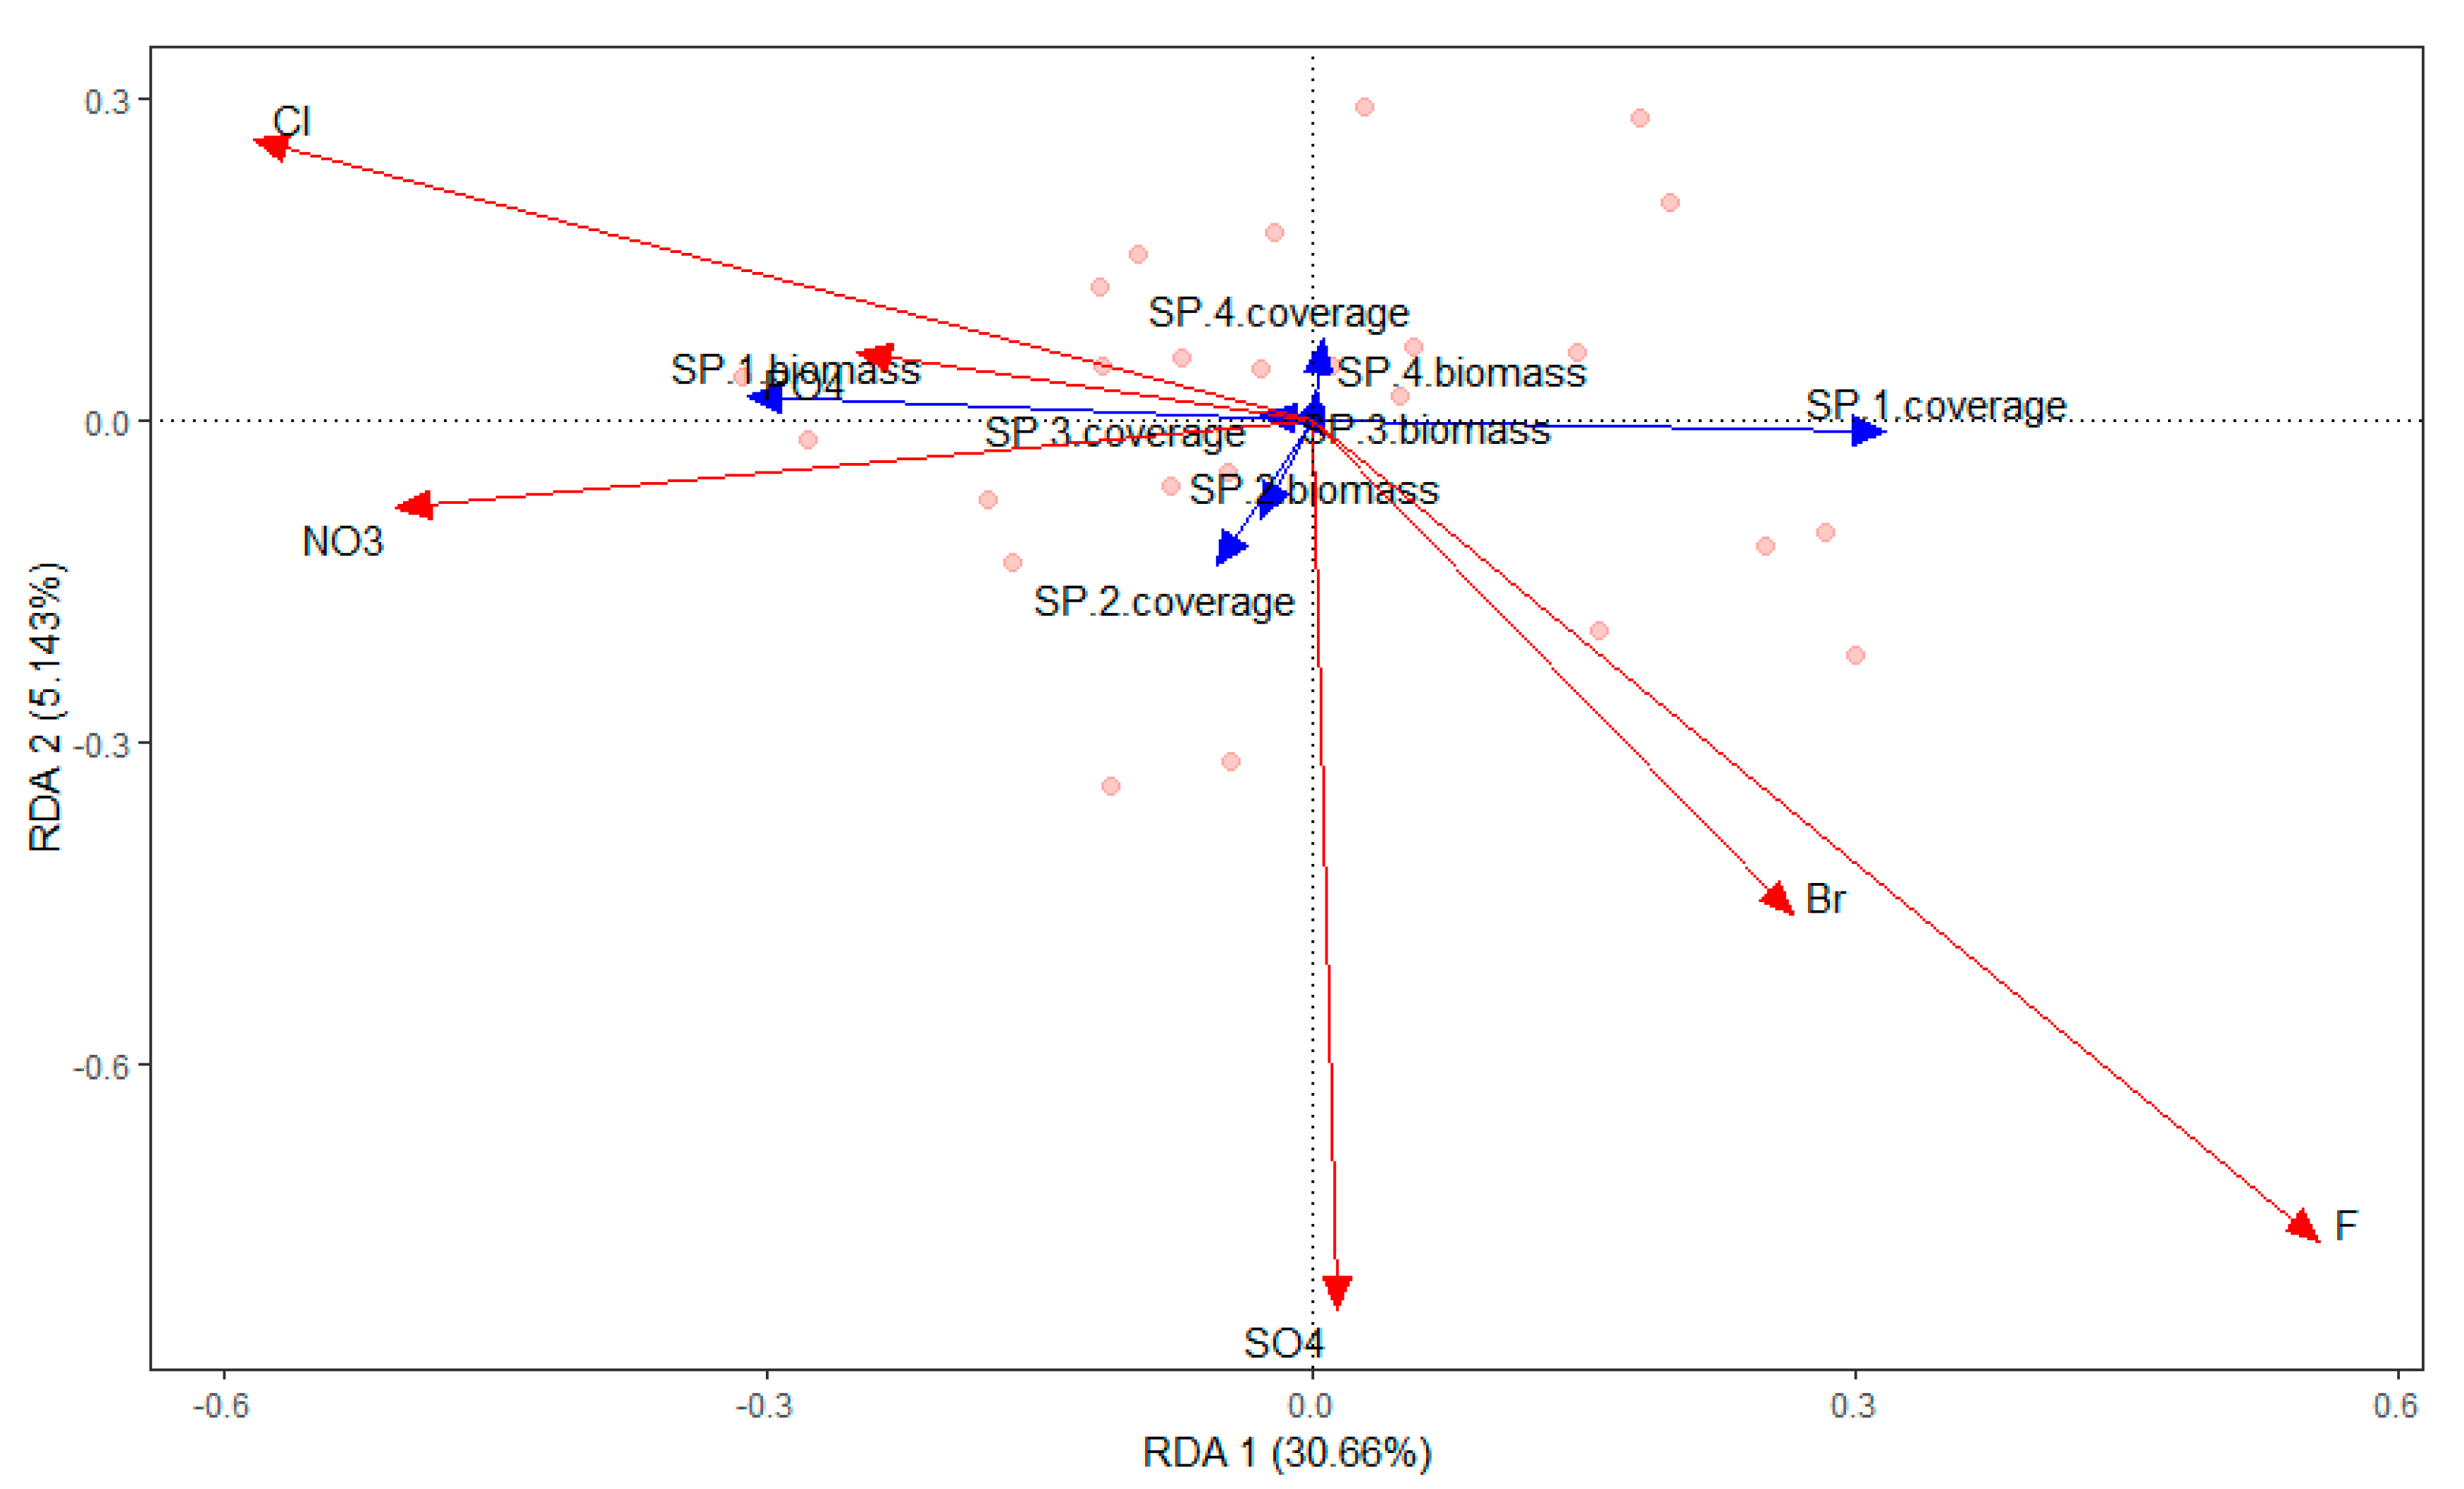
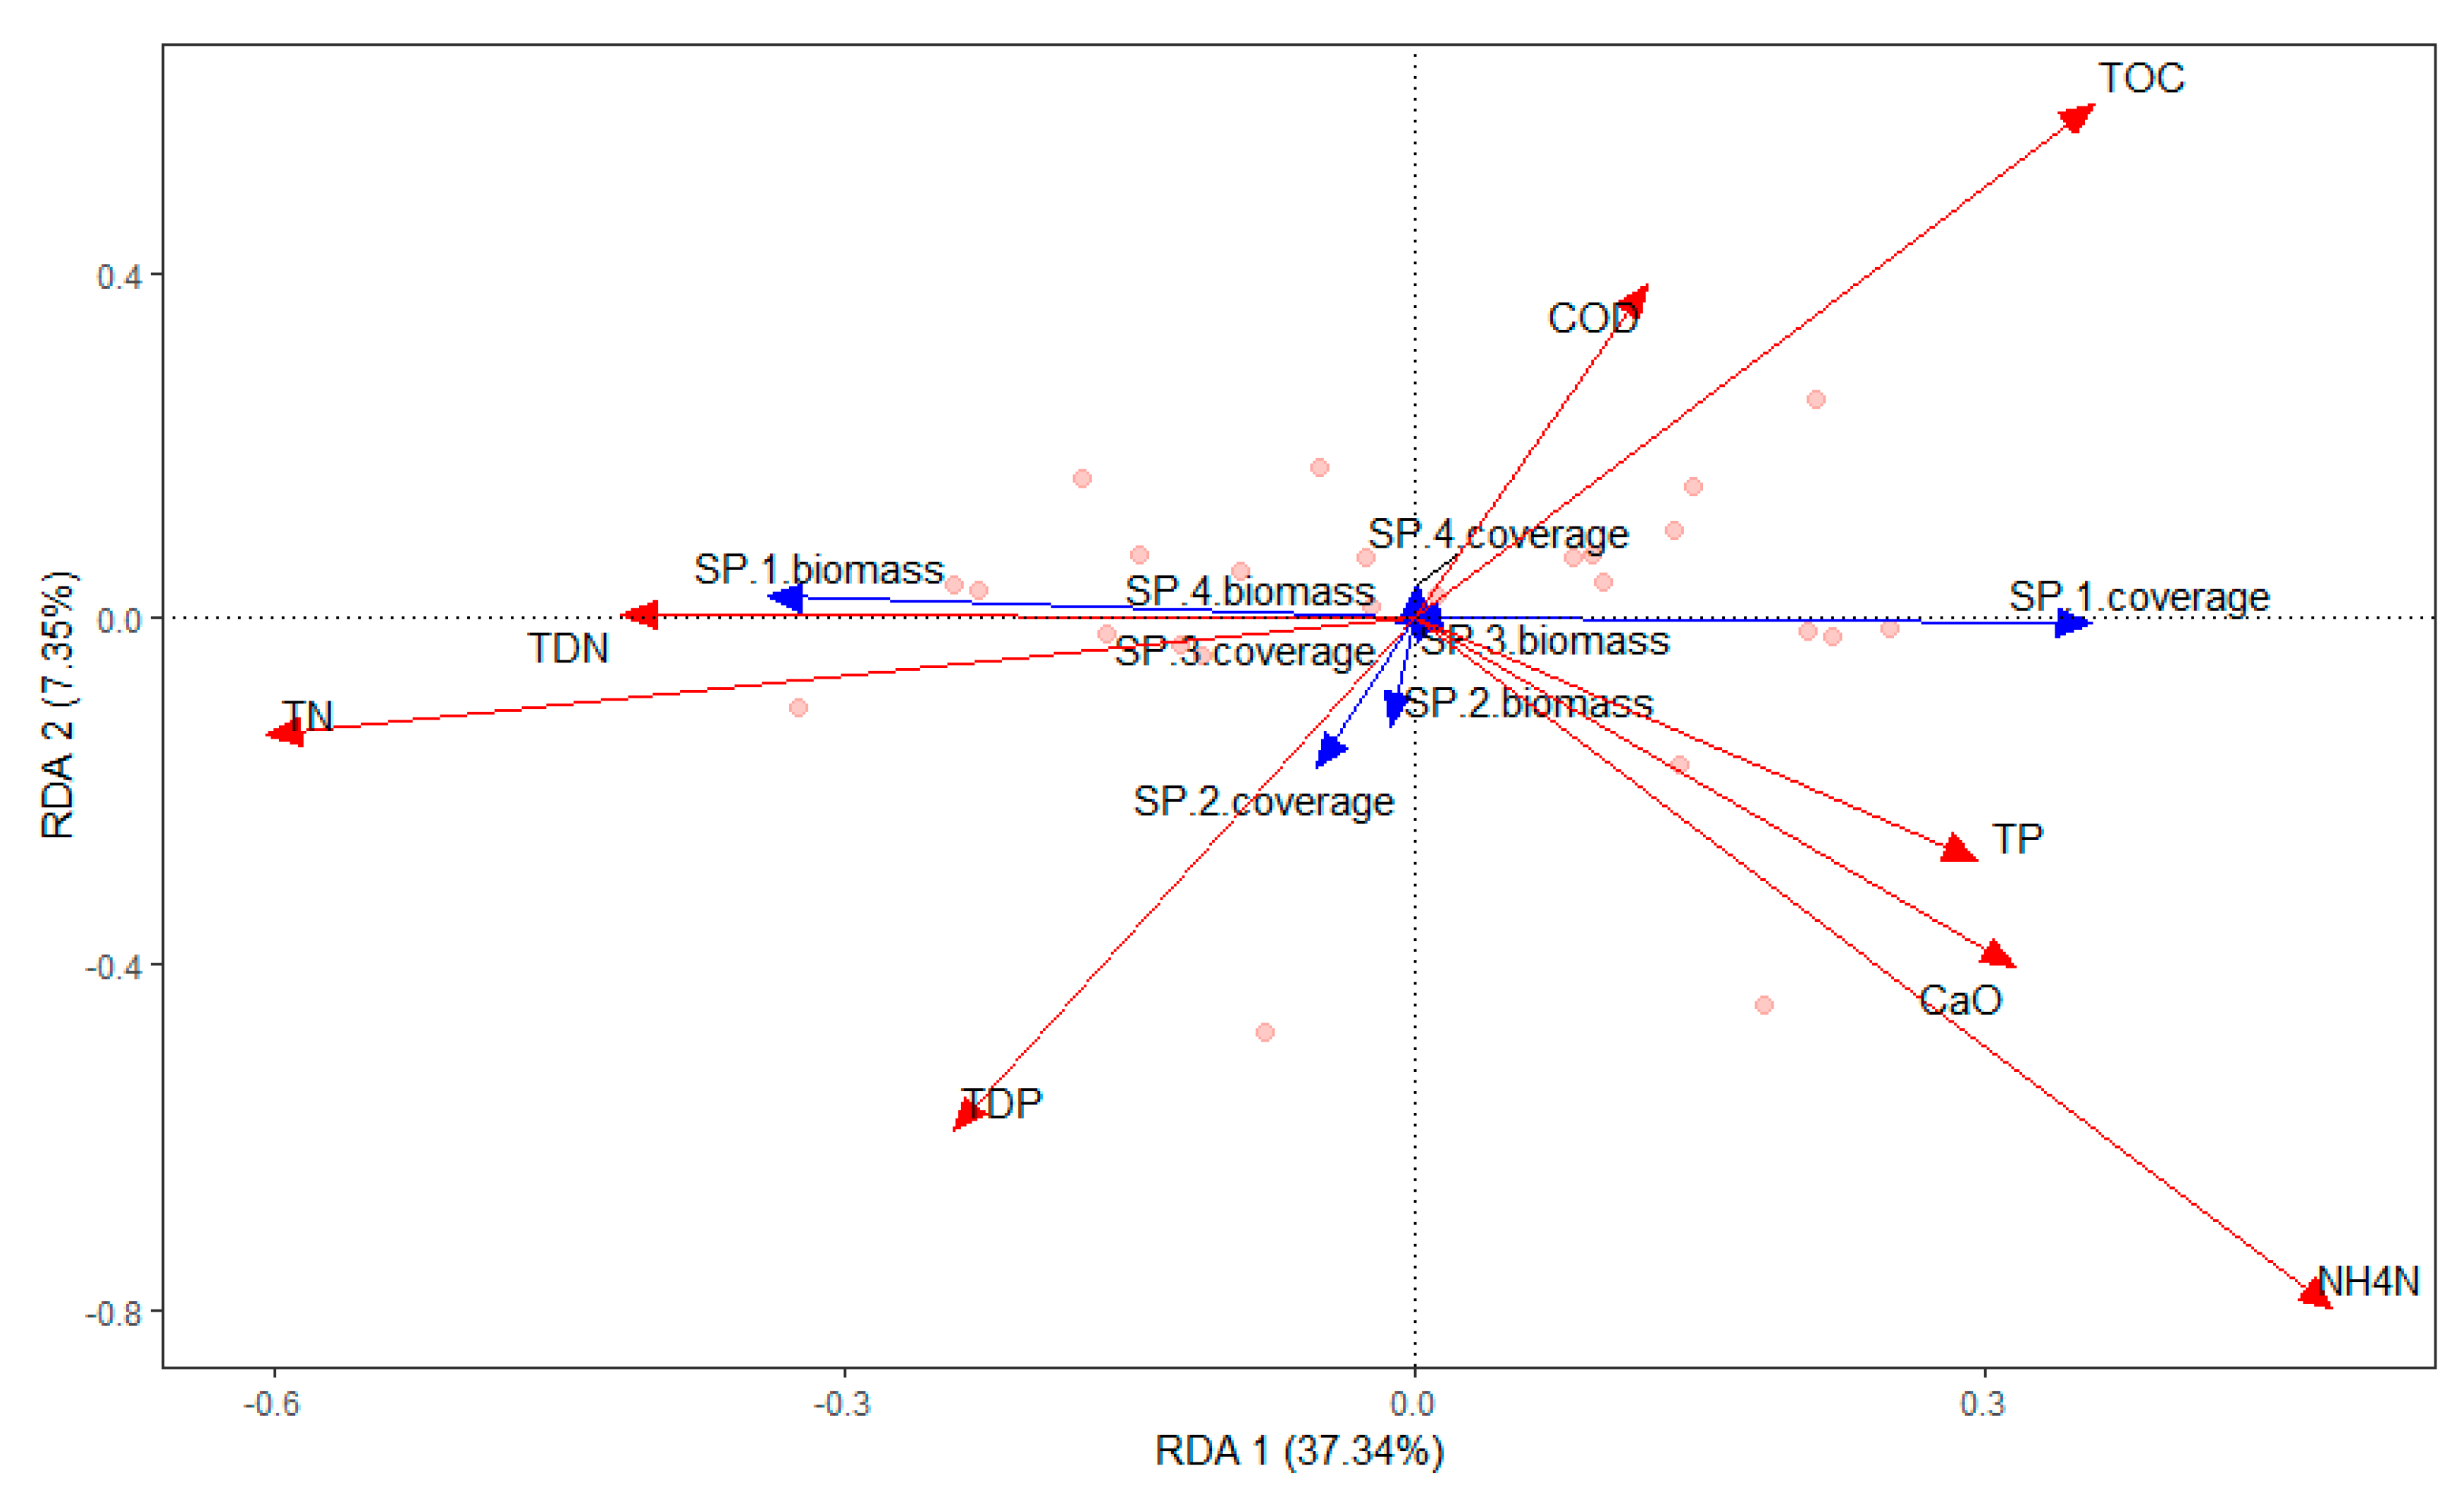
The submerged macrophytes (P. pectinatus, L. minor, Chara sp., and Z. palustris) were significantly affected by chlorophyll-a (r2 = 0.2520; P = 0.046), NH4-N (r2 = 0.5151; P = 0.001), TDP (r2 = 0.2884; P = 0.021), TOC (r2 = 0.3290; P = 0.01), F− (r2 = 0.3710; P = 0.006), SO42− (r2 = 0.3607; P = 0.01), Ca (r2 = 0.5480; P = 0.001), and K (r2 = 0.2811; P = 0.026) (Figure 4, Figure 5, Figure 6 and Figure 7). The dominant macrophyte, P. pectinatus, had a biomass that was positively related to transparency, WD, ORP, TDN, TN, PO43−, Cl−, NO3−, and Cr, and the coverage of P. pectinatus was positively related to temperature, TP, TOC, F-, and Na (Figure 4, Figure 5, Figure 6 and Figure 7). In contrast, the companion Chara species was positively related to C, TDS, pH, DO, TDP, SO42−, NO3−, As, K, and Mg (Figure 4, Figure 5, Figure 6 and Figure 7).
4. Discussion
4.1. The Relationship between Habitat Conditions and Aquatic Plant Species Richness
Some experimental results indicate that the distribution and abundance of aquatic macrophytes are influenced by variations in environmental factors [11]. For example, the dominant species P. pectinatus tolerates high salinity and pH, but it cannot adapt to acidic and nutrient-poor water [39]. In addition, light conditions significantly affected the growth performance of P. pectinatus [40]. The light condition is affected by various factors, including water depth, the chlorophyll of phytoplankton, and inorganic turbidity [11,41,42]. Thus, chlorophyll-a concentration can affect the light intensity penetrating the water body and can thus impact the growth performance of submerged vegetation.
Aquatic plants or their communities can serve as indicators of the trophic status of their habitat [11,43]. For example, Chara species are more typical in mesotrophic environments, Lemna species are suited for highly eutrophic habitats, and P. pectinatus has a broad ecological range [44,45,46]. This survey found that NH4-N, TDP, SO42−, Ca, and K significantly affected the coverage and biomass of aquatic plants; this may be because high ammonium conditions can support the survival of pollution-resistant species such as floating plants (Lemna) [47,48]. L. minor and Z. palustris require medium to high phosphorus concentrations [46,49], and these plants are very widely used for remediation of wastewater by constructed wetlands. In addition, aquatic plants can be limited by micronutrients: For example, some aquatic plants show a nutrient response to base cations, especially calcium [46,50], and may also be negatively sensitive to sulfate [51].
Competition can affect the relative abundance of species and distribution within communities. There existed competition and coexistence between P. pectinatus and its main companion species in Chenghai Lake. For example, P. pectinatus (98% coverage of Chenghai Lake) may be a better competitor for light [52] because of its rapid growth and ability to form a canopy of leaves near the water surface [7,53].
Thus, the structure of aquatic plant communities is affected by the life-history traits of the component species and their tolerance of environmental conditions, such as stress, disturbance, and competition. As aquatic plants show a high level of ecological plasticity in their responses to variations in environmental factors, many species of aquatic plants are poor indicators of specific habitat conditions.
4.2. The Mechanism of Aquatic Vegetation Succession
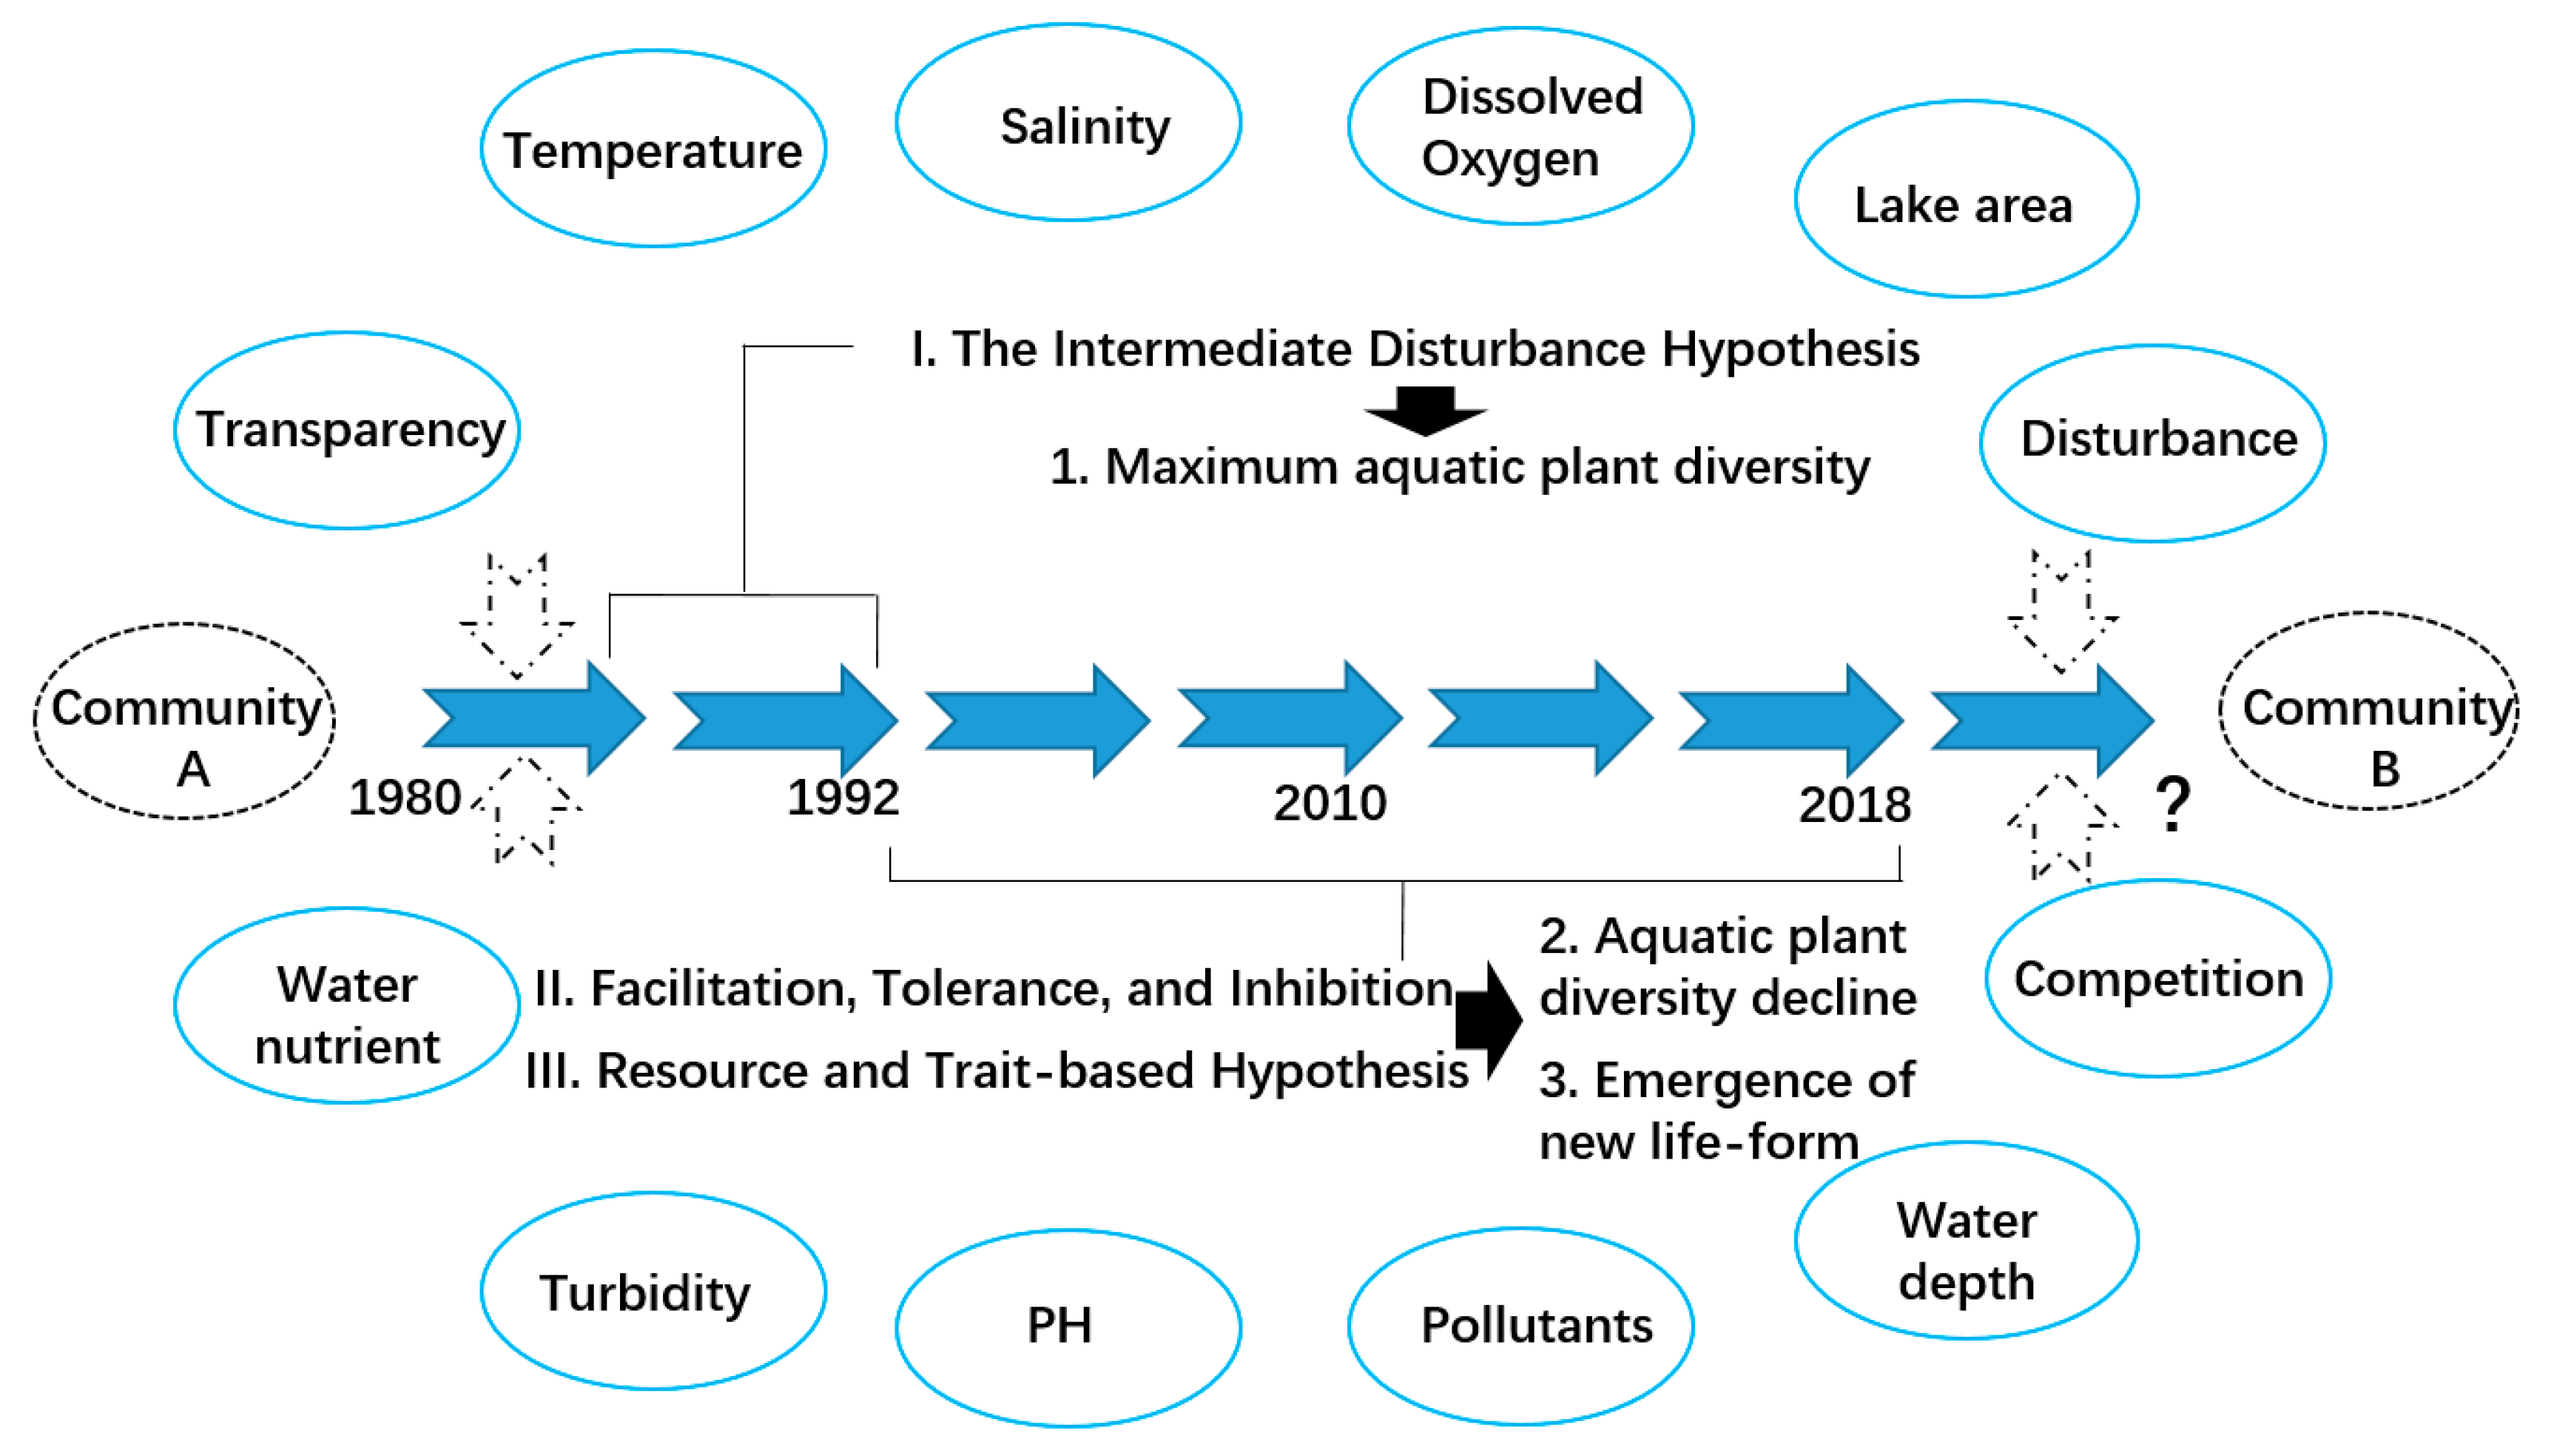
The intermediate disturbance hypothesis, which postulates that coexistence and/or biodiversity peak as a result of intermediate disturbance regimes [28], can be applied to plant succession [25]. The relationships between succession dynamics and species richness change dynamically over time [54,55]. Comparing historical data, we found that a peak in species richness occurred at an intermediate stage of development from 1980 to 1992 (Figure 3). This is probably because of the intermediate levels of disturbance to aquatic plants in Chenghai Lake [35,37]. Previous studies of plant communities have suggested that (I) after a low level of disturbance, plant species with the ability to be highly competitive become the dominant species; (II) after a high level of disturbance, the surviving species have a strong resistance or the capacity to rapidly colonize; (III) after intermediate levels of disturbance, more species may coexist because there is lower competition [15,28,56,57]. The mechanism described by the IDH is based on patch dynamics [55]. For example, species can easily access disturbed patches when there is low dispersal between habitat patches; thus, disturbances may have a negative effect on species richness [25]. In contrast, habitats with high connectivity can prompt species to recolonize disturbed patches from adjacent undisturbed ecosystems. Consequently [58], as a promoter of species coexistence, high connectivity can accelerate the increase in species richness [25,54].
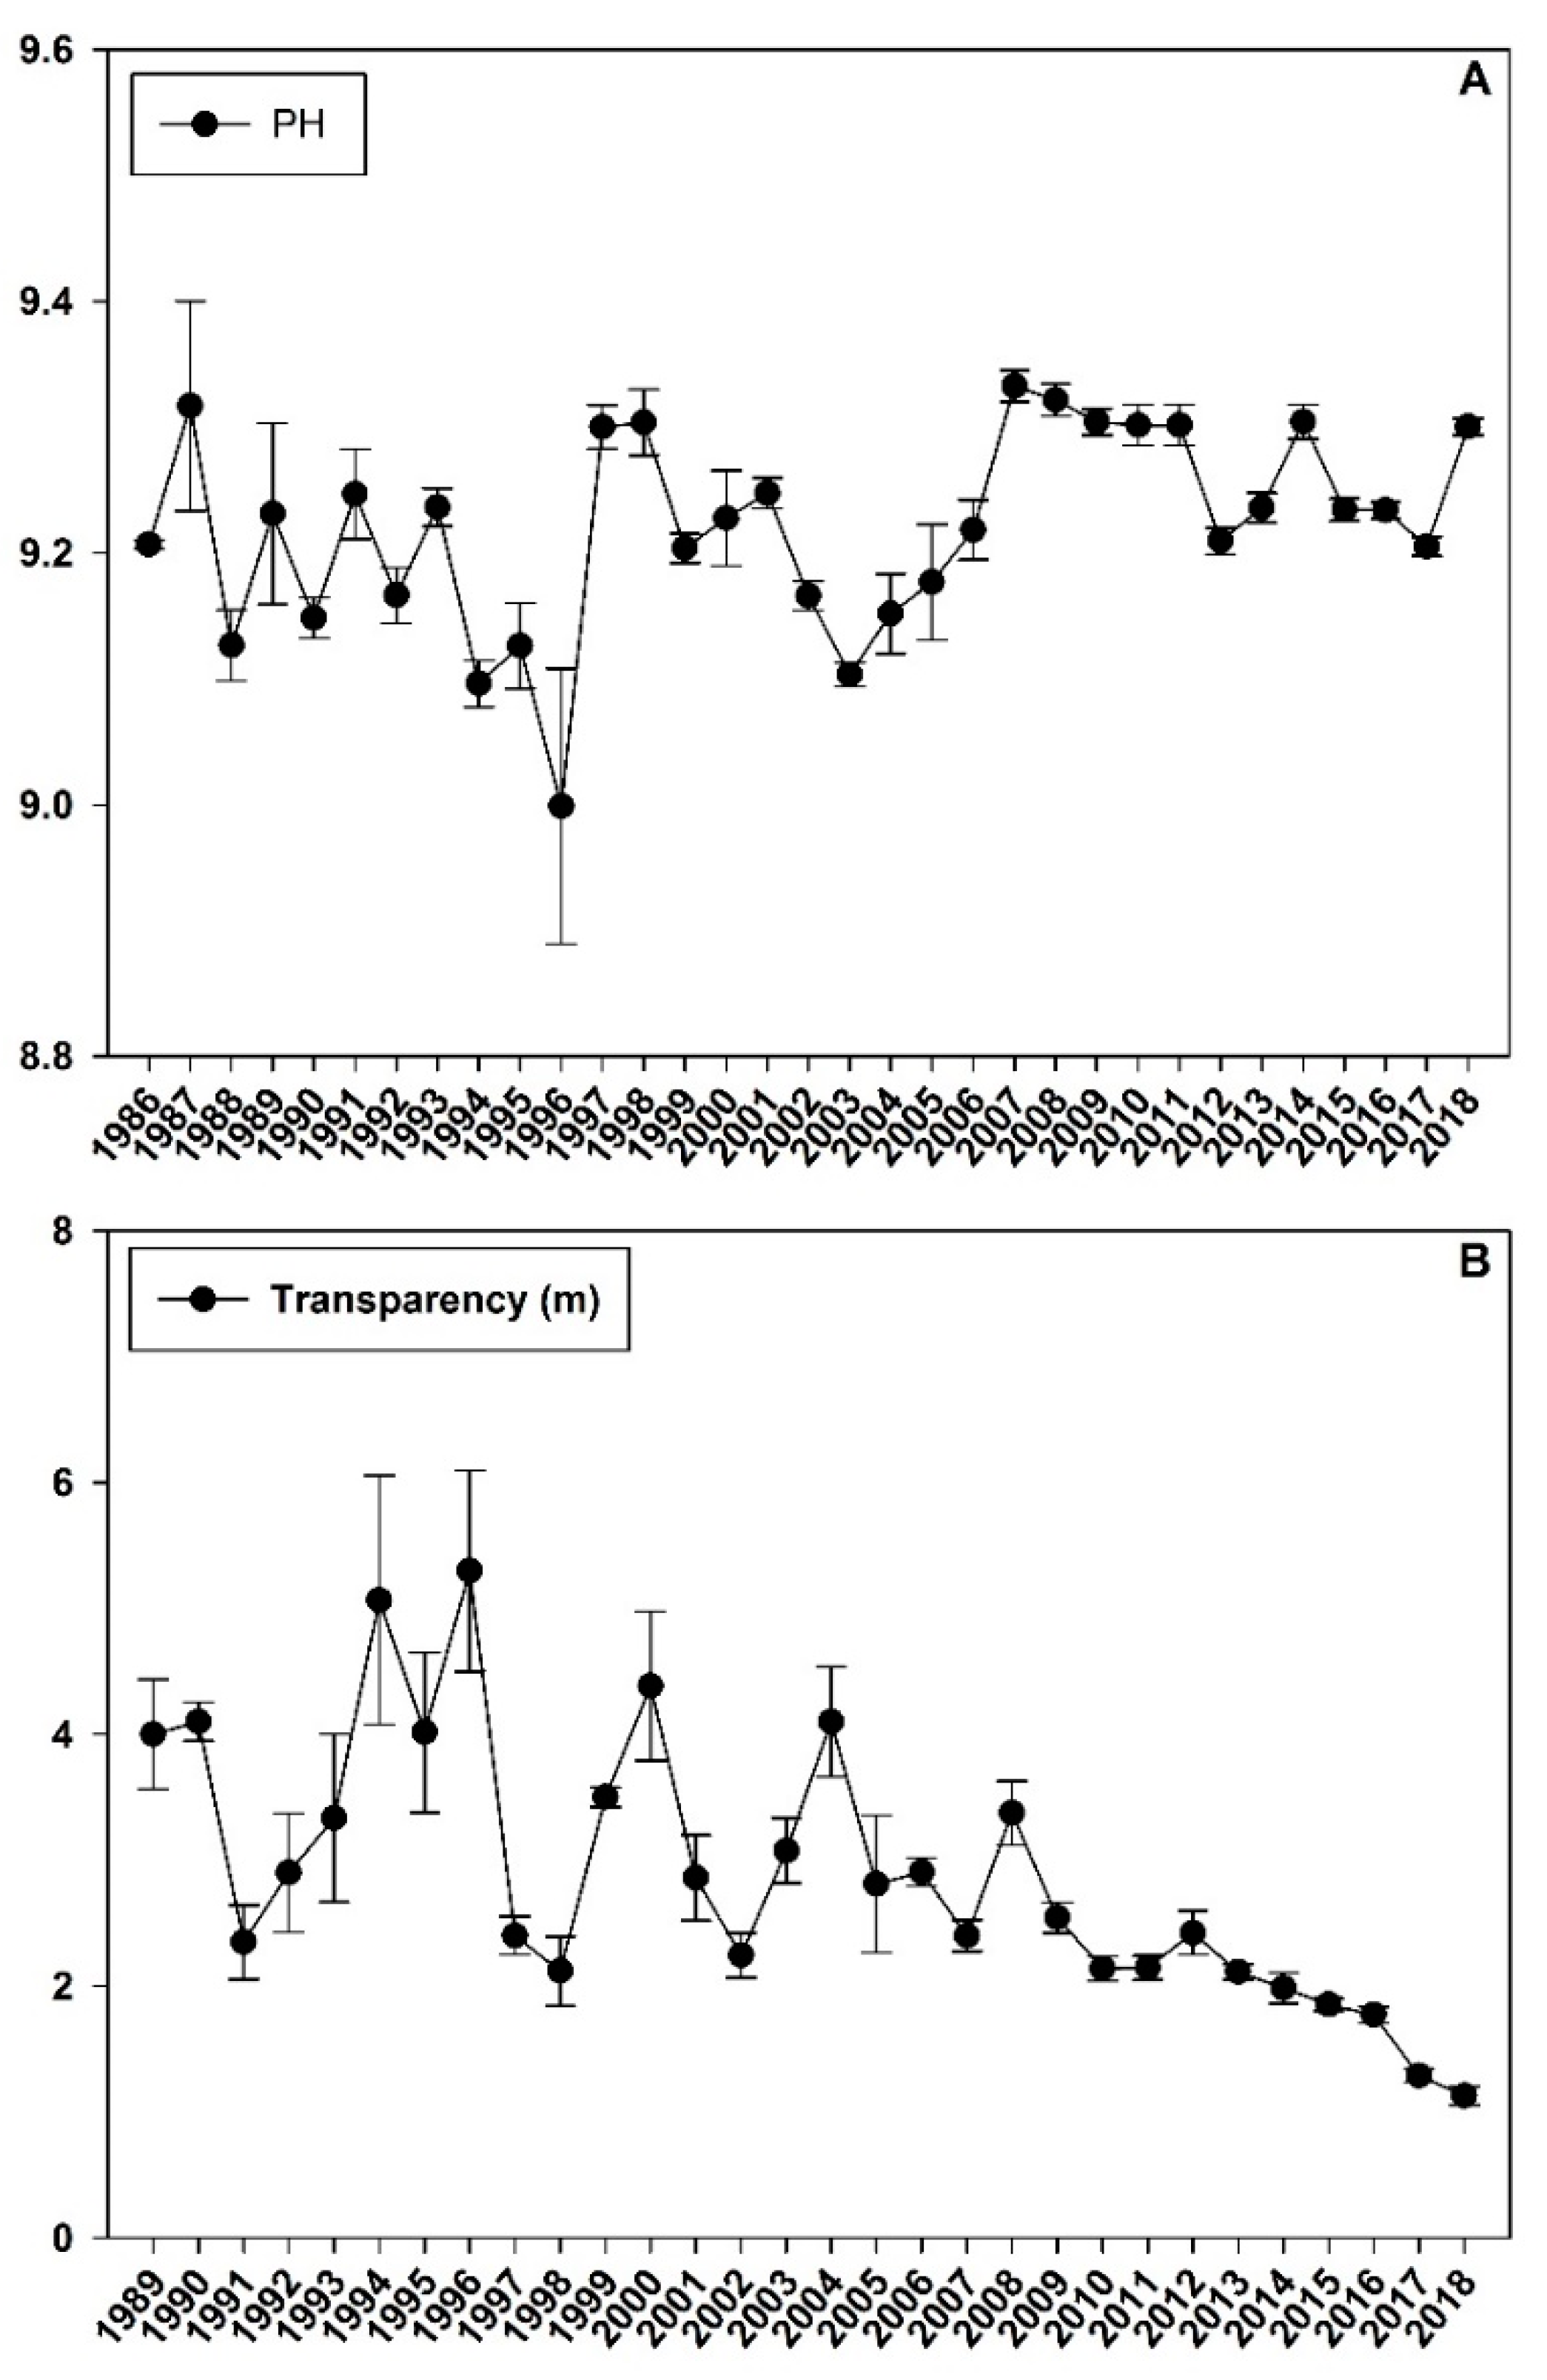
After the initial stage of vegetation succession (1980–1992), the aquatic community with high plant species diversity had formed (Figure 8). However, after 26 years of secondary succession, the diversity and distribution area of aquatic plants gradually declined (Table 1). First, according to the facilitation, tolerance, and inhibition hypothesis, an established species or community (P. pectinatus; Myriophyllum spicatum; Vallisneria natans; Potamogeton crispus; and Chara sp.) may alter habitat conditions so that the habitats are less favorable for themselves and more suitable for the next group of aquatic plant species [15,59]. Second, according to the resource and trait-based hypothesis, gradients of resources or stresses in an ecosystem influence succession, and these gradients interact with species’ traits to determine community changes [15,60,61]. The water quality of Chenghai Lake has gradually deteriorated, especially water transparency (Figure 2 and Figure 3). As a result, P. pectinatus survived, and the new free-floating species of L. minor emerged in the community. This is probably because increasing turbidity can lead to the disappearance of macrophytes [62,63,64], and P. pectinatus can tolerate changes in turbidity because they are able to overcome increasing turbidity by various mechanisms [65]. The facilitation model may apply to the early-succession aquatic plant species L. minor, which can modify an aquatic habitat so that it is more suitable for later-succession aquatic plant species to invade and grow to maturity [59], especially floating life-form aquatic plants that can adapt to low water transparency.
The competition relationship between aquatic vegetation may cause changes in species diversity because the competition pressure on plants can alter the succession process [66]. For example, the stronger interspecific competitive effect of P. pectinatus on Myriophyllum exalbescens inhibited plant growth [53], and P. pectinatus appears to be a stronger competitor than Chara in turbid water [65]. P. pectinatus most often appears in temperate shallow lakes with reduced external nutrient loading, and it dominates during the intermediate stage of vegetation succession [67]. We deduced that the competitiveness of P. pectinatus and its high resistance to environmental change allowed it to gradually become the dominant species in Chenghai Lake. In addition, aquatic plants often suffer from herbivory pressure by snails, fish, and waterfowl, and this affects their abundance and the composition of communities [68]. We hypothesize that the vigorous development of aquaculture (fish production increased from 523.4 tons in 1986 to 2000 tons in 2009) may lead to accelerated eutrophication. Thus, an increase of phytoplankton is resulting in decline of transparency, and finally, influencing the species richness and composition of macrophyte communities.
5. Conclusions
Lakes are incredibly important freshwater resources [69]. At present, most of the lakes in the world are suffering from disturbances due to industrialization, economic growth, and human activities. In this study, we found that with the continuous input of lake nutrients, the growth performance and diversity of aquatic plants was significantly affected in Chenghai Lake, especially during its transition period from a mesotrophic lake to a eutrophic lake. However, the results also suggest that the frequency and intensity of disturbances may significantly affect vegetation composition and succession in different ways. Further research is required to clarify the interacting effects of different types of disturbances on species richness succession in both space and time.
Author Contributions
Conceptualization, L.Y. and L.W.; Methodology, C.L.; Software, T.L.; Formal Analysis, J.P.; Investigation, H.Y.; Data Curation, W.Q.; Writing-Original Draft Preparation, H.Y.; Writing-Review & Editing, J.P.; Visualization, H.Y.; Supervision, C.L.; Project Administration, J.P.; Funding Acquisition, J.P.
Funding
This work was supported by the China Postdoctoral Science Foundation [grant number: 2019M650634].
Acknowledgments
We thank Rui Bian, Haoran Sun, Jingwen Hu, Fei Ma, Yang Li, Xiaowen Ma, Xiaoliang Zhang, Junnan Wang, Yinjiao Yu, Fengxia Li for their help during the course of the experiment.
Conflicts of Interest
The authors declare no conflict of interest.
Abbreviations
| SP.1 cov and SP.1 bio = the coverage and biomass of Potamogeton pectinatus; |
| SP.2 cov and SP.2 bio = the coverage and biomass of Chara sp.; |
| SP.3 cov and SP.3 bio = the coverage and biomass of Lemna minor; |
| SP.4 cov and SP.4 bio = the coverage and biomass of Zannichellia palustris; |
| Chl.a = chlorophyll-a; TURB = turbidity; |
| WD = water depth; ORP = oxidation–reduction potential; |
| SS = suspended solids; T = temperature; |
| DO = dissolved oxygen; C = conductivity; |
| pH = potential of hydrogen; Tran. = transparency; |
| TDS = total dissolved solids; SAL = salinity. |
| TDN = total dissolved nitrogen; TN = total nitrogen; |
| TP = total phosphorus; TDP = total dissolved phosphorus; |
| COD = chemical oxygen demand; TOC = total organic carbon. |
References
- Tamire, G.; Mengistou, S. Macrophyte species composition, distribution and diversity in relation to some physicochemical factors in the littoral zone of Lake Ziway, Ethiopia. Afr. J. Ecol. 2013, 51, 66–77. [Google Scholar] [CrossRef]
- Wetzel, R.G. Fundamental processes within natural and constructed wetland ecosystems: Short-term versus long-term objectives. Water Sci. Technol. 2001, 44, 1–8. [Google Scholar] [CrossRef] [PubMed]
- Chambers, P.A.; Lacoul, P.; Murphy, K.J.; Thomaz, S.M. Global diversity of aquatic macrophytes in freshwater. Hydrobiologia 2008, 595, 9–26. [Google Scholar] [CrossRef]
- Biudes, J.F.V.; Camargo, A.F.M.J.O.A. Studying the limitant factors to primary production of aquatic macrophytes in brazil. People 2008, 12, 7–19. [Google Scholar]
- Gurnell, A.; Van Oosterhout, M.; De Vlieger, B.; Goodson, J.M. Reach-scale interactions between aquatic plants and physical habitat: River Frome, Dorset. River Res. Appl. 2006, 22, 667–680. [Google Scholar] [CrossRef]
- Bando, F.M.; Michelan, T.S.; Cunha, E.R.; Figueiredo, B.R.S.; Thomaz, S.M. Macrophyte species richness and composition are correlated with canopy openness and water depth in tropical floodplain lakes. Braz. J. Bot. 2015, 38, 289–294. [Google Scholar] [CrossRef]
- Barko, J.W.; James, W.F. Effects of Submerged Aquatic Macrophytes on Nutrient Dynamics, Sedimentation, and Resuspension. In The Structuring Role of Submerged Macrophytes in Lakes; Springer: Berlin, Germany, 1998; pp. 197–214. [Google Scholar]
- Duarte, C.M. Marine biodiversity and ecosystem services: An elusive link. J. Exp. Mar. Biol. Ecol. 2000, 250, 117–131. [Google Scholar] [CrossRef]
- Scheffer, M.; Jeppesen, E. Regime shifts in shallow lakes. Ecosystems 2007, 10, 1–3. [Google Scholar] [CrossRef]
- Jones, C.G.; Lawton, J.H.; Shachak, M. Positive and negative effects of organisms as physical ecosystem engineers. Ecology 1997, 78, 1946–1957. [Google Scholar] [CrossRef]
- Lacoul, P.; Freedman, B. Environmental influences on aquatic plants in freshwater ecosystems. Environ. Rev. 2006, 14, 89–136. [Google Scholar] [CrossRef]
- Cook, C.D. Aquatic Plant Book; SPB Academic Publishing: Amsterdam, The Netherlands, 1996; 228p. [Google Scholar]
- Bornette, G.; Amoros, C.; Lamouroux, N.L. Aquatic plant diversity in riverine wetlands: The role of connectivity. Freshw. Biol. 1998, 39, 267–283. [Google Scholar] [CrossRef]
- Eigenbrod, F.; Bell, V.A.; Davies, H.N.; Heinemeyer, A.; Armsworth, P.R.; Gaston, K.J. The impact of projected increases in urbanization on ecosystem services. Proc. Biol. Sci. 2011, 278, 3201–3208. [Google Scholar] [CrossRef] [PubMed] [Green Version]
- Pulsford, S.A.; Lindenmayer, D.B.; Driscoll, D.A. A succession of theories: Purging redundancy from disturbance theory. Biol. Rev. Camb. Philos. Soc. 2016, 91, 148–167. [Google Scholar] [CrossRef] [PubMed]
- Bornette, G.; Puijalon, S. Response of aquatic plants to abiotic factors: A review. Aquat. Sci. 2011, 73, 1–14. [Google Scholar] [CrossRef]
- Van Geest, G.J.; Coops, H.; Roijackers, R.M.M.; Buijse, A.D.; Scheffer, M. Succession of aquatic vegetation driven by reduced water-level fluctuations in floodplain lakes. J. Appl. Ecol. 2005, 42, 251–260. [Google Scholar] [CrossRef]
- Toivonen, H. Concordance of species richness patterns among multiple freshwater taxa: A regional perspective. Biodivers. Conserv. 2002, 11, 137–147. [Google Scholar] [CrossRef]
- Pip, E.J.A.B. Water temperature and freshwater macrophyte distribution. Aquat. Bot. 1989, 34, 367–373. [Google Scholar] [CrossRef]
- Callaway, R.M.; King, L.J.E. Temperature-driven variation in substrate oxygenation and the balance of competition and facilitation. Ecology 1996, 77, 1189–1195. [Google Scholar] [CrossRef]
- Toivonen, H.; Huttunen, P. Aquatic macrophytes and ecological gradients in 57 small lakes in southern Finland. Aquat. Bot. 1995, 51, 197–221. [Google Scholar] [CrossRef]
- Murphy, K.J. Plant communities and plant diversity in softwater lakes of northern Europe. Aquat. Bot. 2002, 73, 287–324. [Google Scholar] [CrossRef]
- Pollock, M.M.; Naiman, R.J.; Hanley, T.A.J.E. Plant species richness in riparian wetlands—A test of biodiversity theory. Ecology 1998, 79, 94–105. [Google Scholar] [CrossRef]
- Wilson, J.B. Mechanisms of species coexistence: Twelve explanations for Hutchinson’s ‘paradox of the plankton’: Evidence from New Zealand plant. N. Z. J. Ecol. 1990, 13, 17–42. [Google Scholar]
- Arthaud, F.; Vallod, D.; Robin, J.; Wezel, A.; Bornette, G. Short-term succession of aquatic plant species richness along ecosystem productivity and dispersal gradients in shallow lakes. J. Veg. Sci. 2013, 24, 148–156. [Google Scholar] [CrossRef]
- Roxburgh, S.H.; Shea, K.; Wilson, J.B. The intermediate disturbance hypothesis: Patch dynamics and mechanisms of species coexistence. Ecology 2004, 85, 359–371. [Google Scholar] [CrossRef]
- Randall Hughes, A.; Byrnes, J.E.; Kimbro, D.L.; Stachowicz, J.J. Reciprocal relationships and potential feedbacks between biodiversity and disturbance. Ecol. Lett. 2007, 10, 849–864. [Google Scholar] [CrossRef] [PubMed]
- Shea, K.; Roxburgh, S.H.; Rauschert, E.S.J. Moving from pattern to process: Coexistence mechanisms under intermediate disturbance regimes. Ecol. Lett. 2004, 7, 491–508. [Google Scholar] [CrossRef]
- Kayes, L.J.; Anderson, P.D.; Puettmann, K.J. Vegetation succession among and within structural layers following wildfire in managed forests. J. Veg. Sci. 2010, 21, 233–247. [Google Scholar] [CrossRef]
- Bakker, J.; Olff, H.; Willems, J.; Zobel, M. Why do we need permanent plots in the study of long-term vegetation dynamics? J. Veg. Sci. 1996, 7, 147–156. [Google Scholar] [CrossRef]
- Wu, J.L.; Gagan, M.K.; Jiang, X.H.; Xia, W.L.; Wang, S.M. Sedimentary geochemical evidence for recent eutrophication of Lake Chenghai, Yunnan, China. J. Paleolimnol. 2004, 32, 85–94. [Google Scholar]
- Wu, J.; Jiang, X.; Xia, W.; Pan, H.; Yin, Y.J.M.G.; Geology, Q. Climate and primary productivity over the last 500 years of the chenghai lake, Yunnan. Mar. Geol. Quat. Geol. 2002, 22, 95–98. [Google Scholar] [CrossRef]
- Podani, J. Braun-Blanquet’s legacy and data analysis in vegetation science. J. Veg. Sci. 2006, 17, 113–117. [Google Scholar] [CrossRef]
- Pérez-Harguindeguy, N.; Diaz, S.; Gamier, E.; Lavorel, S.; Poorter, H.; Jaureguiberry, P.; Bret-Harte, M.; Comwell, W.; Craine, J.; Gurvich, D. New handbook for stand-ardised measurement of plant functional traits worldwide. Aust. J. Bot. 2013, 61, 167–234. [Google Scholar] [CrossRef]
- Li, H. A study on the lake vegetation of Yunnan plateau. Acta Bot. Yunnanica 1980, 2, 113–141. [Google Scholar]
- Li, H. The lake vegetation of hengduan mountains. Acta Bot. Yunnanica 1987, 9, 257–270. [Google Scholar]
- Shan, Z.; Li, J. Btudy on aquatic vegetation in Chenghai lake, Yunnan. J. Yunnan Norm. Univ. 1994, 14, 666–671. [Google Scholar]
- Dong, Y.; Tan, Z.; Wang, J. Current status and evolution trend of aquatic vegetation in Chenghai lake. Plant Divers. Resour. 2011. [Google Scholar] [CrossRef]
- Kantrud, H.A. Ago Pondweed (Potamogeton pectinatus L.): A Literature Review; Fish and Wildlife Resource Publication 176; US Fish and Wildlife Service: Washington, DC, USA, 1990; ND: Northern Prairie Wildlife Research Center Home Page. (Version 16JUL97). [Google Scholar]
- Van Dijk, G.M.; van Vierssen, W. Survival of a Potamogeton pectinatus L. population under various light conditions in a shallow eutrophic lake (Lake Veluwe) in The Netherlands. Aquat. Bot. 1991, 39, 121–129. [Google Scholar] [CrossRef]
- Chambers, P.A.; Kalff, J. Depth Distribution and Biomass of Submersed Aquatic Macrophyte Communities in Relation to Secchi Depth. Can. J. Fish. Aquat. Sci. 1985, 42, 701–709. [Google Scholar] [CrossRef]
- Sand-Jensen, K.; Borum, J.J.A.B. Interactions among phytoplankton, periphyton, and macrophytes in temperate freshwaters and estuaries. Aquat. Bot. 1991, 41, 137–175. [Google Scholar] [CrossRef]
- Tracy, M.; Montante, J.M.; Allenson, T.E.; Hough, R.A. Long-term responses of aquatic macrophyte diversity and community structure to variation in nitrogen loading. Aquat. Bot. 2003, 77, 43–52. [Google Scholar] [CrossRef]
- Wiegleb, G.J.H. Application of multiple discriminant analysis on the analysis of the correlation between macrophyte vegetation and water quality in running waters of Central Europe. Hydrobiologia 1981, 79, 91–100. [Google Scholar] [CrossRef]
- Kovács, M. (Ed.) Biological Indicators in Environmental Protection; Ellis Horwood: Hemstead, UK, 1992; pp. 120–129. [Google Scholar]
- Heegaard, E.; Birks, H.H.; Gibson, C.E.; Smith, S.J.; Wolfe-Murphy, S.J.A.B. Species–environmental relationships of aquatic macrophytes in Northern Ireland. Aquat. Bot. 2001, 70, 175–223. [Google Scholar] [CrossRef]
- Boedeltje, G.; Smolders, A.J.; Roelofs, J.G.; Van Groenendael, J.M. Constructed shallow zones along navigation canals: Vegetation establishment and change in relation to environmental characteristics. Aquat. Conserv. Mar. Freshw. Ecosyst. 2001, 11, 453–471. [Google Scholar] [CrossRef]
- Samecka-Cymerman, A.; Kempers, A.J. Aquatic macrophytes as biomonitors of pollution by textile industry. Bull. Environ. Contam. Toxicol. 2002, 69, 82–96. [Google Scholar] [CrossRef] [PubMed]
- Trei, T.; Pall, P. Macroflora in the watercourses of Saaremaa Island (Estonia). Boreal Environ. Res. 2004, 9, 25–36. [Google Scholar]
- Bernez, I.; Daniel, H.; Haury, J.; Ferreira, M.T. Combined effects of environmental factors and regulation on macrophyte vegetation along three rivers in western France. River Res. Appl. 2004, 20, 43–59. [Google Scholar] [CrossRef]
- Smolders, A.J.P.; Lamers, L.P.M.; Hartog, C.D.; Roelofs, J.G. Mechanisms involved in the decline of Stratiotes aloides L. in The Netherlands: Sulphate as a key variable. Hydrobiologia 2003, 506–509, 603–610. [Google Scholar] [CrossRef]
- Van den Berg, M.S.; Coops, H.; Simons, J.; de Keizer, A. Competition between Chara aspera and Potamogeton pectinatus as a function of temperature and light. Aquat. Bot. 1998, 60, 241–250. [Google Scholar] [CrossRef]
- Moen, R.A.; Cohen, Y. Growth and Competition between Potamogeton-Pectinatus L and Myriophyllum-Exalbescens Fern in Experimental Ecosystems. Aquat. Bot. 1989, 33, 257–270. [Google Scholar] [CrossRef]
- Cook, W.M.; Yao, J.; Foster, B.L.; Holt, R.D.; Patrick, L.B. Secondary succession in an experimentally fragmented landscape: Community patterns across space and time. Ecology 2005, 86, 1267–1279. [Google Scholar] [CrossRef]
- Wilson, J.B. The Intermediate Disturbance Hypothesis of Species Coexistence Is Based on Patch Dynamics. N. Z. J. Ecol. 1994, 18, 176–181. [Google Scholar]
- Wilson, J.B. The twelve theories of co-existence in plant communities: The doubtful, the important and the unexplored. J. Veg. Sci. 2011, 22, 184–195. [Google Scholar] [CrossRef]
- Connell, J.H. Diversity in tropical rain forests and coral reefs. Science 1978, 199, 1302–1310. [Google Scholar] [CrossRef]
- Matthiessen, B.; Ptacnik, R.; Hillebrand, H. Diversity and community biomass depend on dispersal and disturbance in microalgal communities. Hydrobiologia 2010. [Google Scholar] [CrossRef]
- Connell, J.H.; Slatyer, R.O. Mechanisms of Succession in Natural Communities and Their Role in Community Stability and Organization. Am. Nat. 1977, 111, 1119–1144. [Google Scholar] [CrossRef]
- Tilman, D. The Resource-Ratio Hypothesis of Plant Succession. Am. Nat. 1985, 125, 827–852. [Google Scholar] [CrossRef]
- Drury, W.H.; Nisbet, I.C.T. Succession. J. Arnold Arbor. 1973, 54, 331–368. [Google Scholar]
- Steinman, A.D.; Meeker, R.H.; Rodusky, A.J.; Davis, W.P.; Hwang, S.J. Ecological properties of charophytes in a large subtropical lake. J. N. Am. Benthol. Soc. 1997, 16, 781–793. [Google Scholar] [CrossRef]
- Simons, J.; Ohm, M.; Daalder, R.; Boers, P.; Rip, W. Restoration of Botshol (The Netherlands) by Reduction of External Nutrient Load—Recovery of a Characean Community, Dominated by Chara-Connivens. Hydrobiologia 1994, 275, 243–253. [Google Scholar] [CrossRef]
- Coops, H.; Doef, R.W. Submerged vegetation development in two shallow, eutrophic lakes. Hydrobiologia 1996, 340, 115–120. [Google Scholar] [CrossRef]
- Van den Berg, M.S.; Scheffer, M.; Van Nes, E.; Coops, H.J.H. Dynamics and stability of Chara sp. and Potamogeton pectinatus in a shallow lake changing in eutrophication level. Hydrobiologia 1999, 408, 335–342. [Google Scholar] [CrossRef]
- Grime, J.P. Plant strategies, vegetation processes, and ecosystem properties. Biol. Conserv. 2006. [Google Scholar] [CrossRef]
- Hilt, S.; Nuñez, A.; Marta, M.; Bakker, E.S.; Blindow, I.; Davidson, T.A.; Gillefalk, M.; Hansson, L.-A.; Janse, J.H.; Janssen, A.B.; et al. Response of submerged macrophyte communities to external and internal restoration measures in north temperate shallow lakes. Front. Plant Sci. 2018, 9, 194. [Google Scholar] [CrossRef] [PubMed]
- Wood, K.A.; O’Hare, M.T.; Mcdonald, C.; Searle, K.R.; Daunt, F.; Stillman, R.A. Herbivore regulation of plant abundance in aquatic ecosystems. Biol. Rev. 2016, 92, 1128. [Google Scholar] [CrossRef] [PubMed]
- Wetzel, R.G. Limnology: Lake and River Ecosystems; Gulf Professional Publishing: Houston, TX, USA, 2001. [Google Scholar]
Figure 1.
Sampling design of the aquatic plants in Chenghai Lake.

Figure 2.
The historical water quality data (A): pH; (B): transparency in Chenghai Lake from 1986 to 2018.
Figure 2.
The historical water quality data (A): pH; (B): transparency in Chenghai Lake from 1986 to 2018.

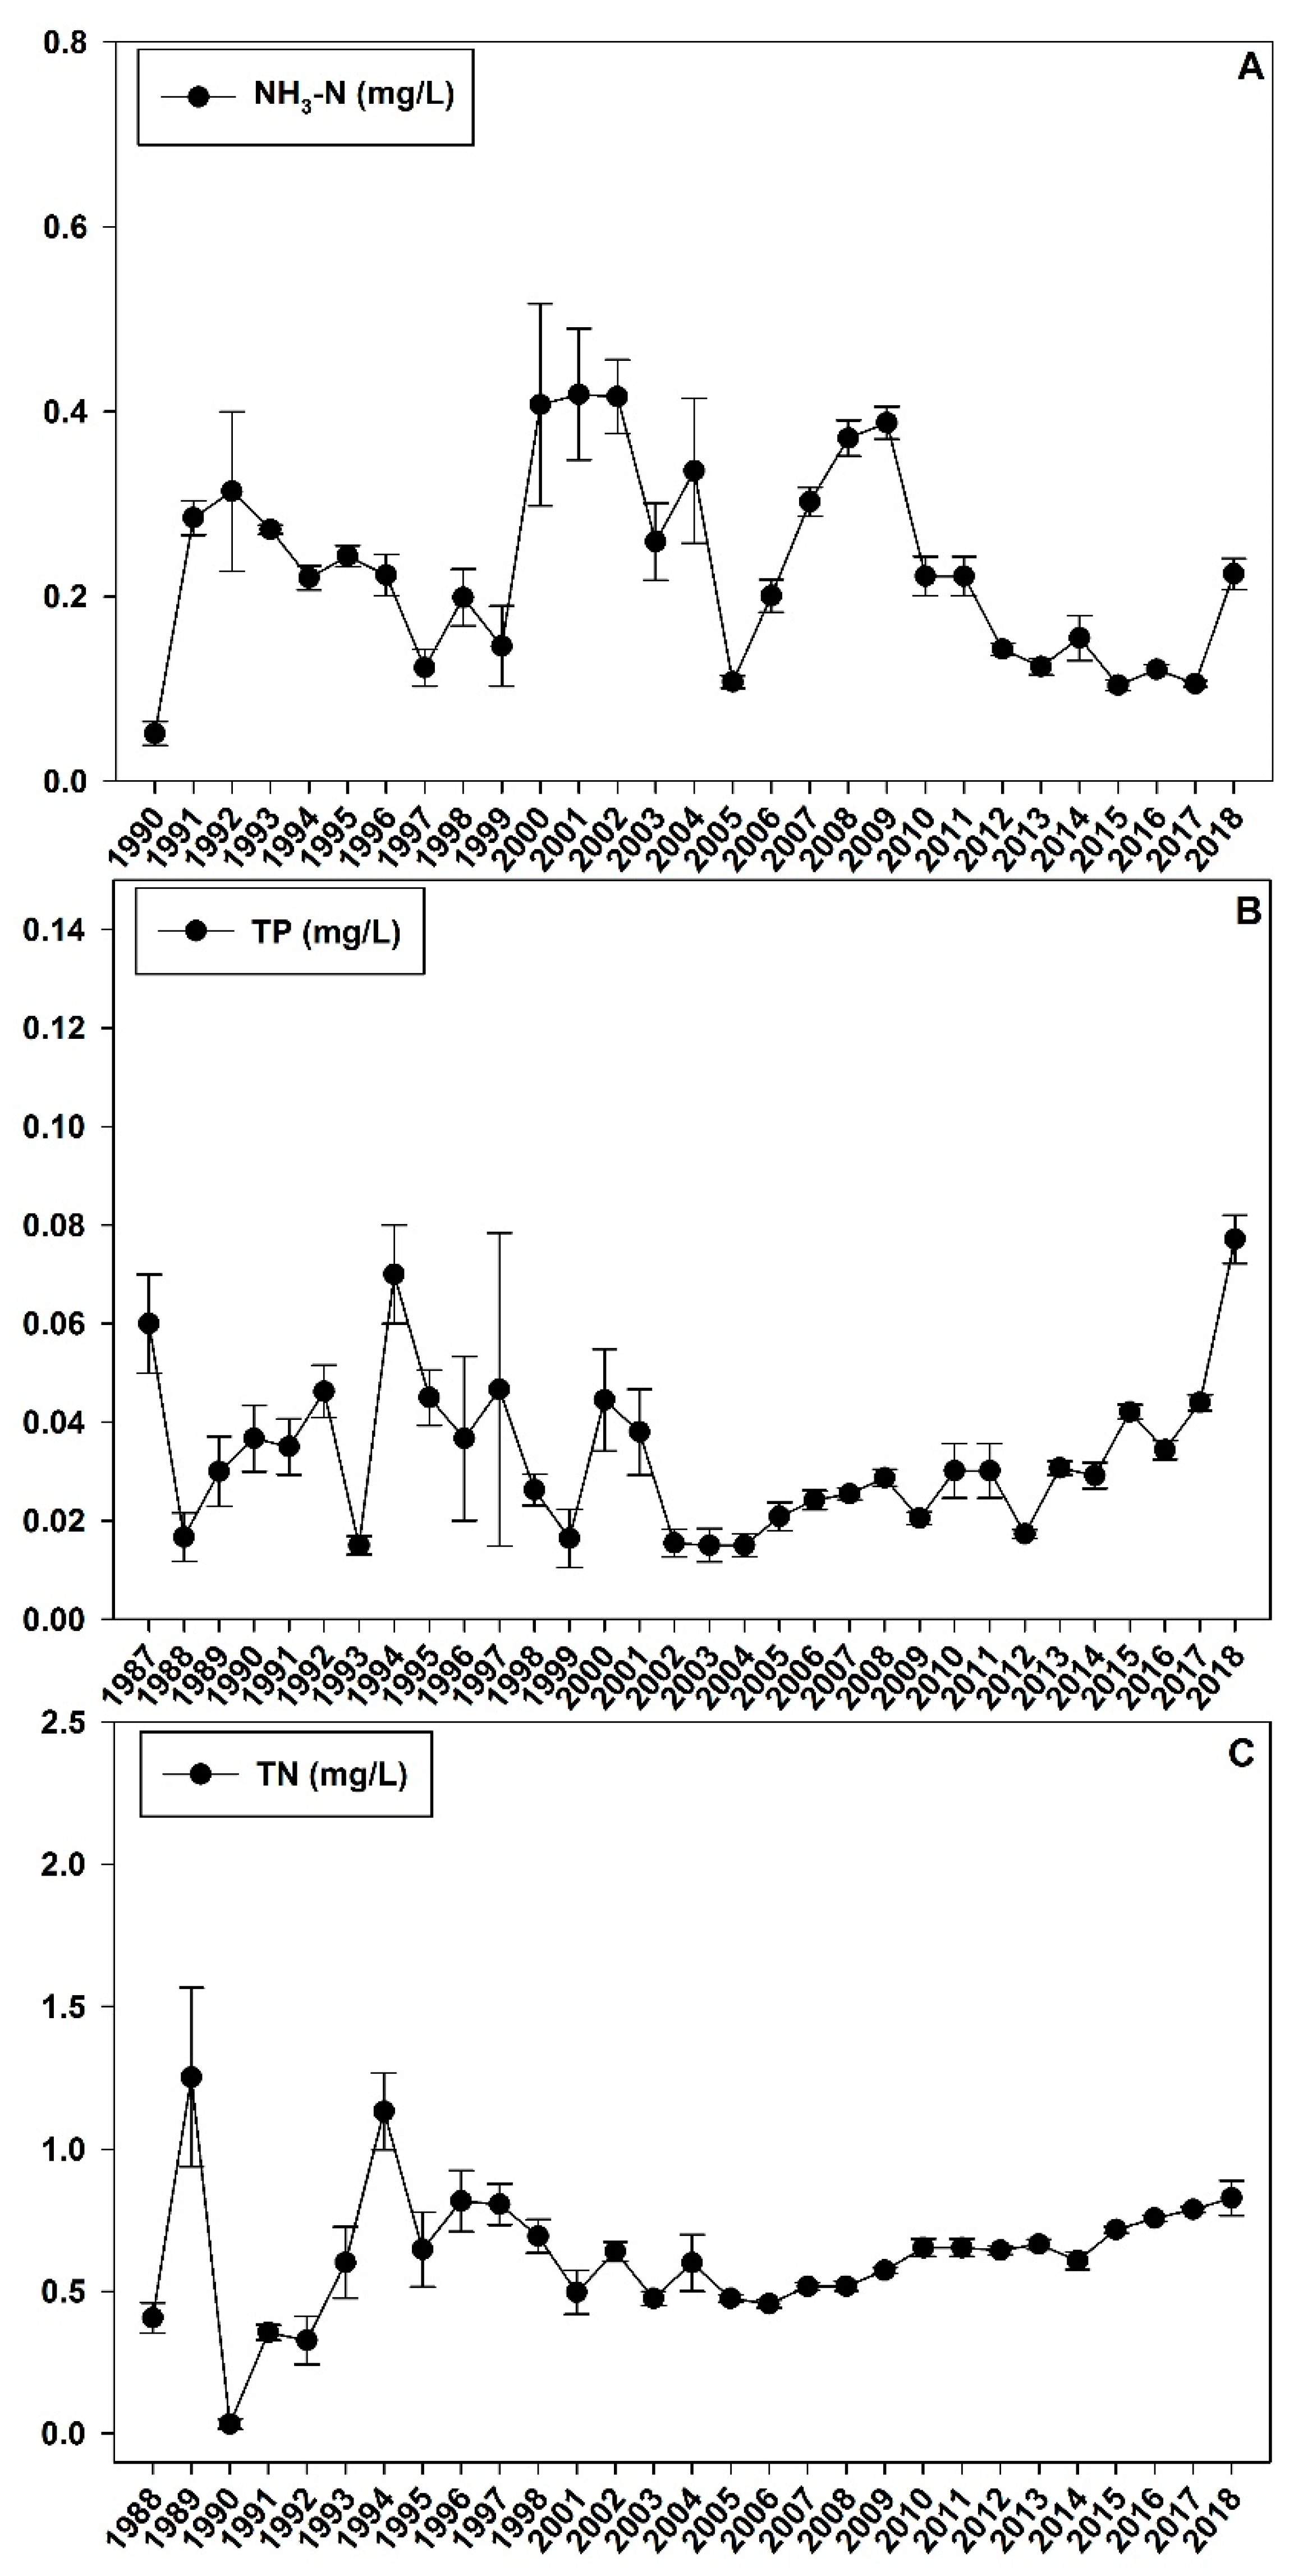
Figure 3.
Historical water quality data (A): NH3-N; (B): TP; and (C): TN in Chenghai Lake from 1986 to 2018.
Figure 3.
Historical water quality data (A): NH3-N; (B): TP; and (C): TN in Chenghai Lake from 1986 to 2018.

Figure 4.
RDA ordination diagram of the relationship between aquatic species and environmental variables in Chenghai Lake.
Figure 4.
RDA ordination diagram of the relationship between aquatic species and environmental variables in Chenghai Lake.

Figure 5.
RDA ordination diagram of the relationship between aquatic species and heavy metals in Chenghai Lake.
Figure 5.
RDA ordination diagram of the relationship between aquatic species and heavy metals in Chenghai Lake.

Figure 6.
RDA ordination diagram of the relationship between aquatic species and anions in Chenghai Lake.
Figure 6.
RDA ordination diagram of the relationship between aquatic species and anions in Chenghai Lake.

Figure 7.
RDA ordination diagram of the relationship between aquatic species and nutrients in Chenghai Lake.
Figure 7.
RDA ordination diagram of the relationship between aquatic species and nutrients in Chenghai Lake.

Figure 8.
A conceptual model illustrating the different stages of aquatic vegetation succession in Chenghai Lake.
Figure 8.
A conceptual model illustrating the different stages of aquatic vegetation succession in Chenghai Lake.


Table 1.
Species richness and coverage of aquatic plants in Chenghai Lake from 1980 to 2018.
| Years | Species | Coverage (km2) | Reference | Sampling Methods |
|---|---|---|---|---|
| 1980 | Vallisneria natans | --- | [35,36] | Used route investigation, sampling, and other ecological methods. |
| Potamogeton pectinatus | ||||
| Myriophyllum spicatum | ||||
| Chara sp. | ||||
| 1992 | Potamogeton crispus | 5.28 | [37] | Used a professional submersed rake to take 86 random samples. |
| Vallisneria natans | ||||
| Potamogeton pectinatus | ||||
| Myriophyllum spicatum | ||||
| Chara sp. | ||||
| 2010 | Potamogeton pectinatus | 0.73 | [38] | Used a professional submersed rake to take 80 random samples. |
| Myriophyllum spicatum | ||||
| 2018 | Potamogeton pectinatus | 0.38 | --- | Used sample points and zone surveys to take 175 samples. |
| Lemna minor | ||||
| Zannichellia palustris | ||||
| Chara sp. |
Table 2.
The water quality of Chenghai Lake in 2018.
| Metal Cations | Ca2+ (mg/L) | K2+ (mg/L) | Mg2+ (mg/L) | Na2+ (mg/L) | Cu2+ (μg/L) | Zn2+ (μg/L) | As2+ (μg/L) | Cd2+ (μg/L) | Cr2+ (μg/L) |
| 9.19 ± 0.27 | 11.35 ± 0.08 | 49.44 ± 0.29 | 222.68 ± 1.99 | 1.22 ± 0.19 | 4.35 ± 1.9 | 13.09 ± 0.5 | 0.05 ± 0.01 | 26.36 ± 2.19 | |
| Nutrient Salts | NH4-N (mg/L) | TP (mg/L) | TDP (mg/L) | COD (mg/L) | CaO (mg/L) | TN (mg/L) | TDN (mg/L) | TOC (mg/L) | |
| 0.22 ± 0.07 | 0.09 ± 0.01 | 0.06 ± 0.01 | 29.41 ± 5.94 | 412.37 ± 2.32 | 0.92 ± 0.08 | 0.58 ± 0.1 | 24.92 ± 0.99 | ||
| Anions | F- (mg/L) | Cl− (mg/L) | SO42− (mg/L) | Br− (mg/L) | PO42− (mg/L) | NO3− (mg/L) | |||
| 2.58 ± 0.66 | 26.1 ± 0.41 | 14.77 ± 1.35 | 1.18 ± 0.01 | 0.01 ± 0 | 0.34 ± 0.03 | ||||
| Other Values | T (℃) | DO (mg/L) | C (mg/L) | TDS (mg/L) | SAL | pH | TURB (mg/L) | SS (mg/L) | Chlorophyll a (mg/L) |
| 24.14 ± 0.91 | 7.67 ± 2.23 | 1232.56 ± 110.98 | 1416.24 ± 2098.27 | 0.64 ± 0.02 | 9.64 ± 0.12 | 32.68 ± 36.73 | 30.08 ± 24.43 | 62.13 ± 31.81 | |
| ORP (mV) | Transparency (m) | ||||||||
| 83.69 ± 35.15 | 1.01 ± 0.16 |
© 2019 by the authors. Licensee MDPI, Basel, Switzerland. This article is an open access article distributed under the terms and conditions of the Creative Commons Attribution (CC BY) license (http://creativecommons.org/licenses/by/4.0/).
Share and Cite
MDPI and ACS Style
Yu, H.; Qi, W.; Liu, C.; Yang, L.; Wang, L.; Lv, T.; Peng, J. Different Stages of Aquatic Vegetation Succession Driven by Environmental Disturbance in the Last 38 Years. Water 2019, 11, 1412. https://doi.org/10.3390/w11071412
AMA Style
Yu H, Qi W, Liu C, Yang L, Wang L, Lv T, Peng J. Different Stages of Aquatic Vegetation Succession Driven by Environmental Disturbance in the Last 38 Years. Water. 2019; 11(7):1412. https://doi.org/10.3390/w11071412
Chicago/Turabian StyleYu, Hongwei, Weixiao Qi, Chunhua Liu, Lei Yang, Ligong Wang, Tian Lv, and Jianfeng Peng. 2019. "Different Stages of Aquatic Vegetation Succession Driven by Environmental Disturbance in the Last 38 Years" Water 11, no. 7: 1412. https://doi.org/10.3390/w11071412
Note that from the first issue of 2016, this journal uses article numbers instead of page numbers. See further details here.