Article

Temporal and Spatial Variation Trends in Water Quality Based on the WPI Index in the Shallow Lake of an Arid Area: A Case Study of Lake Ulansuhai, China

1
School of Ecology and Environment in Inner Mongolia University, Key Laboratory of River and Lake in Inner Mongolia Autonomous Region, Hohhot 010021, Inner Mongolia Autonomous, China
2
Key Laboratory of Ecology and Resources Use of the Mongolian Plateau of Ministry of Education, Hohhot 010021, Inner Mongolia Autonomous, China
*
Author to whom correspondence should be addressed.
Water 2019, 11(7), 1410; https://doi.org/10.3390/w11071410
Submission received: 7 May 2019 / Revised: 28 June 2019 / Accepted: 5 July 2019 / Published: 9 July 2019
(This article belongs to the Section Water Quality and Contamination)

Abstract

:
Ulansuhai, the largest shallow lake of the Yellow River of China, is an important component of the Hetao region irrigation system. Many concerns have concentrated on its water quality, which affects the local water security and sustainable economic development. In this study, the water pollution index (WPI), an effective water quality evaluation method, was used to compare the pollution levels among pollution indicators and to determine the major pollution indicators. The regime shift index (RSI) approach was employed to identify the water quality trends. Cluster analysis and Daniel trend test methods were employed to analyse the inner-annual and inter-annual spatio-temporal trends of the typical water quality indicators (e.g., total nitrogen (TN), total phosphorus (TP), dissolved oxygen (DO), and chemical oxygen demand (COD)) in Lake Ulansuhai. The results show that the water quality of Ulansuhai improved from 1998 to 2017; spatial variations in the WPITN, WPITP, and WPIDO followed the order of inlet > centre and outlet, while spatial variations in the WPICOD showed the order of outlet > inlet > centre. TN was the critical pollution indicator throughout the year. In 2017, the dry season and wet season were determined using cluster analysis. The WPICOD was higher than the WPITN, WPITP, and WPIDO in the dry season, while the WPITN, WPITP, and WPIDO were higher than the WPICOD in the wet season. WPI was grouped into three clusters: highly polluted regions, moderately polluted regions, and less polluted regions, However, there is a discrepancy between the three polluted regions that were divided into the dry season and the wet season. The WPICOD was highest among all pollution indicators in 2017. Major sources of pollution that contribute to the deterioration of water quality include inner-annual or inter-annual pollution, agricultural non-point pollution, point source pollution, and internal pollution. This study provides useful information for authorities to effectively manage water quality and control water pollution.

1. Introduction

As an important source of freshwater on earth, lakes play an irreplaceable role in maintaining the balance of ecosystems in the basin [1]. The determination of water quality is important to assess the health of a watershed and to make necessary management decisions to control current and future pollution in receiving water bodies [2]. There are numerous methods for water quality evaluation, such as fuzzy comprehensive evaluation [3], the grey relational method [4], multivariate statistical methods [5], the artificial neural network [6] and the comprehensive pollution index method [7]. The fuzzy comprehensive evaluation method is used for the comprehensive evaluation of water quality with high requirements and a multitude of uncertain factors. The grey relational method can determine the water quality level by comparing the results from monitoring data and surface water quality standards. The principal component analysis can be applied to water quality assessment when using various evaluation indicators. The neural network method can objectively and accurately obtain the evaluation results of the water quality standard class. The comprehensive pollution index method can determine the main pollutants and establish the correspondence between multiple water quality indicators and their corresponding standards. In contrast, the water pollution index (WPI) extends the single factor evaluation method and has several apparent advantages. These advantages include the identification of major pollutants, comparison of the pollution degree for different water quality indicators, quantitative assessment of the water quality, and comparison of the inferior to V water quality standard classes. Most importantly, it can show the spatio-temporal variation in lake water quality and simplify the calculation procedure [8,9,10].
Currently, the evaluation of water quality is mainly based on single indicators of physical, chemical, hydrological, microbiological, and biological features, etc. When analysing numerous water quality indicators, it is often difficult to explain the water quality assessment results because each indicator has a different quality class. The WPI value overcomes this problem and can explain the water quality more clearly [11] by providing a single assessment score, which can be used to compare different indicators’ pollution degrees. Wang et al. used the WPI to evaluate the riverine water quality of the north bank in Dianchi Lake [12] and combined the multivariate statistical analysis, WPI, and Daniel trend test methods to evaluate the spatial and temporal variations in water quality in Fuxian Lake [13]. Liu et al. used the WPI to evaluate the water quality of a mainstream river in Shandong Province, and found that the WPI is more consistent with the riverine macroscopic governance process in the river and more concise than other water quality assessment methods [14]. Li et al. presented a fuzzy water pollution index method (FWPI) to evaluate the water quality of Sichuan Qu River and compared it with the methods of fuzzy comprehensive evaluation and grey relational analysis. They found the evaluation results of the FWPI to be more reliable [15]. Ana used the WPI to analyse the water quality of the Danube-Tisa-Danube Canal in Serbia from 2004 to 2009 and conducted a pollution assessment [16]. Jovana applied the WPI to assess the water pollution status of four hydrological stations in 1993–1996 and 2006–2009. The results showed that the significant increase in the inorganic pollution index (Fe, Mn) of the Borska Reka River was mainly caused by mining, while the increase in organic pollution indicators (ammonia, E. coli, BOD5) in Timok River was due to the voluntary discharge of domestic sewage [17]. In Greece, the WPI has also been applied to the assessment of drinking water quality [18]. In addition, the revised WPI was utilised to quantify environmental changes in the Mersey Basin in England by combining it with historical and geographic methods [19]. Currently, the WPI is mostly used for the evaluation of water quality in domestic humid and semi-humid areas. However, there have been fewer applications of this method in arid and semi-arid regions.
Lake Ulansuhai, the largest shallow lake in the Yellow River Basin of China, has an important ecological status and huge socioeconomic effects. Its water quality directly affects the water security of the residents in the lower Yellow River basin [20]. However, with the increase in intensive human activities, the lake is suffering from many problems, including increases its nutrient concentration and organic pollution, as well as eutrophication [21]. The nutrient input exceeds the water environment capacity, resulting in algal blooms under appropriate weather conditions. Abloom-prone area covers approximately 10 km2 in Xidatan area of Lake Ulansuhai [22]. So far, many studies have been conducted on the distribution characteristics of nutrient status during the frozen period and non-frozen period [23]. Moreover, some researchers have carried out comprehensive evaluation and analysis ofthe water quality of the Lake Ulansuhai through various methods, such as the fuzzy comprehensive evaluation method [24] and the grey model evaluation method [25]. The WPI is a useful tool for evaluating the water quality, as it can integrate a series of water quality data into a single number with a simple formula and assess results based on different quality indicators. It can also completely eliminate the influence of variable dimension and reflect the pollution degree of surface water that has been applied extensively worldwide.
The aims of this study are as follows: (1) Evaluate the water quality of spatio-temporal variation based on the WPI on the inter-annual scale (1998–2017) and reveal the major pollution indicators; (2) combine WPI, cluster analysis method, and Daniel trend analysis to analyse the inner-annual (2017) spatio-temporal variation trends of the main pollution indicators; (3) investigate the main reasons for the inter and inner annual variation in the WPI of water quality indicators; and (4) provide a reference and rational suggestions for the improvement and effective management of lake water quality.

2. Materials and Methods
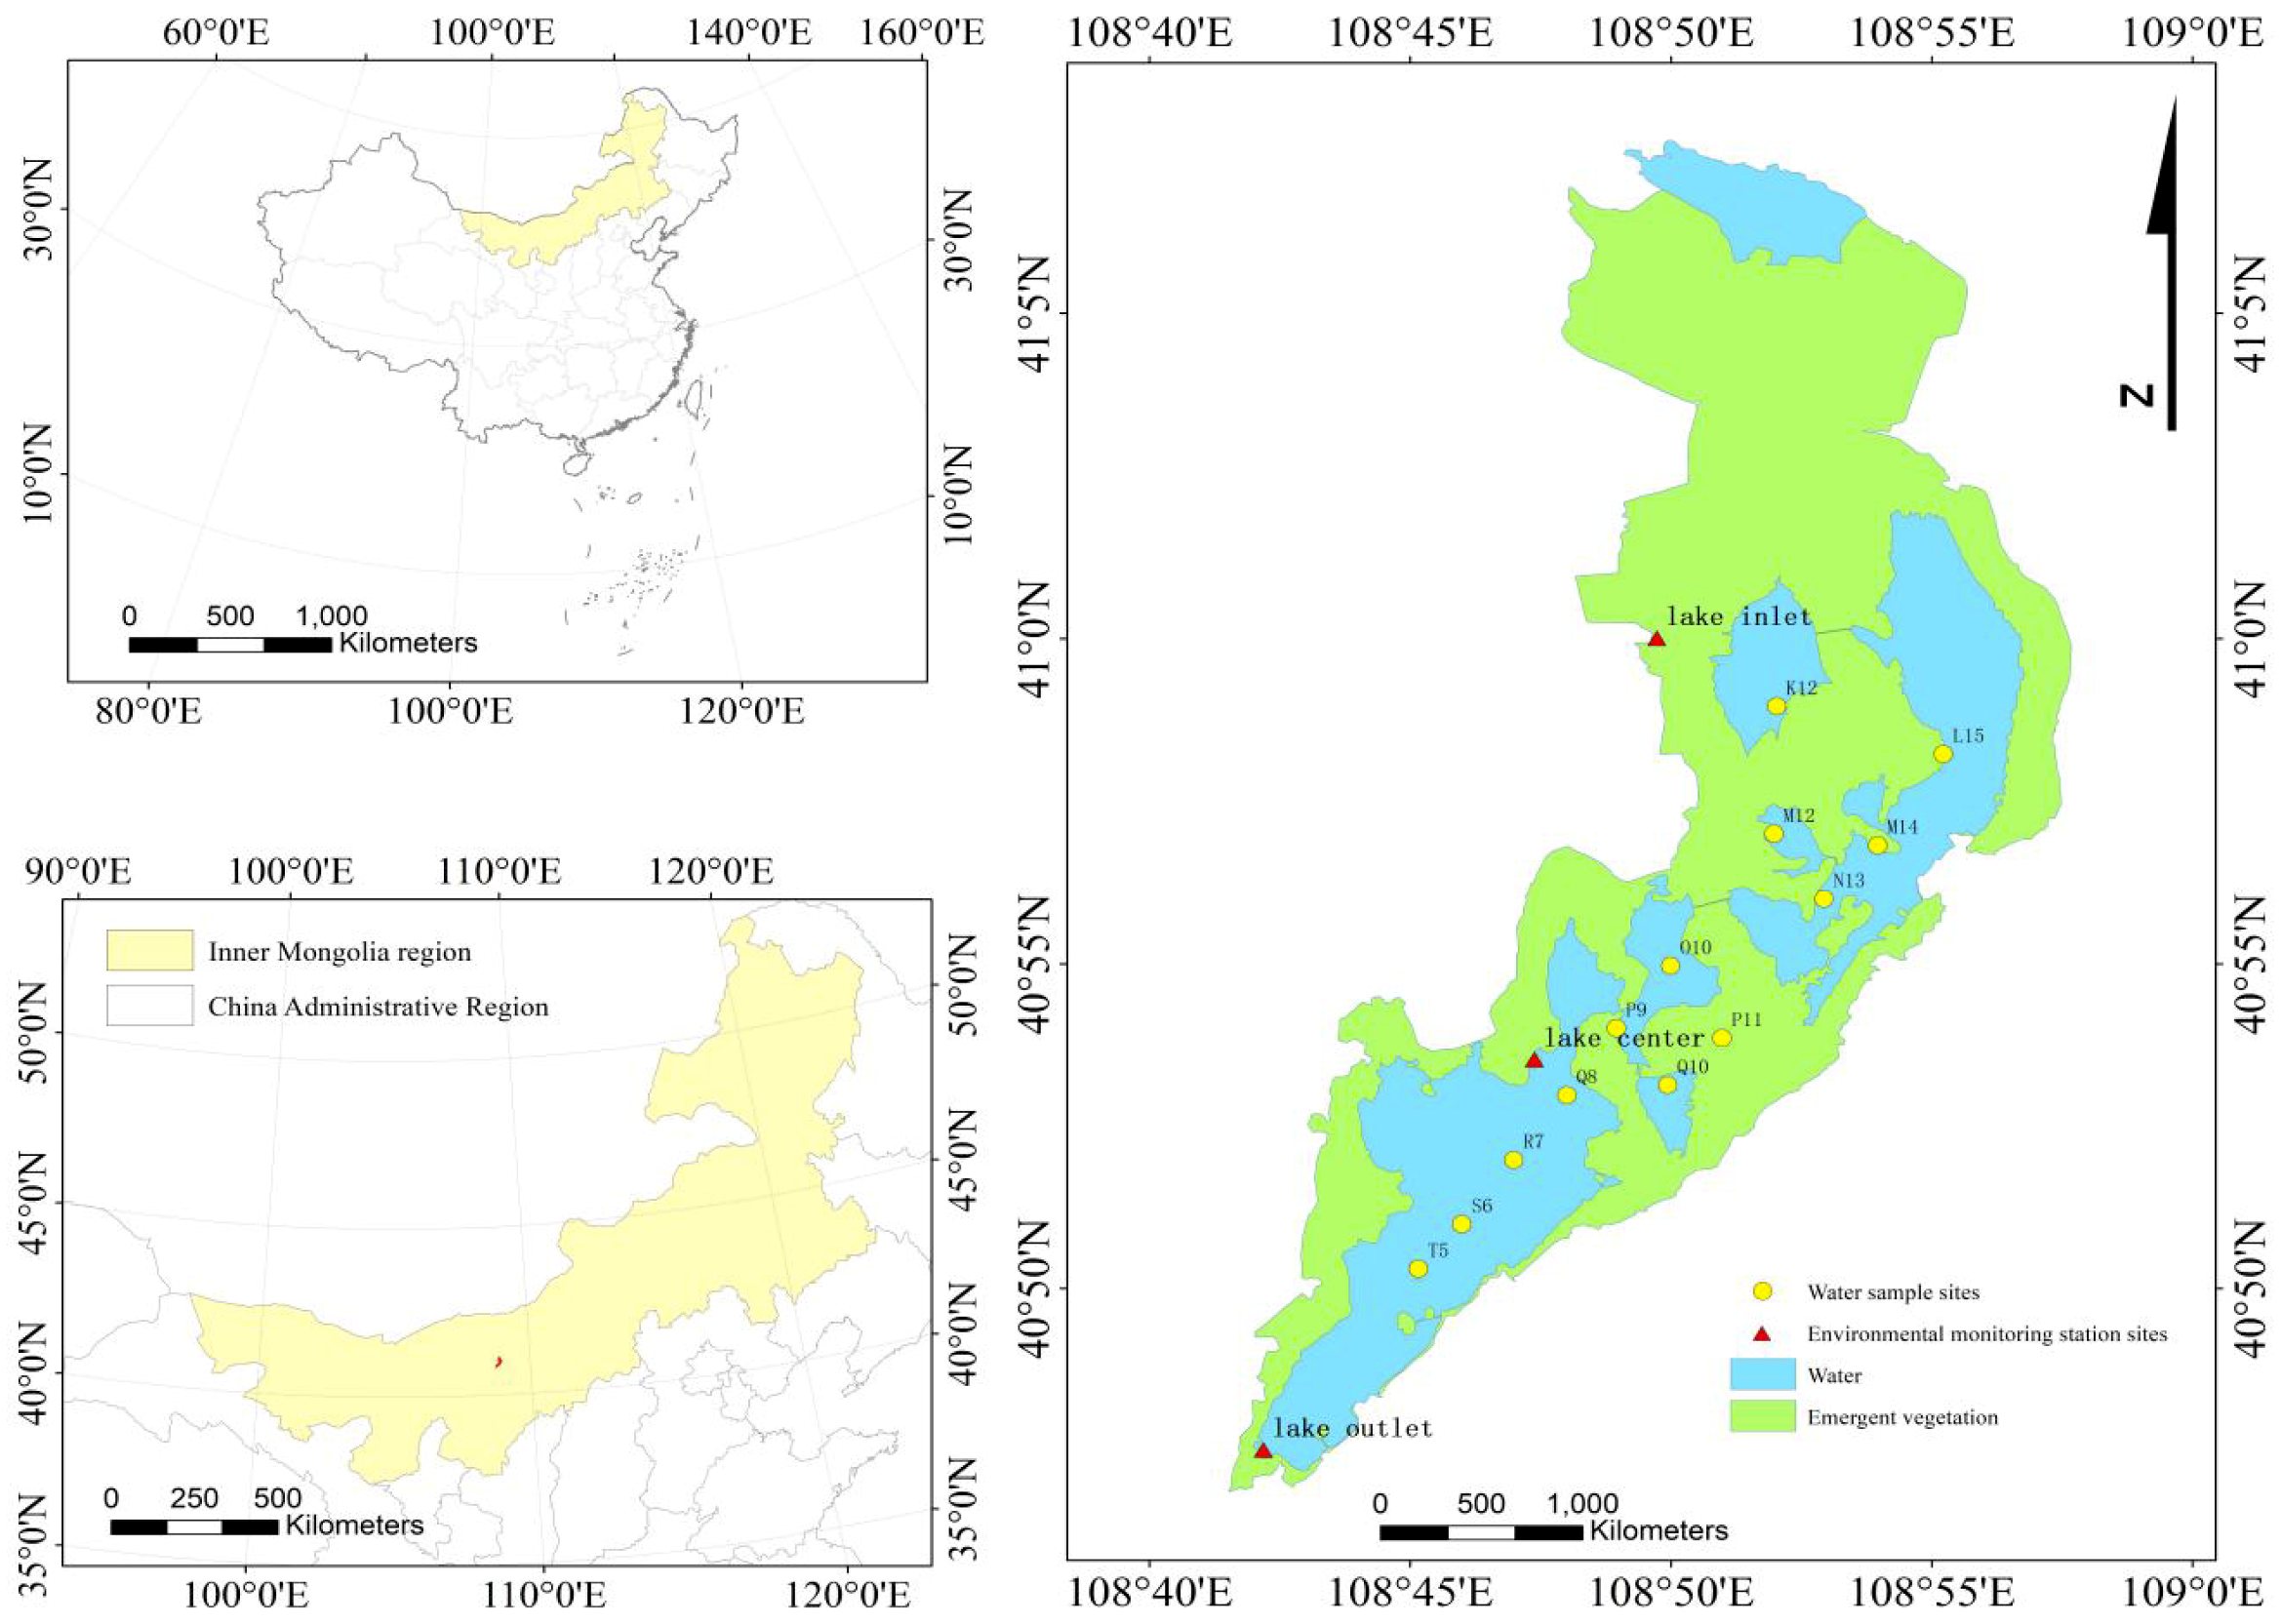
2.1. Study Area

Lake Ulansuhai (40°36′–41°03′ N, 108°43′–108°57′ E), located in northeast Urad Qianqi, Bayannur city, Inner Mongolia, China, is a typical shallow lake in the semiarid regions and is the largest freshwater lake in the Yellow River Basin [26]. The lake area is 293 km2 and its depth ranges from 0.5 to 2.5 m. The average annual precipitation is approximately 200 mm and the potential evaporation is 2300 mm [27]. Various pollutants from agricultural practices, industrial production, and domestic discharge to Lake Ulansuhai, impact the aquatic environment and lead to the degradation of ecosystem function as well as intensified and intensified eutrophication [22]. Currently, large-scale outbreaks of Huangtai algae have seriously threatened the habitat of animals and plants in Ulansuhai Lake and destroyed fishery resources. The ecological environment of the lake is extremely fragile. Lake Ulansuhai has been suffering from increasing eutrophication as a result of non-point pollution from Hetao Irrigation District. Lake Ulansuhai is significant for maintaining the ecological and environmental health and water function in the Yellow River Basin.

2.2. Data Collection and Measurement

Water quality data from 1998 to 2017 in the inlet, centre, and outlet of Lake Ulansuhai were measured by the Inner Mongolia Environmental Station in April, July, and October, respectively. Thirteen sampling sites were selected to collect water in January, April, June, July, August, and October of 2017 based on a 2 × 2 km plum-shape (Figure 1), and indicators such as total nitrogen (TN), total phosphorus (TP), dissolved oxygen (DO), and chemical oxygen demand (COD) were measured. The measurement methods are listed in Table 1.

2.3. Data Analysis Methods

2.3.1. Selection of Water Quality Indicators

Four indicators, including TN, TP, DO, and COD, were selected as the typical indicators to express the eutrophication level of Lake Ulansuhai, of which TN and TP are significant indices of eutrophication, DO is an indicator of water ecosystem health reflecting the water self-purification capacity [25], and COD is primarily used to characterize the organic pollutants in the water.

2.3.2. Water Pollution Index (WPI)

The calculation of the WPI was based on China’s surface water environmental quality standards (GB3838-2002) [28]. This method can compare the pollution level between different indicators and reveal the major pollution indicators [13]. The WPITN, WPITP, WPIDO, and WPICOD are expressed as the corresponding WPI values of TN, TP, DO, and COD. The water quality standard classes and their WPI values are shown in Table 2.
When the concentrations of TN, TP, and COD range from surface water quality standards Class I to Class V (GB3838-2002), the equation is as follows:
WPI ( i ) = WPI l ( i ) + WPI h ( i ) WPI l ( i ) C h ( i ) C l ( i ) × ( C ( i ) C l ( i ) )
When the concentration of DO is above 7.5 mg/L, the WPIDO is 20. When 2 ≤ DO < 7.5 mg/L, the WPIDO is defined as:
WPI ( i ) = WPI l ( i ) + WPI h ( i ) WPI l ( i ) C h ( i ) C l ( i ) × ( C l ( i ) C ( i ) )
When the concentrations of water quality indicators are higher than class V(GB3838-2002), the following Equation is used:
WPI ( i ) = 100 + C ( i ) C 5 ( i ) C 5 ( i ) × 40
In Equations (1)–(3), C ( i ) is the concentration of indicator i , C h ( i ) is the maximum concentration of indicator i , C l ( i ) is the minimum concentration of indicator i , C 5 ( i ) is the upper limit of Class V of indicator i , WPI ( i ) is the WPI value of indicator i , WPI h ( i ) is the maximum WPI value of indicator i , and WPI l ( i ) is the minimum WPI value of indicator i .

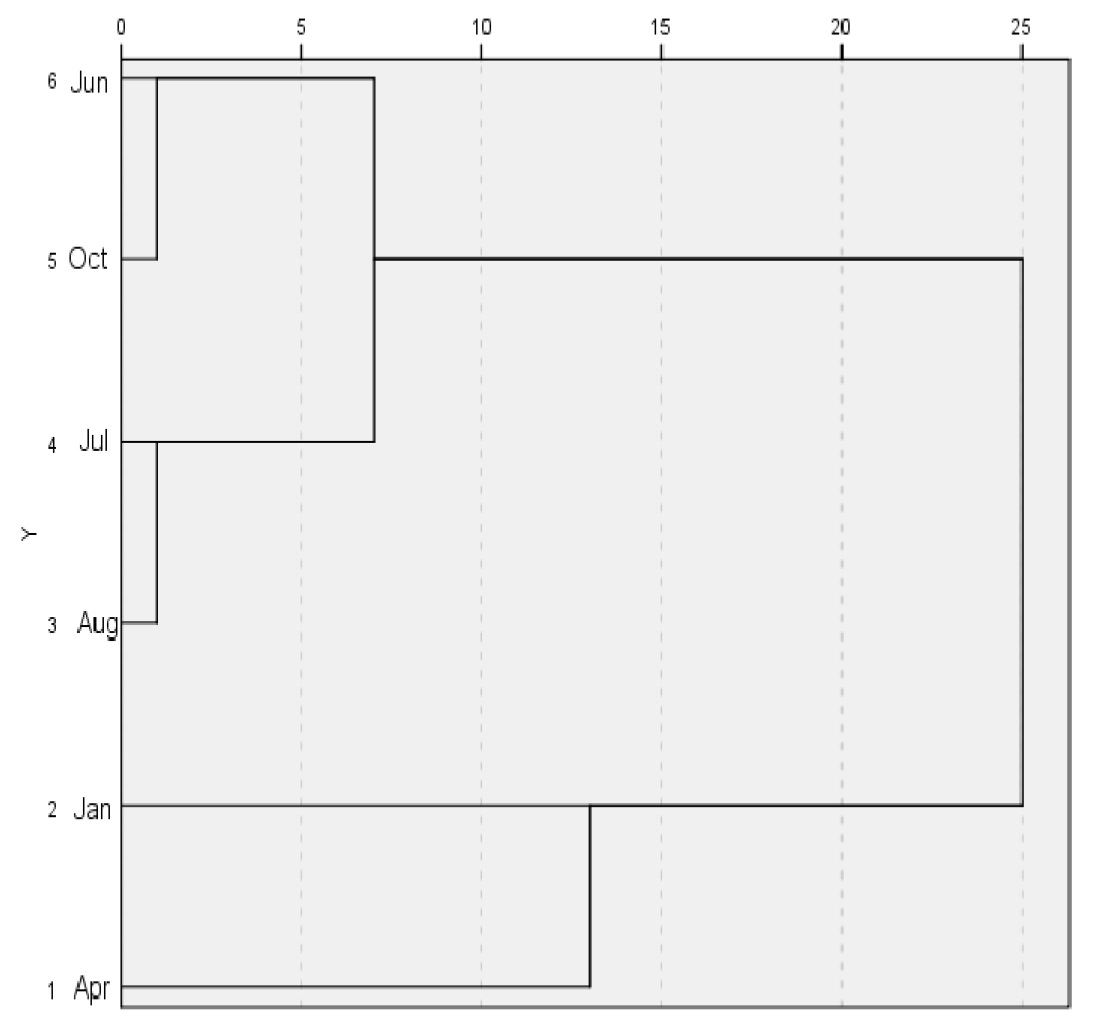
2.3.3. Daniel Trend Test

The Daniel trend test is a non-parametric test which can provide a quantitative evaluation of temporal and spatial variation trends. This method adopts Spearman rank correlation coefficient ( W p ) to inspect the significance of changes in trends. The Daniel rank correlation coefficient can be calculated using Equation (4):
R s = 1 [ 6 i = 1 N D i 2 ] / ( N 3 N ) D i = X i Y i
where R s is the rank correlation coefficient, D i is the difference between X i and Y i , X i is the sequence number of the raw concentration value of a water sample from 1 to N , Y i is the order number arranged by the time sequence number or the spatial arrangement of the serial number, and N is the number of sampling periods or the number of sampling sites. Comparing | R s | to the Spearman rank correlation W p , when | R s | > W p , the trend is significant. If R s > 0 , the trend is aggravated and increased. If R s < 0 , the trend is the opposite [29,30]. When | R s | W p , the trend is not significant, indicating that water quality changes stably throughout the evaluation period.

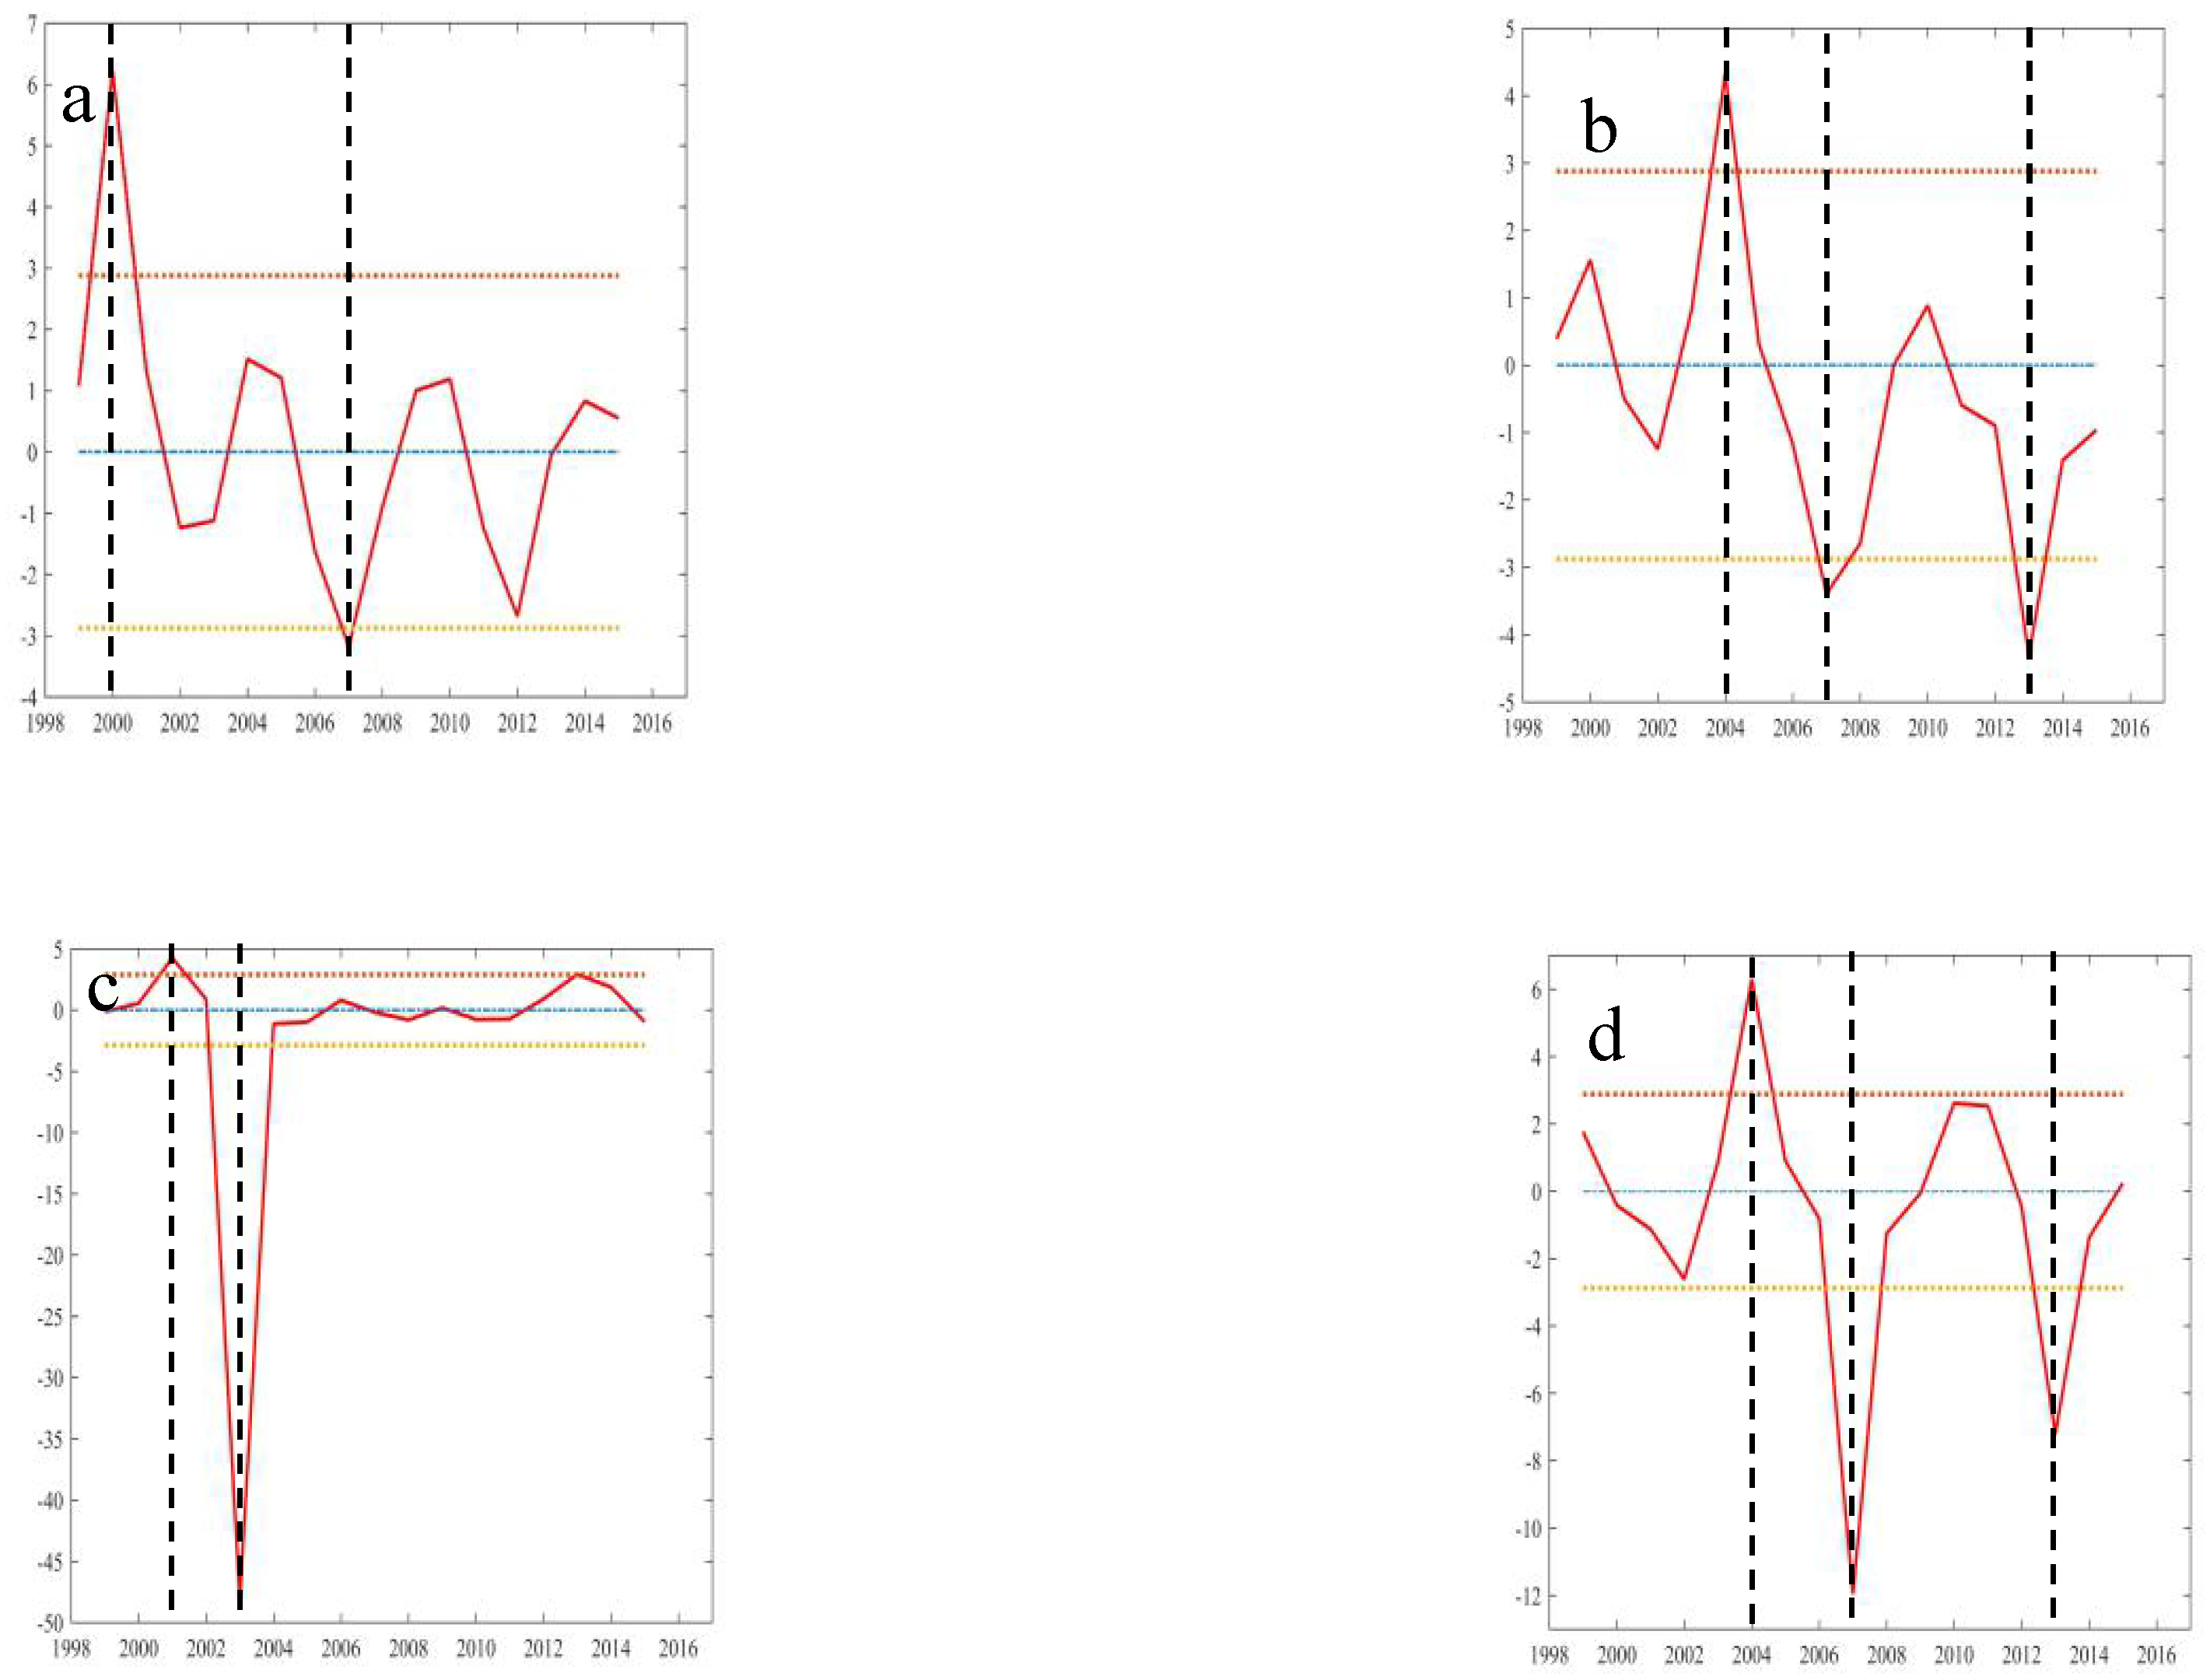
2.3.4. Regime Shift Index (RSI)

Based on the Students t-test using MATLAB software (2015b, MathWorks, Natick, MA, USA), for one-time series {x(t), t = 1, 2, …, M} from 1998 to 2017, the regime shift index (RSI) is expressed as follows:
RSI = T - test ( t 0 ) = x 2 ¯ x 1 ¯ 1 N t = t 0 + 1 t 0 + N [ x ( t ) x 2 ¯ ] 2 + 1 N t = t 0 N t 0 1 [ x ( t ) x 1 ¯ ] 2 x 1 ¯ = 1 N t = t 0 N t 0 1 x ( t )   and   x 2 ¯ = 1 N t = t 0 + 1 t 0 + N x ( t )
where N = 2 and, M = 20, the degrees of freedom for the test are 2N − 2, and t0 is the central time from N + 1 to M – N. x 1 ¯ is the average of N time series before t0, and x 2 ¯ is the average of N time series after t0. The running RSI is correlated with the two years before and after the central year, and the Student’s t-test confidence level is used to identify the significance of the changes [31,32,33].

3. Results

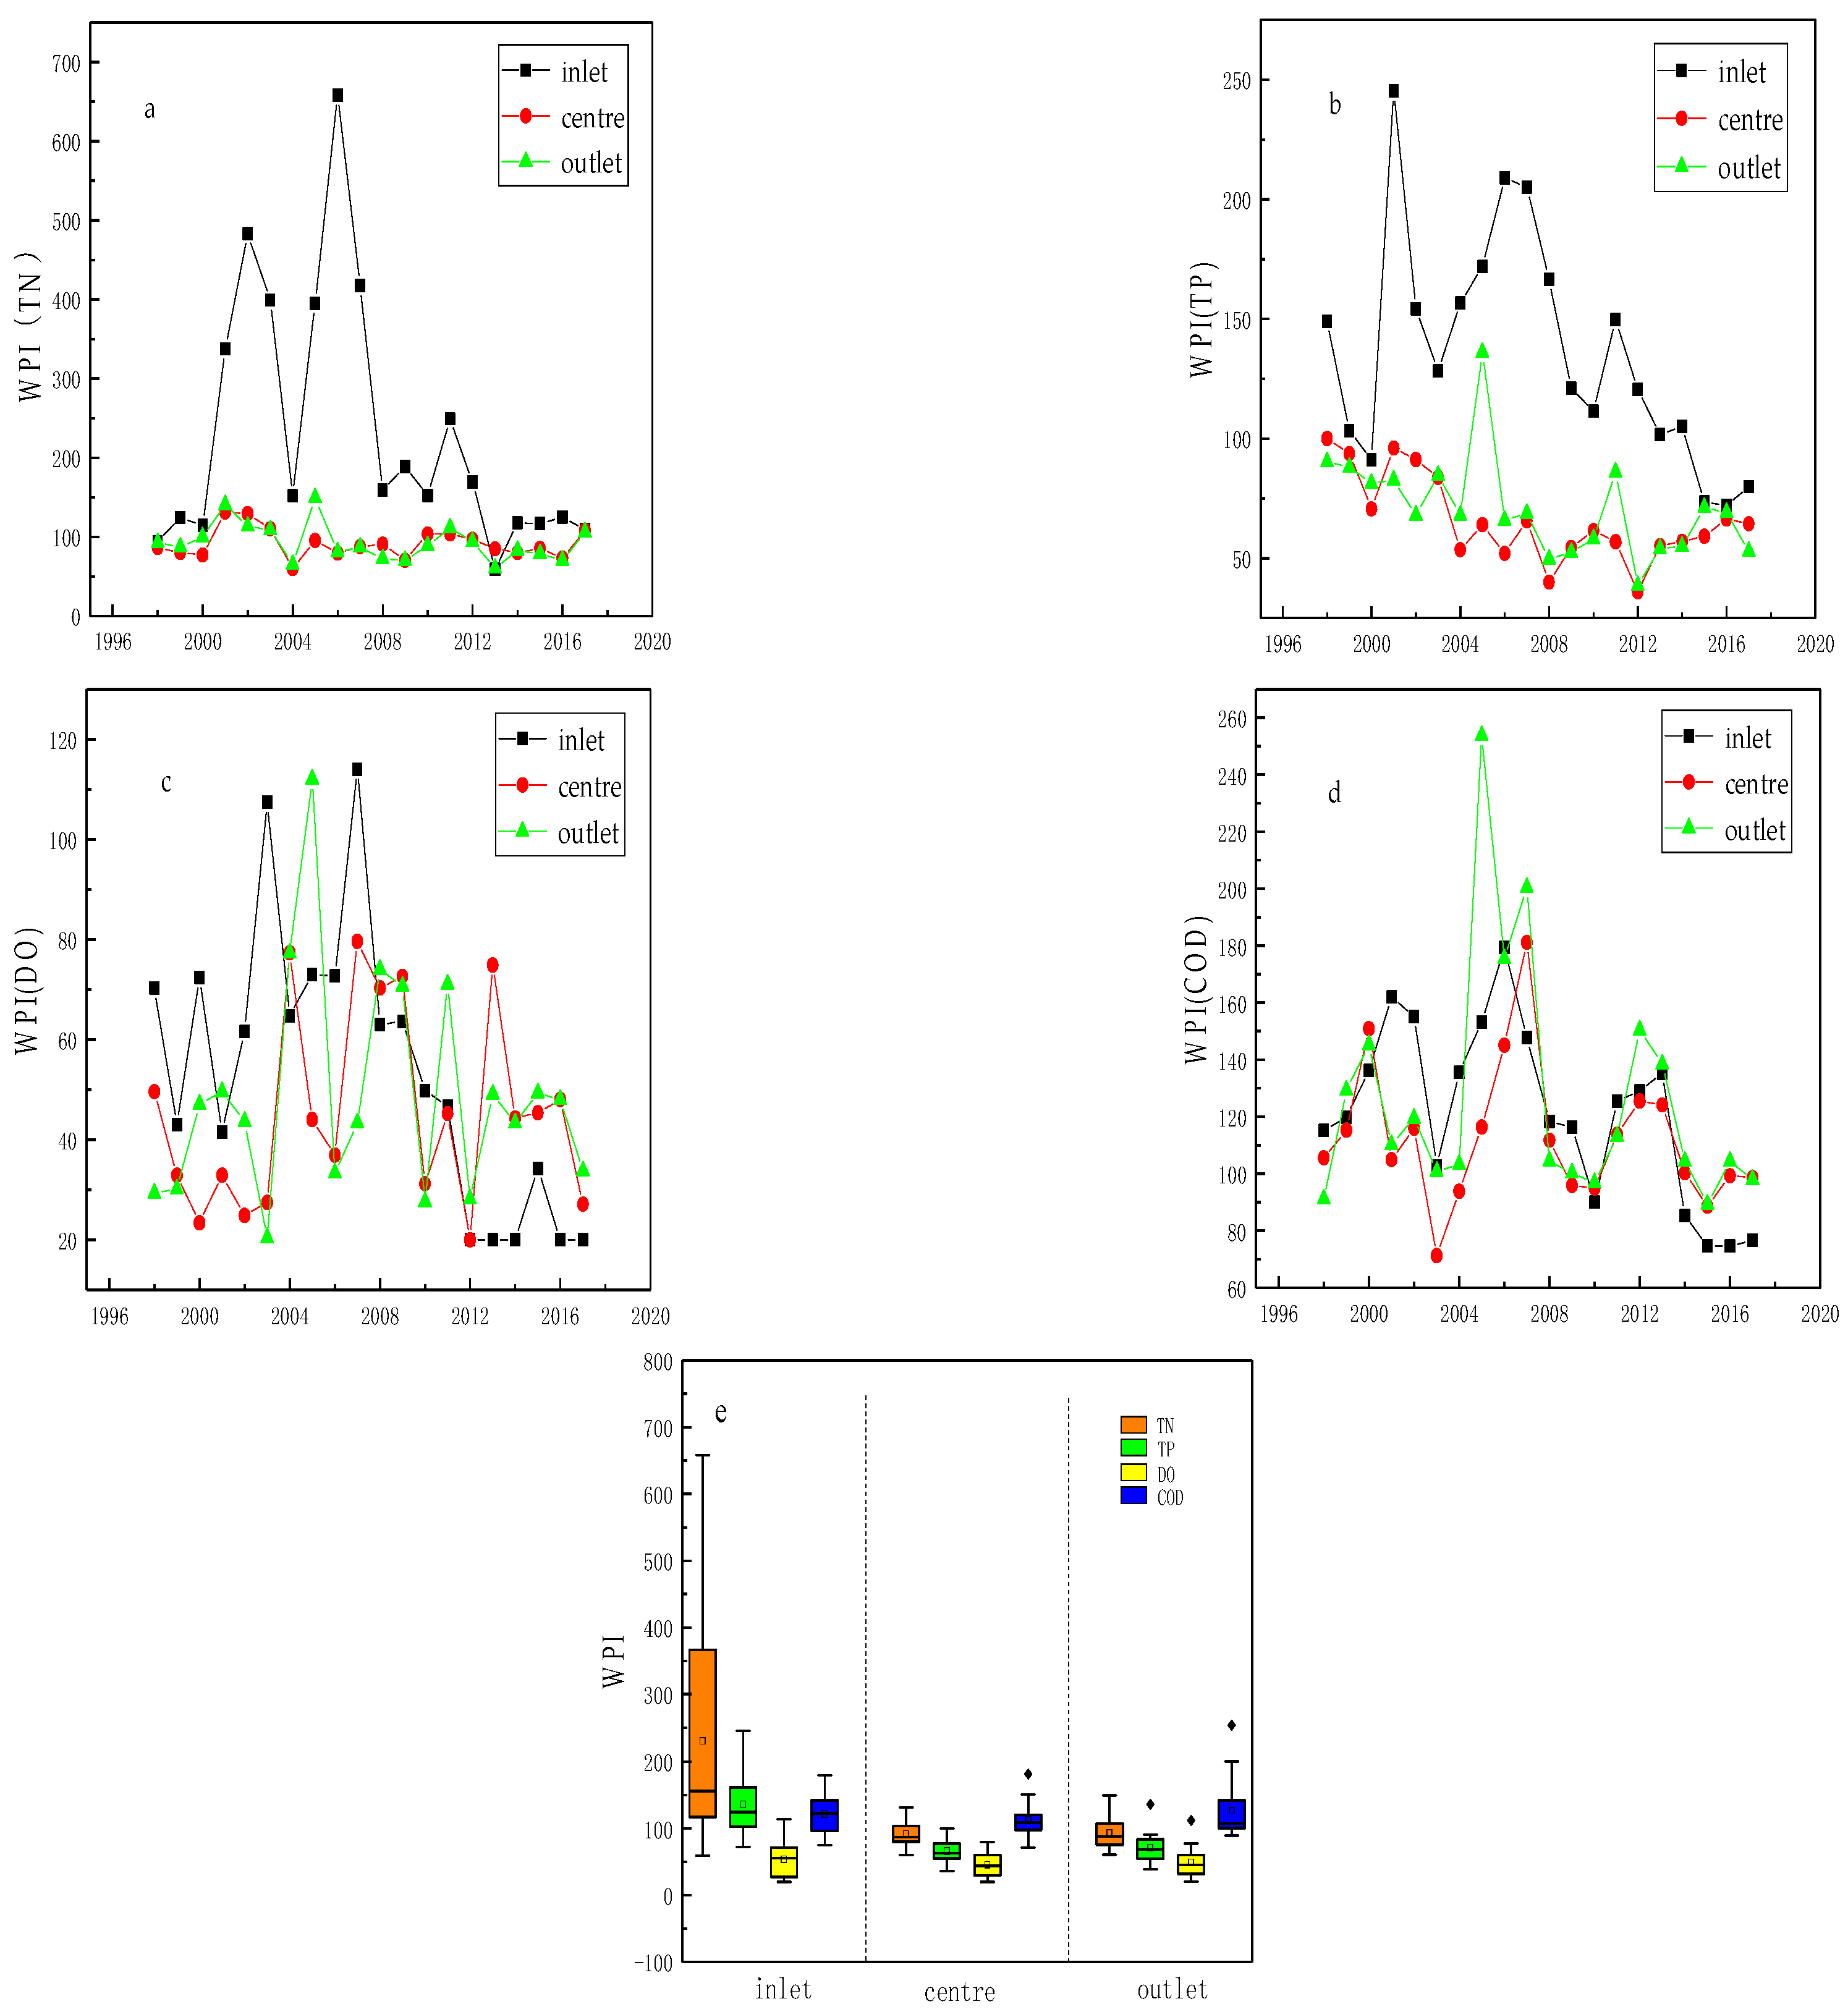
3.1. Inter-Annual Spatio-Temporal Variation in WPI Values during 1998–2017

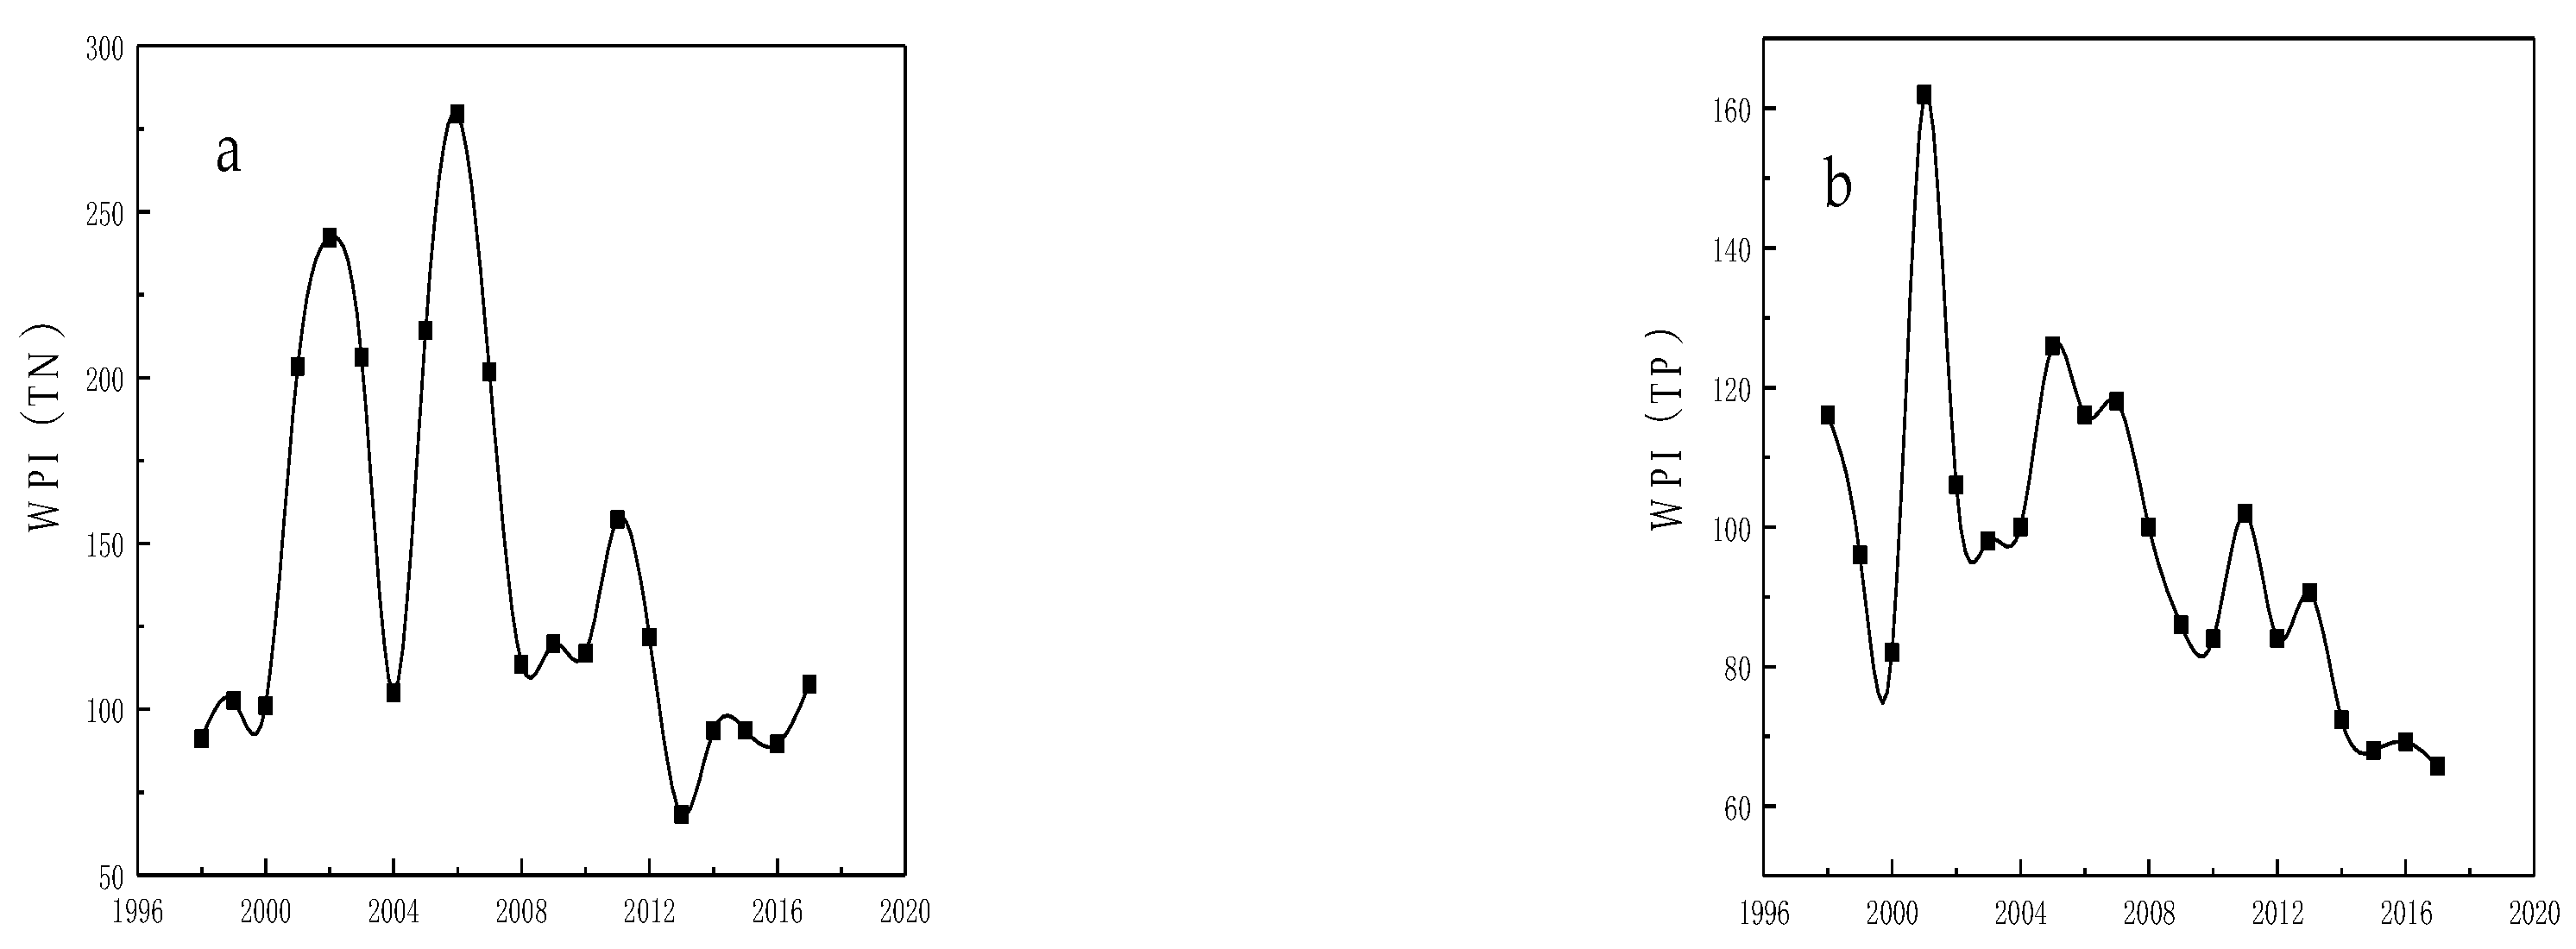
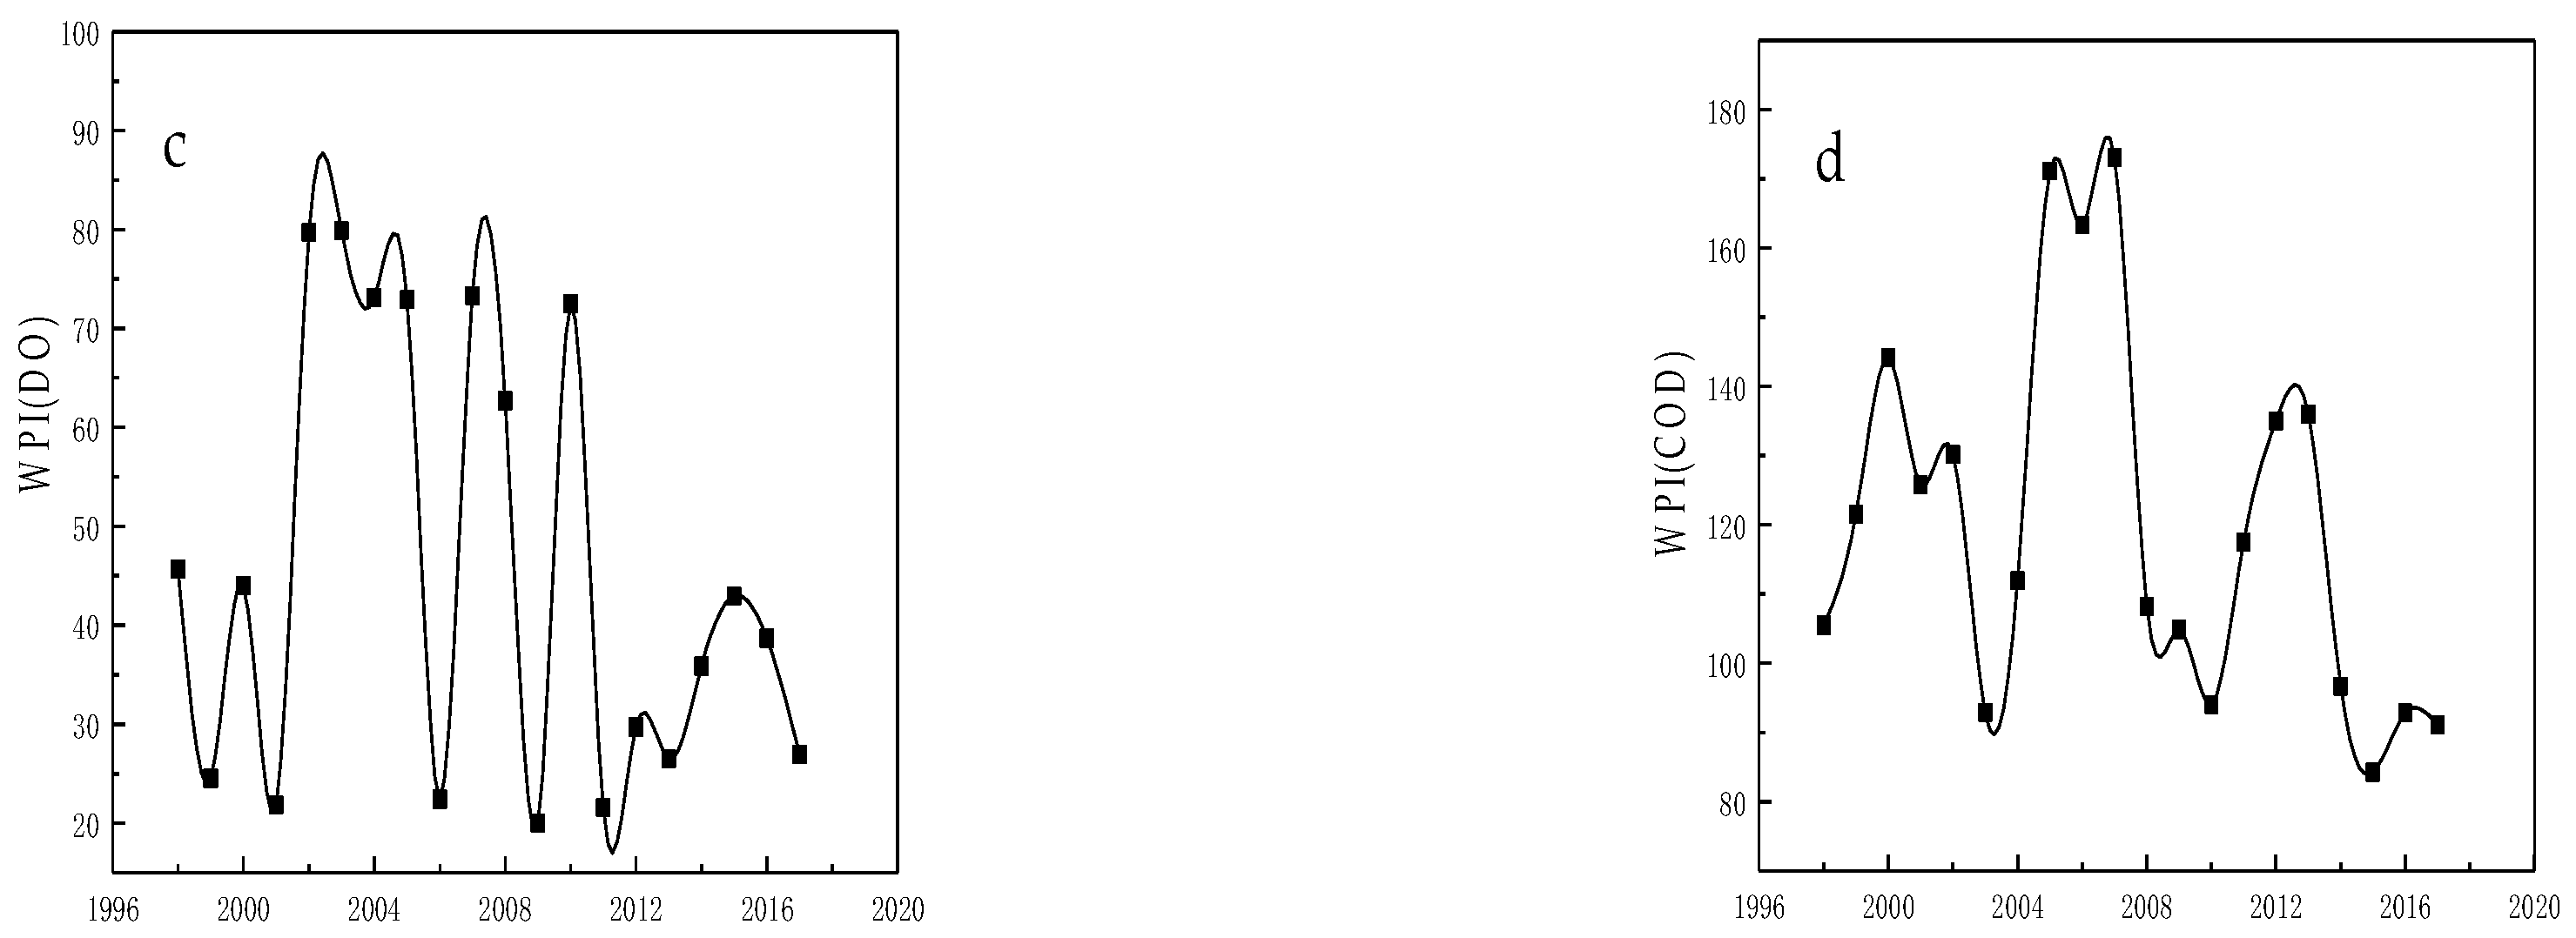
3.1.1. Temporal Variations in WPITN, WPITP, WPIDO, and WPICOD

The temporal variations in the WPITN, WPITP, WPIDO, and WPICOD are shown in Figure 2a–d. Higher WPI values of WPITN, WPITP, and WPICOD indicate heavier water pollution, while the DO concentration trend is opposite to its WPI value: the higher the DO concentration, the lower the WPIDO value and the better the water quality.
The WPITN in the Lake Ulansuhai ranged from 68 in 1998 to 279 in 2017. The multi-annual average WPITN was 141.4, which indicates serious pollution and a water quality standard class inferior to Class V. The WPITN was approximately 100 and remained stable from 1998 to 2000. It rose sharply to 242 in 2002, decreased to 105 in 2004, and increased again to 279 in 2006. In 2008–2017, it was relatively stable, with only a small fluctuation in 2011 and 2013, respectively.
The WPITP presented a decreasing trend with fluctuations that varied from 65 in 1998 to 162 in 2017. The multi-annual average WPITP was 97. In 2001, the WPITP appeared abnormal, showing a maximum of 162.
The temporal variation in the WPIDO can be divided into three stages: 1998–2001, 2002–2010, and 2011–2017. From 1998 to 2001, the WPIDO fluctuated by approximately 35. It reached 80 quickly in 2002 and kept a relatively high value of 70 in 2002–2010, except in 2006 and 2009. In 2006 and 2009, the WPIDO was approximately 23. In 2011 and 2017, the WPIDO showed a decreasing trend and fluctuated by approximately 30. In the past 20 years, the WPIDO has varied from 20 to 80 with an average of 45.7, much lower than that of the WPITN, WPITP, and WPICOD. It was not the main water pollution indicator of Lake Ulansuhai.
The WPICOD varied from 84 in 1998 to 173 in 2017. The temporal variation in WPICOD can be described using three stages. During the first stage (1998–2003), the WPICOD reached 144 in 2000 and decreased to 92.8 in 2003. During the second stage (2003–2010), the WPICOD reached its maximum in 2007, was above 160 in 2005–2007, and then decreased to 94 in 2010. During the third stage (2011–2017), the water quality deteriorated again in 2012 and 2013 with a WPICOD value of 135. The WPICOD decreased to 84 in 2015. Compared to the first and second stages, the water quality appears to have improved in the most recent four years.
The RSI method, based on the running Student’ s t-test, provided the ability to establish a significant confidence level for the differences between years and allowed an assessment of the most apparent regime shift data. Figure 3 shows the results of the regime shift analysis across the years.
Regime shifts in the of WPITN occurred in 2000 and 2007 (Figure 3a) and the WPIDO showed statistically significant changes in 2001 and 2003 (Figure 3c). Furthermore, the results of the WPITP and WPICOD show that the regime shift years were 2004, 2007, and 2013 (Figure 3b,d).
The horizontal dashed line indicates the significance test at the 99% confidence level, and the vertical dashed line indicates the extreme point of the significant region.

3.1.2. Spatial Variation in the WPI

The spatial variations in the WPITN, WPITP, WPIDO, and WPICOD in the inlet, centre, and outlet regions are shown in Figure 4a–d, and Figure 4e shows the box and whisker plots of spatial variation in Ulansuhai. According to the average value of WPI in the past 20 years, the spatial variation in the WPITN, WPITP, and WPIDO followed the order of inlet > outlet and centre, and the spatial variation in the WPICOD generally followed the order of outlet > inlet > centre. The water quality was better in the lake centre.
The WPITN and WPITP in the inlet were much higher than those in the lake centre and outlet in 1998–2017. The WPIDO was higher in the lake inlet than that in the centre and outlet between 1998 and 2003. The WPIDO in the lake inlet was lower than in the outlet and centre in 2012–2017. The WPIDO had no apparent variation in 2004–2011, and the water quality had improved. Spatial variation in the WPICOD was not evident in 1998–2017, of which the highest value appeared in 2005–2007 in the inlet of the lake.
In general, the WPITN had the highest value followed by WPICOD, WPITP, and WPIDO. TN was the most polluted water indicator over the past 20 years. Based on the average value of the WPITN of 141, the water quality of the Lake Ulansuhai was inferior to water quality standard class V in 1998–2017.

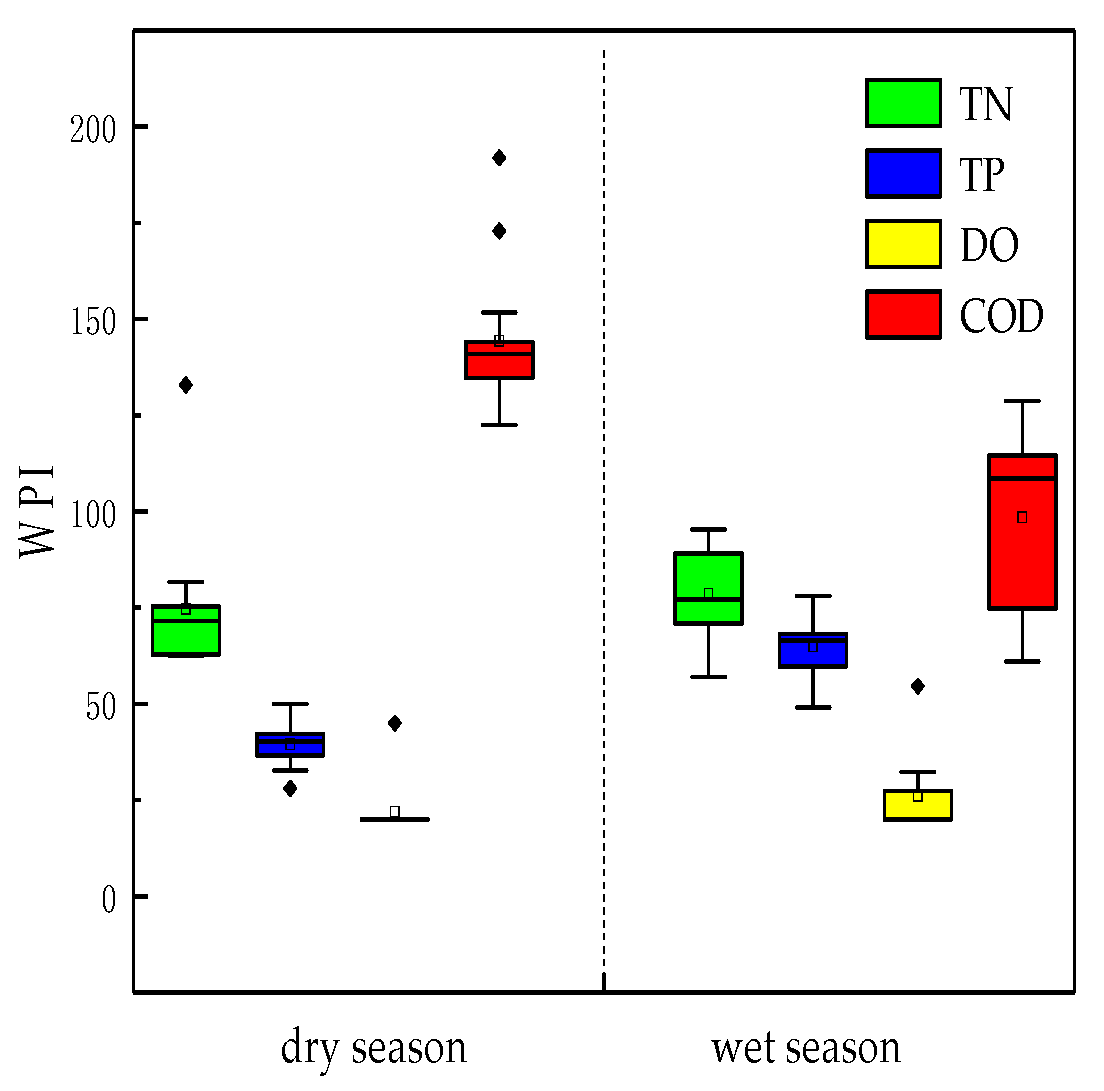
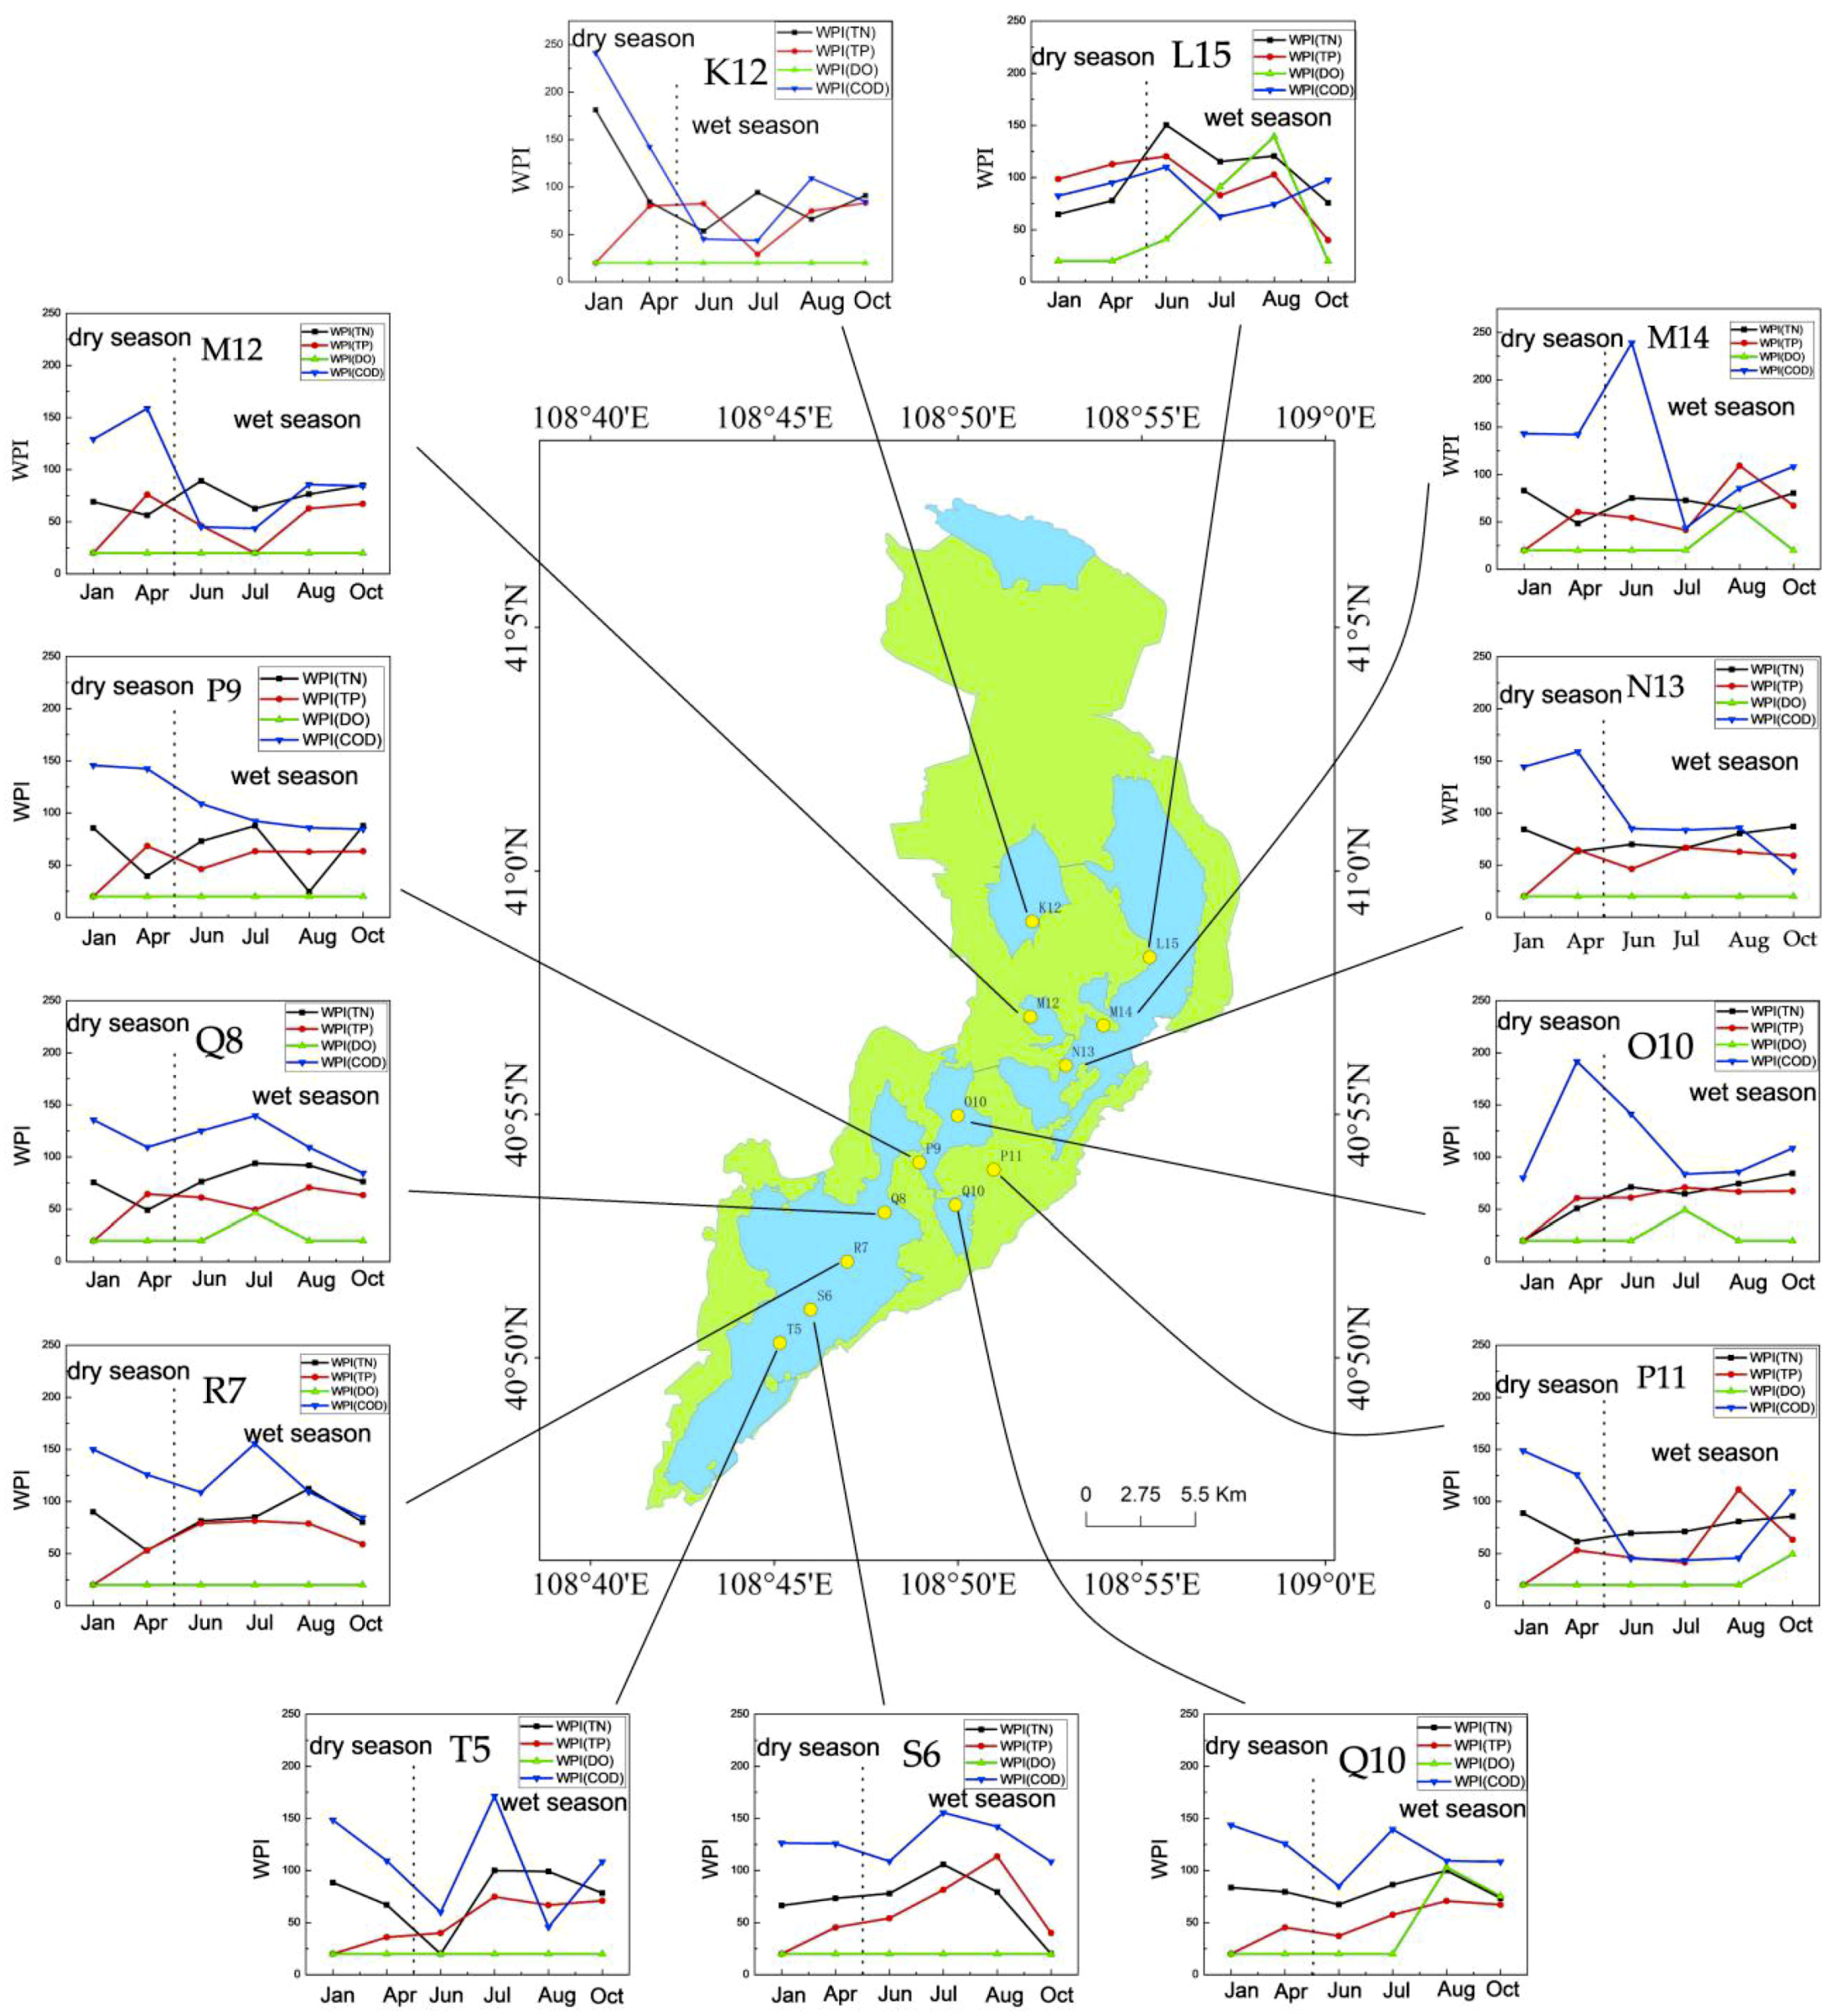
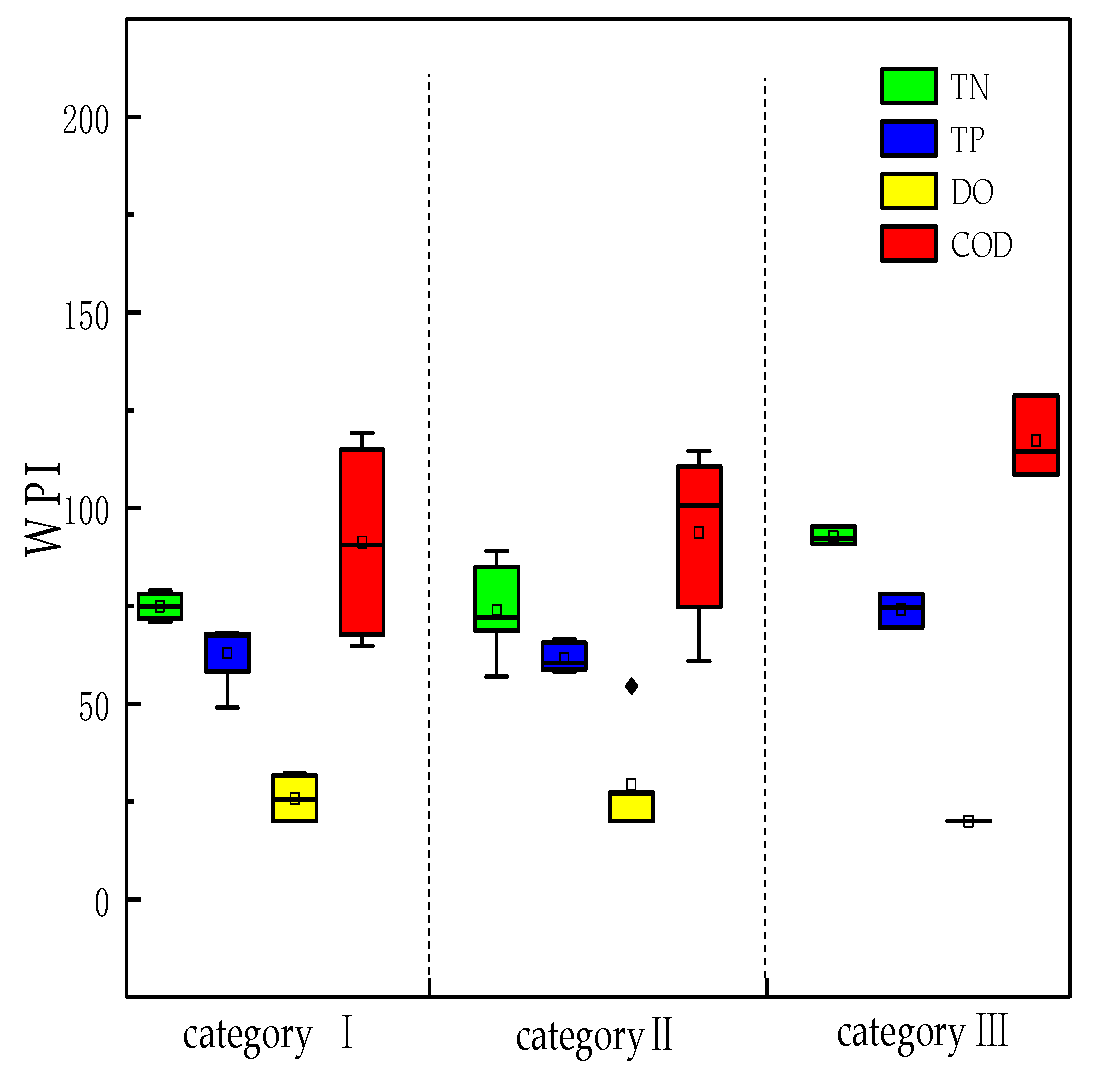
3.2. Spatio-Temporal Variation in the WPI in 2017

The WPITN, WPITP, WPIDO, and WPICOD were measured in January, April, June, July, August, and October. Cluster analysis was applied to analyse the spatial similarities of the 13 sampling sites in Lake Ulansuhai.

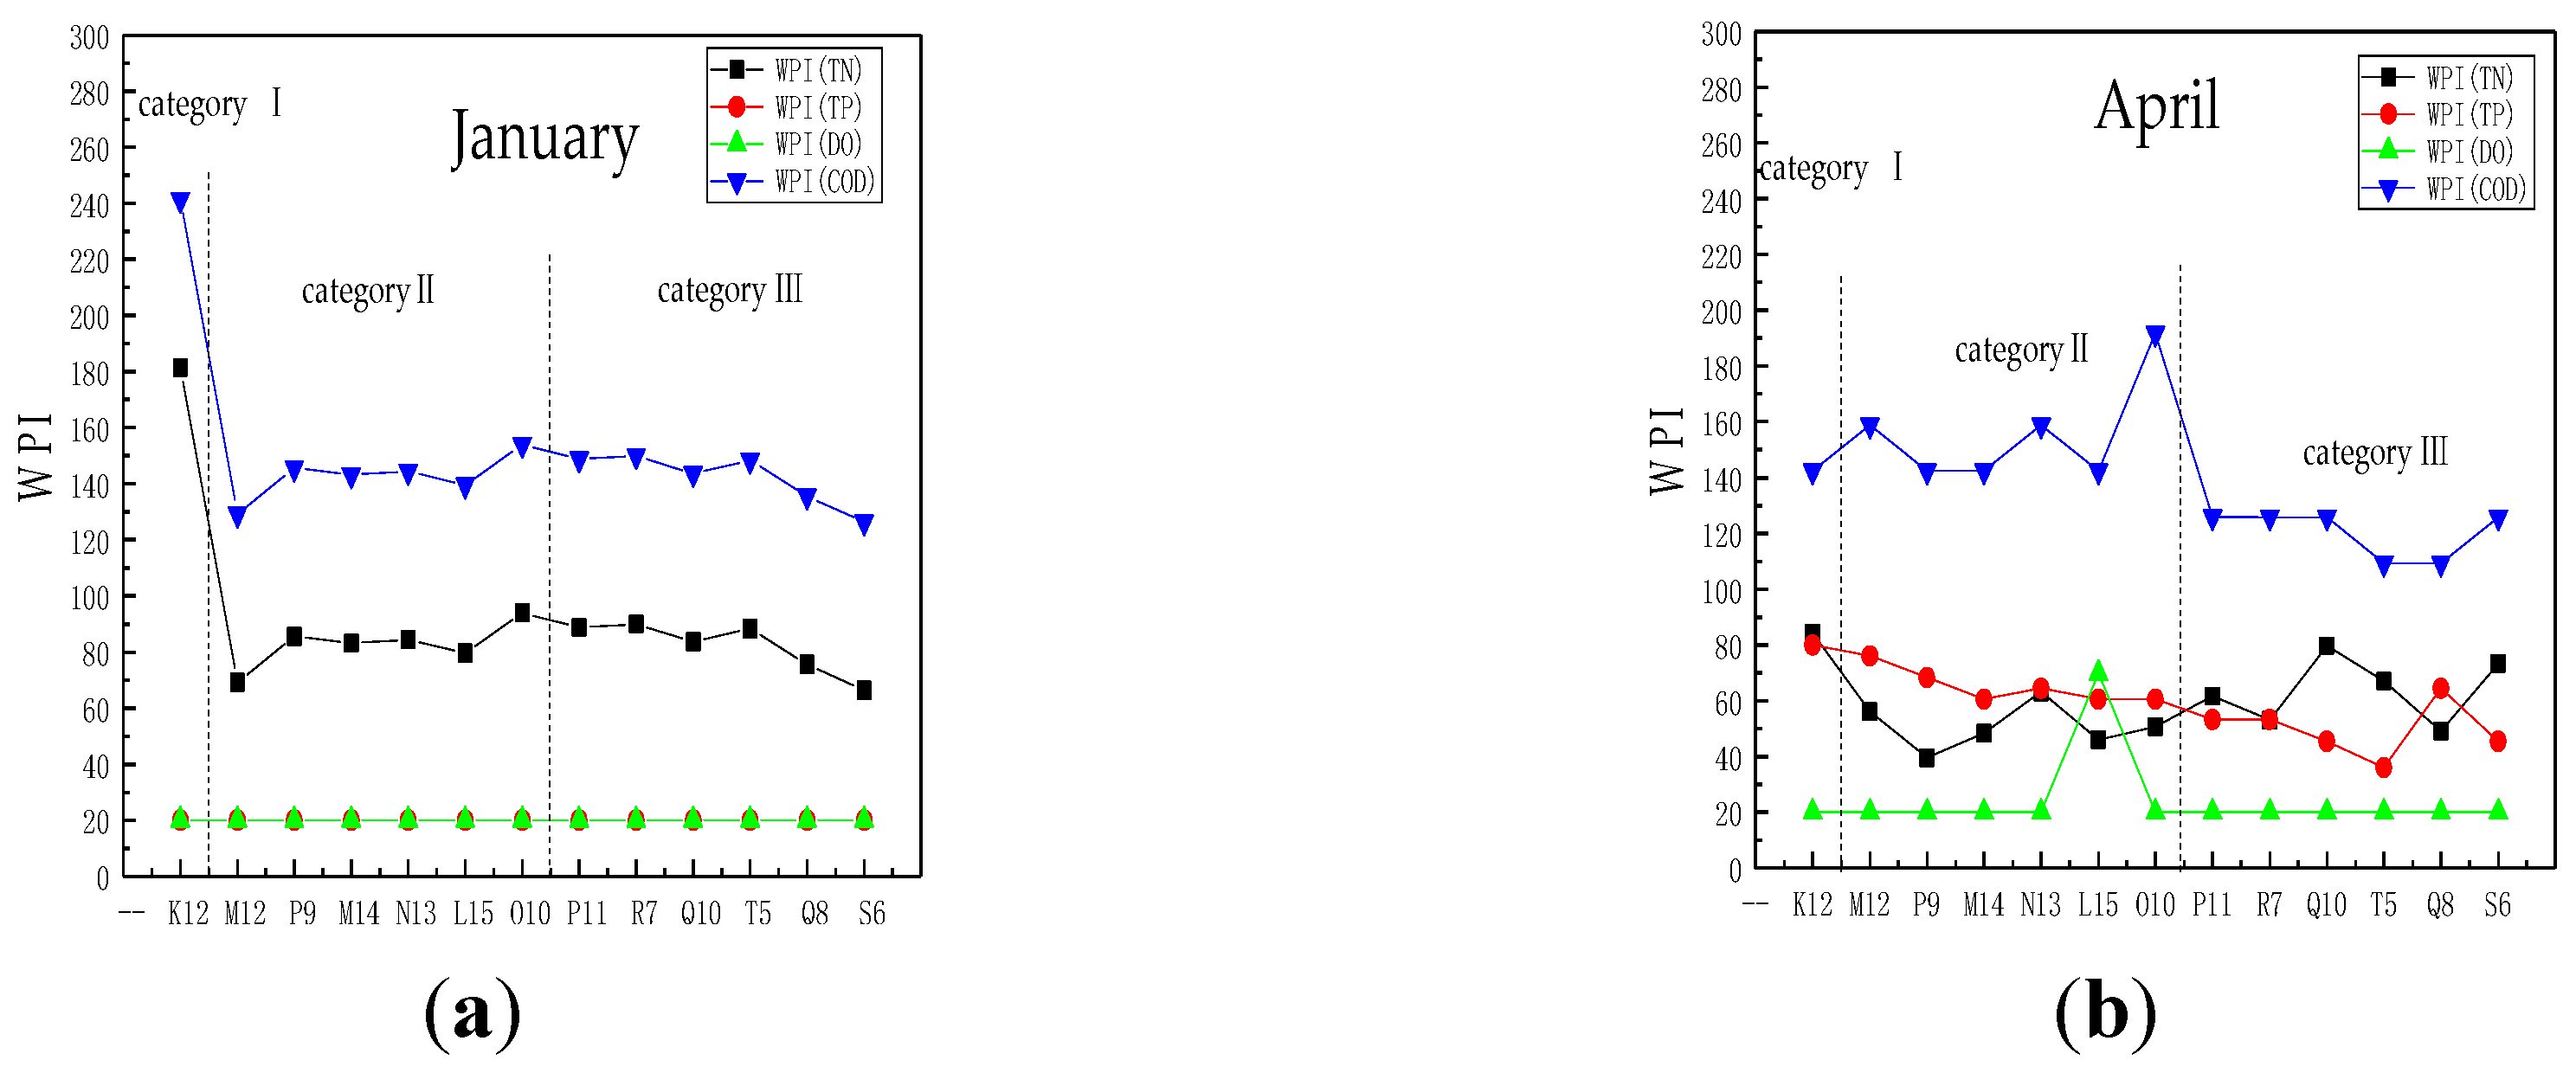
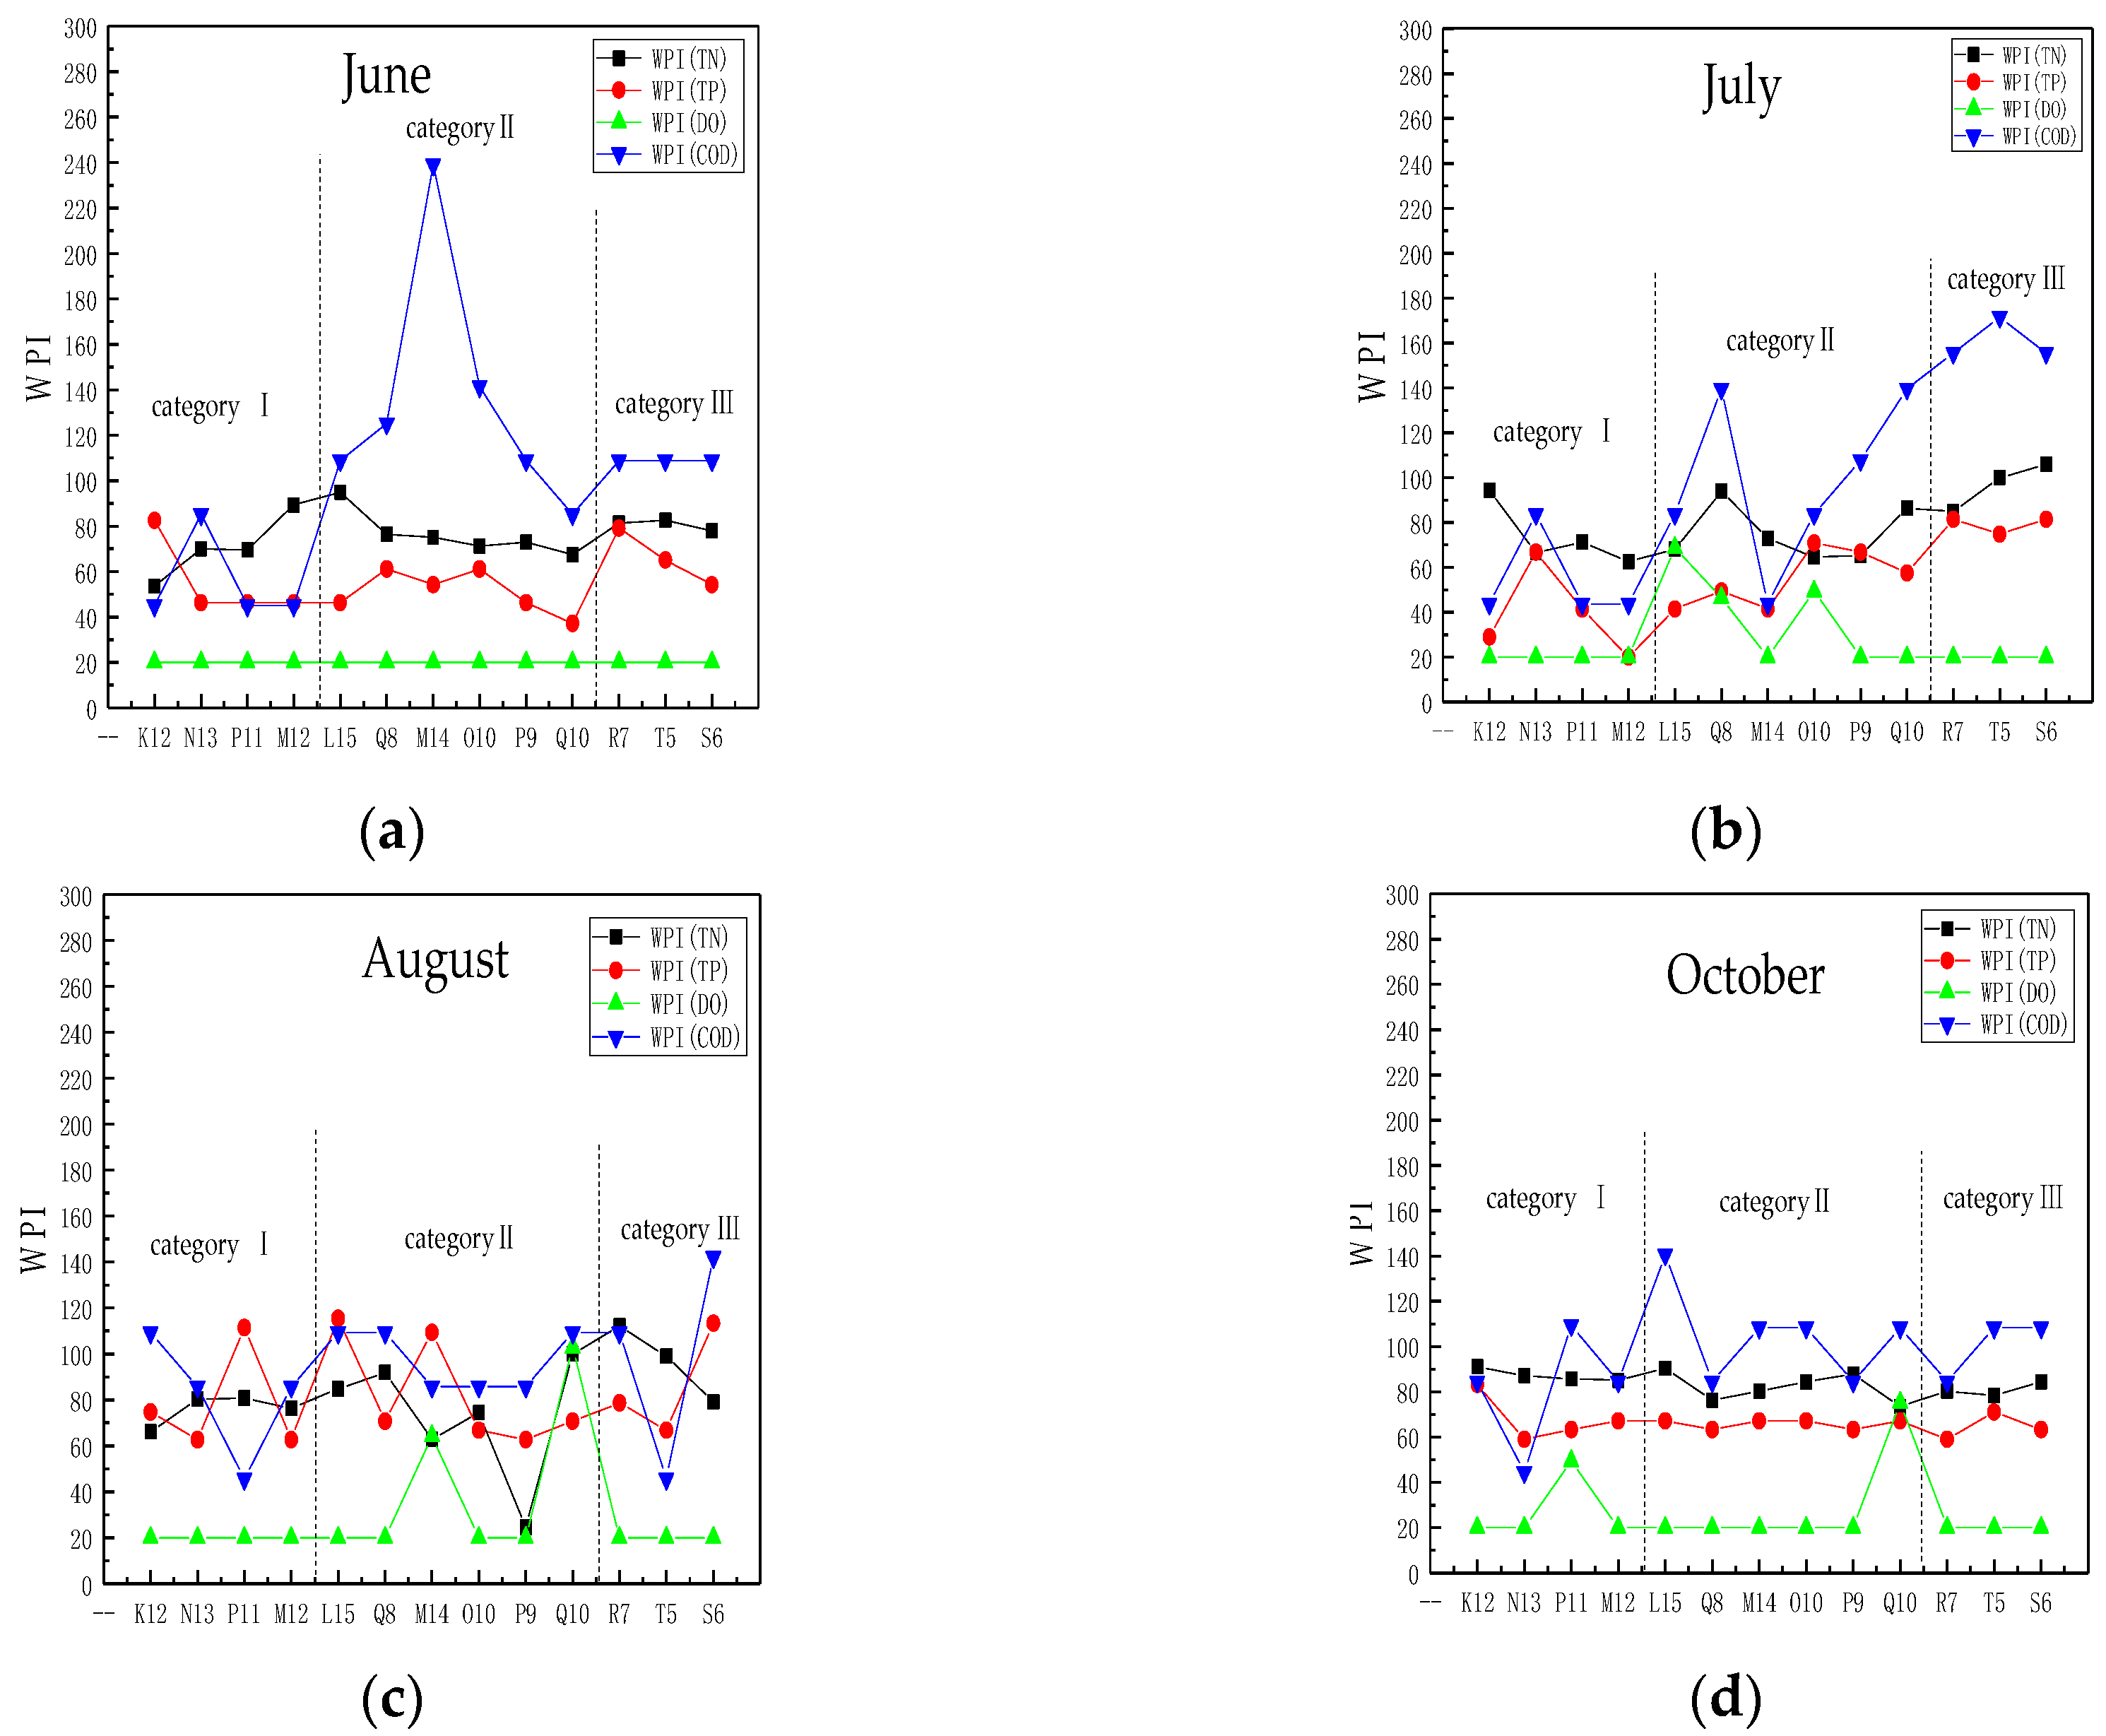
3.2.1. Temporal Variation in the WPITN, WPITP, WPIDO, and WPICOD

Six sampling months were grouped into two clusters by hierarchical cluster analysis. The dry season included January and April, and the wet season included June, July, August, and October (see Figure 5). Figure 6 shows the temporal variations in the WPITN, WPITP, WPIDO, and WPICOD in the dry season and in the wet season.
During both the dry season and wet season, the WPICOD was always higher than the WPITN, WPITP, and WPIDO, and it was the major pollution indicator. The WPICOD was higher in the dry season, with an average value of 135, than in the wet season. However, the average values of the WPITN, WPITP, and WPIDO were higher in the wet season than those in the dry season.
The monthly variations in the WPITN, WPITP, WPIDO, and WPICOD are illustrated in Figure 7. The WPITN, WPITP, and WPIDO were higher in the wet season than in the dry season. The WPICOD was higher in the dry season than in the wet season. COD was the major pollution indicator and its WPI value was higher than WPITN, WPITP, and WPIDO values in both the dry and wet seasons. DO had the lowest WPI value.
The Daniel trend test was performed for the 13 sampling sites (see Table 3), aiming to examine the significance of the temporal variation trends in the WPITN, WPITP, WPIDO, and WPICOD in Lake Ulansuhai. When an Rs value is greater than the Wp value, it is considered to have a significant trend; conversely, when an Rs value is less than the Wp value, the trend is not considered significant. Overall, the temporal variations trends in the WPITN, WPITP, WPIDO, and WPICOD were relatively stable.

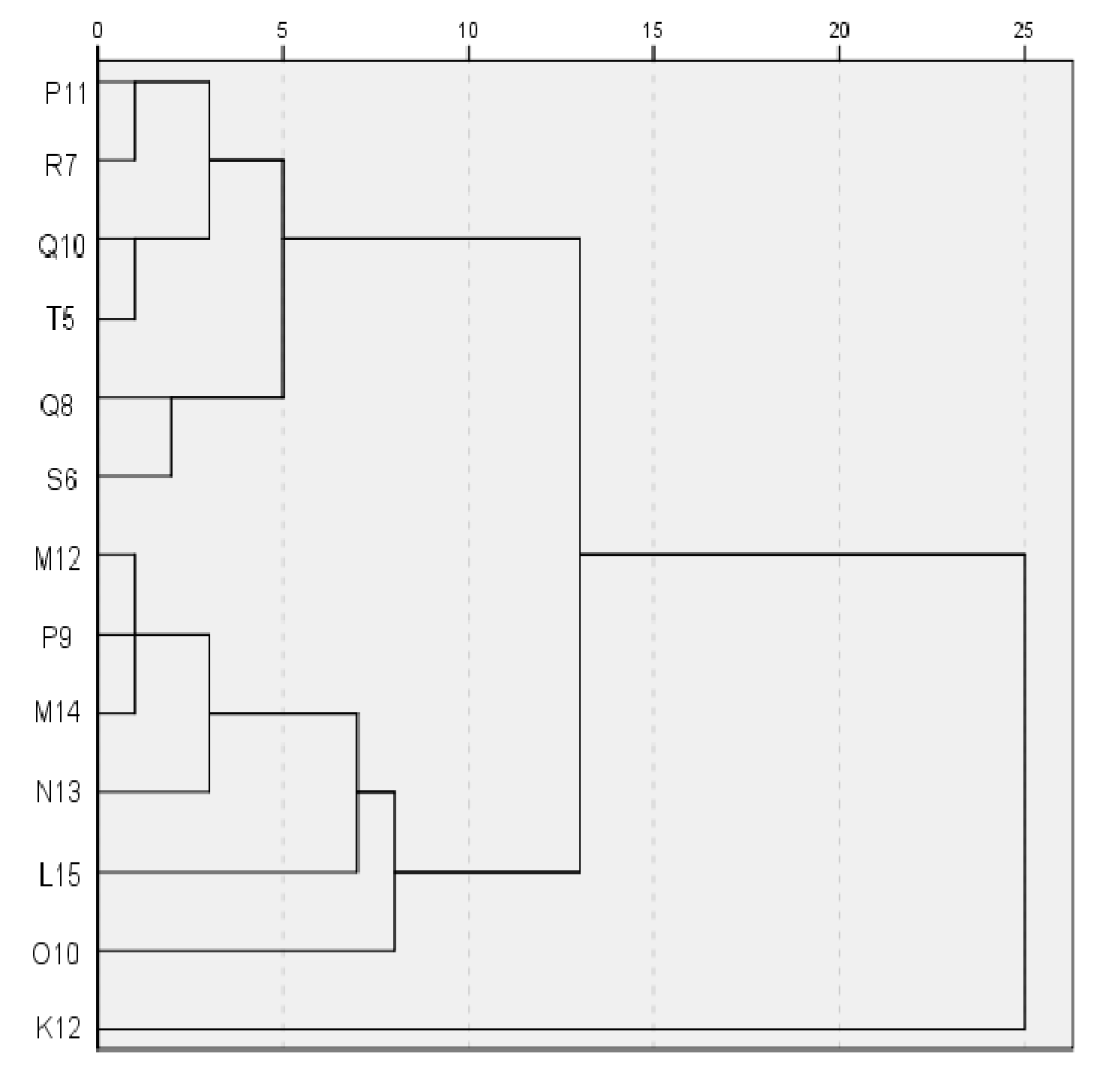
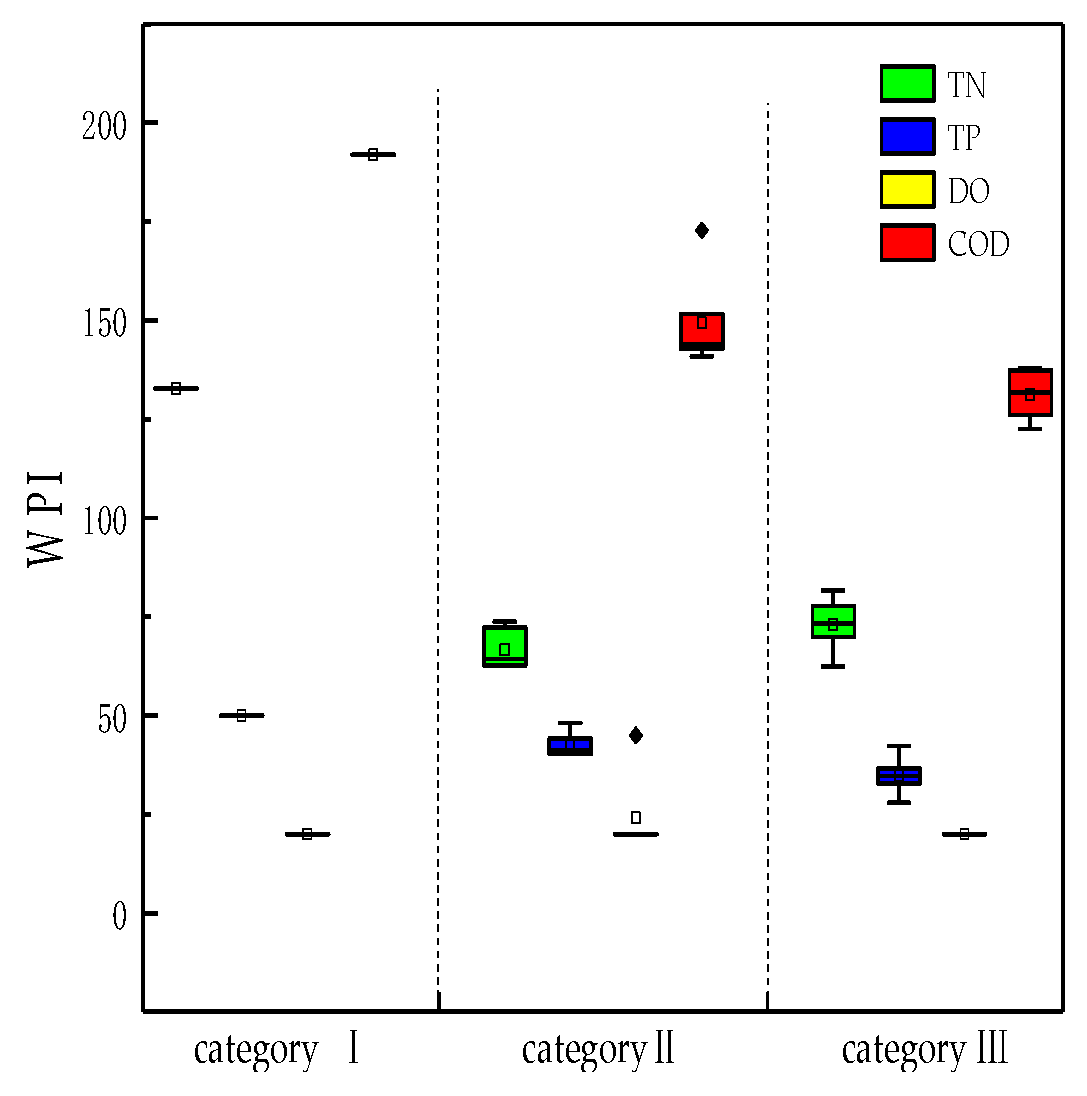
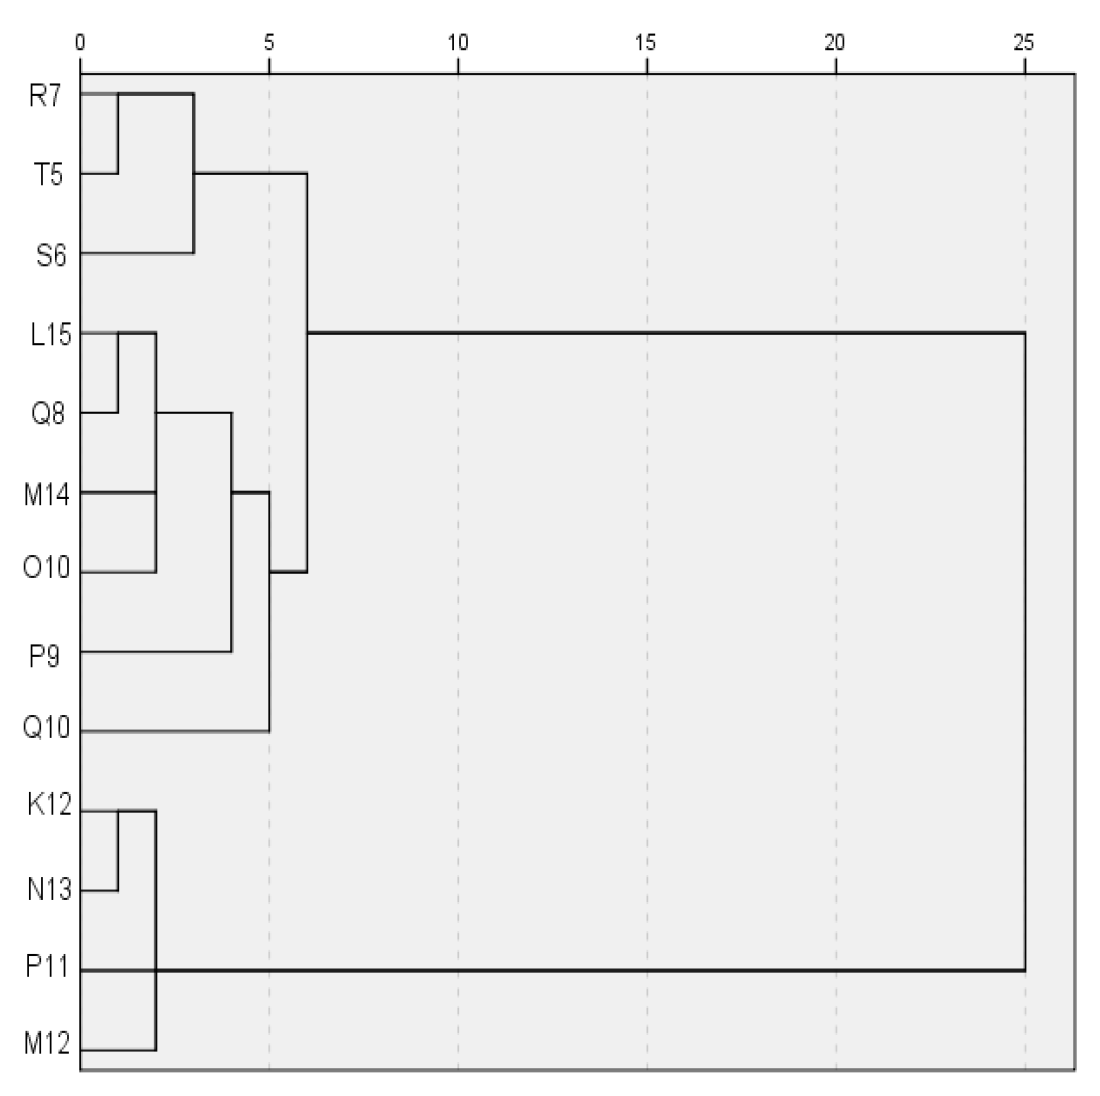
3.2.2. Spatial Variation Trend Analysis

The 13 sampling sites were clustered by the hierarchical cluster analysis method to analyse the spatial trend of the WPI in the dry season and wet season, respectively. The sampling sites were divided into three categories in the dry season (see Figure 8), and the box and whisker plots of spatial variation in the dry season are shown in Figure 9. Category I, including the only K12 located in the lake inlet, was defined as the highly polluted regions. Category II, defined as the moderately polluted regions, contained M12, P9, M14, N13, L15, and O10. Category III, defined as the less polluted regions, included P11, R7, Q10, T5, Q8, and S6. Category III was concentrated in the southwestern region of Lake Ulansuhai and the water quality was better in the dry season.
Figure 10 shows the spatial variation in WPI in January and in April (the dry season). Category I, category II, and category III were defined as the highly polluted regions near the lake inlet, the moderately polluted regions located in the centre of lake, and the less polluted regions close to the outlet, respectively. In January, the WPI followed the order: WPICOD > WPITN > WPITP = WPIDO, and the WPICOD and WPITN were much higher in category I, with values of 241 and 181, respectively, than in categories II and III, which had mean WPICOD and WPITN values of 142 and 82, respectively. The WPITP and WPIDO had the same value of 20 in all three categories. In April, the WPI in categories I and II followed the order of WPICOD > WPITP > WPITN > WPIDO, while in category III, WPICOD > WPITN > WPITP > WPIDO in most of the sampling sites. The mean value of WPICOD was 142 in category I and category II, which was higher than that in category III (120).
The cluster analysis of 13 water quality sampling sites in the wet season (Figure 11) also divided them into three regions. The box and whisker plots of spatial variation are shown in Figure 12. Category III, defined as the highly polluted region, consisted of R7, T5, and S6. Category I, the moderately polluted regions, consisted of K12, N13, P11, and M12. Category II, the less polluted regions, consisted of L15, Q8, M14, O10, P9 and Q10 in the centre regions.
The spatial variation in the WPI is shown in Figure 13. In the wet season, category III was defined as the highly polluted area close to the lake outlet, the moderately polluted region near the lake inlet and the less polluted area near the lake centre. In June, the WPI in categories II and III followed the order WPICOD > WPITN > WPITP > WPIDO, and the mean WPI value was 50 in category I, lower than that in category III. In July, the WPI of category III followed the order: WPICOD > WPITN > WPITP > WPIDO, and the average WPI value was 89 in category III, which was higher than in categories I and II. In August, the variation in TN, TP, COD and DO had no apparent order. In October, categories II and III followed the order WPICOD > WPITN > WPITP > WPIDO, and the mean WPICOD value of the 13 sampling sites was 96.
Table 4 shows the results of the Daniel trend test for the spatial variation in the sampling sites in Lake Ulansuhai. The WPITN decreased from the inlet to the outlet region in October but increased in July and August. The WPITP increased from the inlet to the outlet region in January, July, and August, but decreased in April. The WPICOD increased from the inlet to the outlet region in June and July but decreased in April. The WPIDO increased from the inlet to the outlet region in June and August. For other conditions, the variations did not yield an Rs value greater than Wp, so they were not considered significant.

4. Discussion

4.1. The Reasons for the Spatio-Temporal Variation in 1998–2017

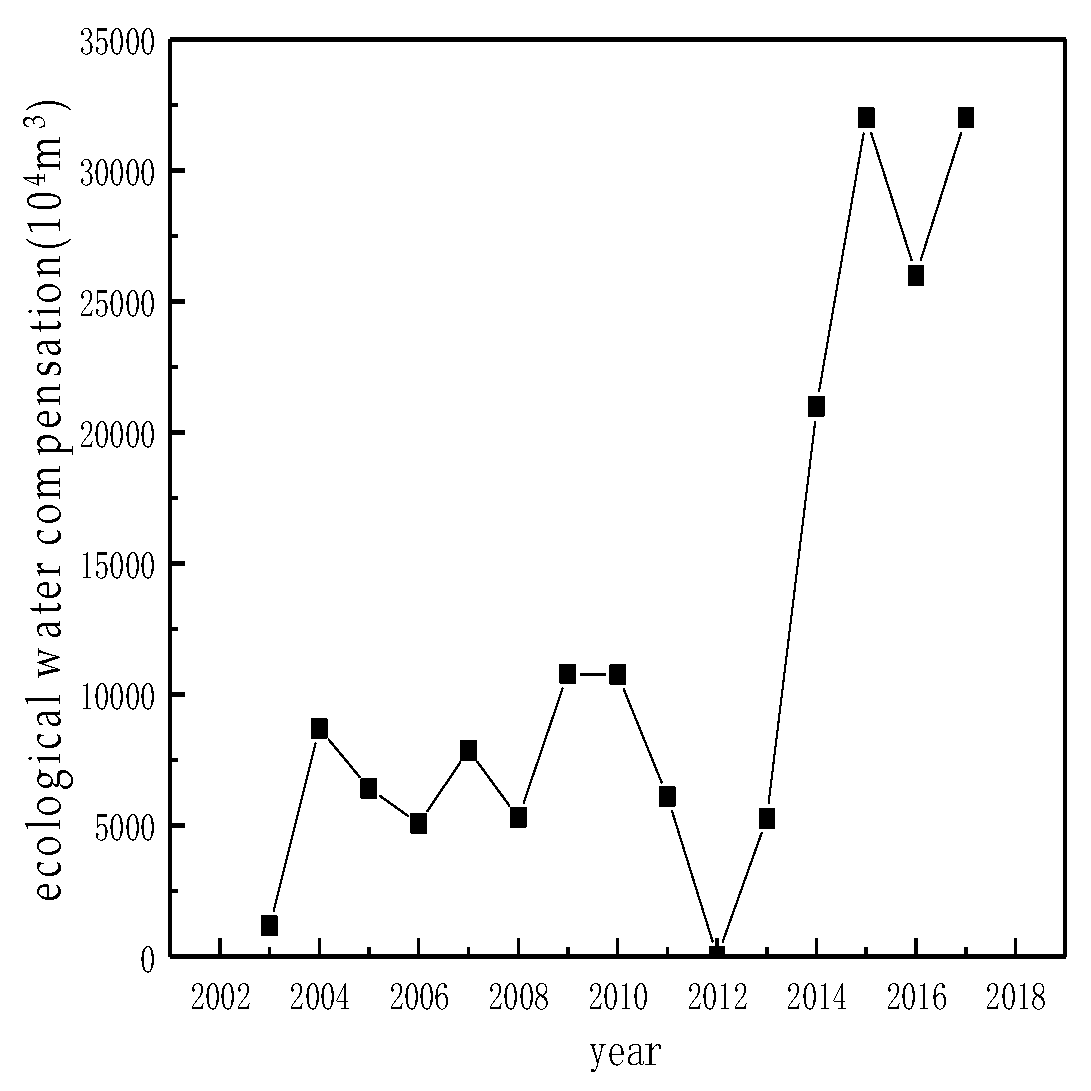
4.1.1. The Reasons for the Temporal Variation in the WPI

In 1998–2000, WPITN fluctuated by approximately 100 and the WPITP dropped from 120 to 80, which indicated that the water quality was acceptable, and the human activities had less impact on Lake Ulansuhai. From 2001 to 2017, the WPITN and WPITP presented a decreasing trend; however, the maxima of WPITN and WPITP appeared in 2006 and 2001, respectively. Li et al. used the accelerated genetic algorithm and the logistic curve to establish a comprehensive evaluation model to evaluate the characteristics and factors that influenced eutrophication from 1996 to 2003. The results showed that the eutrophication status of Ulansuhai became worse and was close to level 5-heavy eutrophication. The concentrations of TN and TP were both high, and the water environment deteriorated [34].
The main reasons for the increases in the WPITP and WPITN were as follows: (1) The existing agricultural irrigated area and pasture forests in Hetao Irrigation District had 8.61 million acres, of which farmland area accounted for 7.87 million acres. Related research showed that the consumption of chemical fertilizers was only 7 × 10⁴ t in 1978 but exceeded 52 × 104 t in 2002. Moreover, 70% of chemical fertilizers applied were not utilized but were directly discharged into the Lake Ulansuhai [35]. Due to excessive fertilizer application by farmers, nitrogen and phosphorus accumulated in the soil were discharged into the Ulansuhai with the return of farmland. (2) According to the Bavannao Water Resources Bulletin, Linhe District had the largest discharge of domestic sewage in the counties around Ulansuhai; the total discharge of urban domestic wastewater reached 151.34 million t/a in Linhe District in 2013. Detergent is one example of a household product found in large amounts in the domestic wastewater that was discharged into Lake Ulansuhai. (3) Internal pollution was another reason for the increase of the WPITP and WPITN. Studies have shown that the release of nutrients from sediments can be affected by many factors, such as water temperature, pH, hydraulic disturbances, and biological factors. Sondergaard investigated Arreso Lake in Denmark and found that dynamic suspension can increase the concentrations of nutrients [36]. According to the comprehensive management plan of Ulansuhai, TN varies from 0.73 to 3.47 g/kg and TP ranges from 0.18 to 1.21 g/kg in the surface sediment. The WPITN is much higher than the WPITP, indicating that the pollution from nitrogen sources in Ulansuhai is more serious. (4) A number of sewage treatment plants, water reuse projects, and reclaimed water supply projects were set up to control point source pollution in the upstream county in 2008.
The decreases in the WPITN and WPITP in 2003 occurred because the water conservancy department of Bayannao transported the irrigation gap water in the ice flood season and non-irrigation period from the Yellow River to the Lake Ulansuhai for ecological water compensation. Even with the water transport in 2003, the WPITN reached its maximum in 2006. The peak in the WPITN can be explained by the serious water contamination accident in the Hetao irrigation area in 2005. This contamination event not only deteriorated the water quality in the Hetao irrigation region, but also led to an accumulation of pollutants in Lake Ulansuhai. Moreover, ecological water compensation was relatively less impactful, and the WPITN increased in 2005 and was maximized in 2006.
The increases in the f WPICOD was related to the discharge of wastewater containing organic matter from industries such as fertilizer, paper, food processing and manufacturing, metal smelting, and livestock and poultry slaughter. COD reflects the level of pollution by reducing substances in water and is used as a comprehensive indicator of organic pollution. The reducing substances mainly include organics, nitrites, nitrates, sulfides, and ferrous salt. Zhou et al. have shown that the total COD emission increased from 10.2 to 12.3 t year by year since 2005 in the Hetao Irrigation District [37]. To control the aggravating pollution, the government took some actions including comprehensive remediation, closing factories with serious pollution, and treating 73 pollutants in sewage treatment facilities. In 2007, the wastewater reached the standard for discharge, and the water quality began to improve. In 2008, the Bayannao Water Resources Bulletin showed that the major pollutants of Ulansuhai were organic substances, with rates of COD, TN, and TP of 50%, 33.3%, and 16.7%, respectively. In recent years, water pollution incidents involving large-scale Huangtai outbreaks have appeared continuously in Ulansuhai. WPICOD increased again and the water quality deteriorated, which resulted from tourism and aquaculture pollution.
The WPIDO was higher from 2002 to 2010, and the variation in DO was related to the spatial distribution of aquatic plants and their physiological and biochemical characteristics.
In sum, the regime shifts in water quality in Lake Ulansuhai mainly occurred in 2004, 2007, and 2013, and the reasons were as follows: (1) Since 2003, 11.67 × 10⁷ m3 of ecological compensation water was directly discharged into Lake Ulansuhai, and the water quality improved significantly. (2) Since 2007, the utilization rate of agricultural fertilizers has reduced from 63 kg per mu to 55 kg per mu by adjusting the industrial structure and developing soil testing formula fertilization in agriculture. To control the non-point source pollution, the government promoted the efficient use of chemical fertilizers, which resulted in the application of less poisonous pesticides, green prevention, and control technologies for crop pests and diseases. (3) Since 2013, the annual average ecological water compensation has increased to 2~3 × 10⁹ m3. The government strengthened the management and proposed comprehensive measures to improve the water quality in Lake Ulansuhai. In summary, the regime shifts of water quality in Lake Ulansuhai occurred due to strengthened governmental management and proposed comprehensive measures.
Linear regression analyses were conducted using the WPI and ecological water compensation, where a significant correlation (P < 0.01) was established. Significant negative correlations (P < 0.01) were found between the WPI values of TN, TP, DO, and COD (WPITN, WPITP, WPIDO, and WPICOD) and ecological water compensation. After continuous ecological water compensation, the water quality of Ulansuhai improved significantly. Figure 14 shows the ecological water compensation of Ulansuhai from 2003 to 2017. Annual precipitation, mean temperature, and maximum wind speed did not have relationships with the WPI values of TN, TP, DO, and COD.

4.1.2. The Reasons for Spatial Variation in the WPI in 2017

The concentrations of nitrogen and phosphorus nutrients were much higher in the lake inlet than in the lake centre and lake outlet. The concentrations of TN and TP exceeded the Class V limit upper risk rates by 96.4% and 96.2%, respectively [38]. The main reason for this was that Lake Ulansuhai, a drainage area of the Hetao Irrigation District, received large amounts of nitrogen and phosphorus from farmland irrigation return water. The WPIDO was low in the lake inlet, due to a dense population of photosynthetic aquatic plants in the north lake inlet and high exposure to atmospheric aeration [39]. This is consistent with the results from Ren, which showed that the WPIDO was high in the lake inlet due to the discharge of industrial wastewater and domestic sewage in the upstream Linhe District and Wuyuan County in 1998–2007, which caused the decomposition of a large amount of organic pollutants [40]. The WPICOD value was low due to the oxidization of reducing substances in water.
With the migration of nutrients in the lake, some of the nitrogen and phosphorus were removed by biodegradation and sedimentation, which led to significantly lower concentrations of TN and TP in the lake centre than in the lake inlet. The oxygen consumption was reduced due to the decomposition of organic pollutants by microorganisms, and the concentration of DO increased as photosynthetic algae released oxygen [41]. The WPIDO was lower in the lake centre and outlet than in the lake inlet. Due to the absorption of aquatic plants and the degradation of organic pollutants, the concentration of COD decreased and the WPICOD was lower in the lake centre than in the lake inlet.
In the lake outlet, the concentrations of TN and TP were diluted and the WPITN and WPITP also decreased, which was consistent with the finding of Guo et al. [42]. The sources of nitrogen and phosphorus discharge into the lake included the farmland irrigation return water, groundwater, flooding, irrigation return water, and precipitation. The average nutrient input to the Ulansuhai was approximately 75.5 × 10⁴ t/a, and TN and TP in the lake inlet were approximately 1088.59 and 65.75 t, respectively. The removal pathways of nitrogen and phosphorus included discharge into the Yellow River, harvest reeds, fish, and feed birds. The average outputs of TN and TP were approximately 759.9 and 37.8 t, respectively [35]. The WPICOD was generally higher in the lake outlet, which was related to point source pollution, such as sewage treatment plant tail water.
Among the four typical indicators, the WPITN is the largest, followed by WPICOD and WPITP. Therefore, reducing nitrogen was critical to improve the water quality of the Ulansuhai. WPIDO ranged from 20 and 80 in Ulansuhai in 1998 and 2017, much lower than the WPITN, WPITP, and WPICOD; however, WPICOD was not the main water pollution indicator.

4.2. The Reasons for Temporal and Spatial Variations in 2017

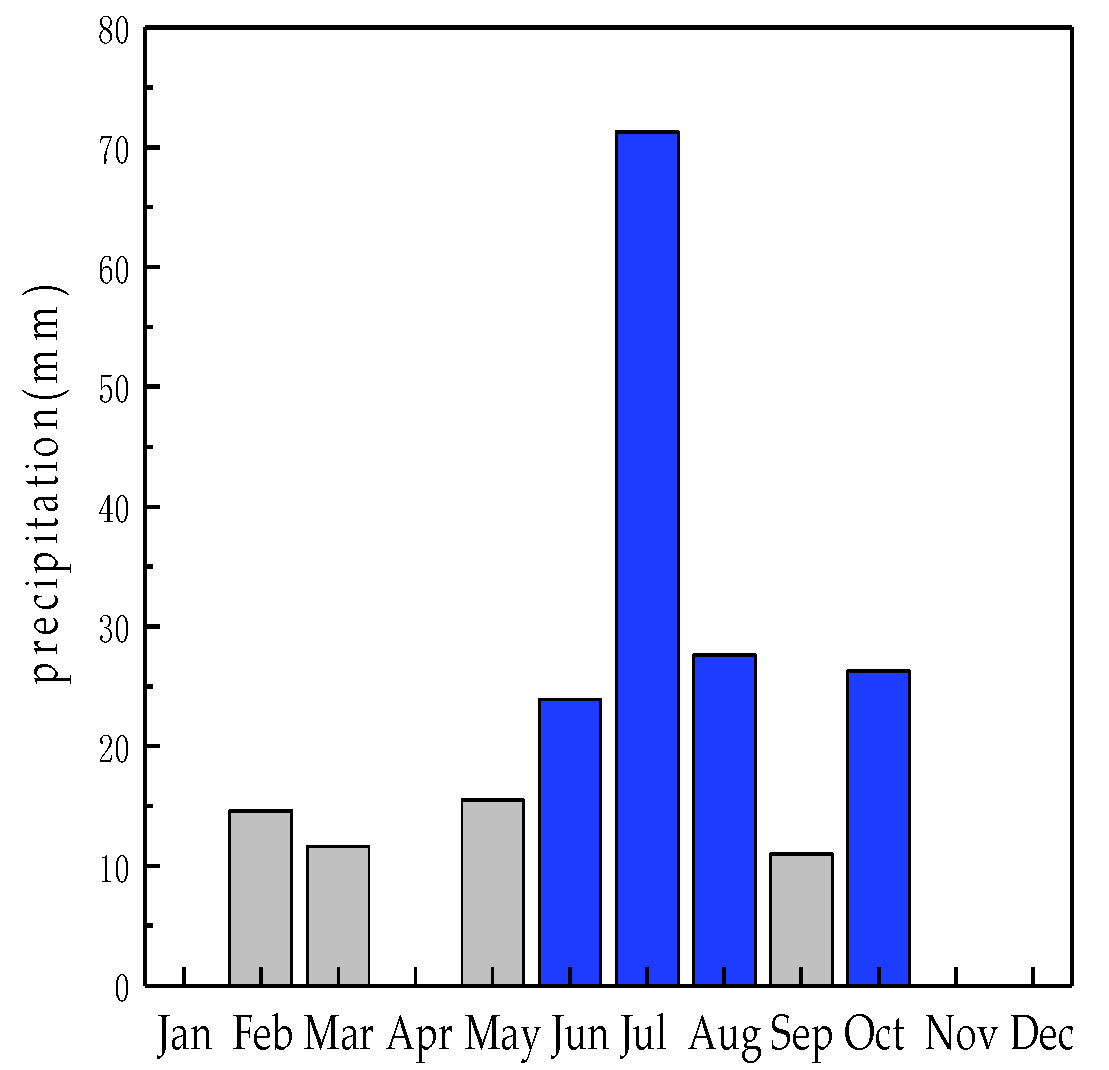
4.2.1. The Reasons for the Temporal Variations in the WPI in 2017

The temporal variation was grouped into the dry season and wet season, and the reasons for WPI variations were different. The WPICOD was much higher than WPITN, WPITP, and WPIDO both in the dry season and in the wet season, and COD was the main pollution indicator in Lake Ulansuhai. High COD results in the death of aquatic organisms due to a lack of oxygen and a bad water odour. The sources of COD are complex and diverse. COD originates from not only exogenous sources (non-point and sewage treatment plant tail water) but also from endogenous releases (sediment release and algae release). COD has different conversion and accumulation processes due to its different structural characteristics [43]. With the expanding scale of fish farming, aquaculture activities that are suitable for semi-enclosed areas with slow water flow will lead to the accumulation of remaining baits and wastes and will result in different levels of organic pollution. Furthermore, sewage treatment plant tail water is another source of deteriorating water quality. The WPICOD had the highest value in 2017. The comprehensive management plan of Ulansuhai showed that, in 2013, COD, TN, and TP in the lake inlet reached 22,471, 2402, and 243 t/a, respectively. Similarly, increased COD was also found in the North-eastern United States, indicating that the increased dissolved organic matter (DOM) in lakes was primarily derived from litter and soil [44]. In 2007, the WPICOD was higher than the WPITN, WPITP, and WPIDO.
In most of the sampling sites, the WPICOD values were higher in the dry season than in the wet season. In the dry season, January was the freezing period, where the water exchange capacity was poor and the accumulation of pollutants caused internal pollution. With the rise of the temperature in April, the ice body melted, and the internal pollution was released. Due to water replenishment mainly from industrial wastewater and domestic sewage, the water self-purification ability was poor. The rising temperatures in June, July, August, and October were more beneficial to microbial activities and the decomposition efficiency of organic pollutants, which resulted in a decrease in the WPICOD in the wet season. Another reason for this effect was that precipitation was scarce in the dry season but significantly increased in the wet season, causing a pollution dilution effect (Figure 15).
The WPITN, WPITP, and WPIDO were higher in the wet season than in the dry season in 2017. This conclusion opposes the findings of Wang et al., who reported that the WPI value was higher in the dry season than in the wet season on the north bank of Lake Dianchi. Wang et al. also reported that the storm rain scouring effect contributed to the dilution of pollutants, which contributes to the difference in results found by the two studies [12]. The main reason for the difference in results stems from the different sources of compensation water in the two lakes. Lake Ulansuhai is located in the arid and semiarid regions of the northern middle temperate region, so when farmers began to fertilize and irrigate heavily in the Hetao Irrigation District in the spring and summer, a large amount of nitrogen and phosphorus were discharged into Ulansuhai. Furthermore, due to the hydraulic erosion caused by rainfall, pollutants from farmland soil were carried into the lake through runoff and sediment, which was the main reason why WPITN and WPITP were higher in the wet season. In addition, an increase in tourism in Ulansuhai from June to October resulted in an increase in pollution.

4.2.2. The Reasons for the Spatial Variations in WPI in 2017

Ulansuhai is the only drainage channel for farmland irrigation return water, industrial wastewater, and domestic sewage in the Hetao Irrigation District, with drainage ratios of 96%, 2%, and 2%, respectively [26]. Table 5 shows the comparison of the spatial variation in the sampling sites in the dry season and in the wet reason. In the dry season, K12 was classified as a highly polluted area because it was close to the lake inlet, and additionally, a large amount of farmland returned water was discharged into the lake and concentrated at this site. P9, M14, L15, and O10, which were located in the lake centre and near the reed area, were classified as the moderately polluted areas. The main reason for this classification was that large aquatic plants purified the pollutants in the water and improved the water quality. T5, S6, R7, and P11 were classified as the less polluted areas because human activity was not frequent, and with dilution and purification, the water quality become better. However, in the wet season, the T5, S6, and R7 sites changed from less polluted areas to highly polluted areas. The main explanation for the increase in pollution from May to October was the close proximity of the three sites to the fishery farming area, where a large amount of fishing baits and excreta directly entered the lake ecological cycle. The fish farms expanded from May to October, and the increases in nitrogen, phosphorus, and organic pollutants caused serious water pollution. Studies from Xu et al. showed that only 13.9% of the nitrogen and 25.4% of the phosphorus in the bait entered into fishery products. The rest was deposited in the sediment [45], which would be released in the wet season. K12 changed from a highly polluted area in the dry season to a moderately polluted area in the wet season. The main explanation for the change in K12 during the dry season resulted from the thawing of the frozen period (January–April), releasing sources of domestic sewage and industrial effluence, with little contribution from farmland irrigation return water. K12 was near the lake inlet, and internal pollution caused the water quality to deteriorate compared with the wet season. The P9, M14, L15, and O10 sites changed from moderately polluted areas in the dry season to less polluted areas in the wet season. The main reason for this change was that these sampling sites were near the lake centre, where there was high precipitation, and the dilution effect improved the water quality in the wet season. In addition, the pollution levels of M12, N13, Q8, and Q10 had no changes in either the wet season or the dry season of 2017. M12 and N13 were classified as moderately polluted areas, while Q8 and Q10 were classified as less polluted areas.

5. Conclusions

In this study, the WPI method was used to assess the temporal and spatial variation in the water quality for a period of time in Lake Ulansuhai. We think that the WPI proved to be a suitable method of water quality in the eutrophic shallow lake. In this region, the water quality was mainly affected by organic pollutants from non-point agricultural sources. In 1998–2017, TN was the major pollution indicator, followed by COD and TP, and in 2017, COD was the dominant factor influencing water quality. The WPICOD value in the dry season was significantly higher than the WPITN, WPITP and WPIDO, while the WPITN, WPITP and WPIDO were higher than the WPICOD in the wet season. The main reasons were as follows: (1) non-point source pollution and fish farming activities, (2) point source pollution such as industrial wastewater and domestic sewage, (3) internal pollution released from the sediment, and (4) ecological water compensation from the Yellow River. Based on the above results, the water quality should control or ration the consumption of fertilizers and pesticides. These results provide a reference and present suggestions for the improvement and effective management of lake water quality. In future work, we will explore the impact of reducing irrigation and ecological water compensation by optimizing water allocation and improving the lake water quality.

Author Contributions

Q.Z. and R.Y. designed the research framework and wrote the manuscript. R.Y. supervised the study. L.W. and Y.H. collected Inner Mongolia environmental monitoring station data. Q.Z., Y.J., H.X. and X.L. carried out the field experiments and laboratory experiments analyses. Z.Z. drew GIS mapping in this paper. X.L. proofread the manuscript.

Funding

This study was funded by the National Natural Science Foundation of China (grant numbers 51869014, 51469018, 61461034), Science and Technology Major Project on Lakes of Inner Mongolia (No.ZDZX2018054), and the National Key Research and Development Program of China (Grant No.2016YFC0500508).

Acknowledgments

We thank X. X. Lu for their expertise and technical reviews of this manuscript.

Conflicts of Interest

The authors declare no conflict of interest.

References

  1. Yang, G.S.; Ma, R.H.; Zhang, L.; Jiang, J.H.; Yao, S.C.; Zhang, M.; Zeng, H.A. Lake status major problems and protection strategy in China. J. Lake Sci. 2010, 22, 799–810. [Google Scholar] [CrossRef]
  2. Garizi, A.Z.; Sheikh, V.; Sadoddin, A. Assessment of seasonal variations of chemical characteristics in surface water using multivariate statistical methods. Int. J. Environ. Sci. Technol. 2011, 8, 581–592. [Google Scholar] [CrossRef] [Green Version]
  3. Liu, R.; Chen, Y.; Yu, W.; Xu, F.; Shen, Z.Y. Spatial-temporal distribution and fuzzy comprehensive evaluation of total phosphorus and total nitrogen in the Yangtze River Estuary. Water Sci. Technol. 2016, 73, 924–934. [Google Scholar] [CrossRef] [PubMed]
  4. Ip, W.C.; Hu, B.Q.; Wong, H.; Xia, J. Applications of grey relational method to river environment quality evaluation in China. J. Hydrol. 2009, 379, 284–290. [Google Scholar] [CrossRef]
  5. Alves, D.D.; Riegel, R.P.; De, D.Q.; Osório, D.M.M.; Da, G.C.; Do, C.N.; Telöken, F. Seasonal assessment and apportionment of surface water pollution using multivariate statistical methods: Sinos River, southern Brazil. Environ. Monit. Assess. 2018, 190, 384. [Google Scholar] [CrossRef] [PubMed]
  6. Ahamad, K.U.; Raj, P.; Barbhuiya, N.H.; Deep, A. Surface Water Quality Modeling by Regression Analysis and Artificial Neural Network. In Advances in Waste Management; Springer: Singapore, 2019; pp. 215–230. Available online: https://link.springer.com/chapter/10.1007/978-981-13-0215-2_15. (accessed on 8 July 2019). [CrossRef]
  7. Tang, T.; Zhai, Y.; Huang, K. Water Quality Analysis and Recommendations through Comprehensive Pollution Index Method. Manag. Sci. Eng. 2011, 5, 95–100. [Google Scholar]
  8. Zhang, Y.L.; Zhou, Y.; Cheng, Z.; Yao, Z.P.; Shen, J.; Wang, X.L. Comparison and analysis of different evaluation methods for water quality in the Danjiangkou valley. Environ. Monit. China 2015, 31, 58–61. [Google Scholar] [CrossRef]
  9. Liu, Y.; Zheng, B.H.; Fu, Q.; Luo, Y.P.; Wang, M. Application of water pollution index in water quality assessment of rivers. Environ. Monit. China 2013, 29, 49–55. [Google Scholar] [CrossRef]
  10. Ma, Y. Application of water pollution index in water quality assessment of rivers. Tech. Superv. Water Resour. 2017, 25, 11–12. [Google Scholar] [CrossRef]
  11. Popovic, N.Z.; Duknic, J.A.; Atlagic, J.Z.C.; Raković, M.J.; Marinković, N.S.; Tubić, B.P.; Paunović, M.M. Application of the water pollution index in the assessment of the ecological status of rivers: A case study of the Sava River, Serbia. Acta Zool. Bulg. 2016, 68, 97–102. [Google Scholar]
  12. Wang, Q.; Li, Y.X.; He, J.; Xu, X.M.; Wu, X.H. Analysis of water quality variation trend in lake inlet river on north of lake Dianchi. Environ. Sci. Technol. 2012, 35, 191–194. [Google Scholar] [CrossRef]
  13. Wang, Q.; Wu, X.H.; Zhao, B.; Qin, J.; Peng, T.C. Combined Multivariate Statistical Techniques, Water Pollution Index (WPI) and Daniel Trend Test Methods to Evaluate Temporal and Spatial Variations and Trends of Water Quality at Shanchong River in the Northwest Basin of Lake Fuxian, China. PLoS ONE 2015, 10, e0118590. [Google Scholar] [CrossRef] [PubMed]
  14. Liu, H.; Wu, J.J. Application of water pollution index in water quality assessment of rivers. J. Anhui Agric. Sci. 2014, 21, 7164–7165. [Google Scholar] [CrossRef]
  15. Li, R.; Zou, Z.; Yan, A. Water quality assessment in Qu River based on fuzzy water pollution index method. J. Acta Sci. Circumstantiae 2016, 50, 87–92. [Google Scholar] [CrossRef] [PubMed]
  16. Milanović, A.; Milijašević, D.; Brankov, J. Assessment of polluting effects and surface water quality using water pollution index: A case study of hydro-system Danube-Tisa-Danube, Serbia. Carpathian J. Earth Environ. Sci. 2011, 6, 269–277. [Google Scholar]
  17. Brankov, J.; Evi, D.M.; Milanovi, A. The Assessment of the Surface Water Quality Using the Water Pollution Index: A Case Study of the Timok River (The Danube River Basin), Serbia. J. Arch. Environ. Prot. 2012, 38, 49–61. [Google Scholar] [CrossRef]
  18. Nikolaidis, C.; Mandalos, P.; Vantarakis, A. Impact of intensive agricultural practices on drinking water quality in the Evros region (NE Greece) by GIS analysis. Environ. Monit. Assess. 2008, 143, 43–50. [Google Scholar] [CrossRef]
  19. Burton, L.R.; Howard, A.; Goodall, B. Construction of a historical Water Pollution Index for the Mersey Basin. Area 2003, 35, 438–448. [Google Scholar] [CrossRef]
  20. Zhao, S.N.; Li, C.Y.; Shi, X.H.; Zhang, H.M.; Wang, S. Bioavailability and environment pollution evaluation of sediments heavy metals in Wuliangsuhai lake. Ecol. Environ. Sci. 2013, 22, 481–489. [Google Scholar] [CrossRef]
  21. Wang, X.W.; Yang, H.; Cai, Y.P.; Yu, C.X.; Yue, W.C. Identification of optimal strategies for agricultural nonpoint source management in Ulansuhai Nur watershed of Inner Mongolia, China. Stoch. Environ. Res. Risk Assess. 2016, 30, 137–153. [Google Scholar] [CrossRef]
  22. Mao, X.F.; Wei, X.Y.; Yuan, D.H.; Jin, Y.X.; Jin, X. An ecological-network-analysis based perspective on the biological control of algal booms in Ulansuhai Lake, China. Ecol. Model. 2018, 386, 11–19. [Google Scholar] [CrossRef]
  23. Lv, J.; Li, C.Y.; Zhao, S.N.; Sun, B.; Shi, X.H.; Tian, W.D. Evaluation of nutritional status in Wuliangsuhai in frozen and non-frozen seasons. Arid Land Resour. Environ. 2018, 32, 109–114. [Google Scholar] [CrossRef]
  24. Jiang, H.Q.; Li, C.Y.; Shi, X.H.; Zhang, G.F. Comprehensive evaluation of water quality for Wuliangsuhai lake. J. Water Sav. Irrig. 2010, 5, 15–17. [Google Scholar]
  25. Tian, W.D.; Jia, K.L.; Shi, X.H.; Zhao, S.N.; Wu, Y.; Song, S.; Ma, J. Water quality variation in Lake Wuliangsuhai, 2005–2014. J. Lake Sci. 2016, 28, 1226–1234. [Google Scholar] [CrossRef]
  26. Sun, H.M.; He, J.; Lv, C.W.; Gao, X.D.; Fan, Q.Y.; Xue, H.X. Nitrogen pollution and spatial distribution pattern of Wuliangsuhai lake. Geogr. Res. 2006, 25, 1003–1012. [Google Scholar] [CrossRef]
  27. Zhang, Y.M.; Jiao, S.W.; Jia, Y.F.; Zeng, Q.; Feng, D.D.; Lei, G.C. Spatial and temporal variations in waterbird communities and its implications for ecosystem management in a large temperate arid wetland of northwest P.R. China. Avian Biol. Res. 2017, 10, 119–128. [Google Scholar] [CrossRef]
  28. The Ministry of Environmental Protection of the People’s Republic of China. Environment Quality Standards for Surface Water; GB3838-2002; State Environment Protection Administration of China: Beijing, China, 2002.
  29. Gao, W.; Chen, Y.; Xu, M.; Guo, H.C. Trend and driving factors of water quality change in lake Fuxian (1980–2011). J. Lake Sci. 2013, 25, 635–642. [Google Scholar] [CrossRef]
  30. Abudumutailifu, M.; Halik, Ü.; Aishan, T.; Keyimu, M.; Nasirdin, N.; Ainiwaer, A. Variation Characteristics of the main atmospheric pollutant conccentration in Urumqi. Ecol. Environ. Sci. 2018, 27, 533–541. [Google Scholar] [CrossRef]
  31. Lang, Z.Y.; Liu, Y.; Sheng, H. Identification of water quality trends in Lake Dianchi using an integrated STL and RSI approach. Acta Sci. Circumstantiae 2014, 34, 754–762. [Google Scholar] [CrossRef]
  32. Alfred, M.; Powell, J.; Xu, J.J. The 1977 Global Regime Shift: A Discussion of Its Dynamics and Impacts in the Eastern Pacific Ecosystem. Atmos. Ocean 2012, 50, 421–436. [Google Scholar] [CrossRef]
  33. Xu, J.J.; Alfred, M.; Powell, J. Two mechanisms responsible for marine ecosystem regime shifts from fish landings data off the West Coast of California (WCC). Nat. Sci. 2013, 5, 495–500. [Google Scholar] [CrossRef] [Green Version]
  34. Li, C.Y.; Liu, T.X.; Gao, R.Z.; Ren, C.T. Study and synthetic assessment for the season-year change of the eutrophication main-control factors in Wuliangsuhai Lake. Hydrology 2004, 24, 14–17. [Google Scholar]
  35. Shang, S.Y.; Du, J.M.; Li, X.Y.; Shen, Q.T.; Wang, L.M. Ecological restoration engineering technology of eutrophic lake—A case study of Lake Wuliangsuhai in Inner Mongolia. Chin. J. Ecol. 2003, 22, 57–62. [Google Scholar] [CrossRef]
  36. Søndergaard, M.; Kristensen, P.; Jeppesen, E. Phosphorus release from resuspended sediment in the shallow and wind-exposed Lake Arresø, Denmark. Hydrobiologia 1992, 228, 91–99. [Google Scholar] [CrossRef]
  37. Zhou, Y. The Wuliangsuhai Ecological Research Station Building and Health Evaluation Index System; Inner Mongolia University of Science and Technology: Baotou, China, 2012. [Google Scholar]
  38. Li, X.; Gou, M.M.; Wang, Y. Analysis on the exceeding the risk ratio of mouth water quality for Wuliangsuhai lake in Inner Mongolia. J. Agro-Environ. Sci. 2011, 30, 1638–1644. [Google Scholar] [CrossRef]
  39. Astel, A.; Biziuk, M.; Przyjazny, A.; Namies´nik, J. Chemometrics in monitoring spatial and temporal variations in drinking water quality. Water Res. 2006, 40, 1706–1716. [Google Scholar] [CrossRef] [PubMed]
  40. Ren, C.T.; Yang, L.P.; Wei, Z.Z.; Cao, Y.Y. Study on Influence Factors of Dissolved Oxygen Variation in Wuliangsuhai Inlet Water. J. Urban Constr. Theory Res. 2012, 33. Available online: http://d.old.wanfangdata.com.cn/Periodical/csjsllyj2012332944 (accessed on 8 July 2019).
  41. Li, W.P. Study on Water Environment Pollution and Hydrological Simulation of Typical Lake; China Water Conservancy and Hydropower Press: Beijing, China, 2015; pp. 84–96. [Google Scholar]
  42. Guo, J.; Wei, W.; Yu, Y.L.; Song, J.X.; Zhang, M.Y.; Li, S.N. Research progress on the eutrophication of Wuliangsuhai wetland. Chin. J. Ecol. 2015, 34, 3244–3252. [Google Scholar] [CrossRef]
  43. Yang, F.; Wang, S.R.; Guo, W.; Ni, Z.K. Specctroscopic analysis and degradation kinetics study of COD in sewage plant effluent into Dianchi Lake. Environ. Eng. Technol. 2017, 7, 558–564. [Google Scholar] [CrossRef]
  44. Sanclements, M.D.; Oelsner, G.P.; Mcknight, D.M.; Stoddard, J.L.; Nelson, S.J. New insights into the source of decadal increases of dissolved organic matter in acid-sensitive lakes of the north eastern united states. Environ. Sci. Technol. 2012, 46, 3212–3219. [Google Scholar] [CrossRef]
  45. Xu, Q. Rice Field Ecosystem in China; China Agriculture Press: Beijing, China, 1998; pp. 154–196. [Google Scholar]
Figure 1. Geographical location of the sampling sites in Lake Ulansuhai.
Water 11 01410 g001
Figure 2. Inter-annual variation in the trends of the WPI TN, WPITP, WPIDO, and WPICOD: (a) WPI TN; (b) WPITP; (c) WPIDO; (d) WPICOD.
Water 11 01410 g002aWater 11 01410 g002b
Figure 3. Regime Shift Index (RSI) based on the Student’ s t-test from 1998 to 2017: (a) WPITN; (b) WPITP; (c) WPIDO; (d) WPICOD.
Water 11 01410 g003
Figure 4. Concentrations of relevant water quality indicators and spatial variation in the WPI: (a) WPI TN; (b) WPITP; (c) WPIDO; (d) WPICOD; (e) the box and whisker plots of spatial variation in Ulansuhai.
Water 11 01410 g004
Figure 5. Cluster analysis of temporal variation in the six sampling months.
Water 11 01410 g005
Figure 6. Box and whisker plots of temporal variation in the WPITN, WPITP, WPIDO, and WPICOD.
Water 11 01410 g006
Figure 7. Temporal variation in the WPI at each sampling sites in 2017.
Water 11 01410 g007
Figure 8. Cluster analysis of sampling sites in the dry season.
Water 11 01410 g008
Figure 9. Box and whisker plots of spatial variation in the dry season.
Water 11 01410 g009
Figure 10. Spatial variation in WPI in 13 sampling sites in the dry season: (a) January; (b) April.
Water 11 01410 g010
Figure 11. Cluster analysis of sampling sites in the wet season.
Water 11 01410 g011
Figure 12. Box and whisker plots of spatial variation in the wet season.
Water 11 01410 g012
Figure 13. Spatial variation in the WPI in each sampling site in the wet season: (a) June; (b) July; (c) August; (d) October.
Water 11 01410 g013
Figure 14. The ecological water compensation in Ulansuhai from 2003 to 2017.
Water 11 01410 g014
Figure 15. Urad front banner monthly precipitation in 2017.
Water 11 01410 g015
Table 1. Water quality indicators and the corresponding measurement methods.
IndicatorsAbbreviationsUnitsMeasurement Methods
Total nitrogenTNmg/LPotassium persulfate UV spectrophotometry
Total phosphorusTPmg/LMolybdenum antimony anti spectrophotometry
Dissolved oxygenDOmg/LGerman-made WTW series multi 3420 portable multi-parameter metre
Chemical oxygen demandCODcrmg/LDichromate titration
Table 2. China’s national water quality standards for total nitrogen (TN), total phosphorus (TP), chemical oxygen demand (COD), and dissolved oxygen (DO) and their corresponding water pollution index (WPI) values.
First LevelSecond LevelThird LevelFifth LevelInferior to Fifth Level
TP (mg/L)0.010.0250.050.2>0.2
TN (mg/L)0.20.512>2.0
DO (mg/L)7.5652<2.0
CODcr (mg/L)15152040>40
WPI2020 < WPI ≤ 4040 < WPI ≤ 6080 < WPI ≤ 100>100
Table 3. Temporal variation trends calculated by the Daniel trend test method at the 13 sampling sites.
Sampling SiteNWpaRs (TN)Rs (TP)Rs (CODcr)Rs (DO)
K1260.829−0.2570.543−0.5420.772
L1560.8290.4290.714−0.142−0.086
M1260.8290.4290.372−0.4860.029
M1460.829−0.0850.714−0.60.658
N1360.8290.3720.314−0.7710.142
O1060.8290.0860.829−0.7140.6
P1160.8290.1430.714−0.4860.543
P960.8290.0290.257−10.658
Q1060.8290.0860.885−0.5420.772
Q860.8290.5430.314−0.7710.714
R760.8290.0290.6−0.7140.086
S660.8290.8290.829−0.5420.658
T560.8290.1430.829−0.7710.2
(aRs is the significance level of the unilateral tests where <0.05 indicates significance; when N = 6, Wp = 0.829).
Table 4. Spatial variation in the WPI values calculated by the Daniel trend method in six sampling months.
Sampling PeriodNWater IndicatorWpaRs
January13TN0.456–0.506b−0.115
13TP0.456–0.506b0.572
13CODcr0.456–0.506b0.428
13DO0.456–0.506b0.281
April13TN0.456–0.506b0.179
13TP0.456–0.506b−0.664
13CODcr0.456–0.506b−0.648
13DO0.456–0.506b0.231
June13TN0.456–0.506b0.176
13TP0.456–0.506b0.231
13CODcr0.456–0.506b0.910
13DO0.456–0.506b0.737
July13TN0.456–0.506b0.517
13TP0.456–0.506b0.825
13CODcr0.456–0.506b0.94
13DO0.456–0.506b−0.115
August13TN0.456–0.506b0.528
13TP0.456–0.506b0.039
13CODcr0.456–0.506b0.286
13DO0.456–0.506b0.605
October13TN0.456–0.506b−0.670
13TP0.456–0.506b−0.307
13CODcr0.456–0.506b0.385
13DO0.456–0.506b0.099
(aRs is the significance level of unilateral test, where <0.05 indicates significance when N = 12, Wp = 0.506; when N = 14, Wp = 0.456).
Table 5. Partition of sampling sites in the dry season and wet season.
The Dry SeasonThe Wet Season
Highly polluted areasK12T5, S6, R7
Moderately polluted areasM12, N13, P9, M14, L15, O10M12, N13, P11, K12
Less polluted areasQ8, Q10, P11, T5, S6, R7Q8, Q10, P9, M14, L15, O10

