Effectiveness of Rainwater Harvesting Systems for Flood Reduction in Residential Urban Areas


School of Engineering and Architecture, University of Enna “Kore”, Cittadella Universitaria, 94100 Enna, Italy
*
Author to whom correspondence should be addressed.
Water 2019, 11(7), 1389; https://doi.org/10.3390/w11071389
Submission received: 20 May 2019
/
Revised: 24 June 2019
/
Accepted: 4 July 2019
/
Published: 6 July 2019
(This article belongs to the Special Issue Design of Urban Water Drainage Systems)
Abstract
:Rainwater harvesting (RWH) systems have many benefits being an effective alternative water supply solution, not only in arid and semi-arid regions. Also, these systems can be useful in the reduction of flood risk in urban areas. Nevertheless, most of the studies in literature focused on the potential of RWH in reducing water consumption, whereas few examples examined their efficiency in the retention of stormwater in flood-susceptible residential areas. The aim of this work was to investigate the reliability of RWH systems in terms of stormwater retention. Specifically, the performance of RWH tanks to supply water for toilet flushing, in more than 400 single-family houses in a residential area of Sicily (Southern Italy) was analyzed. The area of study was chosen due to its high susceptibility to flooding. A flushing water demand pattern was defined using water consumption data collected during a measurement campaign. The yield-after-spillage algorithm was used to simulate the daily water balance of the RWH tanks. The effect of the RWH implementation on flood volumes in the area of study was quantified using FLO-2D. Results point out that the potential of neighborhood RWH installation in the mitigation of flood risk is highly related to rainfall amount.
1. Introduction
In the past, rainwater harvesting and domestic utilization have been very frequent practices in different parts of the world. Since climate change, together with the rapid development of urban areas and population growth, is affecting the availability of water resources in many regions, the importance of collecting rainwater to partially meet the household water demand is now widely recognized. In the context of increasing water stress, the installation of rainwater harvesting (RWH) systems represents a valuable and effective solution to reduce the use of drinkable water consumption for domestic uses not only in arid and semi-arid areas [1,2,3] but also in urban areas [4,5]. The use of these systems has additional benefits, such as the retaining of flood from rainfall events and the consequent control of stormwater flood volume [6,7,8].
Different studies showed that, in urban catchments, the extensive installation of RWH tanks could be an efficient support for reducing frequency and peak of stormwater flood. In England, Gerolin et al. [9] used a times series modeling approach in order to quantify the flood reduction related to RWH tanks installed in three locations for a wide range of scenarios. This study pointed out that, when the average annual supply is smaller than the annual household demand, an increase in the RWH tank size leads to greater retention of flood and reduction in the flood volume and peak. For RWH tanks installed in the residential district in Nanjing (China), Zhang et al. [10] found that the system has a good performance in mitigating urban waterlogging problems, reducing flood volume of 13.9%, 30.2% and 57.7% in the cases of maximum daily rainfall, annual average maximum daily rainfall and critical rainfall, respectively. In the city of Champigny-sur-Marne (France), the effectiveness to prevent stormwater sewer overflows of a great number of installed RWH tanks was analyzed by Petrucci et al. [11]. In this case, the characteristics of the implemented systems were not adequate to prevent stormwater overflow. Campisano and Modica [12] investigated the potential of an RWH system, installed in a small city located in Sicily (Southern Italy), to reduce peak flow during storm events. Results showed that, depending on tank capacity and rainfall characteristics, the RWH tank is able to reduce the peak of rainfall intensity in a great number of storm events. To evaluate the performance of RWH systems in stormwater flood control, Palla et al. [13] analyzed an installation of RWH tanks in a residential urban block in Genoa (Northern Italy). The authors found a 33% average reduction of peak flow and a 26% reduction of drained rain volume. More recently, Teston et al. [14] assessed the impact of RWH on flood reduction in a condominium of houses in Curitiba (Southern Brazil) in different scenarios, finding a reduction of peak flow, even if the impact of the RWH system on drainage is affected by some factors related to buildings, tank capacity, rainfall characteristics, and land use.
The main purpose of this research was to assess the rainwater quantity that can be collected by RWH tanks installed in a residential area and to quantify the effectiveness of these tanks for stormwater retention and flood volume reduction. The residential area is located in the city of Palermo, Sicily (Southern Italy) and includes 408 single-family houses. In this area, sewage and rainwater are collected and conveyed by the urban drainage system. The catchment area is approximately 1.6 km2. It has been assumed that the users in the above-mentioned houses range between 3 and 5 persons and the capacity of the installed RWH tanks is 5 m3. The performance of the tanks was tested using daily rainfall data measured in the Palermo rain gauge from 2002 to 2008 and assuming that the collected water is used to supply water only for toilet flushing. The system reliability was assessed using the yield after spillage (YAS) algorithm. Once the water balance was simulated for the RWH tanks, the FLO—2D model was used to quantify the flood volume reduction due to the RWH systems installation.
2. Materials and Methods
2.1. Case Study and Dataset
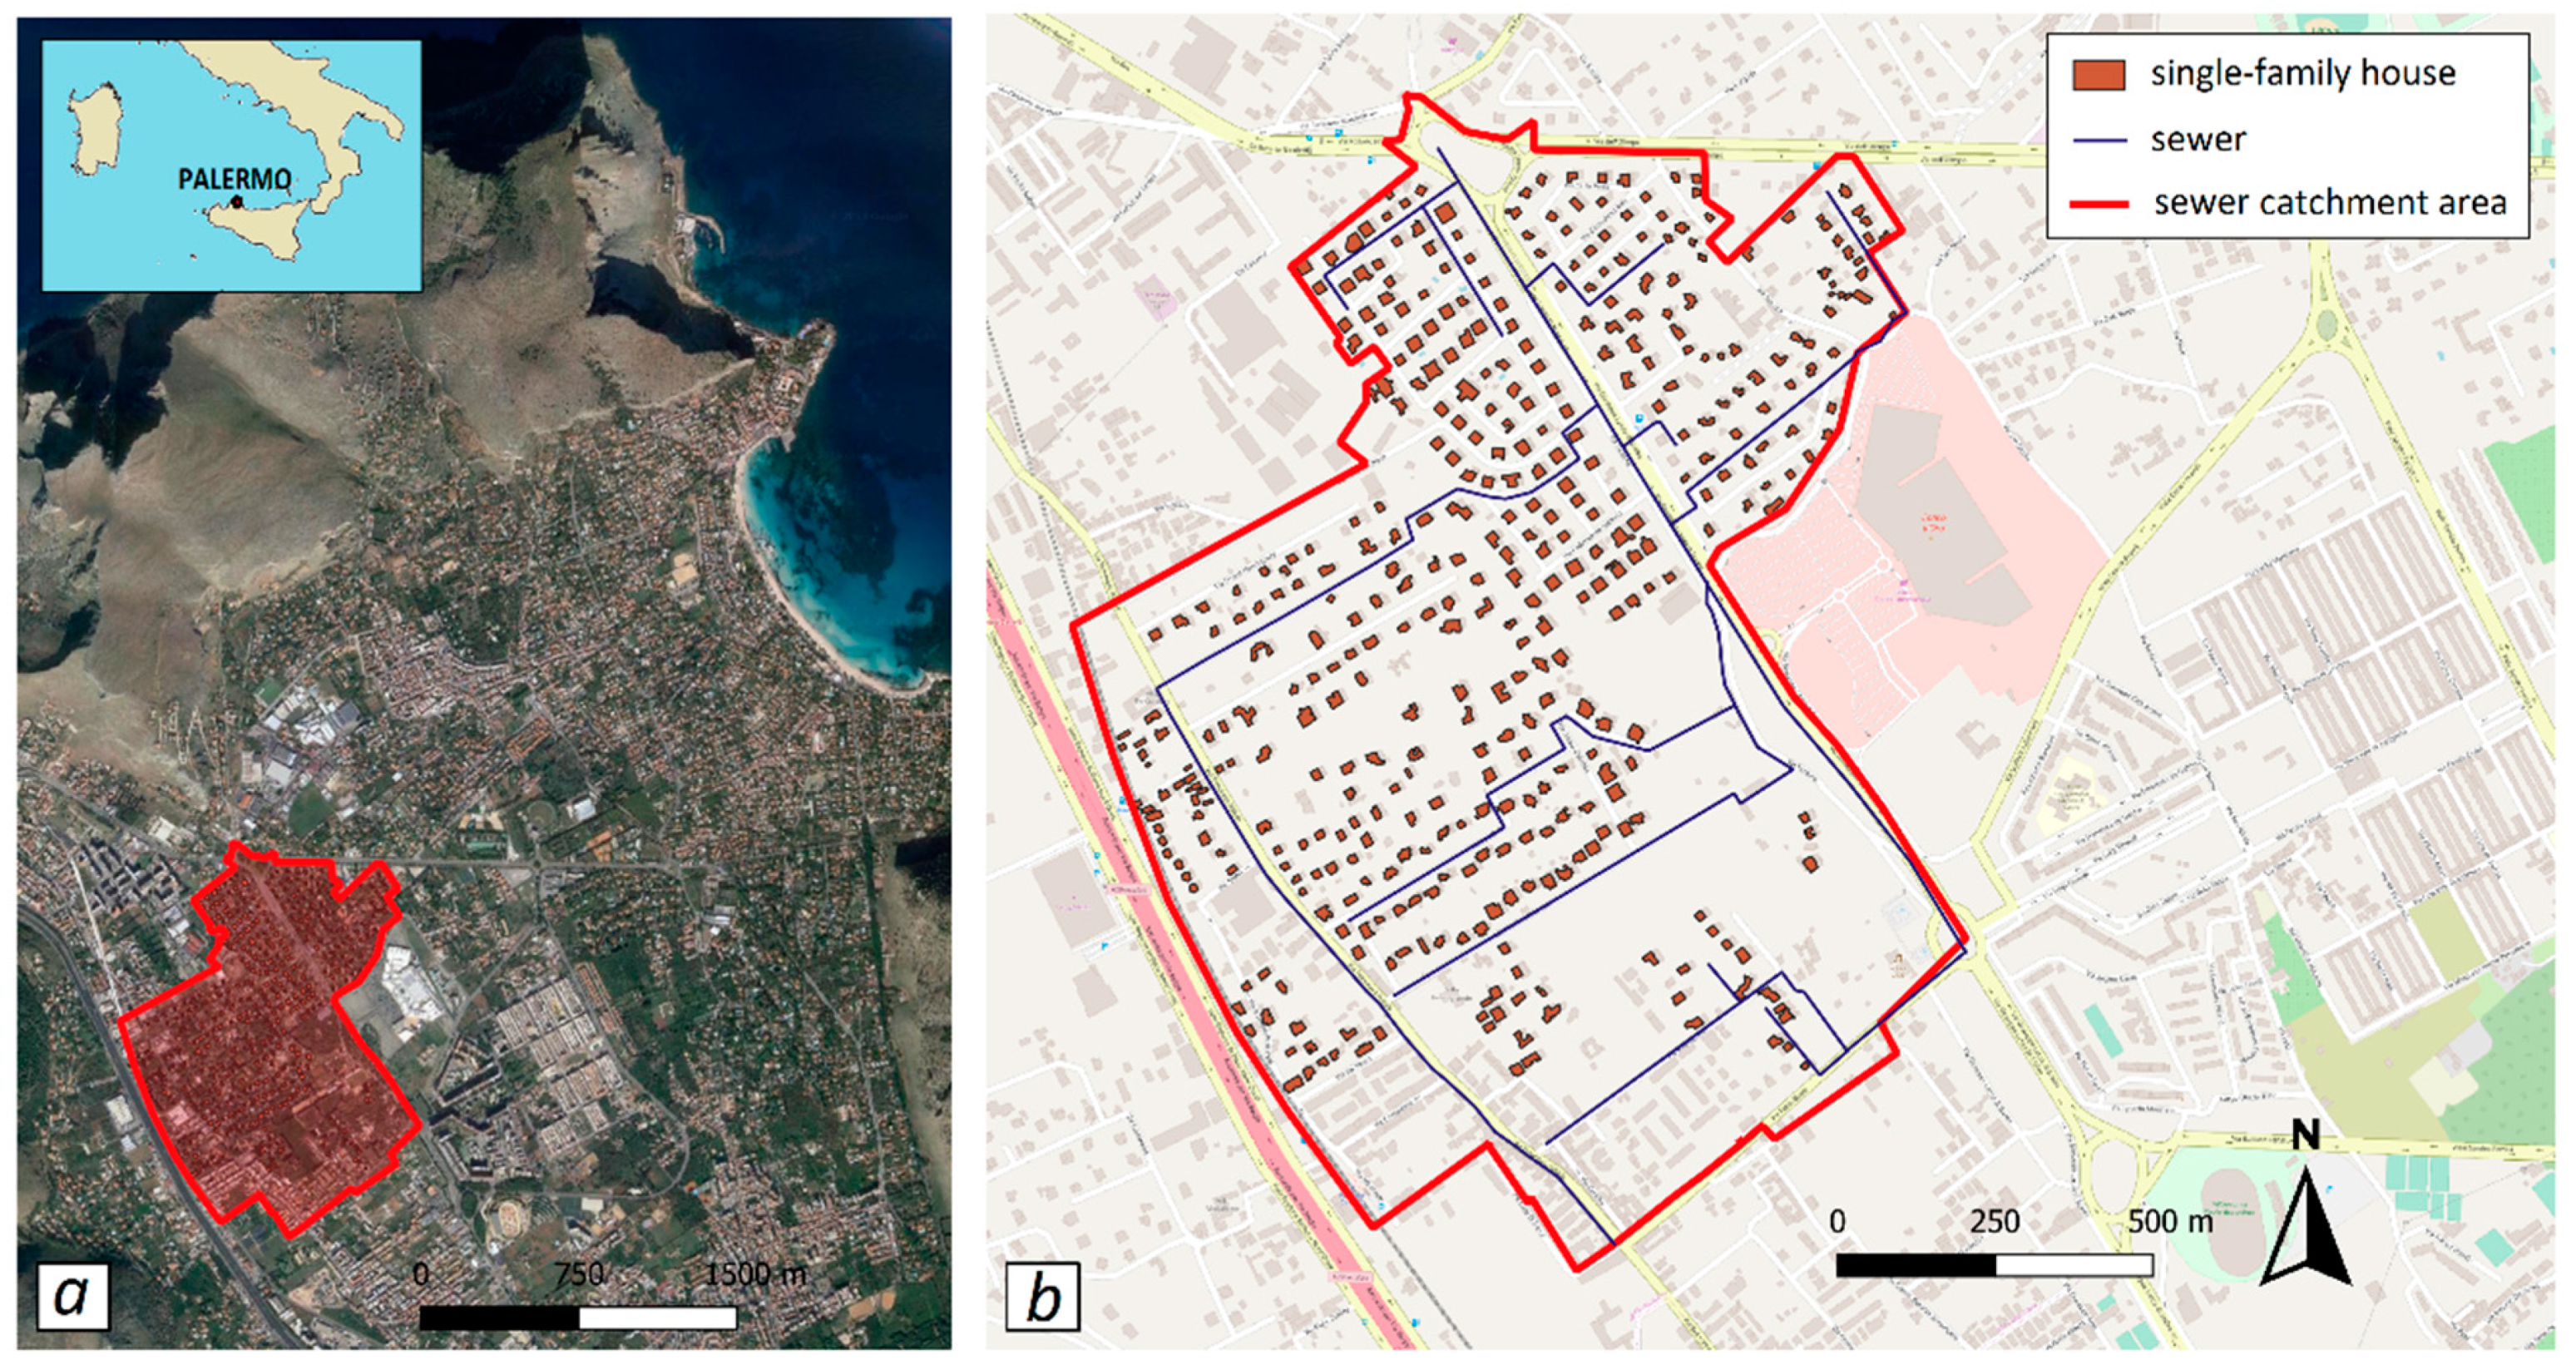
The area of study is located in Palermo (Southern Italy) and has an extension of 1.6 km2 (Figure 1a). This case study was chosen due to the high flood susceptibility of the area, also during storm events of low intensity. In the analysis, 408 single-family houses were included (Figure 1b). It has been assumed that each house is provided with a 5 m3 RWH tank. The water catchment surface of the RWH tanks is the house rooftop. This surface ranges from 40 to 700 m2. In the supposed RWH systems, rainfall (inflow) is collected from rooftops and stored only for toilet flushing use (outflow). Rainfall volumes were calculated using the daily rainfall data recorded in the Palermo rain gauge during the 2002–2008 period. These data were provided by the Servizio Informativo Agrometeorologico Siciliano (SIAS). The average annual rainfall and the average number of rainy days in a year in Palermo are approximately 700 mm and 100 days, respectively (Table 1). The selected historical rainfall series is representative of the climate in the area of study, both in terms of annual and monthly average values.
2.2. Inflow to the RWH Tank
In the model, the rainwater tank is filled exclusively by rainfall volumes from building rooftops. Assuming that rainfall is constant within each time step t, rainwater volume can be evaluated as follows:
where is the inflow volume supplied to the tank at time step t (m3), is the runoff coefficient depending on water loss (dimensionless), is the total rainfall at time t (m), is the total catchment surface area (m2), and is the effective rainfall at time t (m), i.e., total rainfall, subtracted of water losses, being the rainfall volume producing runoff. Evaporation losses from the tank are neglected. In this analysis, was set equal to 0.9 [15].
Depending on the specific site characteristics, type of contaminant and final use of the water, some studies in literature recommend different values for the first flush that is the amount of water that has to be diverted to ensure an adequate water quality. Subtracting the first 0.33 mm of rainfall from the total daily rainfall as the first flush would significantly improve the water quality collected from the rooftops [16,17]. Following this recommendation, all the daily water balance simulations were performed subtracting 0.33 mm from the daily rainfall series.
2.3. Water Demand for Toilet Flushing
To simulate the water balance of the RWH tanks, the daily water demand for toilet flushing was required. In this study, the toilet flushing demand pattern was defined by analyzing water consumption data collected during a monitoring campaign of seven dwellings in Palermo over the 2002–2004 period. Each dwelling involved in the campaign had a toilet WC flush tank with a volume of 9–10 l (in water balance simulations 10 l have been considered for all the houses). These data were processed using the procedure described in details by Liuzzo et al. [18]. The per capita number of daily flushing was analyzed in order to detect a well-fitting probability distribution function. According to the results of the Kolmogorov–Smirnov test, observed data are well fit by the Weibull probability distribution, with parameter λ and κ equal to 5.90 and 2.02, respectively. Therefore, for each year, per capita daily flushing volumes were obtained by sampling 365 points from the Weibull cumulative distribution function. Finally, the daily series of toilet flushes were calculated by multiplying the number of flushes by the number of users in the house during the day. The described procedure was applied for each of the 408 houses included in the study. As regards to the number of users in each house, this information was not available, then this variable was assessed based on the cumulative annual water consumption data collected by the water manager and the property surface. The obtained number of inhabitants per house was between 3 and 5 and it was consistent with the type of residences (detached houses) present in the area.
2.4. Water Balance Simulation
To predict the performance of RWH systems, different models can be used [19,20]. Among these, behavioral models are frequently applied allowing a more detailed design and relatively simple development. In this study, a behavioral model was used, in which water fluxes include runoff into the RWH tank (inflow), overflow from the RWH tank, and the yield extracted from the RWH tank; water demand is met in each operating period to the extent that storage is available. The algorithm for the model relies on a yield after spillage (YAS) operating rule [21]:
where (m3) is the volume discharged as overflow from the storage tank at time step t, (m3) is the volume stored at time step t, (m3) is the yield of rainwater from the storage tank at time step t, (m3) is the toilet and grass irrigation water demand at time step t, and S (m3) is the tank storage capacity.
In the present study, the water balance of each RWH tank was evaluated at daily scale. The RWH system performance, in terms of water saving efficiency, was evaluated for every year of the entire simulation period by means of two dimensionless indexes frequently used in the literature [22]: The reliability of the system and the rainwater overflow ratio. The reliability RV is calculated as the total actual rainwater supply over water demand:
where T is the total time period under consideration and represents the overall water savings achieved by using the RWH system. The overflow ratio OR is the non-potable water which exceeds the RWH tank capacity and is calculated as the ratio of the spilled rainwater (due to lack of storage in the tank) to the rainwater inflow in the tank [23]:
where QDt is the volume exceeding the storage capacity at time t, It is the inflow to the RWH system at time t.
To evaluate the performance of the RWH system in terms of flood reduction, two dimensionless indexes are commonly used: The rainwater retention and the ratio of reduced flood volume. For the entire period of simulation, the rainfall retention is calculated as the ratio of the total precipitation volume P less the total flood volume W and the total precipitation volume [24]:
The ratio of reduced flood volume U (expressed here as a percentage) is calculated as follows [10]:
where STOT is the total volume of RWH tanks and W is the flood volume.
2.5. The Hydraulic Model: FLO 2-D
In the urban catchment, flood routing was performed using the two-dimensional hydraulic model FLO-2D (http://www.flo-2d.com/) [25]. The model governing equations include the continuity equation and the two-dimensional equations of motion. The FLO-2D simulation code solves these equations using a finite difference method on a grid of square elements which is also employed to obtain the map of flooded areas. The model includes a number of components useful to enhance the detail of a flood simulation (e.g. channel floodplain discharge exchange, loss of storage due to buildings, flow obstructions, street flow, bridge and culvert flow, levee, debris flow, sediment transport etc.). In this study, the application of FLO-2D allowed the estimation of the flood volumes in absence and presence of RWH tanks.
The whole simulated domain (Figure 1b) has an area equal to 76 ha and it was discretized with 190,000 squared cells 2 m × 2 m. As the area is mainly affected by zenithal floods, the area was divided in terms of roughness (gardens and parks were assumed to have roughness equal to 0.03 in the Manning scale; roads, pavements, roofs were assumed to have roughness equal to 0.015).
The analyzed area is served by an underground combined sewer system that was implemented in the model. The drainage system is made by circular polyethylene pipes with diameters ranging between 300 mm and 600 mm. Manholes are present along the roads with inter-distance between 30 and 50 m and their position was considered in the model as they represent the interconnection between the underground drainage system and the surface flooding propagation along the roads. Manholes maximum depth ranges between 3 and 5 m depending on served areas and sewer slopes. The layout of the drainage system is presented in Figure 1b.
3. Results
3.1. Water Balance Simulation
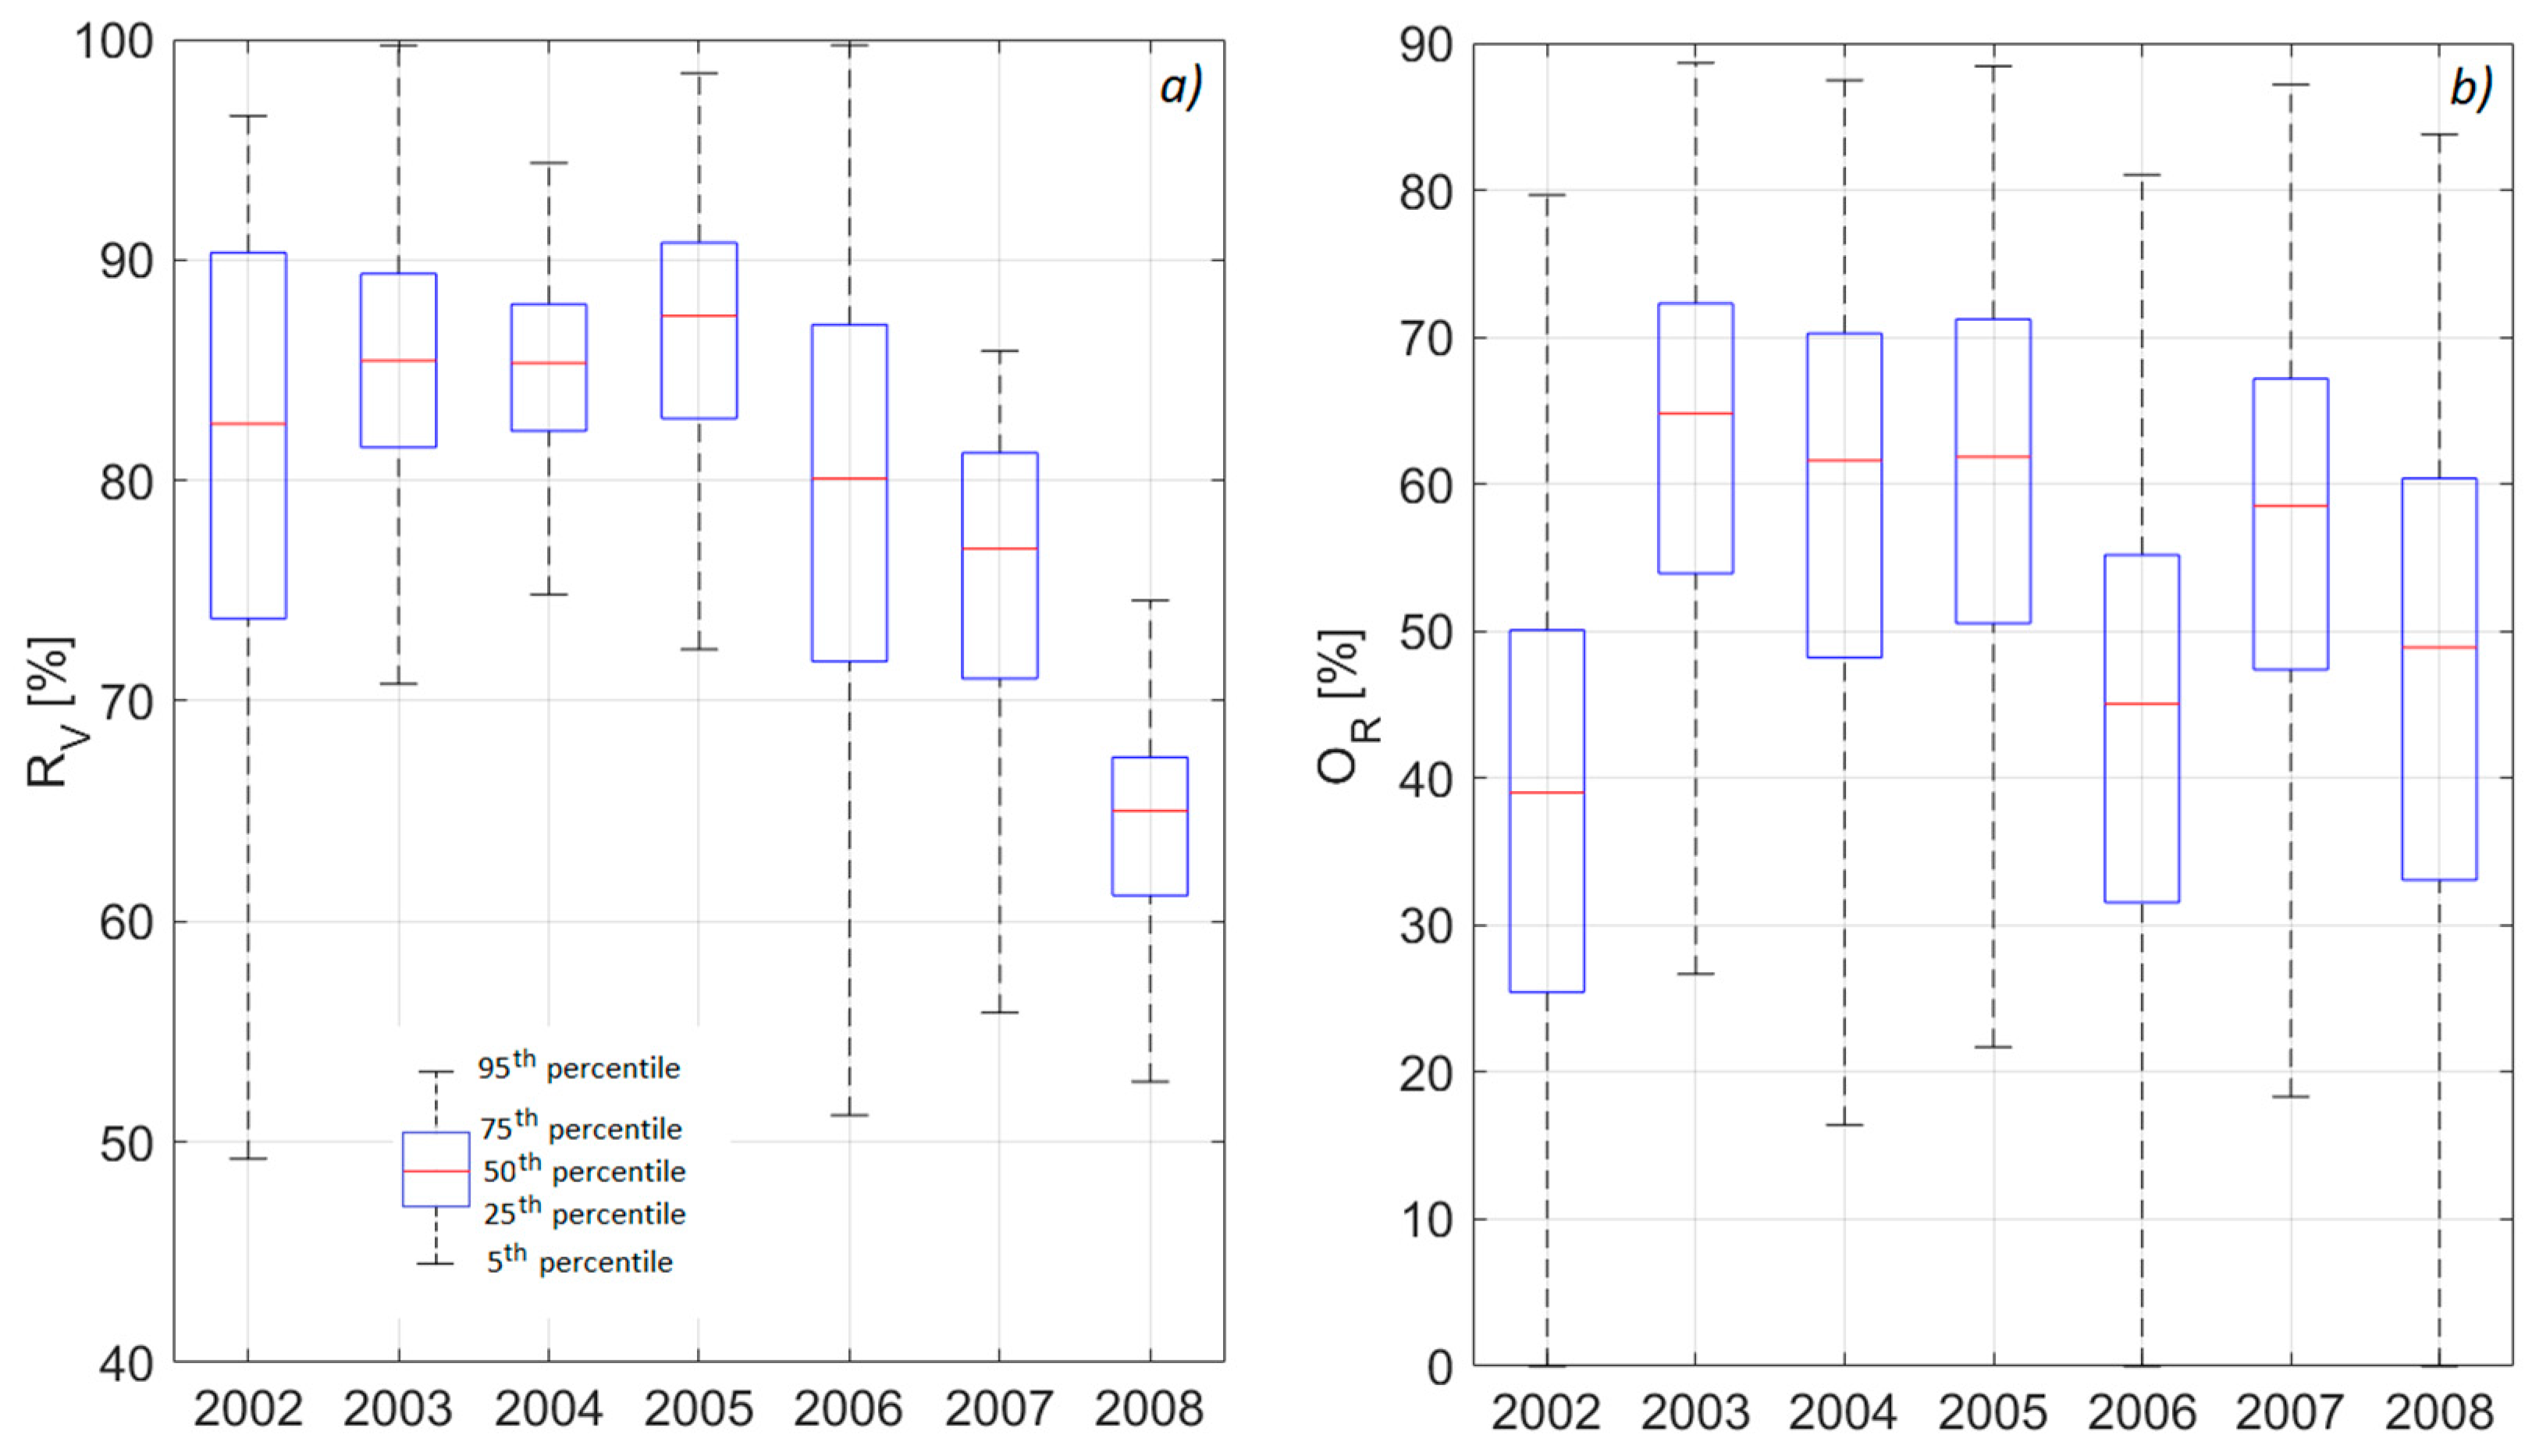
The historical rainfall series recorded in the Palermo rain gauge during the 2002–2008 period was used to evaluate the performance of the RWH system installed in the 408 single-family houses included in the analysis. The system performance was assessed by means of the reliability RV, calculated using Equation (5). The box-whisker plot in Figure 2a shows the variation of annual average RV during the analyzed period. The 50th percentile of RV is 80% or above for the years from 2002 to 2006, while a decrease occurs in the last two years of the series. Low values of the 5th percentile point out that, for some of the single-family houses, a tank of 5 m3 is not adequate to ensure a good performance of the system. Nevertheless, in this analysis, the same capacity was considered for all the RWH tanks. Indeed, the identification of the optimal tank size is out of the scope of this study.
As described in Section 2.4, the OR indicated the percentage of water that enters the RWH tank and is released during the simulation period [22]. Basically, the OR provides an estimation of the percentage of rainwater that the RWH tank failed to harvest. The box-whisker plot in Figure 2b shows the variation of annual average OR during the analyzed period. The 50th percentile of OR is variable and ranges between 39% and 65%. Where the OR reaches high values, most of the stormwater that enters the RWH tank is released.
Figure 3 shows the comparison between the average annual values of the two performance indexes. Results show that the installation of the RWH system is highly affected by the rainfall variability over the area of study. The average RV ranges between 63% and 86%, while the average OR varies from 38% and 62%. Even if the performance of the RWH installation could be improved in many cases by increasing the tank volume, on average, the configuration analyzed in this study ensures a good result in terms of RV. On the one hand, the increase of the RWH tank volume would provide an improvement of the system in terms of water saving efficiency, on the other hand, a higher capacity would ensure additional storage for stormwater and, consequently, a reduction of the water released from the tank during rainfall events. Nevertheless, the optimal capacity of the RWH tank should be investigated case-by-case and would require the knowledge of the real number of users in each single-family house, together with a more accurate and specific definition of the water demand pattern.
3.2. Flood Volume Reduction
To evaluate the reduction of flood volumes due to the installation of the RWH tanks, two scenarios were considered: The first, that is representative of the current conditions of the catchment area (absence of RWH systems), and the second in which it is assumed that a 5 m3 tank has been installed in 408 single-family houses. The analysis of the overflow component from the water balance simulation of the tank allowed the investigation of the tank behavior with regard to its potential flood volume reduction.
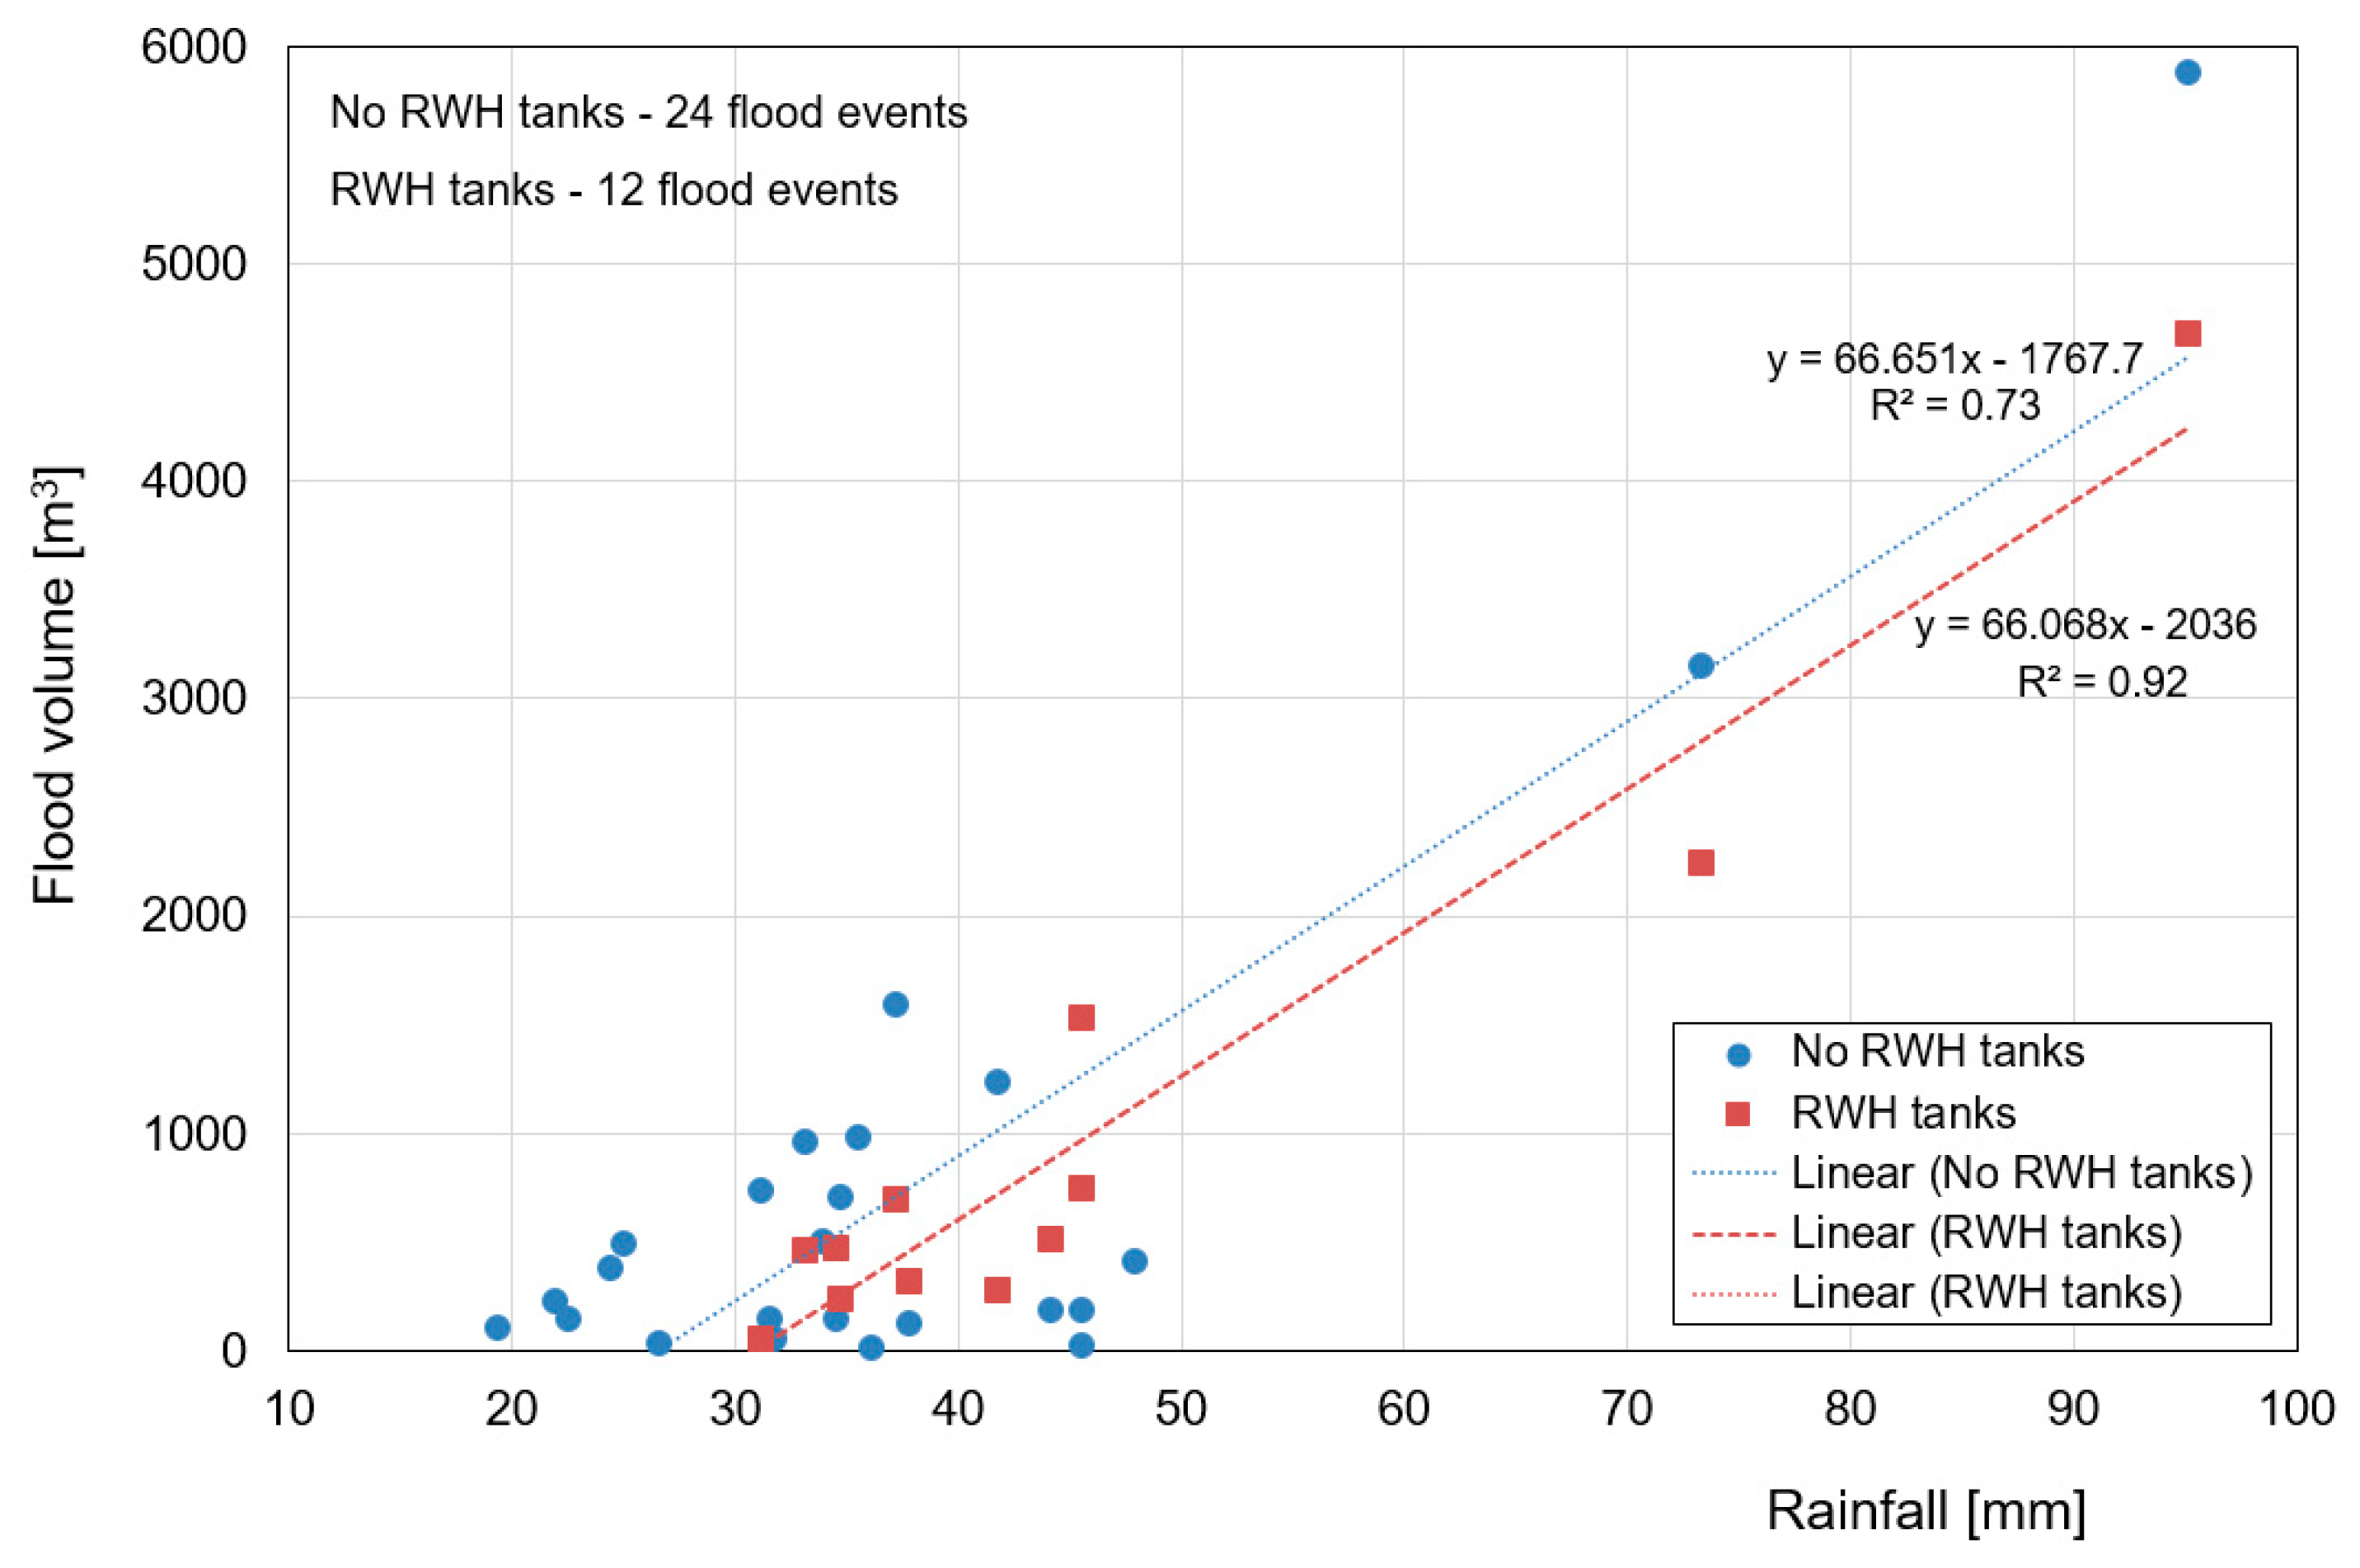
Figure 4 compares the response of the urban catchment to rainfall. Considering a linear relationship between rainfall and flood volume, the distance between the two regression lines represents the flood reduction and the proportion retained due to the RWH tanks. The installation of RWH tanks in the area of study provides a reduction of flood volumes (approximately 300 m3). Also, the number of flood events is reduced from 24 to 12, meaning that, under the assumed configuration, the RWH tanks have been able to halve the number of failures of the urban drainage system.
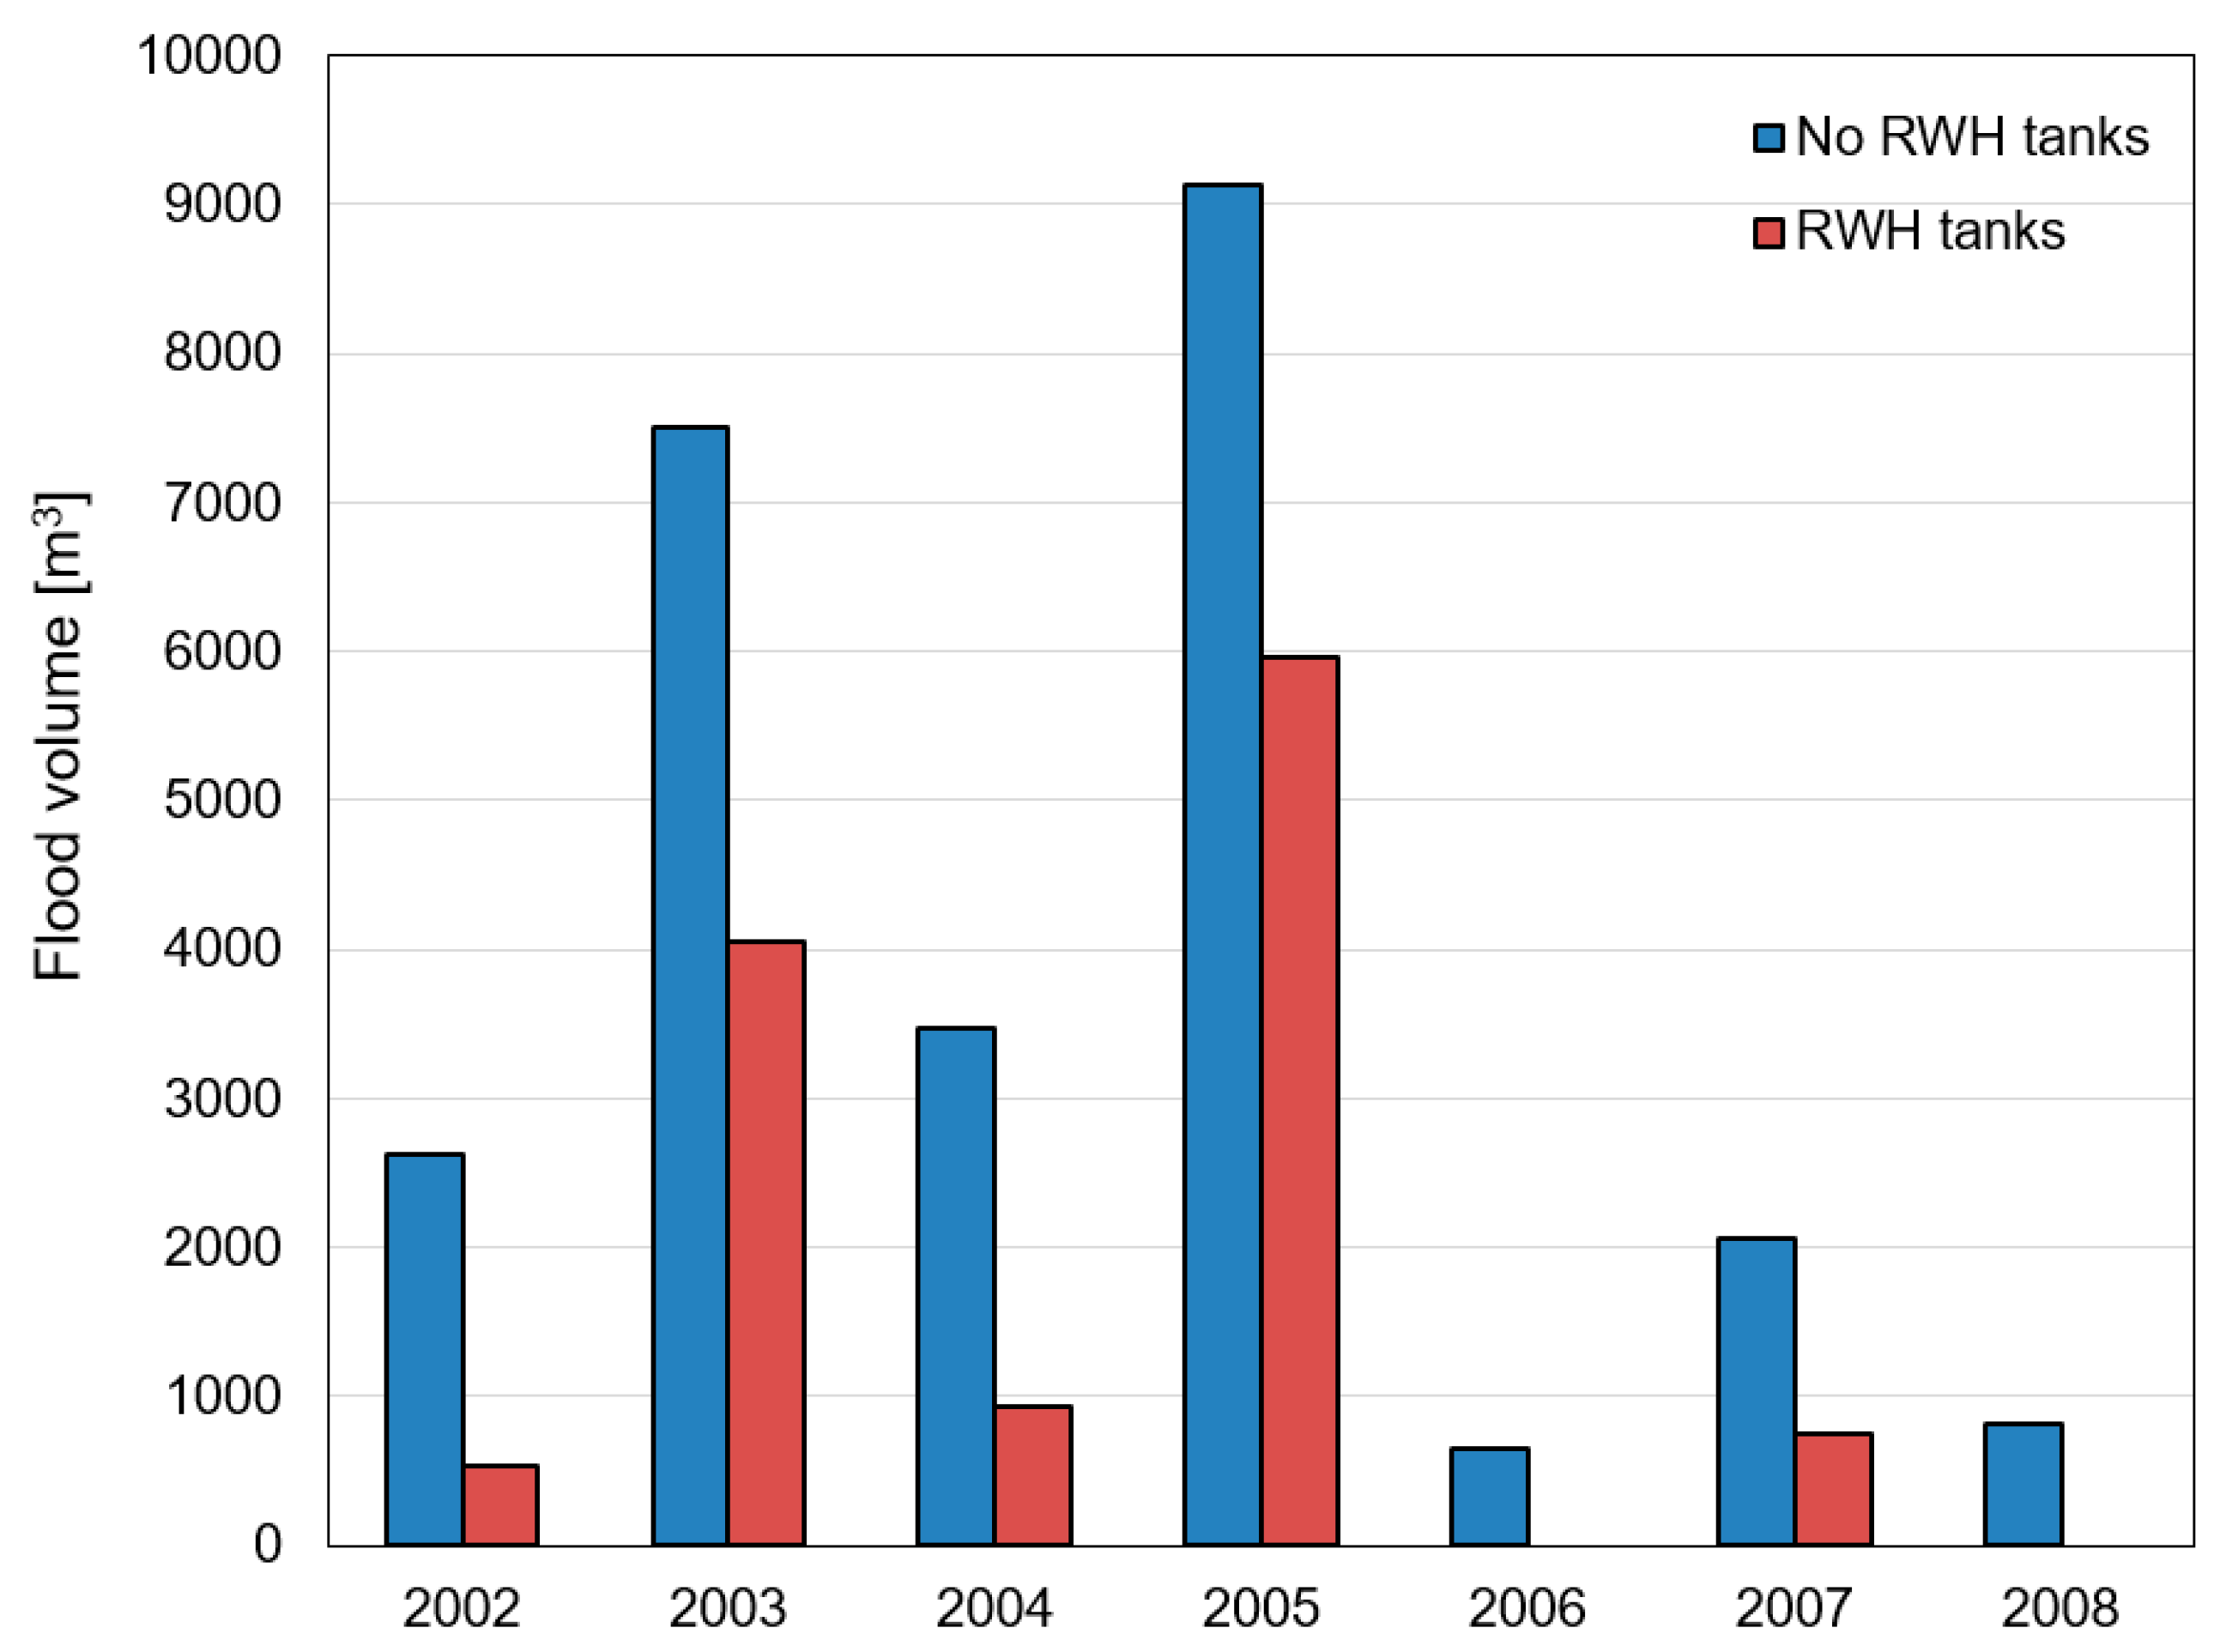
Figure 5 compares the annual flood volumes simulated in absence of RWH tanks and in the case of RWH tanks installed for all the 408 single-family houses. Because of the lower total annual rainfall, the installation of the RWH tanks ensured the absence of flood volumes in 2006 and 2008. During the remaining years of the analyzed period, the assumed configuration of the RWH system provided an effective reduction of flood volumes.
Table 2 shows in detail the number of flood events and the percentage of the reduction of flood volumes for each year of simulation in the two scenarios. The assumed configuration is able to provide a remarkable reduction of flood volume in most of the simulated years. In particular, the installation of RWH tanks allowed a complete retention of stormwater during 2006 and 2008, reducing the flood volumes of 100%.
The reduced ratio of flood volume by rainwater harvesting is calculated using Equation (7) for three different rainfall depth: The maximum daily rainfall recorded during the 2002–2008 period, the annual average maximum rainfall, and the critical rainfall of duration d 24 h and return period T equal to 5 years. Table 3 shows the reduced ratios of flood volume for the above-mentioned rainfall values, considering a total tank capacity equal to 2040 m3. These results point out the effectiveness of RWH systems in reducing flood volumes. Indeed, according to the two indexes, for rainfall depth equal to the average annual daily maximum value, the installation of RWH tanks in the area of study is likely to ensure the complete retention of stormwater avoiding urban floods. Nevertheless, these results need to be confirmed by the assessment of the flooded areas by means of the hydraulic model.
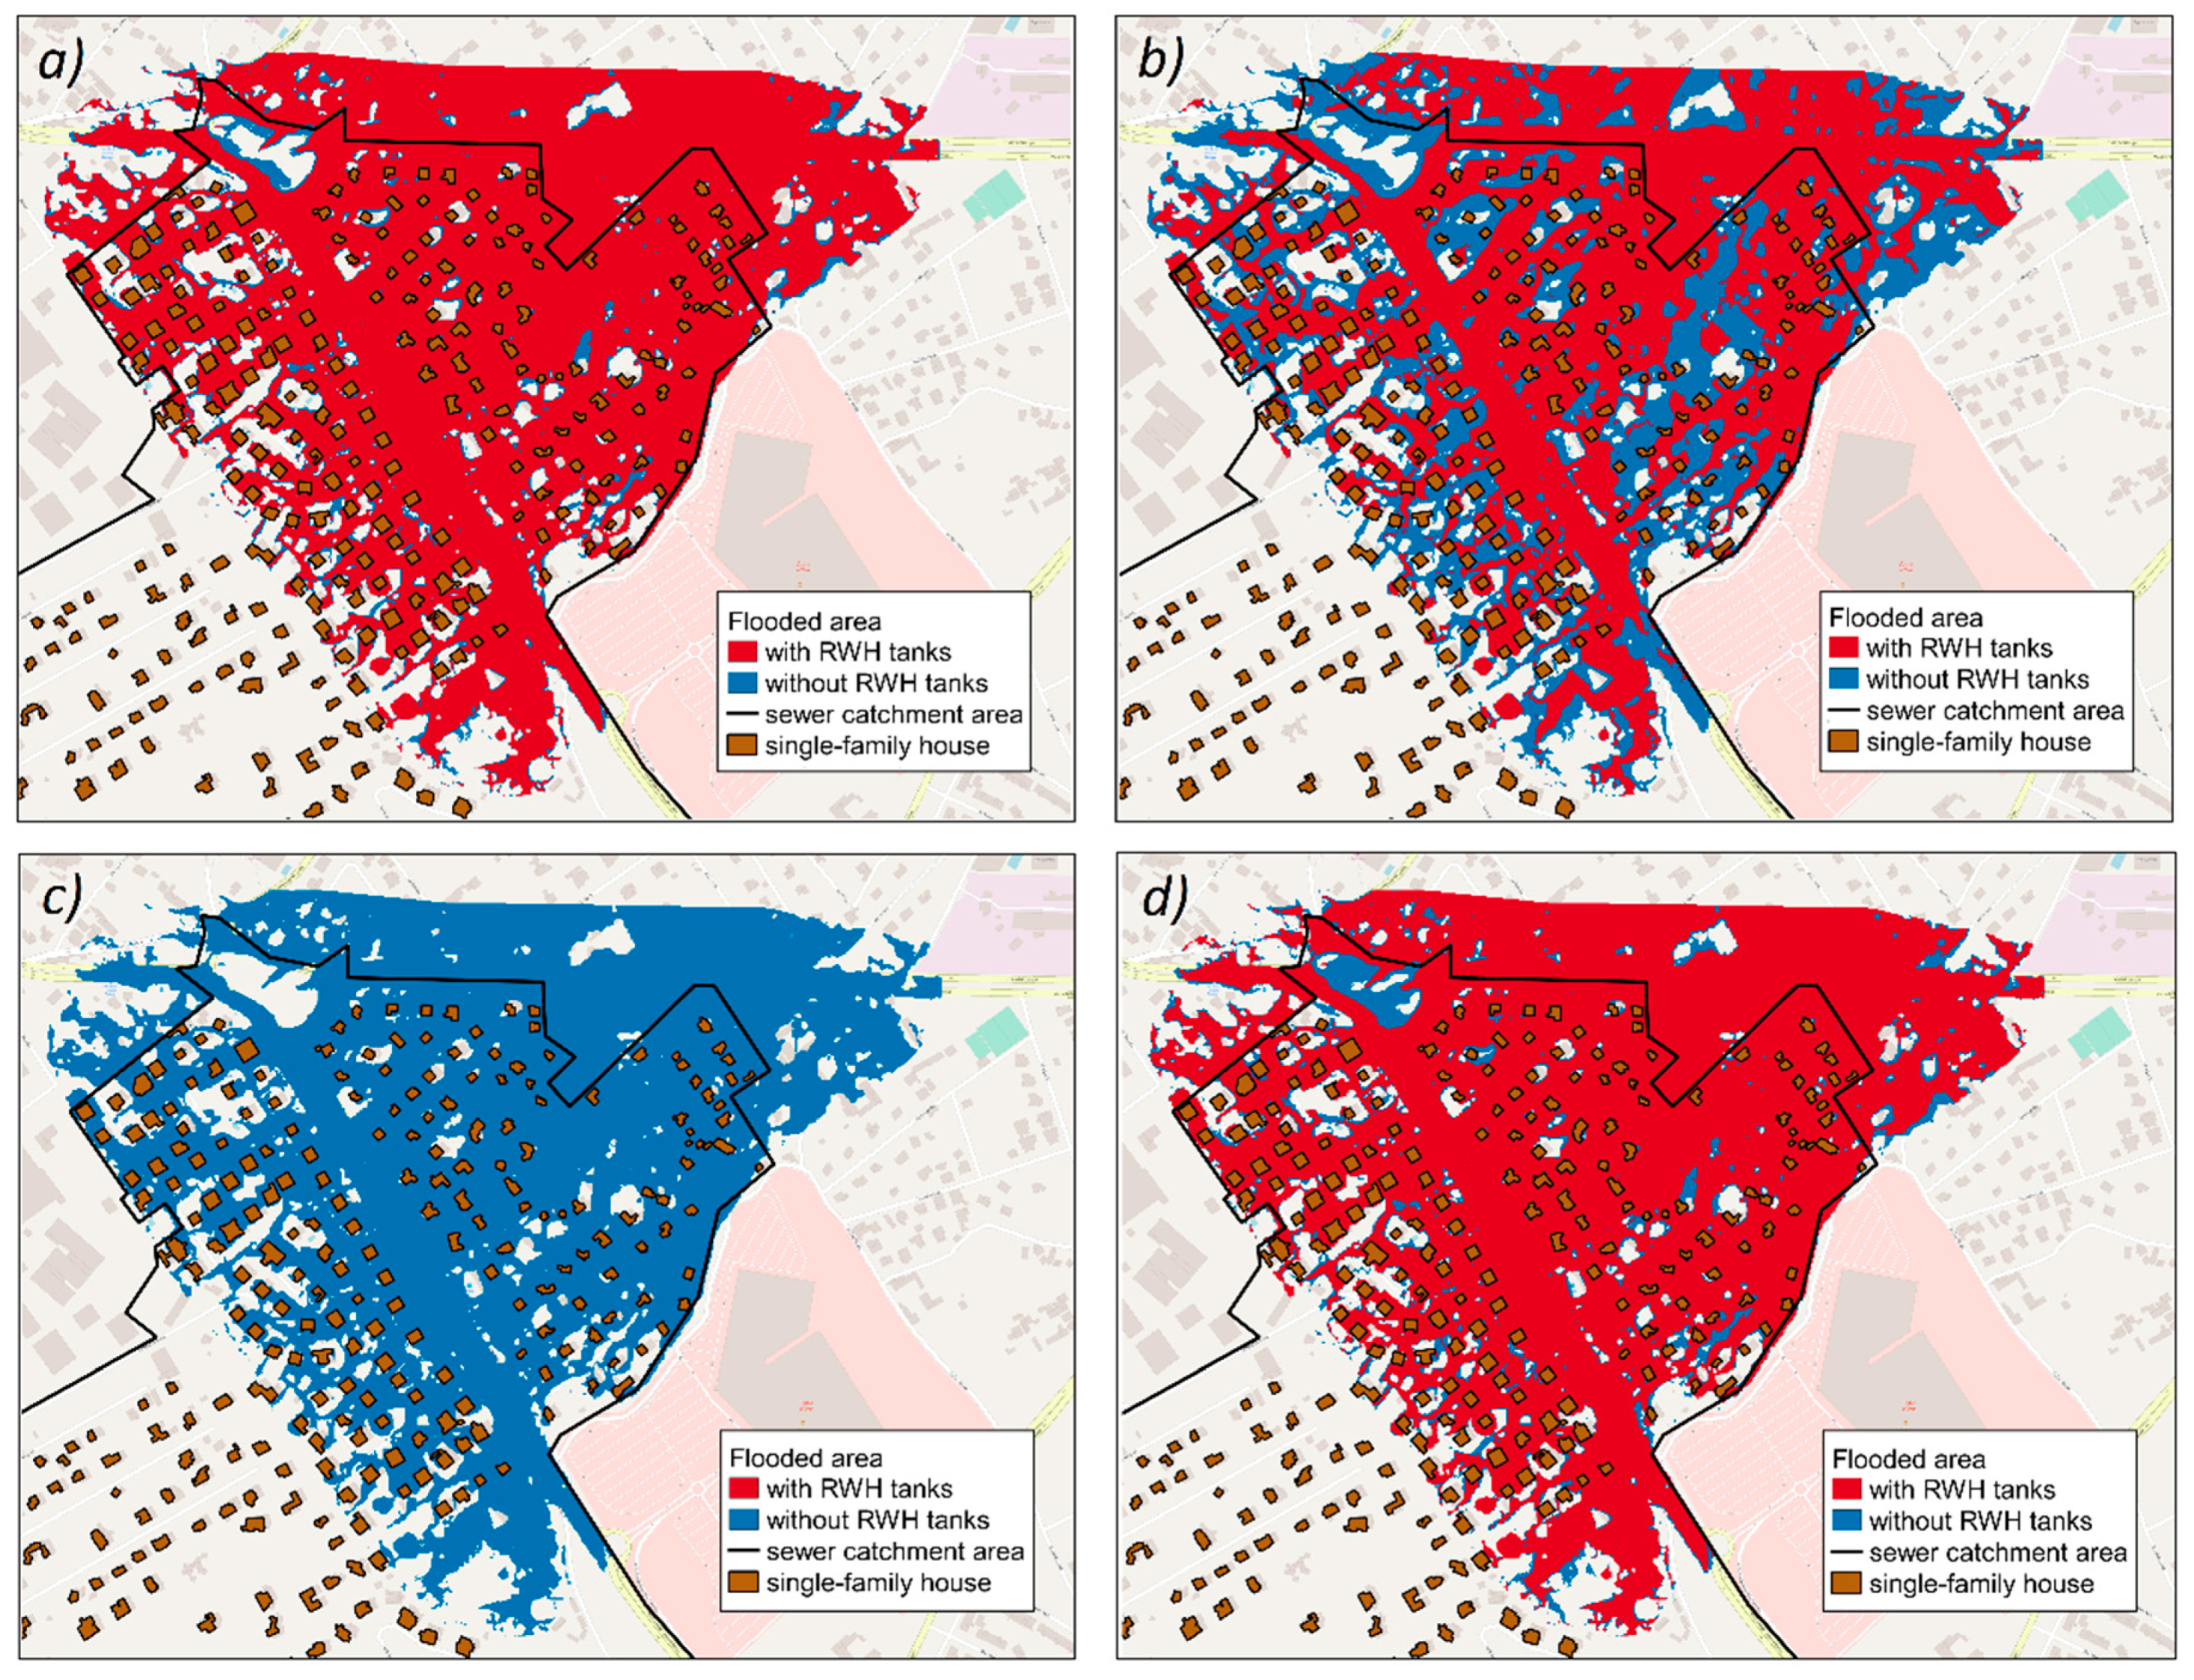
The effect of the installation of the RWH tanks on the maximum flow depth and on the extension of the flooded areas in a part of the analyzed urban catchment was investigated. The output of the FLOD-2D simulations was used to define some maps in which the maximum flow depth for specific rainfall events were displayed. In order to have an overview of the RWH system response to different rainfall conditions, four rainfall events were analyzed: the maximum rainfall event recorded over the 2002–2008 period (95.2 mm) recorded the 13 December 2005, an event close to the average maximum daily rainfall during the analyzed period (41.8 mm) recorded the 23 September 2003, an average rainfall event that typically produces flood in the area of study (34 mm) recorded the 19 September 2003, and a critical rainfall event (d = 24 h and T = 5 years). Figure 6 shows the spatial distribution of the maximum flow depth in absence and presence of the RWH tanks for the above-mentioned rainfall events. In Figure 6a,b results for the maximum rainfall are reported, in absence and presence of the RWH tanks, respectively. Comparing the two maps, it is evident that the effectiveness of the RWH installation in terms of flood volume reduction is very weak. The flooded areas in the two cases are almost identical. Also, the reduction of maximum flow depth is very small. The average maximum flow depths are 0.24 m and 0.20 in absence and presence of the RWH system, respectively. These results point out the inadequacy of the assumed configuration to reduce the flow depths and the flooded areas. The installed capacity (5 m3) is not enough to provide a considerable flood volume reduction. Whereas, Figure 6c,d show that the RWH tanks perform a good response when the magnitude of the rainfall event is approximately equal to the average maximum daily rainfall. In this case, a remarkable reduction of both maximum flow depth and flooded areas can be observed. The average maximum flow depths are equal to 0.23 m in absence and to 0.11 in presence of the RWH tanks, respectively. Figure 6e,f illustrate the results obtained for the average rainfall event that produces flood. Flooded areas are absent when the RWH tanks are installed, meaning that the system is able to ensure a complete retention of stormwater. The response of the RWH installation for a critical event of 5 years return period is similar to that observed in the case of the maximum rainfall depth (Figure 6g,h). The installation of the RWH tanks slightly reduces the maximum flow depth. In this case, the average maximum flow depths are 0.25 m and 0.21 in absence and presence of RWH system, respectively.
Finally, the maps in Figure 7 compare the extension of the flooded areas in absence and presence of the RWH tanks. In these maps, the flooded area in absence of the RWH system is the sum of the red and blue areas. In Figure 7a, results obtained for the 13 December 2005 event (maximum rainfall depth) are illustrated. The difference between the two cases is minimal, the flooded area has a very small reduction when the stormwater is collected (only 5.0%). Figure 7b shows that the installation of the RWH tanks is able to produce a 34.9% reduction of flooded areas for the average maximum rainfall event. The installation of higher capacities could improve this result, increasing the contribution of the RWH tanks in flood area reduction. The effectiveness of the RWH system is maximum in case of smaller rainfall events. Simulations showed that, for rainfall events up to 34 mm, the RWH tanks are able to completely retain the stormwater, providing a 100% reduction of flood volumes and flooded areas (Figure 7c). In the case of a critical event of 5 years return period, the behavior of the RWH system is comparable to that observed for the maximum rainfall (Figure 7d). The extension of the flooded area is slightly reduced (8.4%). Table 4 summarizes the percentage reduction of flooded area for the different rainfall events.
The spatial distribution of flooded areas, obtained from the application of the hydraulic model, highlighted that the only assessment of the indexes in Equations (8) and (9) is not exhaustive to test the effectiveness of the RWH system in terms of flood reduction. The calculation of PR and U indicated a complete reduction of flood volumes for rainfall events with a depth equal to the annual average maximum (52.1 mm). This result is not confirmed by the maps from FLO-2D simulations. Specifically, Figure 6d shows that a rainfall event of 41.8 mm is able to produce a flood in the analyzed urban catchment.
4. Conclusions
This study was aimed at evaluating and quantifying the effectiveness of rainwater harvesting in reducing flood volume and, consequently, mitigating urban waterlogging problems in a residential area in Palermo (Southern Italy). Results pointed out that the implementation of RWH systems at the urban catchment scale has important implications on urban water management. Specifically, the RWH systems have a remarkable role in the reduction of flood volumes, providing an important contribution to avoiding potential drainage system failures during storm events. Nevertheless, the effectiveness of these systems is affected by the magnitude of rainfall events. A series of 2D hydraulic simulations performed for the area of study showed that, for a rainfall event of low and medium depth (up to 50 mm), the RWH system is able to provide a good performance, ensuring an effective reduction of flood volumes. Analyzing the response of the urban catchment to the maximum rainfall depth recorder over the 2002–2008 period and the critical rainfall event of the 5 year return period showed that the contribution of the RWH tanks to flood volume reduction is weak due to the shortage of capacity to store rainfall peak events. Indeed, the retention of stormwater during critical or heavy rainfall events requires the introduction of specific mitigation measures, such as detention tanks or bigger pipes, that are able to significantly reduce peak flows or the installation of RWH tanks with a capacity higher than 5 m3. Nevertheless, the cost related to the setup of capacity greater than 5 m3 could be not convenient, therefore a cost-benefit analysis should be carried out to verify the economic feasibility of the project.
The installation of the RWH tanks in the urban catchment has implications to the extension of flooded area. Flooded areas can be reduced up to 100% when small rainfall events occur. For a rainfall event with depth up to 50 mm, approximately a 35% of flooded area reduction can be reached. The reduction of flooded area is negligible for severe rainfall events.
Further analyses are required to completely investigate the exploitation of the RWH technologies in urban catchment. Indeed, more scenarios of water demand and rainfall should be analyzed, together with the identification of the optimal size of the tank for each single-family house. This analysis requires detailed knowledge of the number of users and the water demand patterns.
Author Contributions
Conceptualization, G.F. and L.L.; methodology, G.F and L.L.; formal analysis, G.F. and L.L.; investigation, G.F. and L.L.; data curation, G.F. and L.L.; writing—original draft preparation, G.F. and L.L. writing—review and editing, G.F. and L.L.; visualization, G.F. and L.L.; supervision, G.F.
Funding
This research received no external funding.
Conflicts of Interest
The authors declare no conflict of interest.
References
- Ammar, A.; Riksen, M.; Ouessar, M.; Ritsema, C. Identification of suitable sites for rainwater harvesting structures in arid and semi-arid regions: A review. Int. Soil Water Conserv. Res. 2016, 4, 108–120. [Google Scholar] [CrossRef] [Green Version]
- Taffere, G.R.; Beyene, A.; Vuai, S.A.; Gasana, J.; Seleshi, Y. Reliability analysis of roof rainwater harvesting systems in a semi-arid region of sub-Saharan Africa: Case study of Mekelle, Ethiopia. Hydrol. Sci. J. 2016, 61, 1135–1140. [Google Scholar] [CrossRef]
- Al-Batsh, N.; Al-Khatib, I.A.; Ghannam, S.; Anayah, F.; Jodeh, S.; Hanbali, G.; Khalaf, B.; van der Valk, M. Assessment of Rainwater Harvesting Systems in Poor Rural Communities: A Case Study from Yatta Area, Palestine. Water 2019, 11, 585. [Google Scholar] [CrossRef]
- Campisano, A.; Lupia, F. A dimensionless approach for the urban-scale evaluation of domestic rainwater harvesting systems for toilet flushing and garden irrigation. Urban Water J. 2017, 14, 883–891. [Google Scholar] [CrossRef]
- Petit-Boix, A.; Devkota, J.; Phillips, R.; Vargas-Parra, M.V.; Josa, A.; Gabarrell, X.; Apul, D. Life cycle and hydrologic modeling of rainwater harvesting in urban neighborhoods: Implications of urban form and water demand patterns in the US and Spain. Sci. Total Environ. 2018, 621, 434–443. [Google Scholar] [CrossRef] [PubMed]
- Coombes, P.J.; E Barry, M. The relative efficiency of water supply catchments and rainwater tanks in cities subject to variable climate and the potential for climate change. Australas. J. Water Resour. 2008, 12, 85–100. [Google Scholar] [CrossRef]
- Burns, M.J.; Fletcher, T.D.; Duncan, H.P.; Hatt, B.E.; Ladson, A.R.; Walsh, C.J. The stormwater retention performance of rainwater tanks at the landparcel scale. In Proceedings of the 7th International Conference on Water Sensitive Urban Design, Melbourne Australia, 21–23 February 2012; p. 195. [Google Scholar]
- Steffen, J.; Jensen, M.; Pomeroy, C.A.; Burian, S.J. Water Supply and Stormwater Management Benefits of Residential Rainwater Harvesting in U.S. Cities. JAWRA J. Am. Water Resour. Assoc. 2013, 49, 810–824. [Google Scholar] [CrossRef]
- Gerolin, A.; Kellagher, R.B.; Faram, M.G. Rainwater harvesting systems for stormwater management: Feasibility and sizing considerations for the UK. In Proceedings of the Novatech 2010—7th International Conference on Sustainable Techniques and Strategies for Urban Water Management, Lyon, France, 27 June–1 July 2010. [Google Scholar]
- Zhang, X.; Hu, M.; Chen, G.; Xu, Y. Urban Rainwater Utilization and its Role in Mitigating Urban Waterlogging Problems—A Case Study in Nanjing, China. Water Resour. Manag. 2012, 26, 3757–3766. [Google Scholar] [CrossRef]
- Petrucci, G.; Deroubaix, J.-F.; De Gouvello, B.; Deutsch, J.-C.; Bompard, P.; Tassin, B. Rainwater harvesting to control stormwater runoff in suburban areas. An experimental case-study. Urban Water J. 2012, 9, 45–55. [Google Scholar] [CrossRef] [Green Version]
- Campisano, A.; Modica, C. Appropriate resolution timescale to evaluate water saving and retention potential of rainwater harvesting for toilet flushing in single houses. J. Hydroinformatics 2015, 17, 331–346. [Google Scholar] [CrossRef] [Green Version]
- Palla, A.; Gnecco, I.; La Barbera, P. The impact of domestic rainwater harvesting systems in storm water runoff mitigation at the urban block scale. J. Environ. Manag. 2017, 191, 297–305. [Google Scholar] [CrossRef] [PubMed]
- Teston, A.; Teixeira, C.A.; Ghisi, E.; Cardoso, E.B. Impact of Rainwater Harvesting on the Drainage System: Case Study of a Condominium of Houses in Curitiba, Southern Brazil. Water 2018, 10, 1100. [Google Scholar] [CrossRef]
- Wisner, P.; P’ng, J.C. OTTHYMO, A Model for Master Drainage Plans, IMPSWM Urban Drainage Modelling Procedures, 2nd ed.; Department of Civil Engineering, University of Ottawa: Ottawa, ON, Canada, 1983. [Google Scholar]
- Yaziz, M.I.; Gunting, H.; Sapari, N.; Ghazali, A.W. Variations in rainwater quality from roof catchments. Water Res. 1989, 23, 761–765. [Google Scholar] [CrossRef]
- Coombes, P. Rainwater Tanks Revisited: New Opportunities for Urban Water Cycle Management. Ph.D. Thesis, University of Newcastle, Callaghan, NSW, Australia, 2002. [Google Scholar]
- Liuzzo, L.; Notaro, V.; Freni, G. A Reliability Analysis of a Rainfall Harvesting System in Southern Italy. Water 2016, 8, 18. [Google Scholar] [CrossRef]
- Fewkes, A.; Butler, D. Simulating the performance of rainwater collection and reuse systems using behavioural models. Build. Serv. Eng. Res. Technol. 2000, 21, 99–106. [Google Scholar] [CrossRef]
- Ward, S.; Memon, F.A.; Butler, D. Rainwater harvesting: Model-based design evaluation. Water Sci. Technol. 2010, 61, 85–96. [Google Scholar] [CrossRef] [PubMed]
- Jenkins, D.; Pearson, F.; Moore, E.; Sun, J.K.; Valentine, R. Feasibility of Rainwater Collection Systems in California. Contribution No. 173; Californian Water Resources Centre, University of California: Oakland, CA, USA, 1978. [Google Scholar]
- Palla, A.; Gnecco, I.; Lanza, L. Non-dimensional design parameters and performance assessment of rainwater harvesting systems. J. Hydrol. 2011, 401, 65–76. [Google Scholar] [CrossRef]
- Karim, M.R.; Bashar, M.Z.I.; Alam Imteaz, M. Reliability and economic analysis of urban rainwater harvesting in a megacity in Bangladesh. Resour. Conserv. Recycl. 2015, 104, 61–67. [Google Scholar] [CrossRef]
- Cipolla, S.S.; Maglionico, M.; Stojkov, I. A long-term hydrological modelling of an extensive green roof by means of SWMM. Ecol. Eng. 2016, 95, 876–887. [Google Scholar] [CrossRef]
- O’Brien, J.S.; Julien, P.Y.; Fullerton, W.T. Two-Dimensional Water Flood and Mudflow Simulation. J. Hydraul. Eng. 1993, 119, 244–261. [Google Scholar] [CrossRef]
Figure 1.
(a) Orthoimage of the area of study; (b) Location of single-family houses and sewer in the area of study.
Figure 1.
(a) Orthoimage of the area of study; (b) Location of single-family houses and sewer in the area of study.

Figure 2.
Box-whisker graphs: (a) Average annual Rv, (b) average annual OR.

Figure 3.
Annual average reliability RV, overflow ratio OR and total annual rainfall.

Figure 4.
Comparison of the urban catchment response to rainfall in absence and presence of the RWH (Rainwater harvesting) tanks.
Figure 4.
Comparison of the urban catchment response to rainfall in absence and presence of the RWH (Rainwater harvesting) tanks.

Figure 5.
Annual flood volumes in absence and presence of the RWH tanks.

Figure 6.
Maximum flow depth for different rainfall events: maximum rainfall event (13 December 2005), (a) no RWH tanks, (b) RWH tanks; average maximum rainfall event (26 September 2003), (c) no RWH tanks, (d) RWH tanks; average rainfall event that produces flood (19 December 2003), (e) no RWH tanks, (f) RWH tanks; the critical event for d = 24 h and T = 5 years, (g) no RWH tanks, (h) RWH tanks.

Figure 7.
Flooded area with and without RWH tanks installation for different rainfall events (the total flooded area in absence of RWH tanks is the sum of the red and the blue area): (a) Maximum rainfall event (13 December 2005); (b) average maximum rainfall event (26 September 2003); (c) an average rainfall event that produces flood (19 September 2003); (d) the critical event for d = 24 h and T = 5 years.


Table 1.
Monthly and annual rainfall statistics in the area of study.
| Month | Total Rainfall (mm) | Rainy Days | ||
|---|---|---|---|---|
| Average | Standard Deviation | Average | Standard Deviation | |
| January | 64.1 | 43.0 | 13 | 3 |
| February | 60.5 | 33.6 | 11 | 5 |
| March | 67.7 | 35.0 | 11 | 3 |
| April | 63.7 | 39.9 | 10 | 4 |
| May | 21.3 | 20.3 | 5 | 3 |
| June | 19.1 | 16.0 | 3 | 1 |
| July | 8.5 | 9.1 | 2 | 1 |
| August | 13.0 | 13.2 | 3 | 3 |
| September | 76.4 | 36.9 | 9 | 2 |
| October | 81.1 | 42.5 | 10 | 3 |
| November | 62.9 | 37.1 | 12 | 3 |
| December | 124.5 | 39.0 | 16 | 3 |
| Annual | 656.4 | 159.8 | 103.3 | 12.2 |
Table 2.
Annual flood reduction in absence and presence of the RWH systems.
| Year | Number of Flood Events | Flood Volumes (m3) | % Flood Volume Reduction | ||
|---|---|---|---|---|---|
| No RWH | RWH | No RWH | RWH | ||
| 2002 | 3 | 2 | 2629.2 | 529.2 | −80 |
| 2003 | 5 | 3 | 7506.1 | 4047.7 | −46 |
| 2004 | 5 | 2 | 3472.8 | 931.3 | −73 |
| 2005 | 4 | 4 | 9121.8 | 5960.4 | −35 |
| 2006 | 2 | 0 | 654.4 | 0.0 | −100 |
| 2007 | 3 | 1 | 2062.8 | 741.1 | −64 |
| 2008 | 2 | 0 | 819.7 | 0.0 | −100 |
Table 3.
Rainfall retention and ratio of reduced flood volume calculated for different rainfall values.
Table 3.
Rainfall retention and ratio of reduced flood volume calculated for different rainfall values.
| Rainfall (mm) | PR (%) | U (%) | |
|---|---|---|---|
| Maximum daily rainfall | 95.2 | 83.9 | 43.6 |
| Annual average maximum daily rainfall | 52.1 | 100.0 | 100.0 |
| Critical rainfall (d = 24 h and T = 5 years) | 71.2 | 90.2 | 88.4 |
Table 4.
Percentage reduction of flooded area for different rainfall events.
| Rainfall Event | Rainfall Depth (mm) | Area (m2) | % Reduction of Flooded Area | |
|---|---|---|---|---|
| No RWH | RWH | |||
| Maximum (13 December 2005) | 95.2 | 590713.7 | 561307.1 | 5.0 |
| Average maximum (26 September 2003) | 41.8 | 601352.2 | 391242.1 | 34.9 |
| Average (19 September 2003) | 34.0 | 574189.0 | 0 | 100.0 |
| Critical (d = 24 h, T = 5 years) | 71.2 | 617963.6 | 566099.5 | 8.4 |
© 2019 by the authors. Licensee MDPI, Basel, Switzerland. This article is an open access article distributed under the terms and conditions of the Creative Commons Attribution (CC BY) license (http://creativecommons.org/licenses/by/4.0/).
Share and Cite
MDPI and ACS Style
Freni, G.; Liuzzo, L. Effectiveness of Rainwater Harvesting Systems for Flood Reduction in Residential Urban Areas. Water 2019, 11, 1389. https://doi.org/10.3390/w11071389
AMA Style
Freni G, Liuzzo L. Effectiveness of Rainwater Harvesting Systems for Flood Reduction in Residential Urban Areas. Water. 2019; 11(7):1389. https://doi.org/10.3390/w11071389
Chicago/Turabian StyleFreni, Gabriele, and Lorena Liuzzo. 2019. "Effectiveness of Rainwater Harvesting Systems for Flood Reduction in Residential Urban Areas" Water 11, no. 7: 1389. https://doi.org/10.3390/w11071389
Note that from the first issue of 2016, this journal uses article numbers instead of page numbers. See further details here.