Impacts of Sea Level Rise and River Discharge on the Hydrodynamics Characteristics of Jakarta Bay (Indonesia)


1
Ocean College, Zhejiang University, Zhoushan 316021, China
2
State Key Laboratory of Satellite Ocean Environment Dynamics (Second Institute of Oceanography, MNR), Hangzhou 310058, China
*
Author to whom correspondence should be addressed.
Water 2019, 11(7), 1384; https://doi.org/10.3390/w11071384
Submission received: 8 May 2019
/
Revised: 3 July 2019
/
Accepted: 3 July 2019
/
Published: 5 July 2019
(This article belongs to the Special Issue Coastal Dynamic and Evolution)
Abstract
:Jakarta city has been vulnerable to sea level rise and flooding for many years. A Giant Seawall (GSW) was proposed in Jakarta Bay to protect the city. The impacts of sea level rise and river discharge on the tidal dynamics in Jakarta Bay and flooding areas in Jakarta city were investigated using the finite-volume coastal ocean model (FVCOM). Model results showed that the bay is diurnally dominated by the K1 tidal component. The diurnal tides propagate westward, while the semidiurnal tides propagate eastward in the bay. The rise of sea level increases the diurnal tidal component and the inundation areas due to the increased tidal forcing: when considering a sea level rise of 0.6 m, the K1 amplitude increases by ~1% (0.25 cm) near the coastline and the current magnitude increases by 16.6% (0.05 m/s). The inundation area increases with the sea level rise in the low land elevation areas occurring near the coastlines: the inundation area increased by 29.68 km2 (7.1%) with a sea level rise of 0.6 m. The increase of river discharge amplified the diurnal tidal component as well as the inundation areas at the river mouth due to increased fluvial forcing: if 10 times the mean river discharge occurs, the K1 amplitude increases by ~1% (0.25 cm) and the current magnitude increases by 100% (0.4 m/s), and the inundation areas increase by 26.61 km2 (6.2%). The K1 tidal phase remains almost unchanged under both the sea level rise and river discharge conditions. The combined increase of sea level rise and the river discharge amplifies the inundation areas and the tidal currents due to increased tidal and fluvial forcing. The construction of GSW would decrease the tidal prism and dissipation effects of the bay, thus slightly increasing the K1 amplitude of the tidal level: by less than 1% (0.2 cm). There would be no significant change of phase lag for the K1 component. Although this study is site specific, the findings could be applied more widely to any open-type bays.
1. Introduction
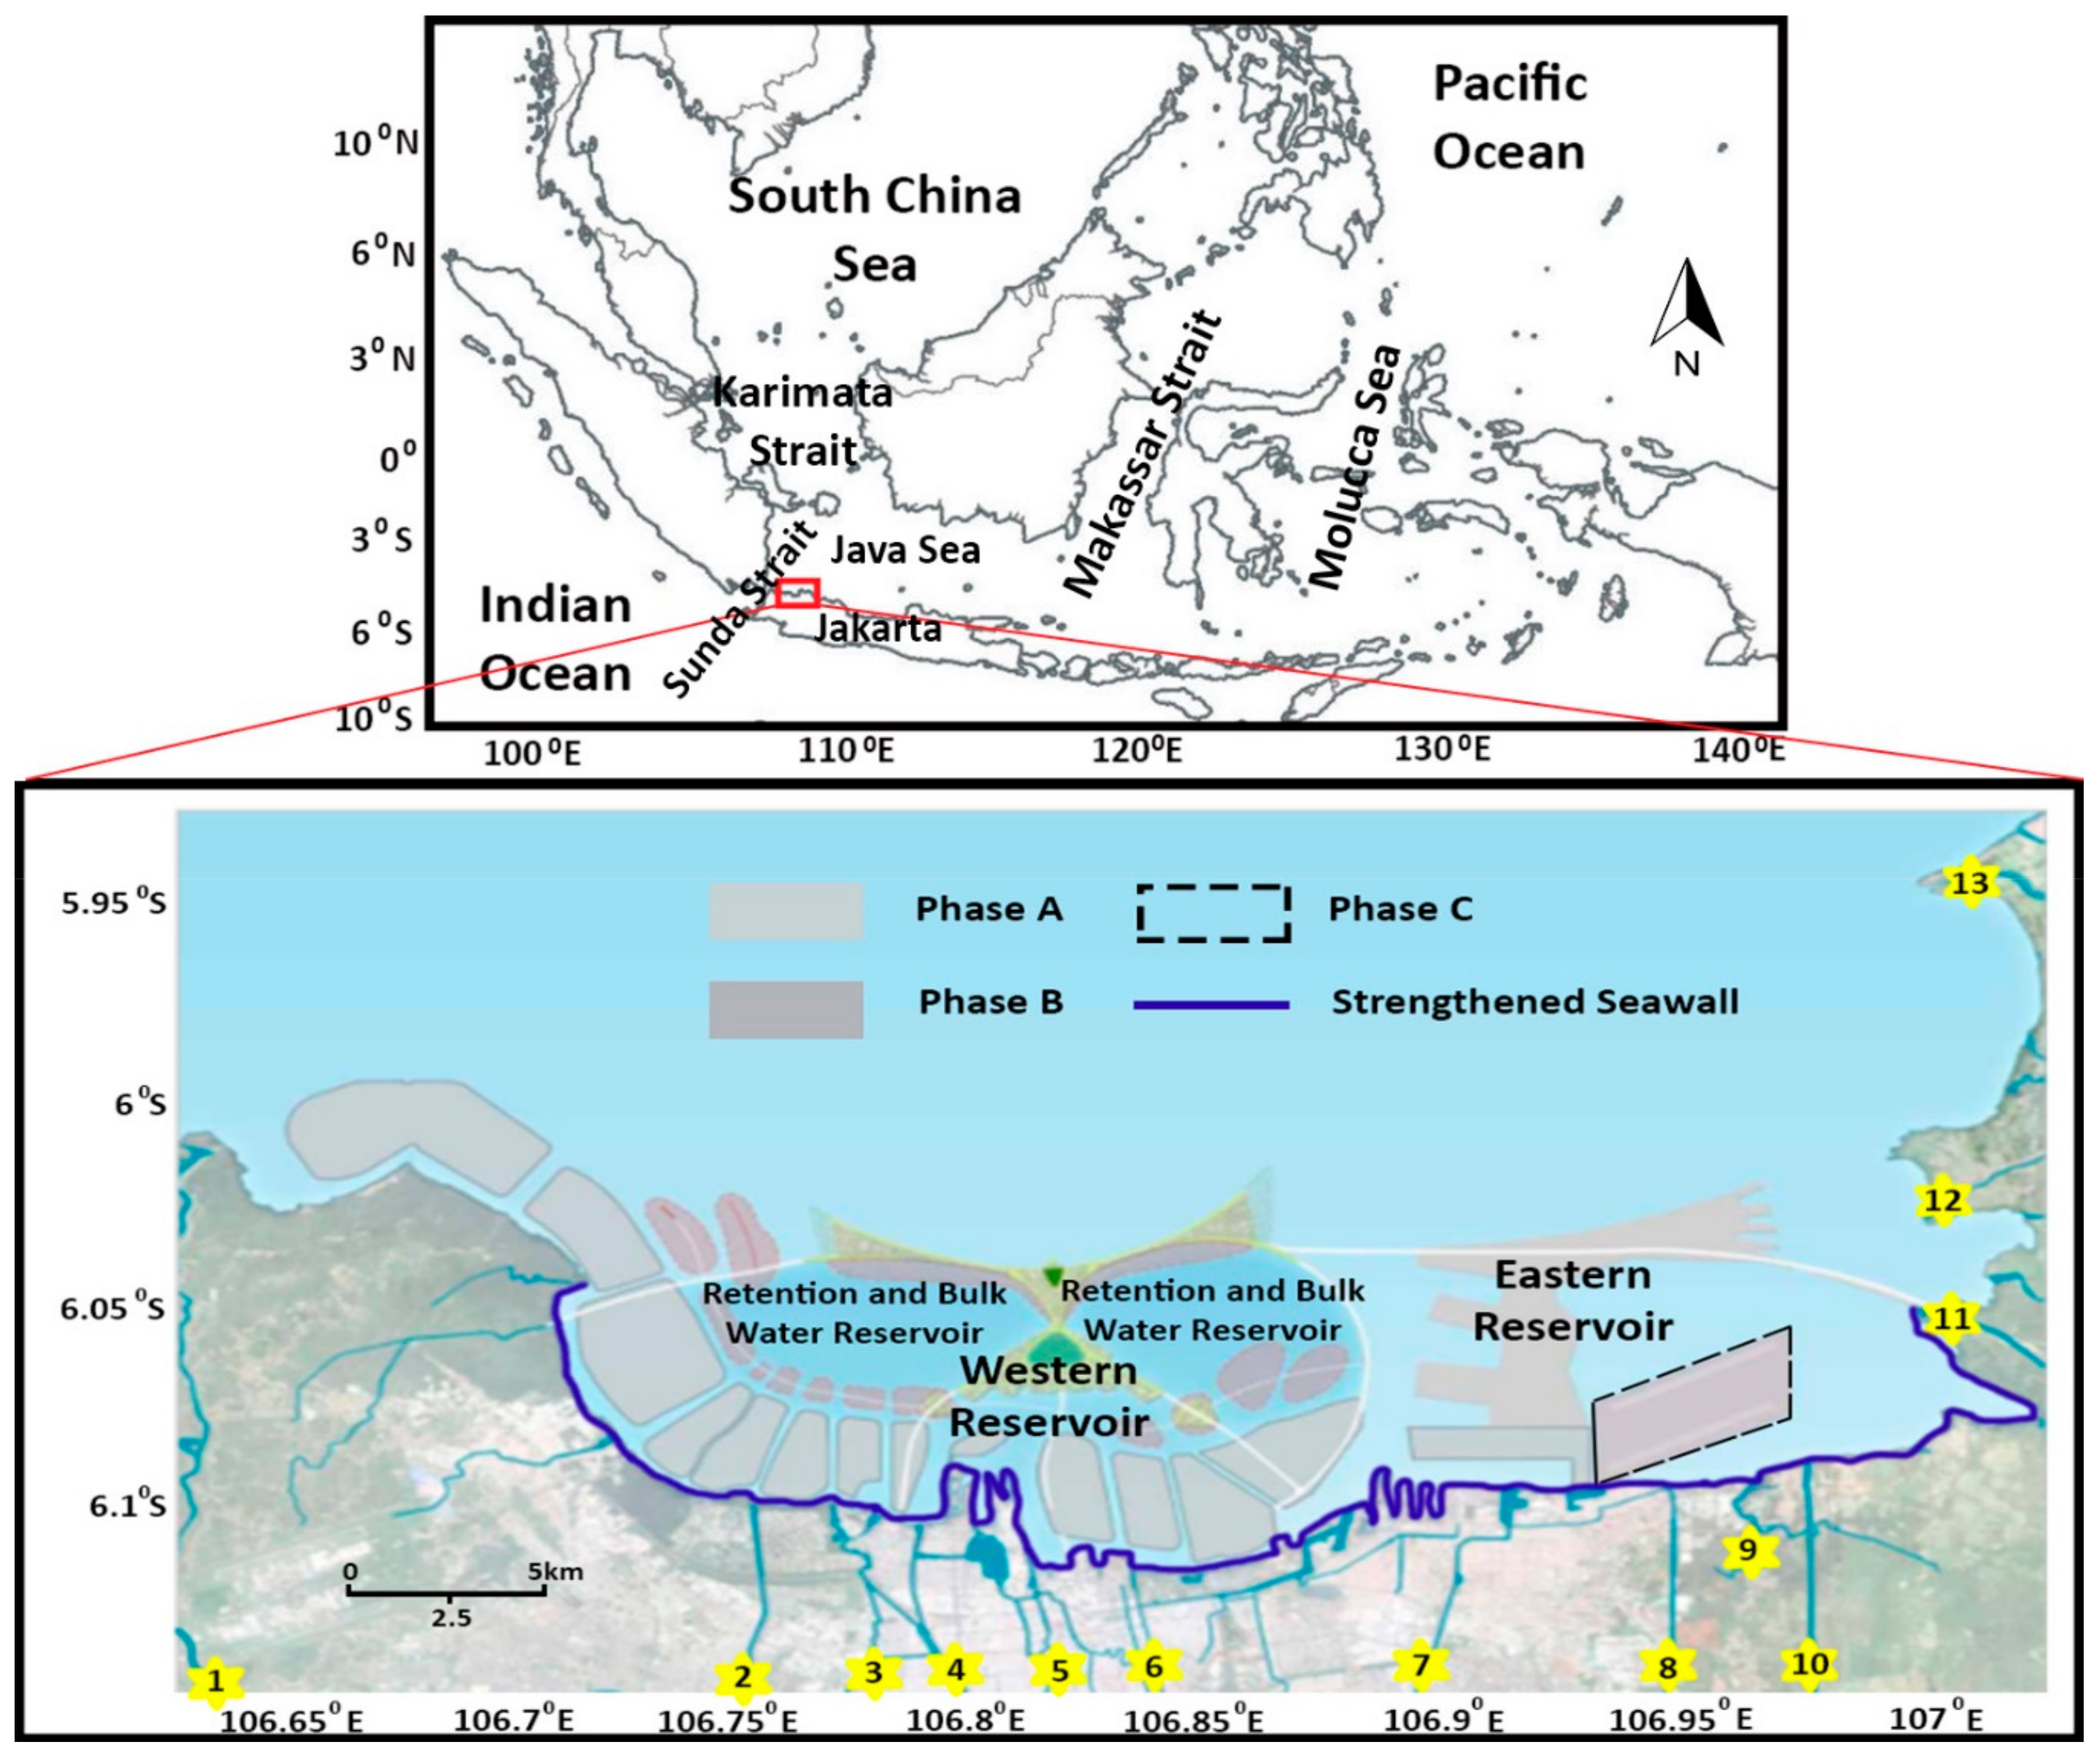
Jakarta Bay is located on the northwest coast of Java Island, extending from 5.8° S to 6.2° S and 106.6° E to 107.1° E [1]. It is a shallow bay with an average depth of about 18 m and an area of 662 km2 [2]. The bay is bordered by Pasir Cape to the west and Karawang Cape to the east, with a total coastline length of about 72 km.
Jakarta Bay is essential for the development of Jakarta city, the capital city of Indonesia. Jakarta city is the economic, cultural and political center of Indonesia. There are 10 million people in Jakarta city and more than 28 million people in the satellite cities of Jakarta [3]. The large population and the rapid development of the city have brought increasing urban development issues. The demographic change influenced by the urbanization causes large-scale rural land conversion and new town development in Jakarta city. This massive urbanization has led to some environmental issues. One of the environmental problems is related to flooding and sea level rise. Flood, in terms of river flooding and coastal flooding, is the most common natural disaster affecting populations in Asia [4]. For example, extreme rainfall events will increase in frequency and severity within the twenty-first century and lead to extreme river discharges [5].
Jakarta city experiences annual flooding disasters due to heavy rains, high river discharges, and high tides. An extreme flood occurred in 2007, when north Jakarta was hit by unusually high tides and heavy rains. The total inundation area in the extreme flood covered 400 km2. Approximately 70% of Jakarta was flooded with water depth of up to 4 m. This extreme flood cost was around 890 million USD in direct losses and more than 620 million USD in indirect losses [6]. Nearly 600,000 people were displaced and 79 people died. Many roads were closed, including the highway to the international airport, and electricity and telephone lines were cut. Some researchers believed that land subsidence contributed to the heavy flood in 2007. The land subsidence due to groundwater extraction was the main cause for lowering the land topography. At that time, the rate of land subsidence was about 1–10 cm per year [7].
As well as the flooding issue, the problem of rising sea levels has become a major concern in Jakarta Bay. During the 20th century, the mass loss of glaciers and ice caps contributed to sea level rise [5]. These losses were estimated to be 0.5 ± 0.18 mm in sea level equivalent (SLE) per year between 1961 and 2003. Global warming of ocean waters produces water molecule expansions that are responsible for sea level rise. The average contribution of the thermal expansion to sea level rise is 0.42 ± 0.12 mm.
To overcome the flooding and sea level rise, a Giant Seawall (GSW) at Jakarta Bay has been proposed to protect the city from flood events increasing due to subsidence, exceptional high tides, and sea level rise [8]. The GSW project will include sea wall construction, land reclamation, toll roads, and a port extension in Jakarta Bay. The GSW will offer a long-term protection and flooding solution, and at the same time facilitate social-economic development. The GSW project may also have large impacts on tidal level, flow pattern, current and flooding area in Jakarta Bay. There have been many studies around Jakarta Bay, but relatively few focused on river discharge and subsequent sea level rise effect. Most of the applied models of Jakarta Bay have taken into account only tides and winds as the predominant forces to study circulation and hydrodynamics.
Ningsih’s model for Java Sea showed that monsoon wind plays important roles in the general circulation of this area [9]. The flow pattern in Jakarta Bay is mainly driven by monsoon winds with current moving easterly during northwest monsoons (NWM), and reversed during southeast monsoons (SEM) [10,11,12]. In general, the southeast monsoons (SEM) are stronger than northwest monsoons (NWM) [13]. During flood conditions, the westward current induces a clockwise circulation through Jakarta Bay, and an eastward counter-clockwise circulation at ebb conditions [1,14].
Land subsidence in Jakarta is the predominant driver exacerbating coastal floods, followed by the influence of sea level rise [4]. The potential flood area in the 2025–2050 period is estimated to be 3.4 times greater than during the 2000–2025 period [15]. The sea level rise effects on tidal hydrodynamics along the northern Gulf of Mexico have been observed and modelled [16]. Tidal amplitudes within the bays increased by as much as 67% (10 cm) in some areas. Most of the bays would experience faster tidal propagation due to changes in harmonic constituent phases in future scenarios. The tidal inundation increases along the NGOM study area, especially in low-lying marsh areas and barrier islands with low dune elevations.
In recent years, estuaries and coastal system have been modelled successfully using the finite-volume coastal ocean model (FVCOM). Fukuoka Bay has been modelled using the FVCOM and Princeton Ocean Model (POM) [17]. A comparison of these two models showed that FVCOM provides a better result because FVCOM can describe the coastline geometry better. Benoa Bay, which has shallow water depth, has also been modelled with FVCOM [18]. FVCOM can successfully produce the residual current and vertical salinity profile, which is significantly affected by fresh water discharge. In Saemangeum in Korea, FVCOM has been used to successfully explain the mechanism of decreasing tidal current and tidal amplitude after the construction of a sea dike [19]. Thus, FVCOM is a powerful tool for modelling the hydrodynamics in Jakarta Bay. The unstructured grid of FVCOM would be suitable for the irregular coastline and bathymetry of Jakarta Bay.
In this paper, an FVCOM model for Jakarta Bay was used to construct tidal dynamics and the flooding occurrence in Jakarta city. The impacts of the river discharges and sea level rise on tidal dynamics and flooding areas were numerically examined, and the effects of the GSW on tides and flooding were investigated.
2. Materials and Methods
The influence of river discharge and sea level rise on the hydrodynamics of the bay was investigated through numerical modelling. The hydrodynamic model (Figure 1) in this paper was based on the model previously established by Rusdiansyah et al. [1], with the model domain being expanded to cover the entire area as described in the Master Plan National Capital Integrated Coastal Development [8]. The impacts of river discharges and sea level rises were analysed using numerical experiments in this study.
2.1. Hydrodynamics of Jakarta Bay
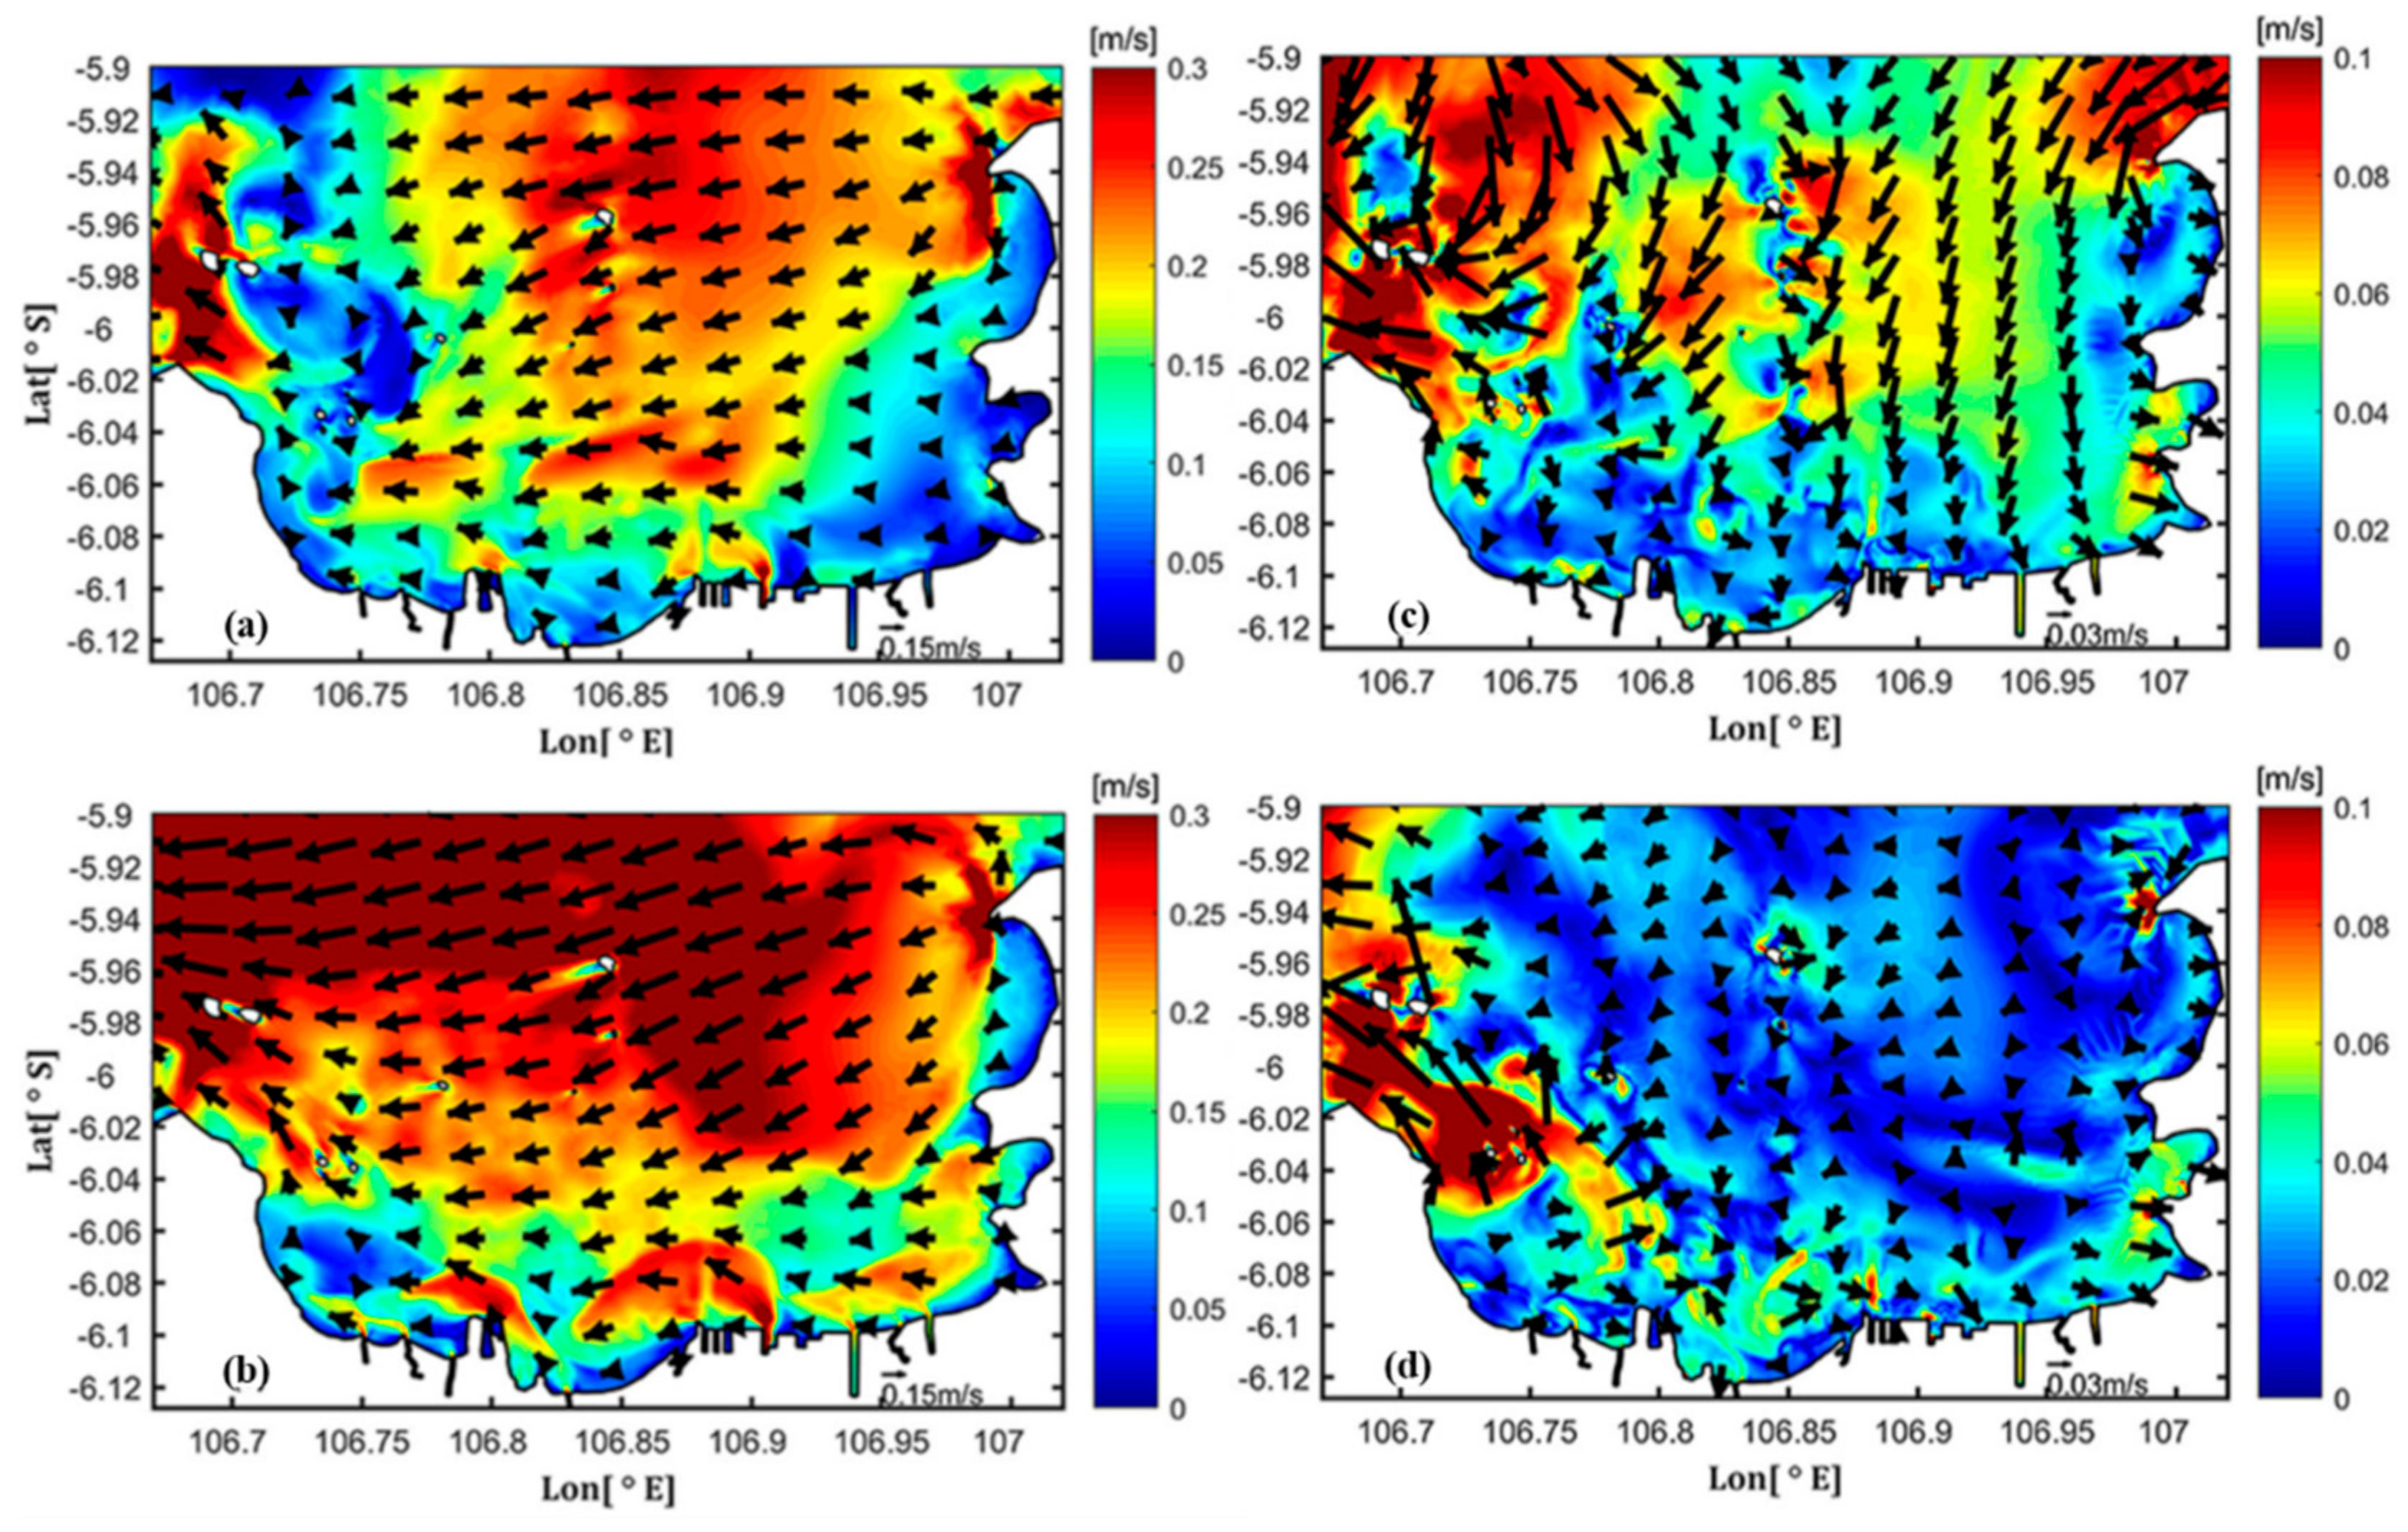
Jakarta Bay is an open type bay (Figure 1) with a water depth less than 60 m. Surface currents in Jakarta Bay are mainly in an east to west direction during spring tides, with peak current speed occurring at the bay mouth and near the river mouths (Figure 2a,b) [1]. Inside the bay, the current speed is mainly below 0.2 m/s. The ebbing currents are slightly larger than the flood currents due to the river discharge. The current speeds near the bottom level reach 0.1 m/s in Jakarta Bay during spring flood tides (Figure 2c,d). During spring ebbing tides, the bottom currents are small (within 0.07 m/s) in almost the entire bay.
To overcome the flooding issues in Jakarta, Indonesia’s government proposed the Giant Seawall (GSW) construction through the Master plan National Capital Integrated Coastal Development [8]. The GSW construction is considered through three phases: phase A, B, and C. In phase A the existing sea wall and river embankments are strengthened (the solid blue line in Figure 1), including land reclamation (the light grey color along the coast in Figure 1). In phase B, the outer sea wall is constructed and land is reclaimed (the dark grey color in Figure 1). This phase B is mainly determined by the required storage capacity of giant water reservoir between the coastline and seawall. There are two reservoirs in the GSW to adjust the water discharges from rivers. Phase C covers the long-term development in the east of Jakarta Bay (the dashed lines).
2.2. Tides in Jakarta Bay
The tidal level can be decomposed into different tidal components using harmonic analysis with the least squares method in MATLAB [20]. There are eight astronomical tidal components, named M2, S2, N2, K2, K1, O1, P1, and Q1 tides. When tides propagate into shallow water areas, the shallow water components are generated. For example, the MF, MM, M4, MS4, MN4 tides are all shallow water tides.
The Global Sea Level Observing System (GLOSS) by the Intergovernmental Oceanographic Commission (IOC) provides the sea surface level data for Kolinamil Station, Jakarta. The measurements at Kolinamil Station are from 2 June to 30 June 2015. The maximum tidal range at Kolinamil Station is 0.87 m. The maximum tidal range at Jakarta Bay is about 1 m with the highest level at around 0.6 m and the lowest level at around −0.4 m during spring tides relative to the mean sea level.
Defant (1961) [21] classified tidal type based on the amplitudes of tidal harmonic components called Formzahl number. The Formzahl number (F) is obtained from:
where AmpK1, AmpO1, AmpM2 and AmpS2 indicate the amplitude of the corresponding tidal component. The classification of the Formzahl number is as follow: F < 0.25 is semidiurnal type, 0.25 < F < 3 is mixed type, and F > 3 is diurnal type.
According to the Formzahl number (F) by Defant (1961) [21], the tidal pattern in Jakarta bay is diurnal indicated by the Formzahl number of 3.95 observed at Kolinamil Station. Hence, the tides in Jakarta Bay are diurnal.
2.3. Description of the Flow Model
The finite-volume coastal ocean model (FVCOM) was used to simulate the hydrodynamics of Jakarta Bay. The finite volume approach and unstructured meshes with 3-D primitive equations make FVCOM ideally suited for coastal areas [22]. The unstructured grid of FVCOM provides topography flexibility that is adequate for the irregular morphology of Jakarta Bay. A -coordinate transformation system in a vertical direction is used to get a clear representation of the irregular bottom topography. The -coordinate transformation is defined as:
where total water column depth is , while is bottom depth (relative to ) and is the height of the free surface (relative to ).
Under the -coordinate system, the continuity and momentum equations can be written as Equations (2)–(5), and salinity, temperature, and density as Equations (6)–(8):
where x, y, and are the respective east, north, and vertical axes in the -coordinate; u, v, and are velocity components; S and T are salinity and temperature; is total density; is the reference density of ; f is the Coriolis parameter; g is gravitational acceleration; is thermal vertical eddy viscosity and is thermal vertical eddy diffusion; are horizontal momentum, salt diffusion, and thermal terms.
2.4. Flow Model Setup
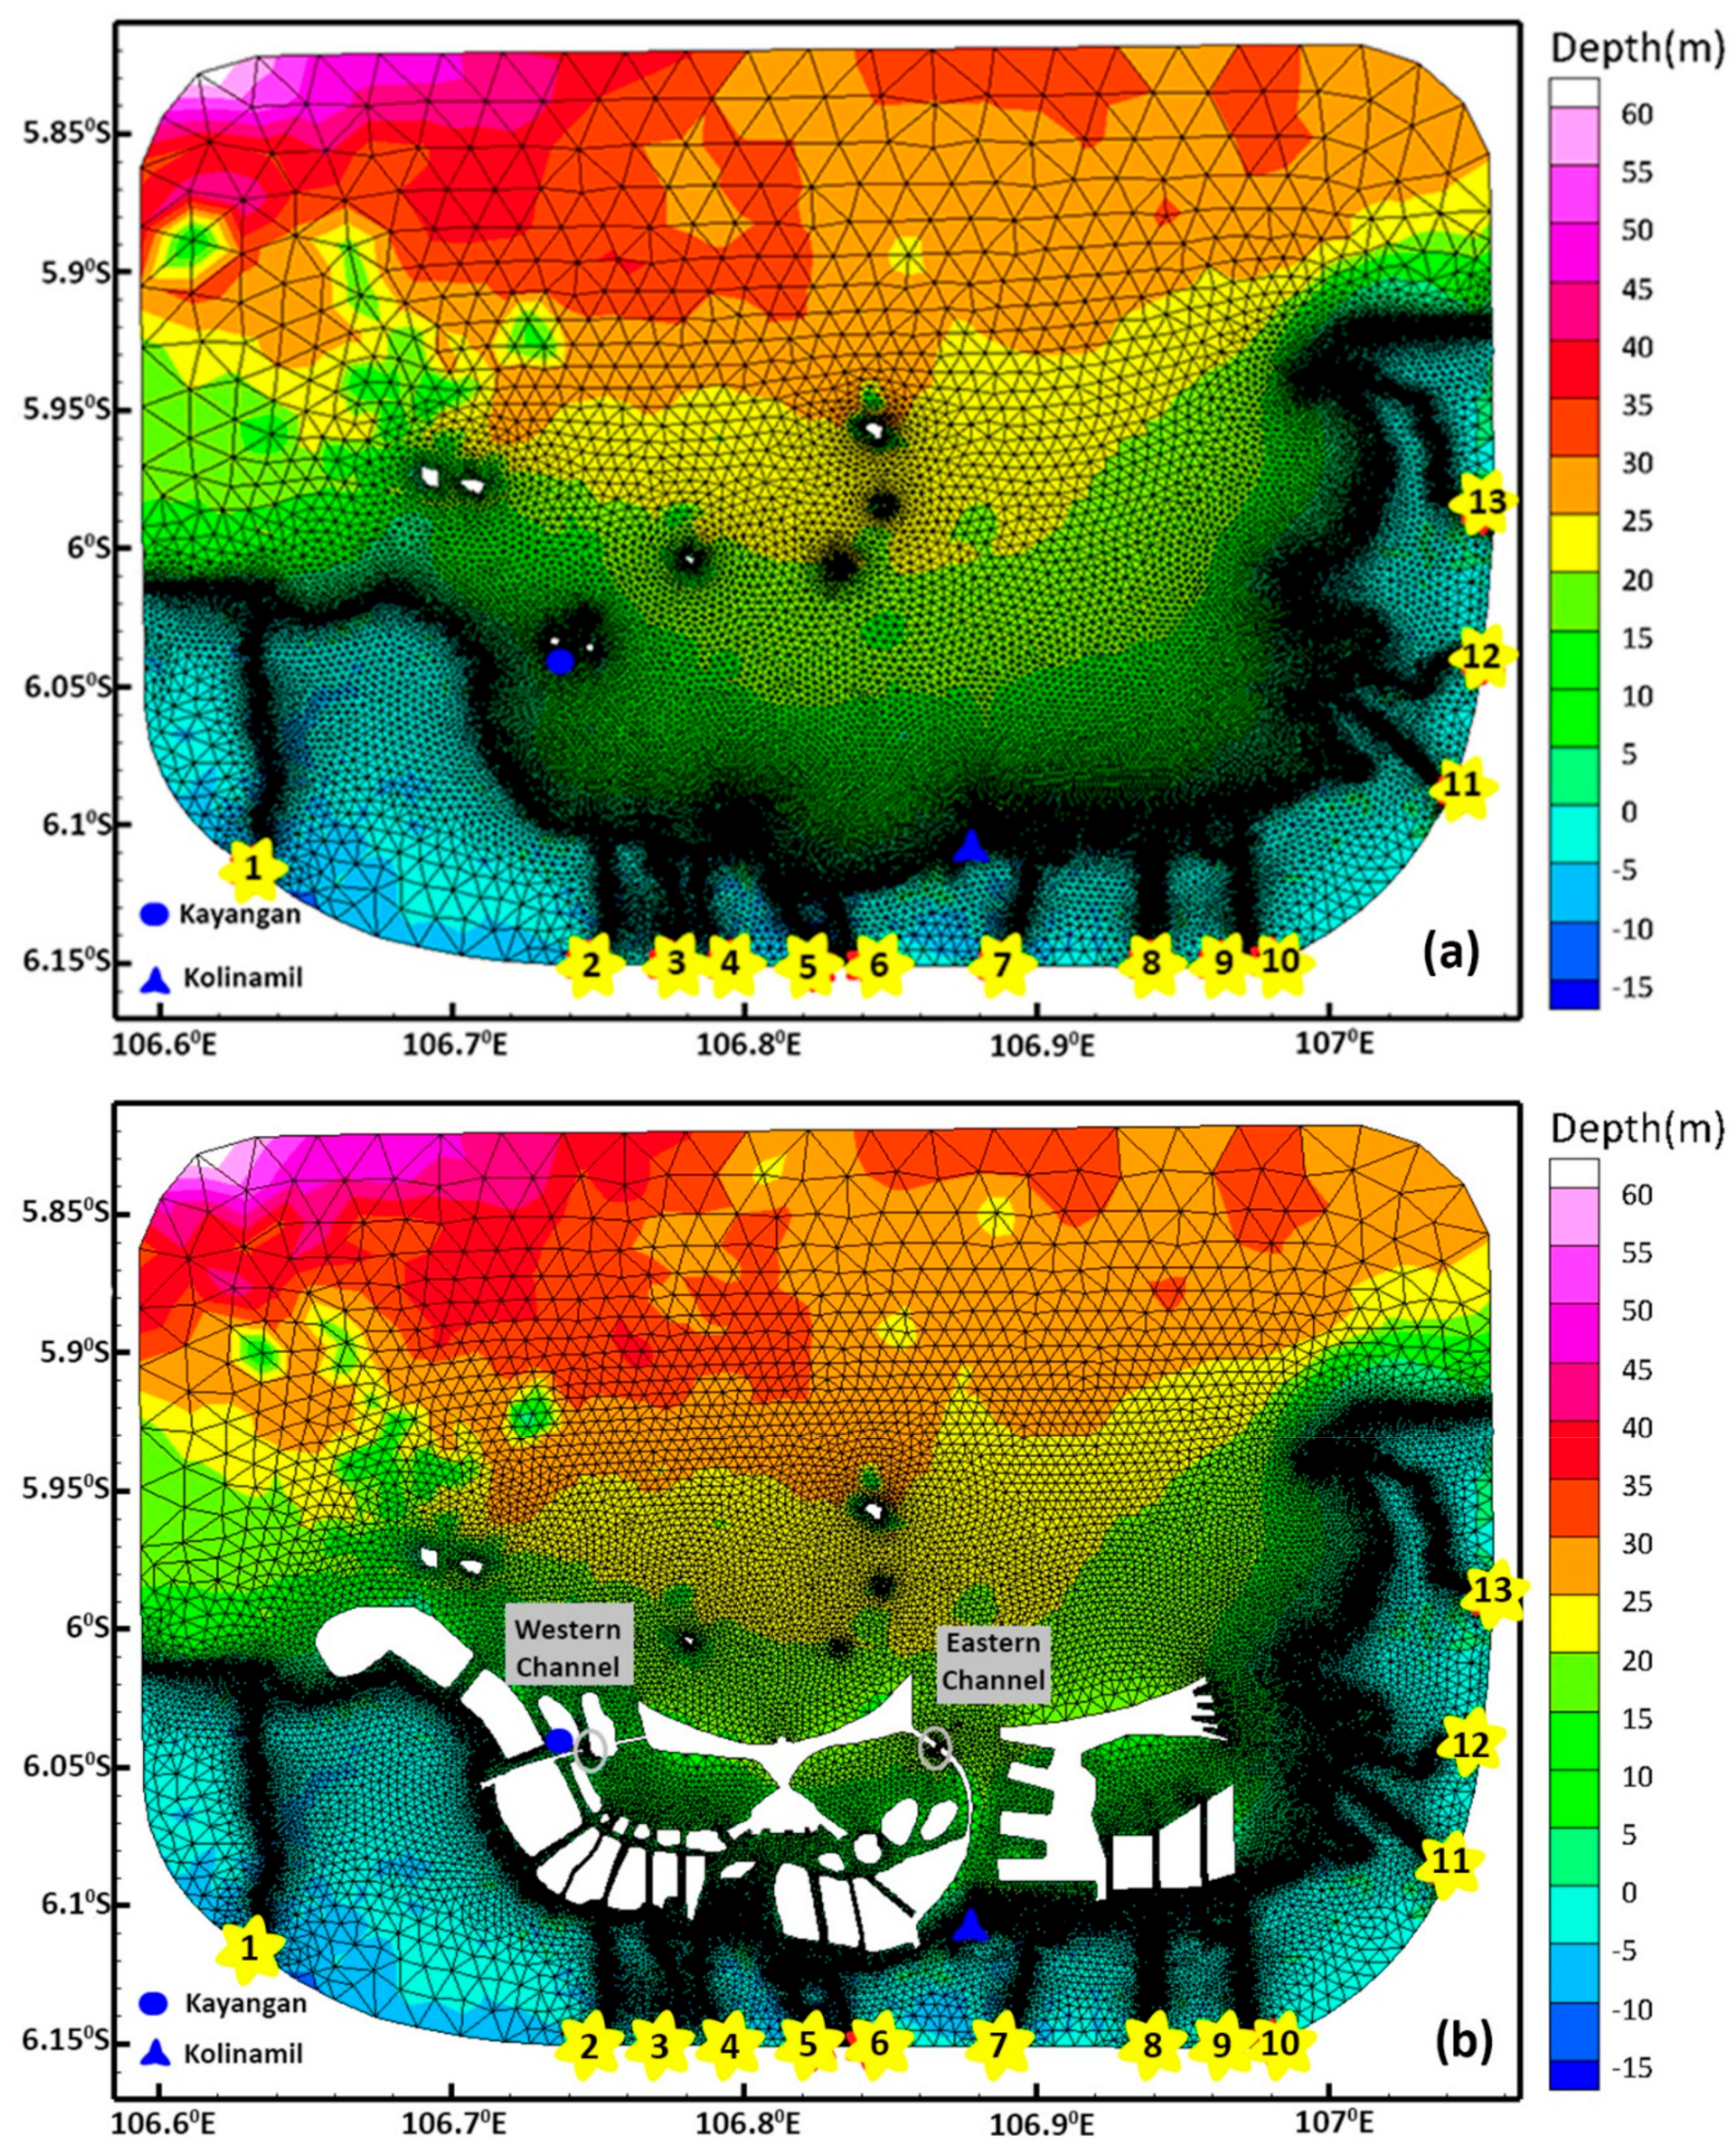
The computational domain covers Jakarta Bay, extending from 5.8° S to 6.15° S and 106.6° E to 107.1° E (Figure 3). This domain is covered by two grids, one with no GSW (Figure 3a) and one with GSW (Figure 3b). The model grid for Jakarta Bay with no GSW (Figure 3a) consists of 63,932 nodes and 127,273 elements, while the grid for Jakarta Bay with a GSW (Figure 3b) consists of 62,880 nodes and 122,986 elements. The computational grid has a high resolution varying from ~2.3 km at the open ocean boundary to ~25 m near the coastlines. Land areas of ~4.5 km from the nearest coastline have resolutions varying from ~25 m to ~300 m. Ten uniform vertical layers in a sigma coordinate system are set in the model according to sensitivity analysis.
Coastline data were extracted from the Navy Chart Indonesia and Google Earth (2014). Bathymetrical data were obtained from survey data provided by the Ministry of Public Works and combined with nautical charts of Jakarta Bay. Jakarta Bay is a shallow water bay with maximum depth around 60 m. Land topography was obtained from the Consortium for Spatial Information (CGIAR-CSI) (http://srtm.csi.cgiar.org). The SRTM (Shuttle Radar Topographic Mission) digital elevation data were used for this land topography with a high spatial resolution of 90 m. The CGIAR-CSI SRTM data product applied a hole-filling algorithm to provide continuous elevation values [25].
The observation data of tidal elevation and currents from two field stations (Figure 3) were used to validate the numerical model. The blue dot represents Kayangan Station, which provided tidal elevation and current data, while the blue triangle represents Kolinamil Station, which provided tidal elevation data.
The numerical simulation is driven by ocean tides, winds, and river discharges. The open boundary condition is used for ocean tides as the main forcing, while the closed boundary condition is used for river discharges as the main forcing. The wind data were used as the atmospheric forcing at this research. Other types of external forcing such as precipitation, evaporation, heat flux, and groundwater input were not included in the simulation. Initial conditions for tidal levels and currents were set to zero.
Oceanic tides play an important role when considering the flooding effect. The tide in the Java Sea is a diurnal type with maximum tidal range around 1 m during spring tides. Tidal forcing data were obtained from the TPXO (http://volkov.oce.orst.edu/tides/tpxo8_atlas.html) [26]. Thirteen tidal constituents included eight basic components (M2, S2, N2, K2, K1, O1, P1, and Q1) and five shallow water components (MF, MM, M4, MS4, MN4).
Jakarta Bay itself is sheltered by many islands and so wind plays a very limited role [27]. However, a monsoon wind still impacts the dynamic circulation in Jakarta Bay. Wind data were derived from the European Center for Medium-Range Weather Forecast (ECMWF). ECMWF can be accessed at ERA-Interim reanalysis (http://apps.ecmwf.int). The spatial and temporal resolutions of the wind data were 0.125° × 0.125° and 6 h, respectively.
Thirteen rivers discharge into Jakarta Bay. The total mean river discharge from these 13 rivers was around 205 m3/s throughout the year 2012 [28]. Detailed information of the annual distribution of river discharge can be seen in Table 1.
Sea surface salinity in the western Java Sea varied from 30.6–32.6 PSU [29], while sea surface temperatures in northern Java ranged from 29–31 °C [30]. In this state, the initial salinity and temperature were set as constant values of 31.5 PSU and 31 °C, respectively. In this paper, water density was assumed to be homogeneous. The authors assumed that the Manning coefficient for bottom roughness varied from 0.004 at the open ocean to 0.008 near the islands and coastal region. The model ran for 17 days starting from 3 to 19 June 2015. Courant Friedrich Levy (CFL) was used as the numerical stability condition to calculate the external and internal step. The external time step numerical stability is defined as:
where is the time step of the external model and (computational length scale) is the shortest edge from individual triangular grid element, and D is the local depth. The internal step is defined as:
where is the time step of the internal model, and is the maximum phase speed of the internal gravity waves. Since is usually smaller than , could be larger than . The external time step was 0.15 s and the internal time step was 5 s based on the numerical stability condition.
2.5. Scenarios
The prevention of future coastal flooding in Jakarta is vital because of the phenomenon of future sea level rises and the frequent occurrence of high river discharge conditions. The Intergovernmental Panel on Climate Change (IPCC) reported that the temperature in Indonesia will increase from 1.3 °C to 4.6 °C. As the temperature increases, sea surface levels will also increase. The rate of sea level rise accelerated between the mid-19th and the mid-20th centuries based on tidal gauge and geological data [5]. The TOPEX/POSEIDON satellite is joint venture between NASA (National Aeronautics and Space Administration) and CNES (National Centre for Space Studies). The satellite observed that the rate of sea level rises along the coast of Indonesia was approximately 7 mm/year between 1992 and 2015 and that value was used in this paper. There are three scenarios for the sea level; the first is the scenario 1 (reference model), the second is with a sea level increase of 25 cm (scenario 2a), and the third is with a sea level increase of 60 cm (scenario 2b).
On the other hand, high river discharge occurs due to high precipitation and intraseasonal effects such as La Niña. High precipitation usually occurs under the northwest monsoon (NWM) conditions from December to February [13]. There are two high river discharge scenarios, 1.5 times the average discharge (scenario 1a) and 10 times the average discharge (scenario 1b). Scenario 1a is linked to the northwest monsoon (NWM) conditions, while scenario 1b is assumed for extreme river discharge. These scenarios for river discharge are combined with the scenarios for sea level rise to give a view of the areas affected by coastal flooding.
The impact of the GSW on coastal flooding was also included in this model. The effectiveness of the GSW in preventing the city from coastal flooding was examined using river discharges (scenarios 3a and 3b) and the sea level rises (scenarios 4a and 4b), presented in Table 2.
The numerical scenarios are listed in Table 2, showing Jakarta Bay (scenario 1) as the reference scenario before the construction of the GSW. This scenario covers a period from 3 to 19 June 2015.
3. Model Validation
The reference model was validated by comparing with the observation data. Data from two field stations, Kayangan Station (tidal and current) and Kolinamil Station (tidal), were used to validate the model. Data from the Kolinamil Station were obtained from http://www.ioc-sealevelmonitoring.org. Tidal and current data at Kayangan Station were collected by the Ministry of Public Works. Tidal data from the Kayangan Station were collected from 2 to 15 June 2015 and current data from 12 to 14 June 2015. During the June period, Jakarta experienced a dry season because of the southeast monsoons (SEM) conditions. Wind direction moved westward with maximum wind speeds at the simulation period around 4 m/s.
Ma et al. (2011) [31] suggested a statistical method to assess model skill for verification. This skill indicates the corresponding degree of deviation from prediction and observation data. A skill value of 1 means perfect agreement between model and observation.
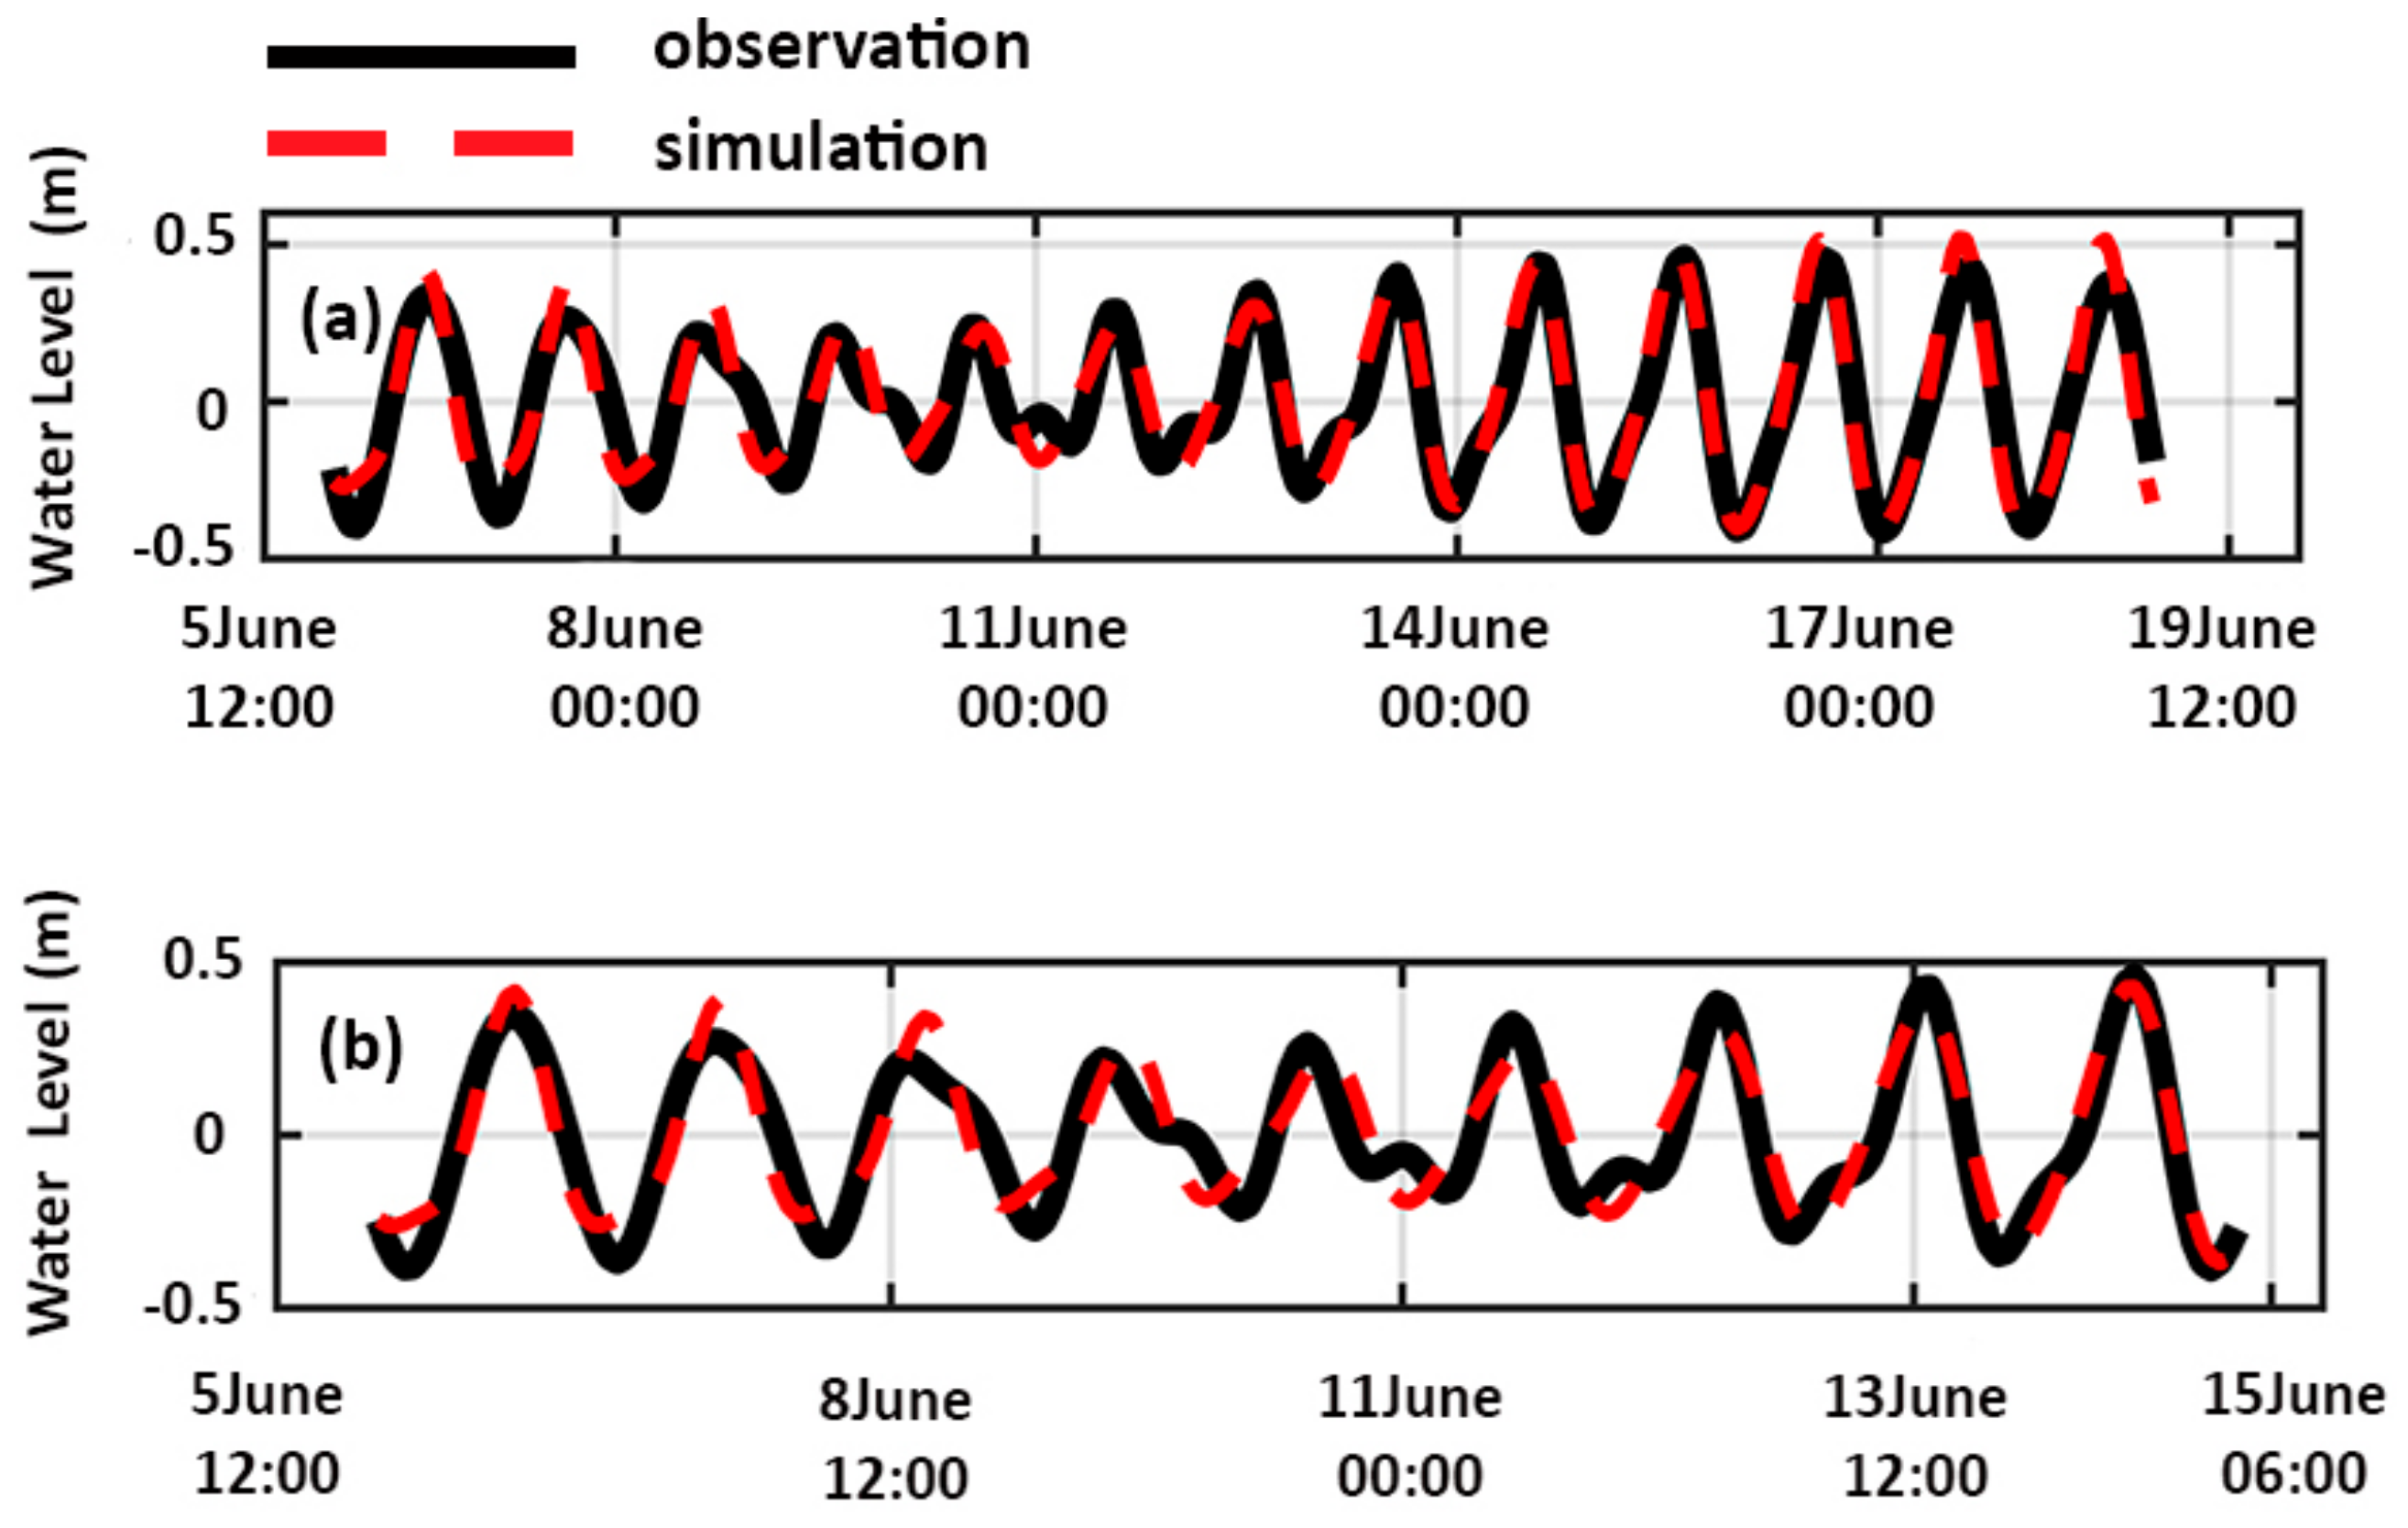
Tidal verification data at Kolinamil Station started from 6 June 2015 to 19 June 2015 (Figure 4a), while the data at Kayangan Station were from 6 to 15 June 2015 (Figure 4b). The skill parameters for the tidal level calibration at Kolinamil Station and Kayangan Station were 0.97 and 0.96, respectively. The tidal data at Kolinamil Station and Kayangan Station were reproduced by the model with root mean square error (RMSE) of 0.08 m and 0.09 m, respectively. These two tidal verifications show good agreement between the model and observation data.
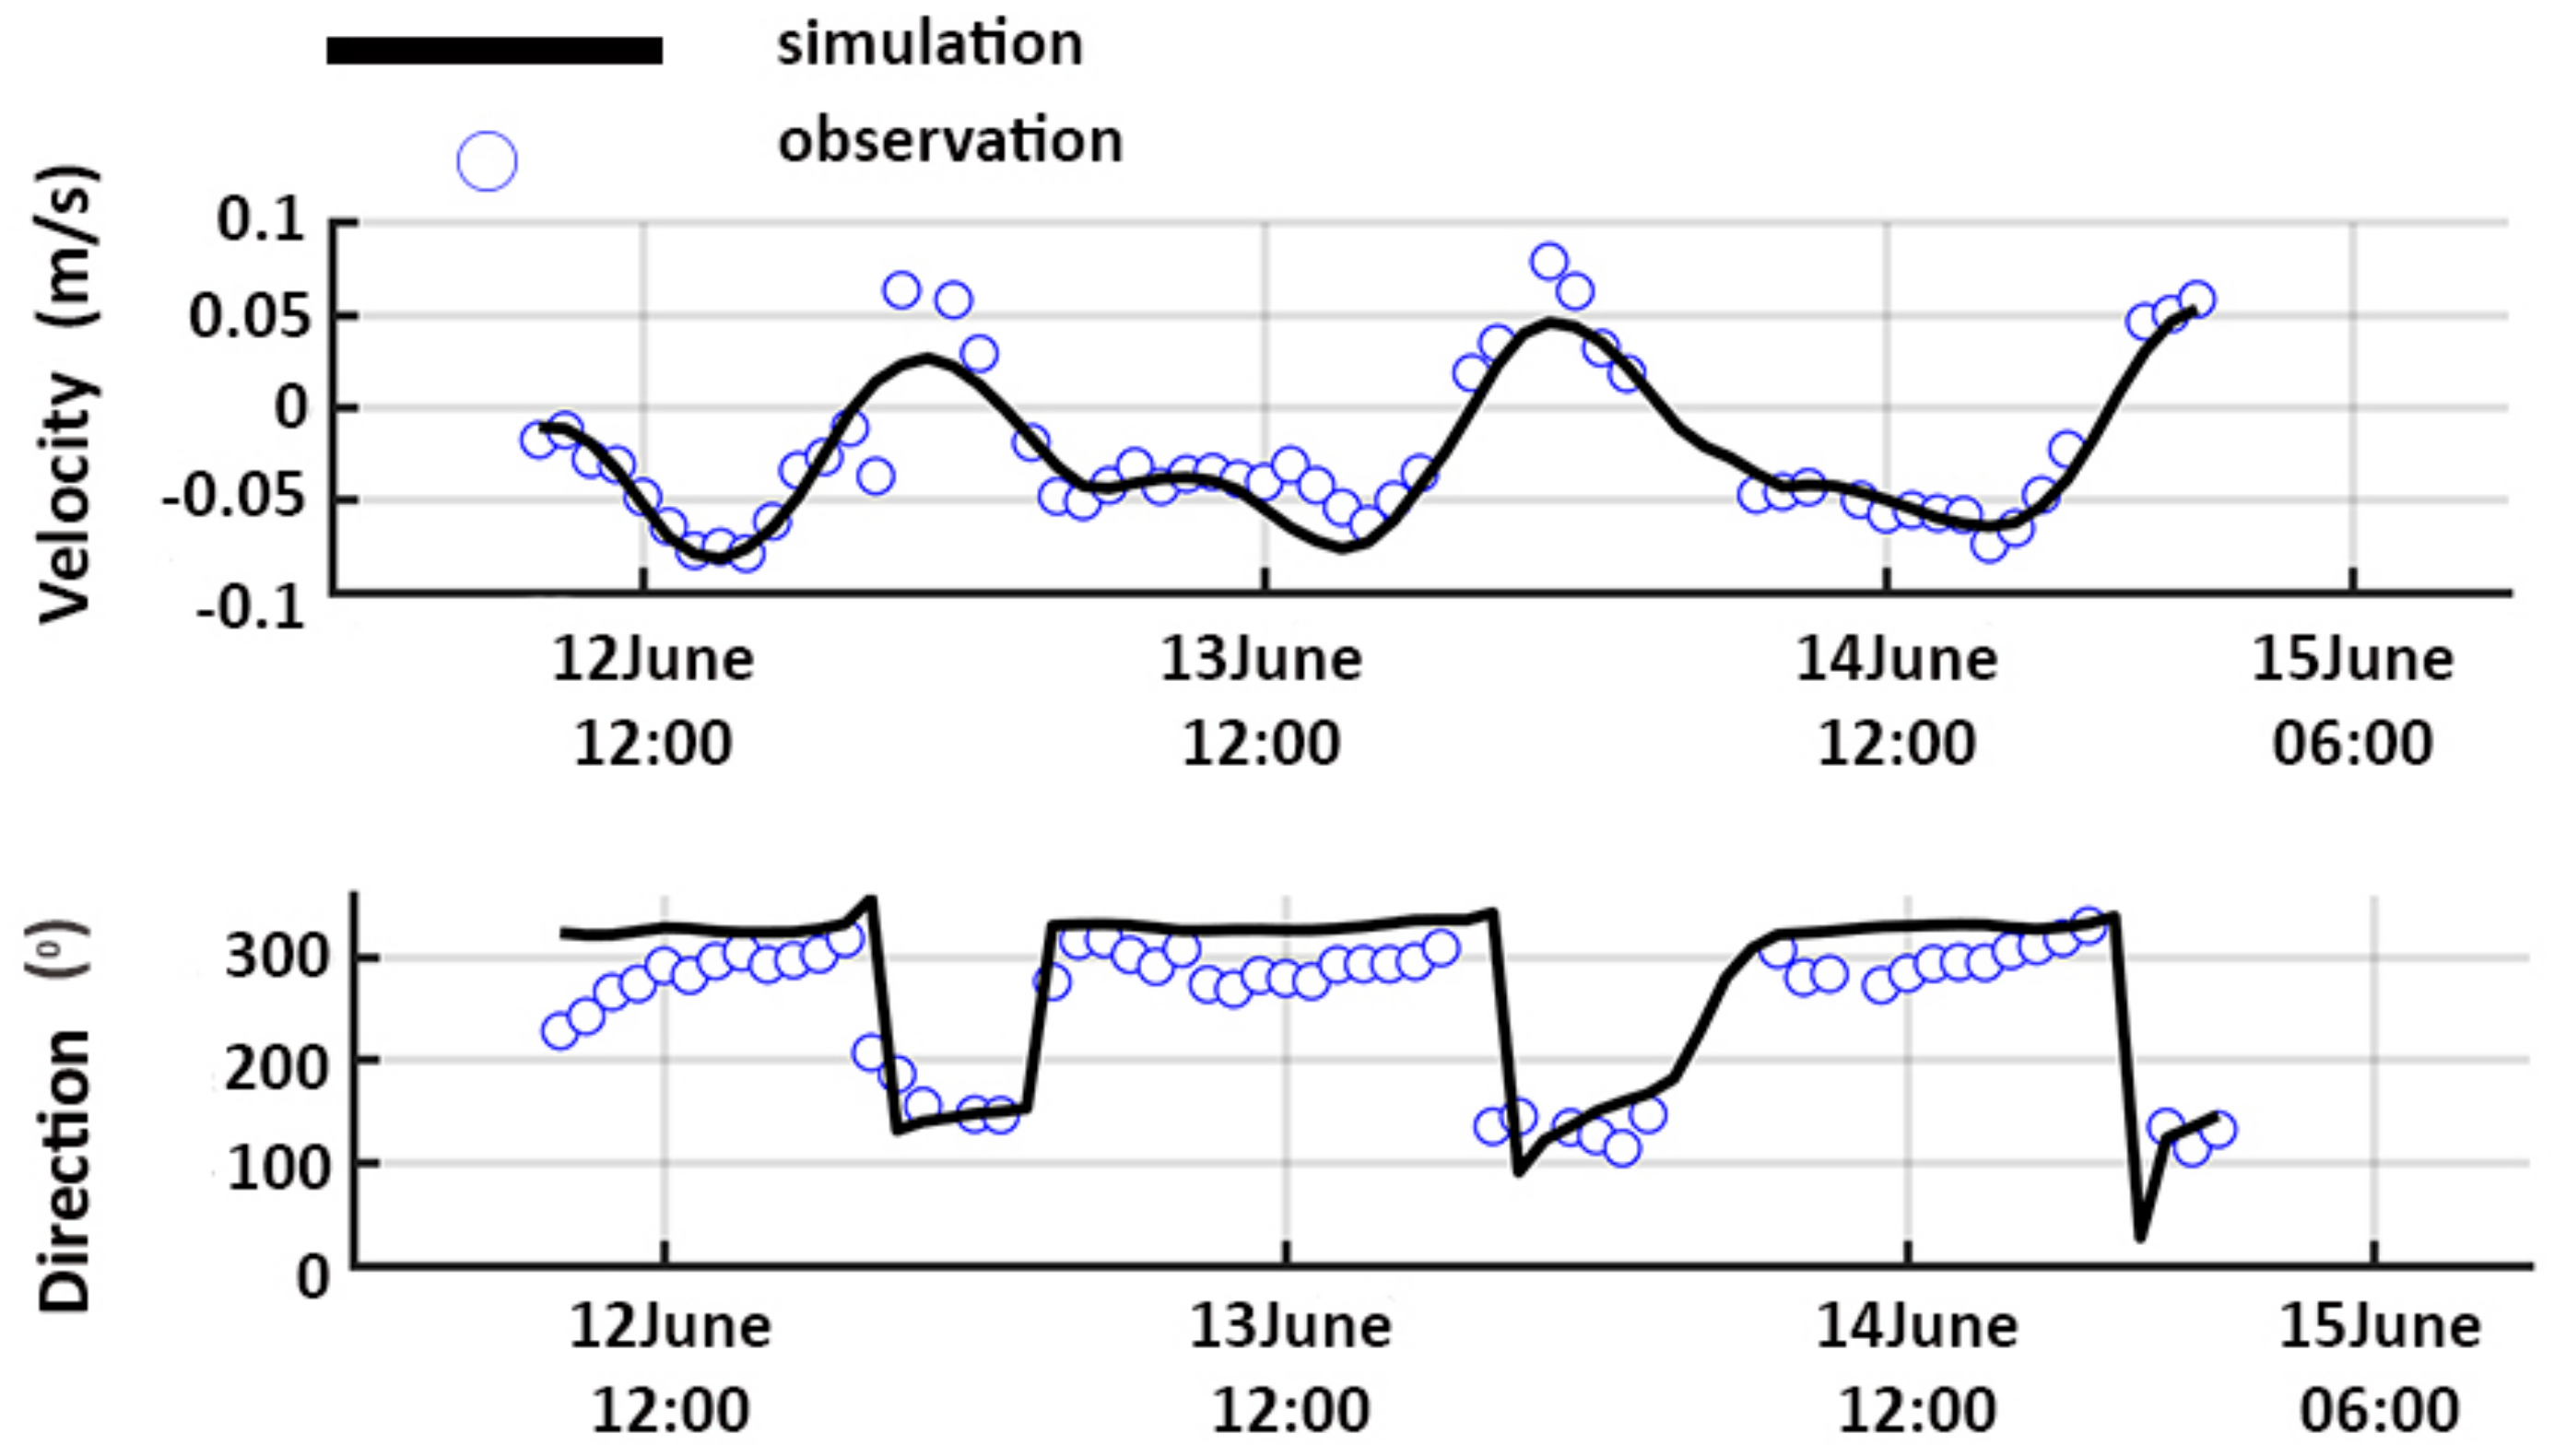
Current verification was conducted at Kayangan Station, where the data were collected from 12 to 14 June 2015 (Figure 5). The skill scores between the modelled and the observed current velocity and direction were 0.96 and 0.88, respectively. The velocity and direction at Kayangan Station had RMSE of 0.015 m/s and 50°, respectively. These skill values indicate that the model has good agreement with the observation data.
4. Results
4.1. Tidal Dynamics in Jakarta Bay
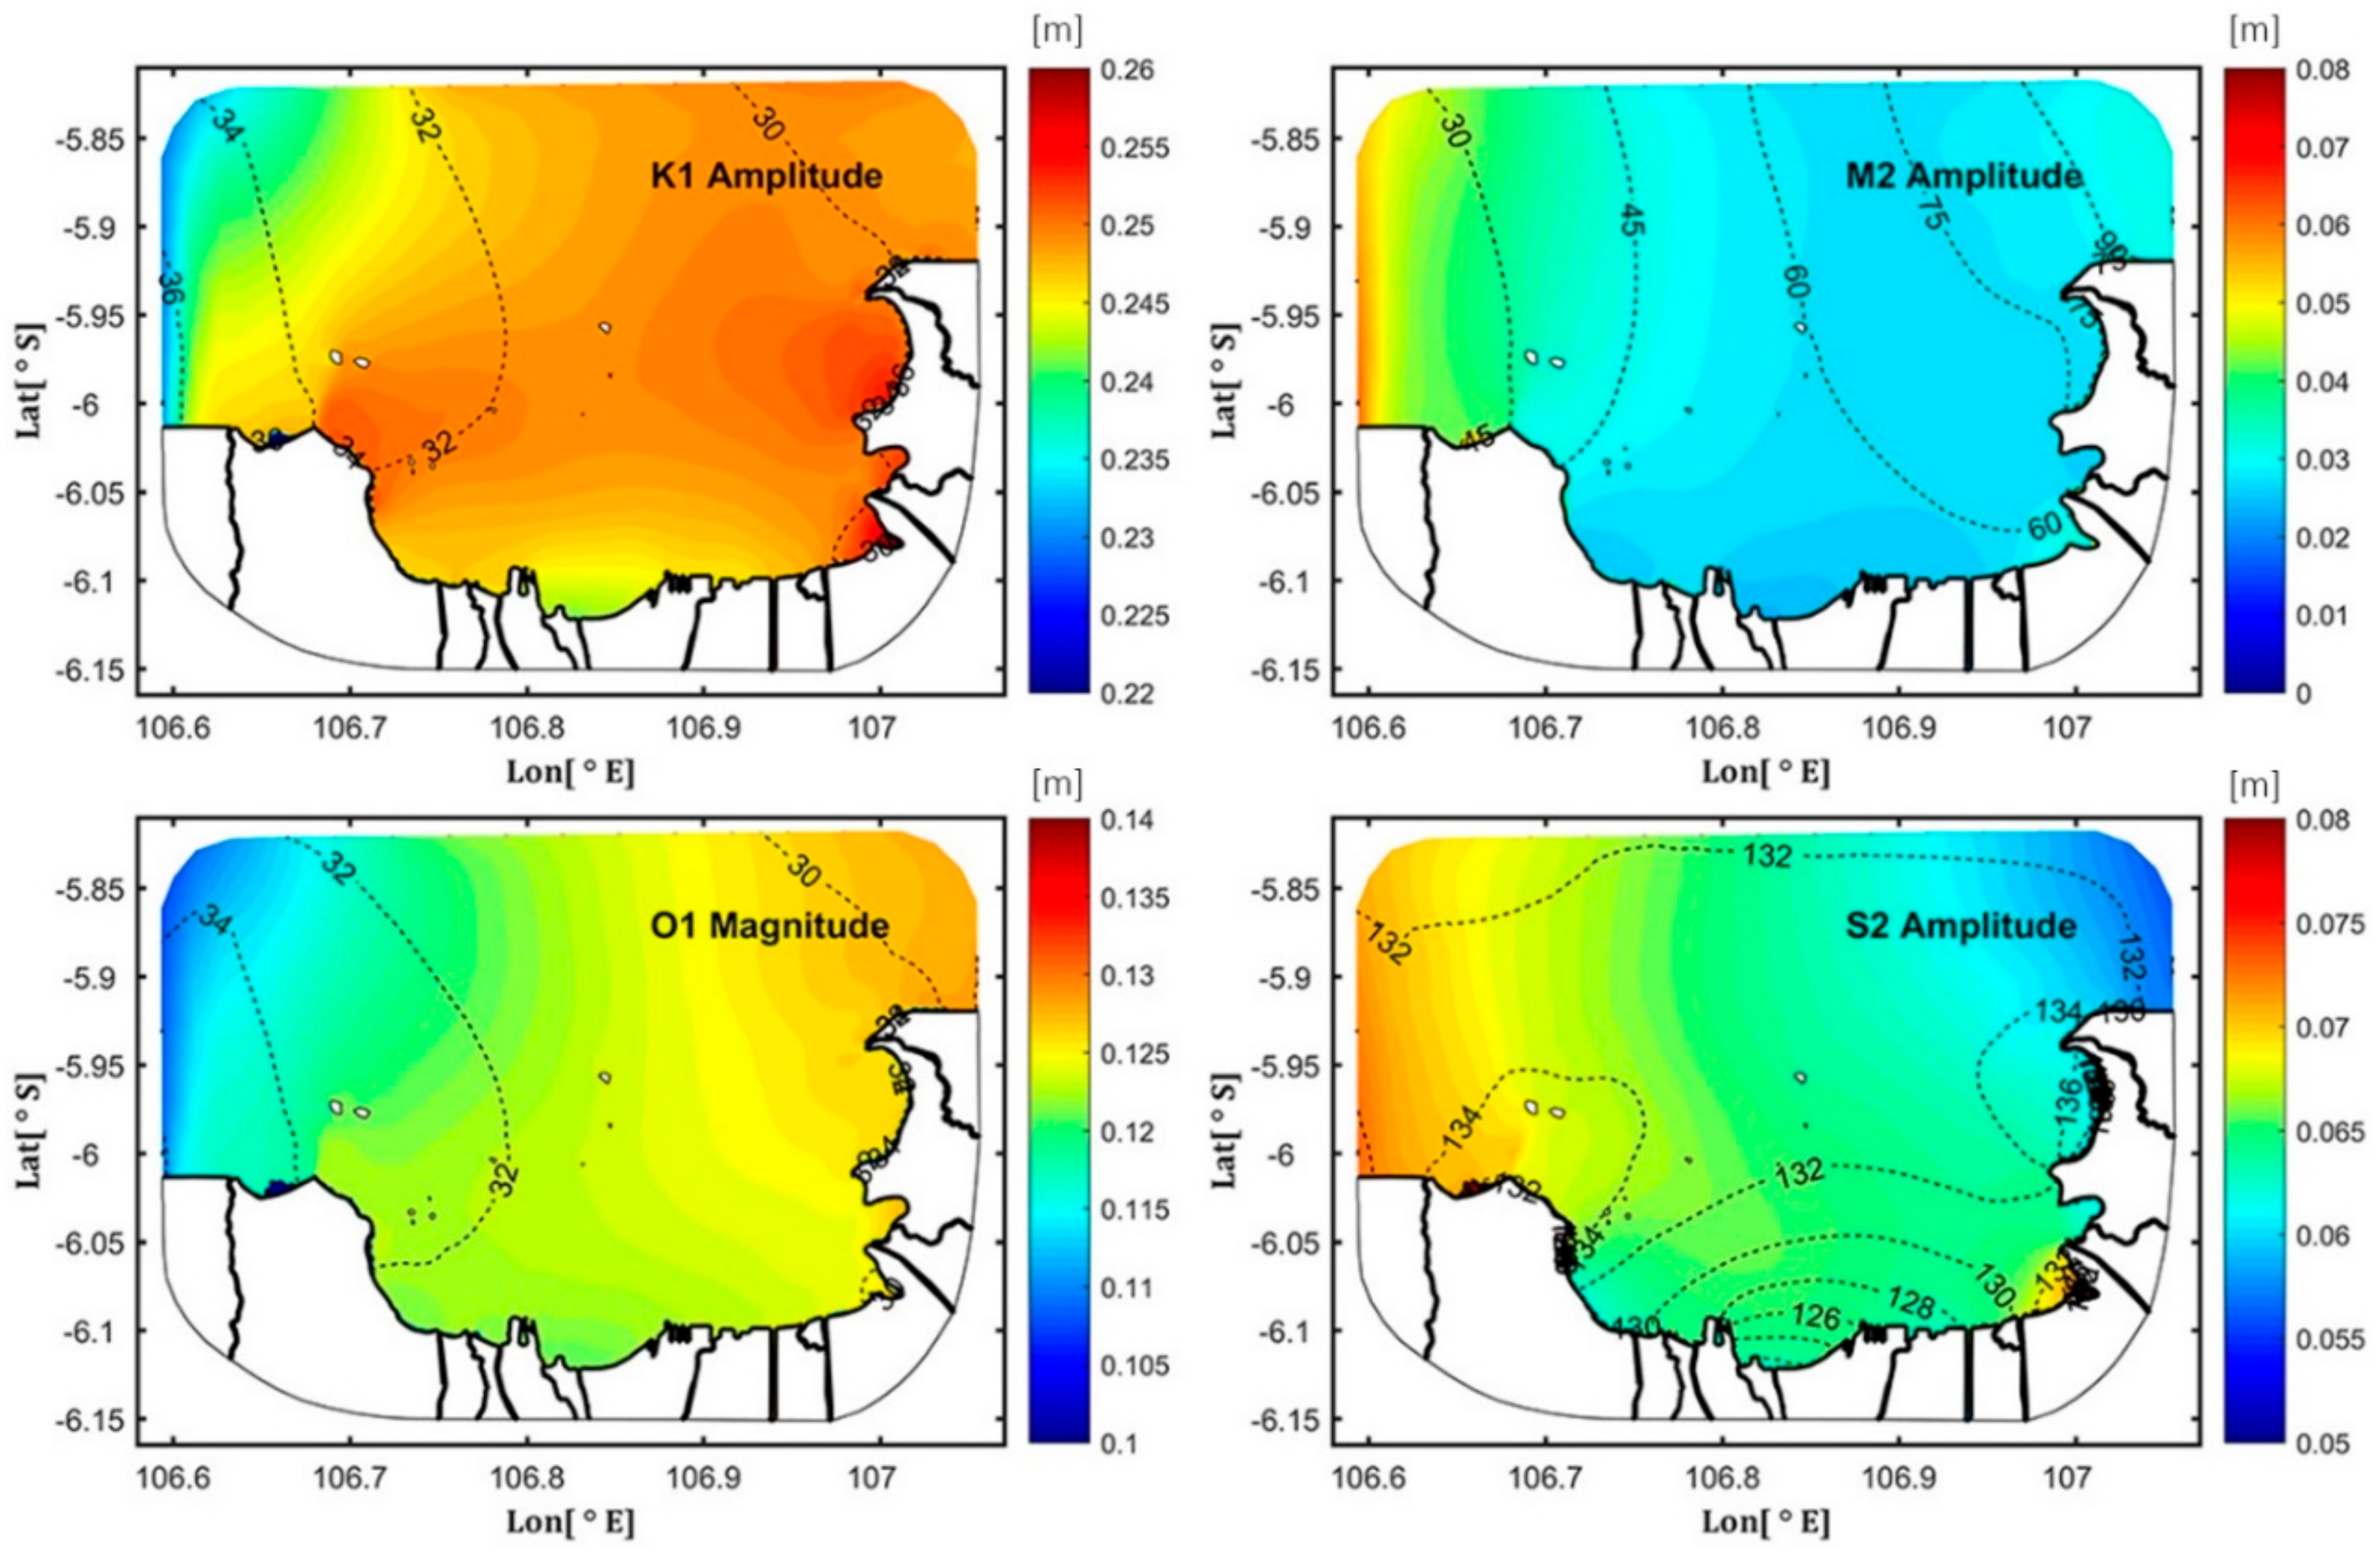
Sea surface level data in the reference model were analyzed using harmonic analysis [20] to examine the main components of tides in Jakarta Bay. The four main astronomical tidal constituents (K1, O1, M2, and S2) explain about 80% of the total variances of water level in the bay. The diurnal components (K1 and O1) account for more than 70% of the tides, with tidal magnitudes of approximately 0.25 m and 0.13 m, respectively. The semidiurnal tides just account for a small part of the tides in the bay, with amplitudes of M2 and S2 tides of ~0.04 m and ~0.07 m, respectively (Figure 6).
Model results showed that diurnal tides and semidiurnal tides propagate differently. Diurnal tides mainly propagate westward, while semidiurnal tides propagate eastward. The different propagation pattern of diurnal and semidiurnal components is caused by the topography of Jakarta Bay, as the bay is located at the Java Sea and near to the Sunda Strait. Ray et al. (2005) [32] reported that the semidiurnal response is clearly dominated by the large tides from the Indian Ocean, while, in contrast, the diurnal tides come from the Pacific Ocean. These diurnal tides propagate westward in the Java Sea. The diurnal tides from the Java Sea propagate westward and meet waves coming from the South China Sea and the Karimata Straits [13,32,33]. The semidiurnal tides penetrate north and merge with the diurnal tides at western Kalimantan. In Jakarta Bay, the diurnal components are mainly driven by tides that come from the Pacific Ocean. The semidiurnal components are driven by tides that come from Indian Ocean. The shallow bathymetry and complicated coastlines generate the distribution pattern of the tides in the bay.
K1 and O1 tides share a similar pattern of propagating westward, from the Pacific Ocean through the Makassar Strait and the Molucca Sea. The semidiurnal components show another behavior. The eastward propagation of an M2 tide comes from the Indian Ocean through the Sunda Strait, while an S2 tide shows a more complicated pattern. An S2 tide comes from the Sunda Strait then propagates northward, and from the Karimata Strait then propagates southward. The complex patterns of tides in the bay are affected by the standing waves which occur in the west part of Java, and the amphidormic point occurring at the Sunda Strait.
In the reference model (scenario 1), the total inundation areas of Jakarta Bay amount to 32.36 km2, which is 7.7% of the total land area in the study domain (420.13 km2). These inundation areas relate to the land topography around the coastlines of the bay. Some parts of the topography are already under mean sea water level. Most of the inundated parts occur at the eastern part (near the river number 13) and central part of Jakarta (between the river number 6 and 7). In the eastern part, the Citarum River (river number 13) has the highest river discharge of all 13 rivers in Jakarta Bay. The topography of eastern Jakarta also has the same elevation as the coastal areas at around 0 m. In the central part of Jakarta Bay, the elevations of most of the inundated areas are below mean sea water level. The inundated areas are caused by sea water overtopping, as the rivers only have small amounts of river discharge.
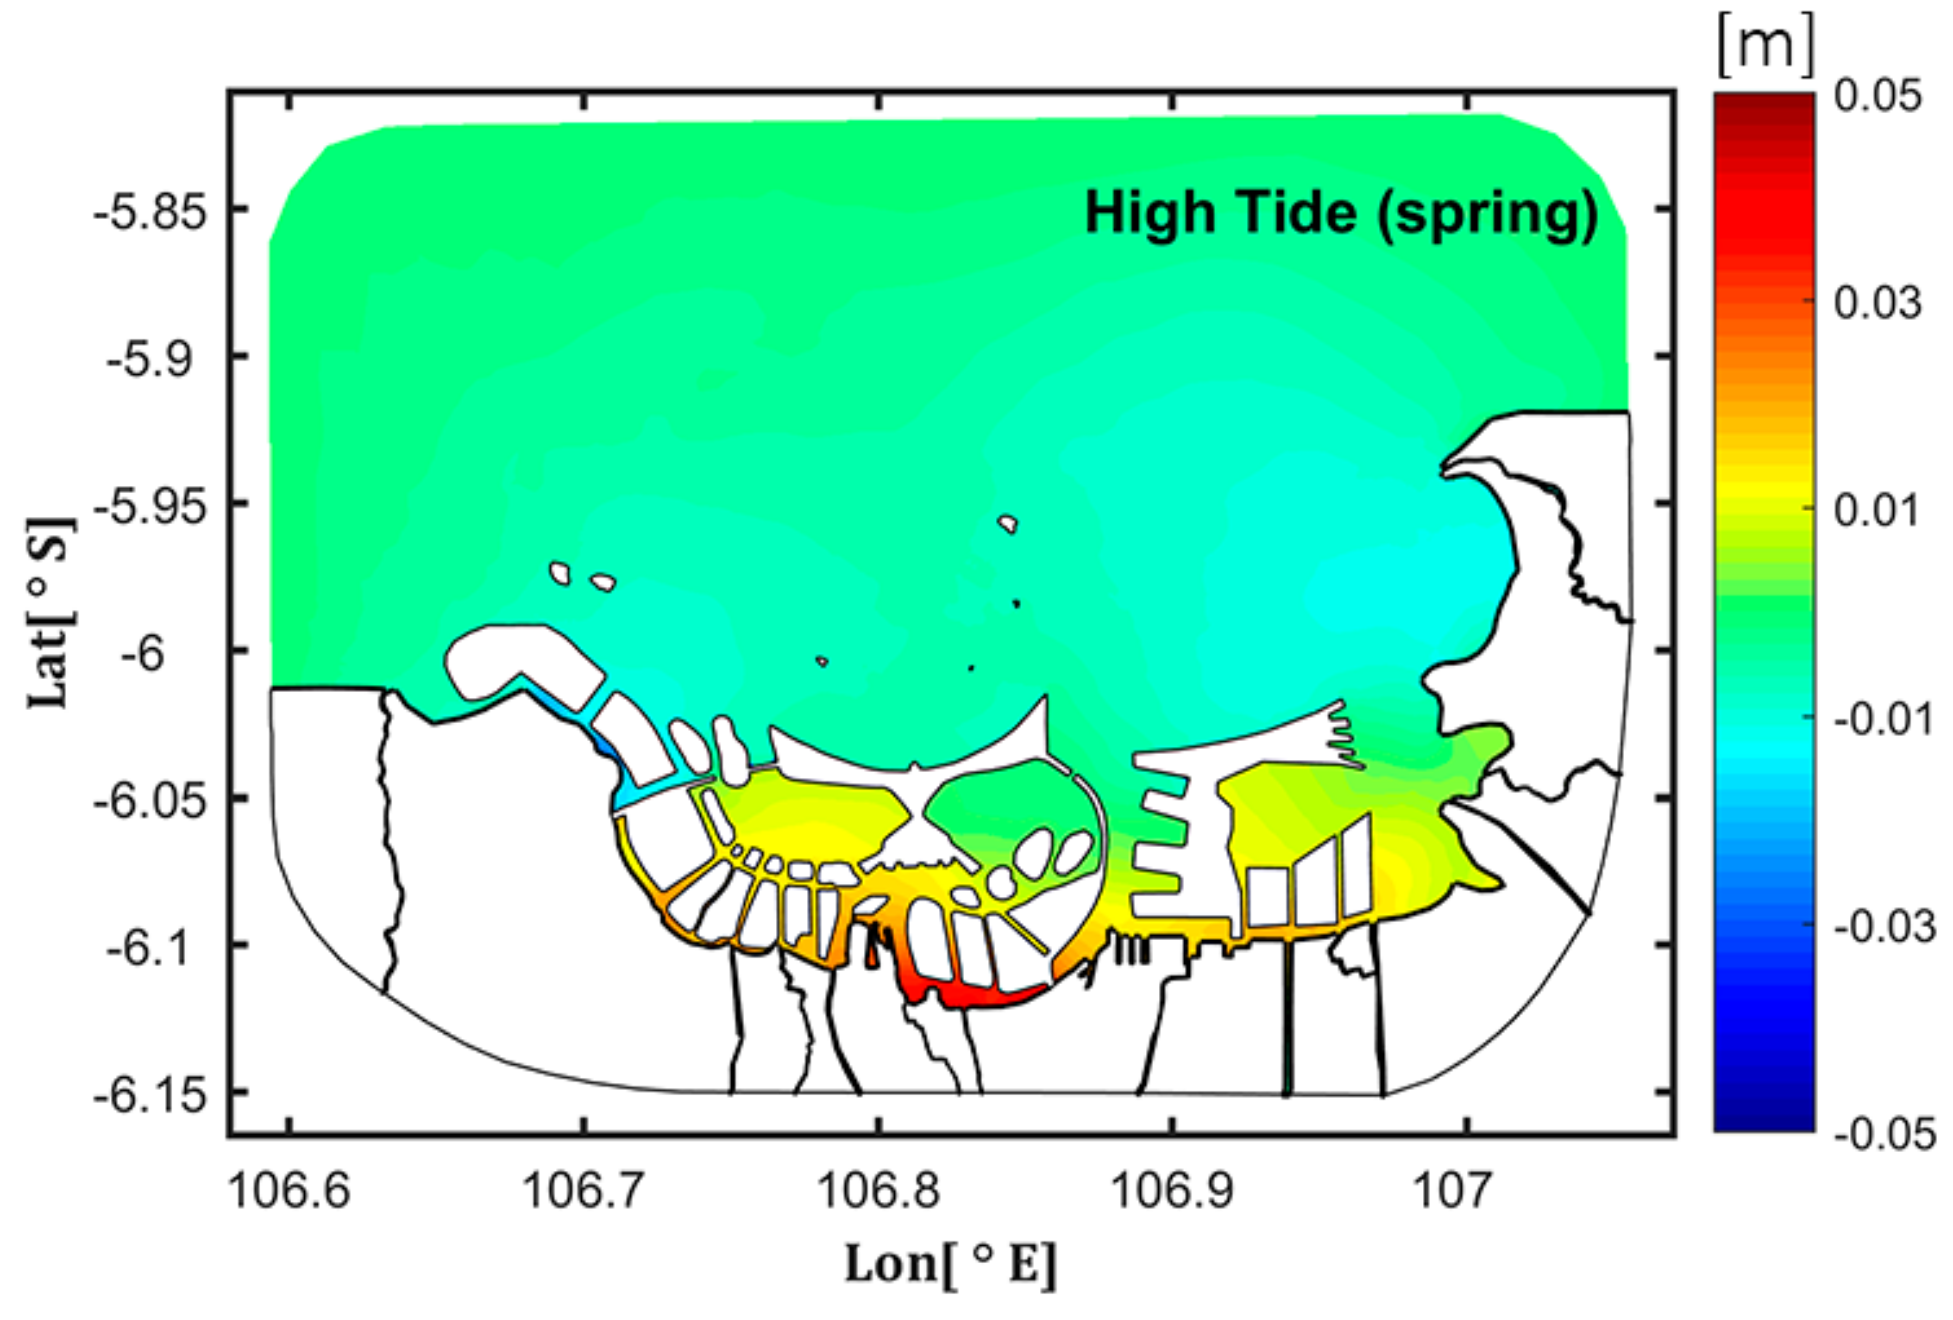
Jakarta Bay, without GSW, had the highest water elevation of approximately 0.6 m at high spring tides. In scenario 1a, there is almost no change of water elevation in the entire bay. In scenario 1b, the water elevation along the coastline increased by less than 2.08% (1.25 cm) at the western part of the bay (from river numbers 1 to 6), and 0.9% (0.5 cm) at the center part of bay (from river numbers 6 to 11), and 3.33% (2 cm) at the eastern part of the bay (from the Keramat River to the Citarum River). In scenario 2a, there is a slight change of water elevation increase, 0.33% (0.2 cm) at the center and eastern parts of bay (from river numbers 6 to 13). In scenario 2b, water elevation increases by 4.17% (2.5 cm) at the center part of the bay (near river numbers 2 to 7) and reaches a maximum, 6.67% (4 cm), at the eastern part of the bay (near river number 13).
4.2. Impacts of River Discharge on Hydrodynamics in Jakarta Bay
The impacts of the river discharge in Jakarta Bay were tested in scenarios 1a and 1b. Wulp et all (2016) [28] reported that in wet seasons mean river discharge in Jakarta increased 1.5 times than the averaged river discharge. If scenario 1a were applied, the total inundation areas of Jakarta Bay would be 33.88 km2 (8.06% of the total land areas in the study domain), increasing by 1.55 km2 compared with the reference scenario 1. The inundation areas slightly increase near the eastern part of Jakarta where the Citarum River is located.
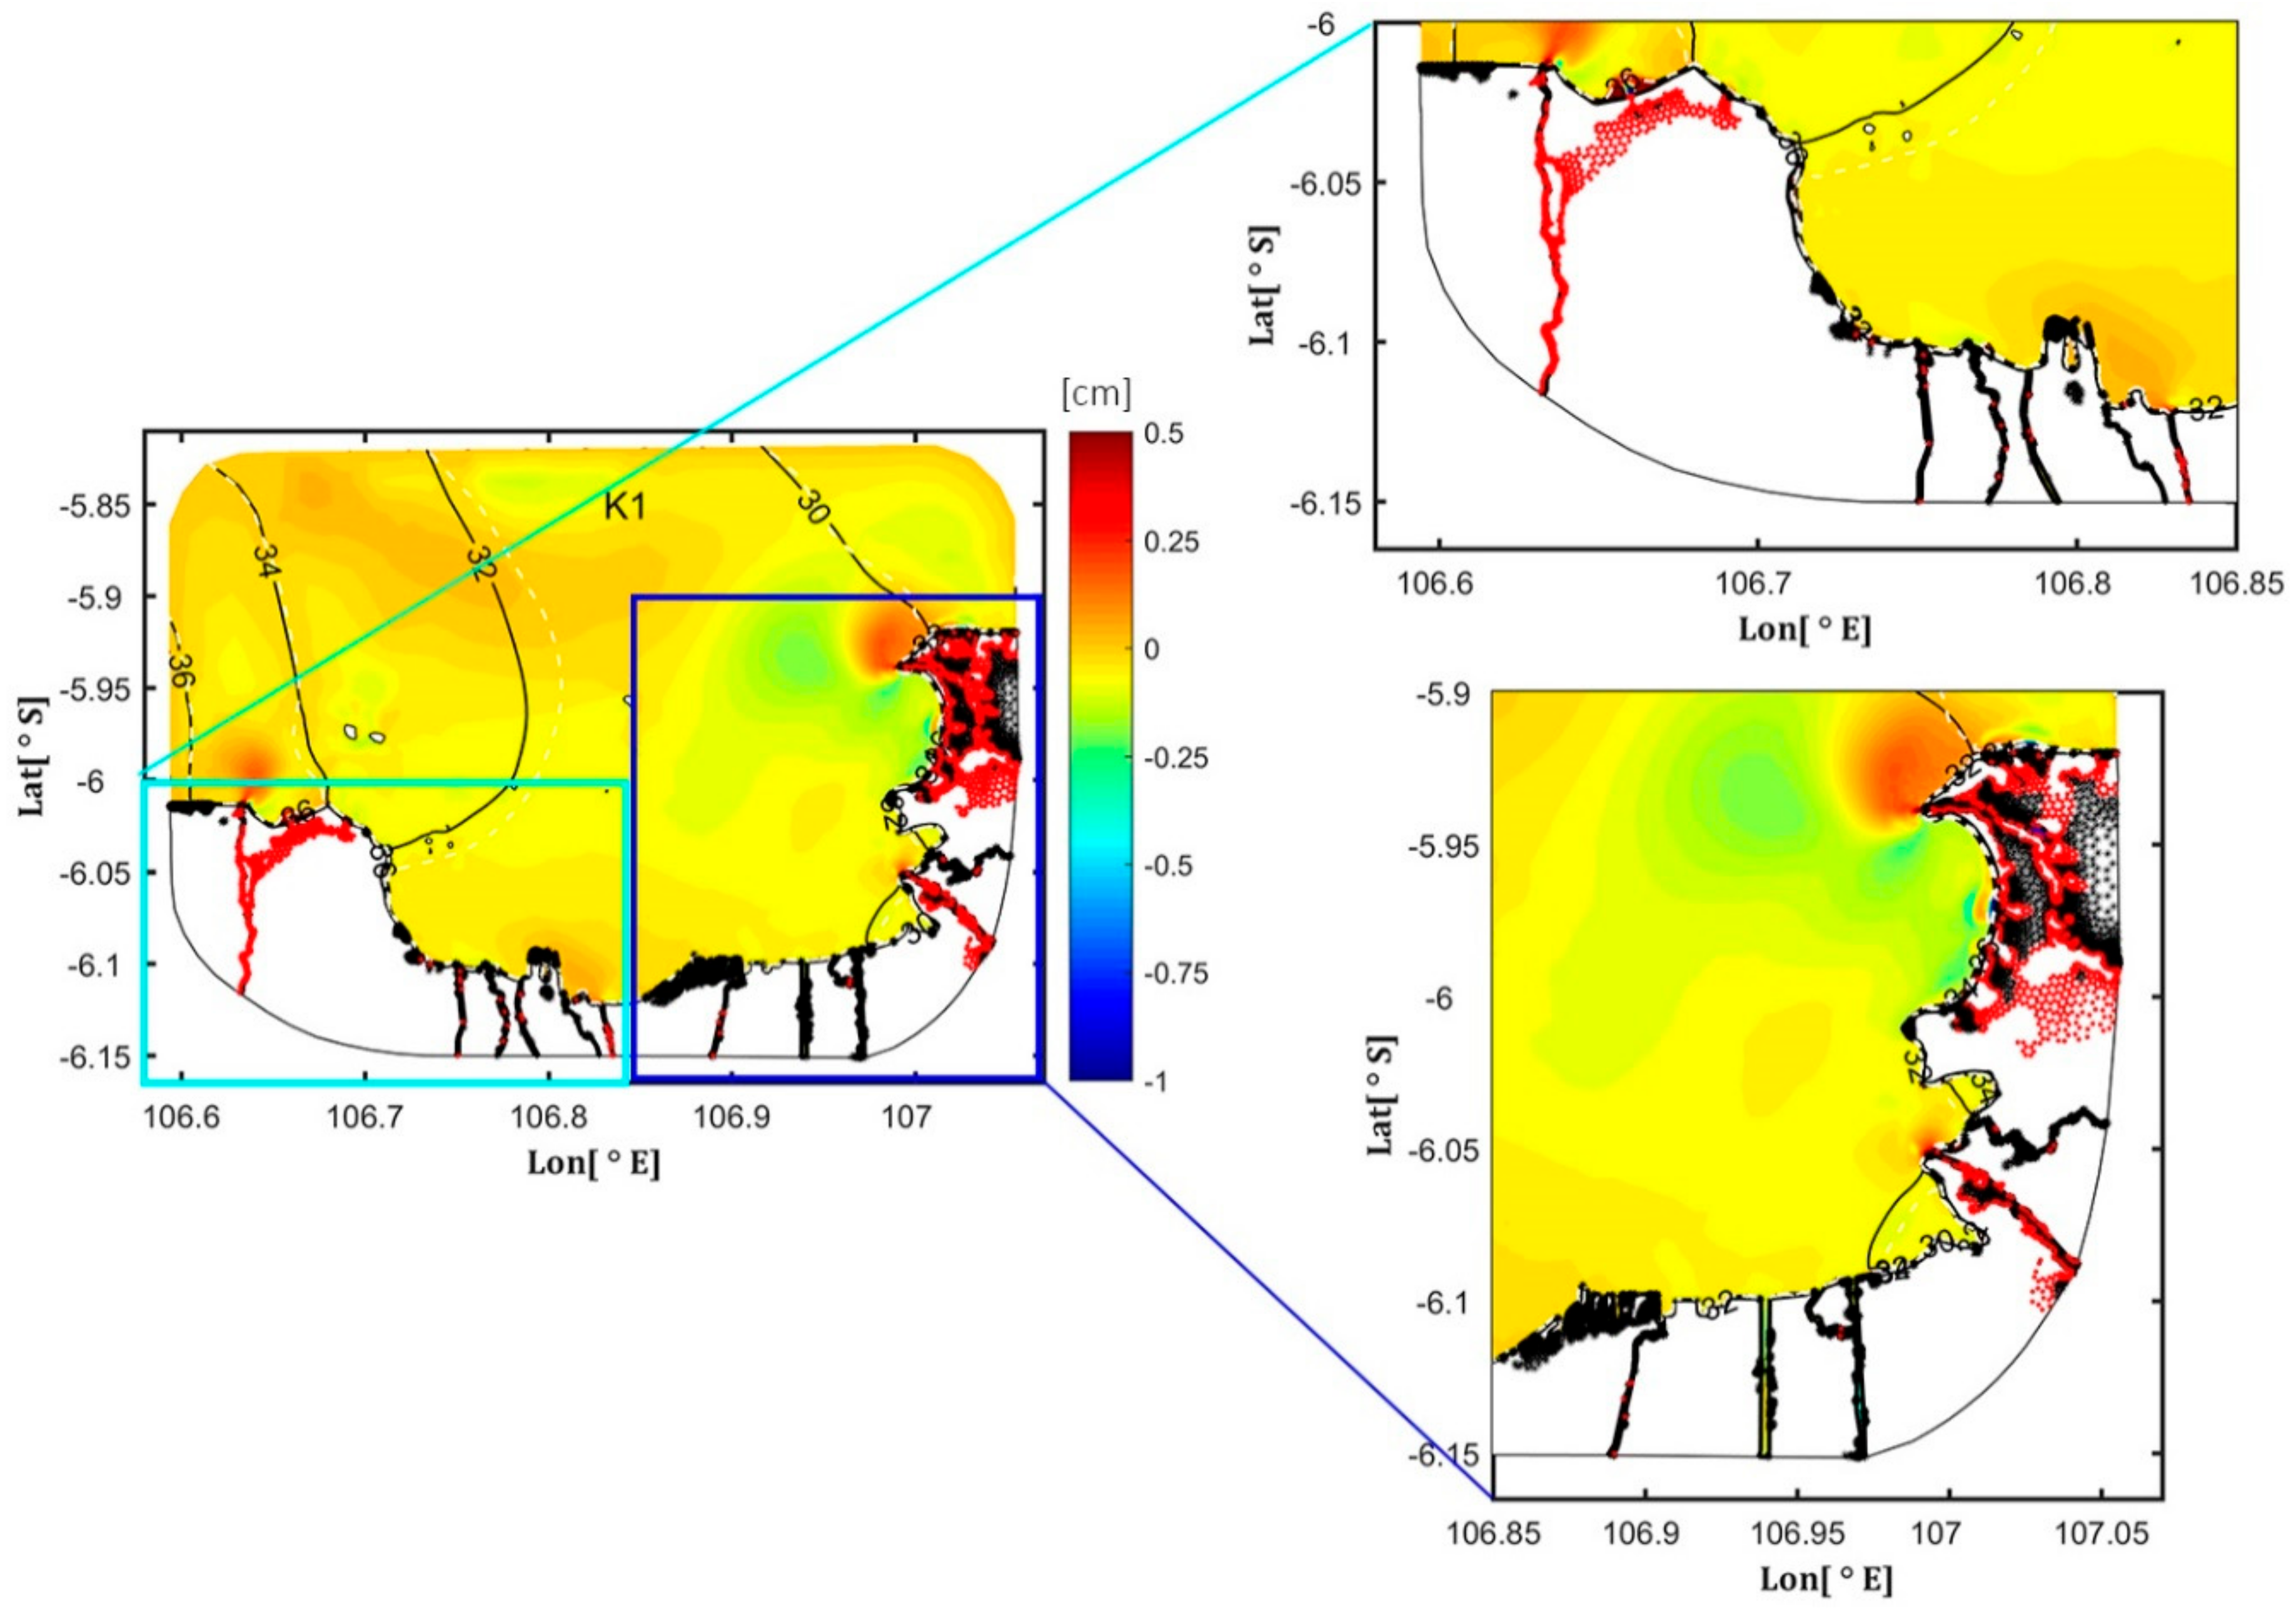
Under extreme conditions, when the river discharge is 10 times the normal one (scenario 1b), flooded areas in Jakarta Bay are 58.52 km2 (13.93% of the total land area), an increase of 26.61 km2 with respect to scenario 1 (Figure 7). The inundation areas mainly occur in the western and eastern part of Jakarta. A major cause of this extreme condition is the Cisadane and Citarum rivers (river numbers 1 and 13, respectively), which have larger river discharges than the others. The central part of Jakarta is relatively unaffected in this scenario due to the small amount of river discharge nearby. As the river discharge increases, the inundation areas become larger, especially in the eastern part of Jakarta.
To further examine the impacts of river discharge on tidal amplitude, the dominant astronomical tidal component K1 was chosen to represent the changes in the bay. In scenario 1a, the K1 tidal amplitude increases only near the river mouths (river numbers 11 to 13) by 0.8% (0.2 cm). In scenario 1b, the K1 amplitude increases by 1% (0.25 cm) in the western and eastern parts (river mouth numbers 1, 11, and 13) and 0.5% (0.125 cm) in the center part (river number 6) of the bay. There is no significant change for the phase lags in K1 in scenario 1a. In scenario 1b, the phases for K1 advanced, meaning that high tides would occur earlier than in the reference scenario 1.
Surface current directions in Jakarta Bay are largely westward during flood spring tides. The surface current pattern changes slightly due to the variations of river discharge (Figure 8). River discharge strengthens the current magnitude at the eastern part of Jakarta Bay and weakens the current magnitude at the central and western parts of Jakarta Bay. In scenario 1a, current velocities decrease by 33.33% (0.1 m/s) at the center of the bay. In scenario 1b, current velocities increase by around 50% (0.2 m/s) at the center of bay and by around 100% (0.4 m/s) at river mouths (numbers 1, 11, and 13).
4.3. Impacts of Sea Level Rise on Hydrodynamics
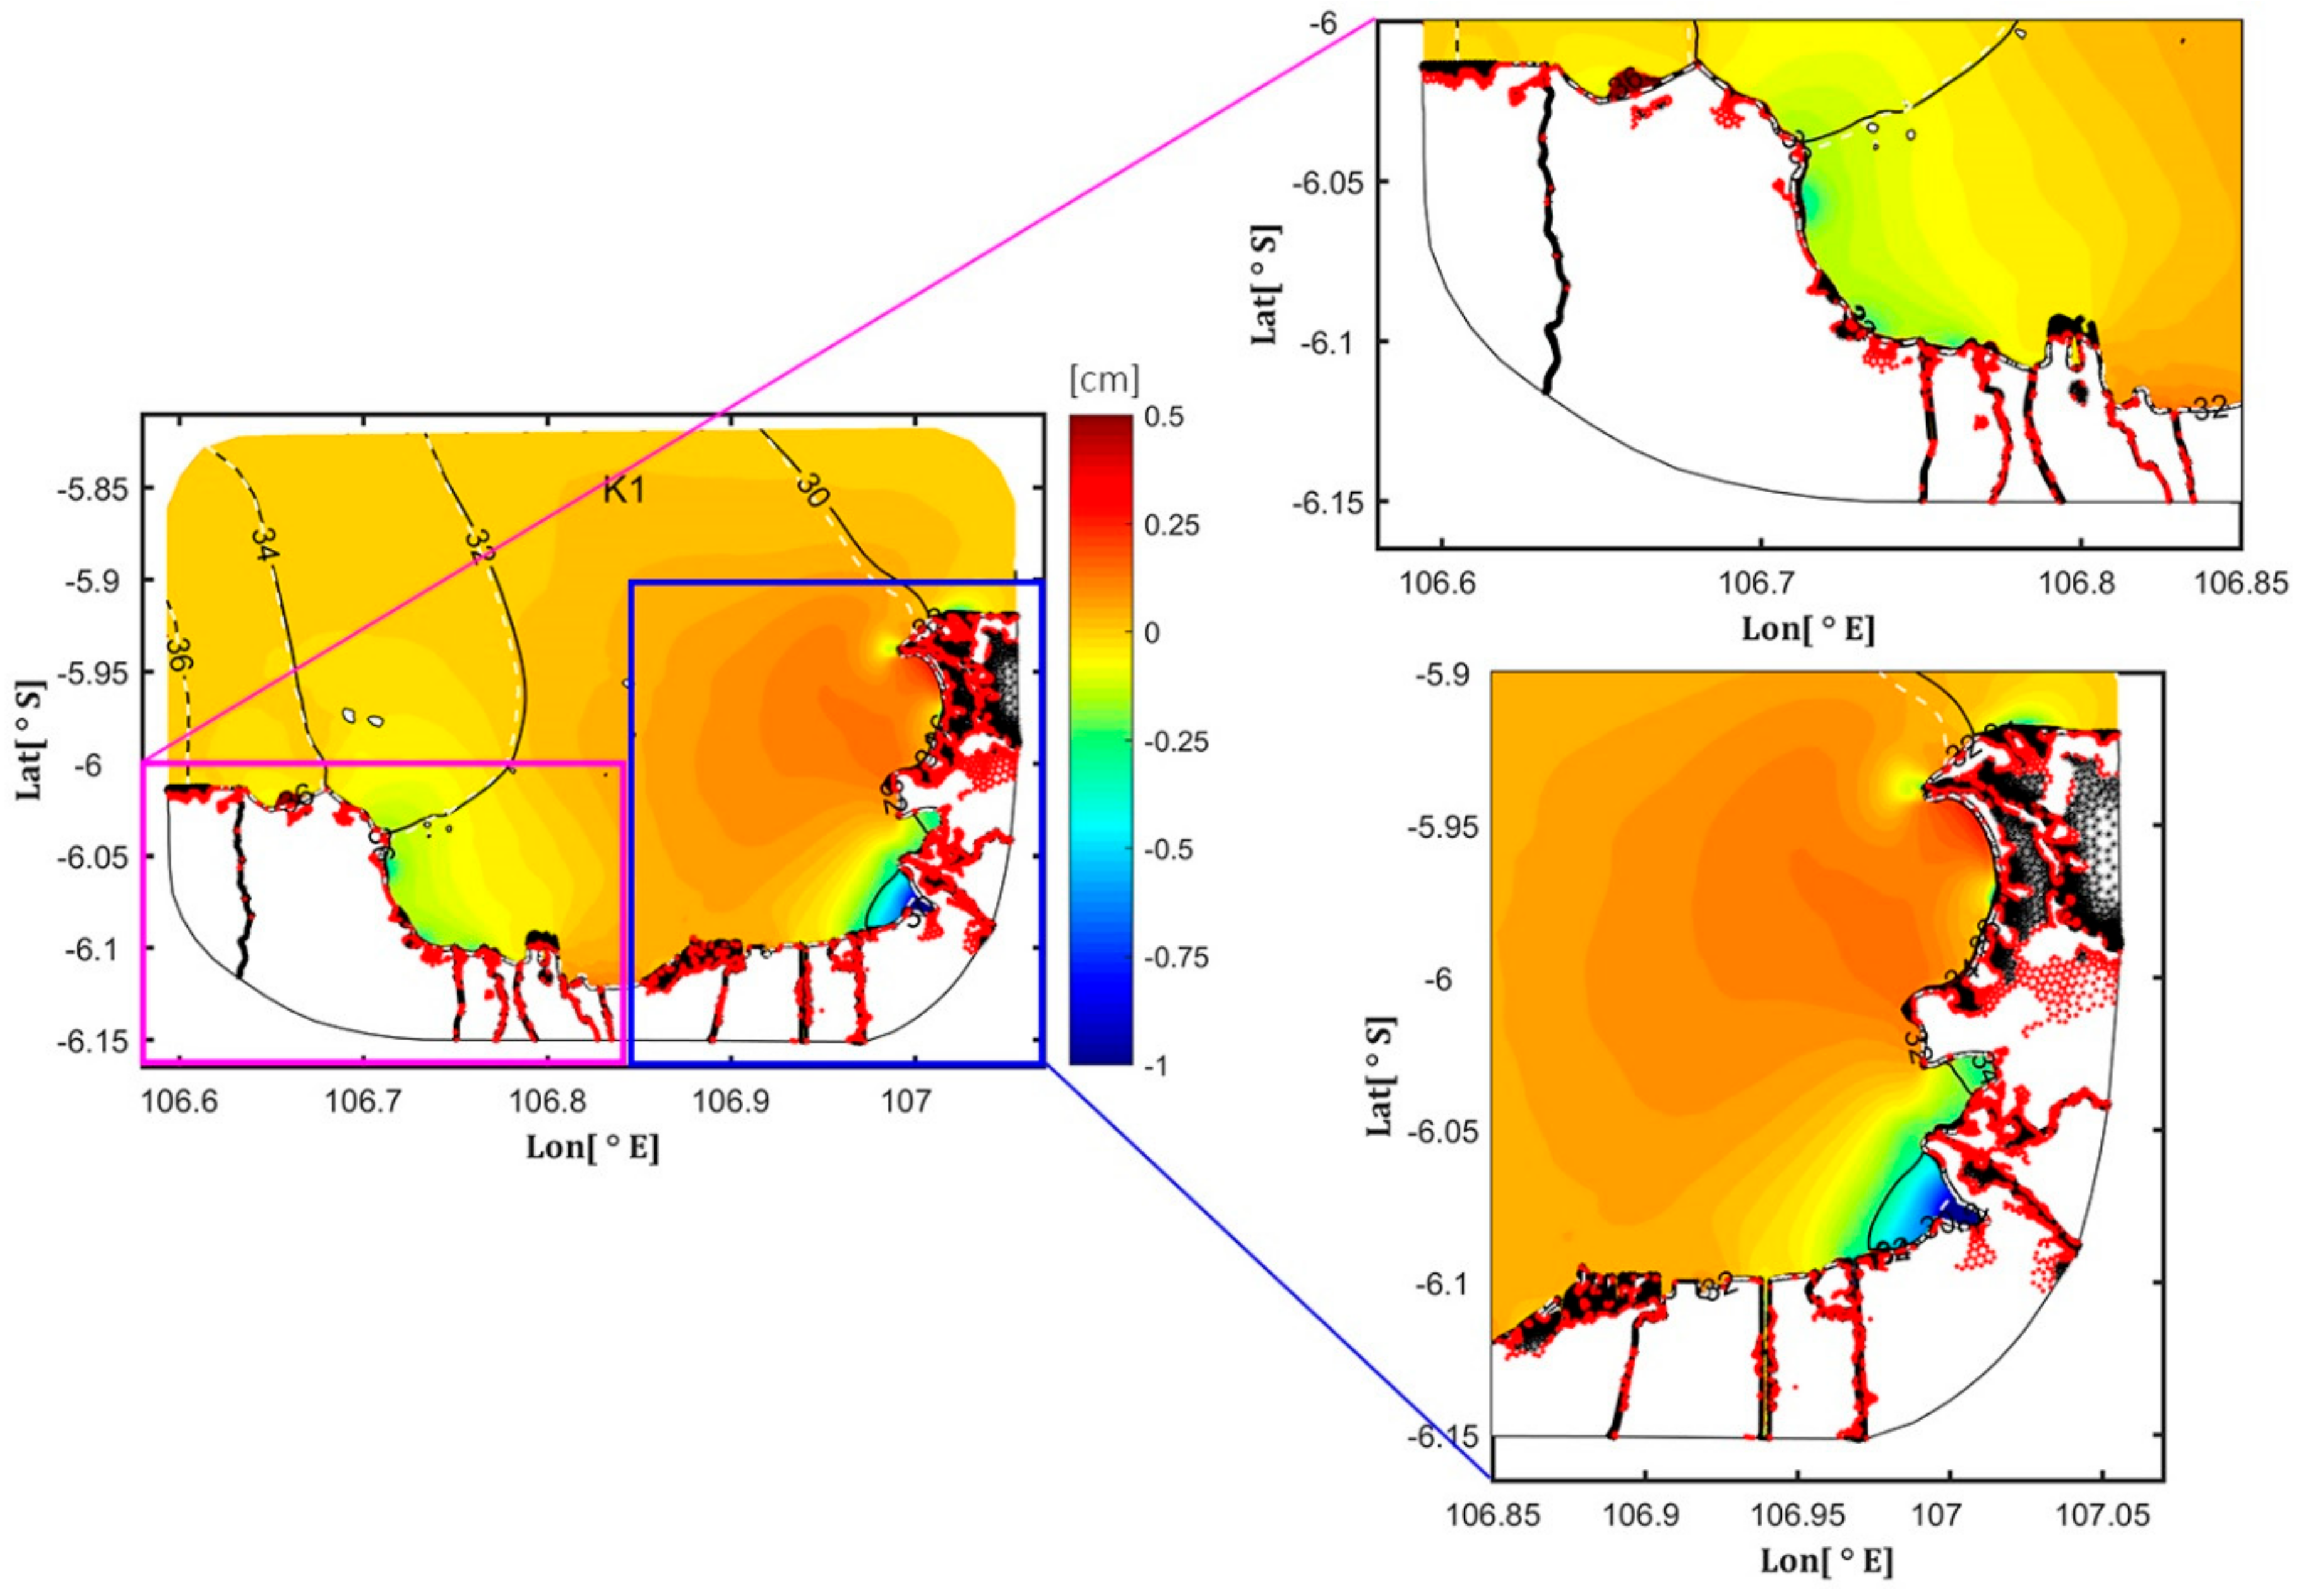
The impacts of sea level rise on the hydrodynamics of Jakarta Bay were tested in scenarios 2a and 2b (Figure 9). In scenario 2a (0.25 m sea level rise), the total inundation areas were 43.37 km2 (10.32% of the total land area), increasing by 11.01 km2 from the reference scenario 1. In scenario 2b (0.60 m sea level rise), total inundation areas were 62.04 km2 (14.77% of the total land area), with an increase of 29.68 km2 from the reference scenario 1. The flood areas of Jakarta Bay occurred near the coastal region from the western to the eastern part.
When the sea level rise is 0.25 m (scenario 2a), the K1 tidal amplitude increases by around 1% (0.25 cm) at the eastern part of the bay (from river numbers 11 to 13) and decreases by about 2% (0.5 cm) between river numbers 10 and 11. There is a small phase lag change for the K1 component, compared with that in the scenario 1.
When the sea level rise is 0.60 m (scenario 2b), the increase of the K1 amplitude is about 1% (0.25 cm) near the coastlines at the eastern part of the bay, which is almost the same as that in scenario 2a. On the other hand, the K1 amplitude decreases between river numbers 10 and 11 by around 3% (0.75 cm), which is larger than that in scenario 2a. The K1 tidal phase remains almost unchanged. The K1 tidal amplitude increases with the rate of sea level rise.
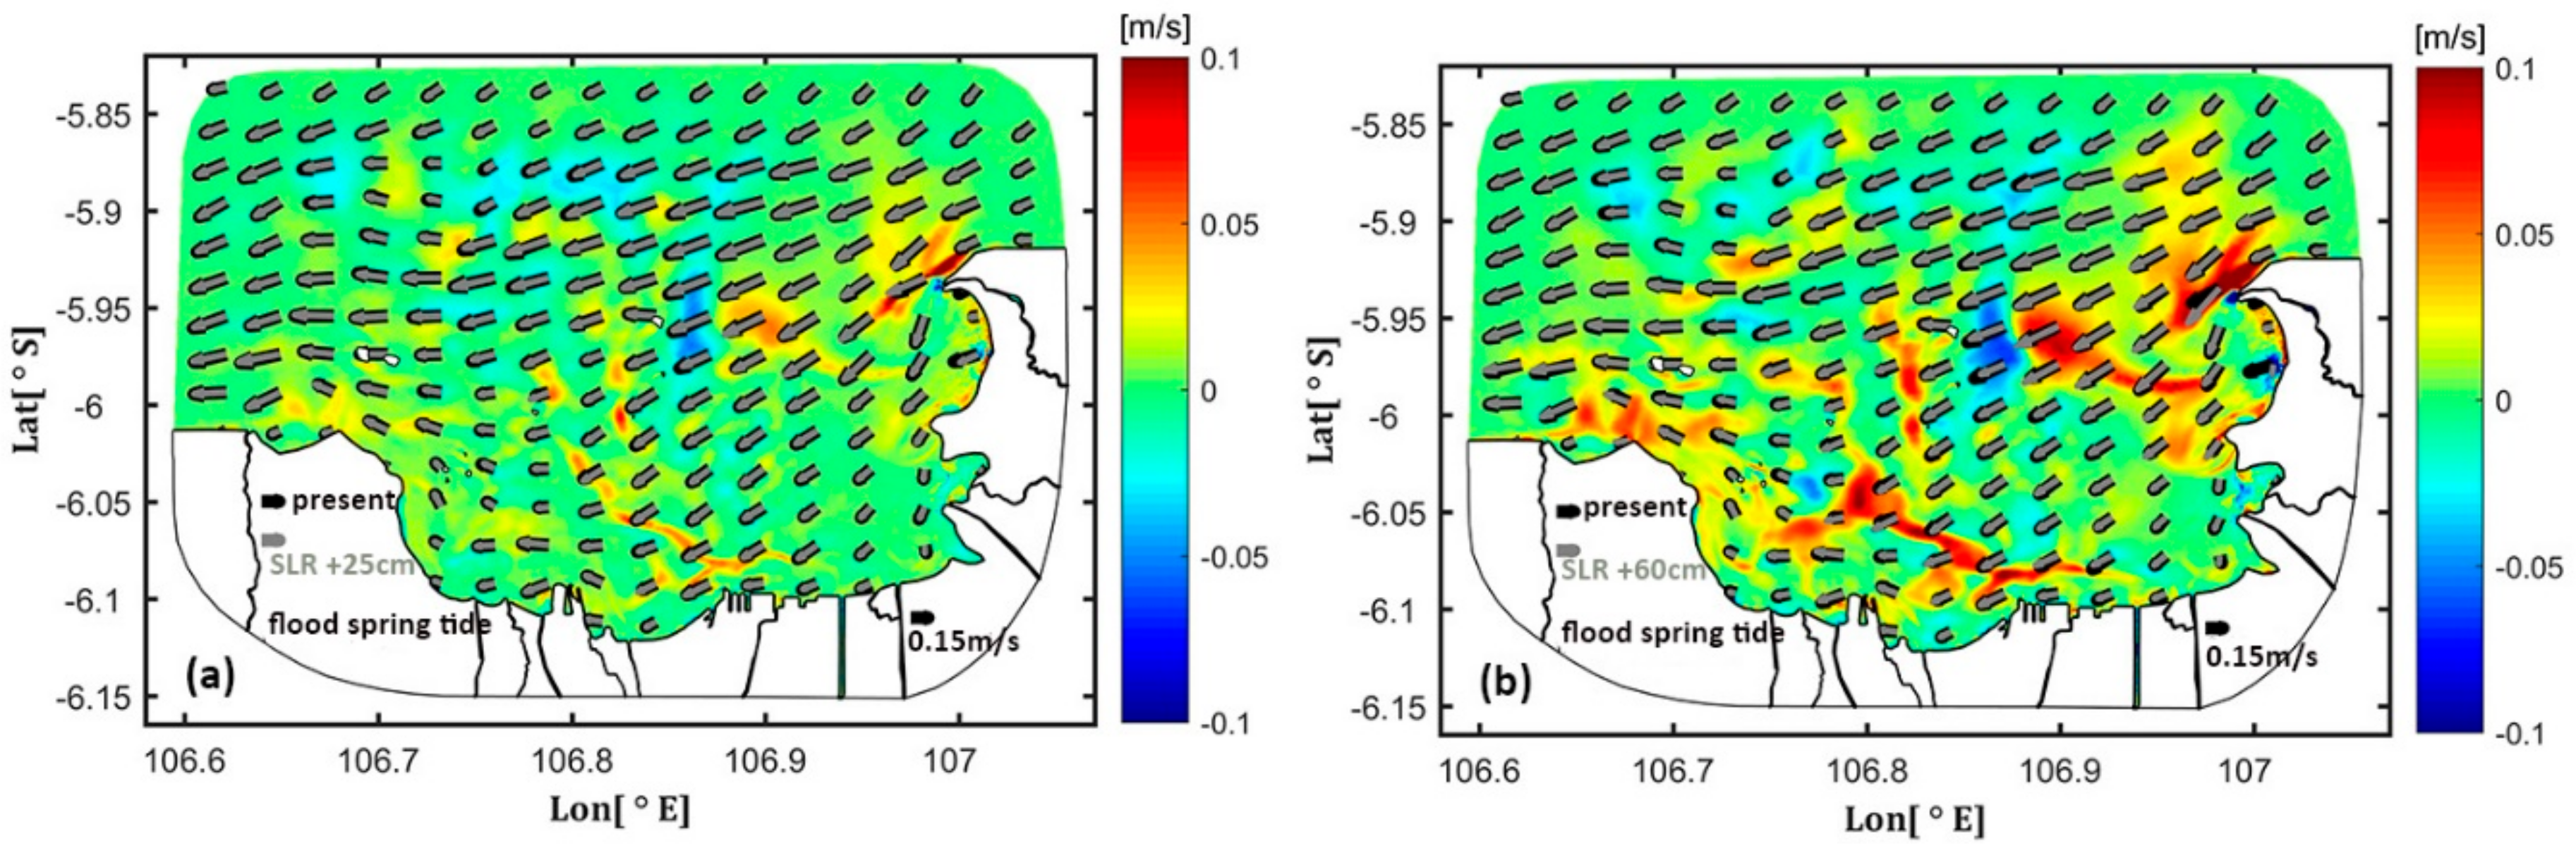
The pattern of surface currents remains largely the same as the sea level rises (Figure 10). A greater rate of sea level rise strengthens the current magnitude in the entire bay, except in the middle part of the bay. Under a sea level rise of 0.25 m (scenario 2a), current velocities increase by 8.3% (0.025 m/s) in the entire bay and decrease by 13.33% (0.04 m/s) in the middle of the bay. Under conditions of sea level rise of 0.6 m (scenario 2b), current velocities would increase by 16.6% (0.05 m/s) near the coastal region and decrease by 24.9% (0.075 m/s) in the middle of the bay.
5. Discussion
This research improves the understanding of sea level rise and river discharge effect on the Jakarta Bay hydrodynamics. As the Jakarta Bay tidal range is no more than 2 m, it can be classified as a microtidal region. Moreover, it is likely that the other microtidal regions with similar characteristics to Jakarta Bay will experience the same conditions under the effects of sea level rise. These findings can be used to assess future hydrodynamic conditions due to sea level rise effects. The projected change of tidal hydrodynamics and inundation areas in this study will be helpful to adopt sound management strategies and adaptation plans.
The impacts of the GSW on the Jakarta Bay flooding area are shown in Table 3. To overcome flooding disasters, the construction of the GSW has been proposed for Jakarta Bay. The construction of the GSW will slightly increase the maximum tidal range by 0.01 m [1] because of the reduced tidal prism by 20% and increased tidal choking in the bay.
In scenario 3, the total inundation areas of Jakarta Bay are 33.47 km2 (7.97% of the total land area), increasing by 1.11 km2 from scenario 1. There would be a slight change in flooding area after the GSW had been constructed.
After the construction of the GSW, a slight change would occur to tidal amplitudes during high spring tides near the coastline, compared with scenario 1 (Figure 11). Tidal amplitudes would increase by around 1 cm (2% from scenario 1) at the eastern reservoir. At the western reservoir, tidal amplitudes near the coastal area would increase by around 3 cm (5.88% from scenario 1) and 1 cm (2% from scenario 1) near the channel on the left side of the western reservoir. There would no change in tidal amplitude on the right side of the western reservoir. Tidal amplitudes in the eastern part of the bay (from river numbers 12 to 13) will decrease by around 1 cm (2% from scenario 1).
5.1. Effects of the Giant Seawall on Sea Level Rise
The effects of the GSW on sea level rise were tested in scenarios 4a and 4b (Figure 12a). The inundation area in scenario 4a would be 44.05 km2 (10.49% of the total land area in the study domain), increasing by 10.58 km2 from scenario 3 (the reference model with GSW). In scenario 4b, the total inundation area would be 63.56 km2 (15.13% of the total land area in the study domain) increasing by 30.09 km2 from scenario 3. The inundation areas in scenarios 4a and 4b would increase by less than 1% compared with scenarios 2a and 2b. The construction of the Giant Seawall in Jakarta Bay would need further design improvement to prevent a flooding hazard due to sea level rise. Furthermore, the implementation of the GSW design should also consider strengthening and increasing the current seawall height on the shore to prevent sea water overtopping the wall.
Compared with scenario 3, when the sea level rises by 0.25 m in scenario 4a, the K1 tidal amplitude slightly increases by around 0.2% (0.05 cm) in the eastern reservoir and on the left side of the western reservoir, and decreases by 0.65% (0.1 cm) near the Cisadane River (river number 1). There are small phase lag changes for the K1 component near the reclamation island areas outside the western reservoir.
When the sea level rises by 0.60 m in scenario 4b, the K1 tidal amplitude increases by around 0.4% (0.1 cm) in the eastern reservoir (from river numbers 9 to 11) and by 1.22% (0.3 cm) near the coastlines inside the western reservoir. The K1 tidal amplitude also decreases by 0.8% (0.2 cm) on the right side of the western reservoir, the eastern reservoir (from river numbers 7 to 8), and the mouth of the Cisadane, Keramat, and Citarum rivers (river numbers 1, 12, and 13). There is no significant change of phase lag for the K1 component.
5.2. Effects of the Giant Seawall on River Discharge
The impacts of a Giant Seawall on river discharge were tested in scenarios 3a and 3b (Figure 12b). When river discharge is increased 1.5 times (scenario 3a), inundation areas are 36.7 km2 (8.74% of the total land area in study domain) increasing by 2.82 km2 from scenario 3. The inundation areas in scenario 3a would increase by 0.6% compared with scenarios 1a. The K1 amplitude remains almost the same in the entire bay. There is a small increase of around 0.42% (0.1 cm) at river mouth numbers 11 and 13. There are no significant changes in phase lag for the K1 component in scenario 3a compared to scenario 3.
If river discharge is 10 times higher (scenario 3b), all the areas are flooded due to a blocking of the tidal inflow. Further design improvement is needed for the construction of the GSW to prevent a flooding hazard due to high river discharge, especially under extreme conditions (25-year return period). The designed dike height should be increased along the rivers to prevent overland flow from high river discharge. Protection of the inundation area after construction of the GSW under sea level rise and high river discharge can be considered in mitigation strategies. Overall, this research will help to improve coastal management in Jakarta Bay.
6. Concluding Remarks
The impacts of sea level rise and river discharge on the hydrodynamics of Jakarta Bay have been investigated using FVCOM. Sea surface level and current data at two field stations were used to validate the model. The model reproduced tidal elevation and current very well, with statistical skill parameters of 0.96, 0.96 and 0.88 for elevation, current velocity and direction, respectively. Numerical experiments were designed to examine the contribution of sea level rise and river discharge to the changes of hydrodynamics in Jakarta Bay.
The distribution of the amplitudes and phases of diurnal and semidiurnal tides in Jakarta Bay are quite different to other bays as the bay is located in the Java Sea and near the Sunda Strait. The diurnal tidal wave moves westward, while the semidiurnal tidal wave moves eastward. Diurnal tides come from the Pacific Ocean through the Makassar Strait and Mollusca Sea and propagate westward into the Java Sea. In contrast, semidiurnal tides come from the Indian Ocean through the Sunda Strait and propagate northward and from the Karimata Strait, propagating southward. The shallow bathymetry and complicated coastlines contribute to generating the distribution pattern of the tides in the bay.
Future sea level rise and river discharge variations will affect the hydrodynamics and coastal flooding areas in Jakarta Bay. The increase of river discharge amplifies the tidal components as well as the inundation areas near the river mouth due to increased fluvial forcing: the K1 amplitude increases by ~1% (0.25 cm), the current magnitude increases by 100% (0.4 m/s), and the inundation area increases by 26.61 km2 under the 10 times of mean river discharge. The rise of sea level increases the diurnal tidal component due to the increased tidal forcing: when sea level rise is 0.6m, the K1 amplitude increases by ~1% (0.25 cm) near the coastline and current magnitude increases by 16.6 % (0.05 m/s). The increasing sea level rise and river discharge would amplify the inundation areas and the tidal currents due to the increased tidal forcing and the river discharge amounts.
The GSW construction would slightly increase the water level by around 1 cm at the eastern reservoir due to the reduced tidal prism, while in the western reservoir, the water level would increase by up to 3 cm. If sea level rise occurs together with flooding, the K1 amplitude would slightly increase by less than 1% (0.2 cm), due to the reduction of the dissipation effects. The design of the GSW will need further improvement to prevent flooding hazards in the event of sea level rise and the effect of high river discharge. Strengthening the current seawall on the shore and increasing the dike height along the rivers would help to prevent a flooding hazard in Jakarta Bay. The outcome of this research improves our understanding of the sea level rise and river discharge effects in open type bays.
Author Contributions
Conceptualization, Y.X. and L.L.; Methodology, M.Y.S.; Software, M.Y.S.; Validation, M.Y.S., Y.X. and L.L.; Formal Analysis, M.Y.S., L.L.; Investigation, M.Y.S., Z.H. and L.L.; Resources, M.Y.S., L.L.; Data Curation, L.L.; Writing-Original Draft Preparation, M.Y.S.; Writing-Review & Editing, L.L. and Y.X.; Visualization, M.Y.S.; Supervision, Y.X. and Z.H.; Project Administration, Z.H.; Funding Acquisition, Z.H. and L.L.
Funding
This study was supported by the National Key Research and Development Program of China (2017YFC1405101) and was partially supported by the Natural Science Foundation of Zhejiang Province (LR16E090001) and the Bureau of Science and Technology of Zhoushan (2018C81036). Martin was supported by a scholarship from Zhejiang University for a Master’s Degree program at the Ocean College of Zhejiang University, China.
Acknowledgments
We thank the Ministry of Public Works, Indonesia, for providing the tide, current, and bathymetry data.
Conflicts of Interest
The authors declare no conflict of interest.
References
- Rusdiansyah, A.; Tang, Y.; He, Z.; Li, L.; Ye, Y.; Surya, M.Y. The impacts of the large-scale hydraulic structures on tidal dynamics in open-type bay: Numerical study in Jakarta Bay. Ocean Dyn. 2018, 68, 1141–1154. [Google Scholar] [CrossRef]
- Sagala, S.; Lassa, J.; Yasaditama, H.; Hudalah, D. The Evolution of Risk and Vulnerability in Greater Jakarta: Contesting Government Policy. Inst. Resour. Governance Social Chang. 2015, 2, 1–18. [Google Scholar]
- Central Bureau of Statistics. Preliminary Results of Population Census; Central Bureau of Statistics: Denpasar, Indonesia, 2010.
- Budiyono, Y.; Aerts, J.; Brinkman, J.; Marfai, M.A.; Ward, P. Flood Risk Assessment for Delta Mega-cities: A Case Study of Jakarta. Nat. Hazards 2015, 75, 389–413. [Google Scholar] [CrossRef]
- IPCC. Summary for Policymakers Climate Change the Physical Science Basic Contribution of Working Group 1 to the Fourth Assessment Report of the Intergovernmental Panel on Climate Change; Cambridge University Press: Cambridge, UK, 2017. [Google Scholar]
- Bappenas. Laporan Perkiraan Kerusakan dan Kerugian Pasca Bencana Banjir Awal Februari 2007 Di wilayah Jabodetabek (Jakarta, Bogor, Depok, Tangerang, dan Bekasi); Kementian Negara Perencanaan Pembangunan Nasional/BAPPENAS: Jakarta, Indonesia, 2007.
- Abidin, H.Z.; Andreas, H.; Djaja, R.; Darmawan, D.; Gamal, M. Land subsidence and characteristics of Jakarta between 1997 and 2005, as estimated using GPS surveys. GPS Solut. 2008, 12, 23–32. [Google Scholar] [CrossRef]
- Ministry of Economic Affairs. Master Plan National Capital Integrated Coastal Development (NCICD); Ministry of Economic Affairs: Jakarta, Indonesia, 2014.
- Ningsih, N.S. Three-Dimensional Model for Coastal Ocean Circulation and Sea Floor Topography Changes: Application to the Java Sea. Ph.D. Thesis, Kyoto University, Kyoto, Japan, 2000. [Google Scholar]
- Koropitan, A.F.; Ikeda, M.; Damar, A.; Yamanaka, Y. Influences of physical processes on the ecosystem of Jakarta Bay: A coupled physical–ecosystem model experiment. ICES J. Mar. Sci. 2009, 66, 336–348. [Google Scholar] [CrossRef]
- Sachoemar, S.I.; Yanagi, T. Seasonal variation of water characteristics in northern coastal area of Java. Societe Franco-Japonaise d’Oceanographie 2001, 39, 77–85. [Google Scholar]
- Setiawan, A.; Putri, M.R. Study of current circulation in Jakarta Bay. In Proceedings of the 3rd International Symposium on Advanced and Aerospace Science and Technology in Indonesia, Jakarta, Indonesia, 31 August–3 September 1998. [Google Scholar]
- Wyrtki, K. Physical Oceanography of the Southeast Asian Waters; Naga Report 2; Scripps Institution of Oceanography: La Jolla, CA, USA, 1961. [Google Scholar]
- Koropitan, A.F.; Ikeda, M. Three-dimensional modeling of tidal circulation and mixing over the Java Sea. J. Oceanogr. 2008, 64, 61–80. [Google Scholar] [CrossRef]
- Takagi, H.; Esteban, M.; Mikami, T.; Fujii, D. Projection of coastal floods in 2050 Jakarta. Urban Clim. 2006, 17, 135–145. [Google Scholar] [CrossRef]
- Passeri, D.L.; Hagem, S.C.; Plant, N.G.; Bilskie, M.V.; Medeiros, S.C.; Alizad, K. Tidal hydrodynamics under future sea level rise and coastal morphology in the Northern Gulf of Mexico. Earth’s Future 2016, 4, 159–176. [Google Scholar] [CrossRef] [Green Version]
- Aoki, K.; Isobe, A. Application of Finite Volume Coastal Ocean Model to hindcasting the wind-induced sea-level variation in Fukuoka Bay. J. Oceanogr. 2007, 63, 333–339. [Google Scholar] [CrossRef]
- Gede, H.I.; Koji, A. Numerical study on tidal currents and seawater exchange in the Benoa Bay, Bali, Indonesia. Acta Oceanol. Sin. 2004, 33, 90–100. [Google Scholar]
- Park, Y.G.; Kim, H.Y.; Hwang, J.H.; Kim, T.; Park, S. Dynamics of dike effects on tidal circulation around Saemangeum, Korea. Ocean Coast. Manag. J. 2014, 102, 572–582. [Google Scholar] [CrossRef]
- Pawlowicz, R.; Beardsley, B.; Lentz, S. Classical tidal harmonic analysis includirng error estimates in MATLAB using T_TIDE. Comput. Geosci. 2002, 28, 929–937. [Google Scholar] [CrossRef]
- Defant, A. Physical Oceanography; Pergamon Press: New York, NY, USA, 1961. [Google Scholar]
- Chen, C.; Beardsley, R.C.; Cowles, G. An Unstructured Grid, Finite Volume Coastal Ocean Model: FVCOM User Manual, 2nd ed.; Technical Report 06-0602; University of Massachusetts-Dartmouth: New Bedford, MA, USA, 2006. [Google Scholar]
- Mellor, G.L.; Yamada, T. Development of turbulence closure model for geophysical fluid problems. Review of geophysics and space physics. Rev. Geophys. 1982, 20, 851–875. [Google Scholar] [CrossRef]
- Smagorinsky, J. General circulation experiments with the primitive equations. Mon. Weather Rev. 1963, 91, 99–164. [Google Scholar] [CrossRef]
- Jarvis, A.; Reuter, H.I.; Nelson, A.; Guevara, E. Holefilled SRTM for the Globe Version 4. CGIAR-CSI SRTM 90 m Database; International Center for Tropical Agriculture: Cali, Colombia, 2008. [Google Scholar]
- Egber, G.D.; Erofeeva, S.Y. Efficient inverse modelling of barotropic ocean tides. J. Atmos. Ocean. Technol. 2002, 19, 183–204. [Google Scholar] [CrossRef]
- Radjawane, I.M.; Riandini, F. Numerical Simulation of Cohesive Sediment Transport in Jakarta Bay. Int. J. Remote Sens. Earth Sci. 2009, 6, 65–76. [Google Scholar] [CrossRef]
- Wulp, S.A.; Damar, A.; Ladwig, N.; Hesse, K.-J. Numerical simulation of river discharges, nutrient flux and nutrient dispersal in Jakarta Bay, Indonesia. Mar. Pollut. Bull. 2016, 110, 675–685. [Google Scholar] [CrossRef]
- Soeriaatmadja, R.E. Surface salinities in the Straits of Malacca. Mar. Res Indones. 1956, 2, 27–55. [Google Scholar] [CrossRef]
- Trisakti, B.; Sulma, S.; Budhiman, S. Study of sea surface temperature (SST) using Landsat-7 ETM (In comparison with sea surface temperature of NOAA-12 AVHRR. In Proceedings of the Thirteenth Workshop of OMISAR (WOM-13) on Validation and Application of Satellite Data for Marine Resources Conservation, Bali, Indonesia, 5–9 October 2004. [Google Scholar]
- Ma, G.; Shi, F.; Liu, S.; Qi, D. Hydrodynamic modelling of Changjiang Estuary: Model skill assessment and large-scale structure impacts. Appl. Ocean Res. 2011, 69–78. [Google Scholar] [CrossRef]
- Ray, R.D.; Egbert, G.D.; Erofeeva, S.Y. A Brief Overview of Tides in the Indonesian Seas. Oceanography 2005, 18, 4. [Google Scholar] [CrossRef]
- Gordon, A.L. Oceanography of the Indonesian Seas and their throughflow. Oceanography 2005, 18, 14–27. [Google Scholar] [CrossRef]
Figure 1.
Map of the location of Jakarta Bay, and the Giant Seawall (GSW) as described in the NCICD Master Plan (Source: Master Plan NCICD). Numbers 1 to 13 correspond to rivers.
Figure 1.
Map of the location of Jakarta Bay, and the Giant Seawall (GSW) as described in the NCICD Master Plan (Source: Master Plan NCICD). Numbers 1 to 13 correspond to rivers.

Figure 2.
Currents (m/s) during spring tides in Jakarta Bay: (a) flooding and ebbing (b) ebb currents near the water surface; (c,d) show flooding and ebbing currents near the bottom level.
Figure 2.
Currents (m/s) during spring tides in Jakarta Bay: (a) flooding and ebbing (b) ebb currents near the water surface; (c,d) show flooding and ebbing currents near the bottom level.

Figure 3.
Model Grid for Jakarta Bay (a) reference scenario 1 and (b) Jakarta Bay after the Giant Seawall (GSW) construction (scenario 3). The numbers indicate rivers. The blue dot and triangle indicate field stations.
Figure 3.
Model Grid for Jakarta Bay (a) reference scenario 1 and (b) Jakarta Bay after the Giant Seawall (GSW) construction (scenario 3). The numbers indicate rivers. The blue dot and triangle indicate field stations.

Figure 4.
Comparisons of tidal level between the model results and the field data at (a) Kolinamil Station and (b) Kayangan Station.
Figure 4.
Comparisons of tidal level between the model results and the field data at (a) Kolinamil Station and (b) Kayangan Station.

Figure 5.
Comparisons of current speeds and directions between the modelled and observed data at Kayangan Station (12–14 June 2015).
Figure 5.
Comparisons of current speeds and directions between the modelled and observed data at Kayangan Station (12–14 June 2015).

Figure 6.
Co-tidal charts of the main tidal constituents (K1, O1, M2, and S2).

Figure 7.
Changes in K1 tidal amplitudes (cm) and inundation areas in Jakarta Bay between scenario 1b and scenario 1. Black dots indicate the inundation area in scenario 1, and red dots indicate the increased inundation area in scenario 1b. Color contours indicate the changes in K1 amplitude (cm).
Figure 7.
Changes in K1 tidal amplitudes (cm) and inundation areas in Jakarta Bay between scenario 1b and scenario 1. Black dots indicate the inundation area in scenario 1, and red dots indicate the increased inundation area in scenario 1b. Color contours indicate the changes in K1 amplitude (cm).

Figure 8.
Differences in surface current velocity (m/s) and direction under flood condition spring tide (a) scenario 1a and (b) scenario 1b. Black vectors are for scenario 1, and grey vectors are for scenario 2a/2b. Color contours indicate the change in magnitude (m/s) of the surface current velocity.

Figure 9.
Changes in K1 tidal amplitudes (cm) and inundation areas in Jakarta Bay between scenario 2b and scenario 1. Black dots indicate the inundation area in scenario 1, and red dots indicate the increased inundation area in scenario 2b. Color contours indicate the changes in K1 amplitude (cm).
Figure 9.
Changes in K1 tidal amplitudes (cm) and inundation areas in Jakarta Bay between scenario 2b and scenario 1. Black dots indicate the inundation area in scenario 1, and red dots indicate the increased inundation area in scenario 2b. Color contours indicate the changes in K1 amplitude (cm).

Figure 10.
Differences in surface current velocity (m/s) and direction under flood condition spring tide (a) scenario 2a and (b) scenario 2b. Black vectors are for scenario 1, and grey vectors are for scenario 2a/2b. Color contours indicate the change in magnitude (m/s) of the surface current velocity.

Figure 11.
Changes in water elevation (m) between scenario 1 and after the Giant Seawall (GSW) construction (scenario 3).
Figure 11.
Changes in water elevation (m) between scenario 1 and after the Giant Seawall (GSW) construction (scenario 3).

Figure 12.
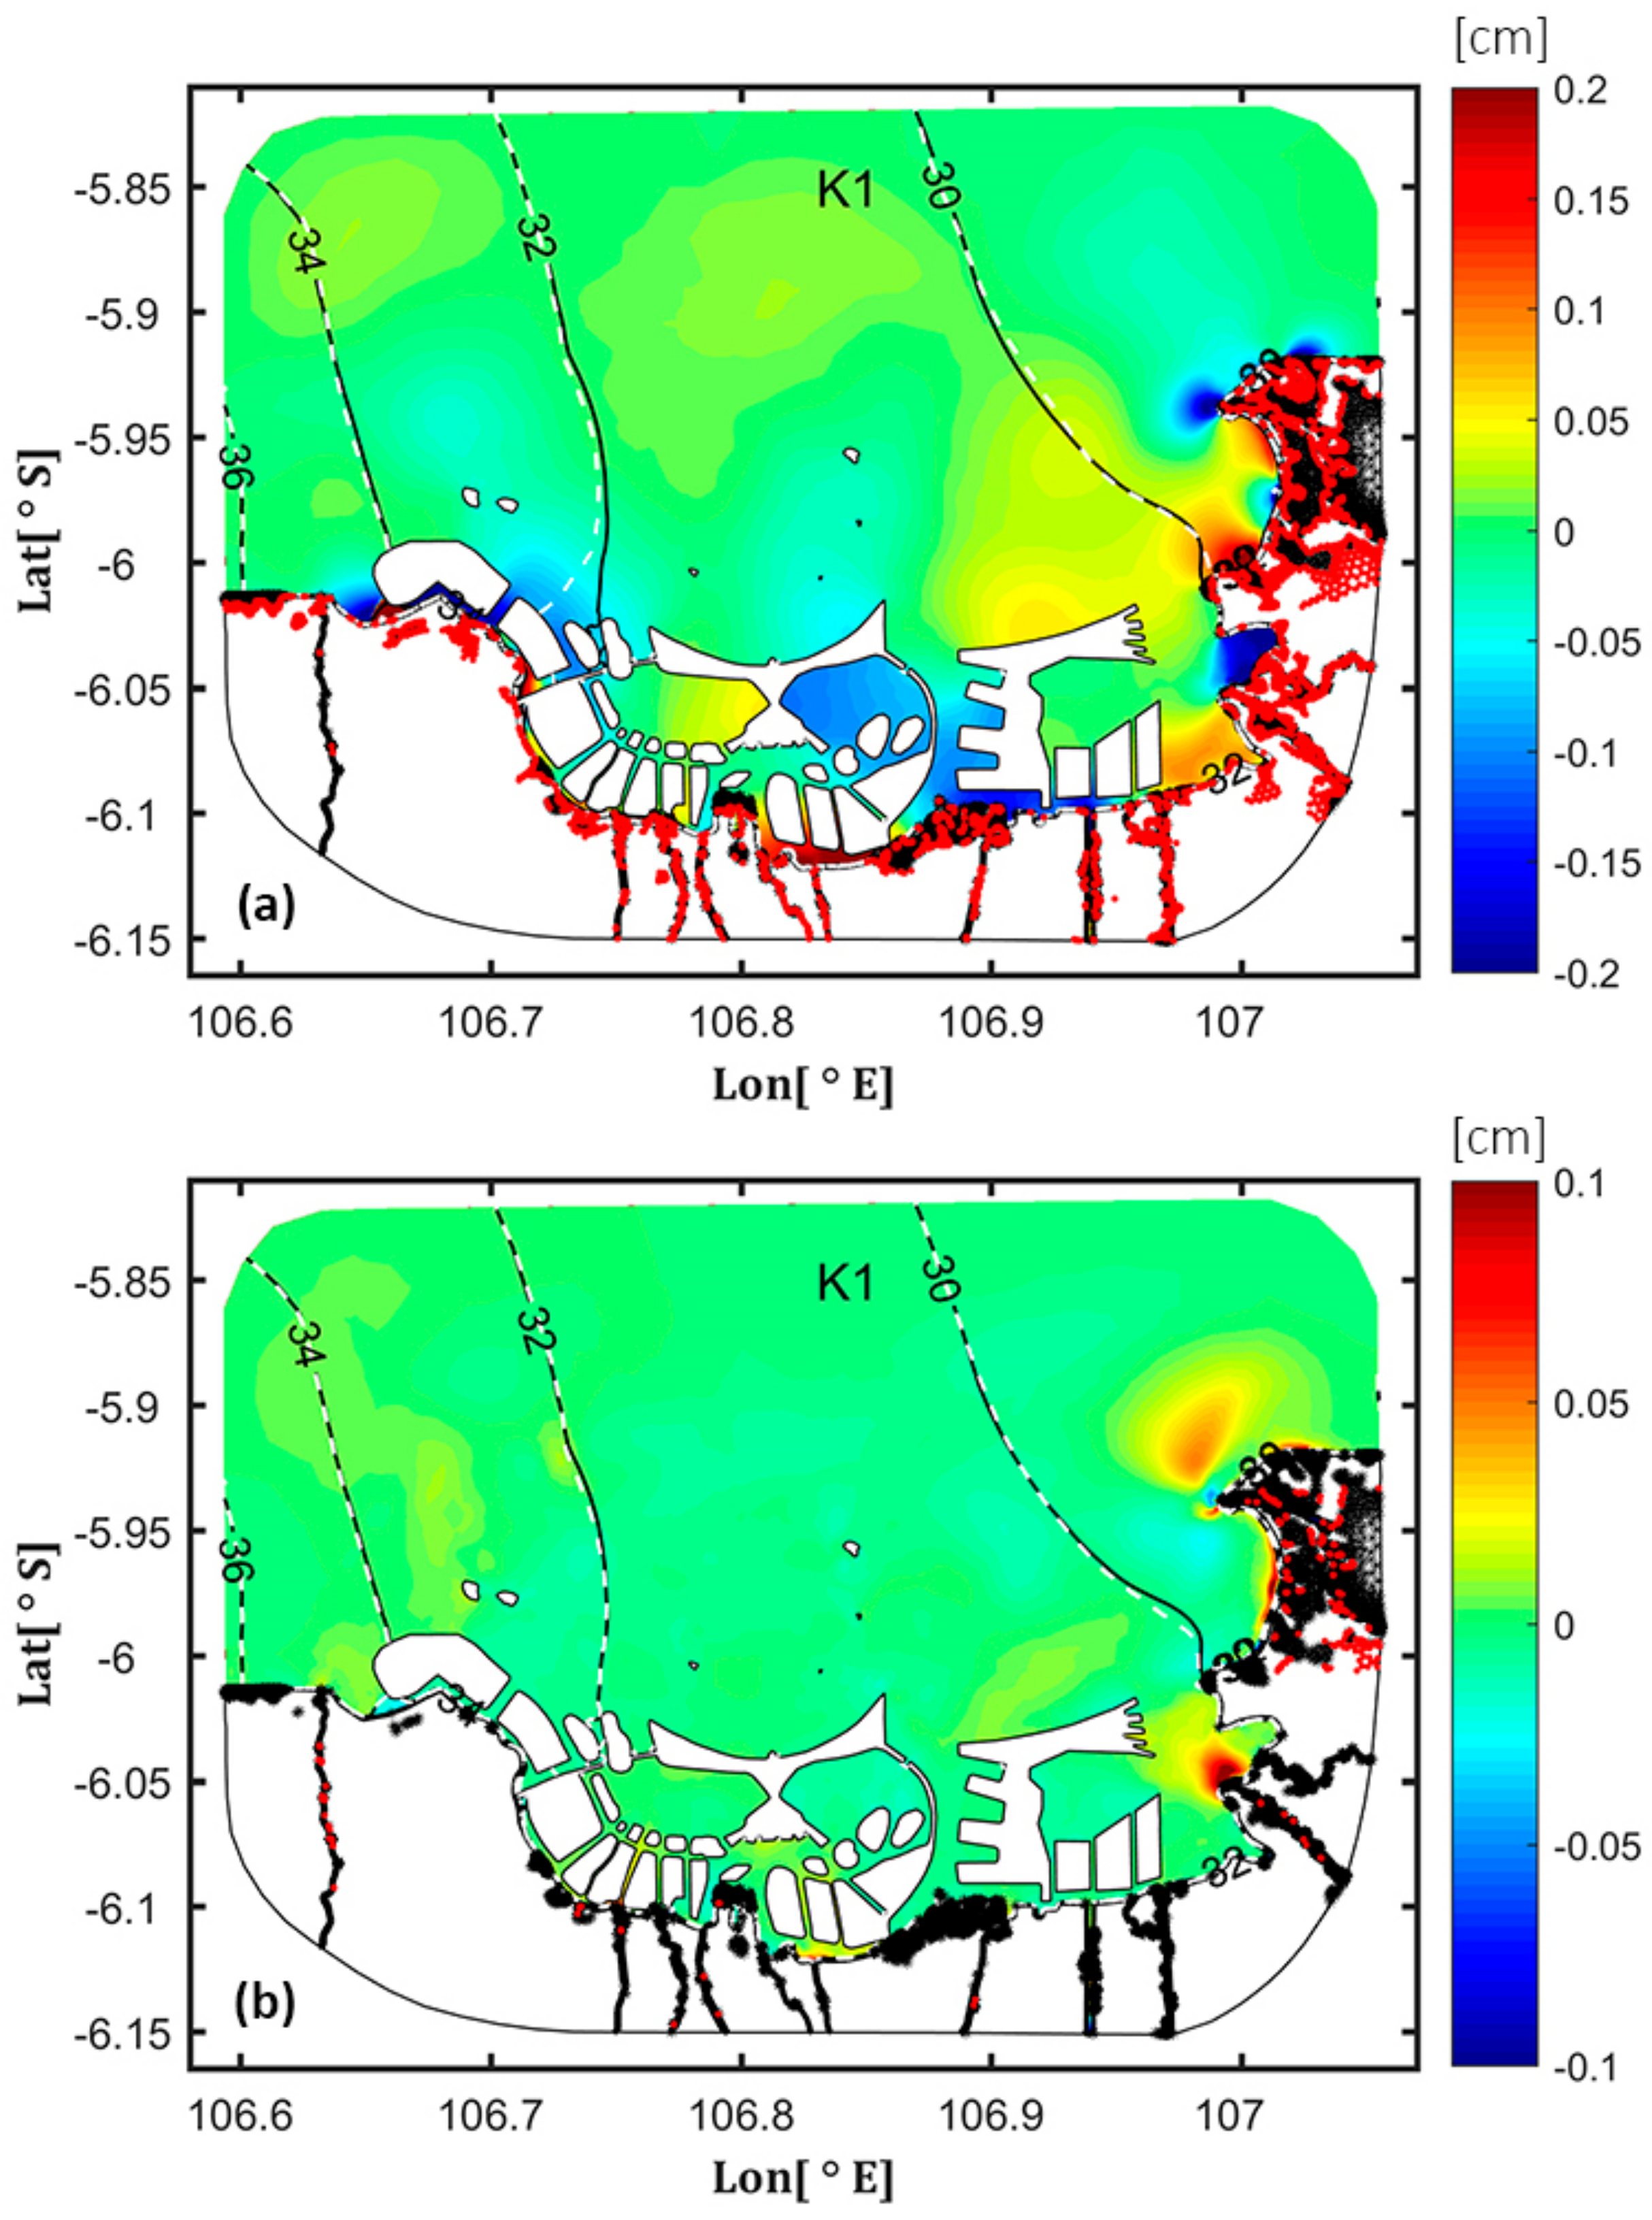
Changes in tidal amplitudes (cm) and inundation areas (red dots) in Jakarta Bay: (a) K1 tidal component between scenario 4b and scenario 1 and (b) K1 tidal component between scenario 3a and scenario 1. Color contours indicate the changes in amplitude (cm), and the black/white dashed lines indicate the phase change.
Figure 12.
Changes in tidal amplitudes (cm) and inundation areas (red dots) in Jakarta Bay: (a) K1 tidal component between scenario 4b and scenario 1 and (b) K1 tidal component between scenario 3a and scenario 1. Color contours indicate the changes in amplitude (cm), and the black/white dashed lines indicate the phase change.


Table 1.
River discharge in Jakarta Bay based on Wulp et al. (2016) [28]. For rivers location see Figure 3.
| No | Name | Discharge (m3/s) | No | Name | Discharge (m3/s) |
|---|---|---|---|---|---|
| 1 | Cisadane | 36.3 | 8 | Cakung | 0.2 |
| 2 | Cengkareng | 2.4 | 9 | Blencong | 0.1 |
| 3 | Banjir Kanal Barat | 0.5 | 10 | Banjir Kanal Timur | 0.2 |
| 4 | Muara Angke | 0.1 | 11 | CBL | 16.6 |
| 5 | Muara Baru | 0.1 | 12 | Keramat | 0.8 |
| 6 | Ciliwung | 8.2 | 13 | Citarum | 136.5 |
| 7 | Sunter | 2.7 |
Table 2.
Descriptions of different scenarios for Jakarta Bay. Scenario 1 is the reference scenario before the construction of the GSW and covers the 3–19 June 2015 period.
Table 2.
Descriptions of different scenarios for Jakarta Bay. Scenario 1 is the reference scenario before the construction of the GSW and covers the 3–19 June 2015 period.
| Scenarios | Descriptions |
|---|---|
| 1 | Jakarta Bay without GSW (reference scenario) |
| 1a | With 1.5 times mean river discharge based on scenario 1 |
| 1b | With 10 times mean river discharge based on scenario 1 |
| 2a | Sea level +25 cm based on scenario 1 |
| 2b | Sea level +60 cm based on scenario 1 |
| 3 | Add the GSW based on scenario 1 |
| 3a | With 1.5 times mean river discharge based on scenario 3 |
| 3b | With 10 times mean river discharge based on scenario 3 |
| 4a | Sea level +25 cm based on scenario 3 |
| 4b | Sea level +60 cm based on scenario 3 |
Table 3.
Flooding areas of Jakarta Bay due to sea level rise and river discharge.
| Scenarios | Flooding Area (without GSW, km2) | Scenarios | Flooding Area (with GSW, km2) |
|---|---|---|---|
| 1 | 32.36 | 3 | 33.47 |
| 1a | 33.88 | 3a | 36.7 |
| 1b | 58.52 | 3b | 420.13 |
| 2a | 43.37 | 4a | 44.05 |
| 2b | 62.04 | 4b | 63.56 |
© 2019 by the authors. Licensee MDPI, Basel, Switzerland. This article is an open access article distributed under the terms and conditions of the Creative Commons Attribution (CC BY) license (http://creativecommons.org/licenses/by/4.0/).
Share and Cite
MDPI and ACS Style
Yahya Surya, M.; He, Z.; Xia, Y.; Li, L. Impacts of Sea Level Rise and River Discharge on the Hydrodynamics Characteristics of Jakarta Bay (Indonesia). Water 2019, 11, 1384. https://doi.org/10.3390/w11071384
AMA Style
Yahya Surya M, He Z, Xia Y, Li L. Impacts of Sea Level Rise and River Discharge on the Hydrodynamics Characteristics of Jakarta Bay (Indonesia). Water. 2019; 11(7):1384. https://doi.org/10.3390/w11071384
Chicago/Turabian StyleYahya Surya, Martin, Zhiguo He, Yuezhang Xia, and Li Li. 2019. "Impacts of Sea Level Rise and River Discharge on the Hydrodynamics Characteristics of Jakarta Bay (Indonesia)" Water 11, no. 7: 1384. https://doi.org/10.3390/w11071384
Note that from the first issue of 2016, this journal uses article numbers instead of page numbers. See further details here.