Article

Development of a Combined Aerobic–Anoxic and Methane Oxidation Bioreactor System Using Mixed Methanotrophs and Biogas for Wastewater Denitrification

1
Department of Land, Water and Environment Research, Korea Institute of Civil Engineering and Building Technology, 283, Goyang-daero, Ilsanseo-gu, Goyang-si, Gyeonggi-do 10223, Korea
2
Department of Construction Environment Engineering, University of Science and Technology, 217, Gajeong-ro, Yuseong-gu, Daejeon 34113, Korea
*
Author to whom correspondence should be addressed.
Water 2019, 11(7), 1377; https://doi.org/10.3390/w11071377
Submission received: 28 May 2019 / Revised: 24 June 2019 / Accepted: 2 July 2019 / Published: 4 July 2019
(This article belongs to the Special Issue Water Quality Engineering and Wastewater Treatment)

Abstract

:
We developed a lab-scale aerobic–methane oxidation bioreactor (MOB)–anoxic system, combining a MOB and the aerobic–anoxic denitrification process, and evaluated its potential for advanced nitrogen treatment in wastewater treatment plants (WWTPs). The MOB used biogas generated from a WWTP and secondary-treated wastewater to support mixed methanotroph cultures, which mediated the simultaneous direct denitrification by methanotrophs and methanol production necessary for denitrifying bacteria in the anoxic chamber for denitrification. Compared to the aerobic–anoxic process, the aerobic–MOB–anoxic system with an influent concentration of 4.8 L·day−1 showed a marked increase in the reduction efficiency for total nitrogen (41.9% vs. 85.9%) and PO4−3-P (41.1% vs. 69.5%). However, the integrated actions of high nitrogen and phosphorus consumption are required for methanotroph growth, as well as the production and supply of methanol as a carbon source for denitrification and methane monooxygenase-mediated oxidation of NH3 into N2O by methanotrophs. After three months of continuous operation using actual wastewater, the total nitrogen removal rate was 76.3%, equivalent to the rate observed in a tertiary-advanced WWTP, while the total phosphorus removal rate reached 83.7%.

1. Introduction

Methanotrophic bacteria are capable of removing nitrogen and phosphorus while consuming methane as the substrate in an oxidation reaction to produce methanol. To exploit this characteristic, Mechsner and Hamer [1] used methane as the carbon source for denitrification under aerobic conditions and observed an increase in the nitrate (NO3) removal efficiency. Similarly, Werner and Kayser [2] obtained a high denitrification rate by introducing landfill-derived biogas into various types of wastewater treatment reactors, including a complete mixing reactor, trickling filter, and fluidized bed reactor, and subsequently studied the denitrification properties under aerobic conditions. In addition, the potential for methane-dependent denitrification has been verified based on the findings of laboratory-based reactor experiments [3,4,5]. When ammonia (NH3) is present, methanotrophs oxidize NH3 into NH3OH, and then into N2O as mediated by methane monooxygenase, a methane-oxidizing enzyme that uses NH3 as a cometabolite; this reaction resembles the NH3 oxidation pathway mediated by ammonia-oxidizing bacteria [6,7].
With the aim of improving the standard activated sludge process in wastewater treatment plants (WWTPs), Wuhrmann was the first to develop the nitrogen removal process [8]; Ludzack and Ettinger [9] subsequently developed the advanced nitrogen removal process. The difference between these two processes lies in the carbon source for denitrification and the location of the denitrification tank. In Wuhrmann’s process (oxic–anoxic), the denitrification tank is positioned after the aeration tank; as a result, wastewater undergoes removal of organic substances in the aeration tank, and then maintains a long residence time in the denitrification tank for denitrification, which uses organic substances produced upon cell lysis as the carbon source. In the Ludzack–Ettinger process (anoxic–aerobic), the denitrification tank is positioned before the aeration tank and uses the organic substances in the influent wastewater as the carbon source for denitrification; then, the wastewater that has undergone nitrification in the aeration tank is transferred to the denitrification tank as return sludge. For nitrogen removal, the Wuhrmann process requires a retention time of at least 8 h in the denitrification tank; this led to commercialization failure due to the generation of NH3-N and increase in the turbidity of the effluent. In the case of the Ludzack–Ettinger process, the nitrogen removal efficiency is very low, using only the return sludge sent from the secondary settling tank to the denitrification tank.
To date, most studies on the use of methanotrophs for methanol production have used NO3 mineral salts (NMS) medium [10], allowing the study of single species of type II methanotrophs [11,12]. Thus, previous studies of methanol production were conducted under limited, controlled laboratory conditions using only single methanotrophic species and pure methane. To ensure the economic feasibility of using methanotrophs for methanol production, the following issues must be resolved: (i) the need for a source of culture that can replace high-cost sources, such as those cultured in NMS medium; (ii) the practical difficulty of maintaining single-species cultures; and (iii) the cost of methane purification. A previous study [13] verified the potential for producing biomethanol using mixed methanotroph cultures in lieu of single methanotrophic species, as well as for using biogas instead of pure methane. Based on those results, in the present study, we developed and evaluated a process that directly produces methanol as the carbon source for denitrification in WWTPs. We used biogas generated from a WWTP and secondary-treated wastewater as the direct sources of the mixed methanotroph culture and designed a methane oxidation bioreactor (MOB) that could mediate direct denitrification by methanotrophs simultaneously with the production of methanol required for denitrifying bacteria and the anoxic process for denitrification. To combine the MOB with the denitrification process, a novel treatment system (aerobic–MOB–anoxic process) was developed, and its potential as an advanced wastewater treatment technology was verified in a lab-scale reactor.

2. Materials and Methods

2.1. Methanotrophs and Activated Sludge

The methane-oxidizing bacteria used in this study comprised a mixture of methanotrophic species cultured in a previous study [13], in which Methylomonas methanica, Methylococcus capsulatus, Methylococcus bovis, and Methylobacter marinus were the dominant species. The activated sludge used in the water treatment process was collected from the aeration tank of the Terminal Wastewater Treatment Plant in Ilsan, Goyang-si, Korea.

2.2. Methanotroph Culture Solution

The mixed methanotroph culture in the developed system was maintained using secondary-treated wastewater collected from the Terminal Wastewater Treatment Plant (Ilsan, Korea). The Terminal Wastewater Treatment Plant in Ilsan has a treatment capacity of 270,000 m3∙day−1 and runs a tertiary advanced treatment facility for nitrogen and phosphorus removal. Table 1 shows the characteristics of the source water for the wastewater used in the unit batch test and the secondary-treated water used as the effluent of the secondary settling tank. All samples were stored in a refrigerator at 4 °C for subsequent use.

2.3. Biogas Source

Biogas discharged from the anaerobic sludge digestor in the Terminal Wastewater Treatment Plant (Ilsan, Korea) was used in the experiment. The biogas was composed of CH4 (67.7%), CO2 (30.3%), N2 (1.4%), and O2 (0.6%). It was collected and stored using a 4.9 L high-pressure gas tank (GlobalGastec, Ltd., Buchun, Korea).

2.4. Analysis and Measurements

For the biogas (CH4, CO2, N2, and O2) analysis, the methane content in the serum bottle headspace was measured using a gas chromatographer (HP Agilent 6890A; Santa Clara, CA, USA) equipped with a packed column (GS-GASPRO; 30 m × 0.32 mm) and flame ionization detector (FID). The conditions were as follows: an inlet temperature of 100 °C, oven temperature of 50 °C (for 3 min), and detector temperature of 200 °C; He as the carrier gas; and the flow rate of to 1.2 mL min−1 with a split ratio of 20:1.
For the methanol analysis, a gas chromatographer (HP Agilent 6890A; head space G1888) equipped with a packed column (INNOWAX 30 m × 0.25 mm × 0.25 μm) and a FID was used. The conditions were an oven temperature of 50 °C (5 min), which was raised to 250 °C (for 3 min), and a detector temperature of 250 °C, using N2 as the carrier gas and setting the flow rate to 1.2 mL min−1 with a split ratio of 10:1.
For the formaldehyde analysis, high-performance liquid chromatography (HPLC; Agilent 1100 series) with a column (Eclipse XDB-C18; 5 µm, 4.6 × 150 mm) was used. The mobile phases were mobile A (D.W 100%) and mobile B (ACN 100%), with a mobile flow of 1.5 mL/min, eluent A:B of 50:50, runtime of 38 min, and detection wavelength of 360 nm.
To measure the extracellular polymeric substances (EPS; bound EPS located close to the cells of microorganisms) in the microbial sludge, the samples were centrifuged (Centrifuge-416; Dongseo Science, Ltd., Dangjin, Korea) at 2700× g. Then, the protein was analyzed using the Lowry method, i.e., measured via absorbance at 750 nm with a bovine serum albumin standard for quantification [14]. In addition, polysaccharide was analyzed using the phenol–sulfuric acid method and measured as the absorbance at 490 nm, using a glucose standard for quantification [15,16].
For the microbiological analysis, DNA extraction, polymerase chain reaction (PCR) amplification, and pyrosequencing were performed by ChunLab, Inc. (Seoul, Korea). The 16S rRNA genes for each sample were amplified using barcoded universal primers.
Analyses of water quality and components of treated wastewater (TWW) were based on the American Standard Methods for the Examination of Water and Wastewater and Environmental Protection Agency (EPA) Methods (EPA Method 1613).

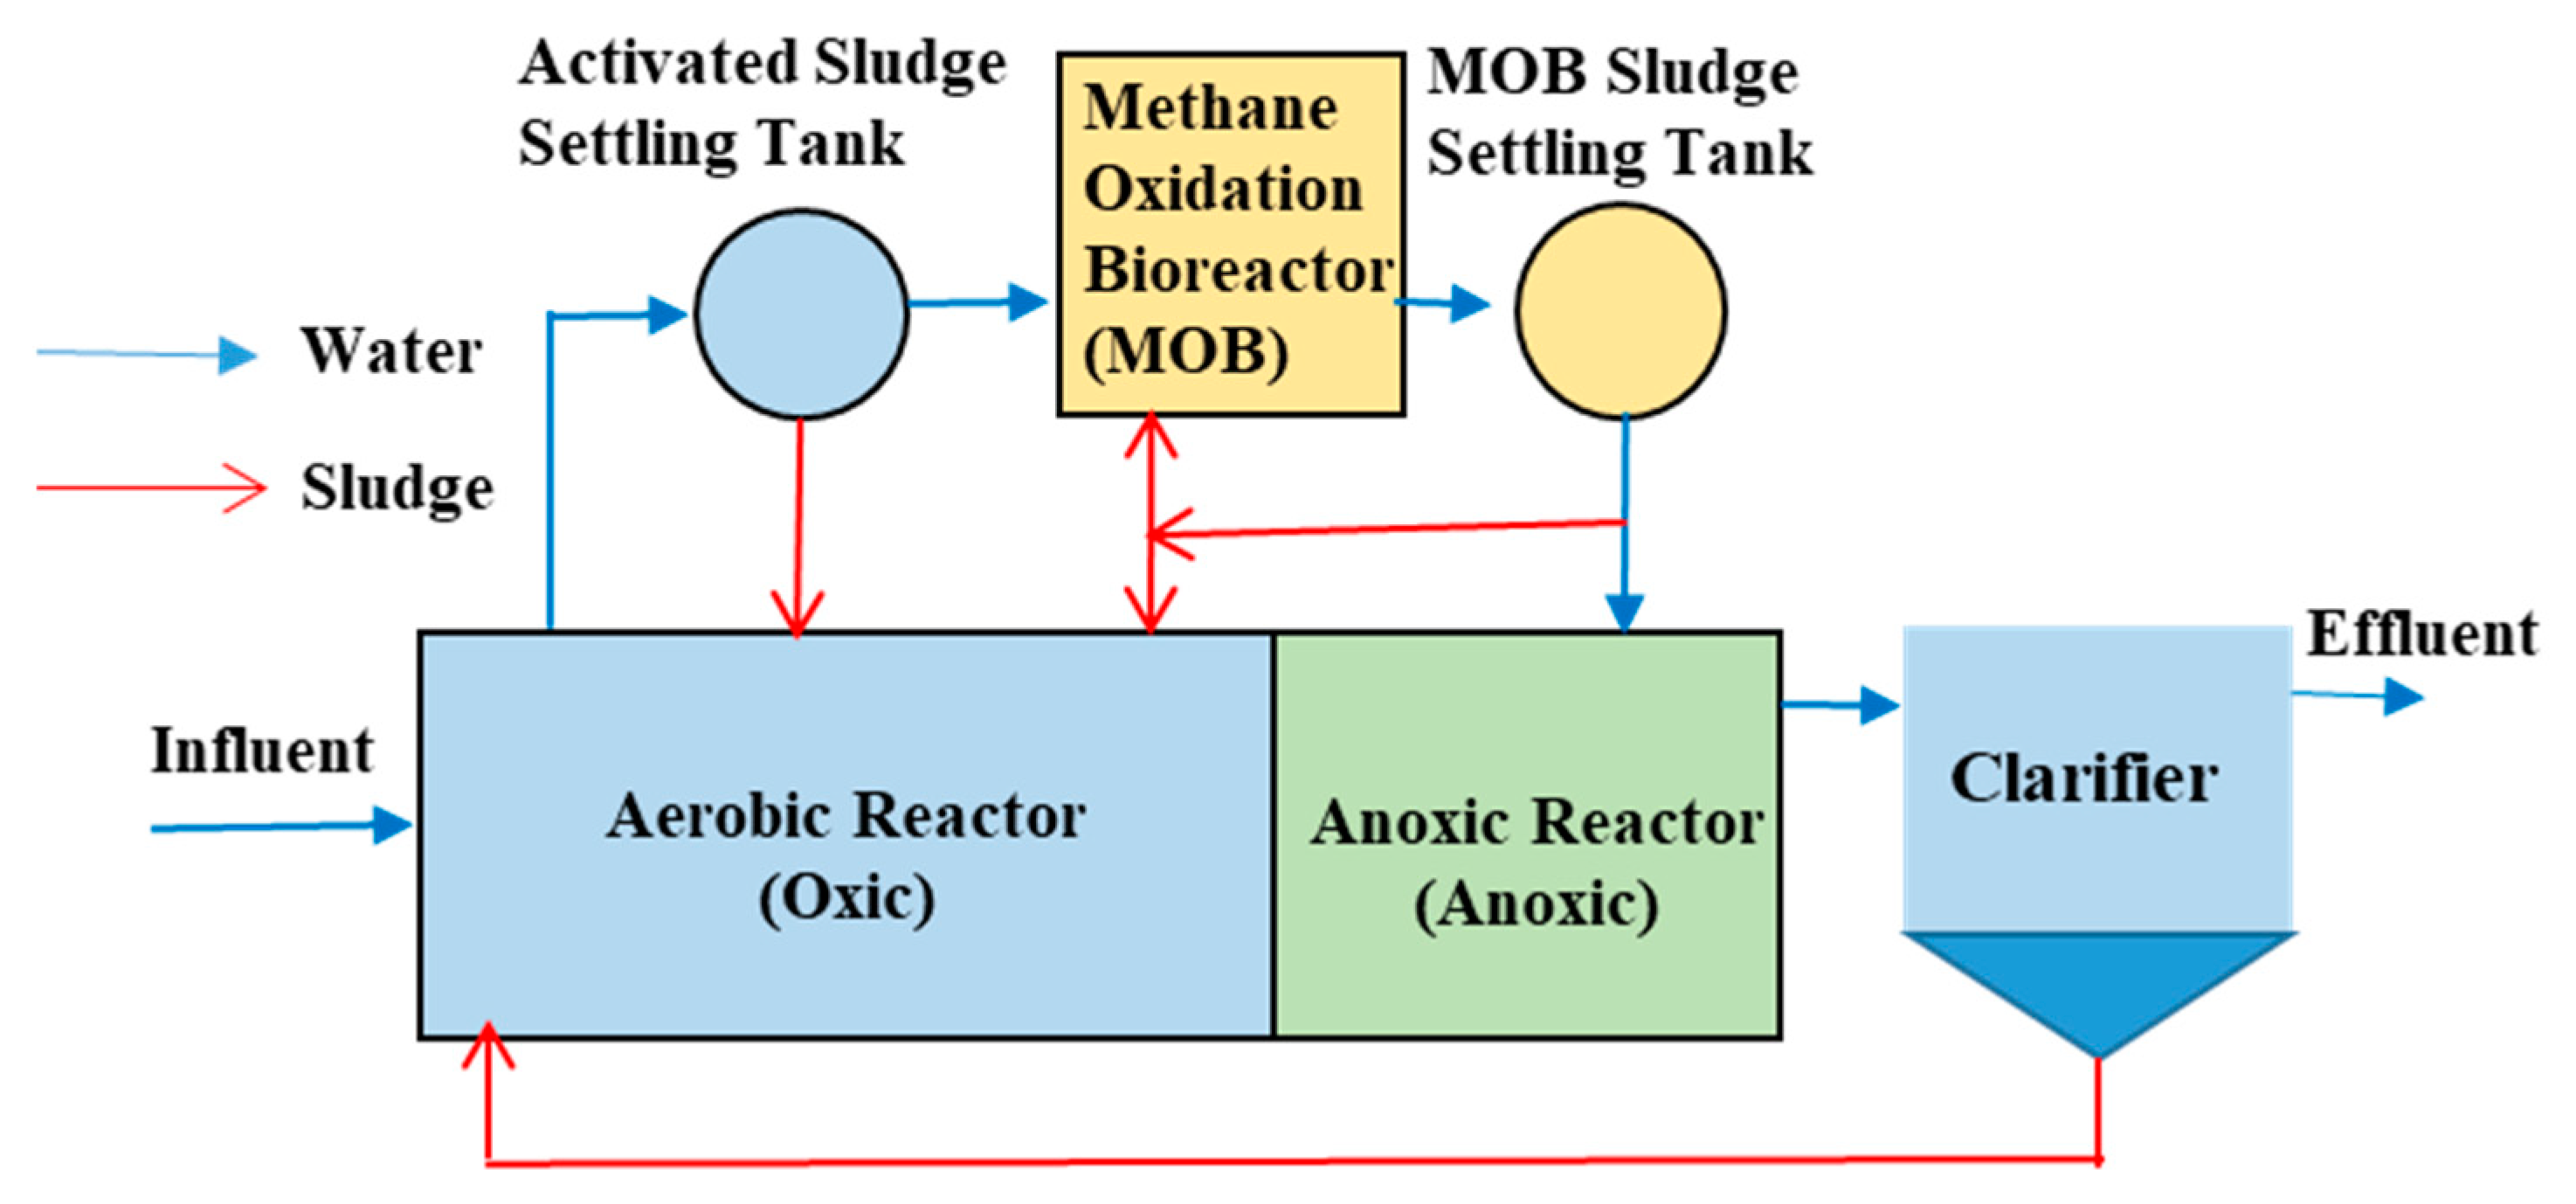
2.5. Treatment Process Composition

For the batch test to examine the characteristics of methanol production and changes in nutritive salts in the secondary-treated wastewater mediated by methanotrophs, a 160 mL serum bottle was filled with secondary-treated water inoculated with 50 mL of methanotroph culture, after which 25 mL (22.7%) of the 110 mL headspace was substituted with biogas to adjust the O2, CH4, and CO2 contents to 17.8 mL, 16.9 mL, and 7.4 mL, respectively.
The newly developed combined MOB and aerobic–anoxic reactor (aerobic–MOB–anoxic reactor) for nitrogen and phosphorus removal was designed as shown in Figure 1. The biogas and oxygen consumed in the MOB were injected automatically from a gas tank based on input by a pressure sensor. During the biological process of nitrogen removal in aerobic–anoxic reactors, organic substance removal and nitrification occur in the aerobic reactor, whereas NO3 denitrification occurs in the anaerobic reactor. In our system, the carbon source for denitrification in the anaerobic reactor was supplied by the effluent containing methanol produced by the MOB. Table 2 presents the operation conditions for the combined aerobic–MOB–anoxic process.
Following primary settling of effluent from the aerobic reactor, the supernatant was transferred to the MOB, and the settled sludge was returned to the aerobic reactor. The MOB effluent underwent another round of settling, after which the supernatant was transferred to the anaerobic reactor. The produced methanol was settled in the anaerobic reactor without a carbon source to enhance the nitrogen removal efficiency, while the settled sludge was returned to maintain the mixed liquor suspended solids (MLSS) content of the MOB at 1000–1200 mg·L−1 and residual sludge was sent to the aerobic reactor.
The settling time for the activated sludge settling tank and the sludge settling tank in the MOB were 50 min and 10 min, respectively, as determined based on an analysis of the sludge settling characteristics (see Section 3.3). In the aerobic reactor receiving 24 L·day−1 wastewater collected from the influent of the target WWTP, an air stone was used to supply air to enable an adequate supply of dissolved oxygen (DO) in the sludge mixture, while an aerator operating at approximately 150 rpm was installed in the anaerobic reactor to maintain the anaerobic condition. The settled sludge in the final settling tank was returned to the aerobic reactor at 0.5 Q (Q: influent concentration), while the hydraulic retention time (HRT) was set as 6 h and the solids retention time was set as 25 days. The effluent of the aerobic reactor was delivered to the MOB, and after a 3 h reaction (HRT 3 h), the supernatant was returned to the anaerobic reactor at 0.1 Q or 0.2 Q. The MOB including an aerator, a gas supplier, and a pressure gauge was operated at 150 rpm, while biogas was supplied to maintain 25% (v/v) of the headspace. The mixed liquor suspended solids (MLSS) contents of the reactors were 2300–2400 mg·L−1 for the anaerobic reactor, 2200–2300 mg·L−1 for the aerobic reactor, and 1000–1200 mg·L−1 for the MOB. All experiments were conducted in the laboratory at 20–25 °C.

3. Results and Discussion

3.1. Methanol Production in the MOB and Characteristics of Nitrogen and Phosphorus Removal

Table 3 presents the methanol and formaldehyde production results using activated sludge or mixed methanotrophs in biogas and secondary-treated wastewater. With an MLSS concentration of 520 mg·L−1, 12.13 mg·L−1 (chemical oxygen demand (COD) conversion value 18.20 mg·L−1) and 35.23 mg·L−1 (COD conversion value 52.85 mg·L−1) of methanol were produced after 1 h and 3 h of culturing, respectively. Meanwhile, 0.34 mg·L−1 (COD conversion value 0.36 mg·L−1) and 1.74 mg·L−1 (COD conversion value 1.86 mg·L−1) of formaldehyde were produced after 1 h and 3 h of culturing, respectively. In comparison, substantially less methanol and formaldehyde were produced when activated sludge was used in other identical conditions (i.e., MLSS concentration 520 mg·L−1, culture time).
After 3 h of culturing, the secondary-treated wastewater of the MOB showed a substantial increase in COD, from the initial concentration of 12.42 mg·L−1 to 59.84 mg·L−1 due to methanol production (Table 4). In contrast, the NH3-N and NO3-N concentrations in the secondary-treated wastewater were drastically reduced by 87.1% and 92.0%, respectively, through the nitrogen-assimilating action of methanotrophs. Furthermore, the PO4−3-P concentration was reduced by 63.1% compared to the initial concentration (Table 4).
Anthony [17] explained such a reduction in nitrogen based on the fact that methanotrophs have a relatively high nitrogen demand during the growth phase, whereby 0.25 mol of nitrogen is consumed to assimilate 1 mol of carbon using methane. This is distinguished from the denitrification mechanism. Herein, methanol is used as the carbon source by methylotrophs and common denitrifying bacteria, as the two mechanisms are assumed to occur concurrently for nitrogen removal via methanotroph-mediated nitrogen assimilation.
Analyzing the nitrogen and phosphorus contents in sludge revealed a higher average total nitrogen (TN) content in the methanotroph sludge (8.53%) than in the activated sludge (5.34%). Similarly, the average total phosphorus (TP) content was much higher in methanotroph sludge (7.8%) than in activated sludge (1.6%). Trotsenko et al. [18] explained that the high phosphorus removal rate in a MOB and higher phosphorus content in methanotroph sludge than activated sludge, as shown in this study, was the result of a high level of intracellular inorganic pyrophosphate (5 mM) in methanotrophs, despite the low level of Adenosine triphosphate (ATP) (0.5 mM).

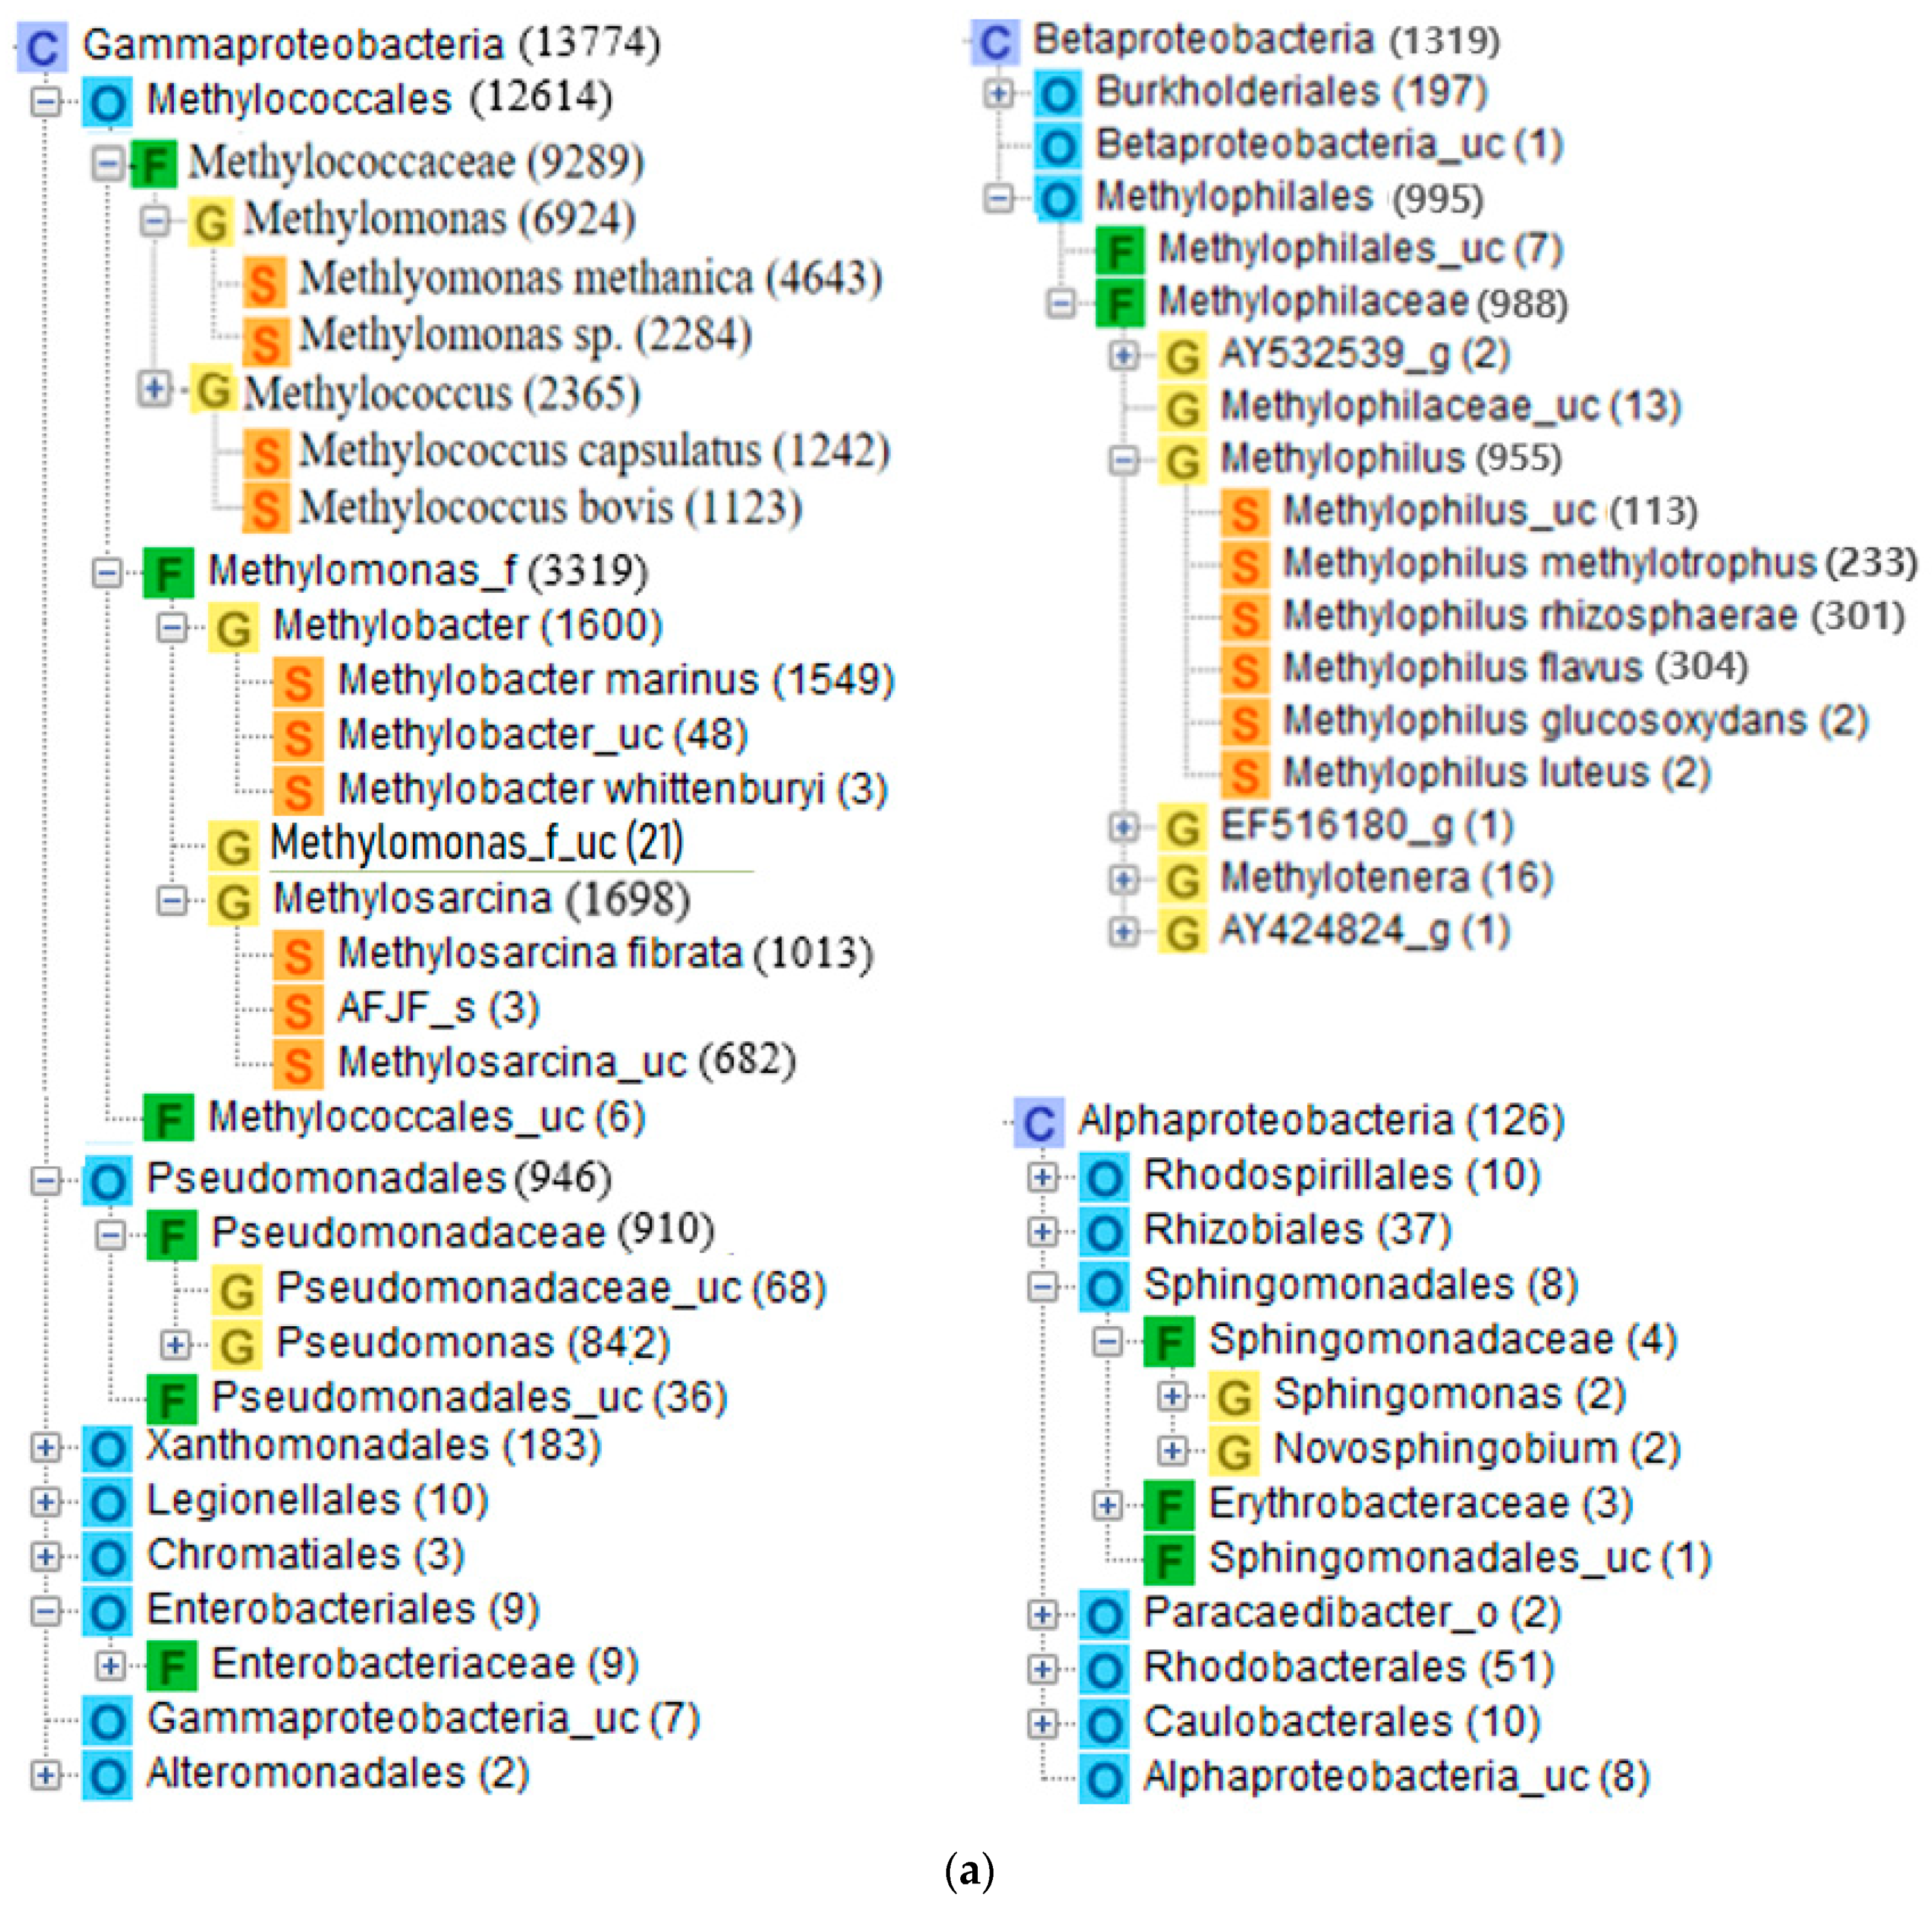
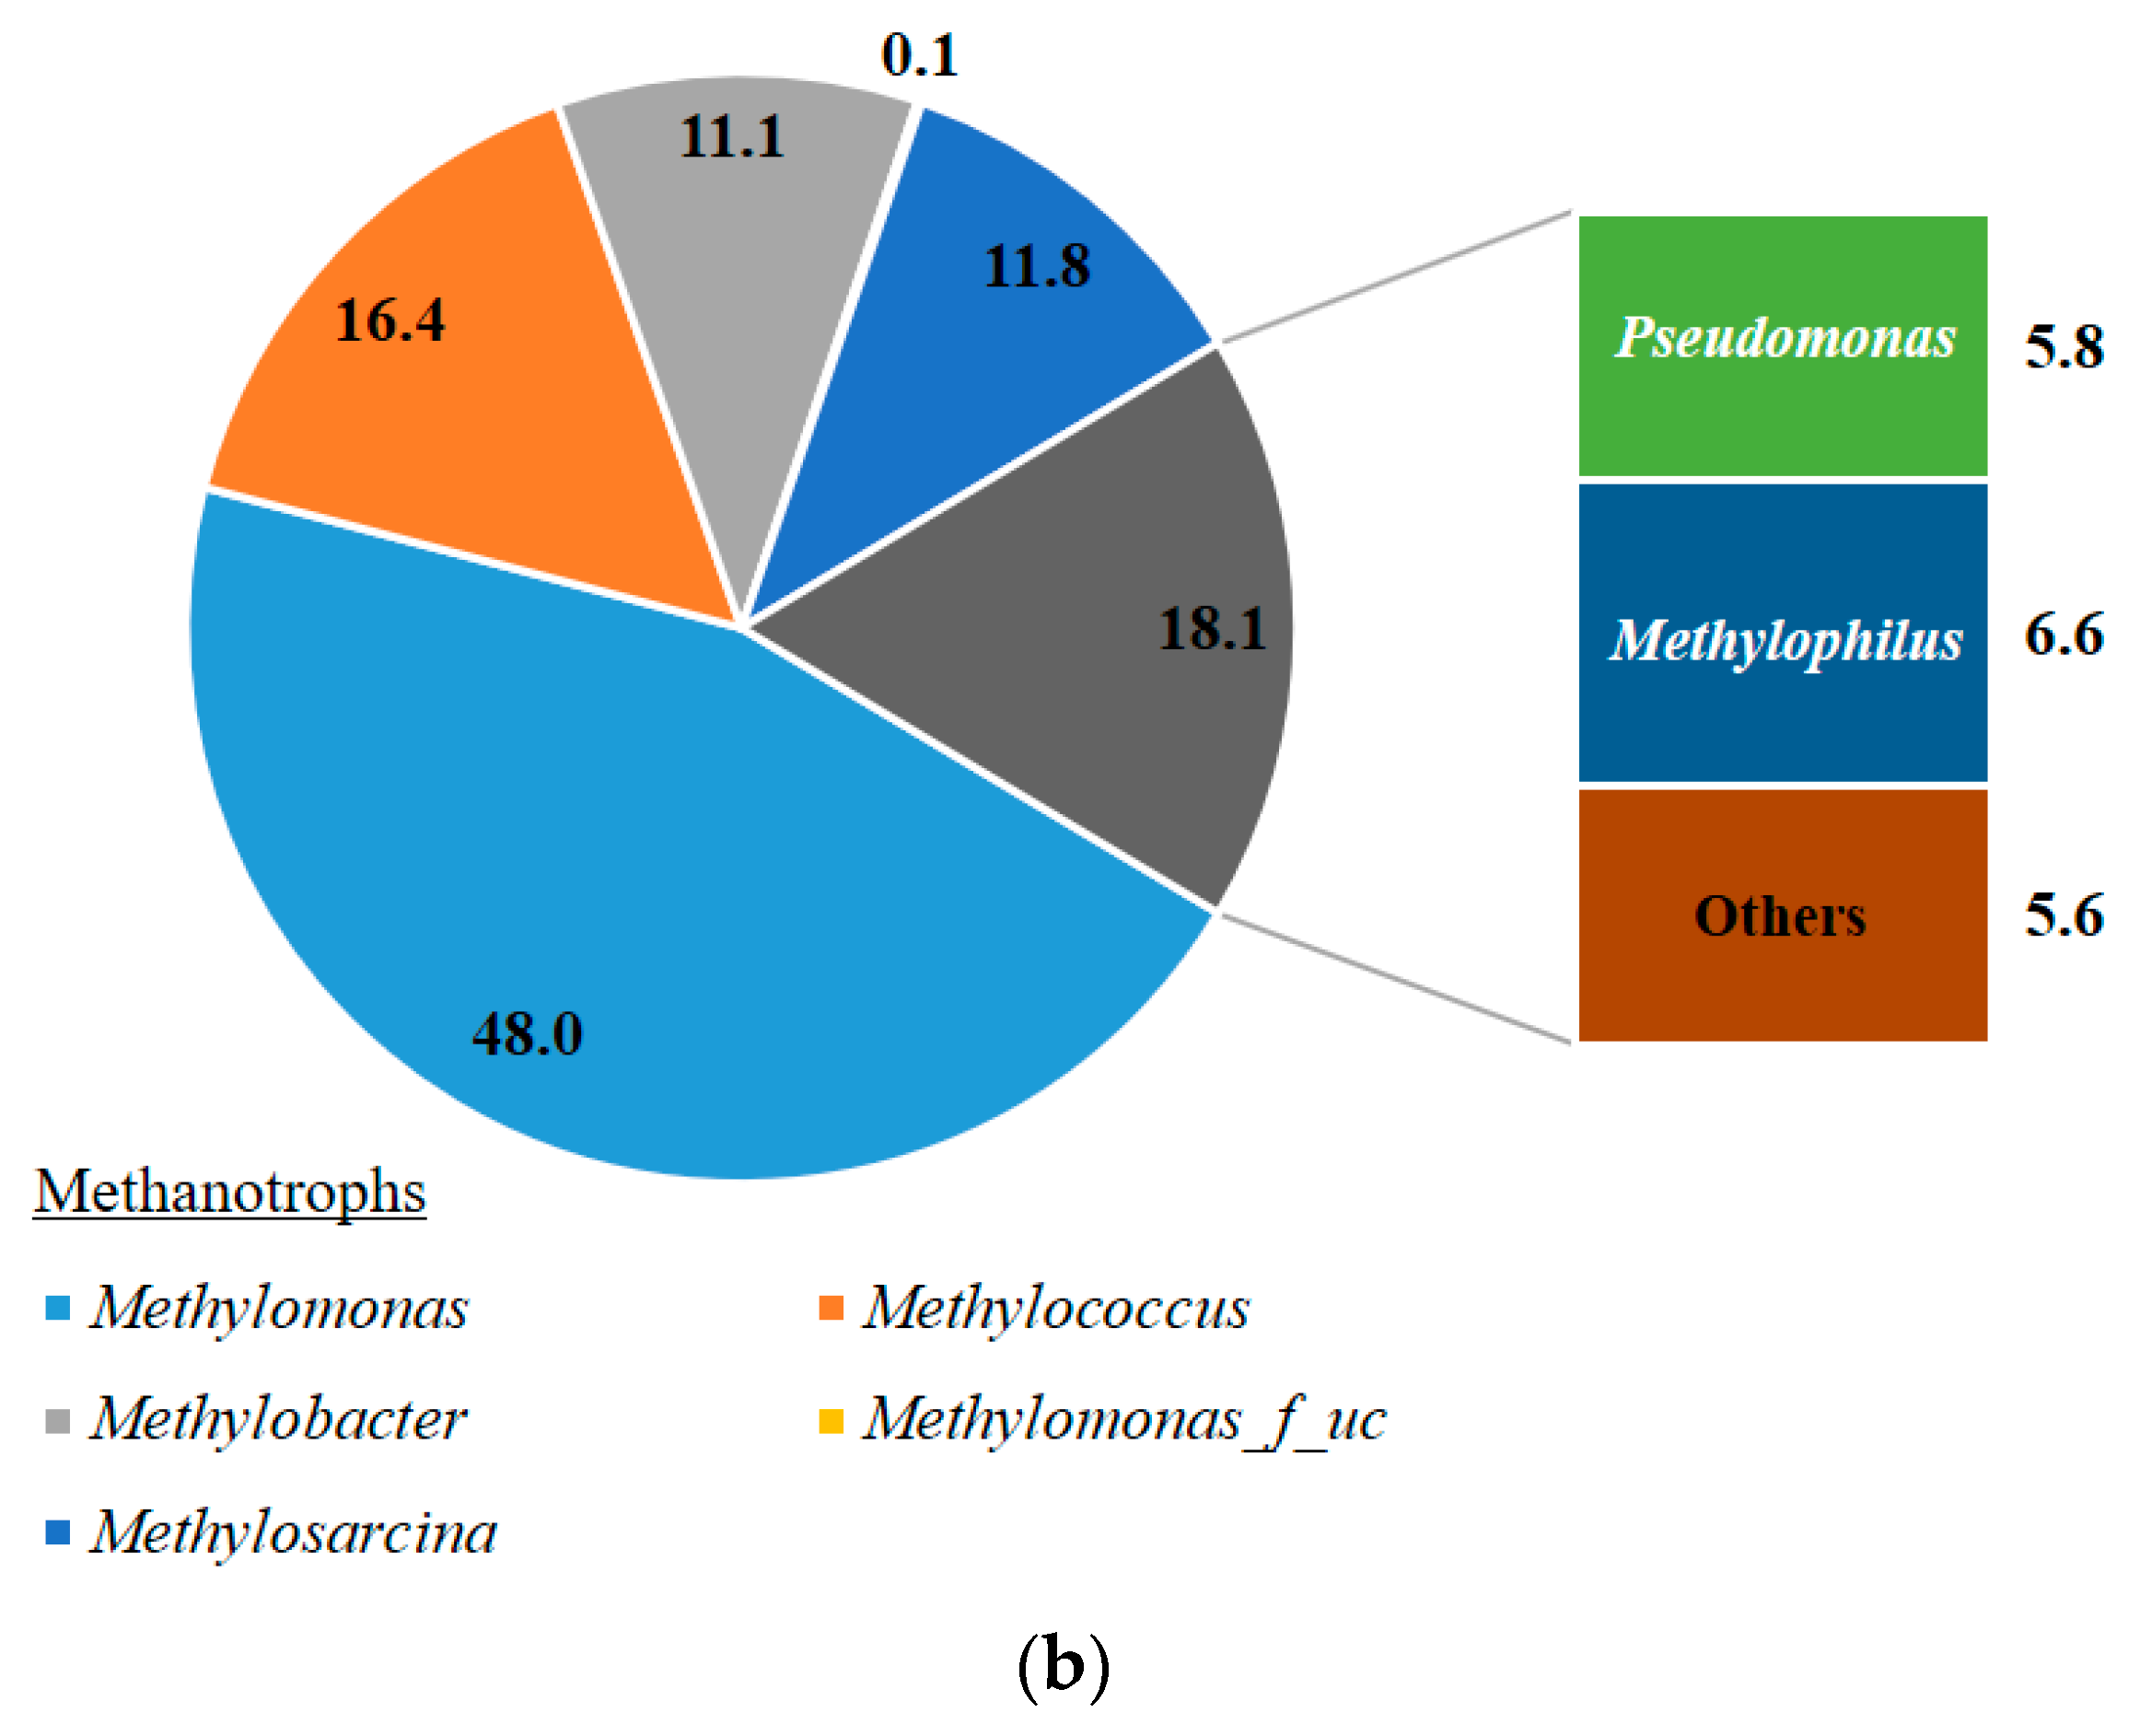
3.2. Microbial Consortium in the MOB

The microbial consortium of the bacterial sludge in the MOB was comprised of 81.9% methanotrophs, predominated by the genera Methylomonas, Methylococcus, Methylomonas_f_uc, Methylobacter, and Methylosarcina. Among them, Methylomonas was most abundant (48%). Meanwhile, nonmethanotrophic bacterial strains in the genera Pseudomonas (5.8%) and Methylophilus (6.6%) were relatively abundant (Figure 2). Pseudomonas is commonly found in the activated sludge of WWTPs and is mainly isolated from activated sludge for cultures [19,20,21].
In the MOB sludge, Methylophilus was detected in relatively high proportions as a denitrification bacterium when methanol was used as the substrate, and disappeared from the microbial consortium once methanol was depleted. To this end, Osaka et al. [22] discovered an association with Methylophilus and Methylobacillus of the family Methylophilaceae and the methanol-assimilating denitrification activity of the genus Aminomonas using a stable-isotope probing method. Because Methylophilus falvus also oxidizes methanol into formaldehyde using pyrroloquinoline quinone-linked methanol dehydrogenase (PQQ-MDH) [23], the denitrification reaction also occurs, and the Methylophilus genome only encodes assimilatory denitrification reactions [24]. Methylophilus flavus, which was clearly shown to coexist in the present study, is an obligate methanol-using gram-negative bacterium and a strict aerobic bacterium [23]. The bacterium converts methanol into formaldehyde using PQQ-MDH and employs NO3 and NH3 compounds as the carbon source, while assimilating methanol via the ribulose monophosphate pathway. Another dominant strain, Methylophilus rhizosphaerae, is also a strictly aerobic gram-negative bacterium that displays an identical mechanism [25].

3.3. Sedimentation Properties of the Methanotrophic Microbial Consortium

Water treatment processes require a sedimentation step to separate treated water and microorganisms. Thus, the sedimentation properties of the MOB sludge were comparatively analyzed with activated sludge in a 1000 mL graduated cylinder. Complete sedimentation of MOB sludge occurred within 5 min (Figure 3), which would require a settling tank retention time of 10 min. By contrast, the activated sludge settling tank retention time would need to be 50 min due to the slow rate of sedimentation of activated sludge.
The characteristic of rapid sedimentation brought by MOB sludge was determined by a much higher EPS content than activated sludge (Table 5), resulting in larger particle size in MOB sludge (742 μm) than in activated sludge (107 μm).

3.4. Denitrification Efficiency

3.4.1. Aerobic–Anoxic Process

Table 6 presents the characteristics of the aerobic–anoxic process in removing organic substances, nitrogen, and phosphorus using actual WWTP influent compared with the effluent from a general activated sludge process. In the case of the aerobic–anoxic process, the influent COD was 106.3 mg·L−1, which was reduced to 11.5 mg·L−1 in the aerobic reactor and 11.4 mg·L−1 in the anaerobic reactor, resulting in a total removal efficiency of 89.5% (i.e., 11.1 mg·L−1 reduction). In the case of the activated sludge process, the COD removal efficiency was 75.2%. In the aerobic–anoxic process, the influent NH3-N concentration was 17.2 mg·L−1, of which 96.0% was removed (effluent concentration 0.68 mg·L−1) due to the complete nitrification in the aerobic reactor that had been maintained at a DO concentration of 1.5–1.8 mg·L−1. In contrast, the activated sludge process resulted in only partial nitrification and discharge of 14.98 mg·L−1 NH3-N. The influent NO3-N concentration was 1.6 mg·L−1 in the aerobic–anoxic process, which increased to 10.6 mg·L−1 in the aerobic reactor due to nitrification, and then decreased to a final concentration of 9.9 mg·L−1 in the anaerobic reactor, showing negligible removal of NO3-N between these two steps. Although 10.7 mg·L−1 was transferred from the aerobic reactor to the anaerobic reactor, it is presumed that the lack of a carbon source (the theoretical COD requirement was approximately 37 mg·L−1; 2.47 g methanol g−1 NO3-N−1 [26]) prevented the denitrification of NO3-N. Both processes showed nonsignificant removal rates.

3.4.2. Aerobic–MOB–Anoxic Process

In the combined aerobic–MOB–anoxic process, the settled effluent from the aerobic reactor was transferred to the MOB to provide a denitrification source in the anaerobic reactor, at a rate of 0.1 Q (2.4 L·day−1) or 0.2 Q (4.8 L·day−1), which are 10% and 20%, respectively, of the influent flow rate (24 L·day−1). Table 7 presents the experiment results of the inflow to the anaerobic reactor following the methane oxidation reaction mediated by the injection of biogas.
At 0.1 Q (2.4 L·day−1) of influent wastewater from the MOB, the influent COD concentration was 129.3 mg·L−1, which was reduced to 18.1 mg·L−1 in the aerobic reactor and then to 11.9 mg·L−1 in the anaerobic reactor; therefore, the COD concentration in the final treated water was 9.4 mg·L−1 (removal efficiency 92.7%). The influent NH3-N concentration was 27.93 mg·L−1, which was mostly removed in the aerobic reactor through nitrification. Although the NO3-N concentration increased to 23.4 mg·L−1 in the aerobic reactor, it was subsequently reduced to 8.4 mg·L−1. The influent PO4−3-P concentration was 6.49 mg·L−1, but the aerobic and anoxic processes resulted in a final concentration of 3.82 mg·L−1. Although negligible NO3-N was removed in the anaerobic reactor without the MOB-treated water as a carbon source (Table 6), when 0.1 Q MOB effluent was provided to the anaerobic reactor, the TN removal efficiency increased substantially from 41.9% to 71.2%. PO4−3-P showed a similar trend; the reduction efficiency was 12.5% without MOB effluent (Table 6), but was 41.1% when 0.1 Q MOB effluent was supplied (Table 7).
At 0.2 Q (4.8 L·day−1) of MOB effluent, the influent COD concentration of 129.3 mg·L−1 was reduced to 17.8 mg·L−1 in the aerobic reactor and to 11.6 mg·L−1 in the anaerobic reactor; therefore, the final treated water upon discharge had a COD concentration of 9.7 mg·L−1 (Table 7). Nitrification in the aerobic reactor removed most of the 27.93 mg·L−1 of NH3-N, and although NO3-N initially increased to 21.9 mg·L−1 in the aerobic reactor, it was reduced to 5.3 mg·L−1 in the anaerobic reactor, resulting in a final concentration of 4.1 mg·L−1 in the treated water. Compared to the nitrogen removal trend upon the supply of 0.1 Q, the TN removal efficiency was enhanced by 1.2 times upon increasing the proportion of MOB effluent supply to 0.2 Q. Similarly, the influent PO4−3-P concentration was 6.49 mg·L−1, but removal via the aerobic and anoxic processes resulted in a final concentration of 2.0 mg·L−1, showing a 1.7-fold increase in removal efficiency compared to the 0.1 Q condition.

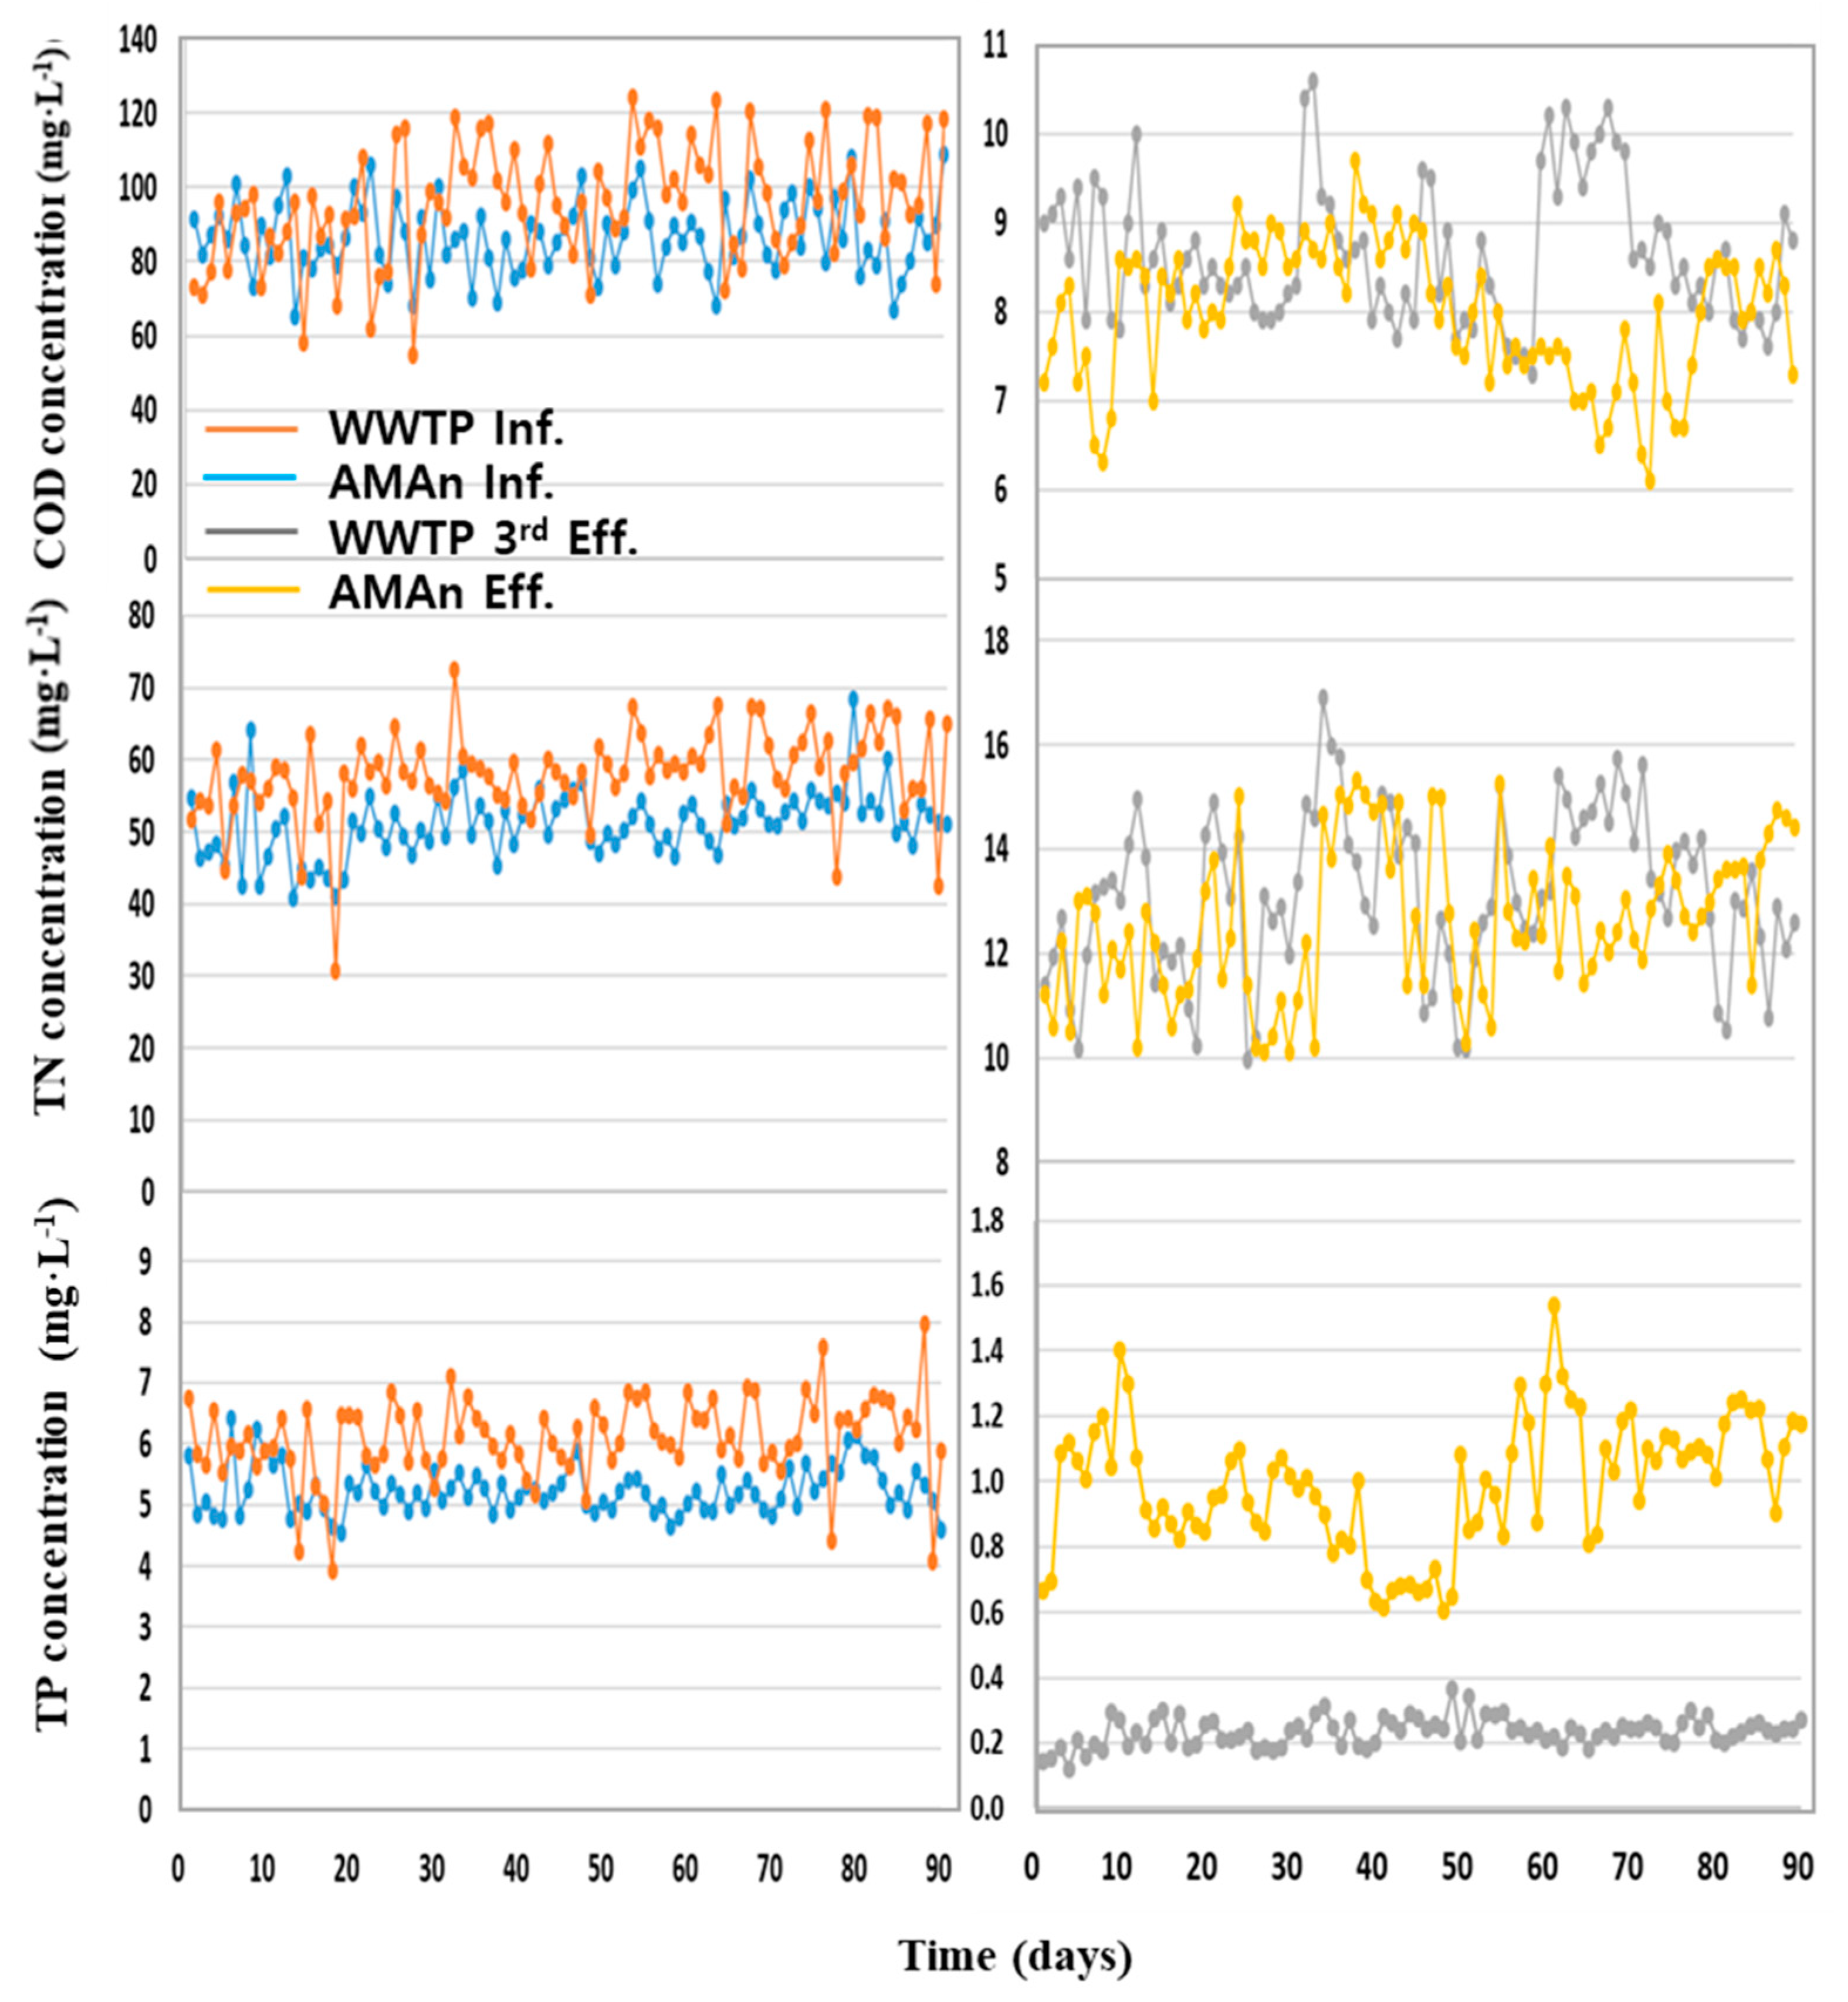
3.4.3. Comparison with a Tertiary Advanced WWTP Facility

The aerobic–MOB–anoxic process developed in this study was operated for three months, and the results were compared with the nutrient removal characteristics of an actual tertiary advanced system in a WWTP using the same wastewater influent. For the tertiary advanced treatment to remove nitrogen and phosphorous, the plant runs a water treatment system based on the modified Ludzack–Ettinger process [9,27] and an ultrarapid coagulation (URC) technique for phosphorus removal via condensation filtration. Figure 4 shows the changes in the composition of wastewater influent and effluent during the three-month operation of the MOB and WWTP.
Compared to the water quality of the WWTP tertiary advanced treatment, the newly developed aerobic–MOB–anoxic process (under the 0.2 Q condition) showed a consistent and similar treatment efficiency with respect to COD and TN removal. In case of TP, the process in this study led to a relatively high removal efficiency of 83.7% (Table 8), even without an additional phosphorus removal system. This is encouraging because the efficiency of the aerobic–MOB–anoxic process was lower than the 95.5% efficiency of the WWTP, which used a separate URC technique for phosphorus removal.

4. Conclusions

We developed a new combined aerobic–MOB–anoxic wastewater treatment system for improved nitrogen and phosphorus removal, and compared the MOB sludge with typical activated sludge and the whole system with a tertiary advanced WWTP using the same wastewater influent. Our system relies on the production of methanol and formaldehyde from biogas and secondary-treated wastewater inoculated with cultured, mixed methanotroph species; the MOB secondary-treated wastewater showed a nearly five-fold increase in COD concentration (to 59.84 mg·L−1) due to methanol production, whereas NH3-N and NO3-N showed substantial reductions of 87.1% and 92.0%, respectively, due to methanotroph-mediated nitrogen assimilation. PO4−3-P also showed a 63.1% reduction (to 0.62 mg·L−1).
Methanotrophs accounted for 81.9% of the microbial consortium of the MOB microbial sludge, including the genera Methylomonas, Methylococcus, Methylomonas_f_uc, Methylobacter, and Methylosarcina; relatively abundant nonmethanotrophs included the genera Pseudomonas and Methylophilus. The MOB sludge had a much higher EPS content (protein concentration 76.8 mg·L−1 vs. 106.2 mg·L−1) and particle size (742 μm vs. 107 μm) than that of activated sludge, leading to much more rapid sedimentation and shorter retention time in a settling tank.
Compared to the aerobic–anoxic process, the aerobic–MOB–anoxic process (applying 0.2 Q of MOB settled effluent to the anoxic tank) led to substantial improvement in TN removal (41.9% vs. 85.9%) and PO4−3-P removal (41.1% vs. 69.5%). After three months of operation with actual wastewater, the aerobic–MOB–anoxic process showed a TN removal rate of 76.3%, similar to that of the tertiary advanced WWTP, as well as an 83.7% phosphorus removal rate.
This study confirmed that the new denitrification system combining an aerobic–anoxic process and methane oxidation bioreactor is applicable as an advanced sewage treatment method.

Author Contributions

Conceptualization, I.-T.K. and Y.-S.Y.; Validation, Y.-E.L. and Y.-S.Y.; Formal Analysis, I.-T.K., W.J. and Y.-H.Y.; Investigation, I.-T.K., D.-C.S. and Y.-E.L.; Resources, I.-T.K.; Writing—Original Draft Preparation, I.-T.K.; Writing—Review & Editing, I.-T.K., Y.J., and Y.-E.L.; Supervision, Y.-S.Y.; Project Administration, I.-T.K.

Funding

This work was supported by a Major Project of the Korea Institute of Civil Engineering and Building Technology, grant number 20190152-001.

Conflicts of Interest

The authors declare no conflict of interest.

References

  1. Mechsner, K.L.; Hamer, G. Denitrification by Methanotrophic, Methylotrophic Bacterial Associations in Aquatic Environments; Plenum Press: New York, NY, USA, 1985; pp. 257–271. [Google Scholar]
  2. Werner, M.; Kayser, R. Denitrification with Biogas as External Carbon Source. Water Sci. Technol. 1991, 23, 701–708. [Google Scholar] [CrossRef]
  3. Thalasso, F.; Vallecillo, A.; Garcıa-Encina, P.; Fdz-Polanco, F. The use of methane as a sole carbon source for wastewater denitrification. Water Res. 1997, 31, 55–60. [Google Scholar] [CrossRef]
  4. Houbron, E.P.; Torrijos, M.; Capdeville, B. An Alternative Use of Biogas Applied at the Water Denitrification. Water Sci. Technol. 1999, 40, 115–122. [Google Scholar] [CrossRef]
  5. Rajapakse, J.P.; Scutt, J.E. Denitrification with natural gas and various new growth media. Water Res. 1999, 33, 3723–3734. [Google Scholar] [CrossRef]
  6. Bedard, C.; Knowles, R. Physiology, biochemistry, and specific inhibitors of CH4, NH4+, and CO oxidation by methanotrophs and nitrifiers. Microbiol. Rev. 1989, 53, 68–84. [Google Scholar] [PubMed]
  7. Calsen, H.N.; Joergensen, L.; Degn, H. Inhibition by ammonia of methane utilization in Methylococcus capsulatus (Bath). Appl. Microbiol. Biotechnol. 1991, 35, 124–127. [Google Scholar]
  8. Applegate, C.S.; Wilder, B.; DeShaw, J.R. Total Nitrogen Removal in a Multichemical Oxidation System. J. Water Pollut. Control Fed. 1980, 52, 568–577. [Google Scholar]
  9. Ludzack, F.J.; Ettinger, M.B. Controlling Operation to Minize Activated Sludge Effluent Nitrogen. J. Water Pollut. Control Fed. 1962, 34, 920–931. [Google Scholar]
  10. Higgins, I.J.; Best, D.J.; Hammond, R.C.; Scott, D. Methane-oxidizing microorganisms. capsularus (Bath). Its ability to oxygenate n-alkanes. Microbiol. Rev. 1981, 45, 556–590. [Google Scholar]
  11. Patel, S.K.; Mardina, P.; Kim, S.Y.; Lee, J.K.; Kim, I.W. Biological Methanol Production by a Type II Methanotroph Methylocystis bryophila. J. Microbiol. Biotechnol. 2016, 26, 717–724. [Google Scholar] [CrossRef]
  12. Mardina, P.; Li, J.; Patel, S.K.S.; Kim, I.W.; Lee, J.K.; Selvara, C. Potential of Immobilized Whole-Cell Methylocella tundrae as a Biocatalyst for Methanol Production from Methane. J. Microbiol. Biotechnol. 2016, 26, 1234–1241. [Google Scholar] [CrossRef] [PubMed] [Green Version]
  13. Kim, I.T.; Yoo, Y.S.; Yoon, Y.H.; Lee, Y.E.; Jo, J.H.; Jeong, W.; Kim, K.-S. Bio-Methanol Production Using Treated Domestic Wastewater with Mixed Methanotroph Species and Anaerobic Digester Biogas. Water 2018, 10, 1414. [Google Scholar] [CrossRef]
  14. Raunkjær, K.; Hvitved-Jacobsen, T.; Nielsen, P.H. Measurement of pools of protein, carbohydrate and lipid in domestic wastewater. Water Res. 1994, 28, 251–262. [Google Scholar] [CrossRef]
  15. DuBois, M.; Gilles, K.A.; Hamilton, J.K.; Rebers, P.A.; Smith, F. Colorimetric Method for Determination of Sugars and Related Substances. Anal. Chem. 1956, 28, 350–356. [Google Scholar] [CrossRef]
  16. Wu, Z.; Zhiwei, W.Z.; Zhou, Z.; Yu, G.; Gu, G. Sludge rheological and physiological characteristics in a pilot-scale submerged membrane bioreactor. Desalination 2007, 212, 152–164. [Google Scholar] [CrossRef]
  17. Anthony, C. The Biochemistry of Methylotrophs; Academic Press Ltd.: London, UK, 1982; pp. 235–279. [Google Scholar]
  18. Trotsenko, Y.A.; Shishkina, V.N. Studies on phosphate metabolism in obligate methanotrophs. FEMS Microbiol. Lett. 1990, 87, 267–271. [Google Scholar] [CrossRef]
  19. Annaduraia, G.; Juangb, R.S.; Lee, D.J. Microbiological degradation of phenol using mixed liquors of Pseudomonas putida and activated sludge. Waste Manage. 2002, 22, 703–710. [Google Scholar] [CrossRef]
  20. Nishihara, T.; Okamoto, T.; Nishiyama, N. Biodegradation of didecyldimethyl ammonium chloride by Pseudomonas fluorescens TN4 isolated from activated sludge. J. Appl. Microbiol. 2000, 88, 641–647. [Google Scholar] [CrossRef]
  21. Dhanya, V.; Usharani, M.V.; Jayadev, P. Biodegradation of cyclohexanol and cyclohexanone using mixed culture of Pseudomonas in activated sludge process. J. Environ. Res. Dev. 2016, 11, 324–331. [Google Scholar]
  22. Osaka, T.; Yoshie, S.; Tsuneda, S.; Hirata, A.; Iwami, N.; Inamori, Y. Identification of acetate- or methanol- assimilating bacteria under nitrate-reducing conditions by stable-isotope probing. Microb. Ecol. 2006, 52, 253–266. [Google Scholar] [CrossRef]
  23. Gogleva, A.A.; Kaparullina, E.N.; Doronina, N.V.; Trotsenko, Y.A. Methylophilus flavus sp. nov. and Methylophilus luteus sp. nov., aerobic, methylotrophic bacteria associated with plants. Int. J. Syst. Evol. Microbiol. 2010, 60, 2623–2628. [Google Scholar] [CrossRef] [PubMed] [Green Version]
  24. Beck, D.A.C.; McTaggart, T.L.; Setboonsarng, U.; Vorobev, A.; Kalyuzhnaya, M.G.; Ivanova, N.; Goodwin, L.; Woyke, T.; Lidstrom, M.E.; Chistoserdova, L. The expanded diversity of Methylophilaceae from Lake Washington through cultivation and genomic sequencing of novel ecotypes. PLoS ONE 2014, 9, e102458. [Google Scholar] [CrossRef] [PubMed]
  25. Madhaiyan, M.; Poonguzhali, S.; Kwon, S.; Sa, T. Methylophilus rhizosphaerae sp. nov., a restricted facultative methylotroph isolated from rice rhizosphere soil. Int. J. Syst. Evol. Microbiol. 2009, 59, 2904–2908. [Google Scholar] [CrossRef] [PubMed] [Green Version]
  26. McCarty, P.L.; Beck, L.; Amant, P.S. Biological Denitrification of Wastewater by Addition of Organic Materials. In Proceedings of the 24th Industrial Waste Conference, Lafayette, IN, USA, 6–8 May 1969. [Google Scholar]
  27. Metcalf & Eddy Inc. Wastewater Engineering: Treatment and Reuse, 4th ed.; Tchobanoglous, G., Burton, F.L., Stensel, H.D., Eds.; McGraw-Hill: New York, NY, USA, 2003. [Google Scholar]
Figure 1. Schematic diagram of the newly developed system combining the aerobic–anoxic process with a methane oxidation bioreactor (MOB).
Water 11 01377 g001
Figure 2. Microbial consortium in the methane oxidation bioreactor: (a) Microbial species found in MOB sludge (output from the CLcommunity program (ChunLab Inc., Seoul, Korea); (b) proportions (%) of the most abundant identified taxa at the genus level.
Water 11 01377 g002aWater 11 01377 g002b
Figure 3. Comparison of the rate of sedimentation between the methane oxidation bioreactor (MOB) sludge and activated sludge. MOB sludge concentration: 1200 mg·L−1; activated sludge concentration: 2300 mg·L−1.
Water 11 01377 g003
Figure 4. Comparison of the changes in influent water quality based on chemical oxygen demand (COD), total nitrogen (TN), and total phosphorus (TP) removal between the tertiary advanced treatment of a wastewater treatment plant (WWTP) and the long-term operation of the aerobic–methane oxidation bioreactor–anoxic system (AMAn). Orange line stands for WWTP influent (Inf.), blue line AMAn influent, gray line tertiary WWTP effluent, and yellow line AMAn effluent (Eff.).
Water 11 01377 g004
Table 1. Characteristics of raw and secondary-treated wastewater.
ParameterConcentration (mg·L−1)
Raw SewageTreated Wastewater
COD94.912.4
NH3-N44.816.7
NO3-N4.615.3
PO43−-P5.81.6
Table 2. Operation conditions of the aerobic–methane oxidation bioreactor (MOB)–anoxic process.
ReactorMLSS (mg·L−1)Inflow (L·day−1)HRT (h)
Aerobic2200–2300244.3
Anoxic2300–24001.7
MOB1000–12003
MLSS: mixed liquor suspended solids; HRT: hydraulic retention time.
Table 3. Concentrations of methanol and formaldehyde in the effluent of the methane oxidation bioreactor.
Sludge InoculantTime (h)Methanol (mg·L−1)Formaldehyde (mg·L−1)MLSS (mg·L−1)
Activated sludge3<0.52 ± 0.020.03 ± 0.01520
Methanotrophs112.13 ± 0.310.34 ± 0.02520
335.23 ± 1.211.74 ± 0.08520
Data represent the means ± standard deviations of three replicates (n = 3).
Table 4. Changes in chemical oxygen demand (COD) and nitrogen and phosphorus concentrations via the actions of methanotrophs in the methane oxidation bioreactor using biogas and secondary-treated wastewater.
ParameterInitial Concentration (mg·L−1)Concentration after 3 h (mg·L−1)
COD12.42 ± 0.2259.84 ± 0.62
NH3-N16.75 ± 0.182.16 ± 0.06
NO3-N15.33 ± 0.211.23 ± 0.03
PO4−3-P1.68 ± 0.020.62 ± 0.01
COD: chemical oxygen demand. Data represent the means ± standard deviations of three replicates (n = 3).
Table 5. Comparison of extracellular polymeric substance (EPS) characteristics (mg·g VSS−1) and a particle size between methane oxidation bioreactor (MOB) sludge and activated sludge.
CharacteristicActivated SludgeMOB Sludge
EPS protein (mg·g VSS−1)76.8 ± 4.9106.2 ± 9.4
EPS polysaccharide (mg·g VSS−1)31.4 ± 3.246.5 ± 2.6
Particle size (µm)107 ± 12742 ± 22
Data represent the means ± standard deviations of three replicates (n = 3); VSS: volatile suspended solid.
Table 6. Comparison of nutrient removal between the aerobic–anoxic process and the activated sludge process.
ParameterInfluent (mg·L−1)Aerobic–Anoxic ProcessActivated Sludge Process
Effluent Concentration (mg·L−1)Removal Rate (%)Effluent Concentration (mg·L−1)Removal Rate (%)
COD106.311.1 ± 1.689.5626.3 ± 2.675.25
NH3-N17.20.68 ± 0.0496.0514.98 ± 1.510.30
NO3-N1.79.9 ± 1.341.92 (as TN)2.7 ± 0.42.95 (as TN)
PO4−3-P7.346.42 ± 0.7612.536.24 ± 0.6414.98
COD: chemical oxygen demand; TN: total nitrogen. Data represent the means ± standard deviations of 22 experiments (n = 22).
Table 7. Comparison of nutrient removal in the aerobic–methane oxidation bioreactor (MOB)–anoxic process under supply rates of settled effluent into the MOB.
ParameterInfluent (mg·L−1)0.1 Q 1 (2.4 L·day−1)0.2 Q 1 (4.8 L·day−1)
Effluent Concentration (mg·L−1)Removal Rate (%)Effluent Concentration (mg·L−1)Removal Rate (%)
COD129.39.4 ± 1.292.79.7 ± 0.892.5
NH3-N27.930.12 ± 0.0199.90.11 ± 0.0199.9
NO3-N1.38.4 ± 0.671.21 (as TN)4.1 ± 0.285.87 (as TN)
PO4−3-P6.493.82 ± 0.0641.142.0 ± 0.0369.47
COD: chemical oxygen demand; TN: total nitrogen. Data represent the means ± standard deviations of 22 experiments (n = 22). 1 Q: influent concentration = 24 L·day−1.
Table 8. Comparison of the total nitrogen and total phosphorus removal rates between the wastewater treatment plant (WWTP) tertiary advanced treatment and the aerobic–MOB–anoxic process.
CODTotal NitrogenTotal Phosphorus
InfluentEffluentInfluentEffluentInfluentEffluent
WWTPAMAnWWTPAMAnWWTPAMAnWWTPAMAnWWTPAMAnWWTPAMAn
Conc. (mg·L−1)86.495.98.68.051.057.913.113.75.236.080.230.21
SD9.7716.630.770.784.566.101.541.230.380.670.040.20
Removal rate (%)90.091.774.276.395.583.7
COD, chemical oxygen demand; WWTP, tertiary advanced wastewater treatment plant; AMAn, aerobic–MOB–anoxic process; SD, standard deviation. Data represent the means ± SD from WWTP experiments (n = 84) and AMAn experiments (n = 89).

