Article

Water Quality and Macroinvertebrate Community in Dryland Streams: The Case of the Tehuacán-Cuicatlán Biosphere Reserve (México) Facing Climate Change

by
Eugenia López-López
1,*,
Jacinto Elías Sedeño-Díaz
2,*,
Erick Mendoza-Martínez
1,
Andrea Gómez-Ruiz
1 and
Emilio Martínez Ramírez
3
1
Instituto Politécnico Nacional. Escuela Nacional de Ciencias Biológicas. Prol. de Carpio y Plan de Ayala s/n. Col. Sto. Tomás, Ciudad de México C.P. 11340, Mexico
2
Instituto Politécnico Nacional. Coordinación Politécnica para la Sustentabilidad. Av. Instituto Politécnico Nacional s/n, Esq. Wilfrido Massieu, Col. San Pedro Zacatenco, Deleg. Gustavo A. Madero, Ciudad de México C.P. 07738, Mexico
3
Instituto Politécnico Nacional. Centro Interdisciplinario de Investigación para el Desarrollo Integral Regional, Unidad Oaxaca. Departamento de Investigación. Hornos No. 1003, Col. Noche Buena, Municipio de Santa Cruz Xoxocotlán, C.P. 71230 Oaxaca, Mexico
*
Authors to whom correspondence should be addressed.
Water 2019, 11(7), 1376; https://doi.org/10.3390/w11071376
Submission received: 30 May 2019 / Revised: 28 June 2019 / Accepted: 2 July 2019 / Published: 4 July 2019

Abstract

:
The Tehuacán-Cuicatlán Biosphere Reserve (TCBR), the southernmost semi-arid zone of North America, includes two dryland streams, the Río Salado (RS) and Río Grande (RG); it is surrounded by high vegetation diversity, a cacti diversification center, and the densest columnar cacti forest worldwide. However, no scientific knowledge is currently available on these dryland streams. We evaluated water quality, its relationship with the local geological characteristics, land uses, and the composition of aquatic macroinvertebrates (AM), analyzing their bioindicator potential. These results were discussed in relation to climate change predictions. The RS showed higher mineralization, salinity, hardness, water and air temperature, and low water quality index (WQI), relative to the RG. A discriminant analysis showed spatial (mineralization, salinity, and hardness in the RS) and temporal patterns (higher nitrogen compounds and temperature in the rainy season). The RS showed a lower AM diversity (40 taxa) compared to the RG (73 taxa); Ephemeroptera-Plecoptera-Trichoptera reached higher values in the RG. A co-inertia analysis identified five groups of sites with different AM assemblages and water quality characteristics. Climate change predictions for the TCBR suggest increased aridity, higher temperature, and lower rainfall, leading to reduced river flow and increased salinity and mineralization. These could alter habitat features and connectivity, with loss of AM diversity, highlighting the vulnerability of these unique ecosystems to climate change.

Graphical Abstract

1. Introduction

Globally, 45% of the Earth’s surface is covered by drylands [1], environments with scarce scientific information that are highly threatened by different natural and anthropogenic stressors (climate change and anthropogenic disturbances). Additionally, 7 of the 35 diversity hotspots identified to date are located in these arid regions [2]. Dryland rivers can be defined as currents flowing through arid or semi-arid regions characterized by variable flow regimes, including intermittent and unpredictable flows [3,4,5]. Despite their hydrologic and geomorphologic diversity, dryland rivers differ markedly from permanent temperate streams, particularly because drought and flood conditions in dryland rivers are part of the natural hydrology that sustains their uniquely adapted biota [6,7].
Moreover, dryland rivers are naturally subjected to climatic stress [8]. In addition, the increased intermittency, delay in the onset of the rainy season, higher temperatures and evapotranspiration rates, prolonged droughts, and lower rainfall associated to climate change lead to habitat deterioration; as a result, water quality and volume of hydrographic currents are affected, leading to the reduction or loss of their environmental services. Thus, these ecosystems are considered to be highly vulnerable to climate change [9,10]. The effects of climate change in arid zones have been little studied to date; this represents a knowledge gap [11] since these aspects require long-term research.
As dryland streams are characterized by extreme hydrologic variability, the aquatic biota faces stress by severe environmental conditions: drought events and massive flooding [12]. Furthermore, high variation in the hydrologic regimes are evident across the landscape in these ecosystems. As a result, the same basin displays a mosaic of perennial, intermittent, and ephemeral streams with high variations in permanence throughout the year [13]. Water quality in these ecosystems can be affected by the hydrologic variability, particularly where dryland streams cross a particular geological stratum that confers salinity to the aquatic ecosystem. Lintern et al. [14] state that although the effect of anthropogenic changes in land use on water quality in lotic systems is well known, the relative importance of other landscape characteristics such as geology or soil type and their particular effect on water quality remain poorly understood.
Previous studies have aimed to identify the key landscape characteristics affecting spatial variability in water quality using multivariate approaches [15,16]. Varanka and Luoto [17] studied a wide spectrum of factors in their analysis, and found that agricultural land use within the catchment area was the most important factor affecting total phosphorus and total nitrogen concentrations in Finland. However, this process should also be analyzed in other regions, to identify whether it is specific to particular region and climate conditions, is a global trend, or could be related to broad characteristics such as climate type or biome. Consequently, the influence of land use on water quality in dryland streams is still a knowledge gap.
Although all types of dryland streams experience flood disturbance, aquatic organisms must also cope with drought conditions in intermittent and ephemeral (non-perennial) streams that undergo seasonal drought. Thus, dryland streams are an appropriate study system to evaluate the effects of water quality and seasonal variability on hydrological conditions, and the effect of these factors on aquatic biota including macroinvertebrates. Indeed, a considerable amount of literature has shown that aquatic invertebrate assemblages inhabiting dryland streams are strongly influenced by hydrological variability in space and time [18,19,20].
Aquatic macroinvertebrates of dryland systems have been documented, particularly in temperate zones and some tropical areas. For instance, in tropical dryland rivers in West Africa, Kaboré et al. [18] found that family richness metrics, diversity, and functional groups are useful for identifying human impacts related to land use. In Brazil, the effect of flow variability on the taxonomic composition and abundance of macroinvertebrates in intermittent rivers in semi-arid areas has been studied [21]. In temperate dryland rivers, studies have addressed the composition of aquatic macroinvertebrate assemblages. Metrics have usually been applied to the biological assessment of rivers in semi-arid areas; the composition of macroinvertebrates in perennial and intermittent dryland rivers, wetland depressions, and semi-permanent dams; temporal and spatial variations in macroinvertebrate communities; and distribution and abundance of macroinvertebrates along an altitudinal gradient [17,19,20,22,23,24,25]. In tropical dryland streams, however, studies on aquatic macroinvertebrates and their relationship with water quality and variations in the hydrological regime (dry and rainy seasons) are scarce.
In Mexico, arid zones are located primarily in the northern portion of the country [12]; additionally, there is a small region to the south characterized by arid and semi-arid conditions, known as the Tehuacán-Cuicatlán Valley [13]. This valley hosts the Tehuacán-Cuicatlán Biosphere Reserve (TCBR), considered by UNESCO (United Nations Education, Scientific and Cultural Organization) [14] as the arid or semi-arid zone with the highest biodiversity across North America. The TCBR is one of the diversification centers of Cactaceae (a critically endangered group worldwide) and harbors the densest forest of columnar cacti in the world [14]. The TCBR region is considered to be highly vulnerable to climate change [15]. The rivers flowing through this area are dryland streams of the intertropical region of southern Mexico. These ecosystems lack scientific information regarding water quality and macroinvertebrate biodiversity (including their potential value as bioindicators).
In Mexico, aquatic ecosystems in arid and semi-arid zones and the use of macroinvertebrates as bioindicators have been little studied [26]. According to [11], a large percentage of publications about arid zones in the US and Mexico refer to qualitative studies; consequently, huge gaps remain about inventories of hydrographic systems (location and extension of perennial and intermittent streams). There is also scarce information on the environmental characterization of intertropical drylands and the effect of climate change on these systems. Thus, it is imperative to contribute to the knowledge of aspects such as water volume, water quality, diversity of aquatic communities, and the potential impact of climatic change on these features. Aquatic macroinvertebrate communities have been used as bioindicators of water quality. Their responses include reduction in overall abundance and number of species in impacted areas coupled with the predominance of tolerant species, while sensitive species occur only in relatively undisturbed environments. However, although these attributes of aquatic macroinvertebrates may be applicable to streams in arid zones, [16] and [17] point out that in order to use macroinvertebrates as bioindicators, the effects of broad environmental variations on these communities must be determined to assess their potential use as bioindicators. Therefore, information on the potential use of these organisms as bioindicators in arid and semi-arid zones is still lacking.
The aims of this study were to detect spatial and temporal patterns in water quality and aquatic macroinvertebrate assemblages in the TCBR; identify the main physicochemical factors that drive spatial and seasonal patterns; analyze the relationship between physicochemical factors and macroinvertebrate assemblages (as potential bioindicators of water quality); and relate the predictions of climate change to water quality and aquatic macroinvertebrates assemblages. Two dimensions were investigated: (1) spatial differences within each river, and between rivers; and (2) temporal differences between dry and rainy seasons and inter-annual variations (2015, 2016, and 2017).

2. Materials and Methods
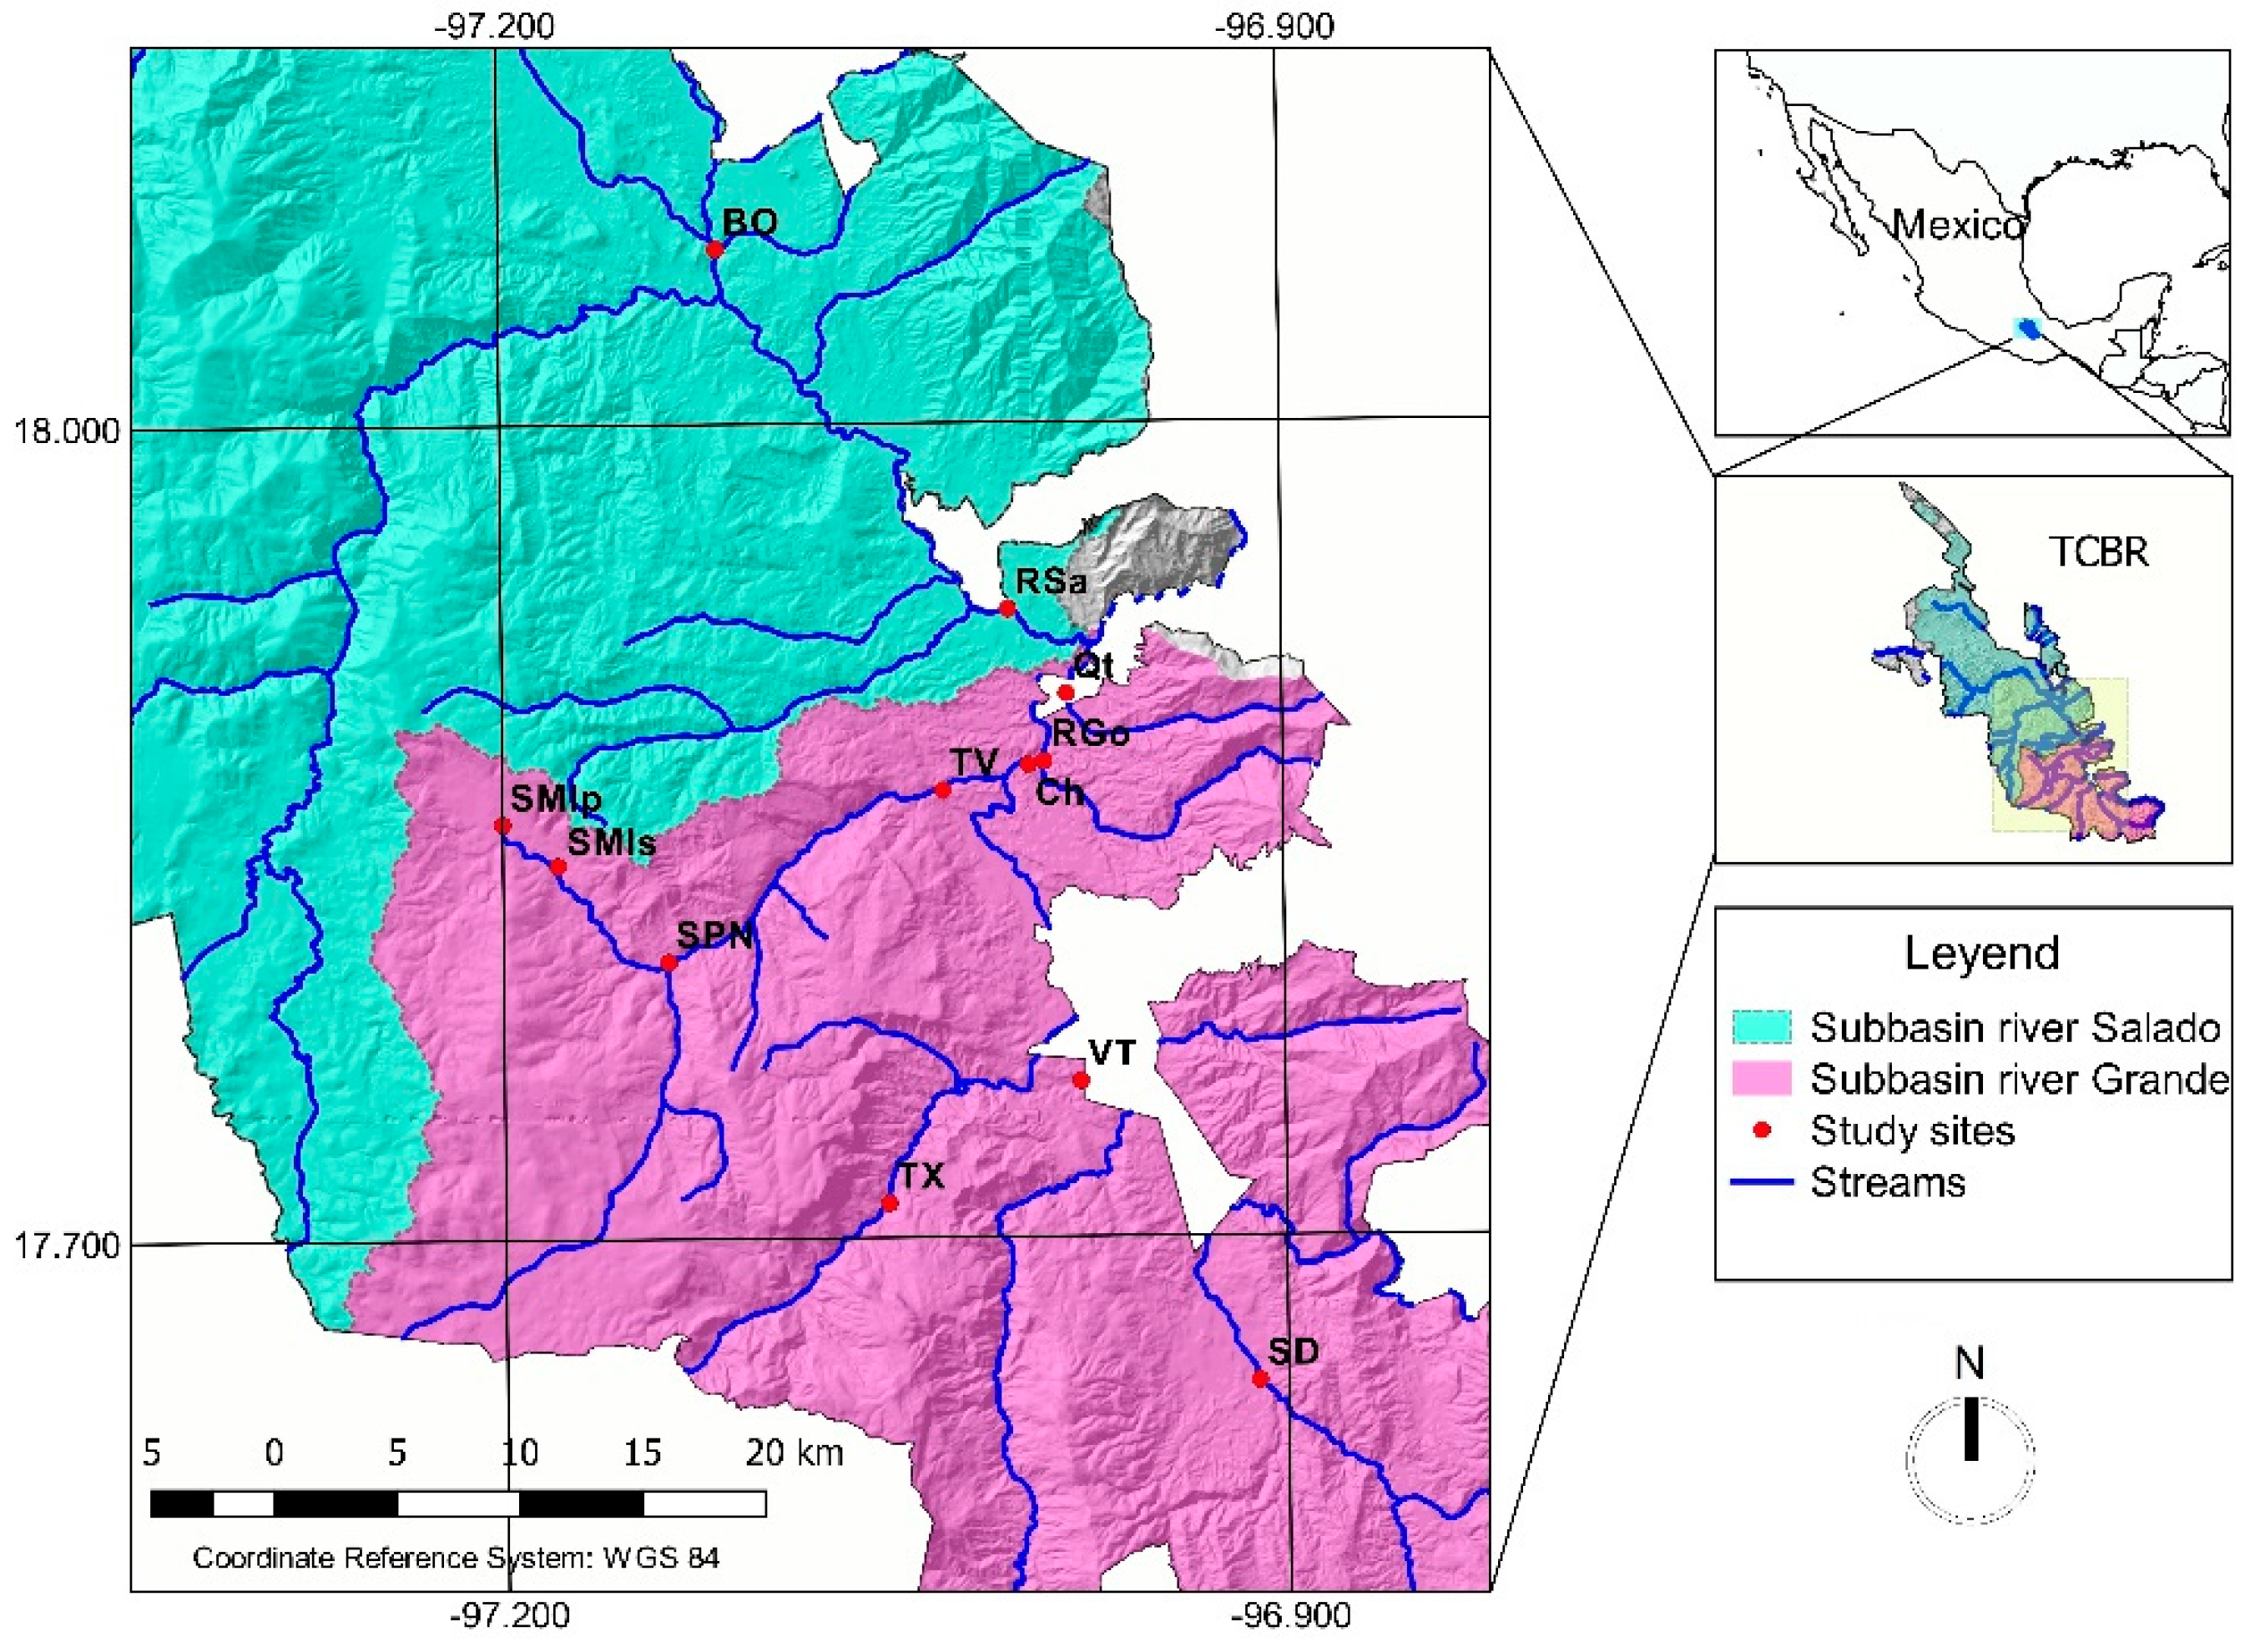
2.1. Study Area

The Tehuacán-Cuicatlán Valley is located in two physiographic provinces: Sierra Madre del Sur that comprises 92.65% of the total surface area of the reserve and the Trans-Mexican Volcanic Belt to the north, with 7.35%. The Río Salado and Río Grande are the most important hydrological systems in the TCBR, both being tributaries of the Papaloapan River, which drains into the Gulf of Mexico [27]. The Río Salado sub-basin has a broad extension within the TCBR; the Río Salado originates in Sierra Negra in the northwest and flows southward through the Tehuacán tectonic pit. Downstream, it joins the Río Grande to form the Santo Domingo River, a direct tributary to the Papaloapan River (Figure 1). The Río Salado is a temporary river; its stream channel remains dry most of the year and its flow is reactivated during periods of heavy rains. The Río Grande sub-basin ranks second in extension in the TCBR. It is located in the southern portion with a southeast-to-northwest direction and includes the Sedimentary Plateau, part of the Tehuacán Tectonic Trench, and the Sierra Mazateca. Its main river is the Río Grande, a permanent stream that originates in Sierra de Juarez and reaches the Río Salado downstream.
The TCBR territory has a mosaic of diverse rocky outcrops dominated (85.6%) by the sedimentary rock basement that originated from the Lower Cretaceous to the Lower Tertiary. This basement suffered several morpho-tectonic events that contributed to the configuration of the Tehuacán-Cuicatlán Valley and gave rise to complex high mountain ranges, folded mountains, hills, sedimentary plateaus, and a tectonic plate. In addition, the valley has metamorphic rocks from the Paleozoic, igneous rocks from the Precambrian and Paleozoic, and a cover of alluvial and residual formations from the Quaternary period [28]. Sedimentary rocks of the Lower Tertiary (Paleocene, Eocene, and Oligocene) are the most abundant type across the valley.
The prevalent composition of soil includes sandstones and conglomerates, shales, limestones, limonites, and gypsum, constituted by a calcareous sequence of the Lower Cretaceous (of marine origin) that covers the central part of the Sedimentary Plateau and the Tectonic Trench. A small area in the southern portion includes shales and plaster. During the Quaternary, weathering favored the formation of alluvial, lacustrine, and residual deposits along the main streams.
The dominant climates across the reserve are warm dry or arid (BW and BS, dry climates categories, mainly), which comprise 73.5% of the area (Figure 2a). Mean annual temperature varies from 22 °C to 24 °C. Annual precipitation ranges between 400 and 600 millimeters in most of the reserve [29,30] (Figure 2b). The rainy season occurs in the summer.
The TCBR is home to highly diverse vegetation [28]; however, the predominant vegetation types along the main channel of the Río Salado and Río Grande are deciduous tropical forest and xeric shrubland (Figure 2c).

2.2. Water and Macroinvertebrate Sampling

The sampling was carried out in two annual cycles, April and September (2015 and 2016), which included the dry (April) and rainy season (September), and January 2017 (cold, dry season only). A total of 12 study sites located along the Río Grande and Río Salado were monitored (Figure 1). The sites studied in the Río Salado, given their permanent nature, were Barranca Oscura (BO) and the Río Salado (RSa). In Río Grande, the study sites were Quiotepec (Qt), Tecomavaca (TV), Río Grande (RGo), El Cacahuatal (Ch), Santa María Ixcatlán Poza (SMIp), Santa María Ixcatlán Sabinos (SMIs), San Pedro Nodón (SPN), Valerio Trujano (VT), Santa María Texcatitlán (Tx), and Santiago Dominguillo (SD) (Figure 1).
For each study site, the following environmental factors were recorded in situ: air temperature (°C), with a thermometer included in the EXTECH anemometer; water temperature (°C), turbidity (Nephelometric Turbidity Units, NTU), salinity (Practical Salinity Units, PSU), dissolved oxygen (DO mg/L), pH, and conductivity (mS/cm), with a Quanta® multiparameter probe. Water flow speed (m/s) was recorded with a HACH hand-held flow meter and the geographic coordinates were recorded with a Sport Trak Maguellan GPS. At each study site, 500 mL water samples were collected in duplicate for water quality and bacteriological testing; these samples were transported in the dark and refrigerated for laboratory testing.
Macroinvertebrates were collected using a kick net and a D-type net, both with a 500 μm mesh size. Samples were obtained in duplicate using the multi-habitat method [31]; in each microhabitat, the collection area was standardized to 1 m2 according to [28]. The organisms collected were fixed in 70% alcohol and transported to the laboratory for sorting and taxonomic identification.

2.3. Water Quality Analysis and Identification of Aquatic Macroinvertebrates

In the laboratory, water samples were tested for biochemical oxygen demand (BOD5 mg/L O2), chlorides (mg/L Cl), alkalinity (mg/L CaCO3), and total and fecal coliforms (Most Probable Number, MPN/100 mL); these tests were conducted according to APHA (2005). Also, nitrite (mg/L NO2), nitrate (mg/L NO3), ammonia (mg/L NH3), total nitrogen (mg/L NT), orthophosphate (mg/L PO4), total phosphorus (mg/L PT), hardness (mg/L CaCO3), sulfates (mg/L SO4), and color (U Pt–Co) were analyzed using a Hach DR 2500 spectrophotometer.
Macroinvertebrates were sorted, and the taxonomic determination was conducted with a stereomicroscope (Nikon C-Leds SMZ745T) using specialized identification keys [32,33]. The relative abundance of each family in each sample was calculated. A rarefaction curve was constructed based on a total of 60 samples using EstimateS_ version 9.1.

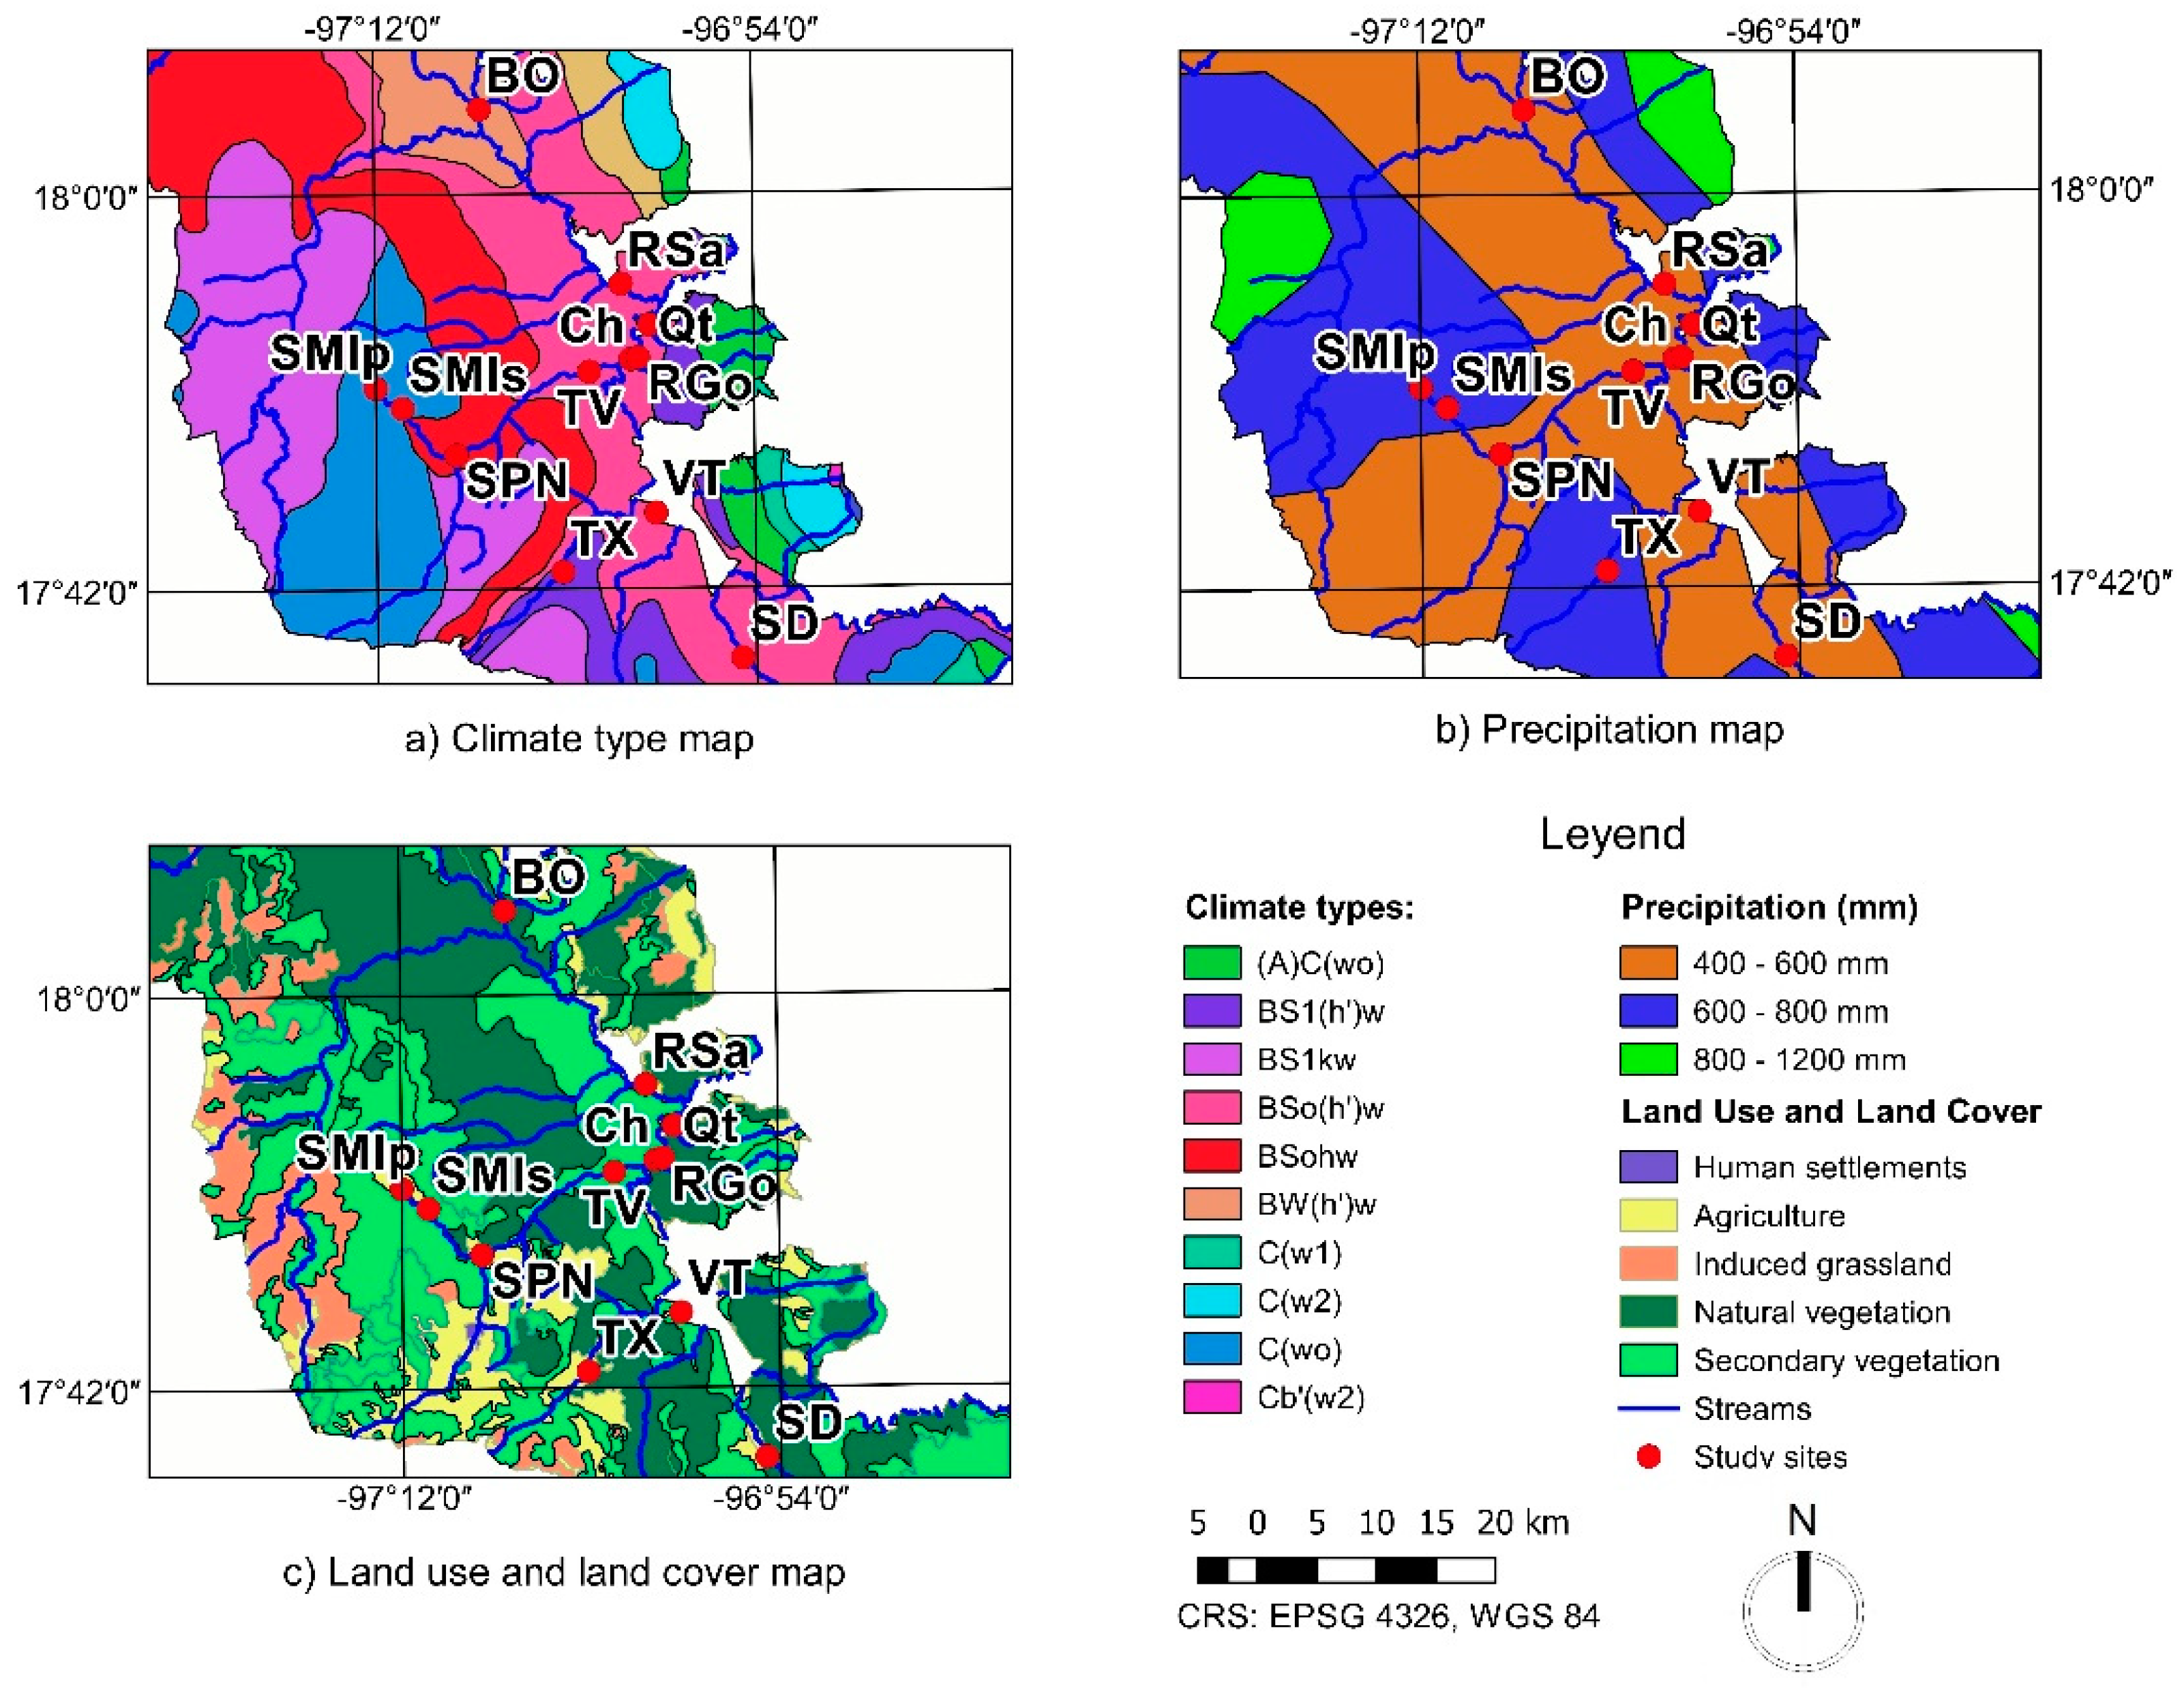
2.4. Land Use and Climate

The influence of land use on water quality for each study site was analyzed in a Geographical Information System. To this end, a set of “buffers” (i.e., zones influenced by land use or land cover) were set measuring 2 km in length upstream of the monitoring study site by 500 m wide at both sides (2 km × 500 m) following the method proposed by [34]. These authors point out that the use of a 2 km × 500 m buffer zone reveals any effect of a shift of land use on the adjacent water body. The percent coverage of each land use was estimated considering the total buffer area of each study site as 100%. The TCBR hosts a high diversity of land uses (37 categories), including agriculture (8 categories), natural vegetation (12 categories), secondary vegetation (13 categories), induced pastures, barren land, human settlements, and urban areas (Figure 2c). For this study, land uses were grouped into Agricultural Use, Natural Vegetation, Human-Induced Grasslands, and Human Settlements.
Climate-type vectorial layers were based on the climatic classification of [29]. Climatic type, precipitation, and land-use vectorial layers were obtained from the National Institute of Statistics, Geography, and Informatics (INEGI) of Mexico. Then, thematic maps for climate type, precipitation, and land use were developed using the QGIS software (Las Palmas version) (Open Source Geospatial Foundation, Chicago, IL, USA).

2.5. Data Analysis

For each study period, a database was constructed that included study sites (rows) and environmental factors (columns; environmental factors recorded in situ and water quality parameters assessed in laboratory). In order to integrate the different results of physical and chemical characteristics into a single figure that gives information about water quality, the water quality index (WQI) designed by [35] was calculated for each study site and period. This index includes 13 physicochemical and biological variables: atmospheric and water temperature, pH, dissolved oxygen saturation (%), alkalinity, BOD5, chlorides, conductivity, nitrates, hardness, true color, fecal and total coliforms; these were weighted using conversion factors that yielded values between 0 and 100.
Mean WQI values was assessed using different data sets: for each study site (WQI values for all periods), sub-basin (the Río Salado and Río Grande, considering WQI values of all study sites and periods), and period (WQI values for all study sites from each sub-basin). Data normality was tested by Shapiro–Wilk. Also, analyses of variance (ANOVA) were performed to test for significant differences between sites, sub-basins, and seasons, followed by Newman–Keuls multiple comparison tests (in the case of data normally distributed and homoscedastic), or a Kruskal–Wallis test (in the case of nonparametric data). To compare WQI values between sub-basins, a Student’s t-test was performed.
Multivariate statistical methods are widely used to characterize and evaluate freshwater quality, and are useful to analyze temporal and spatial variations in water quality [36]. Multivariate analyses (MVA) facilitate the identification of the main factors that influence water quality. Furthermore, MVA facilitate the interpretation of large data sets and reduce the dimensionality of complex data sets with minimum loss of the original information [37,38]. In this sense, considering all the environmental field records and laboratory test results, a factor analysis (FA) was carried out to reduce the number of variables to a smaller number of significant variables. With the set of variables selected from the FA, a stepwise discriminant analysis (DA) was conducted using the environmental factors as attributes of each study site and period. A Pearson’s correlation analysis (p < 0.05) of land uses with different physicochemical factors was carried out. Except for pH, all variables were transformed to Ln (x + 1) for FA and DA; in the case of percentages, the data were standardized using the algorithm: 2πx (arcsin√p), where x is the relative value of each individual taxa.
Factor analysis is a multivariate statistical method that is used mainly for analyzing the relationship between a set of variables (the environmental factors in this case) [39]. Complex data are thus reduced and then factors (the more significant ones) can be assigned to the truly effective chemical processes of water courses in the basin [40,41]. A small number of factors will usually account for approximately the same amount of information as does the much larger set of original observations. In this study we used a matrix of environmental factors in columns and all study sites and periods in rows. The significant factors detected with this procedure were used for the DA.
DA, also called supervised pattern recognition technique, is a multivariate statistical analysis method that uses linear combinations of several variables for the statistical classification of samples into categorical-dependent values. This technique can be used to construct the discriminant functions that contribute important information for each group [42]. In this study, we used DA to describe the relationship between two groups of study sites, the Río Grande and Río Salado, and environmental factors (in situ variables and laboratory test results). Study sites were combined into temporal groups for each sub-basin: dry season 2015 (all study sites for April 2015), dry season 2016 (all study sites for April 2016), rainy season 2015 (all study sites for September 2015), rainy season 2016 (all study sites for September 2016), and dry cold season 2017 (all study sites for January 2017). DA displays two biplots; the first shows groups of study sites and the second the vectors of environmental factors. This enables a description of the relationship of each group displayed with environmental factors, potentially revealing spatial and temporal patterns.
For the analysis of aquatic macroinvertebrates, the richness of families and the relative abundance of the taxa were evaluated. Also, the relative abundance of taxa Ephemeroptera-Plecoptera-Trhichoptera combined (EPT) and Oligochaeta-Chironomidae combined (Oligo-Chiro) were calculated; data were presented in percentage plots for each study site and year. Co-inertia analysis (CIA) is a general coupling method that maximizes the co-inertia between abiotic and biotic data arranged in two tables, allowing the analysis of the dynamics between environmental variables and the composition of organism assemblages. Co-inertia analyses were used to examine the structure of environmental and macroinvertebrate data in parallel, seeking to identify the corresponding variations (i.e., co-structure) in both data sets [43]. This analysis is also useful to explore ecosystem stability based on the intensity of the relationship between species and environmental variables. In this study, a CIA was performed using matrices of environmental factors and relative abundance of macroinvertebrates (including all study sites and periods). The temporal and spatial components of variation in both data sets were examined using within-class CIA [43,44,45]. The statistical analyses were carried out with the XLStat 2015 software; the CIA was conducted using the ADE software of the R programming language [46,47].

3. Results and Discussion

3.1. Physicochemical Characteristics of Streams
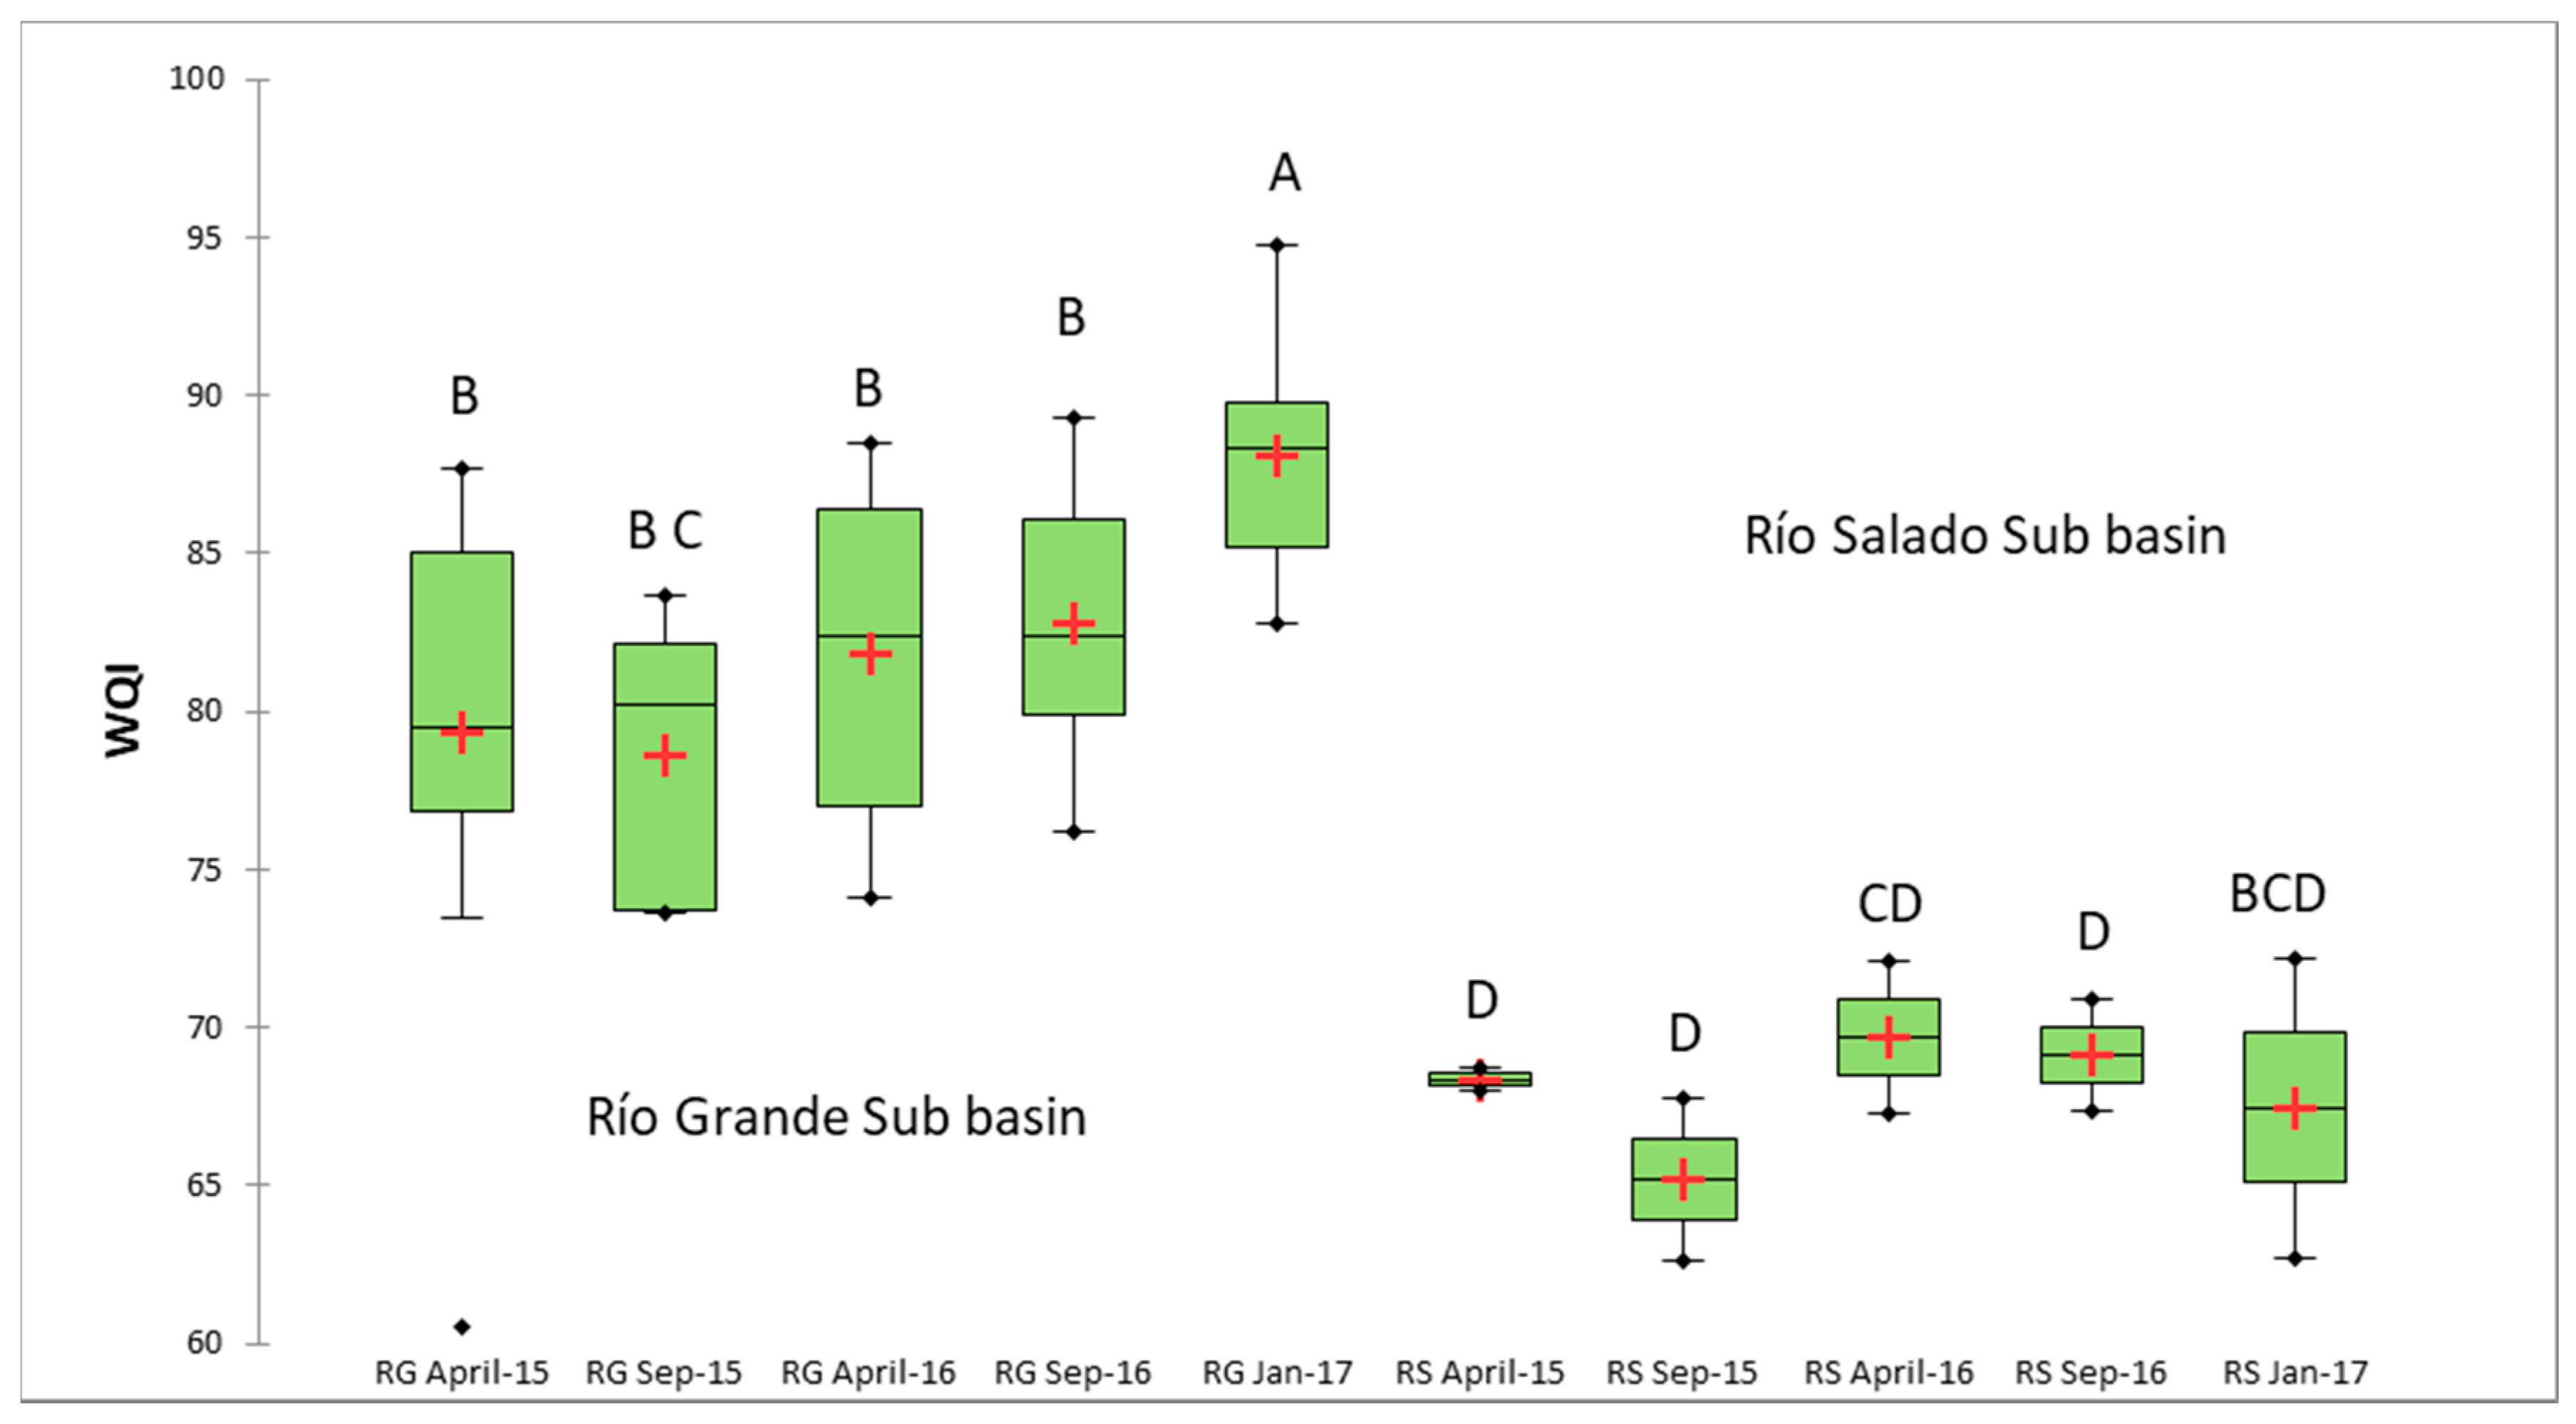
Global figures for physicochemical characteristics showed important variations in both sub-basins (Table 1). Given the geological nature of the Río Salado sub-basin, environmental factors related to mineral content such as salinity, conductivity, alkalinity, sulfates, and chlorides were higher than in the Río Grande sub-basin (p < 0.01 Kruskal–Wallis). According to the river classification systems based on conductivity, salinity, and mineralization [48,49], the Río Salado is a river with slightly saline water and a high mineralization level; in contrast, the Río Grande has a low mineral concentration and is classified as a freshwater stream (Table 1).
Air temperature and water temperature, which depend on climatic conditions, also showed differences between sub-basins, being higher in the Río Salado (p < 0.05 ANOVA Newman–Keuls). Mean values of hardness, color, NH3, suspended solids, and turbidity were higher in the Río Salado vs. the Río Grande; however, no significant differences were found (p > 0.05 Kruskal­–Wallis). According to the classification of water hardness [50], the Río Salado has hard water, while the Río Grande has moderately hard water.
The content of nutrients such as NO2, NO3, NT, O-PO4, DO, and PT showed no differences between sub-basins (Table 1).

3.2. WQI

The WQI showed a wide fluctuation across study sites and periods, with an overall mean of 79.36; the minimum was recorded in the Río Salado (WQImin = 66.74 (site BO)) and the maximum in the Río Grande (WQImax = 87.65 (site Ch)). No significant differences were observed in WQI across sites within each sub-basin (p > 0.05 ANOVA) (Supplementary Material 1), but values were generally lower in the Río Salado vs. Río Grande considering all study sites and periods. The WQI showed differences between the two sub-basins (p < 0.05); mean values were 67.0 (SE ± 1.06) in the Río Salado and 81.96 (SE ± 0.94) in the Río Grande (Figure 3).
Between study periods (rainy and dry seasons, and years), the WQI did not show significant differences in the Río Grande (RG), except for the RG in January 2017 (maximum WQI = 94.78). In the Río Salado, slightly higher values were recorded in the dry periods (mean values of 68.39, 69.94, and 67.45 in April 2015, April 2016, and January 2017, respectively) compared to values in the rainy periods (mean values of 65.15 and 69.11 in September 2016 and 2016, respectively), although these differences were not statistically significant (p > 0.05) (Figure 4).
The WQI was also influenced by the high values of chlorides, conductivity, and hardness, since these were the main factors leading to the low WQI values in the Río Salado. The primary use of water in both hydrological systems is agriculture [28]. In this sense, Kerr [51] states that crop irrigation with saline waters could induce the precipitation of CaCO3, CaSO4, and NaCl, among others, resulting in salinization, a condition recognized as one of the major factors limiting the fertility of agricultural fields [52].
The FA showed that the variables with the greatest contribution to the identification of patterns in the hydrographic systems were salinity, conductivity, chlorides, SO4, alkalinity, hardness, water temperature, BOD5, NO3, NO2, NH3, NT, pH, DO, and WQI; thus, these factors were used for subsequent analyses (Supplementary Material 2).
The DA of all environmental factors taken together for each study period revealed spatial and temporal patterns. The first two functions of DA reached 70.92% of the variance explained (F1 45.32% and F2 25.59%). The DA biplot showed an ample spatial separation of the hydrographic systems studied. The centroids representing the study periods for the Río Salado sub-basin are located in the quadrants to the right, characterized by high conductivity, salinity, alkalinity, and chlorides. In contrast, the centroids of the Río Grande sub-basin are located in the quadrants to the left, characterized by lower values of these same factors (Figure 5a,b). Additionally, a seasonal pattern was observed. In general, the centroids of the September study periods (rainy season) for both sub-basins were represented in the upper quadrants (upper left for the Río Grande and upper right for the Río Salado, except for September 2016 for the Río Grande), associated with a higher concentration of nitrogen compounds (NO3, NO2, NH3). Particularly, the highest WQI values were reached in the Río Grande. In general, the highest values of pH, BOD5, hardness, and temperature occurred in April in the Río Salado (Figure 5a,b).
Differences in the physicochemical conditions and WQI of the water bodies studied are closely related to the underlying geology of the hydrographic basin. The Río Salado is strongly influenced by the sedimentary rock basement and soils are dominated by shales, limestones, limonites, and gypsum (the latter characterized by a high calcium sulfate content) [27]. Calcareous soils, Vertisol, and Fluvisol (among others) are also present [28], which are key factors contributing to the mineralization of water. According to [53], the Río Salado flows through various soil types, mainly Leptosol and Regosol, and in a smaller proportion Phaeozem and Cambisol conferring salinity conditions to it. For their part, the dominant soils in the Río Grande sub-basin are Phaeozem, Regosol, and Leptosol, which contribute to the physicochemical properties of stream water. Stum and Morgan [54] point out that the chemical composition of stream water in a river reflects the local interaction between the substrate (geology and soil), the aquatic environment, and the atmosphere. These factors have been categorized as resulting from the influence of landscape [55]. On the other hand, seasonal patterns related to increases in temperature have also been detected by [8] and are considered the result of the natural variability of dryland rivers.

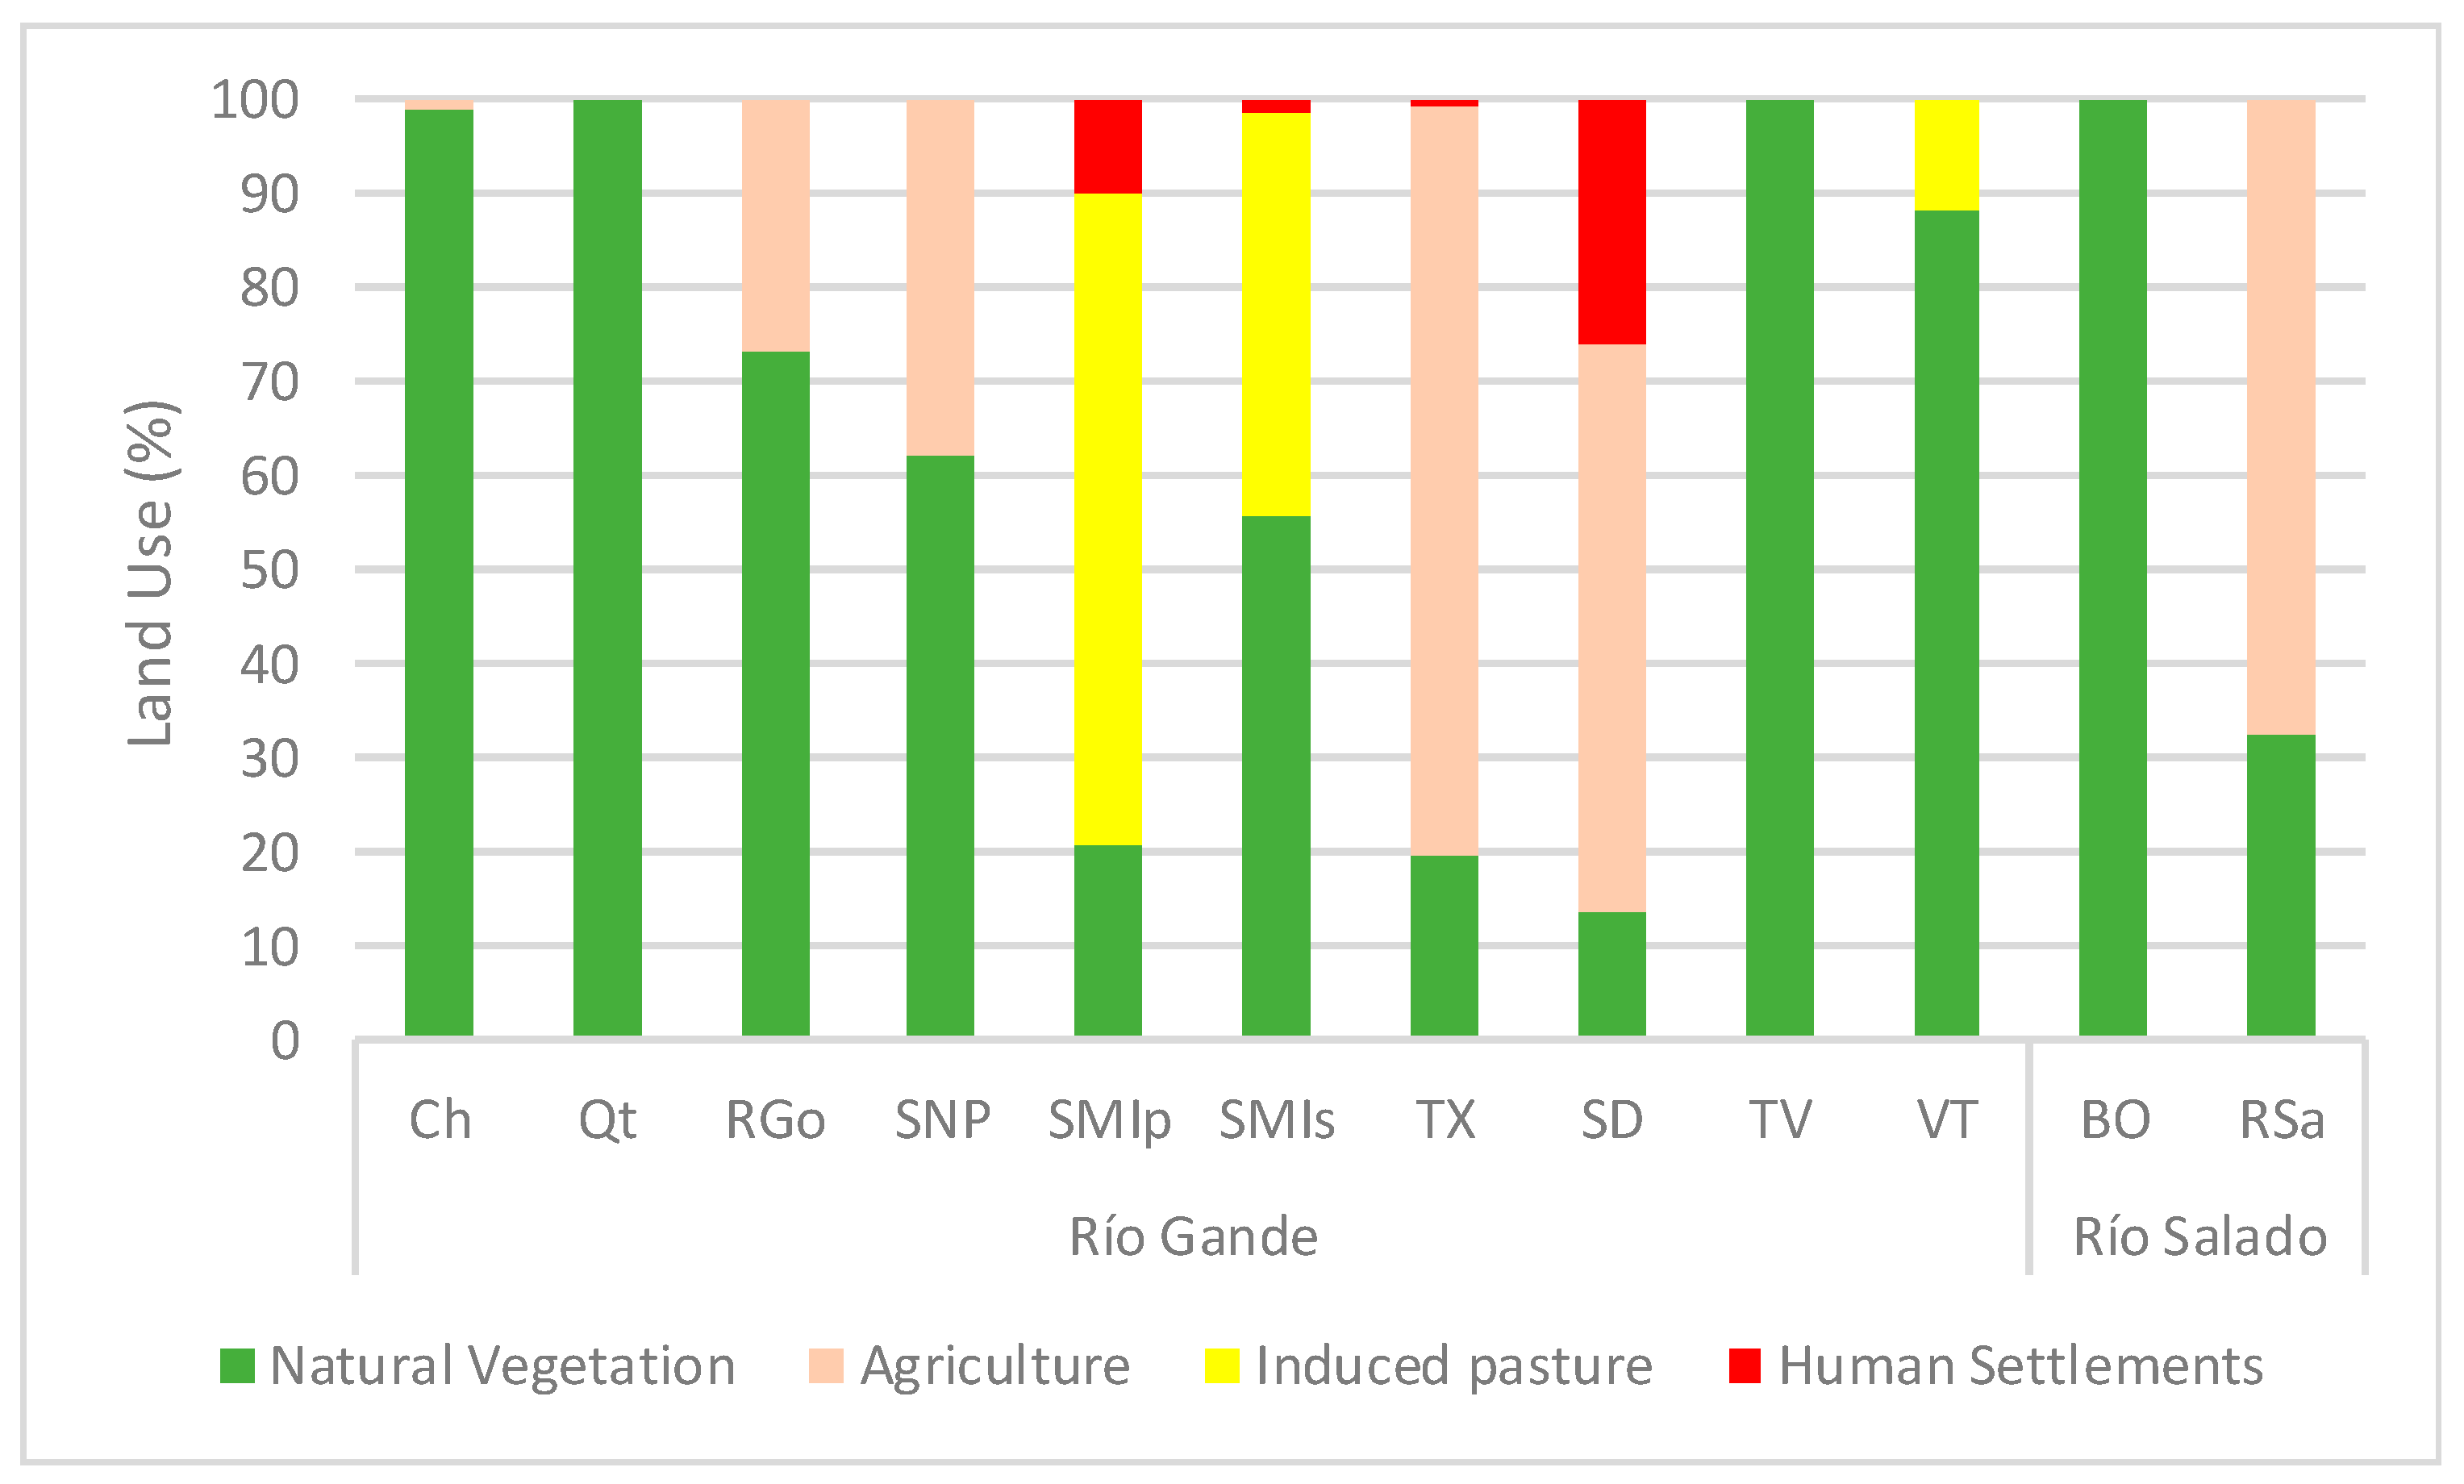
3.3. Land Use and Climate

Buffers adjacent to study sites show that natural vegetation is the prevailing land use in both hydrographic systems (Figure 6). In the Río Grande sub-basin, 6 of the 10 sites have buffers where natural vegetation accounts for more than 60% of the total area; agriculture predominates in buffers of two study sites only, with 60%–70% of the total area; in two study sites, induced pasture reached 40%–70% of the buffer area; last, four study sites included human settlements, involving 1%–25% of the buffer area (Figure 6). On the other hand, in the Río Salado sub-basin natural vegetation reached 100% of the buffer area in one study site and agriculture covered 68% in the other. The correlation analysis between land uses and environmental variables showed positive correlations between human settlements and BOD5 (r = 0.30; p < 0.05) and between human-induced grassland and NT (r = 0.348, p < 0.05). Negative correlations were found between natural vegetation and human-induced grassland (r = −0.413; p < 0.05), agriculture (r = −0.669; p < 0.05), and human settlements (r = −0.656; p < 0.05) (Supplementary Material 3).
Changes in water quality have been attributed to anthropogenic effects due to changes of land use [56]. In this sense, BOD5 in the TCBR is directly related to human settlements, derived from organic matter discharged into river water, as stated by [57,58,59]. Induced grassland was related to NT (Total Nitrogen) studied are located in a natural protected area (listed as a Biosphere Reserve) and within the area of the reserve where human settlements do not exceed 1000 inhabitants (only six villages have between 1000 and 2000 inhabitants) [29]. Thus, water quality degradation due to the impact of small human settlements is probably minor, since these populations use septic tanks. However, wastewater treatment plants are necessary to discontinue raw discharges and septic tanks, aiming to reduce the negative effects of growing human settlements. In contrast, the Lerma River basin flowing across the Mexican Central Plateau (with a high population density, more than 25% of the Mexican population) receives wastewater discharges from cities, industries, and cropland, causing water quality deterioration and low WQI values that range from 26.53 to 67.44 [60].
Allan [61] points out that rivers may display good conditions in basins where agriculture is not overly extensive (threshold of 30%–50% of the catchment area). According to the current land uses in the basin (Figure 2c), the TCBR area is dominated by natural vegetation, suggesting that the reserve is in good condition.
Additionally, Arheimer and Lidén [62] point out that the water quality of rivers varies seasonally as a consequence of increased river flow in the rainy season. Our results showed an enrichment of nitrogen compounds during the rainy season, which was more pronounced in the Río Salado than in the Río Grande. As a result of rainfall, soils are eroded and the materials transported by rainwater are incorporated into river courses [63]. In addition, higher DO was recorded in the rainy season; Crosa et al. [55] also detected differences in DO in river water running through watersheds dominated by agriculture vs. forests. To note, the canopy in older forests can exert a shading effect by reducing irradiation and photosynthetic activity. In our study area, the dominant vegetation types adjacent to the river courses are xeric and deciduous forests [28], whose plant cover could hardly project a significant shading. Hence, the input of nutrients in the rainy season is likely to foster photosynthetic activity, resulting in higher DO levels. On the other hand, the results of this study showed that temperature, hardness, sulfates, and salinity increase during the dry season, particularly in the Río Salado (Figure 5a,b). The increased salinity of dryland rivers was also reported in the Río Grande of North America by [64]. These authors point out that climatic changes leading to greater aridity (i.e., lower rainfall) accelerate the salinization of dryland rivers, degrading water quality and limiting the potential uses of water, thus affecting its use in agriculture or human consumption.
In general, study sites in both sub-basins are influenced by arid semi-warm and warm climates (Figure 2a), both classified as desert climate with temperatures above 18 °C. Site BO in the Río Salado is influenced by arid warm climate, with a mean annual temperature higher than 22 °C. Precipitation ranges from 400 to 600 mm in almost all study sites. This combination of arid climate and low precipitation affects water quality, making this region especially vulnerable to climate change, particularly in the Río Salado.
According to [65], climate predictions for 2030 and 2050 for the study area anticipate a scenario of greater aridity, since it is estimated that the minimum and maximum daily rainfall in rainy days will be <2 mm and <50 mm, respectively. On the other hand, the temperature predictions for this same period suggest minimum temperatures below 5 °C and peak temperatures from 35 to 40 °C. Under these scenarios, the lower water input by rainfall and the higher temperature (leading to higher evaporation) and salinity are expected to become more acute, particularly in the Río Salado. In this sense, Cañedo-Argüelles et al. [66] state that the increase in salinity produces adverse effects, including higher costs of water treatment for human consumption, reduction in biodiversity, altered ecosystem functions, and economic impacts due to the deterioration of ecosystem services.

3.4. Macroinvertebrates

3.4.1. Family Richness

A total of 32,043 aquatic macroinvertebrates belonging to 73 families were collected in the two hydrographic systems. The total family richness was 73 in the Río Grande and 40 in the Río Salado (Supplementary Material 4). The rarefaction curves show the number of taxa obtained against the sampling effort (Supplementary Material 5).
The orders that showed the highest family diversity (from 7 to 13 families) were Diptera, Coleoptera, Hemiptera, Trichoptera, and Odonata (Figure 7); those with a moderate representativeness were Ephemeroptera and Gastropoda (4 and 5 families, respectively); and the least represented (1 family) were Gordioidea, Lepidoptera, Megaloptera, Bivalvia, Trombidiformes, Plecoptera, Ostracoda, and Oligochaeta. The groups Plecoptera (Perlidae) and Ostracoda were absent in the Río Salado.
Mean family richness per study site varied from 11 to 23, being lowest in TX (11 families) and highest in Qt (23), both in the Río Grande. A marked variation of family richness per study site was observed (Supplementary Material 6), and no significant differences were observed in mean family richness between sites (p > 0.05). Although the total number of families differed markedly between hydrographic systems, the mean family richness in the Río Grande and Río Salado was similar (19 and 17, respectively; Figure 8), with no significant differences (p > 0.05).
As regards study periods, the Río Grande showed significant differences in the number of macroinvertebrate families between 2015 and 2016–2017 (p < 0.05), but not between study months within a year (p > 0.05); the mean family richness was higher in 2016–2017 vs. 2015 (Figure 9). In the Río Salado, differences in mean family richness were found between September 2015 and April–September 2016 (p < 0.05).

3.4.2. Biological Indices

The overall mean relative abundance of EPT macroinvertebrates (hereafter referred to as EPT abundance) for the two hydrographic systems was 53.86%. For the Río Grande, EPT abundance varied between 40% and 88% with a mean of 53.44%; in general, EPT abundance was >50%, except for SMIp in September 2015 and April 2016 (<10%), as well as in RGo April 2015, Qt September 2015, SNP April 2016, and CH September 2016 (40%, 30%, 45%, and 38%, respectively). In the Río Salado, EPT abundance varied between 21% and 49%, with a mean of 35.85%, although there were study sites with no EPT families (RSa September 2015) (Table 2). Therefore, significant differences were observed between hydrographic systems (p < 0.05, Student’s t-test). The Oligo-Chiro index was very low in the Río Grande and low in the Río Salado (mean 2.62% and 6.86%, respectively); no significant differences were found between these hydrographic systems (p > 0.05; Student’s t-test).
Mean EPT abundance did not show significant differences either between study sites (p > 0.05) or between periods (p > 0.05).

3.5. Relationship between Macroinvertebrate Assemblages and Physicochemical Variables

The co-inertia analysis showed a significant relationship between taxonomic components and environmental variables (Figure 10a,b, Rv = 0.343, p < 0.05). The analysis arranged all study sites and periods according to biplots that allowed the identification of five groups of study sites based on their physicochemical characteristics and aquatic macroinvertebrate assemblages.
The first group of study sites is located in the upper left quadrant, corresponding to sites in the Río Salado sub-basin: BO in April and September (2015 and 2016), and BO and RSa in January (2017). This group shows high conductivity, salinity, chlorides, sulfates, alkalinity, hardness, color, and turbidity (Figure 10a). The exception was RSa in April (2015 and 2016), which was located towards the lower left quadrant (Figure 10c). This was characterized by higher air and water temperatures, as well as by increased phosphorus (O-PO4 and PT), coliforms, and total suspended solids, vs. the rest of the study sites and periods within the same group. The dominant taxa in this group (study sites BO and RSa) were Diptera, Hemiptera, Oligochaeta, and Gordioidea (Figure 10b).
The second group is located from the lower left to the upper right quadrants and includes study sites TV, VT, and TX, which together represent two tributaries of the Río Grande (Figure 10d). The location of these sites in these quadrants suggests an association with high values of phosphorus (PT and O-PO4), BOD, FC, and TSS; in particular, April (2015 and 2016) is closer to air and water temperature vectors, as well as to pH (Figure 10a,b,e). This group showed the dominance of Trichoptera and Coleoptera, and the presence of Lepidoptera (Figure 10b).
The third group corresponds to the SD study site (Figure 10e), which represents the upper portion of the Río Grande. In the biplot, this group is very close to the origin of the axes in September (2015 and 2016) and January 2017. However, it is located in the lower left quadrant in April (2015 and 2016), with higher temperatures and phosphorus levels (O-PO4 and PT), BOD, SST, and fecal coliforms at this time of the year. The dominant taxonomic orders in this group were Coleoptera, Lepidoptera, and Trichoptera (Figure 10a,b,e).
The fourth group of study sites includes SMIp, SMIs, and SPN (Figure 10f), which together represent a third tributary of the Río Grande. In the biplot, these are distributed between the upper left and lower right quadrants, with a wide dispersion of sites that denotes remarkable seasonal differences. These sites are characterized by their association with nitrogen compounds (NO2, NO3, NH3, and NT) and DO. Sites SMIp and SPN in April (2015 and 2016) and SMIp in September 2015 are located in the right lower quadrant of the biplot and are characterized by higher temperatures (air and water), BOD5, pH, TP, O-PO4, total coliforms, and total suspended solids, vs. all other sites and periods within this group. In general, the most characteristic taxa in this group were Ephemeroptera and mites; in the case of SMIp and SPN in April (2015 and 2016) and SMIp in September 2015, the most important taxonomic groups were Trichoptera, Coleoptera, and Lepidoptera.
The fifth group includes sites Ch, RGo, and Qt (Figure 10g) that represent the lower portion of the Río Grande upstream of its confluence with the Río Salado. In the biplot, these sites are located in two quadrants, upper right and lower left. RGo, Qt, and Ch in September 2016, RG and Qt in January 2017, and Qt in September 2015 (Figure 10g) were characterized by a high content of nitrogen compounds (NO2, NO3, NH3 and NT) and DO, with predominance of Ephemeroptera and mites. For their part, Qt, RGo, and Ch in April (2015 and 2016), as well as Ch in January 2017 and RGo in September 2015, showed higher temperatures, phosphorus (PO4 and PT), BOD5, SST, and fecal coliforms, and showed a notorious seasonal and annual variation. The dominant taxa in this case were Coleoptera, Trichoptera, and Lepidoptera (Figure 10g).
In this study, CIA allowed the interpretation of spatial and temporal dimensions in the dry land streams studied showing a clear variation in the environmental factors between the dry and rainy season (in all annual cycles studied) and the corresponding variations in the composition of aquatic macroinvertebrates. Among the environmental factors that contribute to differences between seasons, the temperature and phosphates reached higher values in the dry season, while in the rainy season higher values of nitrogen compounds were evident; on the other hand, environmental factors such as conductivity, salinity and alkalinity contributed to show spatial differences. Different taxa of macroinvertebrates were dominant in each period and group of study sites. These data show the high variability in physicochemical and aquatic macroinvertebrates of the dry land stream of the TCBR.
The results regarding the macroinvertebrate community of the Río Salado and Río Grande showed that it is a good indicator of differences in environmental conditions. The Río Salado showed a lower family richness vs. the Río Grande. Bunn and Davies [67] found that the benthic fauna in saline rivers of Australia was characterized by high densities and low values of species richness, diversity, and evenness relative to freshwater rivers. Zinchenko and Golovatyuk [68] point out that macroinvertebrates show wide variations in tolerance to salinity; the groups that are more stenohaline include leeches, bivalve mollusks, and larvae of Plecoptera, Trichoptera, and Ephemeroptera. Furthermore, Timpano [69] state that higher water salinity in rivers lead to lower diversity. The lower taxonomic richness in the Río Salado may be attributed to a limiting effect of salinity on the most stenohaline macroinvertebrates, among them the Plecoptera, which were absent in the Río Salado. Furthermore, major differences in habitat type derive from the intermittent nature of the Río Salado. Study sites in this river were shallower (less than 50 cm) than study sites of the Río Grande (more than 50 cm), the width of study sites of the Río Salado was lower (maximum 3 m) vs. the Río Grande (maximum 30 m). In addition, Río Grande has different types of habitats, including riffles, pools, and rapids, while the Río Salado has a very homogeneous habitat with a laminar current. However, no significant differences were found in average current velocity (1.27 m/s in the Río Salado vs. 1.19 m/s in the Río Grande). Bed materials in the Río Salado include pebbles, gravel, and sand, while the Río Grande has more complex bed materials. In addition to pebbles, gravel, and sand, there is coarse material in rapids and riffles, and silt combined with pebbles, gravel, and sand in pools. The differences in habitat diversity between the Río Grande and Río Salado result in broader habitat availability in the Río Grande relative to the Río Salado, which is an additional factor also affecting the diversity of the Río Salado, as reported by [19].
In our study, some families were not found in the Río Salado, such as Caenidae (order Ephemeroptera). This family is reportedly tolerant to water salinity [68]. However, Alhejoj [70] found in several water bodies in Jordan that representatives of the family Caenidae are indicators of good water quality, with low tolerance to pollution, in contrast with the family Baetidae (collected in the Río Salado), which are capable of surviving in waters with organic pollution. Kefford et al. [71] reported tolerance data for some genera of Plecoptera, Hemiptera, and Trichoptera, showing a higher sensitivity to salinity in the early stages of the life cycle. It is possible that the families Perlidae (Plecoptera); Corixidae, Hydrometridae, Mesovellidae, Notonectidae (Hemiptera); Calamoceratidae, Helicopsichidae, Leptoceridae (Trichoptera), which are absent in the Río Salado, but present in the Río Grande, are affected by salinity and habitat features.
From the results of this study and the climate change scenarios that foresee an increased salinization, a shift in the composition of the biota towards a lower diversity of the macroinvertebrate community can be anticipated. In Mexico, there are no data on the sensitivity of macroinvertebrates to salinity; thus, further research is required to identify the most vulnerable components of aquatic macroinvertebrate communities in view of the increased salinity scenarios.
In addition to salinity, water temperature is significantly higher in the Río Salado relative to the Río Grande, which may contribute to a higher evaporation and the consequent higher salinity. On the other hand, in the co-inertia analysis, environmental factors also evidenced that higher temperatures were associated with higher salinity, sulfates, chlorides, alkalinity, and hardness. In turn, these were related to the macroinvertebrate composition. The most salinity-sensitive groups were plecopterans, mites, ostracods, ephemeroptera, odonata, bivalves, and gastropods, which match the salinity-sensitive groups identified by [68,71,72]. These differences in tolerance account for the differences in assemblages observed between the study sites of the Río Salado and those of the Río Grande, in addition to the differences in habitat features.
On the other hand, water bodies in the Río Salado sub-basin are not permanent, hence the input of water to the study sites is an additional factor impacting the level of heterogeneity and habitat availability, with a potential effect on the composition of the macroinvertebrate community. Jaeger [73] points out that more frequent and severe droughts as a consequence of climate change will have significant consequences in terms of intermittence patterns and hydrologic connectivity in dryland streams of the American Southwest, with negative effects on highly endangered fishes. In addition, these authors indicate that recurrent stream drying events in the future will also reduce network-wide streamflow connectivity in all seasons. In the case of the TCBR, particularly in the Río Salado, hydrologic connectivity is a key driver that may threaten macroinvertebrate communities and the ecosystem functions they carry out.
Surface dryland streams in the TCBR are particularly vulnerable to minor changes in climate. Changes in habitats associated with streams are likely to include loss and fragmentation of aquatic habitats; connectivity between them; alterations in nutrient retention and in-stream production; changes in species assemblages, affecting the persistence of the most sensitive species of aquatic macroinvertebrates; and loss of environmental services [9,10].
Global climate change has multiple effects on water quality. Extreme climatic events (high temperatures, scarce rains) mean that previously perennial water courses now undergo drought periods leading to a higher concentration of pollutants with consequences for the aquatic biota [74], affecting the presence and abundance of pollution-sensitive macroinvertebrates.
Schlaepfer [75] indicates that drylands as a whole are expected to increase in extent and aridity in coming decades, although temperature and precipitation forecasts will vary according to latitude and geographic region. This could cause major consequences on the hydrologic cycle, particularly in streams like the Río Salado, increasing its salinity; this will lead to changes not only in the structure of the macroinvertebrate community but also in their biological traits, including dispersal-related processes, as suggested by [76].

4. Conclusions

This study shows a clear spatial and temporal pattern of water quality and aquatic macroinvertebrate assemblages of study sites in the TCBR. Salinity, mineralization, and temperature, as well as geological substrate, are the key factors accounting for the main differences between the Río Salado and the Río Grande. Seasonal patterns show that in the rainy season nitrogen compounds are incorporated into the rivers as a result of changes in land use to agriculture, while during the dry season higher temperatures and water hardness were recorded. Aquatic macroinvertebrates also displayed spatial and seasonal patterns: lower diversity was detected in the Río Salado vs. the Río Grande, and seasonal patterns showed different assemblages related to higher temperatures in the dry season vs. nitrogen enrichment in the rainy season. The sensitivity level of the aquatic macroinvertebrate community is evident and supports its potential use as a bioindicator in dryland rivers. The predictions of climate change in the TCBR highlight the vulnerability of the rivers studied to changes in salinity and temperature and, consequently, the potential effects of variations in these factors on the diversity and structure of macroinvertebrate communities. The ability of macroinvertebrate taxa to withstand these changes is related to their tolerance levels in different stages over their life cycle. Finally, studies addressing the tolerance of macroinvertebrate communities of the TCRB to salinity are needed to obtain more in-depth information about these organisms living in a vulnerable environment and facing climate change.

Supplementary Materials

The following are available online at https://www.mdpi.com/2073-4441/11/7/1376/s1. S1: WQI scores across study sites and periods in the Río Salado and Río Grande. S2: Factorial analysis. S3: Correlation values of environmental factors and land use. S4: Families of aquatic macroinvertebrates in the Río Salado and Río Grande. S5: Rarefaction curves for the aquatic macroinvertebrates of the TCBR. S6: Family richness per study site in the Río Salado and Río Grande.

Author Contributions

Conceptualization, E.L.-L. and J.E.S.-D.; data curation, E.M.-M. and A.G.-R.; formal analysis, J.E.S.-D. and E.M.-M.; funding acquisition, E.L.-L.; investigation, A.G.-R. and E.M.R.; methodology, J.E.S.-D., E.M.-M., A.G.-R. and E.M.R.; supervision, E.L.-L. and J.E.S.-D.; writing—original draft, E.L.-L.; writing—review and editing, E.L.-L.

Funding

This research was funded by Consejo Nacional de Ciencia y Tecnología, grant number 1931 and the Secretariat of Research and Posgrade of the Instituto Politécnico Nacional SIP 20195670 and SIP 20181601.

Acknowledgments

Authors thanks Valeria Perdómo and Claudia Moreno for their help in the collection of aquatic macroinvertebrates. María Elena Sánchez edited the English manuscript.

Conflicts of Interest

The authors declare no conflicts of interest.

References

  1. Bastin, J.-F.; Berrahmouni, N.; Grainger, A.; Maniatis, D. The extent of forest in dryland biomes. Science 2017, 356, 635–638. [Google Scholar] [CrossRef] [PubMed] [Green Version]
  2. Mittermeier, R.A.; Turner, W.R.; Larsen, F.W.; Brooks, T.M.; Gascon, C. Global Biodiversity Coservation: The Critical Role of Hotspots. In Biodiversity Hotspots; Zachos, F., Habel, J., Eds.; Springer: Berlin/Heidelberg, Germany, 2011; pp. 3–22. Available online: https://doi.org/10.1007/978-3-642-20992-5_1 (accessed on 3 May 2019).
  3. Davies, B.R.; Thoms, M.C.; Walker, K.F.; O’Keefe, J.H.; Gore, J.A. Drylands Rivers: Their ecology, conservation and management. In The Rivers Handbook: Hydrological and Ecological Principles; Calow, P., Petts, G.E., Eds.; Blackwell: Oxford, UK, 1994; Volume 2, pp. 484–512. Available online: https://doi.org/10.1002/9781444313871.ch25 (accessed on 3 May 2019).
  4. Walker, K.F.; Sheldon, F.; Puckridge, J.T. A perspective on dryland river ecosystems. River Res. Appl. 1995, 11, 85–104. [Google Scholar] [CrossRef]
  5. Powell, D.M. Drylands Rivers: Processes and Forms. In Geomorphology of Desert Environments, 2nd ed.; Parsons, A.J., Abrahams, A.D., Eds.; Springer: Dordrecht, The Netherlands, 2009; pp. 333–372. Available online: https://doi.org/10.1007/978-1-4020-5719-9_12 (accessed on 3 May 2019).
  6. Amoros, C.; Bornotte, G. Connectivity and biocomplexity in waterbodies of riverine floodplains. Freshw. Biol. 2002, 47, 761–776. [Google Scholar] [CrossRef]
  7. Poff, N.L.; Olden, J.D.; Merritt, D.M.; Pepin, D.M. Homogenization of regional river dynamics by dams and global biodiversity implications. Proc. Natl. Acad. Sci. USA 2007, 104, 5732–5737. [Google Scholar] [CrossRef] [PubMed] [Green Version]
  8. Sheldon, F. Incorporating natural variability into the assessment of ecological health in Australian Dryland rivers. Hydrobiologia 2005, 552, 45–56. [Google Scholar] [CrossRef]
  9. Few, R.; Satyal, P.; McGahey, D.M.; Leavy, J.; Budds, J.; Assen, M.; Camfield, L.; Louser, D.; Adnew, M.; Bewket, W. Vulnerability and Adaptation to Climate Change in Semi-Arid Areas in East Africa. ASSAR Working Paper, ASSAR PMU 2015. Available online: http://www.assar.uct.ac.za/sites/default/files/image_tool/images/138/RDS_reports/EAST-AFRICA/East%20Africa%20RDS%20full%20report%20-%20revised.pdf (accessed on 3 May 2019).
  10. Arab Water Council. Vulnerability of arid and semi-arid regions to climate change—Impacts and adaptive strategies. In Perspectives on Water and Climate Change Adaptation; Arab Water Council: Cairo, Egypt, 2019; Available online: https://www.preventionweb.net/files/12914_PersPap09.AridandSemiAridRegions1.pdfñAqW23 (accessed on 3 May 2019).
  11. Mott Lacroix, K.E.; Tapia, E.; Springer, A. Environmental flows in the desert rivers of the United States and Mexico: Synthesis of available data and gap analysis. J. Arid Environ. 2017, 140, 67–78. [Google Scholar] [CrossRef]
  12. SAGARPA. Available online: http://www.atlaszonasaridas.com.mx/ (accessed on 1 May 2019).
  13. SEMARNAT. Available online: https://www.gob.mx/semarnat/prensa/el-area-natural-protegida-tehuacan-cuicatlan-ya-es-patrimonio-de-la-humanidad-163342?idiom=es (accessed on 1 May 2019).
  14. UNESCO. Available online: http://www.unesco.org/new/es/media-services/single-view/news/tehuacan_cuicatlan_a_la_lista_del_patrimonio_mundial_como/ (accessed on 2 May 2019).
  15. Téllez-Valdés, O.; Dávila-Aranda, P. Áreas protegidas y cambio climático: Un estudio de caso de los cactos en la Reserva de la Biosfera Tehuacán-Cuicatlán, México. Conserv. Biol. 2003, 17, 846–853. [Google Scholar]
  16. Blanchette, M.L.; Pearson, R.G. Macroinvertebrate assemblages in rivers of the Australian dry tropics are highly variable. Freshw. Sci. 2012, 31, 865–881. [Google Scholar] [CrossRef]
  17. Chessman, B.C.; Thurtell, L.A.; Royal, M.J. Bioassessment in A Harsh Environment: A comparison of macroinvertebrate assemblages at reference and assessment sites in an Australian inland river system. Environ. Monit. Assess. 2006, 119, 303–330. [Google Scholar] [CrossRef]
  18. Kaboré, I.; Moog, O.; Alp, M.; Guenda, W.; Koblinger, T.; Mano, K.; Ouéda, A.; Ouédraogo, R.; Trauner, D.; Melcher, A.H. Using macroinvertebrates for ecosystem health assessment in semi-arid streams of Burkina Faso. Hydribiologia 2015, 766, 57–74. [Google Scholar] [CrossRef]
  19. Mabidi, A.; Bird, M.S.; Perissinotto, R. Distribution and diversity of aquatic macroinvertebrate assemblages in a semi-arid region earmarket for shale gas exploration (Eastern Cape Karoo, South Africa). PLoS ONE 2017, 12, e0178559. [Google Scholar] [CrossRef] [PubMed]
  20. Mellado, A.; Suárez, M.L.; Vidal-Abarca, M.R. Biological traits of stream macroinvertebrates from a semiarid catchment: Patterns along complex environmental gradients. Freshw. Biol. 2008, 53, 1–21. [Google Scholar]
  21. Rocha, L.G.; Medeiros, E.S.F.; Andrade, H.T.A. Influence of flow variability on macroinvertebrate assemblages in an intermittent stream of semi-arid Brazil. J. Arid Environ. 2012, 85, 33–40. [Google Scholar] [CrossRef]
  22. Giam, X.; Chen, W.; Scriever, T.A.M.; van Driesche, R.; Muneepeerakul, R.; Lytle, D.A.; Olden, J.D. Hydrology drives seasonal variation in dryland stream macroinvertebrate communities. Aquat. Sci. 2016, 79, 705–717. [Google Scholar] [CrossRef]
  23. Moreno, J.L.; Angeler, D.G.; de las Heras, J. Seasonal dynamics of macroinvertebrate communities in a semiarid saline springs stream with contrasting environmental conditions. Aquat. Ecol. 2010, 44, 177–193. [Google Scholar] [CrossRef]
  24. Alvial, I.E.; Tapia, D.H.; Castro, M.J.; Duran, B.C.; Verdugo, C.A. Analysis of benthic macroinvertebrates and biotic indices to evaluate water quality in rivers impacted by mining activities in northern Chile. Knowl. Manag. Aquat. Ecosyst. 2012, 407, 1–16. [Google Scholar] [CrossRef]
  25. Miserendino, M. Macroinvertebrate functional organization and water quality in a large arid river from Patagonia (Argentina). Int. J. Limnol. 2007, 43, 133–145. [Google Scholar] [CrossRef]
  26. Ruiz-Picos, R.A.; Sedeño-Díaz, J.E.; López-López, E. Assessing ecological impairments in Neotropical rivers of Mexico: Calibration and validation of the Biomonitoring Working Party Index. Int. J. Environ. Sci. Technol. 2017, 4, 1835–1852. [Google Scholar] [CrossRef]
  27. SEMARNAT; CONANP. Programa de Manejo de la Reserva de la Biosfera Tehuacán-Cuicatlán, 1st ed.; SEMARNAT: Ciudad de México, Mexico, 2013.
  28. Brunet, J. Geologic studies. In The Prehistory of the Tehuacan Valley; Environment and Subsistance; Byers, D.S., Ed.; Robert S. Peabody Foundation: Austin, TX, USA, 1967; Volume I, pp. 66–90. [Google Scholar]
  29. García, E. Modificaciones al Sistema de Clasificación Climática (Para Adaptarlo a las Condiciones de la República Mexicana, 6th ed.; UNAM: Mexico City, Mexico, 2004; p. 90. [Google Scholar]
  30. INEGI. Available online: http://www.beta.inegi.org.mx/temas/mapas/climatologia/ (accessed on 1 May 2019).
  31. Barbour, M.T.; Gerritsen, J.; Snyder, B.D.; Stribling, J.B. Rapid Bioassessment Protocols for Use in Streams and Wadeable Rivers: Periphyton Benthic Macroinvertebrates and Fish; US Environmental Protection Agency: Washington, DC, USA, 1999.
  32. Thorp, J.H.; Covich, A.P. An Overview of Freshwater Habitats. In Ecology and Classification of North American Freshwater Invertebrates, 2nd ed.; Academic Press: Fort Collins, CO, USA, 2001. [Google Scholar]
  33. Merrit, R.W.; Cummins, K.W.; Berg, M.B. An Introduction to the Aquatic Insects of North America; Kendall/Hunt Publishing Company: Dubuque, IA, USA, 2008. [Google Scholar]
  34. Rodríguez-Romero, A.J.; Rico-Sánchez, A.E.; Mendoza-Martínez, E.; Gómez-Ruiz, A.; Sedeño-Díaz, J.E.; López-López, E. Impact of Changes of Land Use on Water Quality, from Tropical Forest to anthropogenic Occupation: A Multivariate Approach. Water 2018, 10, 1518. [Google Scholar] [CrossRef]
  35. Dinius, S.H. Desing of an index of water quality. Water Resour. Bull. 1987, 23, 833–843. [Google Scholar] [CrossRef]
  36. Sing, K.P.; Malik, A.; Mohan, D.; Sinha, S. Multivariate statistical techniques for the evaluation of spatial and temporal variations in water quality of Gomti River (India): A case study. Water Res. 2004, 38, 3980–3992. [Google Scholar] [CrossRef] [PubMed]
  37. Massart, D.L.; Vander, H.Y. Practical data handling: From tables to visuals, principal component analysis, Part 1. LG GC Eur. 2004, 17, 586–591. [Google Scholar]
  38. Li, X.; Li, P.; Wang, D.; Wang, Y. Assessment of temporal and spatial variations in waterquality using multivariate statistical methods: A case study ofthe Xin’anjiang River, China. Front. Environ. Sci. Eng. 2014, 8, 895–904. [Google Scholar] [CrossRef]
  39. Evansa, C.D.; Daviesa, T.D.; Wigington, P.J., Jr.; Tranter, M.; Kretser, W.A. Use of factor analysis to investigate processes controlling the chemical composition of four streams in the Adirondack Mountains, New York. J. Hydrol. 1996, 185, 297–316. [Google Scholar] [CrossRef]
  40. Grande, J.A.; González, A.; Beltrán, R. Application of factor analysis to the study of contamination in the aquifer system of Ayamonte-Huelva (Spain). Groundwater 1996, 34, 155–161. [Google Scholar] [CrossRef]
  41. Razmkhah, H.; Abrishamchi, A.; Torkian, A. Evaluation of spatial and temporal variation in water quality by pattern recognition techniques: A case study on Jajrood River (Tehran, Iran). J. Environ. Manag. 2010, 91, 852–860. [Google Scholar] [CrossRef] [PubMed]
  42. Alberto, W.D.; Del Pilar, D.M.; Valeria, A.M.; Fabiana, P.S.; Cecilia, H.A.; De Los Angeles, B.M. Pattern recognition techniques for the evaluation of spatial and temporal variations in wáter quality. A case study: Suquía River basin. (Córdoba-Argentina). Water Res. 2001, 35, 2881–2894. [Google Scholar]
  43. Dolédec, S.; Chessel, D. Co-inertia analysis: An alternative method for studying species-environment relationships. Freshw. Biol. 1994, 31, 277–294. [Google Scholar] [CrossRef]
  44. Franquet, E.; Chessel, S. Approche statistique des composantes spatiales et temporelles de la relation faune-milieu. C. R. Acad. Sci. Paris Sci. Vie. 1994, 317, 202–206. [Google Scholar]
  45. Franquet, E.; Dolédec, S.; Chessel, D. Using multivariate analyses for separating spatial and temporal effects within species-environment relationships. Hydrobiologia 1995, 300–301, 97–112. [Google Scholar]
  46. Chessel, D.; Dolédec, S.; ADE softwere. Multivariate Analysis and Graphical Display for Environmental Data Version 3.4; Volume 1 User Manual, Volume 2 Examples, Volume 3 Graphics Documentation; Univeristy Lyon: Lyon, France, 1992; p. 523. [Google Scholar]
  47. Thioulouse, J.; Chessel, D.; Dolédec, S.; Olivier, J.M. ADE-4: A multivariate analysis and graphical display software. Stat. Comput. 1997, 7, 75–83. [Google Scholar] [CrossRef]
  48. van der Aa, M. Classification of mineral water types and comparison with drinking water standards. Environ. Geol. 2003, 44, 554–563. [Google Scholar] [CrossRef] [Green Version]
  49. Rhoades, J.D.; Kandiah, A.; Mashali, A.M. The Use of Saline Waters for Crop Production—FAO Irrigation and Drainage Paper 48; Food and Agriculture Organization of the United Nations: Rome, Italy, 1992. [Google Scholar]
  50. SGS-U.S. Geological Survey Office of Water Quality. USGS Water-Quality Information: Water Hardness and Alkalinity. Available online: usgs.gov.water.usgs.gov/owq/hardness-alkalinity.html (accessed on 3 April 2019).
  51. Kerr, J. Multiple land use activities drive riverine salinization in a large, semi-arid river basin in western Canada. Limnol. Oceanogr. 2017, 62, 1331–1345. [Google Scholar] [CrossRef]
  52. Shrivastava, P.; Kumar, R. Soil salinity: A serious environmental issue and plant growth promoting bacteria as one of the tools for its alleviation. Saudi J. Biol. Sci. 2015, 22, 123–131. [Google Scholar] [CrossRef] [PubMed]
  53. INEGI. Available online: https://www.inegi.org.mx/temas/edafologia/ (accessed on 3 May 2019).
  54. Stum, W.; Morgan, J.J. Aquatic Chemistry, 3rd ed.; Wiley: New York, NY, USA, 1996. [Google Scholar]
  55. Crosa, G.; Froebrich, J.; Nikolayenki, V.; Stegani, F.; Galli, P.; Calamari, D. Spatial and seasonal variations in the water quality of the Amu Darya River (Central Asia). Water Res. 2006, 40, 2237–2245. [Google Scholar] [CrossRef]
  56. Ahearn, D.S.; Sheibley, R.W.; Dahlgren, R.A.; Anderson, M.; Johnson, J.; Tate, K.W. Land use and land cover influence on water quality in the last free-flowing river draining the western Sierra Nevada, California. J. Hydrol. 2005, 313, 234–247. [Google Scholar] [CrossRef]
  57. Lawniczak, A.E.; Zbierska, J.; Nowak, B.; Achtenberg, K.; Grzeskowiak, A.; Kanas, K. Impact of agriculture and land use on nitrate contamination in groundwater and running waters in central-west Poland. Environ. Monit. Assess. 2016, 188, 172. [Google Scholar] [CrossRef]
  58. Wen, Y.; Schoups, G.; van de Giesen, N. Organic pollution of rivers: Combined threats of urbanization, livestock farming and global climate change. Sci. Rep. 2017, 7, 43289. [Google Scholar] [CrossRef]
  59. Uriarte, M.; Yackulic, C.B.; Lim, Y.; Arce-Nazario, J.A. Influence of land use on water quality in a tropical landscape: A multi-scale analysis. Landsc. Ecol. 2011, 26, 1151–1164. [Google Scholar] [CrossRef]
  60. Sedeño-Díaz, J.E.; López López, E. Water Quality in the Río Lerma, Mexico: An Overviewof the Last Quarter of the Twentieth Century. Water Resour. Manag. 2007, 21, 1797–1812. [Google Scholar] [CrossRef]
  61. Allan, D. Landscapes and rivescapes: The influence of land use on stream scosystems. Annu. Rev. Ecol. Evol. Syst. 2004, 35, 57–84. [Google Scholar] [CrossRef]
  62. Arheimer, B.; Lidén, R. Nitrogen and phosphorus concentrations from agricultural catchments-influence of spatial and temporal variables. J. Hydrol. 2000, 227, 140–159. [Google Scholar] [CrossRef]
  63. Wise, D.R.; Johnson, H.M. Suface-water nutrient conditions and sources in the United States Pacific Northwest. J. Am. Water Resour. Assoc. 2011, 47, 1110–1135. [Google Scholar] [CrossRef] [PubMed]
  64. Borrok, D.M.; Engle, M.A. The role of climate in increasing salt loads in Dryland Rivers. J. Arid Environ. 2014, 111, 7–13. [Google Scholar] [CrossRef]
  65. CIIDIR. Proyecto: Vulnerabilidad y Adaptación de Los Sectores y Sistemas de Interés Para el Estado de Oaxaca, Ante Los Efectos del Cambio Climático; Instituto Politécnico Nacional Oaxaca: Oaxaca, Mexico, 2013. [Google Scholar]
  66. Cañedo-Argüelles, M.; Boga, M.T.; Lytle, D.A.; Prat, N. Are Chironomidae (Diptera) good indicators of water scarcity? Dyland streams as a case study. Ecol. Indic. 2016, 71, 155–162. [Google Scholar] [CrossRef]
  67. Bunn, S.E.; Davies, P.M. Community structure of the macroinvertebrates fauna and water quality of a saline river system in south-western Australia. Hydrobiologia 1992, 248, 143–160. [Google Scholar] [CrossRef]
  68. Zinchenko, T.D.; Golovatyuk, L.V. Salinity tolerance of macroinvertebrates in stream waters. Arid Ecosyst. 2013, 3, 113–121. [Google Scholar] [CrossRef]
  69. Timpano, A.J.; Schoenholtz, S.H.; Soucek, D.J.; Zipper, C.E. Benthic macroinvertebrate community response to salinization in headwater streams in Appalachia USA over multiple years. Ecol. Indic. 2018, 91, 645–656. [Google Scholar] [CrossRef]
  70. Alhejoj, I.; Salameh, E.; Bandel, K. Mayflies (Order Ephemeroptera): An effective indicator of water bodies conditions in Jordan. IJSRES 2014, 2, 361–370. [Google Scholar] [CrossRef]
  71. Kefford, B.J.; Dalton, A.; Palmer, C.S.; Nugegoda, D. The salinity tolerance of eggs and hathlings of selected aquatic macroinvertebrates in south-east Australia and South Africa. Hydrobiologia 2004, 517, 179–192. [Google Scholar] [CrossRef]
  72. Kefford, B.J.; Fields, E.J.; Clay, C.; Nugegoda, D. Salinity tolerance of riverine microinvertebrates from the southern Murray-Darling Basin. Mar. Freshw. Res. 2007, 58, 1019–1031. [Google Scholar] [CrossRef]
  73. Jaeger, K.L.; Olden, J.D.; Pelland, N.A. Climate change poised to threaten hydrologic connectivity and endemic fishes in dryland streams. Proc. Natl. Acad. Sci. USA 2014, 111, 13894–13899. [Google Scholar] [CrossRef] [PubMed] [Green Version]
  74. Vammen, K.; Vaux, H. Water Quality in the Americas Risks and Opportunities; Interamerican Network of Academies of Sciences: Ciudad de México, Mexico, 2019; pp. 12–18. [Google Scholar]
  75. Schlaepfer, D.R.; Bradford, J.B.; Lauenroth, W.K.; Munson, S.M.; Tietjen, B.; Hall, S.A.; Wilson, S.D.; Duniway, M.C.; Jia, G.; Pyke, D.A.; et al. Climate change reduces extent of temperature drylands and intensifies drought in deep soil. Nat. Commun. 2017, 8, 14196. [Google Scholar] [CrossRef] [PubMed]
  76. Gutiérrez-Cánovas, C.; Sánchez-Fernández, D.; Cañedo-Argüelles, M.; Millán, A.; Velasco, J.; Acosta, R.; Fortuño, P.; Otero, N.; Soler, A.; Bonada, N. Do all roads to Rome? Exploring community trajectories in response to anthropogenic salinization and dilution of rivers. Philos. Trans. R. Soc. B 2018, 374, 20180009. [Google Scholar] [CrossRef]
Figure 1. Study area (Tehuacán-Cuicatlán Biosphere Reserve (TCBR)). Location of study sites in the Río Salado and Río Grande sub-basins. Study sites: Barranca Oscura (BO) and the Río Salado (RSa) in the Río Salado sub-basin. Quiotepec (Qt), Santiago Dominguillo (SD), Santa María Texcatitlán (Tx), Valerio Trujano (VT), Tecomavaca (TV), El Cacahuatal (Ch), the Río Grande (RGo), Santa María Ixcatlán Sabinos (SMIs), Santa María Ixcatlán Poza (SMIp), and San Pedro Nodón (SPN) in the Río Grande sub-basin.
Water 11 01376 g001
Figure 2. Environmental conditions and land use in the TCBR. (a) Climate type map; (b) precipitation map; (c) land use and land cover map. Climate types: (A)C(wo): semi-warm subhumid; BS1(h’)w: warm semi-arid; BS1kw: semi-arid, temperate; BSo(h’)w: arid, warm; BSohw: arid, semi-warm; BW(h’)w: arid, warm; C(w1): temperate, subhumid, summer rains with precipitation/temperature index (P/T) between 43.2 and 55; C(w2): temperate, subhumid, summer rains with a P/T higher than 55; C(wo): temperate, subhumid, summer rains with a P/T less than 43.2; and Cb’(w2): semi cold, subhumid.
Water 11 01376 g002
Figure 3. Box and whisker plot of mean values of the water quality index (WQI) for the Río Grande and Río Salado.
Water 11 01376 g003
Figure 4. Box and whisker plot of mean values of WQI between dry (April and January) and rainy (September) seasons for all study sites in the Río Grande and Río Salado. RG = Río Grande, RS = Río Salado, Sep = September, Jan = January, and Ap = April. Letters represent groups of Newman–Keuls test with significant differences.
Water 11 01376 g004
Figure 5. Biplots of the discriminant analysis (DA) of the two hydrographic systems of the Tehuacán-Cuicatlán Biosphere Reserve. (a) Centroids of the Río Salado (RS) and Río Grande (RG) hydrographic systems. (b) Vectors of environmental factors. RG = Río Grande, RS = Río Salado, Sep = September, Jan = January, Ap = April.
Water 11 01376 g005
Figure 6. Land use (%) in the study sites buffers of the Río Salado and Río Grande sub-basins.
Water 11 01376 g006
Figure 7. Total number of families within the orders of aquatic macroinvertebrates for the Río Grande and Río Salado.
Water 11 01376 g007
Figure 8. Box and whisker plots of values of the number of families of aquatic macroinvertebrates in the Río Grande and Río Salado.
Water 11 01376 g008
Figure 9. Box and whisker plots of mean values of the number of aquatic macroinvertebrate families per study period. RG = Río Grande, RS = Río Salado, Sep = September; Jan = January, Ap = April. Letters represent groups of Newman–Keuls test with significant differences.
Water 11 01376 g009
Figure 10. Co-inertia diagrams. (a) Vectors of physical and chemical factors; (b) taxa (order) of aquatic macroinvertebrates; (c) study sites of the Río Salado sub-basin: RSa and BO (Group 1); (d) study sites Tx and VT (Group 2); (e) study site SD (Group 3); (f) study sites SMIp, SMIs, and SPN (Group 4); (g) study sites RGo, Qt, and Ch (Group 5).
Water 11 01376 g010
Table 1. Mean values (± Standard Error, SE) of the physical and chemical parameters assessed in the study sites of the Río Salado and Río Grande.
Río SaladoRío Grande
Alkalinity (mg L−1) a261.89 (±24.6)161.21 (±7.90)
Cl- (mg L−1) a379.60 (±55.29)28.45 (±13.86)
Col. Fec. (MPN)281.68 (±171.09)245.85 (±69.43)
Col. Total (MPN)349.26 (±167.96)393.64 (±89.59)
Color (U Pt-Co)65.4 (±38.66)12.12 (±2.04)
Cond µS/cm a2627.6 (±33.5)403.82 (±23.56)
BOD5 (mg L−1)1.40 (±0.28)1.520 (±0.18)
Hardness (mg L−1)156.55 (±28.26)103.90 (±6.96)
NH3 (mg L−1)0.28 (±0.11)0.16 (±0.03)
NO2 (mg L−1)0.01 (±0.001)0.01 (±0.001)
NO3 (mg L−1)1.76 (±0.30)1.78 (±0.16)
NT (mg L−1)2.71 (±0.50)2.46 (±0.34)
DO (mg L−1)8.59 (±0.51)8.91 (±0.20)
O-PO4 (mg L−1)0.52 (±0.15)0.47 (±0.08)
pH8.90 (±0.29)9.00 (±0.15)
PT (mg L−1)0.76 (±0.14)1.02 (±0.12)
Salinity (PSU) a1.35 (±0.18)0.18 (±0.01)
SO4 (mg L−1) a283.15 (±37.05)33.25 (±6.20)
TSS (mg L−1)66.9 (±48.88)16.01 (±6.15)
Temp. water (°C) b25.36 (±1.22)22.46 (±0.50)
Temp. Air (°C) b27.38 (±1.48)25.06 (±0.65)
Turbidity (UFT)84.43 (±28.54)56.54 (±4.76)
Current velocity (m/s)1.27 (±0.39)1.19 (±0.27)
Values in bold represent significant differences (p < 0.05): a Kruskal–Wallis and b ANOVA Newman–Keuls.
Table 2. Mean values of relative abundance of Ephemeroptera-Plecoptera-Trhichoptera (EPT) and Oligochaeta-Chironomidae (Oligo-Chiro) indices in the study sites and periods of the Río Grande and Río Salado.
Sub-BasinStudy SiteEPTOligo-ChiroStudy SiteEPTOligo-ChiroStudy SiteEPTOligo-Chiro
201520162017
Río GrandeCH Ap64.817.41CH Ap71.170.36CH Jan45.132.73
QT Ap51.677.84QT Ap47.240.06QT Jan39.393.08
RG Ap37.503.19RG Ap45.480.23RG Jan40.330.58
SNP Ap75.480.05SNP Ap30.951.30SPN Jan82.070.01
SMIp Ap95.240.00SMIp Ap5.663.19SMIp Jan61.580.09
SMIs Ap34.030.00SMIs Ap41.100.01SMIS Jan41.220.14
TX Ap88.460.04SD Ap60.561.59SD Jan54.220.05
SD Ap61.810.16TV Ap59.743.95VT Jan77.761.09
TV Ap72.560.04VT Ap41.890.05
CH Sep46.1524.62CH Sep25.800.61
QT Sep21.541.72QT Sep43.794.97
RG Sep60.0032.00RG Sep45.724.76
SNP Sep58.500.54SNP Sep59.292.17
SMIp Sep5.190.00SMIp Sep53.210.03
SMI Sep73.810.00SMIs Sep89.230.25
TX Sep87.681.45SD Sep62.651.55
SD Sep68.530.02TV Sep49.120.00
TV Sep35.290.00VT Sep57.473.37
Río SaladoBO Ap27.590.70BO Ap22.940.06BO Jan26.6715.76
RS Ap75.001.34RS Ap74.581.40RS Jan76.150.94
BO Sep17.3913.04BO Sep14.660.07
RS Sep0.000.00RS Sep23.5335.35

