Article

Precipitation Variations under a Changing Climate from 1961–2015 in the Source Region of the Indus River

1
Key Laboratory of Remote Sensing and Geospatial Science, Northwest Institute of Eco-Environment and Resources, Chinese Academy of Sciences, Lanzhou 730000, China
2
University of Chinese Academy of Sciences, Beijing 100049, China
3
Institute of Tibetan Plateau Research, Chinese Academy of Sciences, Beijing 100101, China
4
CAS Center for Excellence in Tibetan Plateau Earth Sciences, Chinese Academy of Sciences, Beijing 100101, China
5
Water Management Research Center, University of Agriculture, Faisalabad 38040, Pakistan
6
Irrigation and Drainage Department, University of Agriculture, Faisalabad 38040, Pakistan
*
Author to whom correspondence should be addressed.
Water 2019, 11(7), 1366; https://doi.org/10.3390/w11071366
Submission received: 3 June 2019 / Revised: 21 June 2019 / Accepted: 27 June 2019 / Published: 1 July 2019
(This article belongs to the Section Hydrology)

Abstract

:
The source region of the Indus River (SRIR), which is located in the Hindukush, Karakoram and Himalayan (HKH) mountainous range and on the Third Pole (TP), is very sensitive to climate change, especially precipitation changes, because of its multifarious orography and fragile ecosystem. Climate changes in the SRIR also have important impacts on social and economic development, as well as on the ecosystems of the downstream irrigation areas in Pakistan. This paper investigates the changes in precipitation characteristics by dividing the daily precipitation rate into different classes, such as light (0–10 mm), moderate (10.1–25 mm) and heavy precipitation (>25 mm). Daily precipitation data from gauging and non-gauging stations from 1961–2015 are used. The results of the analysis of the annual precipitation and rainy day trends show significant (p < 0.05) increases and decreases, respectively, while light and heavy precipitation show significant decreasing and increasing trends, respectively. The analysis of the precipitation characteristics shows that light precipitation has the highest number of rainy days compared to moderate or heavy precipitation. The analysis of the seasonal precipitation trends shows that only 18 stations have significant increasing trends in winter precipitation, while 27 stations have significant increasing trends in summer precipitation. Both short and long droughts exhibit increasing trends, which indicates that the Indus Basin will suffer from water shortages for agriculture. The results of this study could help policymakers cope with floods and droughts and sustain eco-environmental resources in the study area.

1. Introduction

The Indus Basin is among the world’s largest transboundary river basins. The southern part of this basin has subtropical arid and semiarid to temperate subhumid climates on the plains of Punjab and Sindh provinces, while the northern part has high-altitude mountainous highlands with humid climatic conditions. The annual precipitation ranges from approximately 2000 mm on the mountain slopes of the northern part to 100–500 mm in the lowlands of the southern part [1]. The upper part of this basin is the source region of the Indus River (SRIR). The SRIR is a distinctive area that has a multifarious climate, divergent physio-geographical features and distinct hydrological regimes [2,3]. The SRIR is situated on three of the world’s largest mountain ranges, i.e., the Hindukush, Karakoram and Himalayan (HKH) ranges and in the Third Pole (TP) region. The changing climate in the SRIR has accelerated the melting of glaciers, which has caused a higher contribution of snowmelt than precipitation in stream flow, which was confirmed by Immerzeel, Van Beek [4] via an investigation of the observed annual mean discharge from 2001 to 2005. A high elevation (above 4000 m) snowfall area contributes more than 70% of the stream flow in the study area [5,6]. The largest portion of the stream flow received at the Tarbela Dam on the Indus River comes from the melting of snow and glaciers in the Upper Indus River basin [7,8,9]. Due to the westerly disturbances, maximum precipitation occurs during the winter and spring seasons in the SRIR [10,11].
In arid and semiarid areas, a sufficient amount of precipitation is the key factor for obtaining high agricultural productivity, and the whole ecosystem, including agricultural productivity, is affected by a small deviation in precipitation [12,13]. Different classes of precipitation impose different effects on soil and vegetation. Light precipitation helps the growth of only grass by just wetting the surface soil, and deep-rooted plants receive benefits from moderate precipitation, which infiltrates the soil, while floods occur as a result of heavy precipitation, which then turns the soil much drier [14]. Precipitation is the vibrant part of the hydrologic cycle; therefore, variations in its characteristics directly affect water resources and ecosystems, floods and droughts [15]. Abbas [16] reported the recent occurrence of devastating floods in South Asia, including Pakistan, due to irregular monsoons. More than 20 million people were affected by the terrible monsoon floods in 2010, which destroyed their houses and agriculture. According to the Asian Development Bank (ADB) and World Bank (WB), 2010, this single flood event in 2010 caused US$10 billion in damage, and approximately US$5 billion of the damages were to the agricultural sector.
Climate change is the main reason for the variations in the amount, intensity and frequency of precipitation [17]. Precipitation intensities and frequencies will differ for precipitation events with the same amount [14]. According to Chen [18], the general concerns related to climate changes throughout the world are due to the magnification of the intensities and frequencies of extreme precipitation events. Therefore, it is essential to study the variations in the characteristics of precipitation from the perspective of a changing climate. Variations in characteristics of precipitation have transformed effects on the environment and society [19]. A hot climate is the main reason for precipitation occurring as rain instead of snow, and it also increases the melting of snow. According to Knowles [20], more precipitation occurs as rain instead of snow in North America during spring due to increases in temperature. The possibilities of floods and droughts during spring and summer in snow-covered areas increase because of these changes [14,21]. Knowledge of the occurrence of extreme events at the regional level is very important for understanding regional climatic patterns because it is very difficult to assess and predict extreme events [22]. Previous studies on climatic extremes have generally concentrated on maximum temperature and heavy precipitation and a large amount of studies have shown an increase in heavy precipitation and maximum temperatures [23,24]. According to the studies conducted by different researchers, there are large variations (spatial and temporal) in precipitation extremes and temperature patterns throughout the world, including Pakistan [25,26,27]. According to Lutz [3], the Upper Indus River Basin (UIRB) will experience intense and frequent extreme climate events in the future. Because of extreme climatic events, Pakistan is already facing severe floods and droughts and is under serious threats [28].
Many previous studies have mostly focused on extreme precipitation events in only one region or country in the HKH area, not the whole SRIR. In this study, from the perspective of the watershed, which is the fundamental component of Earth’s system and the basic unit of agricultural production and water resource management [29], we investigated the impact of precipitation characteristics based on light, moderate and heavy classes of precipitation and the number of rainy days of each class. We also determined the annual and seasonal trends of different classes of precipitation, as well as the trends of rainy days and short- and long-duration dry and wet spells. Daily precipitation data from 1961 to 2015 covering the entire SRIR, which includes 50 stations, were collected.

2. Materials and Methods
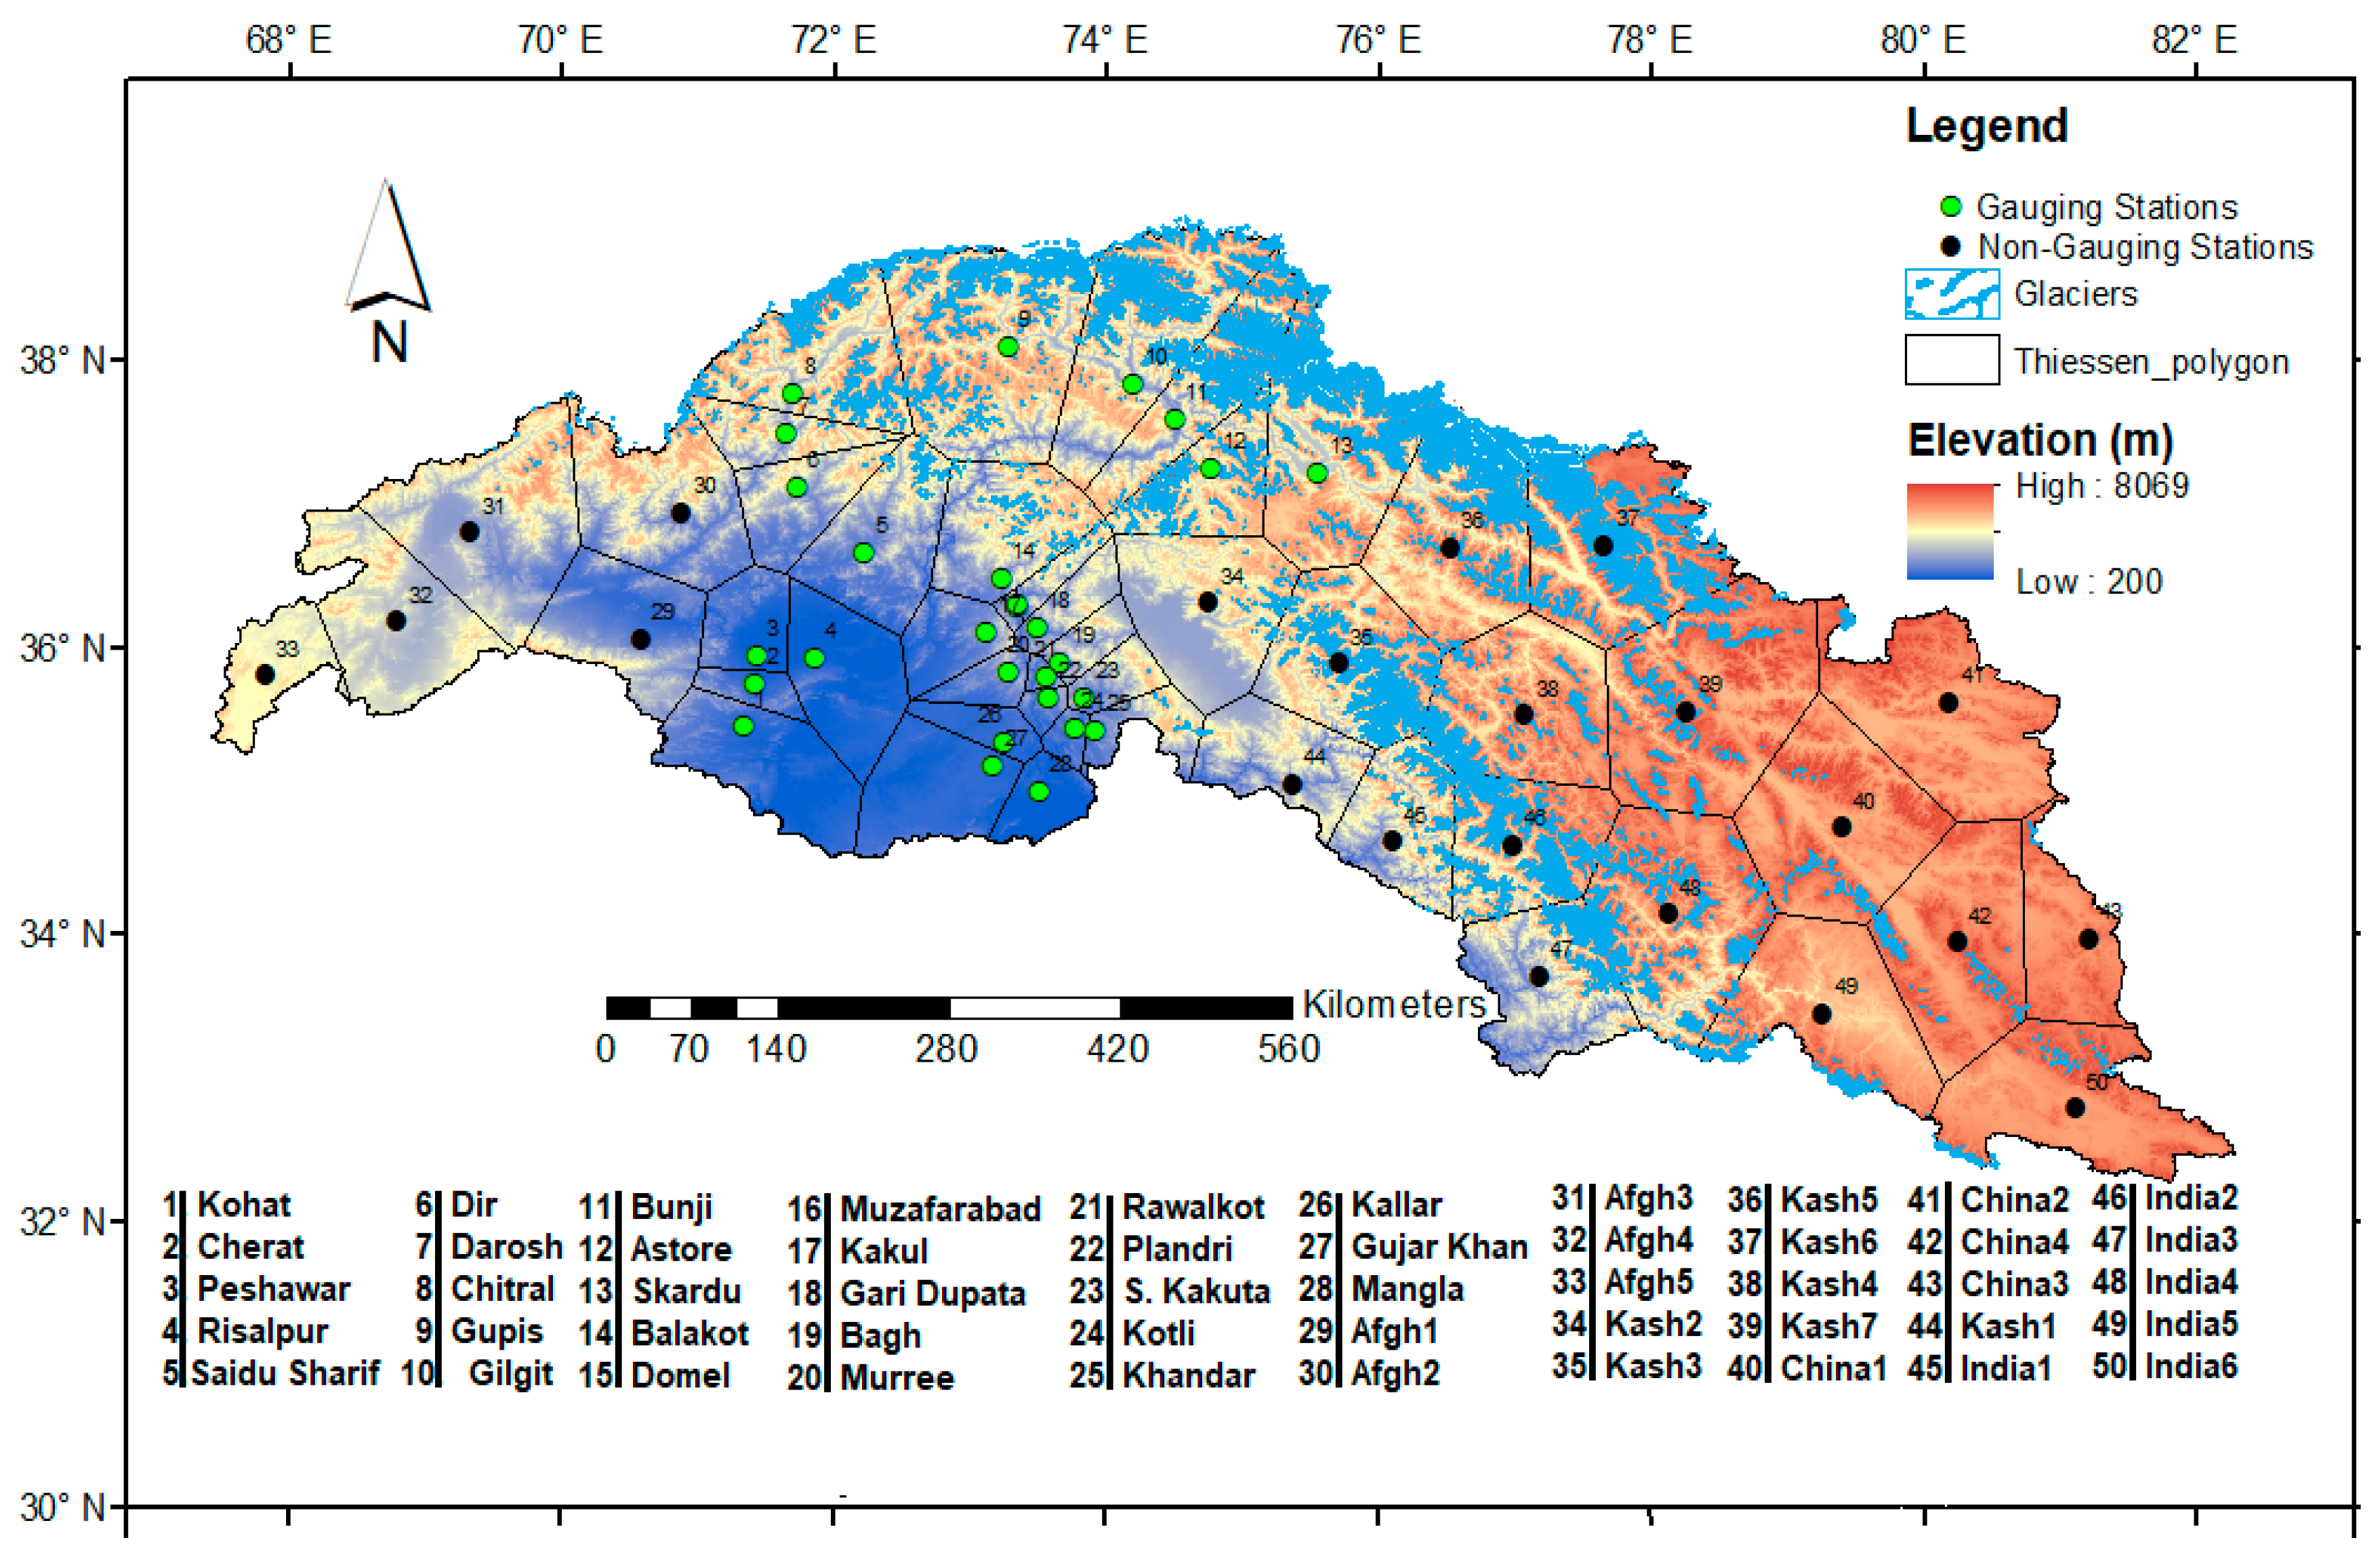
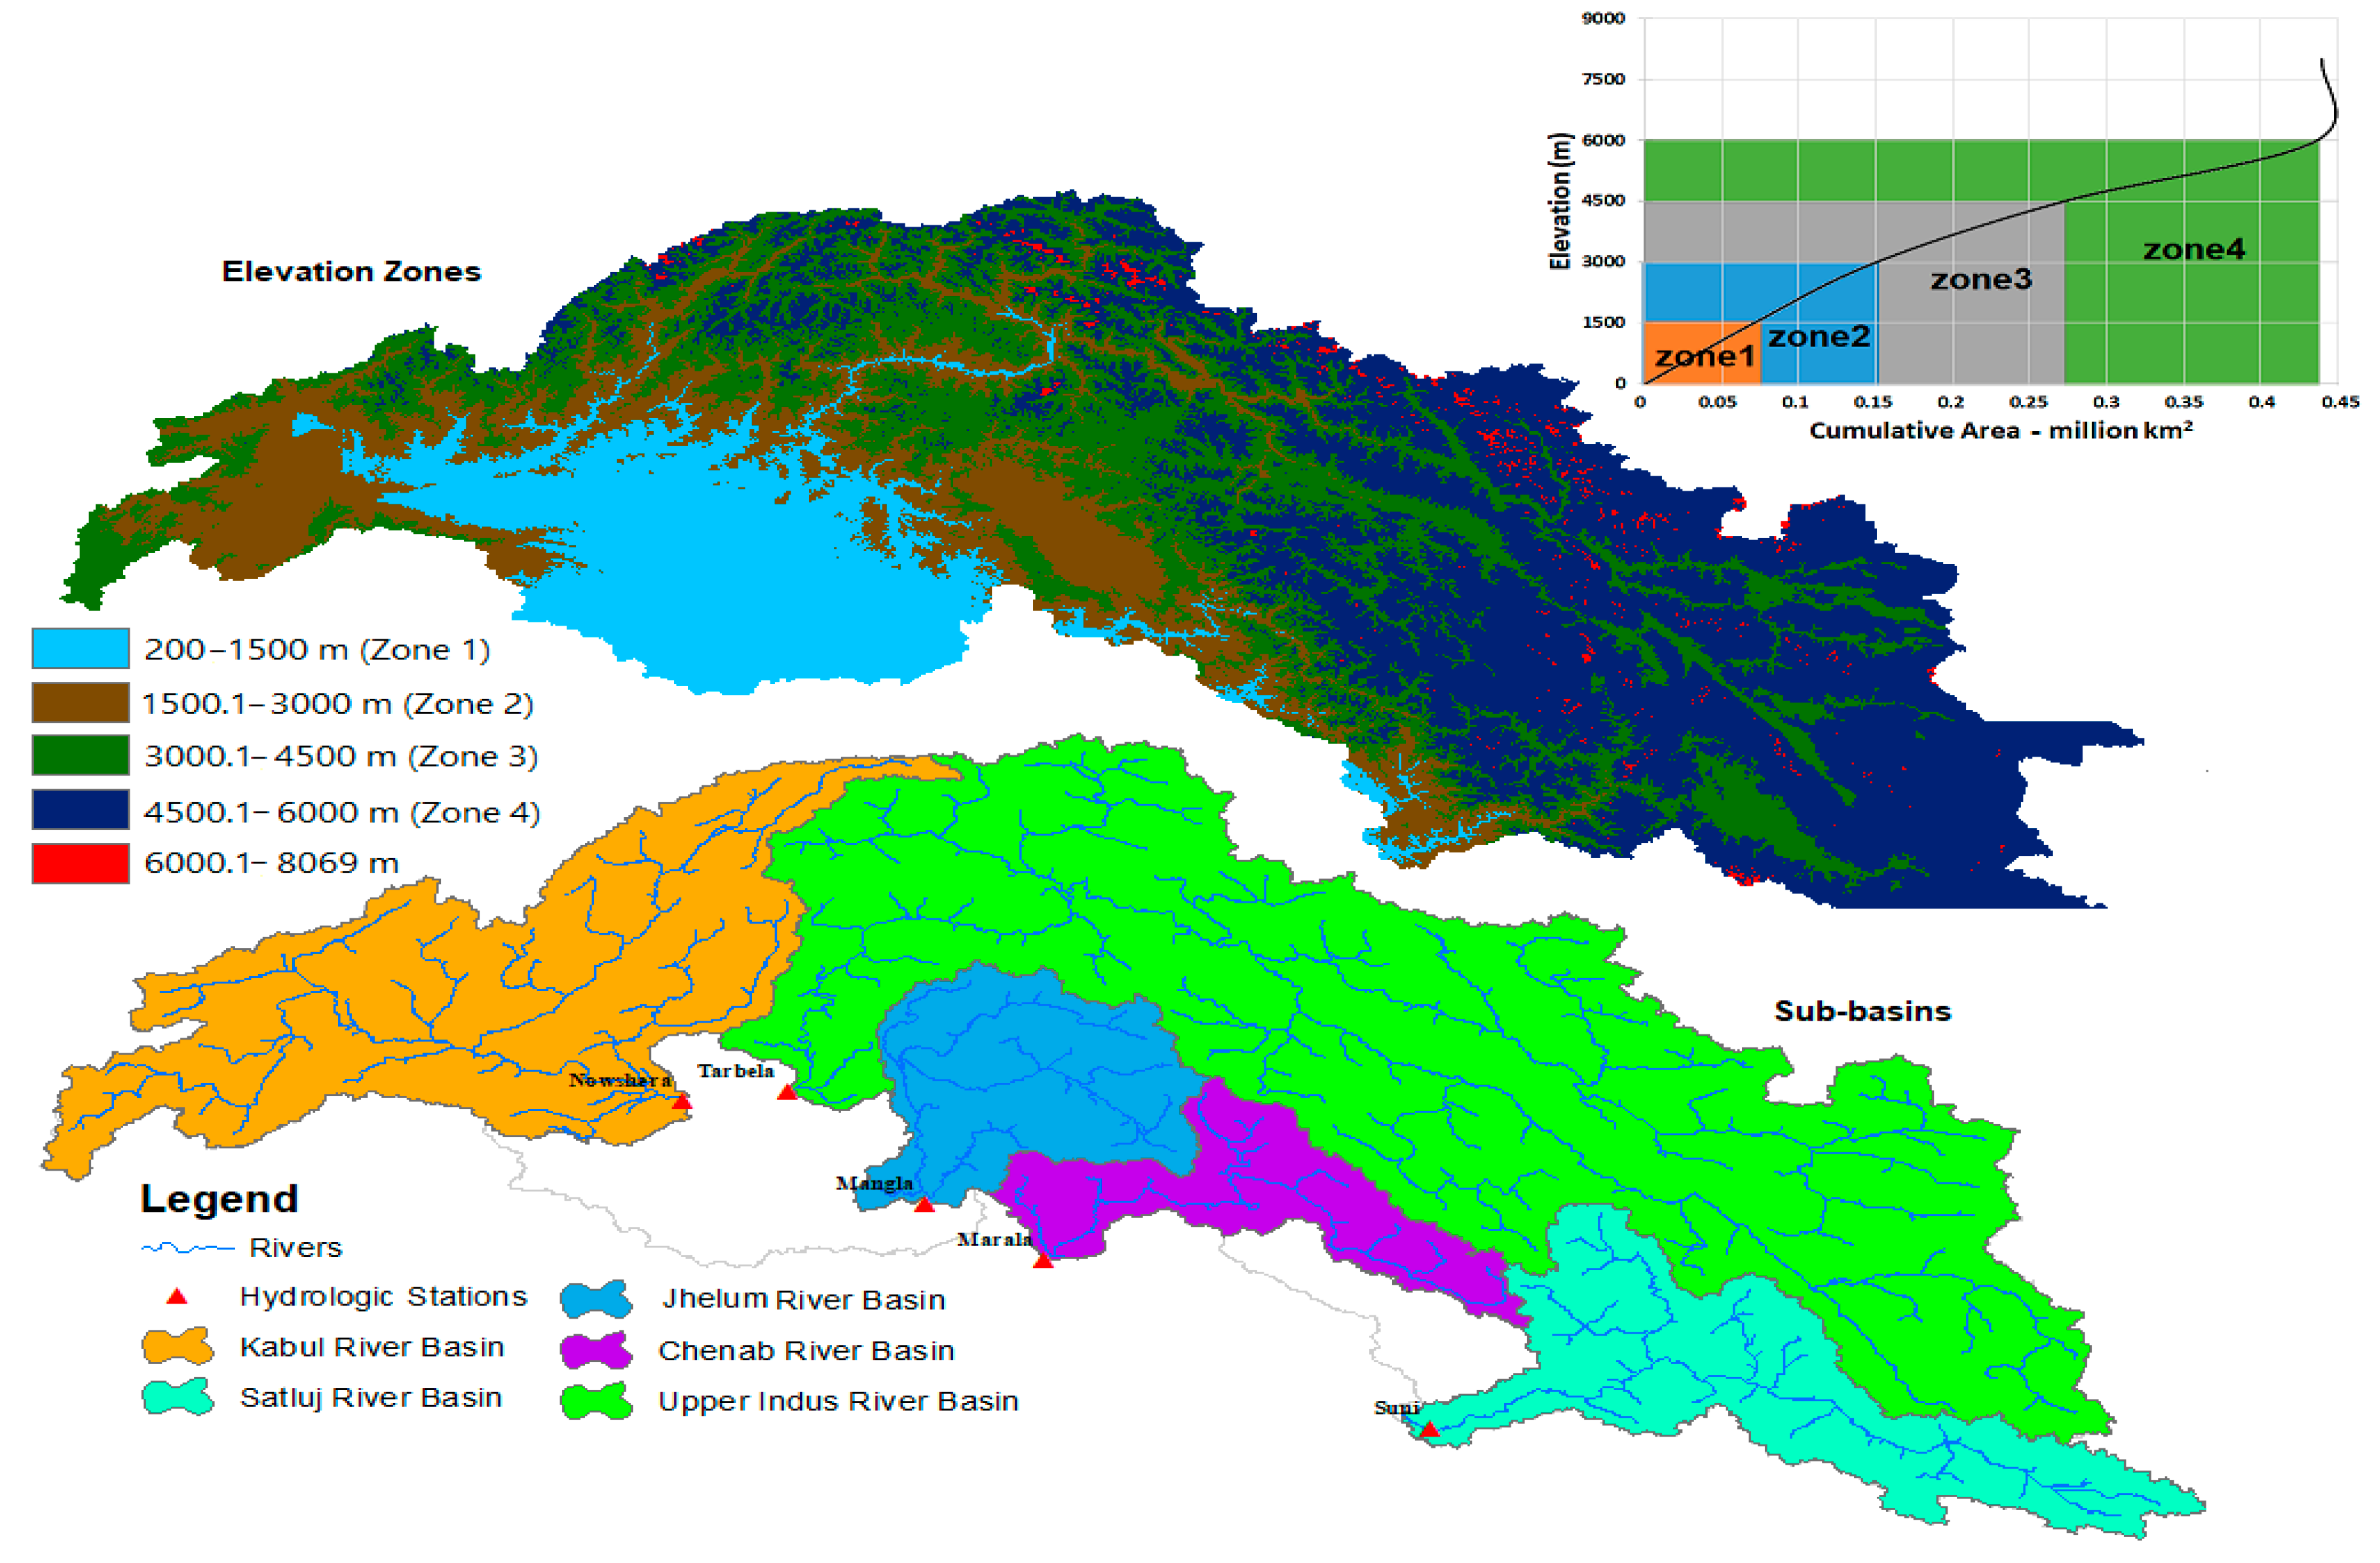
2.1. Study Area

The Indus Basin is a transboundary basin with a total area of approximately 1.12 million km2 that is distributed among four countries (Pakistan, India, China, and Afghanistan). The largest part of this basin lies in Pakistan, while the smallest part lies in Afghanistan. According to Immerzeel [4] and Lutz [30], who studied the source regions of all Asian basins in the Himalayas, the Indus Basin heavily relies on high-altitude water resources. The semiarid climate downstream of the Indus Basin, along with the high demands for water for agriculture, industry and the quickly growing population, has made the Upper Indus Basin a very important region [31]. The upper part of the Indus Basin, which is the SRIR, is selected as the study area to investigate the spatiotemporal characteristics of precipitation. The SRIR is located within the terrestrial range of 67.71–82.4° E and 30.4–37.07° N in the HKH mountainous range and on the TP. Approximately 11,000 glaciers are distributed in these ranges [2], making it one of the world’s most glaciated areas [32].
According to different studies on glaciers in the Western Himalayas, glacial mass balances are decreasing and glacier snouts are retreating [33]. The glaciated area of the Kabul River basin decreased by 40% from 1962–2002 [34]. A large number of glaciers in the north and west of Karakoram are decreasing, while some glaciers in the central part of Karakoram are showing an increase in mass balance [35,36]. The elevation in the study area, which was derived from a 90 m resolution digital elevation model (DEM) from the Shuttle Radar Topography Mission (SRTM) project governed by the US National Aeronautics and Space Administration (NASA), varies from 200 to 8069 m above sea level (Figure 1). The study area was divided into four elevation zones with an altitudinal difference of 1500 m between two successive zones for the zone-wise analysis of precipitation (Figure 2). Zone 4 has the highest area, while zone 1 has the lowest area. The SRIR is the main source of fresh water for agricultural, industrial and domestic use in Pakistan. The total catchment area of this source region is approximately 439,784 km2, and it plays a vibrant part in the development of the country.
The Indus River and its tributaries, i.e., the Jhelum, Chenab, Ravi and Satluj Rivers on the eastern side and the Kabul River on the western side, originate from the SRIR and flow through the Indus Basin down to the Arabian Sea. The Jhelum River originates from Verinag in the southeastern part of Kashmir. The source of the Chenab River is near Bara Lacha Pass in the Zaskar Range. The Ravi River originates from the Kullu hills in Himachal Pradesh. The Satluj River initiates in the Manasarovar Lakes in the western parts of Tibet. In this study, we discuss the SRIR along with its main sub-basins. The Indus River basin is the largest basin in this source region, followed by the Kabul River basin, Satluj River basin, Jhelum River basin and Chenab River basin. These river basins were delineated from the STRM 90 m resolution DEM at the corresponding hydrologic stations, i.e., Nowshera for the Kabul River, Tarbela for the Upper Indus River, Mangla for the Jhelum River, Marala for the Chenab River and Suni for the Satluj River (Figure 2).

2.2. Data Collection

The daily precipitation data from 28 gauging stations for the period of 1961–2015 were collected from the Pakistan Meteorological Department (PMD) and Water and Power Development Authority (WAPDA). The elevations of these stations vary from 283 m at the Mangla gauging station to 2317 m at the Skardu gauging station. These stations cover most of the key area of the SRIR, which lies within the boundaries of Pakistan. These precipitation gauging stations cover a north–south range of approximately 100 km from the Gupis to Astore gauging stations and an east–west range of approximately 200 km from the Skardu to Gupis gauging stations [2]. The missing data accounted for less than 0.001% of the data, and these missing data were approximated by developing simple linear correlations with nearby stations. As the SRIR is a transboundary basin shared by Afghanistan, Pakistan, China and India, the PMD and WAPDA are Pakistani organizations that have installed precipitation gauging stations only within the boundaries of Pakistan. Due to the unavailability of precipitation data from Afghanistan, China and India in their respective parts of the SRIR, Asian Precipitation-Highly Resolved Observational Data Integration Towards Evaluation of Water Resources (APHRODITE) precipitation data from 22 non-gauging stations were used in this study. These non-gauging stations were named according to the name of the country in which they are located. The distribution and elevation of the gauging and non-gauging stations are shown in Figure 1.

2.3. APHRODITE Precipitation Data

APHRODITE is a state-of-the-art, high-resolution daily precipitation dataset that was developed by a consortium between the Research Institute for Humanity and Nature Japan and the Meteorological Research Institute of the Japan Meteorological Agency from a dense rain gauge observational network in Asia. APHRODITE precipitation data have been used by Tahir [37] along with the snowmelt runoff model in one sub-basin of the SRIR. In this study, we used the latest and improved versions of the daily dataset for Monsoon Asia (APHRO_MA_V1101 and APHRO_MA_V1101EX_R1) covering 60.0–150.0° E, 15.0° S–55.0° N at a high spatial resolution of 0.25° for the periods extending from 1951–2007 and 2007–2015, respectively. The dataset is available at http://www.chikyu.ac.jp/precip/.
The APHRODITE precipitation data were evaluated for the period from 1961–2015 using the measured precipitation data from 28 gauging stations. Different statistical indices, such as the bias (BIAS), root mean square error (RMSE), Pearson correlation coefficient (CC), standard error (SE) and index of agreement (IOA), were used for the evaluation. The BIAS measures the difference, RMSE measures the mean magnitude of errors, CC measures the amount of variance and IOA measures additive and comparative difference between gauged and APHRODITE precipitation data. SE is a linear score, showing individual changes are weighted correspondingly in the average. These statistical indices are computed as follows:
BIAS =   ( AP M ) M   × 100 %
RMSE =   1 n ( AP M ) 2
CC =   ( M M ¯ ) ( AP AP ¯ ) ( M M ¯ ) 2 ( AP AP ¯ ) 2
SE =   1 n   i = 1 n   | AP i M i |
IOA = 1   i = 1 n ( AP M ) 2 i = 1 n ( | AP M ¯ | +   | M M ¯ | ) 2
where M and AP are the measured and APHRODITE precipitation data, respectively; M ¯ and AP ¯ are the average values of the measured and APHRODITE precipitation data, respectively. APHRODITE precipitation data are considered perfect if the scores of the statistical indices i.e., BIAS, RMSE, CC, SE and IOA, are 0, 0, 1, 0 and 1, respectively.
Data homogeneity was checked using a double mass curve by developing the annual amount from daily precipitation time series [38] at all stations in the study area. The double mass curve method disclosed a straight line at all stations, showing no breakpoints, which confirms the reliability of the precipitation time series. [39,40] also confirmed such results by using the double mass curve method in their studies conducted in the Yellow River basin, China.
For the analysis of different characteristics of precipitation in the SRIR, the daily precipitation rate was divided into different classes, e.g., 0–10 mm day−1 precipitation was described as light precipitation, 10.1–25 mm day−1 precipitation was described as moderate precipitation, while precipitation greater than 25 mm day−1 was described as heavy precipitation. A similar classification of daily precipitation has been used by different researchers for the analysis of precipitation in different regions [12,13,40,41,42].

2.4. Selection of Climatic Variables

In this study, we used different precipitation classes and the number of rainy days of each class as prime indicators to determine the precipitation class that occurred most frequently. Light precipitation (0–10 mm) leads to drought-like conditions, while heavy precipitation (>25 mm) leads to flood-like conditions. We also evaluated the variability in the amount of precipitation during different seasons and the frequency of dry spells.

2.5. Trend Analysis

The objective of trend analysis is to determine the changes (increasing, decreasing, or trendless) in the values of climatic variables. Nonparametric methods are mostly used to determine the magnitudes of the trends in climatic data. The Mann-Kendall (MK) test and Sen’s slope were used to determine the trends in precipitation in the study area. The trends in the time series of precipitation in the study area were also determined by the trend rate, which represents the slope of the trend. The trend rate m1 was calculated through linear regression using Equation (6).
y = m 1 x t +   c o
where x represents the different precipitation variables from 1961–2015. The significance of m1 was verified by t-test. A p-value smaller than 0.05 of the associated t-value indicates that the associated m1 is significant at the 95% confidence level [43]. A positive value of m1 indicates an increasing trend, while a negative value of m1 indicates a decreasing trend [44].

2.5.1. Mann-Kendall Trend Analysis Test

In this study, we have employed the Mann-Kendall (MK) test to check the trends in long-term time series of observed and APHRODITE precipitation, annual precipitation, seasonal precipitation and number of rainy days from 1961–2015 in the source region of Indus River. The MK test was also used to see trends in short and long duration dry spells and wet spells. Trends in different classes of precipitation in the study area and its main sub-basins are also determined using the MK test. This is an extensively used and accepted as a common effective technique to assess the existence of statistically significant trends in climatic and hydrologic data [45,46].
The MK test is a nonparametric test used for the identification of trends in climatic time series. The test has very low sensitivity to outliers, and a normal distribution of climatic time series data is not required for this test [47]. The MK test statistics (S) are computed by Equation (7).
S = k = 1 n 1 j = k + 1 n sgn ( X j X k )
sgn ( X j X k ) =   { if   ( X j X k ) > 0 ,   + 1 if   ( X j X k ) = 0 ,   0 if   ( X j X k ) < 0 , 1 }
where n is the length of the data set, Xj and Xk are data values at times j and k, and sgn is the sign function that takes on values of −1, 0, and +1. The resultant value of S indicates increasing or decreasing trends in climatic data sets.
Var ( S ) =   n ( n 1 ) ( 2 n + 5 ) k = 1 p t k ( t k 1 ) ( 2 t k + 5 ) 18
where p = tied group, tk = number of observations in the kth group
After the variance Var(S) is calculated from Equation (9), the standardized test statistic (ZS) is then calculated using Equation (10).
Z S =   { S 1 Var ( S ) , S > 0 0 ,                   S = 0 S + 1 Var ( S ) , S < 0 }
The standardized test statistic (ZS) indicates the significance of the trend. ZS is used to test the null hypothesis, Ho if ZS > Zα/2, where α represents the confidence level. α = 5% is used in this study.

2.5.2. Sen’s Slope Test

The magnitudes of the trends in climatic time series data were calculated by Sen’s slope test. The slope of the pair of data “n” was first calculated using Equation (11).
Q =   X j X k j k   if   k < j
where Xj and Xk are data values at times j and k. The median of the “n” values of Q is Sen’s estimator of slope. A positive value of Q indicates an increasing trend, while a negative value indicates a decreasing trend in the climatic time series data. The slopes (Q) of the “n” values were ranked from low to high, and Sen’s estimator can be calculated using Equation (12).
Sen’s estimator =   Q n + 1 2 if   n   is   odd , 1 2 [ Q n 2 + Q n + 2 2 ]   if   n   is   even

3. Results and Discussion

3.1. Evaluation of the APHRODITE Precipitation Data

APHRODITE precipitation data from non-gauging stations in the eastern and western parts of the study area were used due to the unavailability of station data from these regions. The measured daily precipitation data from gauging stations from 1961–2015 were used for the evaluation of APHRODITE precipitation data. The results of the statistical indices that were calculated using Equation (1) to Equation (5) and used to evaluate the APHRODITE precipitation data are shown in Table 1, while the trends and magnitudes of the average monthly observed and APHRODITE precipitation data, which were calculated using the MK test, are presented in Figure 3.
The average values of the CC and IOA statistical indices were 0.7 and 0.8, which are close to their perfect values of 1. The average BIAS value was 2.3, showing an only 2.3% overestimation of the APHRODITE precipitation data (Table 1). The average monthly measured and APHRODITE precipitation data have similar trends and magnitudes (Figure 3) at all stations except for only five (Balakot, Gari Dupata, Gujjar Khan, Khandar and Plandri), where the measured precipitation exhibited a slightly larger decreasing magnitude than the APHRODITE precipitation. The average values of the statistical indices showed good agreement between the measured and APHRODITE precipitation data.

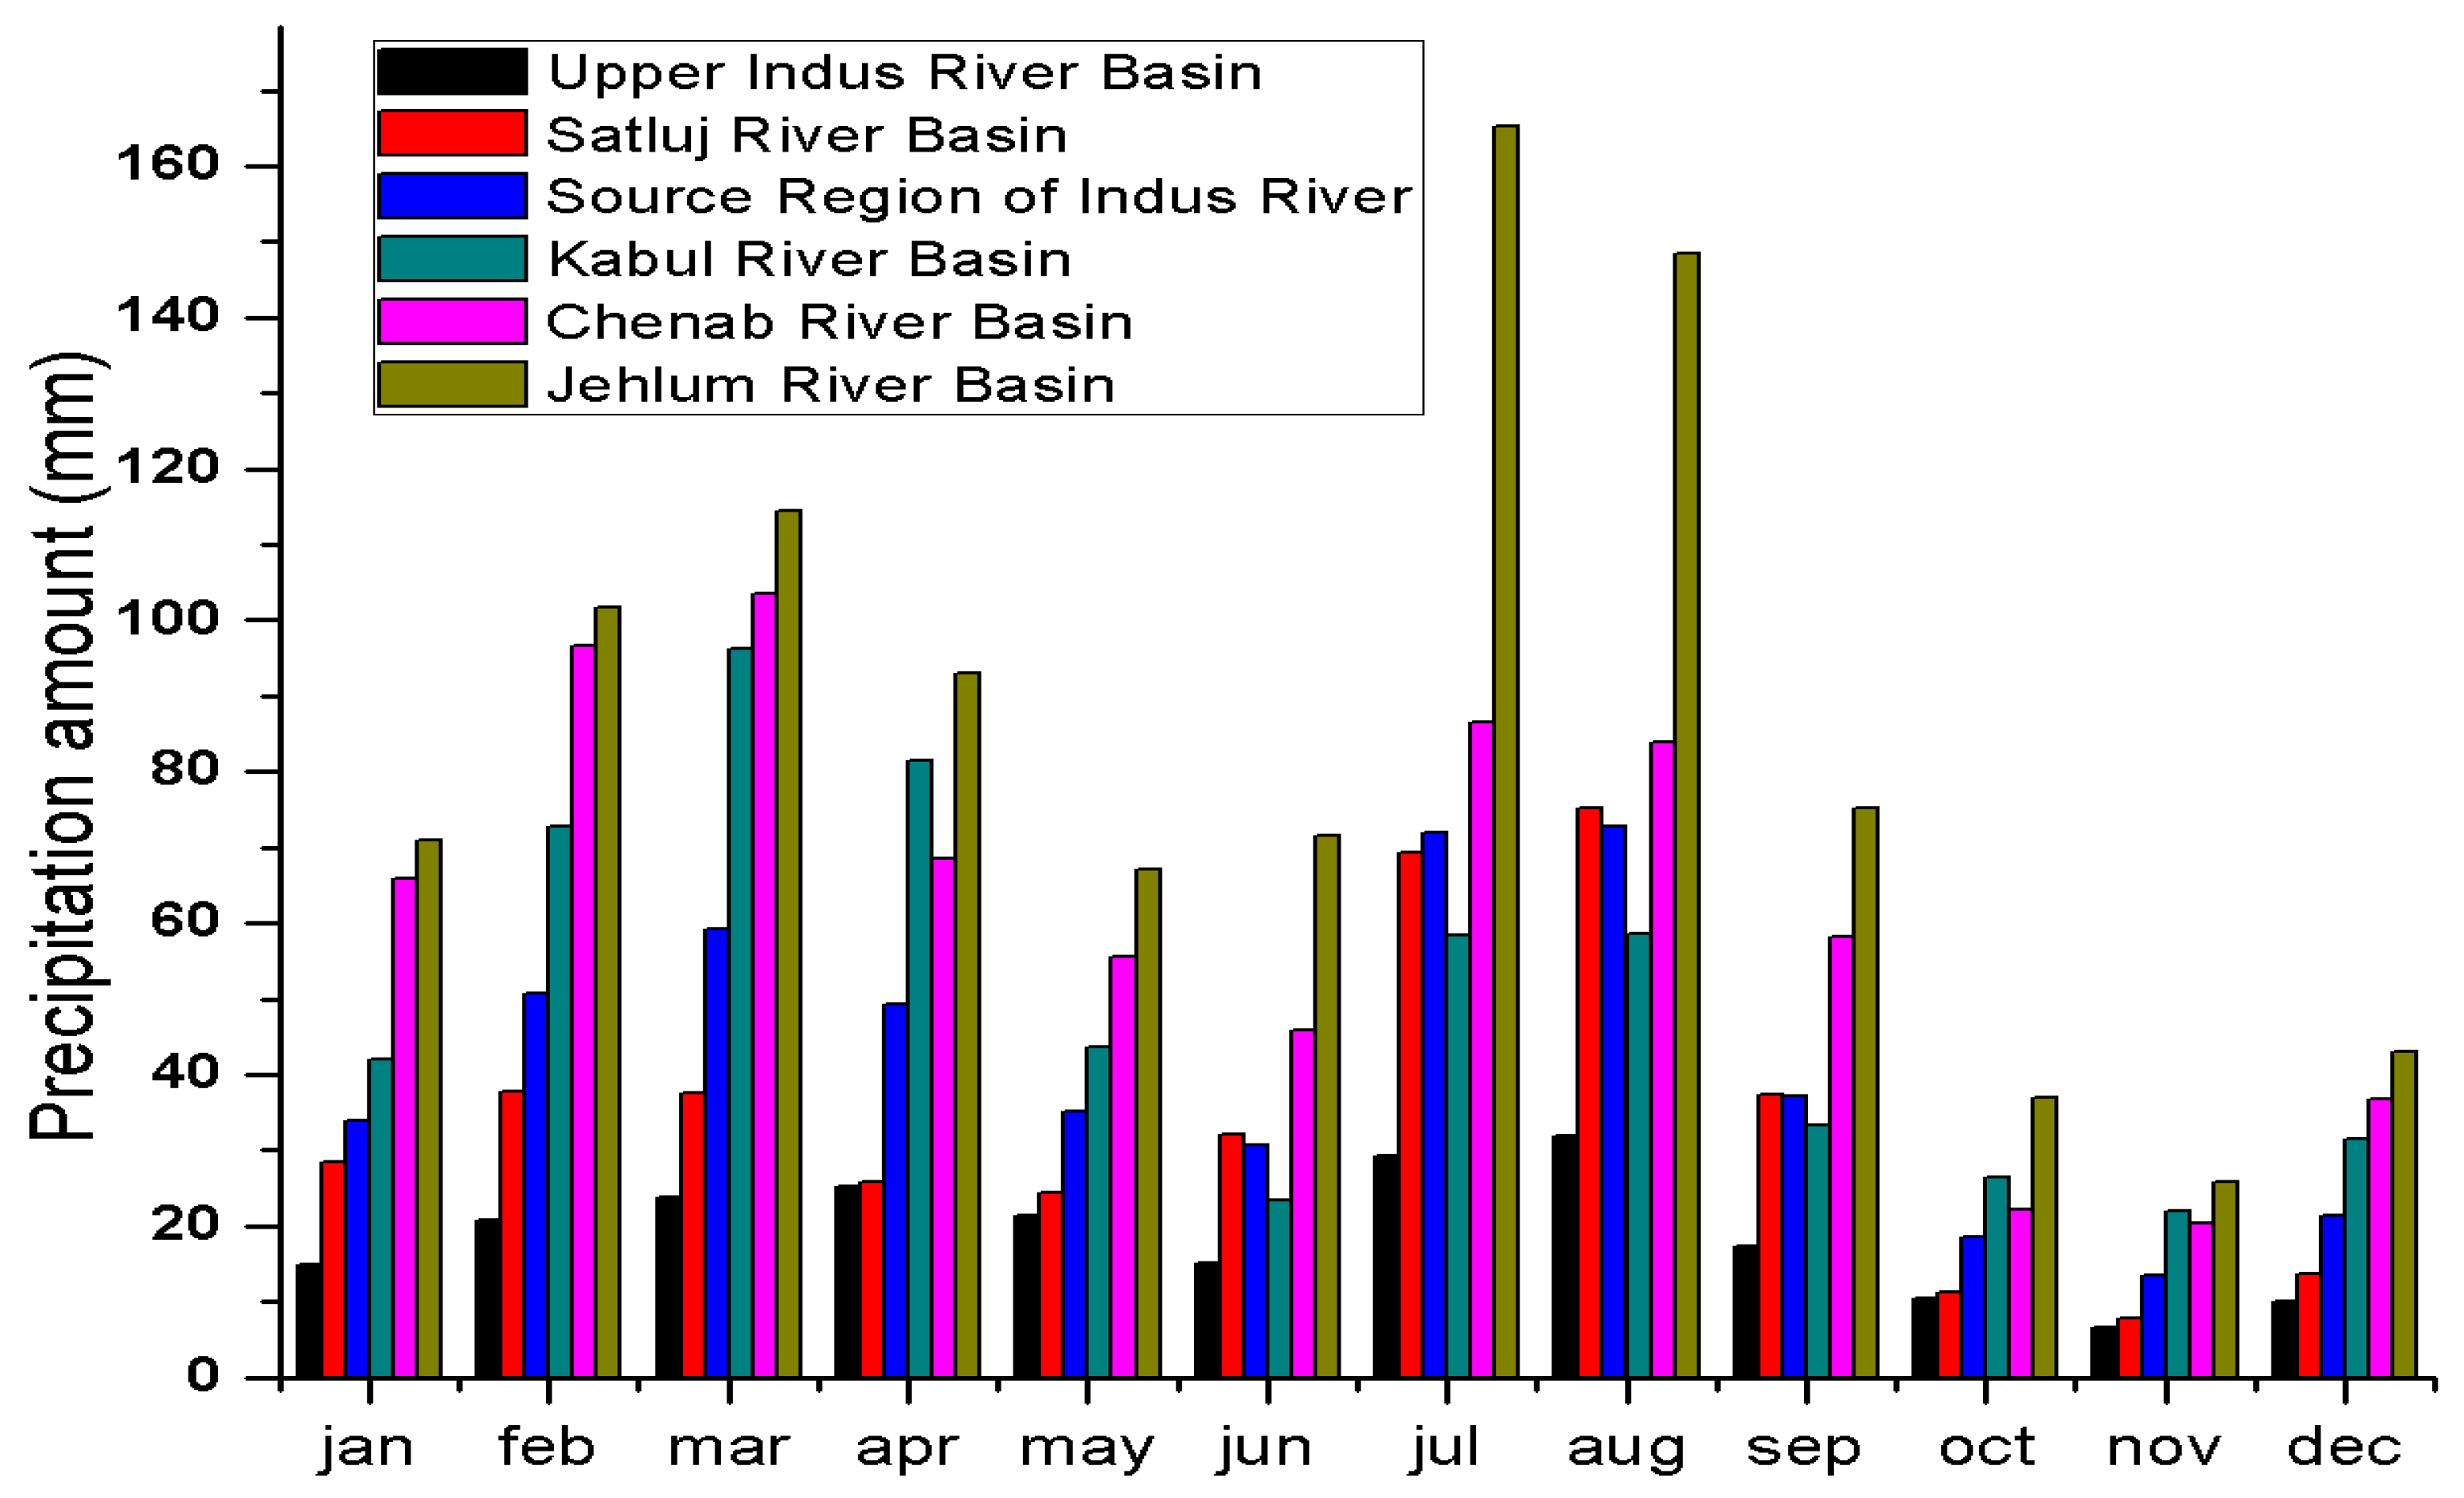
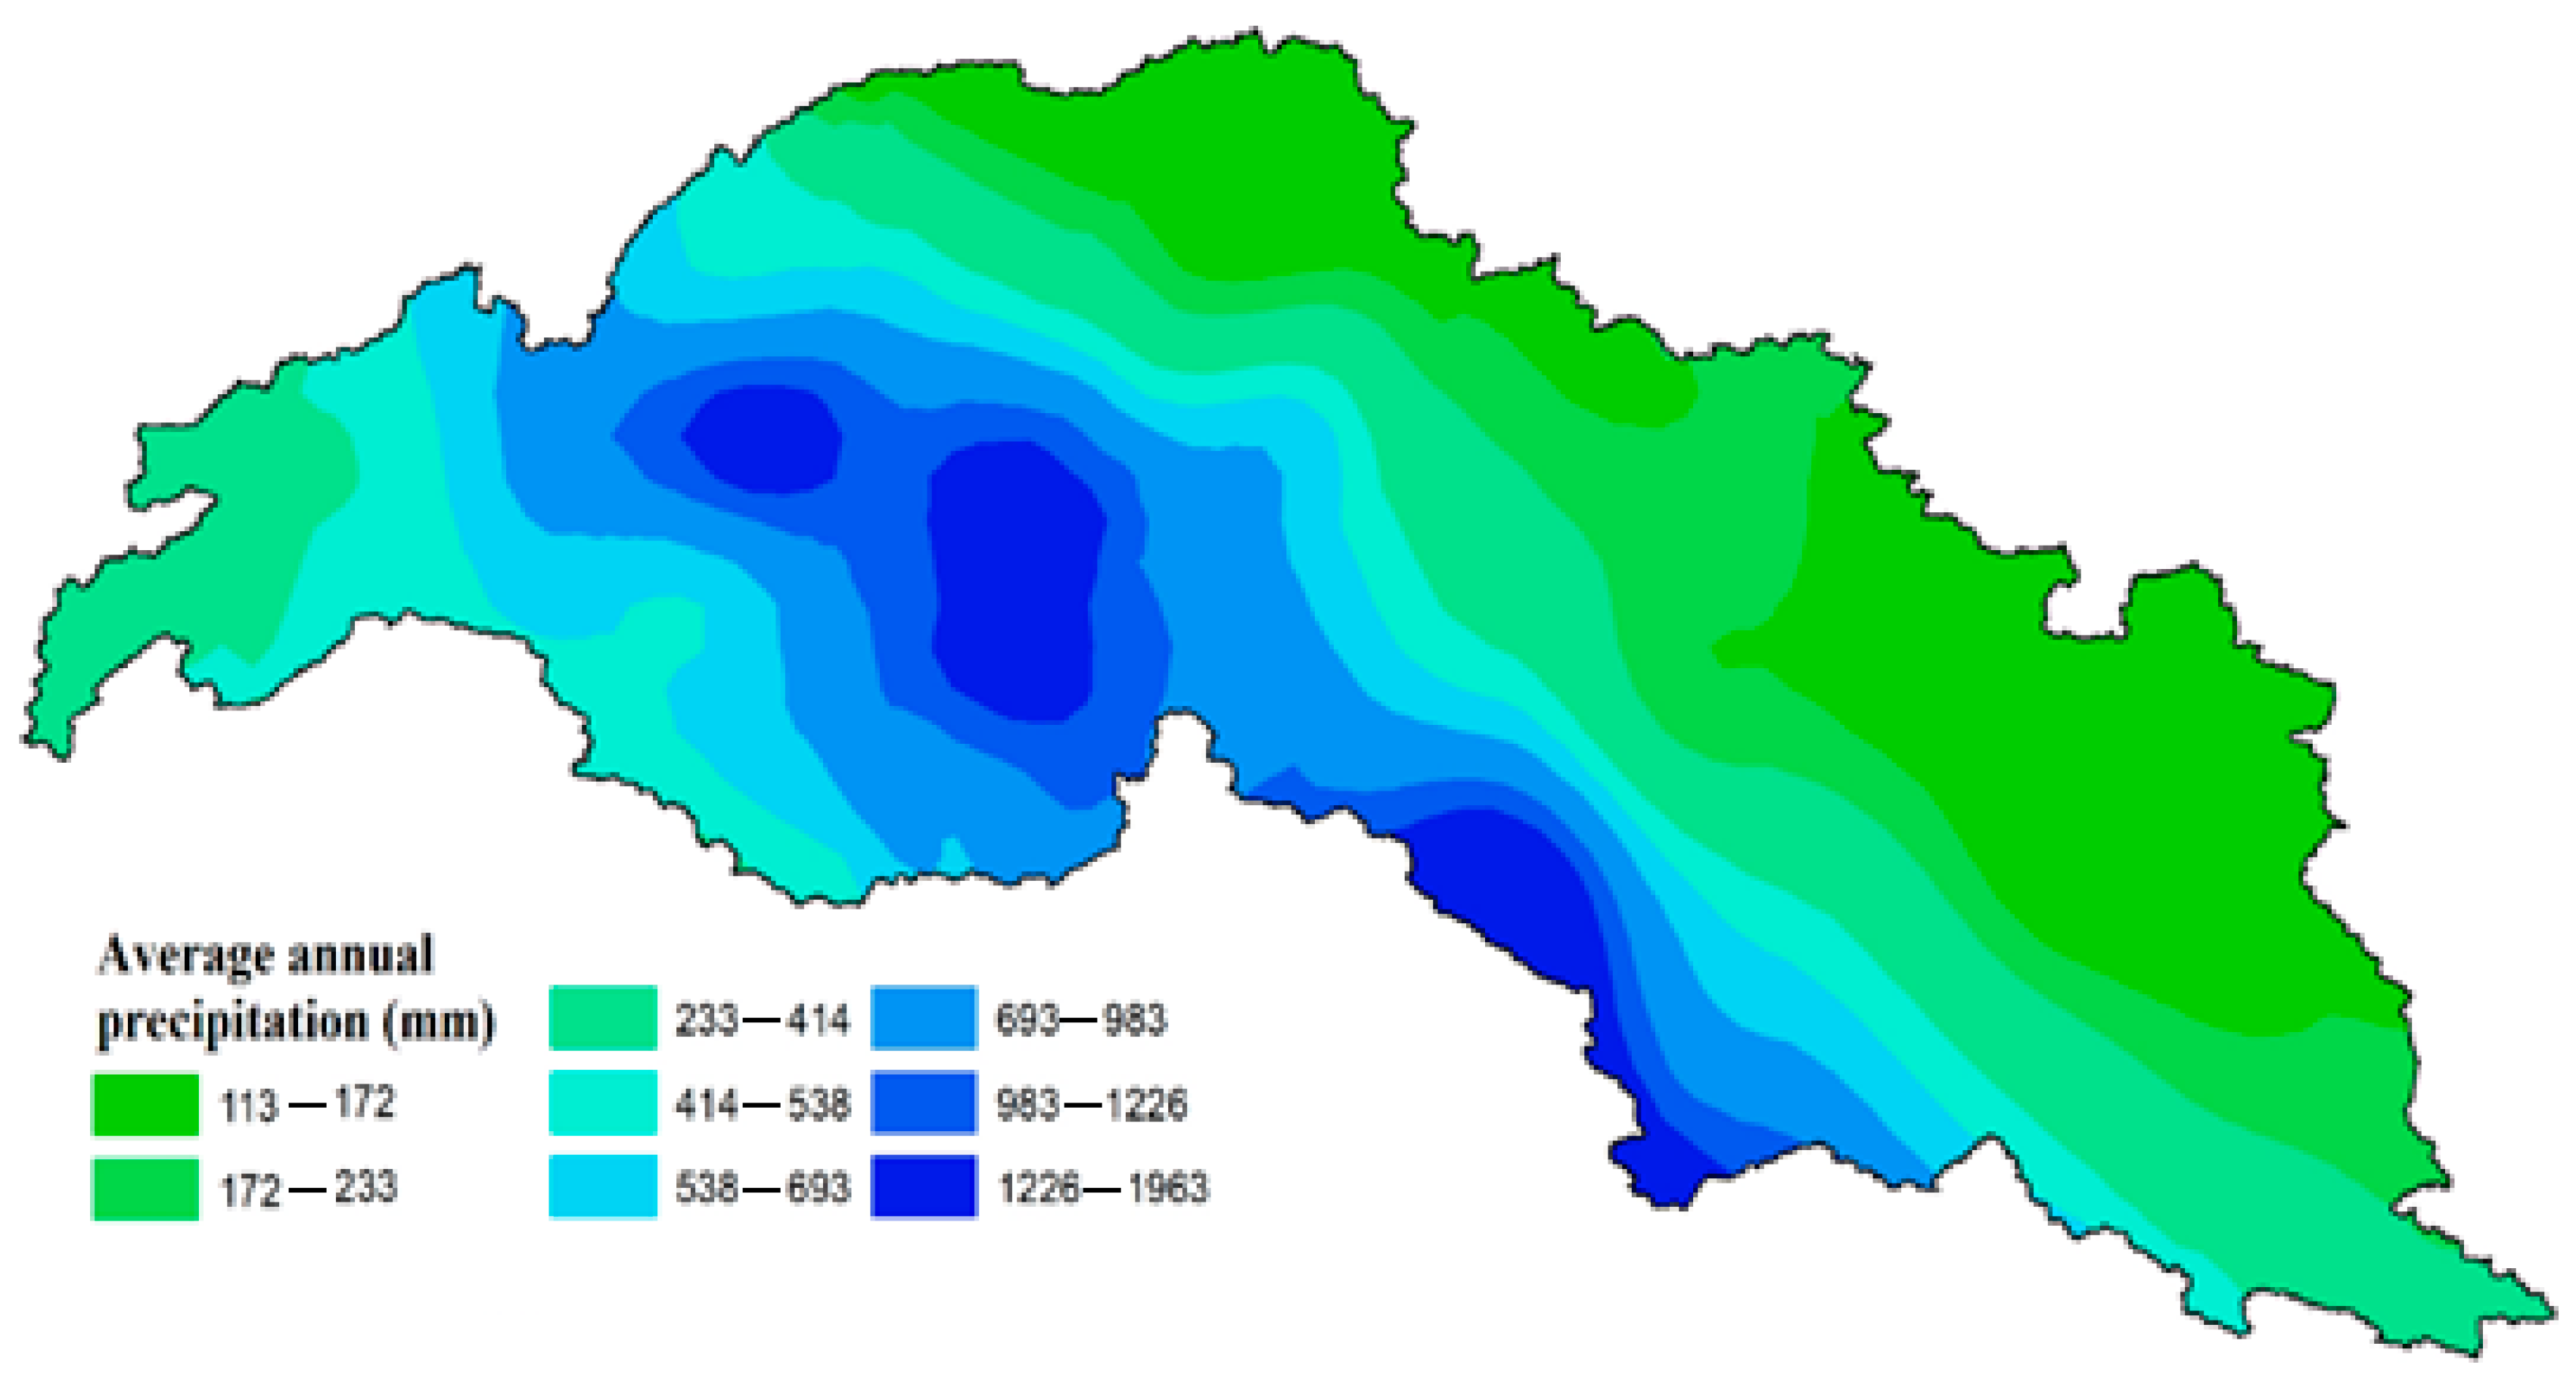
3.2. Spatial Distribution of Annual Precipitation Amounts

The SRIR has very distinctive climatic conditions, and the precipitation in this area exhibits great spatial and temporal variations. The distribution of precipitation during different months of a year in the study area and its main sub-basins from 1961 to 2015 are shown in Figure 4. The highest amount of precipitation in the study area (72.8 mm) was received in August, while the lowest amount of precipitation (13.4 mm) was received in November. According to a study conducted by Amin [48] in the northern areas of Pakistan which is part of the SRIR, about 21% of observed rainfall occurred in the month of March while about 37% of the observed rainfall occurred in the month of July and was almost the same in August.
The Jhelum River basin in the study area received the highest contribution of monthly precipitation, with maximum and minimum amounts of 165.3 mm (July) and 25.8 mm (November), respectively. The monthly amount of precipitation in the study area was lowest in the UIRB, with a maximum value in August (31.8 mm) and a minimum value in November (6.5 mm). Figure 4 clearly indicates that there are two clusters of peak monthly precipitation in the study area, i.e., February to April due to westerly air disturbances and July to August due to monsoonal effects.
The spatial distribution of the average annual precipitation in the study area is shown in Figure 5. The average annual precipitation was spatially interpolated through kriging interpolation, which uses semivariogram and data values from sample locations to create an unbiased estimation of the data values in unsampled locations [49]. According to Tabios III and Salas [50] and Phillips [51], kriging is a better interpolation technique than inverse distance weighting (IDW) for precipitation estimation. Different precipitation stations in the study area exhibited great variations in annual precipitation [2,52] due to diverse climatic circumstances, e.g., monsoon, westerly, and orographic effects. Many of the precipitation stations in the middle of the study area received the highest amount of annual precipitation. The average annual amount of precipitation decreased extensively from the center, i.e., Western Himalayas, to the eastern side, i.e., the TP, western side, i.e., Hindukush, and the northern side, i.e., Karakoram, in the study area with a range from 113 to 1963 mm (Figure 5).
The annual precipitation and number of stations at different elevations are shown in Figure 6a, while the trends and slope of the annual precipitation calculated using the MK test are presented in Figure 6b. Elevation zone 2 (1500–3000 m) has the highest value, while zone 4 (4500–6000 m) has the lowest value of annual precipitation. Most of zone 2 lies in the Western Himalayas, which provide a barrier against monsoon depressions and receives a large amount of precipitation, while zone 4 lies in the TP, which is a high-altitude arid grassland with an annual precipitation of only 100–300 mm. Annual precipitation exhibits increasing trends in all altitudinal zones, with significant increases in zone 3 and zone 4 with magnitudes of 4 mm/year and 0.84 mm/year, respectively, because of climate change. Yan and Liu [53] reported a significant increase in temperature over the TP at an elevation of 4000 m.

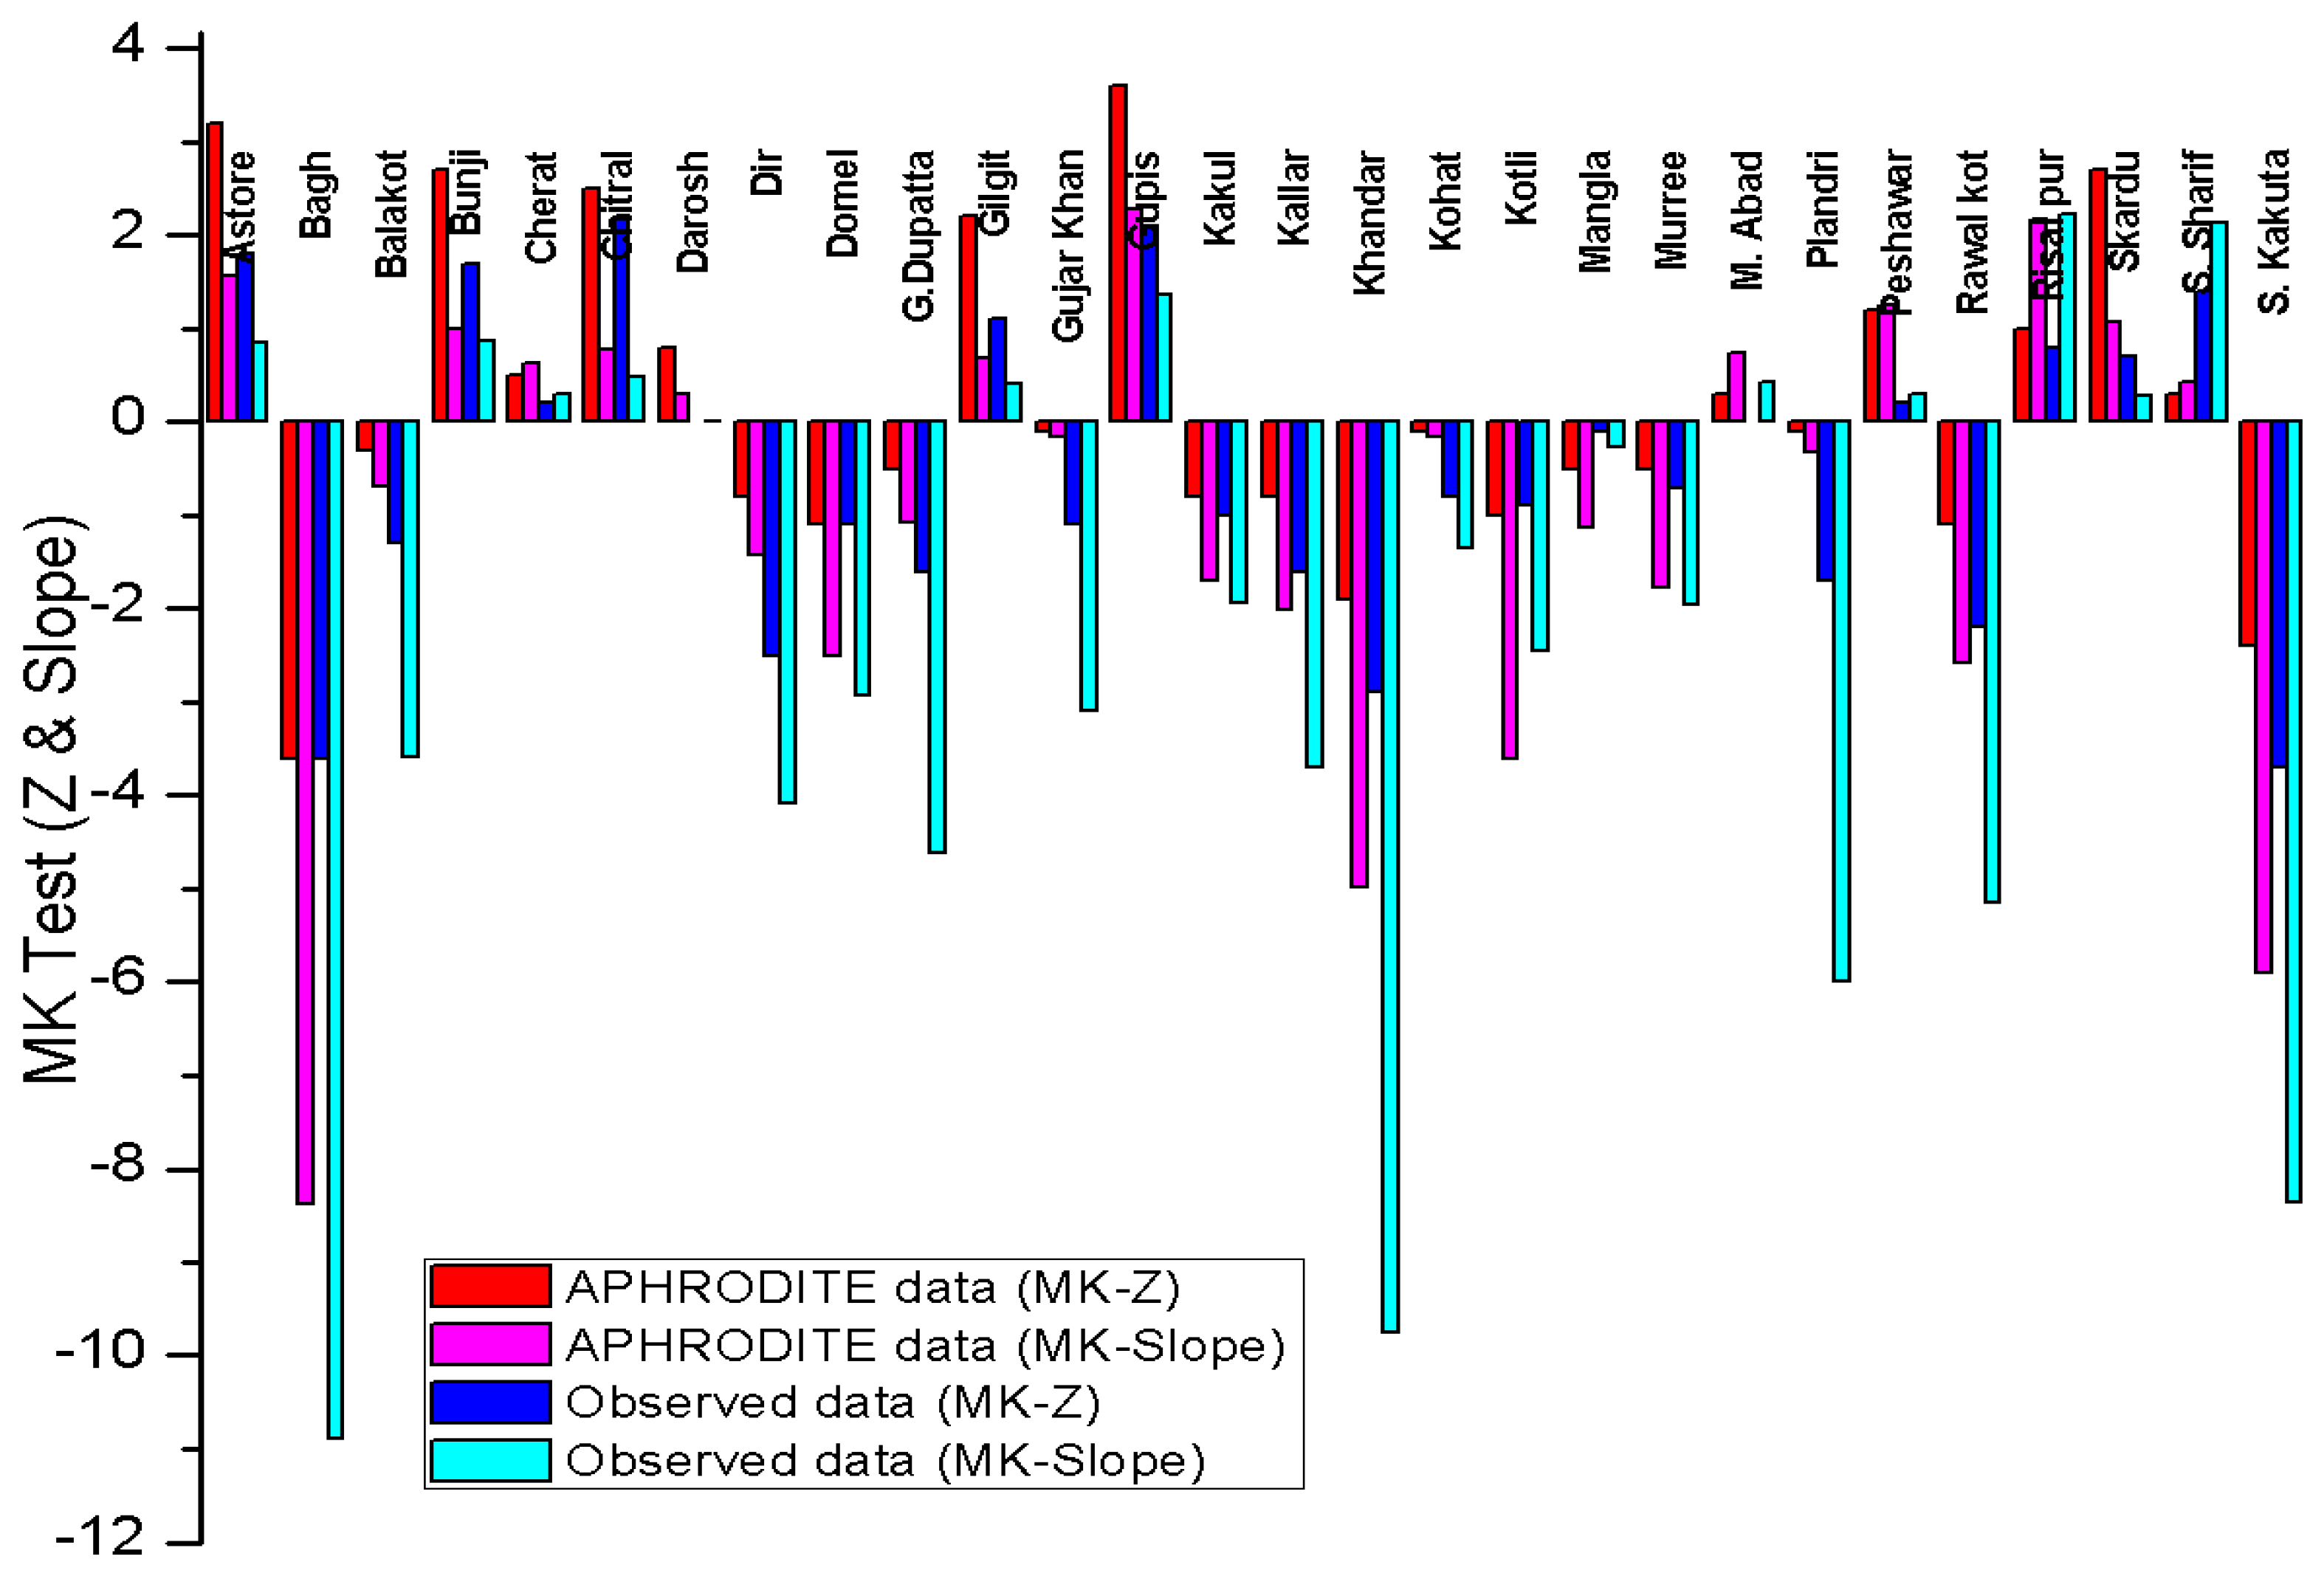
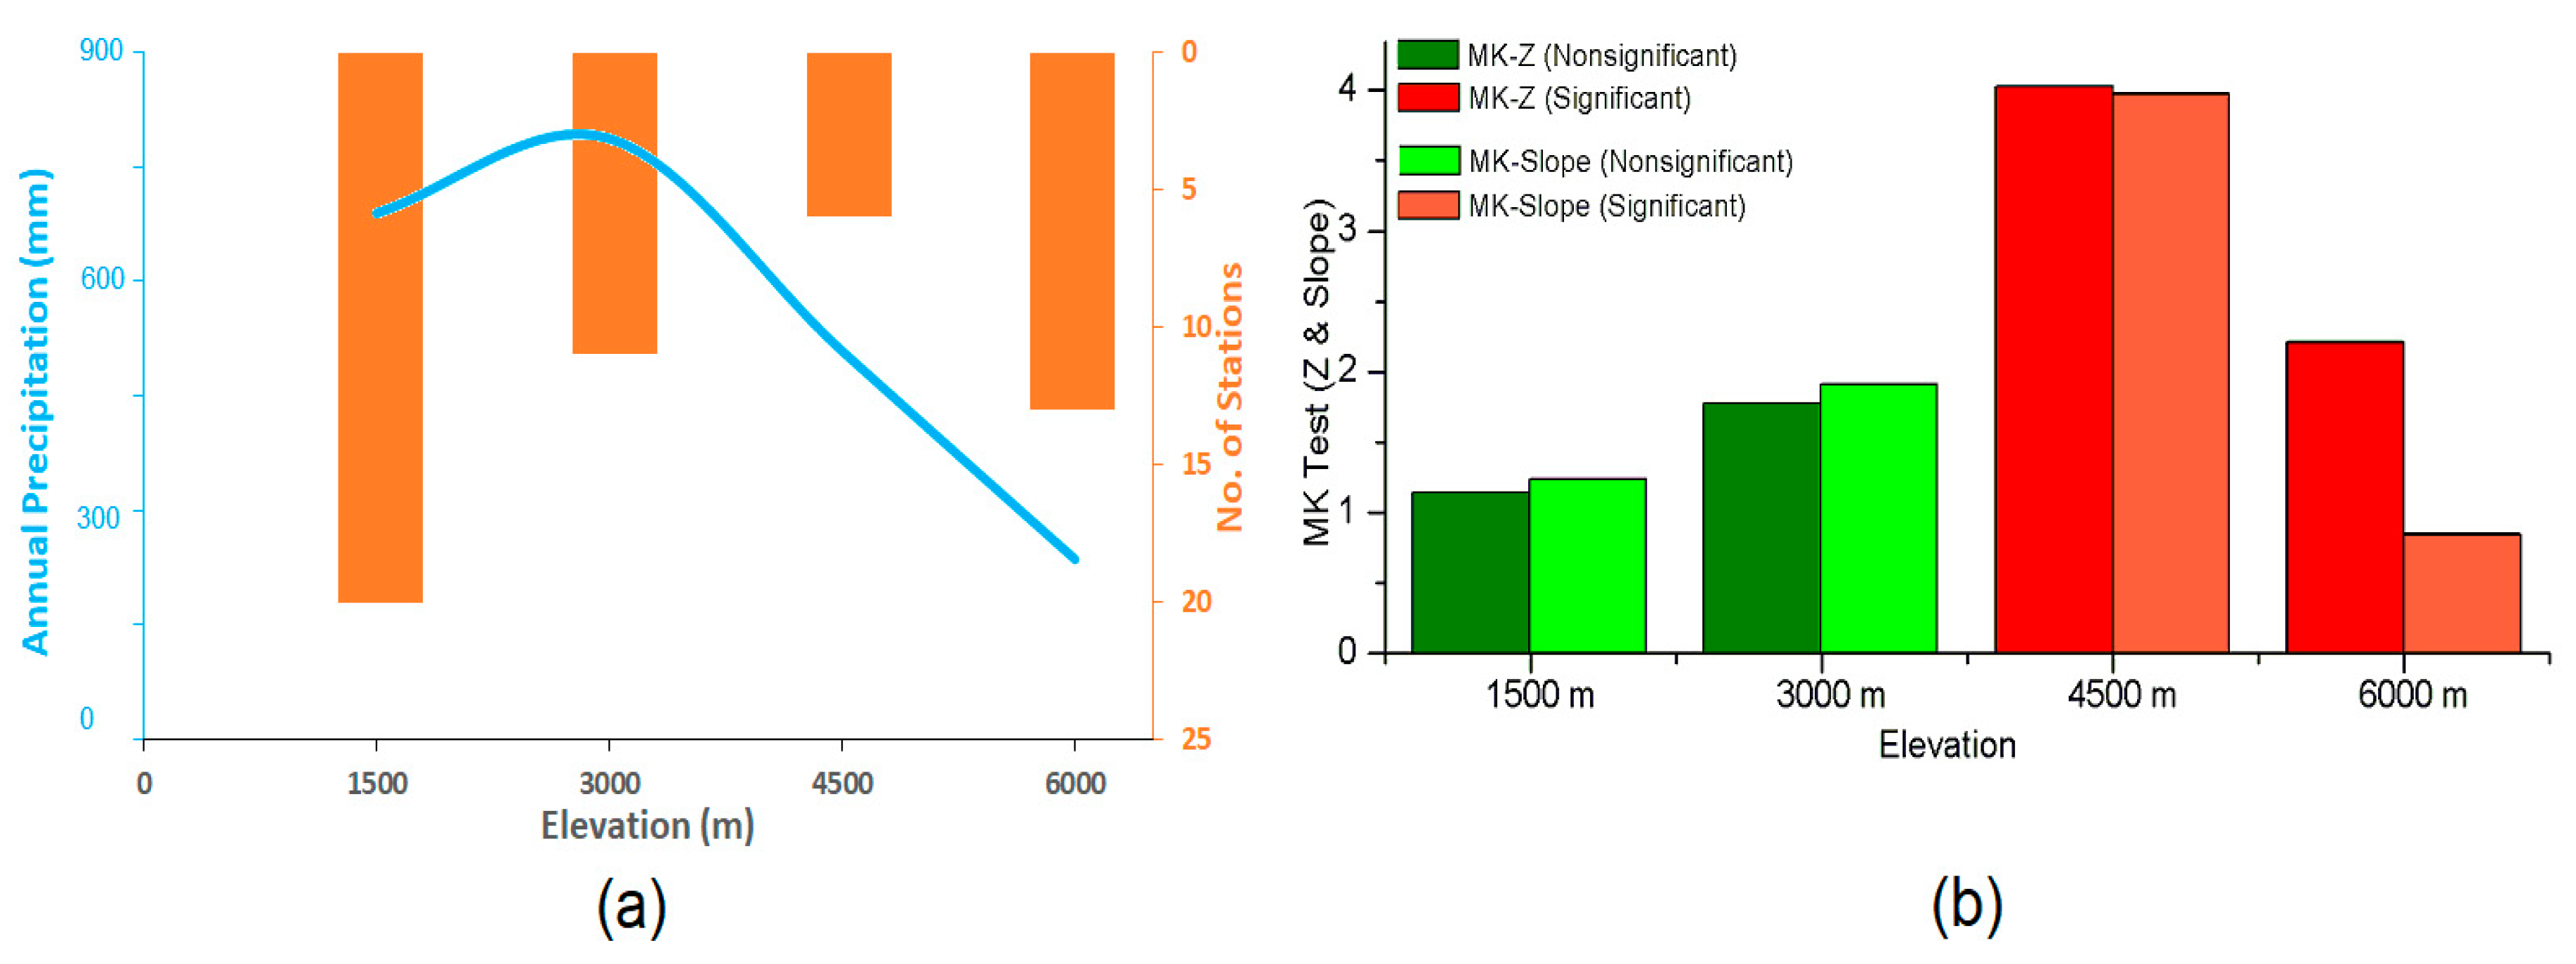
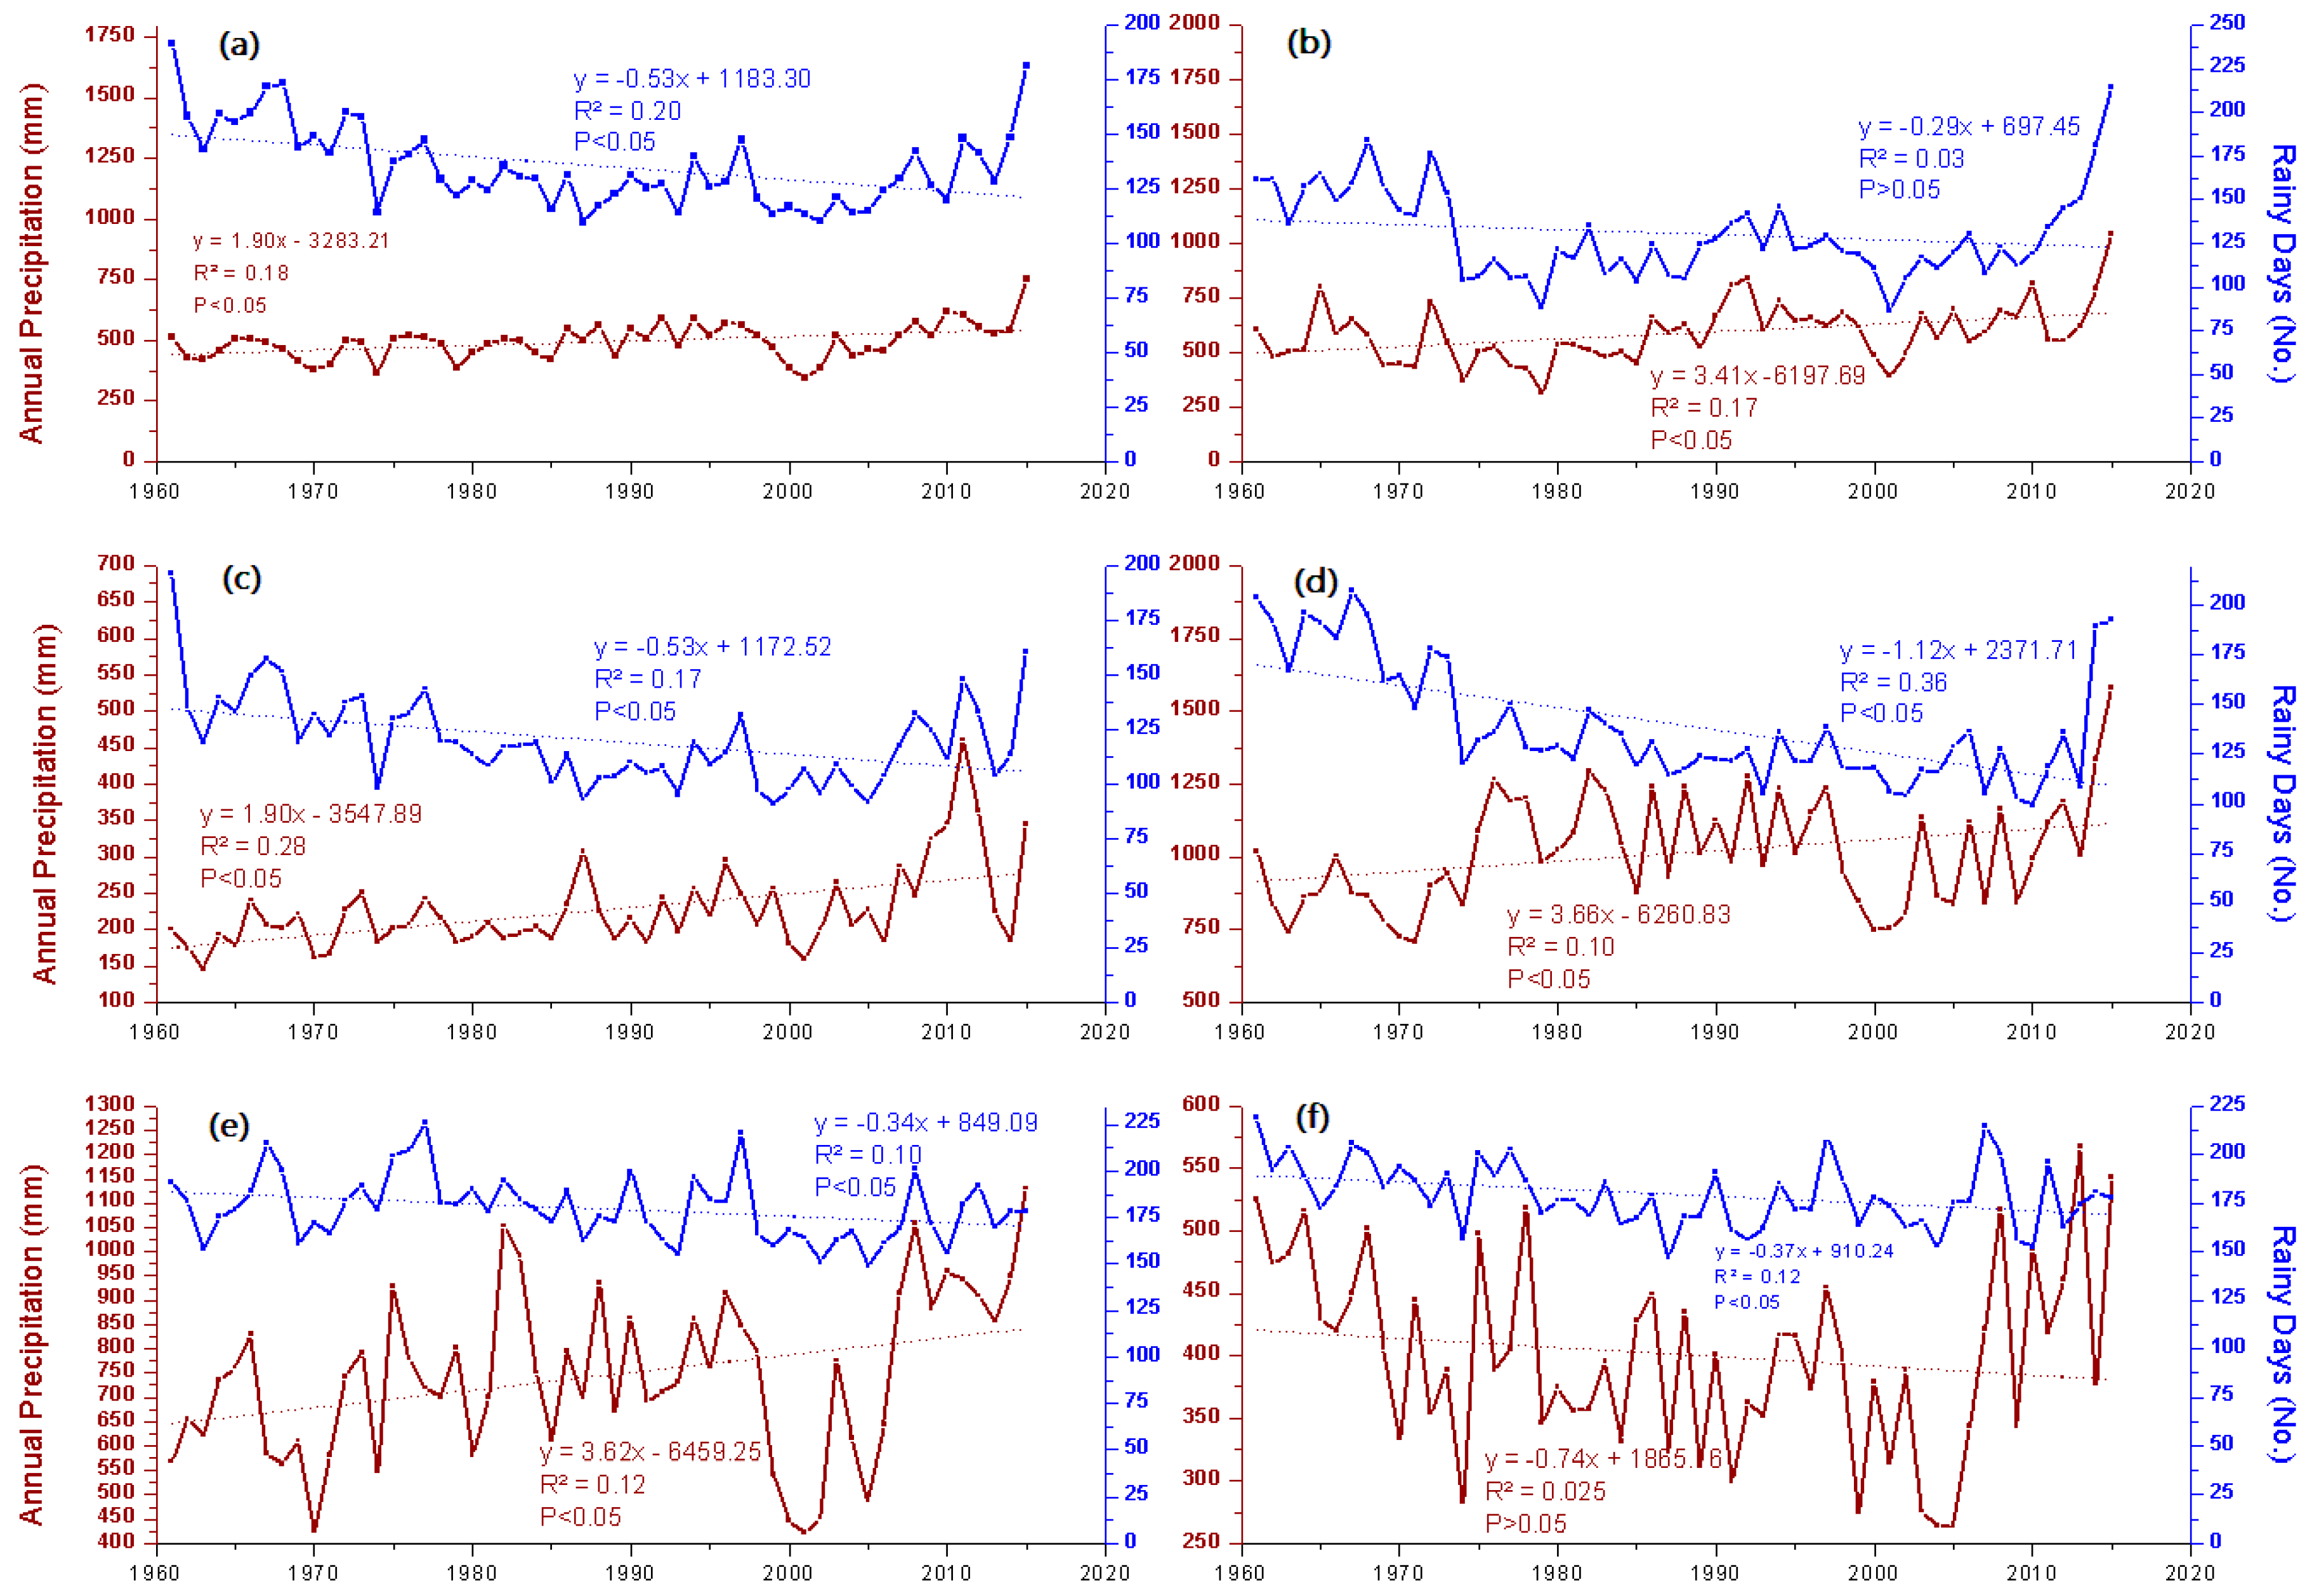
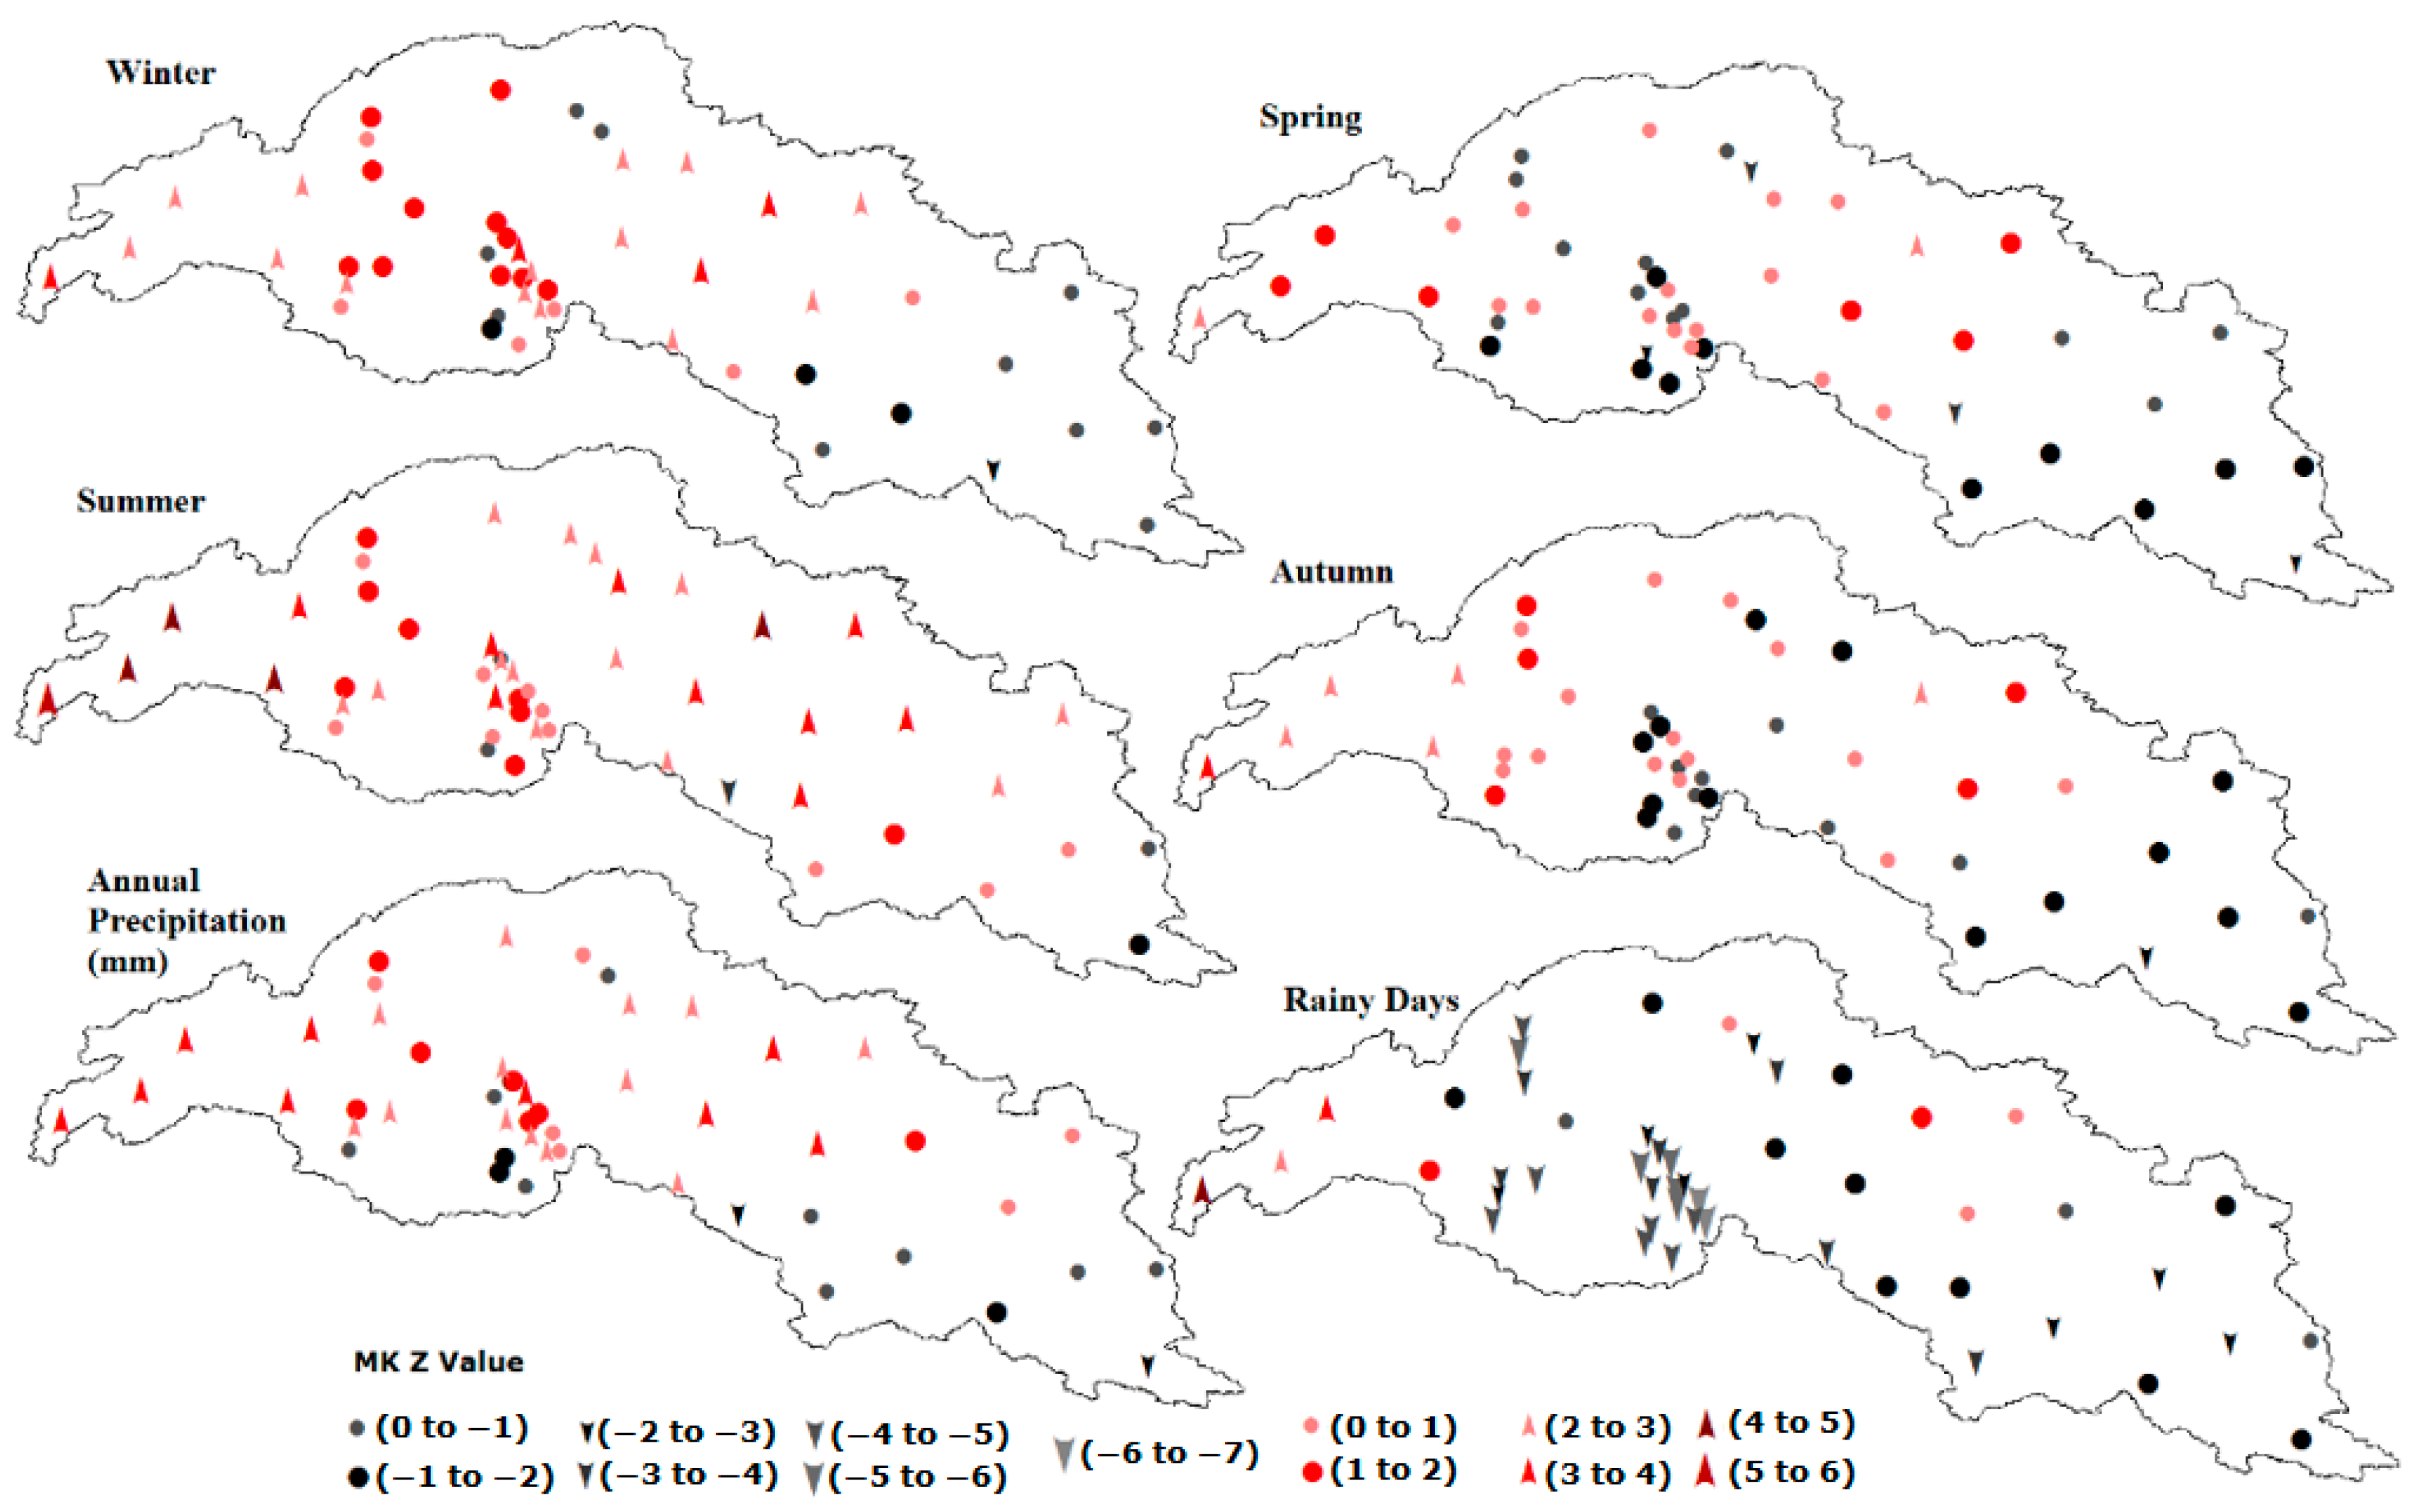
3.3. Trends in Annual Precipitation, Seasonal Precipitation, and Rainy Days

The precipitation observed at all stations was averaged to illustrate the temporal distribution of precipitation in the SRIR [54,55]. The temporal distribution of the annual amount of precipitation and the total number of rainy days in the study area and its main sub-basins are presented in Figure 7. The maximum and minimum amounts of annual precipitation in the study area were 753.33 mm in 2015 and 344.39 mm in 2001, respectively. This large difference between the maximum and minimum amount of annual precipitation in the study area was due to the drought, which started in 1999 and ended in 2002 [56]. The annual precipitation exhibited a significantly (p < 0.05) increasing trend in the study area and its four sub-basins, i.e., the Kabul, Chenab, Jhelum and Upper Indus River basins. The Satluj River basin exhibited a nonsignificant decreasing trend. Rainy days exhibited significantly decreasing trends in the study area and all of its sub-basins except the Kabul basin, which exhibited a nonsignificant decreasing trend (Figure 7).
Seasonal precipitation in the study area was calculated by taking into account the standard months of each season. The four seasons in this region were defined as December to February for winter, March to May for spring, June to September for summer and October to November for autumn. The trends in seasonal precipitation, annual precipitation and rainy days that were calculated using the MK test in the study area are presented in Figure 8. During the winter, 35 out of the 50 stations showed increasing trends in precipitation with significantly increasing trends (α = 5%) at 18 stations. Decreasing trends were observed at 15 stations with one station (India 5) showing a significant decrease. Significantly increasing trends were observed at 27 stations during the summer. The significantly increasing trends in precipitation at 54% of the stations during the summer and 36% of the stations during the winter will increase the chances of flooding in the Indus Basin. The eastern part of the study area mostly exhibited decreasing trends, while increasing trends in precipitation were observed during the winter, spring, summer, and autumn in the western part.
Significantly increasing trends in annual precipitation were observed at 44% of the stations, while significantly decreasing trends were observed at only 4% of the stations, which were India1 and India6. On the other hand, for the number of rainy days, the majority of the stations (58%) showed significantly decreasing trends, whereas only 6% of the stations showed significantly increasing trends (Figure 8). Annual precipitation exhibited increasing trends while the number of rainy days exhibited decreasing trends, showing that a large amount of precipitation will be received in a small number of days, which will increase the chances of flash floods.

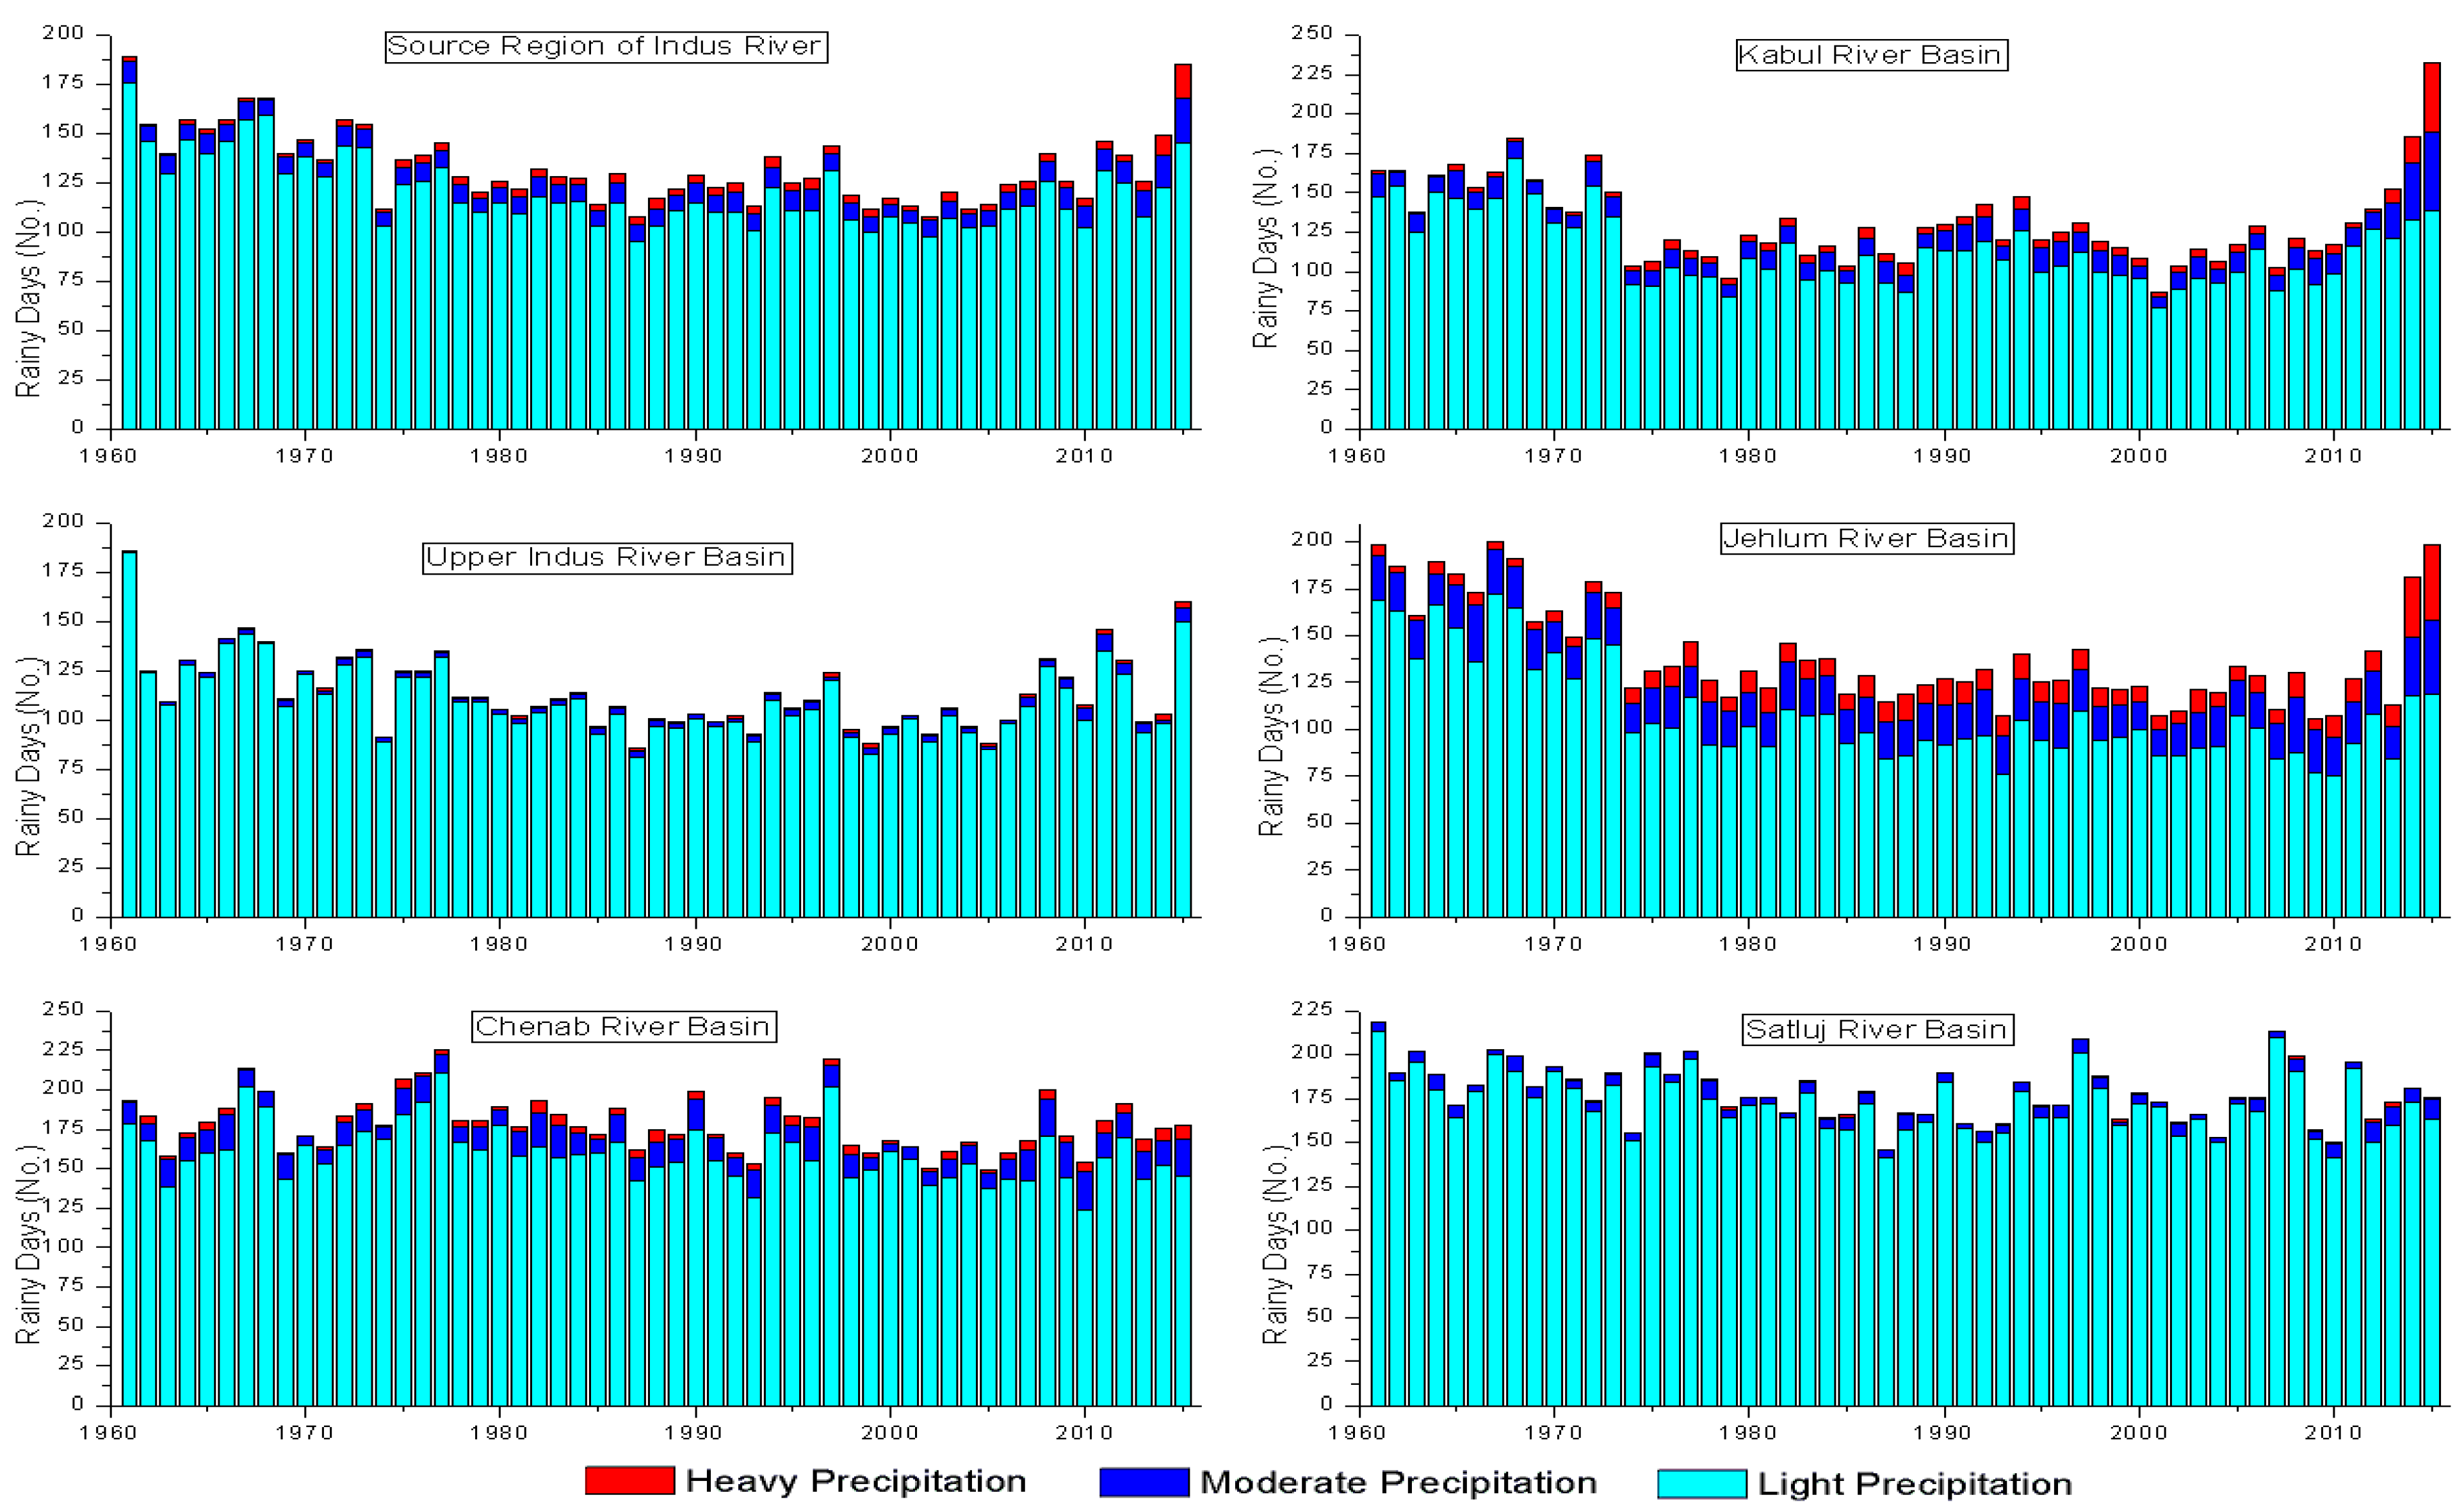
3.4. Characteristics of Different Precipitation Classes

Daily precipitation data from 50 stations from 1961 to 2015 were divided into light, moderate and heavy precipitation. This study investigated the different characteristics of these precipitation classes.
Table 2 shows the trends in the different precipitation classes. Light precipitation exhibited significantly decreasing trends in the study area, moderate precipitation exhibited nonsignificant increasing trends, while heavy precipitation exhibited significantly increasing trends. The heavy precipitation trend increased as the number of rainy days decreased, which means that there will be heavy precipitation for a limited number of days, increasing the chances of floods. Ahmad [57] also reported more severe changes (increasing trend) in heavy precipitation during winter and summer in his study in the UIRB.
The contribution of each precipitation class was calculated by taking the average accumulated precipitation of that class to the total seasonal precipitation. The contributions of light, moderate, and heavy precipitation in the study area were 48%, 28%, and 24%, respectively. More than 50% of seasonal precipitation in autumn was light precipitation. The highest contribution of heavy precipitation was in summer, while the lowest contribution was in autumn. The Satluj and Upper Indus sub-basins had the highest contributions from light precipitation, i.e., 76–89% and 59–70%, respectively, while the lowest contributions were from heavy precipitation, i.e., 2–5% and 10–19%, respectively (Table 3).
The distributions of wet or rainy days for light, moderate, and heavy precipitation in the study area and its main sub-basins are shown in Figure 9. The average number of rainy days for light, moderate, and heavy precipitation are 121, 9 and 4, respectively. In the study area, the Jhelum River basin has the highest number of rainy days for heavy and moderate precipitation, i.e., 10 and 21, respectively, while the UIRB has the lowest number of rainy days for heavy (1 day) and moderate (3 days) precipitation.

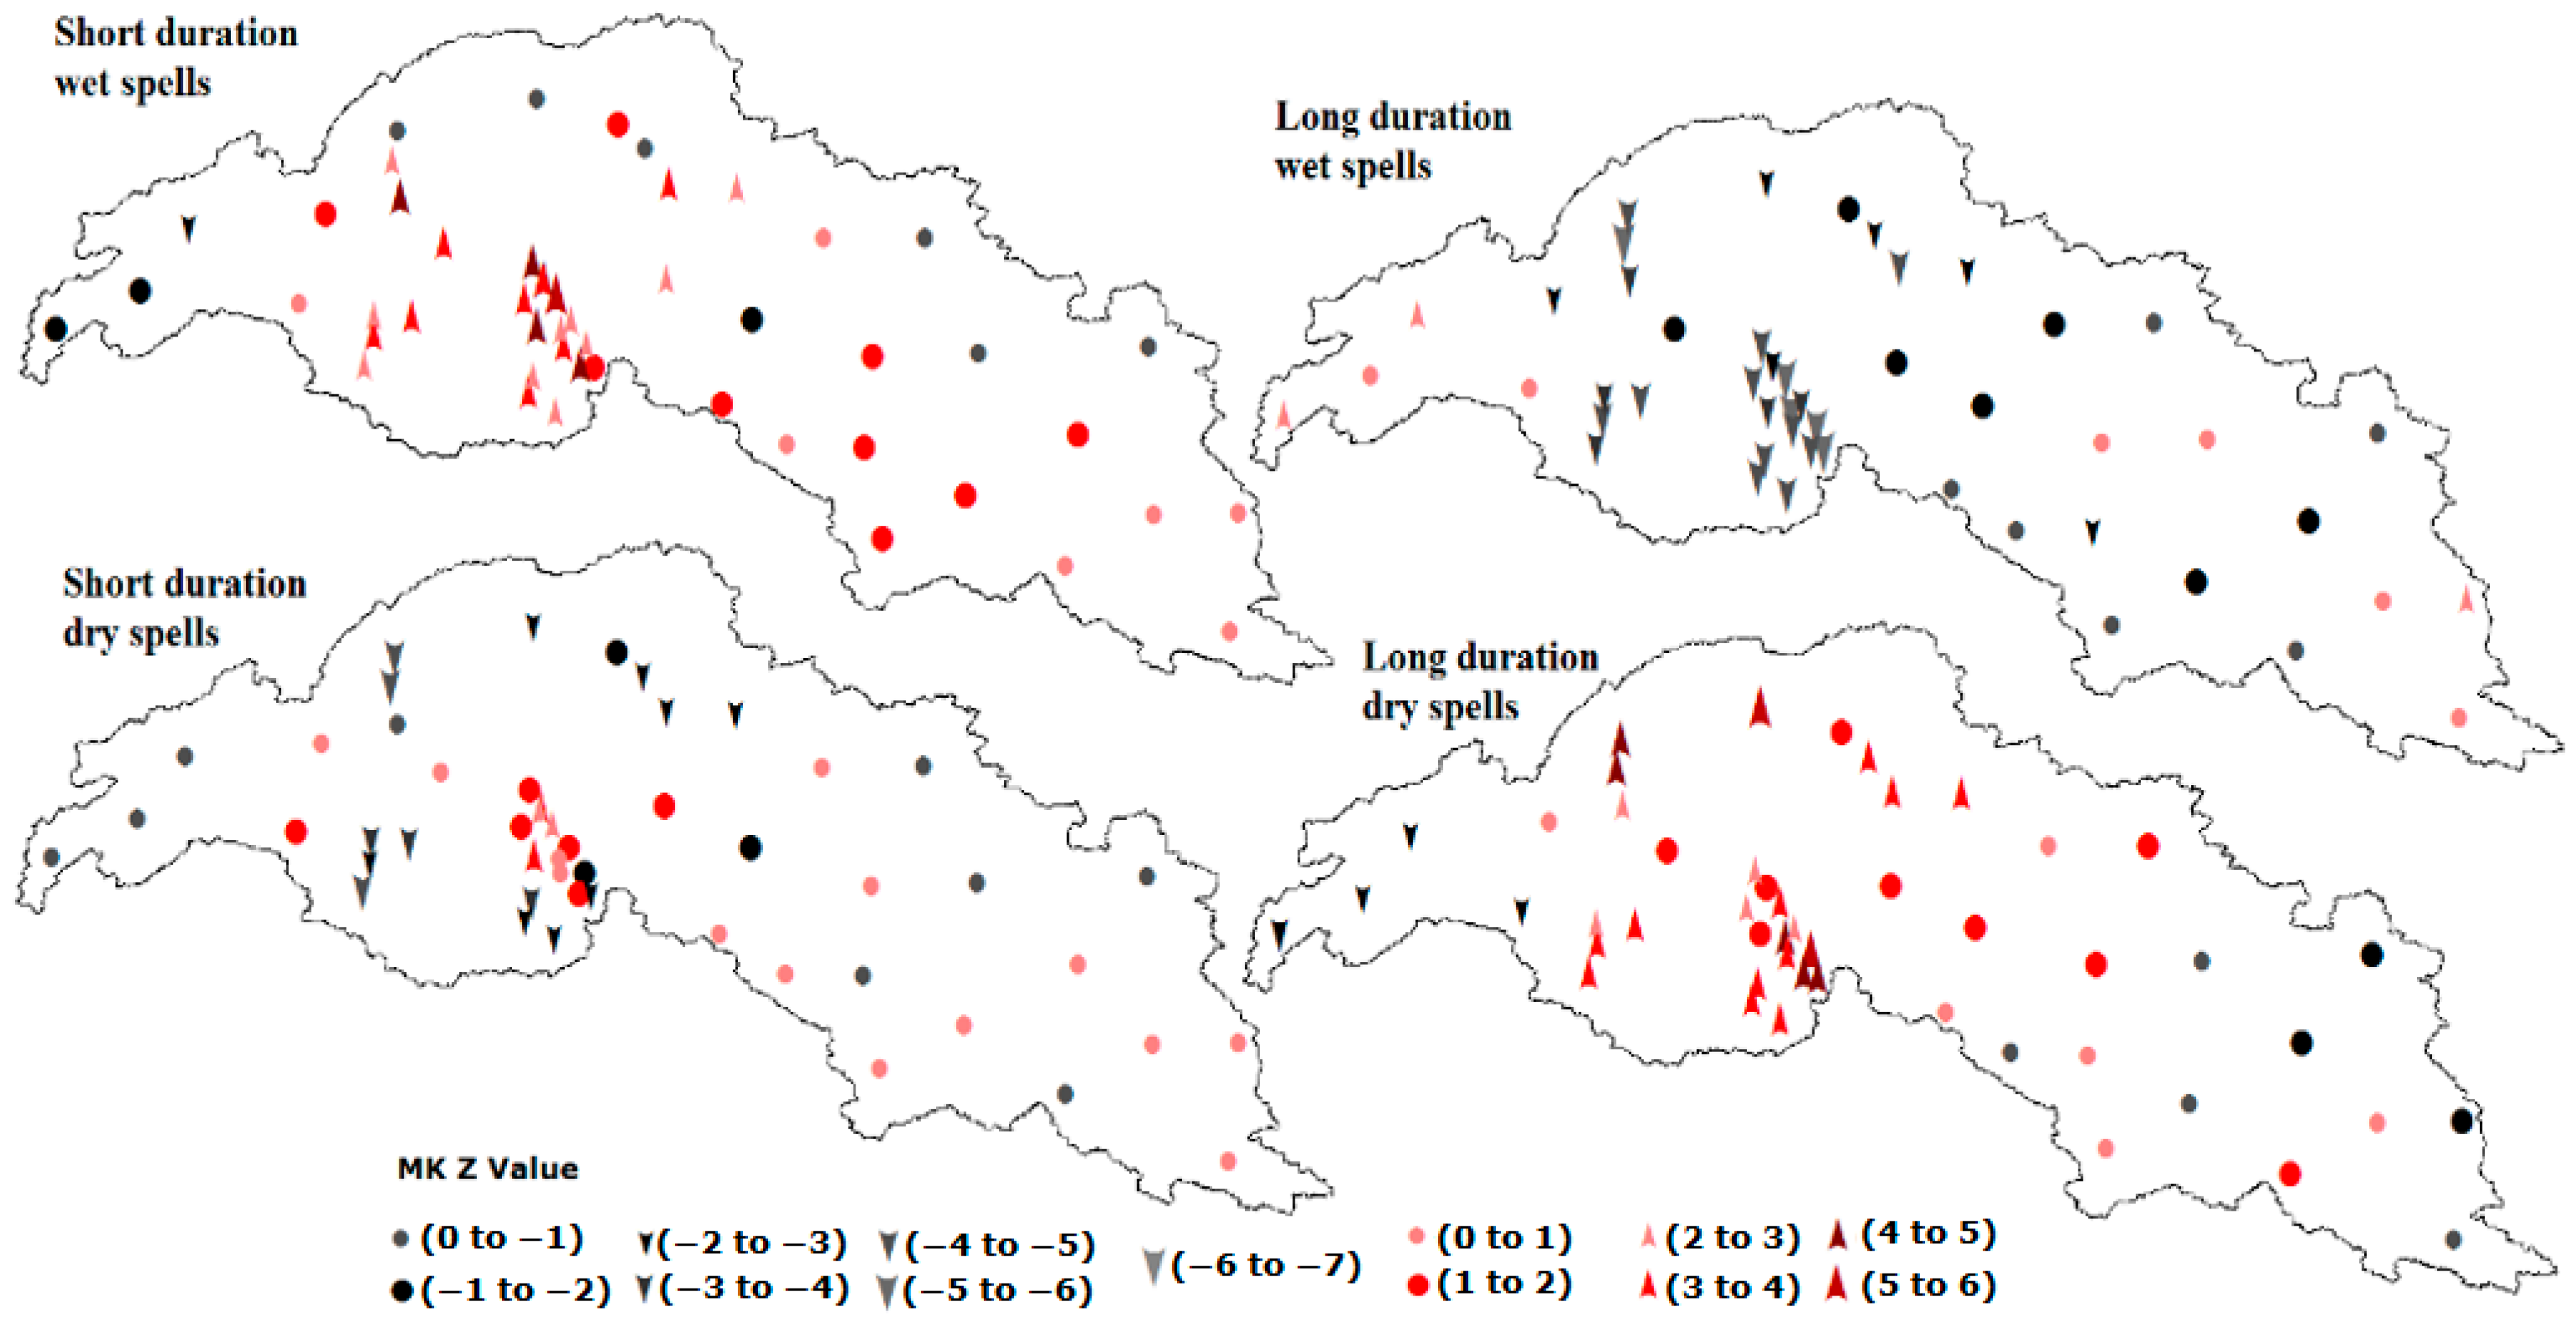
3.5. Trend Analysis of Wet and Dry Spells

Precipitation is very important for the restoration of ecosystems and for maintaining the atmospheric balance. According to De Groeve [58], heavy floods will hit Pakistan after a period of three years. Most of the precipitation in the study area took place as light and heavy precipitation. According to Iqbal [40], precipitation with a duration of 1–2 days was demarcated as short-duration wet spells, and precipitation with a duration of more than 2 days was defined as long-duration wet spells. Gong [41] used short- and long-duration precipitation to examine the continuation of precipitation events. The results of the trend analysis of short- and long-duration wet and dry spells are demonstrated in Figure 10. Short-duration wet spells exhibited increasing trends at most of the precipitation stations (80% of the stations), with significantly increasing trends at 48% of the stations. Long-duration wet spells exhibited decreasing trends at 82% of the stations, with 56% of the stations showing significantly decreasing trends (Figure 10). Long periods with continuous no precipitation will turn the land into desert and stress the ecosystem. Jabeen [59] reported the existence of drought conditions after a period of six years in Pakistan. Periods with no precipitation for less than 10 days were considered short-duration dry spells (short drought), while periods with no precipitation for more than 10 days were considered long-duration dry spells (long drought).
It is very alarming that short droughts, i.e., short-duration dry spells and long droughts, i.e., long-duration dry spells both exhibited increasing trends. Approximately 58% of the stations showed increasing trends in short-duration dry spells, with 8% of the stations showing significantly increasing trends, whereas 78% of the stations showed increasing trends in long-duration dry spells with significant increasing trends at 48% of the stations (Figure 10).

4. Conclusions

This study focused on characteristics and trends in precipitation and was carried out in the SRIR using daily precipitation data from 1961 to 2015. The SRIR is a transboundary basin, the major part of which is in Pakistan, followed by India, China, and Afghanistan. The water for agriculture, industry, and human consumption in the Indus Basin comes from this source region. Data from 28 gauging stations were collected from the PMD and the WAPDA, which covers only the Pakistani part of this source region. Due to the unavailability of precipitation data from other countries, APHRODITE precipitation data from 22 non-gauging stations (daily data, 1961–2015) were used for the analysis of different characteristics of precipitation in the study area along with the data from gauging stations. The validity of the APHRODITE precipitation data was checked by comparing it with the observed precipitation data from the gauging stations. The results showed that the APHRODITE precipitation data strongly corresponded to the measured precipitation data, as the values of the statistical indices were close to their perfect values.
Annual precipitation exhibited a significantly increasing trend, suggesting that the study area will provide enough surface water for agriculture in the Indus Basin if properly managed. The annual maximum amount of precipitation in the study area was recorded during 2015 and was 753.33 mm, while the minimum amount of annual precipitation was 344.39 mm, which was recorded in 2001. The results of the trend analysis for annual precipitation showed increasing trends in the Kabul, Chenab, Jhelum and Upper Indus sub-basins, which were significant at the 95% confidence level. The rainy days exhibited a decreasing trend, meaning that there will be precipitation for a limited number of days of a year, which increases the chances of flash floods in the study area. Most of the stations in the study area showed a significantly increasing trend in the winter and summer seasons, while nonsignificant increasing and decreasing trends were observed during the autumn and spring seasons.
The precipitation data from all the stations were divided into different classes, i.e., 0–10 mm, 10.1–25 mm and >25 mm classes. The light precipitation class (0–10 mm) exhibited decreasing trends in the SRIR and all its sub-basins, with significant decreases in the SRIR, Jhelum and Satluj sub-basins. The heavy precipitation class (>25 mm) exhibited increasing trends in the SRIR and all its sub-basins, which was significant at α = 5%, which indicates increased flood risks in the study area. The precipitation in the study area was mainly contributed by light precipitation, followed by moderate and heavy precipitation.
Precipitation with a duration of one to two days exhibited increasing trends at 40 stations, of which 24 stations exhibited significant increasing trends. Precipitation with a duration of more than two days showed decreasing trends at 41 stations, of which 28 stations showed significantly decreasing trends, indicating that most days in a year will be dry, which will convert the land into desert. Analysis of droughts was also carried out in the study area. Periods of less than 10 days without precipitation were considered short droughts, and periods without precipitation for more than 10 days were considered long droughts. Short droughts exhibited increasing trends at 29 stations, while long droughts exhibited increasing trends at 39 stations out of the total 50 stations in the study area.
From the findings of this study, it is concluded that precipitation in the study area is mainly contributed by the light class followed by the moderate and heavy classes. The light precipitation class exhibited decreasing trends, whereas the heavy precipitation class exhibited increasing trends, which increased the chances of floods in the region. Periods with no precipitation also exhibited increasing trends, which indicates increased risks of droughts in the future. On the basis of these findings, it is recommended to construct more structures, i.e., water storage reservoirs, to cope with floods and droughts. The use of water-efficient technologies is also recommended in the Indus Basin to cope with shortages of irrigation water in the scenario of increasing droughts in the future in the source region of the Indus River.

Author Contributions

All authors are involved in the intellectual part of this paper. X.L., M.R. and Y.C. designed this research. M.R. conducted the research and wrote the manuscript. L.A., J.N.C. helped in the data arrangement while K.J. helped in data analysis. X.L., Y.C., D.Z., Y.R., X.P. helped revise the manuscript and also provided many suggestions. All the authors have read and approved the final manuscript.

Funding

This work is supported by the Strategic Priority Research Program of the Chinese Academy of Sciences, Grant No. XDA20100104, the National Natural Science Foundation of China (grant No. 41630856, 41871280), and the 13th Five-year Informatization Plan of Chinese Academy of Sciences (Grant No. XXH13505-06).

Acknowledgments

The authors are thankful to Water and Power Development Authority (WAPDA) and Pakistan Meteorological Department (PMD) for providing the data for this research work. Acknowledgment is due to Research Institute for Humanity and Nature (RIHN) and the Meteorological Research Institute of Japan Meteorological Agency (MRI/JMA) for the use of APHRODITE data.

Conflicts of Interest

The authors declare no conflict of interest.

References

  1. Ojeh, E. Hydrology of the Indus Basin (Pakistan). 2006. Available online: https://waterinfo.net.pk/sites/default/files/knowledge/Hydrology%20of%20the%20Indus%20Basin.pdf (accessed on 10 February 2019).
  2. Hasson, S.U.; Böhner, J.; Lucarini, V. Prevailing climatic trends and runoff response from Hindukush–Karakoram–Himalaya, upper Indus Basin. Earth Syst. Dyn. 2017, 8, 337–355. [Google Scholar] [CrossRef]
  3. Lutz, A.F.; Lutz, A.; Immerzeel, W.W.; Kraaijenbrink, P.D.A.; Shrestha, A.B.; Bierkens, M.F.P. Climate Change Impacts on the Upper Indus Hydrology: Sources, Shifts and Extremes. PLOS ONE 2016, 11, e0165630. [Google Scholar] [CrossRef] [PubMed]
  4. Immerzeel, W.W.; Van Beek, L.P.H.; Bierkens, M.F.P. Climate Change Will Affect the Asian Water Towers. Science 2010, 328, 1382–1385. [Google Scholar] [CrossRef] [PubMed]
  5. Archer, D. Contrasting hydrological regimes in the upper Indus Basin. J. Hydrol. 2003, 274, 198–210. [Google Scholar] [CrossRef]
  6. Mukhopadhyay, B.; Khan, A. A quantitative assessment of the genetic sources of the hydrologic flow regimes in Upper Indus Basin and its significance in a changing climate. J. Hydrol. 2014, 509, 549–572. [Google Scholar] [CrossRef]
  7. Bookhagen, B.; Burbank, D.W. Toward a complete Himalayan hydrological budget: Spatiotemporal distribution of snowmelt and rainfall and their impact on river discharge. J. Geophys. Res. Space Phys. 2010, 115, 1–25. [Google Scholar] [CrossRef]
  8. Immerzeel, W.W.; Pellicciotti, F.; Bierkens, M.F.P.; Immerzeel, W. Rising river flows throughout the twenty-first century in two Himalayan glacierized watersheds. Nat. Geosci. 2013, 6, 742–745. [Google Scholar] [CrossRef]
  9. Immerzeel, W.W.; Pellicciotti, F.; Shrestha, A.B. Glaciers as a Proxy to Quantify the Spatial Distribution of Precipitation in the Hunza Basin. Mt. Res. Dev. 2012, 32, 30–38. [Google Scholar] [CrossRef]
  10. Dimri, A.P.; Chevuturi, A. Model sensitivity analysis study for western disturbances over the Himalayas. Meteorol. Atmos. Phys. 2014, 123, 155–180. [Google Scholar] [CrossRef]
  11. Dimri, A.; Yasunari, T.; Wiltshire, A.; Kumar, P.; Mathison, C.; Ridley, J.; Jacob, D. Application of regional climate models to the Indian winter monsoon over the western Himalayas. Sci. Total. Environ. 2013, 468, S36–S47. [Google Scholar] [CrossRef]
  12. Kwarteng, A.Y.; Dorvlo, A.S.; Kumar, G.T.V. Analysis of a 27-year rainfall data (1977–2003) in the Sultanate of Oman. Int. J. Clim. 2009, 29, 605–617. [Google Scholar] [CrossRef]
  13. Lazaro, R.; Rodrigo, F.S.; Gutiérrez, L.; Domingo, F.; Puigdefàbregas, J. Analysis of a 30-year rainfall record (1967–1997) in semi–arid SE Spain for implications on vegetation. J. Arid. Environ. 2001, 48, 373–395. [Google Scholar] [CrossRef]
  14. Trenberth, K.E. Changes in precipitation with climate change. Clim. Res. 2011, 47, 123–138. [Google Scholar] [CrossRef] [Green Version]
  15. Wu, P.; Christidis, N.; Stott, P. Anthropogenic impact on Earth’s hydrological cycle. Nat. Clim. Chang. 2013, 3, 807–810. [Google Scholar] [CrossRef]
  16. Abbas, F.; Ahmad, A.; Safeeq, M.; Ali, S.; Saleem, F.; Hammad, H.M.; Farhad, W. Changes in precipitation extremes over arid to semiarid and subhumid Punjab, Pakistan. Theor. Appl. Clim. 2013, 116, 671–680. [Google Scholar] [CrossRef]
  17. Pal, I.; Al-Tabbaa, A. Assessing seasonal precipitation trends in India using parametric and non-parametric statistical techniques. Theor. Appl. Climatol. 2011, 103, 1–11. [Google Scholar] [CrossRef]
  18. Chen, P.-C.; Wang, Y.-H.; You, G.J.-Y.; Wei, C.-C. Comparison of methods for non-stationary hydrologic frequency analysis: Case study using annual maximum daily precipitation in Taiwan. J. Hydrol. 2017, 545, 197–211. [Google Scholar] [CrossRef]
  19. Gajbhiye, S.; Meshram, C.; Singh, S.K.; Srivastava, P.K.; Islam, T. Precipitation trend analysis of Sindh river basin, India, from 102-year record (1901–2002). Atmos. Sci. Lett. 2016, 17, 71–77. [Google Scholar] [CrossRef]
  20. Knowles, N.; Dettinger, M.D.; Cayan, D.R. Trends in Snowfall versus Rainfall in the Western United States. J. Clim. 2006, 19, 4545–4559. [Google Scholar] [CrossRef] [Green Version]
  21. Callaghan, T.V.; Johansson, M.; Brown, R.D.; Groisman, P.Y.; Labba, N.; Radionov, V.; Bradley, R.S.; Blangy, S.; Bulygina, O.N.; Christensen, T.R.; et al. Multiple Effects of Changes in Arctic Snow Cover. Ambio 2011, 40, 32–45. [Google Scholar] [CrossRef] [Green Version]
  22. Llano, M.P.; Penalba, O.C. A climatic analysis of dry sequences in Argentina. Int. J. Clim. 2011, 31, 504–513. [Google Scholar] [CrossRef]
  23. Panagoulia, D.; Vlahogianni, E.I. Nonlinear dynamics and recurrence analysis of extreme precipitation for observed and general circulation model generated climates. Hydrol. Process. 2014, 28, 2281–2292. [Google Scholar] [CrossRef]
  24. Panagoulia, D.; Vlahogianni, E.I. Recurrence quantification analysis of extremes of maximum and minimum temperature patterns for different climate scenarios in the Mesochora catchment in Central-Western Greece. Atmos. Res. 2018, 205, 33–47. [Google Scholar] [CrossRef]
  25. Abbas, F.; Rehman, I.; Adrees, M.; Ibrahim, M.; Saleem, F.; Ali, S.; Rizwan, M.; Salik, M.R. Prevailing trends of climatic extremes across indus-delta of Sindh-Pakistan. Theor. Appl. Climatol. 2018, 131, 1101–1117. [Google Scholar] [CrossRef]
  26. Balling, R.C.; Kiany, M.S.K.; Roy, S.S. Anthropogenic signals in Iranian extreme temperature indices. Atmos. Res. 2016, 169, 96–101. [Google Scholar] [CrossRef]
  27. Yao, J.; Chen, Y. Trend analysis of temperature and precipitation in the Syr Darya Basin in Central Asia. Theor. Appl. Climatol. 2015, 120, 521–531. [Google Scholar] [CrossRef]
  28. Houze, R.A.; Rasmussen, K.L.; Medina, S.; Brodzik, S.R.; Romatschke, U. Anomalous Atmospheric Events Leading to the Summer 2010 Floods in Pakistan. Bull. Am. Meteorol. Soc. 2011, 92, 291–298. [Google Scholar] [CrossRef]
  29. Li, X.; Cheng, G.; Lin, H.; Cai, X.; Fang, M.; Ge, Y.; Hu, X.; Chen, M.; Li, W. Watershed System Model: The Essentials to Model Complex Human-Nature System at the River Basin Scale. J. Geophys. Res. Atmos. 2018, 123, 3019–3034. [Google Scholar] [CrossRef]
  30. Lutz, A.F.; Immerzeel, W.W.; Shrestha, A.B.; Bierkens, M.F.P.; Lutz, A.; Immerzeel, W. Consistent increase in High Asia’s runoff due to increasing glacier melt and precipitation. Nat. Clim. Chang. 2014, 4, 587–592. [Google Scholar] [CrossRef]
  31. Immerzeel, W.W.; Bierkens, M.F.P. Asia’s water balance. Nat. Geosci. 2012, 5, 841. [Google Scholar] [CrossRef]
  32. Bajracharya, S.R.; Shrestha, B.R. The Status of Glaciers in the Hindu Kush-Himalayan Region; International Centre for Integrated Mountain Development (ICIMOD): Kathmandu, Nepal, 2011. [Google Scholar]
  33. UNEP (United Nations Environment Programme). Recent Trends in Melting Glaciers, Tropospheric Temperatures over the Himalayas and Summer Monsoon Rainfall Over India; Division of Early Warning and Assessment Nairobi: Nairobi, Kenya, 2009. [Google Scholar]
  34. Zonn, I.S. Water resources of Northern Afghanistan and Their Future Use. Unpublished Paper Prepared for Meeting. 2002. Available online: http://www.cawater-info.net/afghanistan/pdf/zonn.pdf (accessed on 21 February 2019).
  35. Hewitt, K. The Karakoram Anomaly? Glacier Expansion and the ‘Elevation Effect,’ Karakoram Himalaya. Mt. Res. Dev. 2005, 25, 332–340. [Google Scholar] [CrossRef]
  36. Yao, T.; Thompson, L.; Yang, W.; Yu, W.; Gao, Y.; Guo, X.; Yang, X.; Duan, K.; Zhao, H.; Xu, B.; et al. Different glacier status with atmospheric circulations in Tibetan Plateau and surroundings. Nat. Clim. Chang. 2012, 2, 663–667. [Google Scholar] [CrossRef]
  37. Tahir, A.A.; Chevallier, P.; Arnaud, Y.; Neppel, L.; Ahmad, B. Modeling snowmelt-runoff under climate scenarios in the hunza river basin, Karakoram range, Northern Pakistan. J. Hydrol. 2011, 409, 104–117. [Google Scholar] [CrossRef]
  38. Yuan, F.; Berndtsson, R.; Zhang, L.; Uvo, C.B.; Hao, Z.; Wang, X.; Yasuda, H. Hydro Climatic Trend and Periodicity for the Source Region of the Yellow River. J. Hydrol. Eng. 2015, 20, 5015003. [Google Scholar] [CrossRef]
  39. Hu, Y.; Maskey, S.; Uhlenbrook, S. Trends in temperature and rainfall extremes in the yellow river source region, China. Clim. Chang. 2012, 110, 403–429. [Google Scholar] [CrossRef]
  40. Iqbal, M.; Wen, J.; Wang, S.; Tian, H.; Adnan, M. Variations of precipitation characteristics during the period 1960–2014 in the Source Region of the Yellow River, China. J. Arid. Land 2018, 10, 388–401. [Google Scholar] [CrossRef]
  41. Gong, D.-Y.; Shi, P.-J.; Wang, J.-A. Daily precipitation changes in the semi-arid region over northern China. J. Arid. Environ. 2004, 59, 771–784. [Google Scholar] [CrossRef]
  42. Mukherjee, S.; Ballav, S.; Soni, S.; Kumar, K.; De, U.K. Investigation of dominant modes of monsoon ISO in the Northwest and eastern Himalayan region. Theor. Appl. Climatol. 2016, 125, 489–498. [Google Scholar] [CrossRef]
  43. Wang, S.; Ding, Y.; Iqbal, M. Defining Runoff Indices and Analyzing Their Relationships with Associated Precipitation and Temperature Indices for Upper River Basins in the Northwest Arid Region of China. Water. 2017, 9, 618. [Google Scholar] [CrossRef]
  44. Mavromatis, T.; Stathis, D. Response of the water balance in Greece to temperature and precipitation trends. Theor. Appl. Climatol. 2011, 104, 13–24. [Google Scholar] [CrossRef]
  45. Birsan, M.V.; Molnar, P.; Burlando, P.; Pfaundler, M. Streamflow trends in Switzerland. J. Hydrol. 2005, 314, 312–329. [Google Scholar] [CrossRef]
  46. Norrant, C.; Douguédroit, A. Monthly and daily precipitation trends in the Mediterranean (1950–2000). Theor. Appl. Climatol. 2006, 83, 89–106. [Google Scholar] [CrossRef]
  47. Hamed, K.H. Trend detection in hydrologic data: The Mann–Kendall trend test under the scaling hypothesis. J. Hydrol. 2008, 349, 350–363. [Google Scholar] [CrossRef]
  48. Amin, M.T.; Rizwan, M.; Alazba, A.A. A best-fit probability distribution for the estimation of rainfall in northern regions of Pakistan. Open Life Sci. 2016, 11, 432–440. [Google Scholar] [CrossRef]
  49. David, M. Geostatistical Ore Reserve Estimation; Elsevier: Amsterdam, the Netherlands, 2012. [Google Scholar]
  50. Tabios, G.Q.; Salas, J.D. A comparative analysis of techniques for spatial interpolation of precipitation. JAWRA J. Am. Water Resour. Assoc. 1985, 21, 365–380. [Google Scholar] [CrossRef]
  51. Phillips, D.L.; Dolph, J.; Marks, D. A comparison of geostatistical procedures for spatial analysis of precipitation in mountainous terrain. Agric. For. Meteorol. 1992, 58, 119–141. [Google Scholar] [CrossRef]
  52. Khattak, M.; Babel, M.; Sharif, M. Hydro-meteorological trends in the upper Indus River basin in Pakistan. Clim. Res. 2011, 46, 103–119. [Google Scholar] [CrossRef]
  53. Yan, L.; Liu, X. Has climatic warming over the Tibetan plateau paused or continued in recent years? J. Earth Ocean Atmos. Sci. 2014, 1, 13–28. [Google Scholar]
  54. Duhan, D.; Pandey, A. Statistical analysis of long term spatial and temporal trends of precipitation during 1901–2002 at Madhya Pradesh, India. Atmos. Res. 2013, 122, 136–149. [Google Scholar] [CrossRef]
  55. Wen, X.; Wu, X.; Gao, M. Spatiotemporal variability of temperature and precipitation in Gansu Province (Northwest China) during 1951–2015. Atmos. Res. 2017, 197, 132–149. [Google Scholar] [CrossRef]
  56. Khattak, M.S.; Khan, A.; Alam Khan, M.; Ahmad, W.; Rehman, S.U.; Sharif, M.; Ahmad, S. Investigation of Characteristics of Hydrological Droughts in Indus Basin. Sarhad J. Agric. 2019, 35, 48–56. [Google Scholar] [CrossRef]
  57. Ahmad, I.; Zhang, F.; Tayyab, M.; Anjum, M.N.; Zaman, M.; Liu, J.; Farid, H.U.; Saddique, Q. Spatiotemporal analysis of precipitation variability in annual, seasonal and extreme values over upper Indus River basin. Atmos. Res. 2018, 213, 346–360. [Google Scholar] [CrossRef]
  58. De Groeve, T.; Kugler, Z.; Brakenridge, G.R. Near real time flood alerting for the global disaster alert and coordination system. In Proceedings ISCRAM2007; De Groeve, T., Kugler, Z., Brakenridge, G.R., Eds.; VUBPRESS Brussels University Press: Brussels, Belgium, 2006; pp. 33–39. [Google Scholar]
  59. Jabeen, S.; Ashfaq, M.; AHMAD-BAIG, I. Linear program modeling for determining the value of irrigation water. J. Agric. Soc. Sci. 2006, 2, 101–105. [Google Scholar]
Figure 1. Location of the study area along with gauging and non-gauging stations.
Water 11 01366 g001
Figure 2. Elevation zones and main sub-basins of the study area.
Water 11 01366 g002
Figure 3. Comparison of Mann-Kendall (MK)-Z and slope of average monthly observed and APHRODITE precipitation data.
Water 11 01366 g003
Figure 4. Averaged monthly precipitation in the study area and its river basins from 1961 to 2015.
Water 11 01366 g004
Figure 5. Spatial distribution of the average annual precipitation in the study area.
Water 11 01366 g005
Figure 6. (a) Elevation-dependent precipitation, (b) trends and slope of precipitation at different elevations.
Water 11 01366 g006
Figure 7. Time series of annual precipitation and rainy days (a) Source region of the Indus River, (b) Kabul sub-basin, (c) Upper Indus sub-basin, (d) Jhelum sub-basin, (e) Chenab sub-basin, (f) Satluj sub-basin.
Water 11 01366 g007
Figure 8. Trends in seasonal precipitation, annual precipitation, and rainy days.
Water 11 01366 g008
Figure 9. Distribution of rainy days for light, moderate, and heavy precipitation.
Water 11 01366 g009
Figure 10. Trend analysis of short- and long-duration wet and dry spells in the study area.
Water 11 01366 g010
Table 1. Results of the statistical indices that were calculated to evaluate the Asian Precipitation-Highly Resolved Observational Data Integration Towards Evaluation of Water Resources (APHRODITE) precipitation data.
Statistical IndicesResults of Statistical Indices
MinimumMaximumAverage
CC0.30.90.7
SE0.33.31.8
IOA0.50.90.8
Bias−19.220.22.3
RMSE1.28.75.9
Table 2. Results of MK test statistics (Z) and Sen’s slope (Q) for different precipitation classes.
BasinLight PrecipitationModerate PrecipitationHeavy Precipitation
ZQZQZQ
SRIR−2 *−0.7 *1.90.53.4 *1.8 *
Kabul sub-basin−0.3−0.21.60.73.9 *2.5 *
Upper Indus sub-basin−0.5−0.13 *0.5 *3.1 *1.1 *
Jhelum sub-basin−4.6 *−2.7 *0.20.13 *5 *
Chenab sub-basin−0.6−0.31.313.5 *3.2 *
Satluj sub-basin−3.5 *−1.9 *1.10.42.3 *0.2 *
* Significant at the 5% level.
Table 3. Contributions of different precipitation classes.
River BasinsPrecipitation ClassesPrecipitation Contributions in Different Seasons (%)
WinterSpringSummerAutumn
SRIRLight45464655
Moderate30302527
Heavy25232918
KabulLight42424956
Moderate34332427
Heavy25252717
UIRBLight70596470
Moderate18231920
Heavy12191710
JhelumLight32363243
Moderate33362634
Heavy35294223
ChenabLight39486763
Moderate35312426
Heavy26211012
SatlujLight76837989
Moderate2115168
Heavy3253

