Article

Expected Shifts in Nekton Community Following Salinity Reduction: Insights into Restoration and Management of Transitional Water Habitats

1
Dipartimento di Scienze Ambientali, Informatica e Statistica (DAIS), Università Ca’ Foscari Venezia, Via Torino 155, 30170 Venezia, Italy
2
Istituto Superiore per la Protezione e la Ricerca Ambientale (ISPRA), Loc. Brondolo, 30015 Chioggia, Italy
*
Author to whom correspondence should be addressed.
Water 2019, 11(7), 1354; https://doi.org/10.3390/w11071354
Submission received: 20 May 2019 / Revised: 12 June 2019 / Accepted: 25 June 2019 / Published: 29 June 2019
(This article belongs to the Special Issue Ecological Status Assessment of Transitional Waters)

Abstract

:
A restoration project is planned to take place in the northern Venice lagoon (northern Adriatic Sea, Italy), aiming at introducing freshwater into a confined shallow water lagoon area and recreating transitional water habitats. This work describes the shifts in the nekton (fish and decapods) community structure to be expected following the future salinity decrease in the restoration area. Nekton was sampled at a series of natural shallow water sites located along salinity gradients in the Venice lagoon. A multivariate GLM approach was followed in order to predict species biomass under the salinity and environmental conditions expected after restoration. Biomass of commercially important species, as well as species of conservation interest, is predicted to increase following salinity reduction and habitat changes. From a functional perspective, an increase in biomass of hyperbenthivores-zooplanctivores, hyperbenthivores-piscivores and detritivores is also expected. This study emphasises the efficacy of a predictive approach for both ecological restoration and ecosystem management in transitional waters. By providing scenarios of community structure, the outcomes of this work could be employed in future evaluations of restoration success in the Venice lagoon, as well as to develop management tools to forecast the effects of alterations of salinity regimes in coastal lagoons due to climate change.

1. Introduction

Transitional waters, including estuaries and coastal lagoons, are highly heterogeneous ecosystems, being characterised by the presence of strong gradients in water and sediment properties and composed of a diverse mosaic of morphologies and biogenic structures [1,2]. This makes them highly valuable ecosystems supporting unique biological communities. Nekton fauna (fish and swimming invertebrates) play a central role in transitional waters, mediating multiple ecological processes and including species of commercial and conservation interest [1,3,4,5]. The distribution of biological communities in transitional waters is driven by multiple environmental factors, among which salinity is crucial in determining the organism responses at the physiological level [3,6]. The nekton community structure, in particular, may be affected by the different species tolerances and preferences to salinity, with migratory, marine and freshwater straggler taxa being especially influenced by spatial and inter-annual variations in salinity levels within estuarine ecosystems [3,7,8,9,10,11].
A variety of anthropogenic pressures affect transitional water ecosystems, which may lead to habitat degradation, alterations of ecological processes and depletion of biological communities, ultimately impairing the ecosystem status and functionality [12,13]. The restoration of both abiotic and biotic components of transitional water ecosystems is recognised as a strategic approach to both enhance the ecological status of degraded transitional water ecosystems (sensu Dir. 2000/60/EC Water Framework Directive, WFD) and tackle the loss of biodiversity [14,15,16]. In recent years, a variety of schemes have been carried out in estuaries and coastal lagoons all over the world, aiming at re-establishing specific habitats previously degraded or lost [17,18] and enhancing the status of faunal communities [19,20,21,22]. Due to the central role of salinity in transitional water ecosystems, its management by means of hydrological and morphological improvement have been of particular interest for scientists and practitioners in these environments [16,23,24], and in many instances, the control of salinity has been proposed as a measure to achieve ecological restoration. For example, increasing and stabilising salinity levels in enclosed lagoon basins by enhancing connections with the sea would improve trophic status and conservation of vulnerable habitats such as saltmarshes and seagrass meadows [25], as well as fishery yields and faunal diversity [26]. On the other hand, recreating the salinity gradient in estuaries and lagoons subjected to previous river diversions and the unsustainable use of freshwater could significantly contribute to the restoration of key ecological components [27], as well as influence the structure and functioning of biological communities and the provision of ecosystem services [28,29].
Defining the targets of restoration, i.e., which measurable ecological goals are expected to be met once the restoration scheme is completed, is a critical step in the evaluation of the success of interventions [30]. Traditionally, targets are defined in terms of abiotic conditions of soil, water and sediments, or vegetation structure and composition that characterise habitats subjected to restoration [31]. However, in recent years, a wider approach emerged in restoration ecology, emphasising the importance of including functional attributes of re-created habitats (e.g., their trophic role for faunal communities and their ability to support overall biodiversity) among the measurable targets of restoration [32,33,34]. Furthermore, from a methodological perspective, restoration ecology is rapidly starting to incorporate predictive approaches for the evaluation of project performances [35]. Employing forecasting techniques would indeed contribute to provide robust and less uncertain assessments of restoration success, for instance, by predicting in advance the structure of biological communities prior to the end of habitat re-creation actions, [36] hence allowing for an adaptive management of conservation efforts [37,38].
Defining realistic targets and evaluating restoration success can be particularly difficult in transitional water ecosystems. Here, the high levels of natural stress and the hysteresis exhibited by many ecological components after restoration often mask the response of the ecosystem to management and conservation measures [16,24,39,40]. Due to their central role in ecosystem functioning, nekton fauna in transitional waters is widely employed as indicator of ecological health, being also included among the biological elements to be evaluated for the assessment of the ecological status of European transitional water bodies under the Water Framework Directive [41,42,43,44]. Estuarine and lagoon nekton communities are also considered in studies investigating the effects of restoration measures, including those involving the management of salinity regimes in hydrologically impaired water bodies [19,20,29,45,46,47,48].
In the Mediterranean basin, the intense human development occurred in the last centuries and the subsequent alterations of hydrodynamics and sediment balances determined major losses of transitional water habitats in estuaries and coastal lagoons [49,50,51,52,53,54]. The Venice lagoon (northern Adriatic Sea, Italy) in particular, experienced centuries of land claim and decreased freshwater and sediment inputs from the mainland due to historical diversion of major rivers [55,56]. During the last century, the higher hydrodynamic energy caused by jetty construction at the sea inlets and channel dredging further enhanced the morphological and hydrological alterations [57,58]. Overall, this determined the loss of extensive portions of saltmarshes and intertidal flats, and the almost complete disappearing of reedbed and oligo and mesohaline conditions that originally dominated the interface between the lagoon and the drainage basin [49,50,59,60].
In the Venice lagoon, a restoration project (LIFE Lagoon ReFresh; www.lifelagoonrefresh.eu) is planned to establish a salinity gradient in a currently euhaline shallow water area, by connecting the basin to an adjacent river course and creating a freshwater inflow up to 1000 L s−1. In addition, a series of morphological interventions are planned in the area. These include the arrangement of biodegradable modular elements and the transplantation of reed (Phragmites australis (Cav.) Trin. ex Steud.) and submerged angiosperms (Ruppia cirrhosa (Petagna) Grande and Zostera noltei Hornem.), which are expected to slow down the dispersion of freshwater and control turbidity and nutrient peaks during river overflows [61]. The creation of a new freshwater input, scheduled for autumn 2019, is expected to restore many of the transitional attributes in the lagoon area. In particular, the project foresees the enhancement of habitat functionality for nekton fauna [61].
This paper aims at defining the structure of nekton assemblage to be expected after the restoration of the salinity gradient in an inner, euhaline area of the Venice lagoon, following the predictive approach proposed by Scapin et al. [36] for seagrass nekton communities. The work is structured into two phases: (i) an assemblage-level model was calibrated, in order to explain nekton variability with temporal, environmental and habitat factors characterising sites located along natural salinity gradients in the Venice lagoon; (ii) a set of target scenarios were defined in terms of salinity and other environmental factors that are expected at the end of the restoration process. The taxonomical and functional structure of nekton assemblage expected according to such scenarios was subsequently predicted, using the model developed in the first phase.

2. Materials and Methods

The Venice lagoon is the largest Mediterranean coastal lagoon, with a surface of approximately 550 km2, and is characterised by a microtidal regime, experiencing a tidal range of ±0.50 m during spring tides [62]. Two main watersheds are present in the lagoon, identifying three large sub-basins (northern, central and southern) [63]. Each sub-basin exchanges water with the sea through an inlet. The lagoon is mostly composed of shallow water areas, with an average depth of 1.2 m [64], which are intersected by a network of deeper channels leading inwards from the inlets and branching inside each sub-basin [63,65]. The lagoon is also characterised by several freshwater inputs from the drainage basin, the most consistent of which are located in the northern sub-basin [66] (Figure 1).
Shallow water areas are therefore characterised by strong gradients in environmental conditions such as salinity, dissolved oxygen, turbidity, trophic status and sediment granulometry, these being driven not only by natural processes, but also by multiple anthropogenic pressures [49]. Overall, salinity levels range from polyhaline (18–30) to euhaline (>30) conditions, although values can reach 5 in areas closer to freshwater inputs, depending on the intensity of river discharges [66]. This heterogeneity contributes to creating a complex mosaic of islands, saltmarshes, mud and sand-flats, seagrass meadows and man-made structures. Saltmarshes and intertidal and subtidal flats dominate the mosaic of shallow waters in the inner lagoon areas. Seasonal beds of macroalgae often occur on flats, and sparse patches of Zostera noltei and Ruppia cirrhosa can be present along marsh edges and in marsh creeks. Reedbed is now rare, and limited to areas more directly influenced by freshwater [61]. The lagoon area that will be subjected to the restoration of freshwater inflow is a mostly shallow, inner portion of the northern sub-basin. It is characterised by high water residence times (>20 days; [63]) and euhaline conditions, with salinity levels often higher than 30 PSU, and only occasionally lowered by intense rainfall events [61,66].
In this study, nekton and environmental sampling was carried out in 39 shallow water sites in the three sub-basins. The sites were located along the major salinity gradients, either in confined saltmarsh creeks or at marsh edges exposed to shallow flats, and encompassed the range of environmental and habitat variability that characterises the inner areas of the lagoon (Figure 1).
Nekton and environmental data were gathered from 10 years of surveys in the Venice lagoon (between 2004 and 2018; [44,67,68,69,70]) and included observations performed either in spring, summer or autumn depending on the specific survey. A total of 179 observations were included in the dataset. Nekton sampling was carried out by seine netting, following the protocol described in Franco et al. [67]. The specimens were identified at the species level, and total biomass (g) per species was registered. The data were standardised per area unit (g 100 m−2), allowing comparison between samples. Together with nekton sampling, water temperature (°C), salinity (PSU), dissolved oxygen (DO, percentage of saturation) and turbidity (FNU) were measured with a multi-parameter probe, and the presence of macroalgae was recorded. A value of sediment grain size (percentage of sand in the 10 cm surface layer) was finally associated to each sampling site using data from previous studies [71,72,73].
Field data were employed in a model framework to identify factors driving nekton variability and then predict assemblage characteristics under scenarios of salinity reduction, following the approach proposed for the restoration of seagrass meadows in the Venice lagoon by Scapin et al. [36]. Negative binomial generalised linear models (GLMs) were fitted to biomass of each species contributing to 98% of total assemblage biomass. A set of different model formulations was considered, taking into account different combinations of temporal, geographical, and environmental predictors. Five model categories were included, investigating the following hypotheses (Table 1): None of the predictors considered affect the response variable (null model: category m0); the response variable is affected by the temporal factor only (seasonal and inter-annual variability; category m1); the response variable responds to both temporal factors and the sub-basin (category m2); the response variable is affected by temporal factors, the sub-basin and environmental characteristics of water and bottom surface (category m3); the response variable responds to temporal factors, the sub-basin, environmental characteristics and location (the latter specified either as saltmarsh creek or edge) (category m4). The relative influence of each predictor on variability of nekton assemblage was hence evaluated by comparing the different model formulations (Table 1) in a hierarchical framework [36,41]. Following the approach of the manyglm function contained in the mvabund software package [74], the inference was carried out at the assemblage level by combining species-specific results in a global analysis. The significance of the contribution of additive variables to the simpler model was assessed by means of likelihood ratio tests with 1000 bootstrap iterations. This allowed to investigate a series of hypotheses on the different contribution of each predictor on the overall assemblage variability. Test t1 tested the hypothesis that the temporal factor would improve the null model; test t2 tested the hypothesis that sub-basin would improve the temporal model; tests belonging to category t3 tested the hypothesis that each water parameter and bottom characteristic would progressively improve the previous model; test t4 tested the hypothesis that location would improve a model already taking into account all the previous predictors (Table 1). The model formulation resulting from the outcomes of the tests (i.e., that including only relevant predictors) was then selected, and employed in the second phase of the work to predict the expected nekton assemblages.
The predictive capability of the selected model was assessed by means of Spearman’s r coefficients, calculated between observed and predicted biomass values by means of a k-fold cross-validation (k = 5, [75]). The coefficients were computed for the whole assemblage (i.e., using species, sampling sites and dates as replicates) and for each species separately.
Predictor coefficients estimated by the selected model were used to quantify the magnitude and the sign (either positive or negative) of species response to physico-chemical variables and location (coefficients for seasons, years and sub-basins not shown). In order to provide an assessment of the response at the assemblage level, the absolute (i.e., without sign) values of estimated coefficients for each predictor were averaged among species, using the mean species biomass as weight.
Following the approach of Scapin et al. [36], the values of predictor variables were defined in a set of scenarios, as expected at the end of the restoration scheme. This allowed the prediction of the assemblages expected after establishing the freshwater input and creating the salinity gradient in the project area.
Three restoration scenarios were included, accounting for three different target levels of salinity reduction: 10, 18 and 25 PSU, as expected at the end of the project (see also Figure A1 in Appendix A, [61]). A fourth scenario was taken into account, describing the current salinity conditions in the project area (ca. 30 PSU; [61]). All the scenarios were based on the northern lagoon sub-basin (i.e., where restoration will take place) and in all the scenarios, levels of environmental parameters were set as the inter-annual average values measured during each season in northern sub-basin sites employed in the calibration phase. The year was set as the average sampling year considered in calibration. Since saltmarsh creeks are not expected to be a prominent habitat feature in the restored area in the near future [61], in all the scenario explorations, predictions were carried out for the exposed marsh edge location. The scenarios were defined for spring, summer and autumn separately (Table 2).
Species predicted with low accuracy (i.e., species associated with a Spearman’s cross-validation coefficient lower than 0.25) were excluded from the predicted assemblage. In order to provide a functional assessment of the expected assemblage, species were subsequently grouped into functional guilds. Both ecological guilds, summarising the different use of transitional water habitats by species, and feeding guilds, grouping species with similar food targets and foraging strategies, were considered. Predicted species densities were then aggregated accordingly. Eight ecological guilds (estuarine use functional guilds, EUFGs) were taken into account, adapting the classification approach of Potter et al. [76] to the Venice lagoon: Solely estuarine resident species (ESs), found exclusively within the lagoon ecosystem; estuarine resident species (ES), spending all or most of their life cycle within the lagoon, but represented also by marine populations; marine estuarine-dependents (ME-D), marine-spawning species that require transitional water habitats during the juvenile stages; marine estuarine-opportunists (ME-O), marine-spawning species that regularly enter the lagoon but can alternatively use other coastal habitats; marine stragglers (MS), stenohaline marine species irregularly found within the lagoon in areas most influenced by the sea; freshwater stragglers (FS), stenohaline freshwater species that occur occasionally in the lagoon near river mouths; catadromous (C), species entering the lagoon during periodic migrations from marine spawning areas to freshwaters; anadromous (A), species entering the lagoon during periodic migrations from freshwater spawning areas to the sea. Seven feeding guilds (feeding mode functional guilds, FMFGs) were taken into account, adapting the classification of Franco et al. [77] to the Venice lagoon: Detritivores (D), feeding on small organisms and organic matter associated to the substratum; microbenthivores (Bmi), feeding on benthic fauna smaller than 1 cm; macrobenthivores (Bma), feeding on benthic fauna larger than 1 cm; hyperbenthivores-zooplanctivores (HZ), feeding either on small (<1 cm) hyperbenthos or zooplankton; hyperbenthivores-piscivores (HP), feeding either on large (>1 cm) hyperbenthos or fish; omnivores (OV), which ingest both plant and animal material; planktivores (PL), feeding predominantly on zooplankton and occasionally on phytoplankton. Since a species could be allocated to multiple feeding guilds, the contribution of each species to a guild was expressed as a proportion (0 to 1), by identifying the importance of different food resources within the diet based on literature [78] and available data for the Venice lagoon [41,79].

3. Results

3.1. Environmental Variability

Physico-chemical parameters measured at natural sites employed for model calibration varied markedly according to the sampling season, sub-basin and location along the environmental gradients. Temperature, for instance, was characterised by seasonal fluctuations, showing average values of 19.5 (standard deviation 4.3), 25.1 (sd 2.8) and 18 °C (sd 5.6) in spring, summer and autumn respectively. Similarly, average dissolved oxygen values were 94.3 (sd 19.2), 73.4 (sd 19.1) and 85.6% (sd 15.2) during the three seasons. Other environmental parameters, in turn, varied spatially. Salinity ranged from 4 to 40, showing lower values at sites located in the inner portions of the lagoon, closer to freshwater inputs. Sediment grain size (range 1 to 72% sand) and water turbidity (range 1 to 69 FNU) varied both along the salinity gradient (with lower grain size and higher turbidity in inner lagoon areas) and between the two habitat locations considered (with lower grain size and lower turbidity inside saltmarsh creeks). Finally, the sampling sites in the northern, central and southern sub-basins showed some differences in terms of salinity, with average values of 24.2 (sd 8.8), 28.7 (sd 6.2) and 24.3 (sd 8.6) respectively, and sediment grain size, with average values of 16.9 (sd 11.9), 17.2 (sd 10.5) and 27.7% sand (sd 21.3) respectively.

3.2. Model Calibration

Twelve species accounted for 98% of total assemblage biomass at the sampling sites selected for the model calibration phase, including 10 fish and two decapod taxa (Table 3).
The likelihood ratio tests among pairs of model formulations highlighted that the temporal factor significantly explained assemblage biomass (p-value = 0.002; test t1), and that the geographical factor (sub-basin) significantly explained assemblage biomass (p-value = 0.002) when added to a model already including temporal factor (t2). Among physico-chemical predictors, temperature significantly (p-value = 0.041) improved a model already including both temporal and geographical factors (t3.1), and salinity significantly (p-value = 0.012) improved a model already including temporal and geographical factors and temperature (t3.2). Dissolved oxygen (t3.3), turbidity (t3.4), sediment grain size (t3.5) and presence of macroalgae (t3.6) did not improve the model significantly (p-values > 0.05). Finally, the inclusion of the location factor to the model already taking into account temporal and geographical factors, temperature and salinity significantly (p-value = 0.045) explained assemblage biomass (t4). As a result, the GLM formulation including temporal factor, geographical factor, temperature, salinity and location was selected as the best model explaining the variability of nekton biomass.
Most of the species included in the analysis were predicted accurately (cross-validated average Spearman’s coefficients between 0.28 and 0.60), including big-scale sand smelt Atherina boyeri Risso, 1810, Mediterranean banded killifish Aphanius fasciatus Valenciennes, 1821, rockpool prawn Palaemon elegans Rathke, 1837, brown shrimp Crangon crangon Linnaeus, 1758, black-spotted goby Pomatoschistus canestrinii Ninni, 1883, marbled goby P. marmoratus Risso, 1810, Adriatic dwarf goby Knipowitschia panizzae Verga, 1841, thinlip grey mullet Chelon ramada Risso, 1827 and european flounder Platichthys flesus Linnaeus, 1758 (Table 3). Conversely, golden grey mullet Chelon auratus Risso, 1810, leaping mullet C. saliens Risso, 1810 and gilthead seabream Sparus aurata Linnaeus, 1758 were predicted with lower accuracy (cross-validated average coefficients <0.25), and therefore they were excluded from the prediction of the expected assemblage. Overall, the whole assemblage was predicted with good accuracy (cross-validated average coefficient = 0.46; Table 3).
Among the significant environmental factors, both site location within saltmarsh creeks and salinity showed a strong average influence on the whole assemblage biomass according to the selected model. By comparison, temperature had a weaker average effect (Figure 2). Nekton response to environmental and location factors varied markedly at species level (Figure 3). Overall, biomass of most of the species showed a clear response to the variables investigated, with only A. boyeri and K. panizzae exhibiting weak relationships with water temperature, salinity and site location compared to the other species. The marginal effect of temperature (i.e., with seasonal factor already taken into account) was positive for biomass of most of the species, while both salinity and location showed variable effects. In particular, salinity was negatively associated to biomass of C. ramada, C. saliens, P. canestrinii and P. elegans, and positively to biomass of A. fasciatus and P. marmoratus. The effect of sites located within saltmarsh creeks, as opposed to exposed saltmarsh edges, was positive for most of the species, with only C. crangon, P. flesus and P. marmoratus showing a negative relationship with creeks.

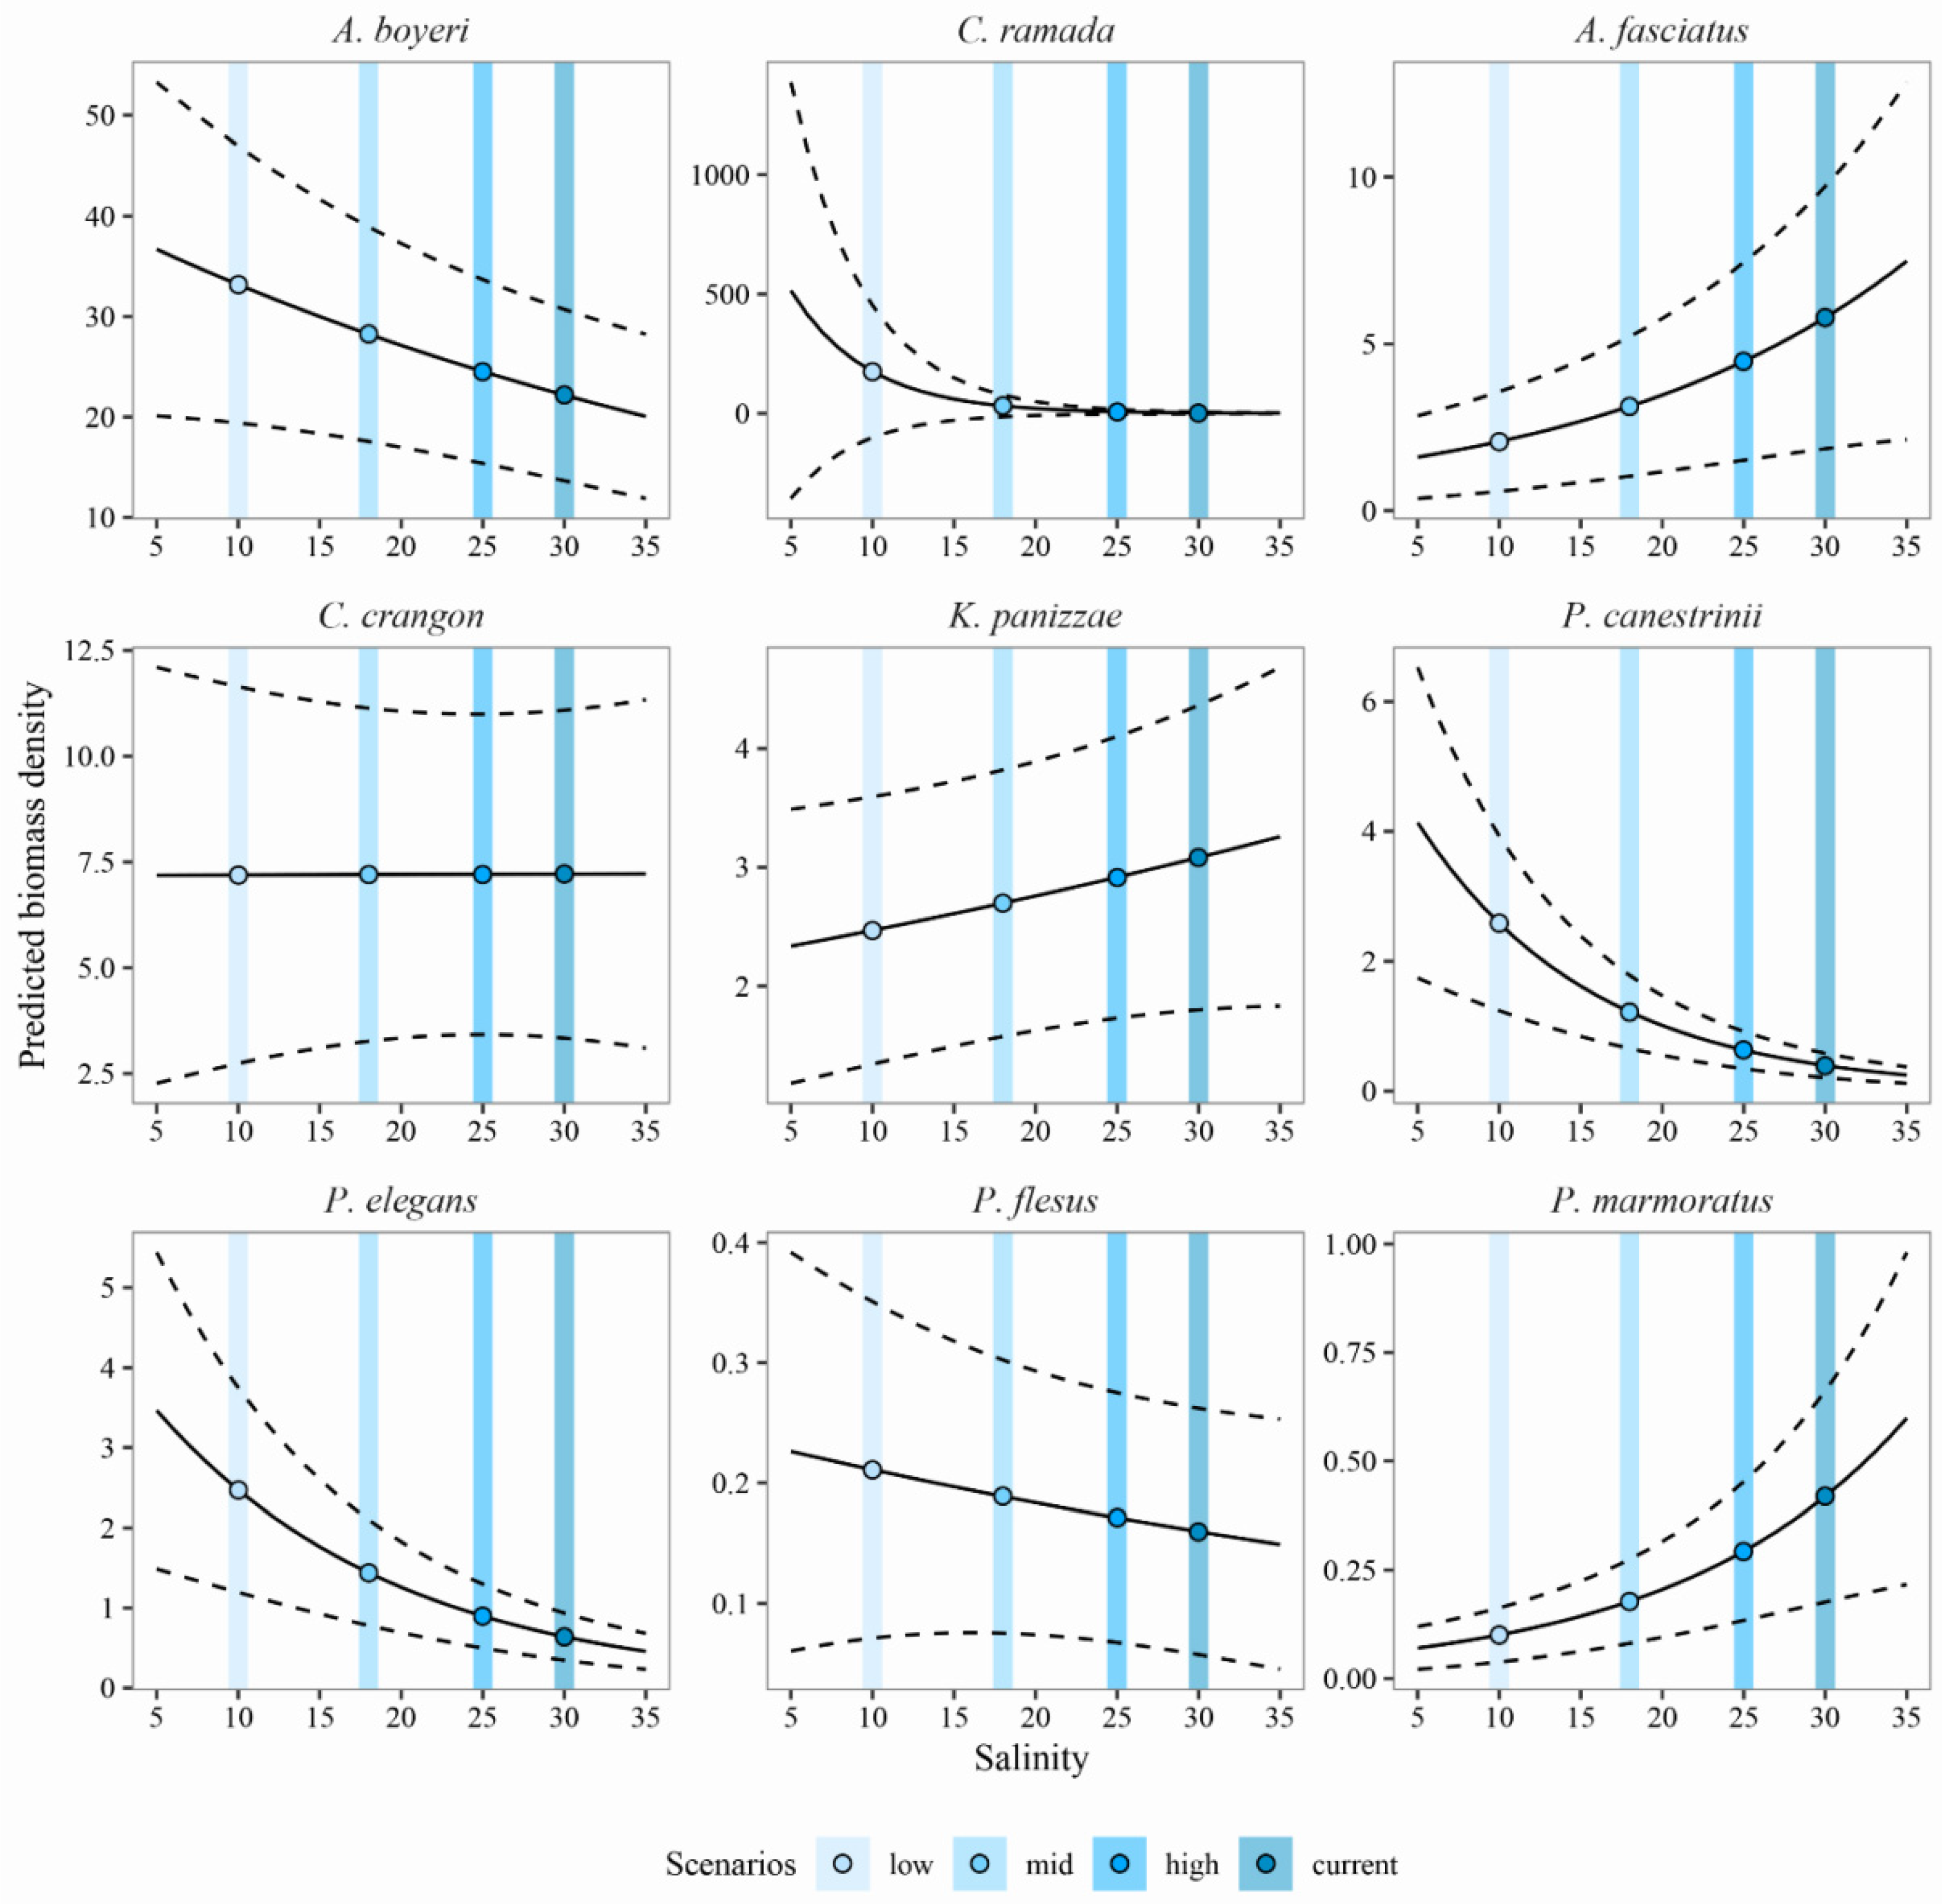
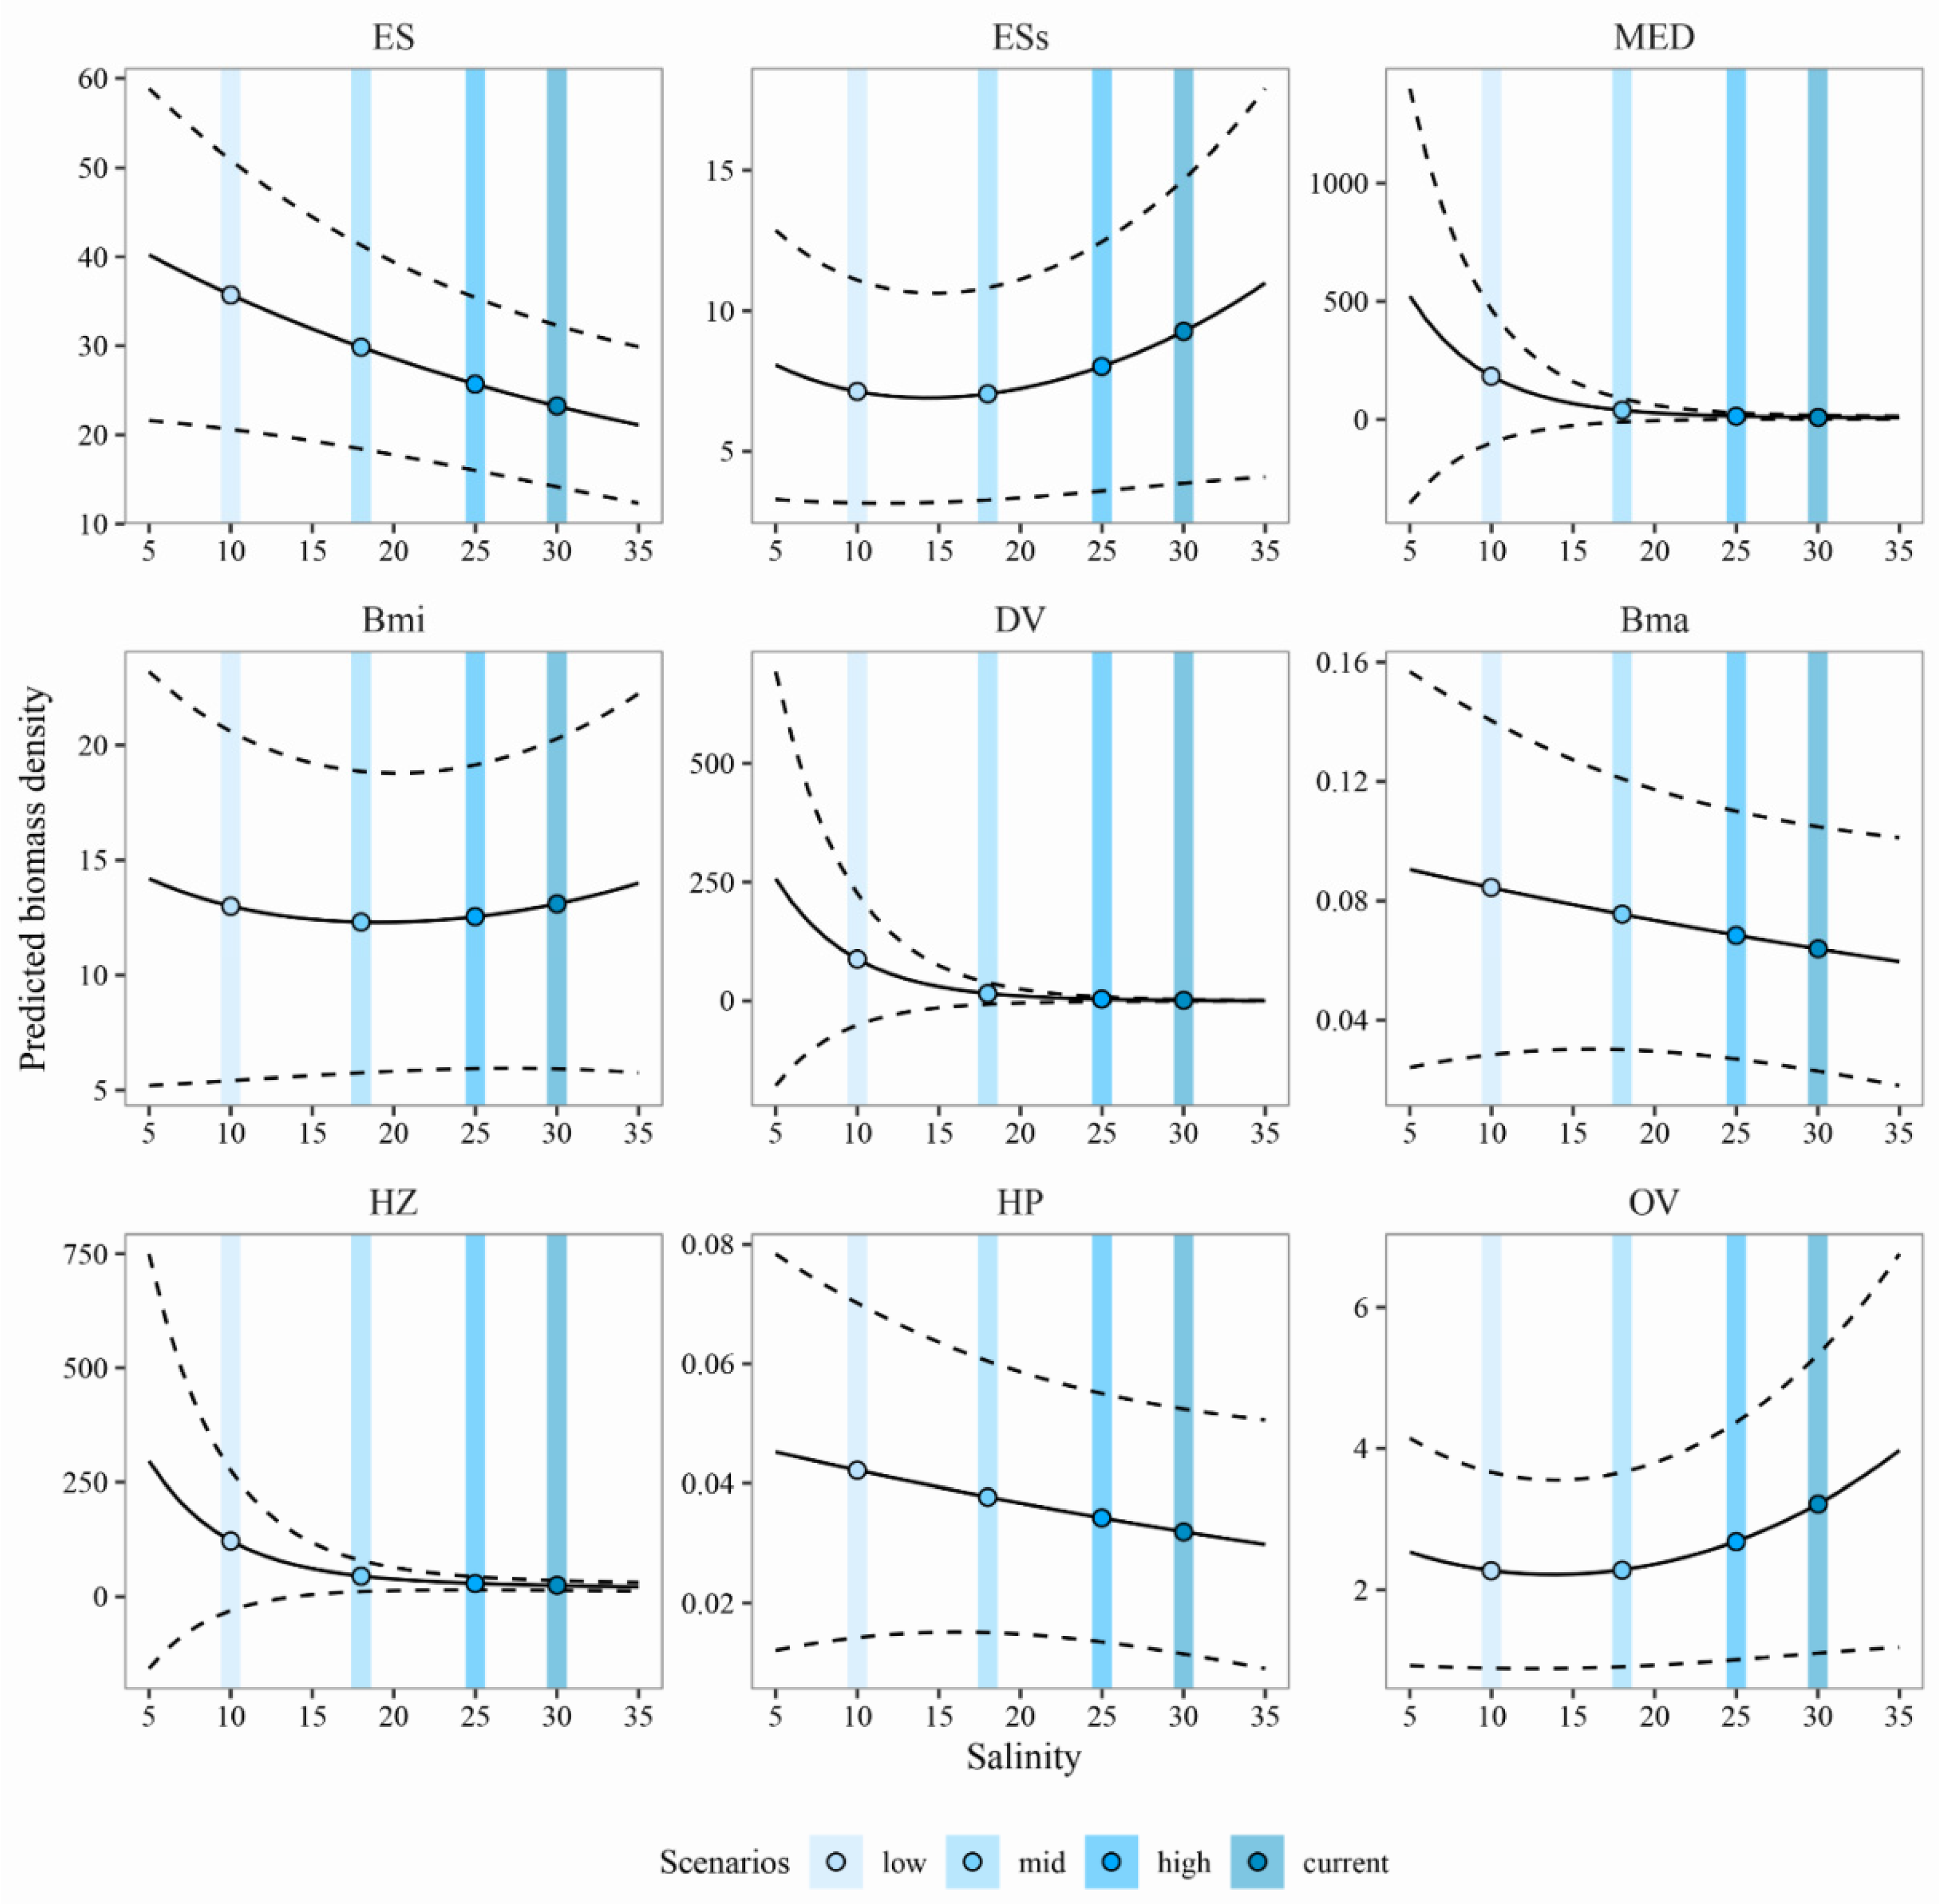
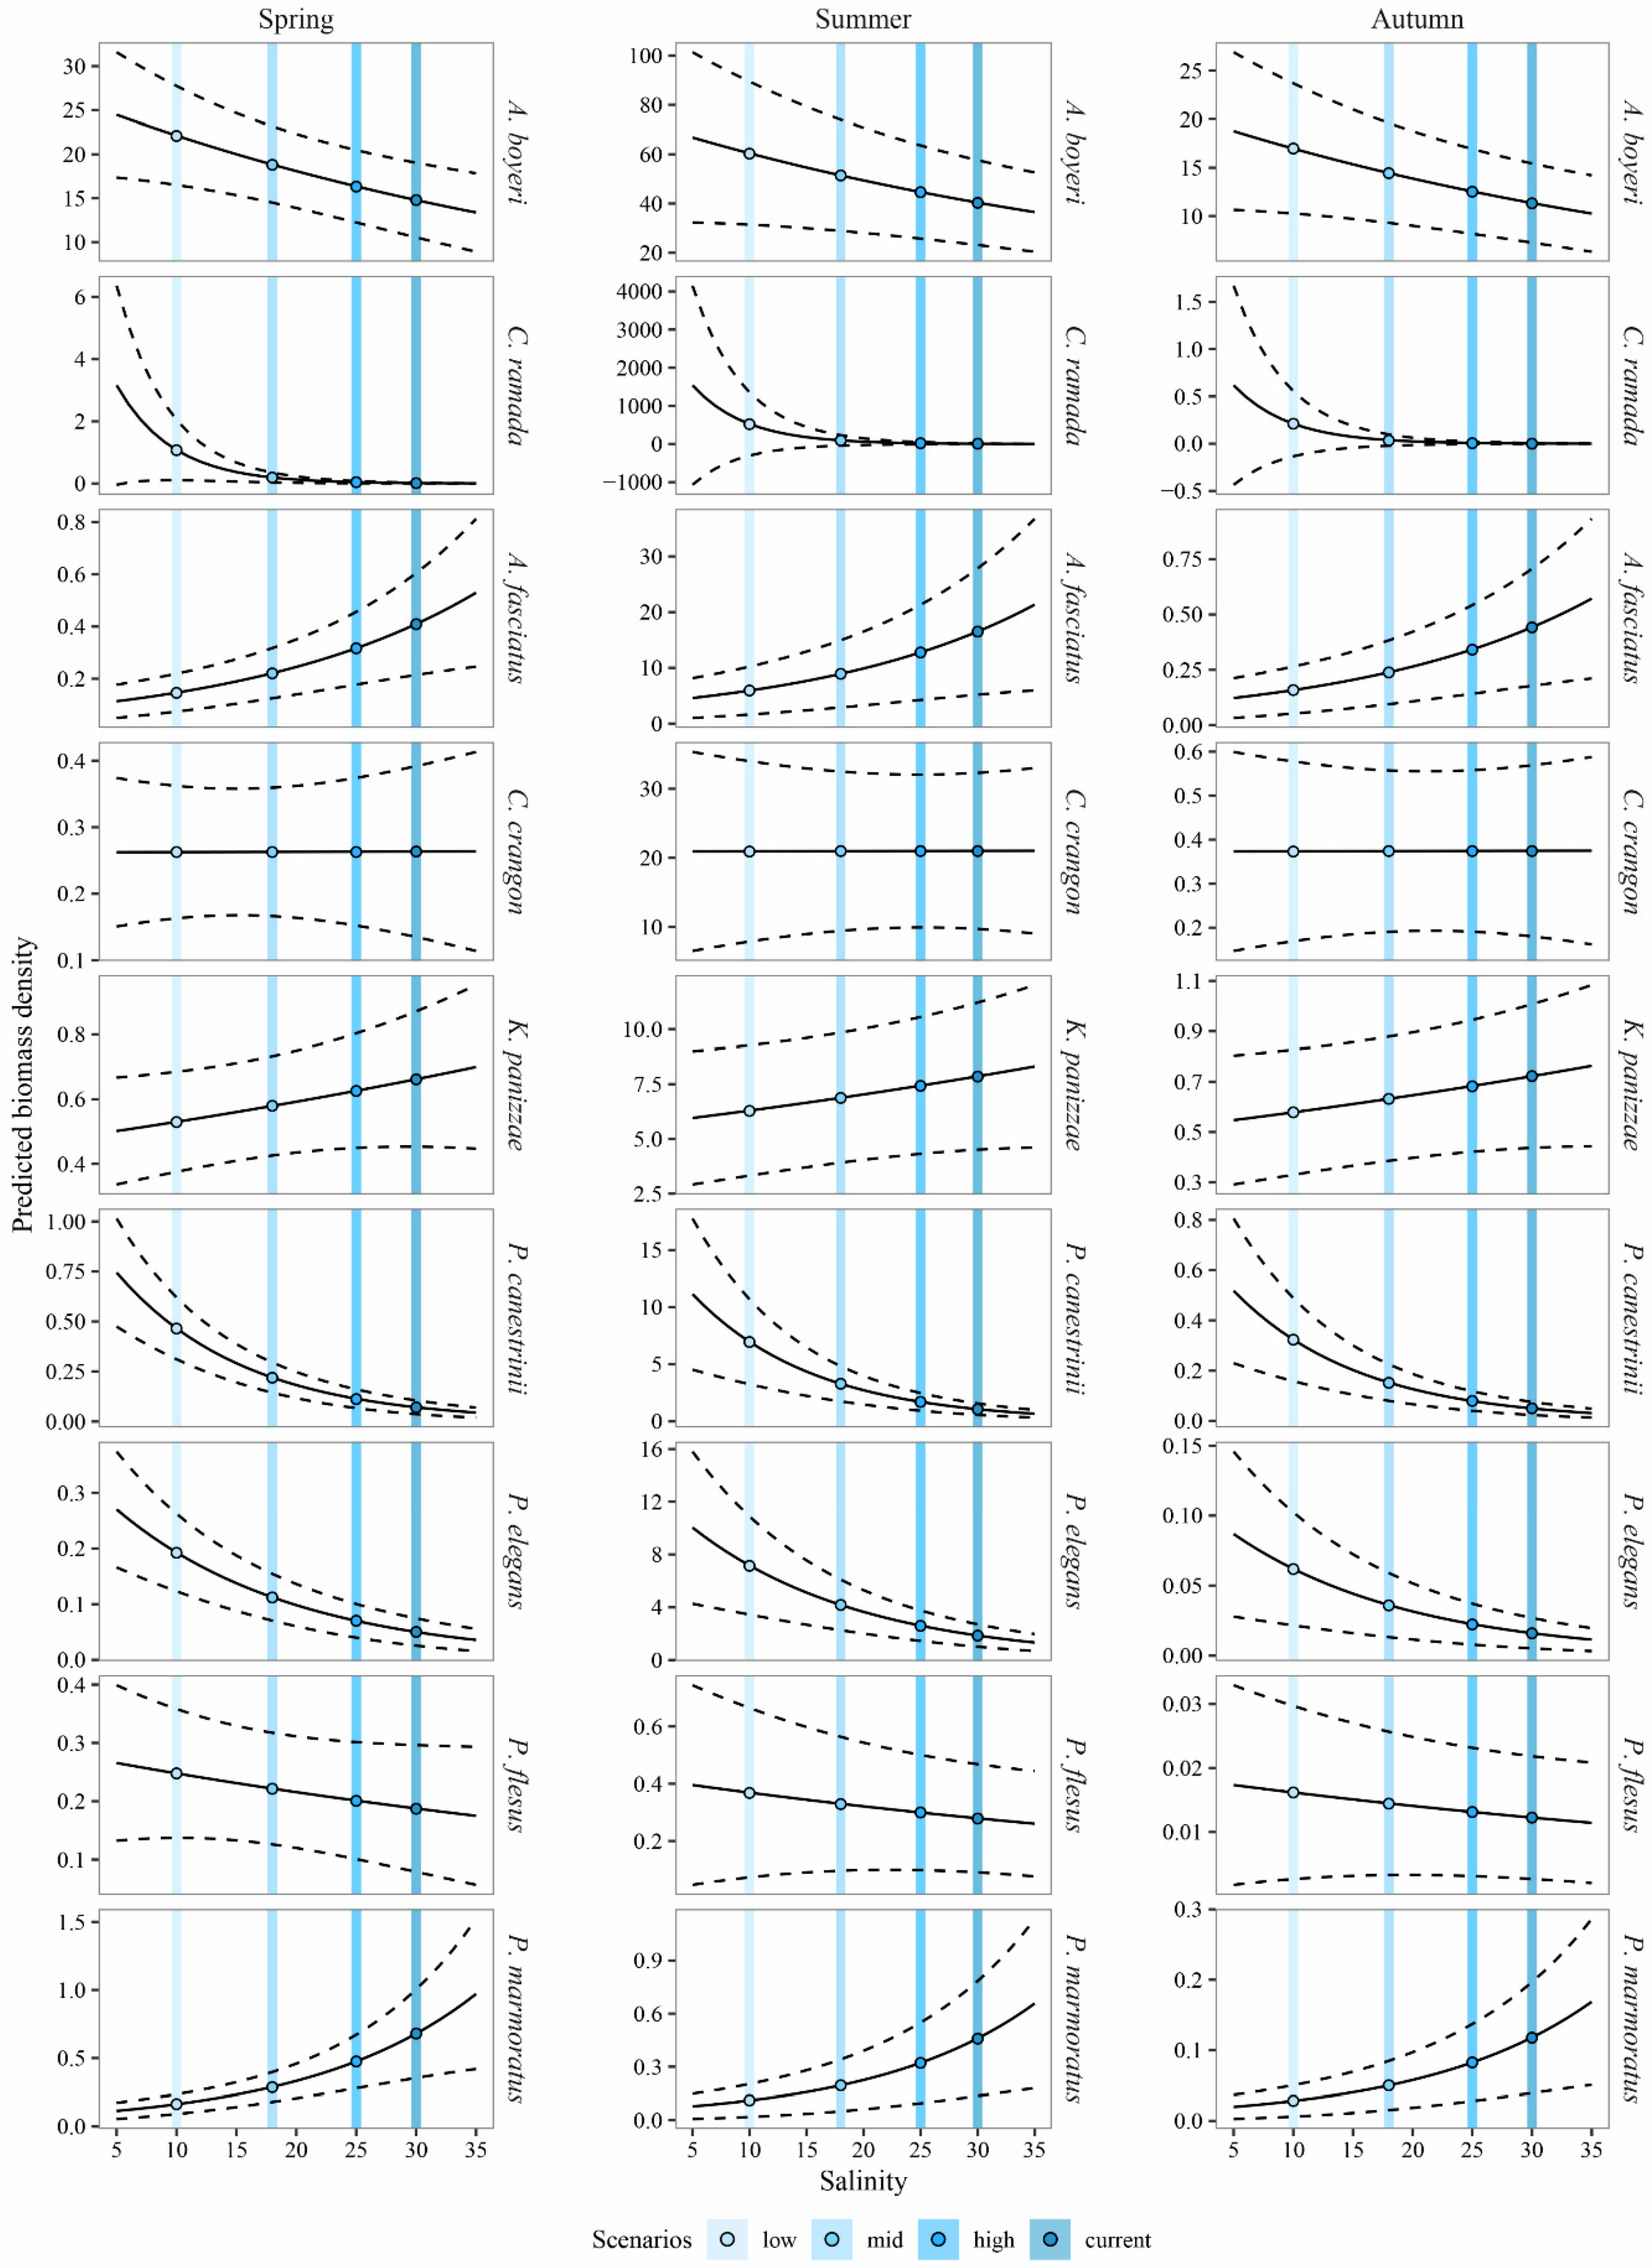
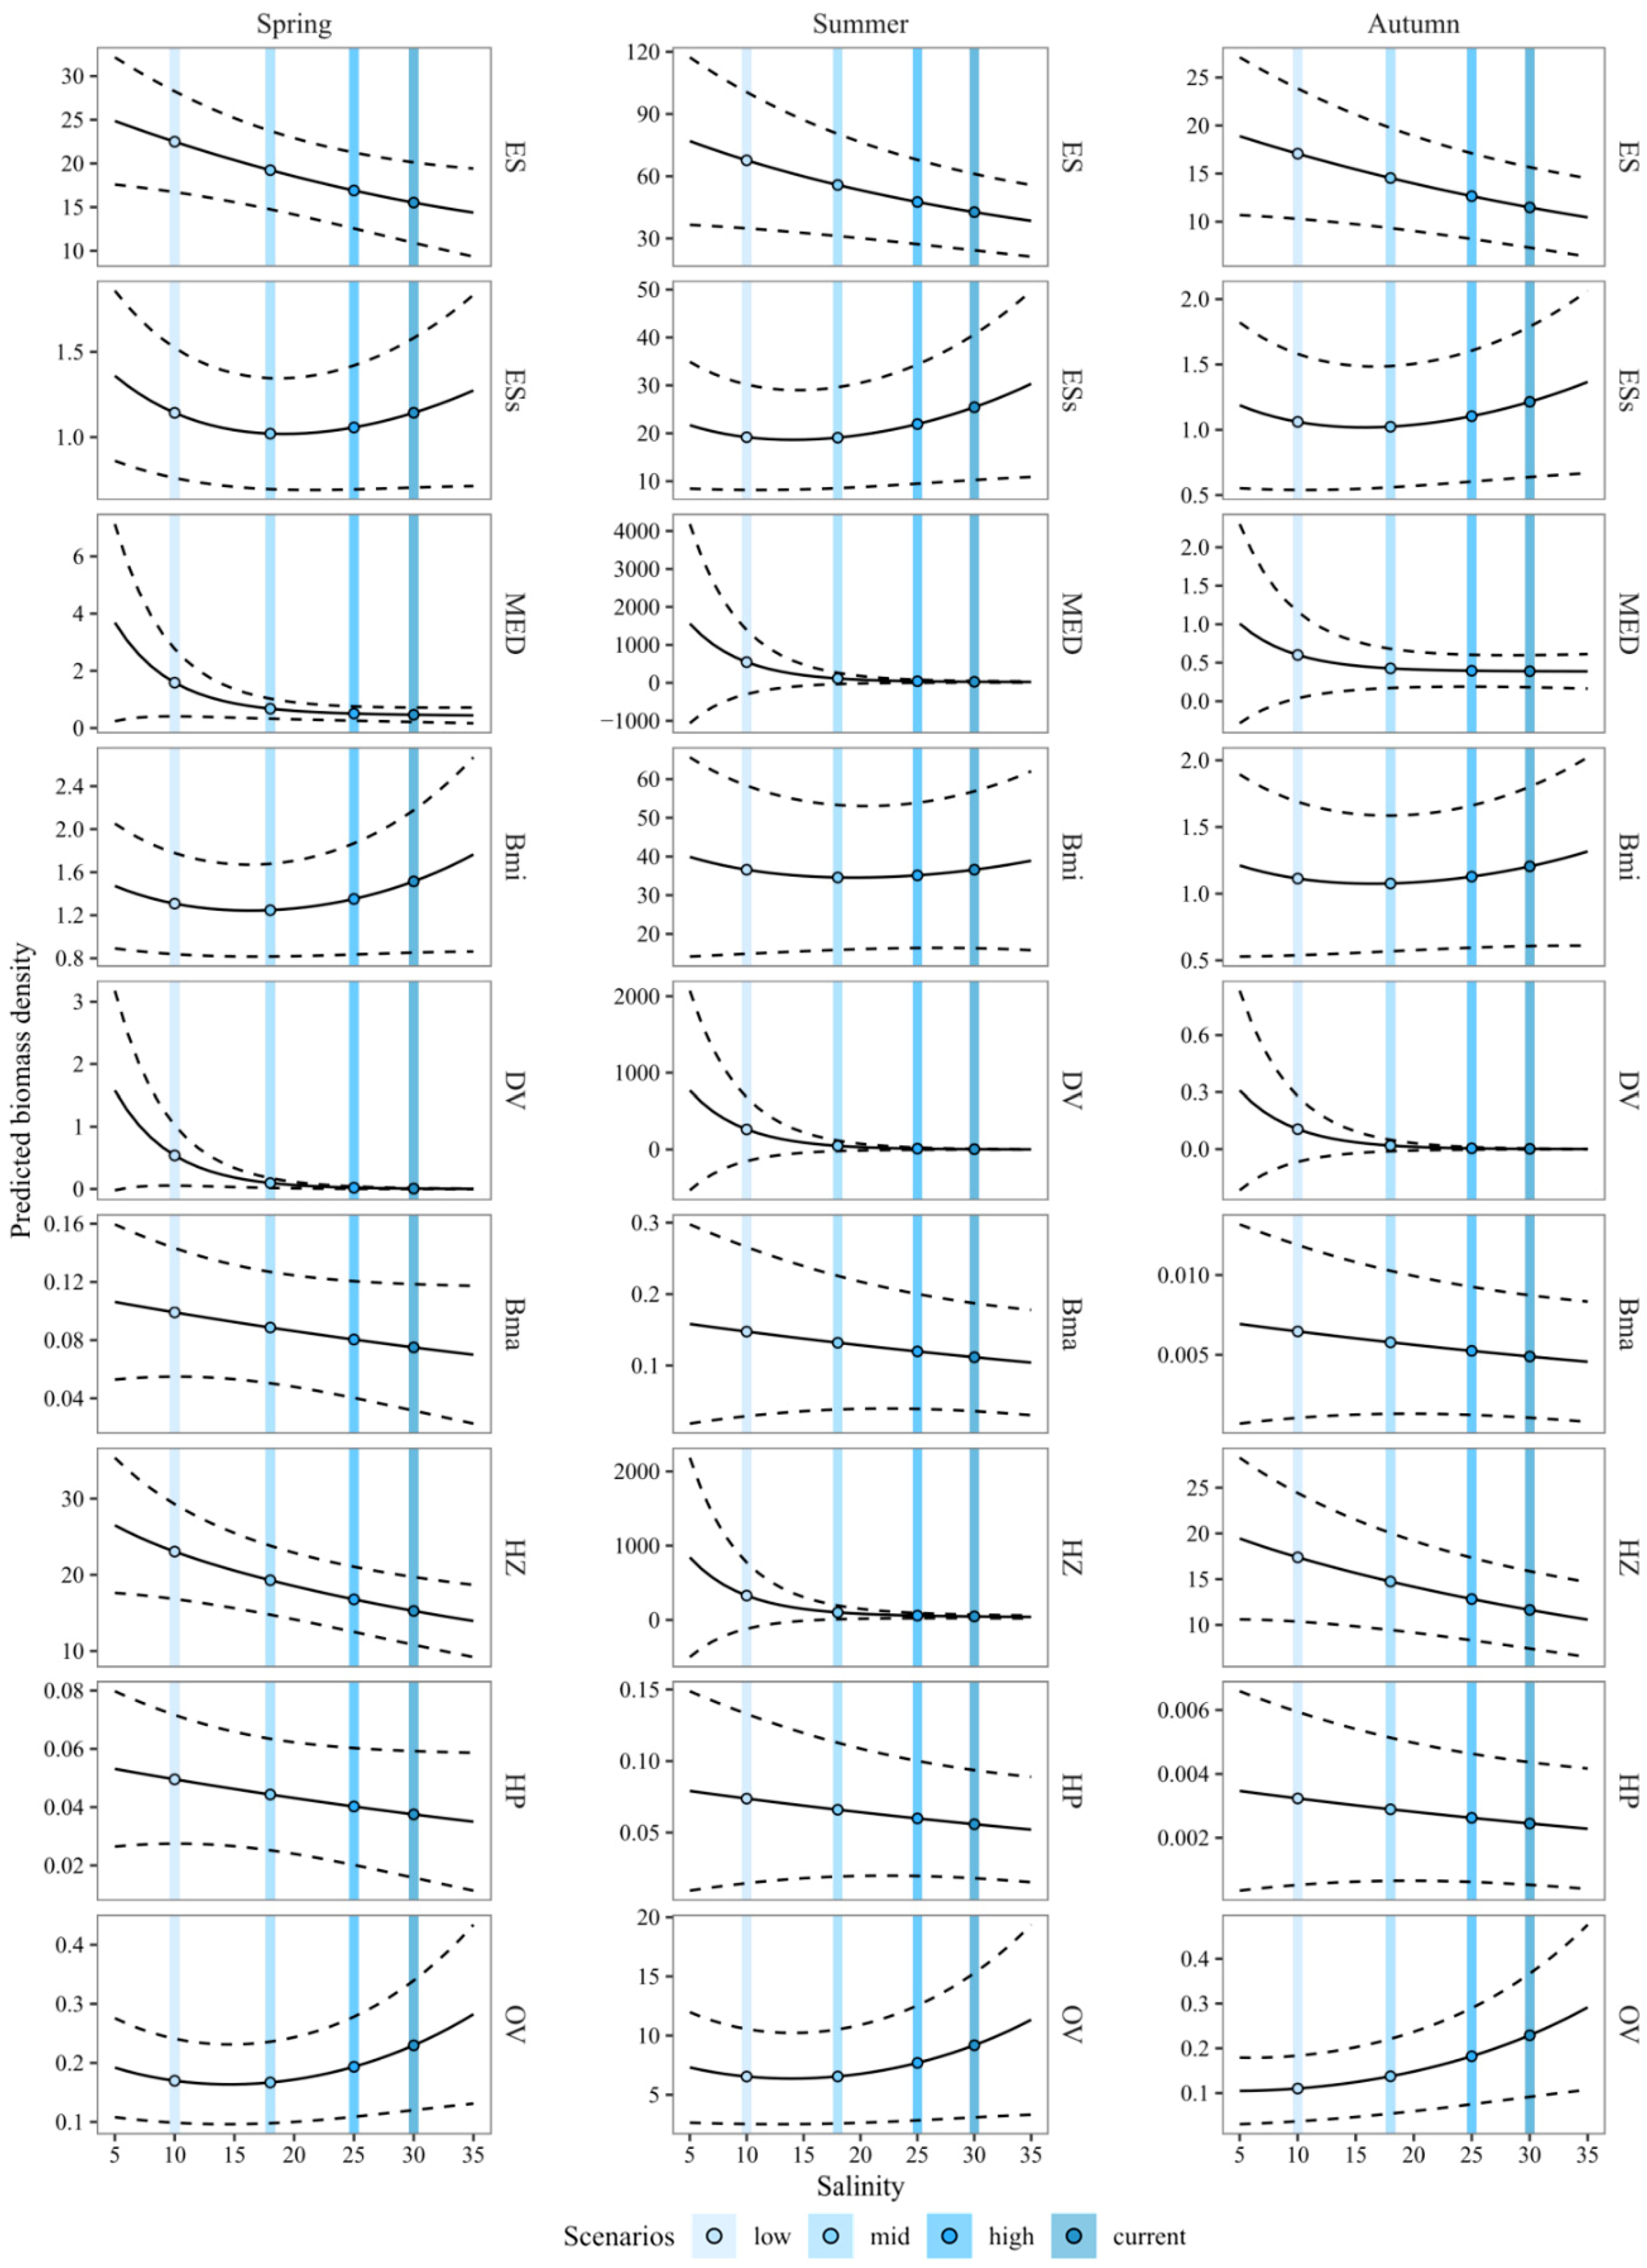
3.3. Predicting the Expected Assemblages

Model predictions applied to the selected scenarios of salinity reduction showed that the whole nekton assemblage (calculated as the cumulative biomass of species included in the analysis) would markedly respond to salinity variations, showing a progressive increase in biomass from the current to the low-salinity scenario. The predicted increase in biomass would occur similarly in all the seasons investigated, although this appears to be stronger and associated to a lower uncertainty in spring (Figure 4). Despite the overall trend observed in whole assemblage, some major differences could be found in the response at the species level (Figure 5). Only minor variations of species response among seasons were detected (see Figure A2 in Appendix B), hence average values were shown (Figure 5). Most of the species investigated showed an increase in biomass with decreasing salinity, including A. boyeri, C. ramada, P. canestrinii, P. elegans and P. flesus. Among them, P. canestrinii and P. elegans were associated to the most marked increase in biomass. In turn, A. fasciatus, K. panizzae and P. marmoratus exhibited an opposite pattern, with higher biomass densities under the current conditions and progressively lower values under reduced salinity scenarios. C. crangon did not show any relevant response to salinity.
Aggregating species biomasses in ecological and trophic guilds highlighted the potential changes in assemblage functional attributes after the restoration (Figure 6). On the whole, biomass of estuarine resident and marine estuarine-dependent species are expected to increase accordingly with the decrease in salinity, although the latter guild showed a marked increase only under the low-salinity scenario. In contrast, solely estuarine residents exhibited a pattern of decrease from the current conditions to mid and low-salinity scenarios. In terms of trophic structure of the nekton assemblage, salinity reduction would drive an increase in biomass of detritivorous, macrobenthivorous, hyperbenthivorous-zooplanctivorous and hyperbentivorous-piscivorous species (Figure 6). Guild response did not exhibit major variations among seasons (see Figure A3 in Appendix B), hence the average values were shown (Figure 6).

4. Discussion

4.1. Predicting the Expected Nekton Changes after Salinity Reduction

This study developed a model to predict the expected shifts in nekton assemblage resulting from the restoration of a freshwater input in an inner portion of the Venice lagoon, taking into account temporal, geographic, environmental and habitat variability found along natural salinity gradients in the basin. The model calibration phase revealed a significant influence of the sampling season and year on overall assemblage and species biomass, confirming the high variability of temporal dynamics in nekton communities in the Venice lagoon [41,67,70,80]. Reproduction, recruitment and migrations are among the major factors causing seasonal variations in community structure in transitional water ecosystems [69,81]. In addition, seasonal patterns may show marked differences among years due to interannual changes in weather, abiotic conditions and trophic status [80,82,83]. Among the physico-chemical and habitat factors taken into account in the present analysis, only three variables significantly affected biomass of the nekton assemblage as a whole, namely water temperature, water salinity and habitat location within the saltmarsh. This confirms previous observations made on fish communities in the Venice lagoon [67,84,85] and in other Mediterranean transitional water ecosystems [8,82]. As many studies previously pointed out, nekton response to physico-chemical and habitat variables would probably be more complex, and show a significant influence of additional factors (e.g., type of substratum, trophic conditions, tidal cycles and weather) at the species level [80,83,86,87,88,89]. Exploring all the factors driving nekton changes at the species level was, however, beyond the scope of this work.
The primary effect on nekton fauna of reducing salinity in the lagoon area investigated would be an overall increase in total assemblage biomass compared to the current conditions, mostly due to the increase in biomass of five species. Among them, the solely resident Pomatoschistus canestrinii and the marine estuarine-dependent Platichthys flesus and Chelon ramada are known to prefer low-salinity, saltmarsh-dominated areas in the inner portions of the Venice lagoon, which they use as recruitment and feeding grounds and, for P. canestrinii, as elective reproductive habitats [80,87,90]. Also the estuarine residents Atherina boyeri and Palaemon elegans, widespread species that can tolerate a wide range of salinity levels in transitional water habitats [7,69], contributed to the expected increase in nekton biomass. The positive response to salinity decrease shown by these species could be related to broader changes in the restoration area, including an increase in trophic status. In the Venice lagoon, trophic levels indeed show marked changes along the salinity gradients, with higher nutrient and chlorophyll concentrations recorded in the more confined portions of the basin [91,92]. Common estuarine species, integrating complex ecological processes such as trophic interactions in transitional water ecosystems, could therefore play a key role as indicators of such changes in the inner areas of the lagoon [41,93,94,95].
This work emphasises the importance of adopting a functional perspective when employing predictive models in restoration ecology. Species traits, or a functional classification like the guild approach, could provide a better understanding of the processes involved in community colonisation of restored habitats and in overall ecosystem functioning [35,96]. The expected nekton response at the functional level further supports the hypothesis that the restoration of a salinity gradient in the Venice lagoon may cause relevant changes to the food web of the area, with biomass of hyperbenthivores-zooplanctivores, hyperbenthivores-piscivores and detritivores benefiting from the decrease in salinity. The newly-created freshwater input could have a major influence on distribution and community structure of hyperbenthic and planktonic prey due to the salinity decrease, as pointed out by Das et al. [28]. More generally, the nutrient loads from the drainage basin, although buffered by the restoration of vegetation, could enhance the productivity of the system, hence the overall availability of food items for nekton species in the area [8,67,97]. Future studies following the restoration of the salinity gradient should therefore take into account the potential changes in trophic status, which could explain a significant portion of variability in functional structure of nekton assemblages in the area.
The model’s accuracy proved to be good in predicting the assemblage as a whole, as cross-validation highlighted. While predictive performances varied markedly among species, most of them were predicted with high accuracy, and could then be included in the set of species to be predicted in the second phase of the work. In particular, this approach identifies a pool of species that best explains the expected assemblage shifts under changing environmental conditions. Overall, the ecological and trophic structure of such assemblage largely corresponds to the typical nekton community composition found in the inner areas of the Venice lagoon and other Mediterranean transitional water ecosystems [11,69,90,98].
As Scapin et al. [36] highlighted, the methodology presented in this work may serve to develop concise tools guiding the management and conservation of biodiversity and ecosystem functions. In a perspective of reinstatement of a salinity gradient in the Venice lagoon, for instance, predicting the expected outcomes in terms of nekton structure and comparing them to the observed conditions after the restoration will provide a mean to quantitatively estimate the degree of restoration success. Applying the same protocol in a suitable time frame will also allow the tracking of restoration trajectories towards the endpoint conditions [36]. Similarly, the present approach may also be employed in the framework of WFD, to evaluate the efficacy of management responses aiming to enhance the ecological status of hydrologically impaired transitional water bodies.

4.2. Implications for Management and Conservation

The present analysis highlighted that restoring the salinity gradient could have major implications for management and conservation of the inner Venice lagoon. Most of the tools developed for the evaluation of ecological status of fish in transitional waters under the WFD, including the one employed in Italian transitional waters, incorporate metrics calculated on assemblage structure and composition, often based on functional guilds [79,99,100,101,102]. Given the expected increase in whole assemblage biomass and the shift in taxonomical and trophic structure, significant changes in the ecological status of fish may therefore occur after the restoration. As a result, nekton surveys in the area following the reinstatement of the freshwater input will be of critical importance, in order to measure the actual effect of creating a salinity gradient on the ecological status.
While restoration could benefit the overall ecological status of fish fauna, the consequences on species conservation may vary. The salinity decrease would contribute to creating suitable environmental conditions, particularly in areas characterised by lower salinity levels, for Pomatoschistus canestrinii, an endemic species of northern Adriatic coastal lagoons listed in the Annex II of the Habitats Directive. One of the major threats for this species is indeed the loss of estuarine and brackish habitats [80,103]. Other species protected at the European level, namely Aphanius fasciatus and Knipowitschia panizzae, could in turn be limited to areas that are less influenced by the salinity gradient, or gather in habitats different from saltmarsh edges, such as creeks. Small saltmarsh channels are often preferred by small estuarine resident species, by providing better shelter and higher food availability [80,90]. Overall, this emphasises the importance of preserving habitat diversity, even in a scenario of beneficial restoration, as already pointed out for the Venice lagoon by Cavraro et al. [90] and Scapin et al. [36,70].
The results of this work also indicate a positive influence of restoring a salinity gradient on the recruitment of Chelon ramada and Platichthys flesus, which exploit transitional water habitats during juvenile stages and represent important resources for local fisheries [41,87,104,105,106,107,108,109]. Transitional water ecosystems play a central role in supporting the populations of many marine migrant species of commercial value. Multiple environmental and geographical factors contribute to sustain this function, including water turbidity and sediment characteristics, trophic status and prey availability as well as the availability of structured habitats such as saltmarshes, and the degree of habitat connectivity [3,110,111,112]. In this light, salinity may not be the only factor regulating the entrance and growth of marine migrant juveniles in the Venice lagoon shallow waters and, while the restoration could contribute to support juveniles of C. ramada and P. flesus, the overall nursery role of the area should be evaluated by future ad hoc studies.
Transitional water habitats rely on the delicate balance between sediment accretion and erosion, as well as on quality and availability of freshwater inputs. The consequences of climate change could therefore pose additional threats to their survival and quality in the next decades. For instance, the expected sea level rise would result in the loss of major intertidal and subtidal shallow water areas in northern Adriatic coastal lagoons due to erosion and submergence in this century [49,58,113]. Moreover, relevant alterations in temperature and precipitation patterns all over the world are already affecting river flows and overall freshwater availability [114]. In the Venice lagoon, climate change could lead to longer periods of high salinity levels and more marine-like conditions due to more severe drought episodes, resulting in further loss of transitional water features in the inner portions of the basin [115]. Restoration schemes aiming at enhancing the riverine influence on the inner lagoon, such as the Lagoon ReFresh project, may therefore represent a viable way to mitigate the negative effects of climate change on transitional water ecosystems, in particular by preserving suitable environmental conditions for nekton assemblages.

Author Contributions

Conceptualization, L.S. and P.F.; methodology, L.S., M.Z. and A.F.; validation, L.S., M.Z. and P.F.; formal analysis, L.S. and M.Z.; investigation, L.S., P.F.; resources, P.F.; writing—original draft preparation, L.S.; writing—review and editing, All the authors; visualization, L.S. and M.Z.; supervision, P.F. and A.S.; project administration, A.B. and R.B.B.; funding acquisition, A.B., R.B.B. and A.S.

Funding

This research was funded by European Union’s LIFE+ financial instrument (grant LIFE16 NAT/IT/000663—LIFE LAGOON REFRESH, which contributes to the environmental recovery of a Natura 2000 site, SIC IT3250031—Northern Venice Lagoon). Field data used in this study were collected under various projects funded by the Italian Ministry of Education, Universities and Research (PRIN grant 2009W2395), by Corila (Consorzio Ricerche Lagunari) and by European Union’s LIFE+ financial instrument (grant LIFE12 NAT/IT/000331).

Conflicts of Interest

The authors declare no conflicts of interest.

Appendix A

Figure A1. Project area of LIFE Lagoon ReFresh in the northern Venice Lagoon. Current state of salinity condition (small panel, bottom) and expected state after the creation of a freshwater input from the Sile river (low tide conditions). The freshwater inflow and morphological interventions are also represented. The diffusion of freshwater during low tide condition was obtained from numerical simulation [61].
Water 11 01354 g0a1

Appendix B

Figure A2. Species biomass (g 100 m−2) predicted along the salinity gradient for each season investigated. The current salinity and the three scenarios of salinity reduction are highlighted. Dashed lines indicate the standard error of the prediction.
Water 11 01354 g0a2
Figure A3. Guild biomass (g 100 m−2) predicted along the salinity gradient for each season investigated. The current salinity and the three scenarios of salinity reduction are highlighted. Dashed lines indicate the standard error of the prediction. Guilds are abbreviated as follows. ES: estuarine resident species; ESs: solely estuarine resident species; MED: marine estuarine-dependent species; Bmi: microbenthivores; DV: detritivores; Bma: macrobenthivores; HZ: hyperbenthivores-zooplanctivores; HP: hyperbenthivores-piscivores; OV: omnivores.
Water 11 01354 g0a3

References

  1. McLusky, D.S.; Elliott, M. The Estuarine Ecosystem: Ecology, Threats and Management, 3rd ed.; Oxford University Press: Oxford, UK, 2004. [Google Scholar]
  2. Sheaves, M. Consequences of ecological connectivity: The coastal ecosystem mosaic. Mar. Ecol. Prog. Ser. 2009, 391, 107–115. [Google Scholar] [CrossRef]
  3. Elliott, M.; Hemingway, K.L. Fishes in Estuaries; Blackwell Science: Oxford, UK, 2002. [Google Scholar]
  4. Kneib, R.T. Salt marsh ecoscapes and production transfers by estuarine nekton in the Southeastern United States. In Concepts and Controversies in Tidal Marsh Ecology; Weinstein, M.P., Kreeger, D.A., Eds.; Springer: Dordrecht, The Netherlands, 2000. [Google Scholar]
  5. Pérez-Ruzafa, A.; Marcos, C.; Pérez-Ruzafa, I.M. Mediterranean coastal lagoons in an ecosystem and aquatic resources management context. Phys. Chem. Earth 2011, 36, 160–166. [Google Scholar] [CrossRef]
  6. Smyth, K.; Elliott, M. Effects of changing salinity on the ecology of the marine environment. In Stressors in the Marine Environment; Solan, M., Witheley, N., Eds.; Oxford University Press: Oxford, UK, 2016; pp. 161–174. [Google Scholar]
  7. Rodríguez-Climent, S.; Caiola, N.; Ibáñez, C. Salinity as the main factor structuring small-bodied fish assemblages in hydrologically altered Mediterranean coastal lagoons. Sci. Mar. 2013, 77, 37–45. [Google Scholar] [Green Version]
  8. Prado, P.; Vergara, C.; Caiola, N.; Ibáñez, C. Influence of salinity regime on the food-web structure and feeding ecology of fish species from Mediterranean coastal lagoons. Estuar. Coast. Shelf Sci. 2014, 139, 1–10. [Google Scholar] [CrossRef]
  9. Martino, E.J.; Able, K.W. Fish assemblages across the marine to low salinity transition zone of a temperate estuary. Estuar. Coast. Shelf Sci. 2003, 56, 969–987. [Google Scholar] [CrossRef]
  10. Harrison, T.D.; Whitfield, A.K. Temperature and salinity as primary determinants influencing the biogeography of fishes in South African estuaries. Estuar. Coast. Shelf Sci. 2006, 66, 335–345. [Google Scholar] [CrossRef]
  11. Franco, A.; Franzoi, P.; Torricelli, P. Structure and functioning of Mediterranean lagoon fish assemblages: A key for the identification of water body types. Estuar. Coast. Shelf Sci. 2008, 79, 549–558. [Google Scholar] [CrossRef]
  12. Marchand, J.; Codling, I.; Drake, P.; Elliott, M.; Pihl, L.; Rebelo, J. Environmental quality of estuaries. In Fishes in Estuaries; Elliott, M., Hemingway, K.L., Eds.; Blackwell Publishing Ltd.: Hoboken, NJ, USA, 2002; pp. 322–409. [Google Scholar]
  13. Vasconcelos, R.P.; Reis-Santos, P.; Fonseca, V.; Maia, A.; Ruano, M.; França, S.; Vinagre, C.; Costa, M.J.; Cabral, H. Assessing anthropogenic pressures on estuarine fish nurseries along the Portuguese coast: A multi-metric index and conceptual approach. Sci. Total Environ. 2007, 374, 199–215. [Google Scholar] [CrossRef]
  14. Perring, M.P.; Standish, R.J.; Price, J.N.; Craig, M.D.; Erickson, T.E.; Ruthrof, K.X.; Whiteley, A.S.; Valentine, L.E.; Hobbs, R.J. Advances in restoration ecology: Rising to the challenges of the coming decades. Ecosphere 2015, 6, 1–25. [Google Scholar] [CrossRef]
  15. Teichert, N.; Borja, A.; Chust, G.; Uriarte, A.; Lepage, M. Restoring fish ecological quality in estuaries: Implication of interactive and cumulative effects among anthropogenic stressors. Sci. Total Environ. 2016, 542, 383–393. [Google Scholar] [CrossRef]
  16. Borja, A.; Dauer, D.M.; Elliott, M.; Simenstad, C.A. Medium-and long-term recovery of estuarine and coastal ecosystems: Patterns, rates and restoration effectiveness. Estuar. Coasts 2010, 33, 1249–1260. [Google Scholar] [CrossRef]
  17. Van Katwijk, M.M.; Thorhaug, A.; Marbà, N.; Orth, R.J.; Duarte, C.M.; Kendrick, G.A.; Althuizen, I.H.J.; Balestri, E.; Bernard, G.; Cambridge, M.L.; et al. Global analysis of seagrass restoration: The importance of large-scale planting. J. Appl. Ecol. 2015, 53, 567–578. [Google Scholar] [CrossRef]
  18. Society for Ecological Restoration. Tidal Marsh Restoration. A Synthesis of Science and Management; Roman, C.T., Burdick, D.M., Eds.; Island Press: Washington, DC, USA, 2012; ISBN 9781597265768. [Google Scholar]
  19. Farrugia, T.J.; Espinoza, M.; Lowe, C.G. The fish community of a newly restored southern California estuary: Ecological perspective 3 years after restoration. Environ. Biol. Fishes 2014, 97, 1129–1147. [Google Scholar] [CrossRef]
  20. Castro, N.; Félix, P.M.; Neto, J.; Cabral, H.; Marques, J.C.; Costa, M.J.; Costa, J. Fish communities’ response to implementation of restoring measures in a highly artificialized estuary. Ecol. Indic. 2016, 67, 743–752. [Google Scholar] [CrossRef]
  21. Reese, M.M.; Stunz, G.W.; Bushon, A.M. Recruitment of estuarine-dependent nekton through a new tidal inlet: The opening of Packery Channel in Corpus Christi, TX, USA. Estuar. Coasts 2008, 31, 1143–1157. [Google Scholar] [CrossRef]
  22. Facca, C.; Bonometto, A.; Boscolo, R.; Buosi, A.; Parravicini, M.; Siega, A.; Volpe, V.; Sfriso, A. Coastal lagoon recovery by seagrass restoration. A new strategic approach to meet HD & WFD objectives. In Proceedings of the 9th European Conference on Ecological Restoration, Oulu, Finland, 3–8 August 2014. [Google Scholar]
  23. Simenstad, C.; Reed, D.; Ford, M. When is restoration not? Ecol. Eng. 2006, 26, 27–39. [Google Scholar] [CrossRef]
  24. Elliott, M.; Burdon, D.; Hemingway, K.L.; Apitz, S.E. Estuarine, coastal and marine ecosystem restoration: Confusing management and science—A revision of concepts. Estuar. Coast. Shelf Sci. 2007, 74, 349–366. [Google Scholar] [CrossRef]
  25. Saunders, K.M.; Mcminn, A.; Roberts, D.; Hodgson, D.A.; Heijnis, H. Recent human-induced salinity changes in Ramsar-listed Orielton Lagoon, south-east Tasmania, Australia: A new approach for coastal lagoon conservation and management. Aquat. Conserv. Mar. Freshw. Ecosyst. 2007, 17, 51–70. [Google Scholar] [CrossRef]
  26. Mohapatra, A.; Mohanty, R.K.; Mohanty, S.K.; Bhatta, K.S.; Das, N.R. Fisheries enhancement and biodiversity assessment of fish, prawn and mud crab in Chilika lagoon through hydrological intervention. Wetl. Ecol. Manag. 2007, 15, 229–251. [Google Scholar] [CrossRef]
  27. Twilley, R.R.; Rivera-Monroy, V.H.; Chen, R.; Botero, L. Adapting an ecological mangrove model to simulate trajectories in restoration ecology. Mar. Pollut. Bull. 1998, 37, 404–419. [Google Scholar] [CrossRef]
  28. Das, A.; Justic, D.; Inoue, M.; Hoda, A.; Huang, H.; Park, D. Impacts of Mississippi River diversions on salinity gradients in a deltaic Louisiana estuary: Ecological and management implications. Estuar. Coast. Shelf Sci. 2012, 111, 17–26. [Google Scholar] [CrossRef]
  29. Koutrakis, E.T.; Sylaios, G.; Kamidis, N.; Markou, D.; Sapounidis, A. Fish fauna recovery in a newly re-flooded Mediterranean coastal lagoon. Estuar. Coast. Shelf Sci. 2009, 83, 505–515. [Google Scholar] [CrossRef]
  30. Zedler, J.B.; Callaway, J.C. Evaluating the progress of engineered tidal wetlands. Ecol. Eng. 2000, 15, 211–225. [Google Scholar] [CrossRef]
  31. McAlpine, C.; Catterall, C.P.; Mac Nally, R.; Lindenmayer, D.; Reid, J.L.; Holl, K.D.; Bennett, A.F.; Runting, R.K.; Wilson, K.; Hobbs, R.J.; et al. Integrating plant- and animal- based perspectives for more effective restoration of biodiversity. Front. Ecol. Environ. 2016, 14, 37–45. [Google Scholar] [CrossRef]
  32. Bourque, A.S.; Fourqurean, J.W. Effects of common seagrass restoration methods on ecosystem structure in subtropical seagrass meadows. Mar. Environ. Res. 2014, 97, 67–78. [Google Scholar] [CrossRef] [PubMed]
  33. Dolbeth, M.; Cardoso, P.; Grilo, T.; Raffaelli, D.; Pardal, M.A. Drivers of estuarine benthic species distribution patterns following a restoration of a seagrass bed: A functional trait analyses. Mar. Pollut. Bull. 2013, 72, 47–54. [Google Scholar] [CrossRef] [PubMed]
  34. Fraser, L.H.; Harrower, W.L.; Garris, H.W.; Davidson, S.; Hebert, P.D.N.; Howie, R.; Moody, A.; Polster, D.; Schmitz, O.J.; Sinclair, A.R.E.; et al. A call for applying trophic structure in ecological restoration. Restor. Ecol. 2015, 23, 503–507. [Google Scholar] [CrossRef]
  35. Brudvig, L.A. Toward prediction in the restoration of biodiversity. J. Appl. Ecol. 2017, 54, 1013–1017. [Google Scholar] [CrossRef] [Green Version]
  36. Scapin, L.; Zucchetta, M.; Sfriso, A.; Franzoi, P. Predicting the response of nekton assemblages to seagrass transplantations in the Venice lagoon: An approach to assess ecological restoration. Aquat. Conserv. Mar. Freshw. Ecosyst. Mar. Freshw. Ecosyst. 2019, 26, 849–864. [Google Scholar] [CrossRef]
  37. Brudvig, L.A.; Barak, R.S.; Bauer, J.T.; Caughlin, T.T.; Laughlin, D.C.; Larios, L.; Matthews, J.W.; Stuble, K.L.; Turley, N.E.; Zirbel, C.R. Interpreting variation to advance predictive restoration science. J. Appl. Ecol. 2017, 54, 1018–1027. [Google Scholar] [CrossRef] [Green Version]
  38. Ebberts, B.D.; Zelinsky, B.D.; Karnezis, J.P.; Studebaker, C.A.; Lopez-Johnston, S.; Creason, A.M.; Krasnow, L.; Johnson, G.E.; Thom, R.M. Estuary ecosystem restoration: Implementing and institutionalizing adaptive management. Restor. Ecol. 2017, 26, 360–369. [Google Scholar] [CrossRef]
  39. Duarte, C.M.; Borja, A.; Carstensen, J.; Elliott, M.; Krause-Jensen, D.; Marbà, N. Paradigms in the recovery of estuarine and coastal ecosystems. Estuar. Coasts 2015, 38, 1202–1212. [Google Scholar] [CrossRef]
  40. Elliott, M.; Quintino, V. The Estuarine Quality Paradox, Environmental Homeostasis and the difficulty of detecting anthropogenic stress in naturally stressed areas. Mar. Pollut. Bull. 2007, 54, 640–645. [Google Scholar] [CrossRef] [PubMed]
  41. Zucchetta, M.; Scapin, L.; Cavraro, F.; Pranovi, F.; Franco, A.; Franzoi, P. Can the effects of anthropogenic pressures and environmental variability on nekton fauna be detected in fishery data? Insights from the monitoring of the artisanal fishery within the Venice lagoon. Estuar. Coasts 2016, 39, 1164–1182. [Google Scholar] [CrossRef]
  42. Pasquaud, S.; Courrat, A.; Fonseca, V.F.; Gamito, R.; Gonçalves, C.I.; Lobry, J.; Lepage, M.; Costa, M.J.; Cabral, H. Strength and time lag of relationships between human pressures and fish-based metrics used to assess ecological quality of estuarine systems. Estuar. Coast. Shelf Sci. 2013, 134, 119–127. [Google Scholar] [CrossRef]
  43. Fonseca, V.F.; Vasconcelos, R.P.; Gamito, R.; Pasquaud, S.; Gonçalves, C.I.; Costa, J.L.; Costa, M.J.; Cabral, H. Fish community-based measures of estuarine ecological quality and pressure–impact relationships. Estuar. Coast. Shelf Sci. 2013, 134, 128–137. [Google Scholar] [CrossRef]
  44. Franco, A.; Torricelli, P.; Franzoi, P. A habitat-specific fish-based approach to assess the ecological status of Mediterranean coastal lagoons. Mar. Pollut. Bull. 2009, 58, 1704–1717. [Google Scholar] [CrossRef] [PubMed]
  45. Milbrandt, E.C.; Bartleson, R.D.; Coen, L.D.; Rybak, O.; Thompson, M.A.; DeAngelo, J.A.; Stevens, P.W. Local and regional effects of reopening a tidal inlet on estuarine water quality, seagrass habitat, and fish assemblages. Cont. Shelf Res. 2012, 41, 1–16. [Google Scholar] [CrossRef]
  46. Able, K.W.; Grothues, T.M.; Hagan, S.M.; Kimball, M.E.; Nemerson, D.M.; Taghon, G.L. Long-term response of fishes and other fauna to restoration of former salt hay farms: Multiple measures of restoration success. Rev. Fish Biol. Fish. 2008, 18, 65–97. [Google Scholar] [CrossRef]
  47. Scapin, L.; Zucchetta, M.; Facca, C.; Sfriso, A.; Franzoi, P. Using fish assemblage to identify success criteria for seagrass habitat restoration. Web Ecol. 2016, 16, 33–36. [Google Scholar] [CrossRef] [Green Version]
  48. Boys, C.A.; Williams, R.J. Succession of fish and crustacean assemblages following reinstatement of tidal flow in a temperate coastal wetland. Ecol. Eng. 2012, 49, 221–232. [Google Scholar] [CrossRef]
  49. Carniello, L.; Defina, A.; D’Alpaos, L. Morphological evolution of the Venice lagoon: Evidence from the past and trend for the future. J. Geophys. Res. Earth Surf. 2009, 114, 1–10. [Google Scholar] [CrossRef]
  50. Sarretta, A.; Pillon, S.; Molinaroli, E.; Guerzoni, S.; Fontolan, G. Sediment budget in the Lagoon of Venice, Italy. Cont. Shelf Res. 2010, 30, 934–949. [Google Scholar] [CrossRef] [Green Version]
  51. Ibanez, C.; Curco, A.; Day, J.W.; Prat, N. Structure and productivity of microtidal Mediterranean coastal marshes. In Concepts and Controversies in Tidal Marsh Ecology; Weinstein, M.P., Kreeger, D.A., Eds.; Kluwer Academic Publishers: Dordrecht, The Netherlands, 2000; pp. 107–136. [Google Scholar]
  52. Bondesan, M.; Castiglioni, G.B.; Elmi, C.; Gabbbianelli, G.; Marocco, R.; Pirazzoli, P.A.; Tomasin, A. Coastal areas at risk from storm surges and sea-level rise in northeastern Italy. J. Coast. Res. 1995, 11, 1354–1379. [Google Scholar]
  53. Cencini, C. Physical processes and human activities in the evolution of the Po delta, Italy. J. Coast. Res. 1998, 14, 774–793. [Google Scholar]
  54. Fontolan, G.; Pillon, S.; Bezzi, A.; Villalta, R.; Lipizer, M.; Triches, A.; D’Aietti, A. Human impact and the historical transformation of saltmarshes in the Marano and Grado Lagoon, northern Adriatic Sea. Estuar. Coast. Shelf Sci. 2012, 113, 41–56. [Google Scholar] [CrossRef]
  55. Marani, M.; Lanzoni, S.; Silvestri, S.; Rinaldo, A. Tidal landforms, patterns of halophytic vegetation and the fate of the lagoon of Venice. J. Mar. Syst. 2004, 51, 191–210. [Google Scholar] [CrossRef]
  56. Tambroni, N.; Seminara, G. Are inlets responsible for the morphological degradation of Venice Lagoon? J. Geophys. Res. 2006, 111, F03013. [Google Scholar] [CrossRef]
  57. Ferrarin, C.; Ghezzo, M.; Umgiesser, G.; Tagliapietra, D.; Camatti, E.; Zaggia, L.; Sarretta, A. Assessing hydrological effects of human interventions on coastal systems: Numerical applications to the Venice Lagoon. Hydrol. Earth Syst. Sci. 2013, 17, 1733–1748. [Google Scholar] [CrossRef]
  58. Defina, A.; Carniello, L.; Fagherazzi, S.; D’Alpaos, L. Self-organization of shallow basins in tidal flats and salt marshes. J. Geophys. Res. Earth Surf. 2007, 112, 1–11. [Google Scholar] [CrossRef]
  59. Molinaroli, E.; Guerzoni, S.; Sarretta, A.; Masiol, M.; Pistolato, M. Thirty-year changes (1970 to 2000) in bathymetry and sediment texture recorded in the Lagoon of Venice sub-basins, Italy. Mar. Geol. 2009, 258, 115–125. [Google Scholar] [CrossRef] [Green Version]
  60. D’Alpaos, L. Fatti e Misfatti di Idraulica Lagunare. La Laguna di Venezia dalla Diversione dei Fiumi alle Nuove Opere delle Bocche di Porto; Istituto Veneto di Scienze Lettere ed Arti.: Venice, Italy, 2010. [Google Scholar]
  61. Feola, A.; Bonometto, A.; Ponis, E.; Cacciatore, F.; Oselladore, F.; Matticchio, B.; Canesso, D.; Sponga, S.; Volpe, V.; Lizier, M.; et al. LIFE LAGOON REFRESH. Ecological restoration in Venice Lagoon (Italy): Concrete actions supported by numerical modeling and stakeholder involvement. In Proceedings of the Citizen Observatories for natural hazards and Water Management—2nd International Conference, Venice, Italy, 27–30 November 2018; Available online: http://www.lifelagoonrefresh.eu/file/pubblicazioni/COWM_2018_Extendedabstract.pdf (accessed on 26 April 2019).
  62. Umgiesser, G.; Melaku canu, D.; Cucco, A.; Solidoro, C. A finite element model for the Venice Lagoon. Development, set up, calibration and validation. J. Mar. Syst. 2004, 51, 123–145. [Google Scholar] [CrossRef]
  63. Solidoro, C.; Melaku Canu, D.; Cucco, A.; Umgiesser, G. A partition of the Venice Lagoon based on physical properties and analysis of general circulation. J. Mar. Syst. 2004, 51, 147–160. [Google Scholar] [CrossRef]
  64. Molinaroli, E.; Guerzoni, S.; Sarretta, A.; Cucco, A.; Umgiesser, G. Links between hydrology and sedimentology in the Lagoon of Venice, Italy. J. Mar. Syst. 2007, 68, 303–317. [Google Scholar] [CrossRef] [Green Version]
  65. Ghezzo, M.; Guerzoni, S.; Cucco, A.; Umgiesser, G. Changes in Venice Lagoon dynamics due to construction of mobile barriers. Coast. Eng. 2010, 57, 694–708. [Google Scholar] [CrossRef] [Green Version]
  66. Ghezzo, M.; Sarretta, A.; Sigovini, M.; Guerzoni, S.; Tagliapietra, D.; Umgiesser, G. Modeling the inter-annual variability of salinity in the lagoon of Venice in relation to the water framework directive typologies. Ocean Coast. Manag. 2011, 54, 706–719. [Google Scholar] [CrossRef] [Green Version]
  67. Franco, A.; Franzoi, P.; Malavasi, S.; Riccato, F.; Torricelli, P.; Mainardi, D. Use of shallow water habitats by fish assemblages in a Mediterranean coastal lagoon. Estuar. Coast. Shelf Sci. 2006, 66, 67–83. [Google Scholar] [CrossRef]
  68. Malavasi, S.; Franco, A.; Fiorin, R.; Franzoi, P.; Torricelli, P.; Mainardi, D. The shallow water gobiid assemblage of the Venice Lagoon: Abundance, seasonal variation and habitat partitioning. J. Fish Biol. 2005, 67, 146–165. [Google Scholar] [CrossRef]
  69. Franzoi, P.; Franco, A.; Torricelli, P. Fish assemblage diversity and dynamics in the Venice lagoon. Rendiconti Lincei 2010, 21, 269–281. [Google Scholar] [CrossRef]
  70. Scapin, L.; Zucchetta, M.; Sfriso, A.; Franzoi, P. Local habitat and seascape structure influence seagrass fish assemblages in the Venice lagoon: The value of conservation at multiple spatial scales. Estuar. Coasts 2018, 41, 2410–2425. [Google Scholar] [CrossRef]
  71. ARPAV. Piano di Monitoraggio dei Corpi Idrici della Laguna di Venezia Finalizzato alla Definizione dello Stato Ecologico, ai Sensi della Direttiva 2000/60/CE; Relazione Finale; Agenzia Regionale per la Prevenzione e Protezione Ambientale del Veneto: Venezia, Italy, 2012. [Google Scholar]
  72. Magistrato alle Acque di Venezia (ora Provveditorato Interregionale alle OO. PP. del Veneto—Trentino Alto Adige—Friuli Venezia Giulia)—Selc Studio B.12.3/III. La funzionalità dell’ambiente lagunare attraverso rilievi delle risorse alieutiche, dell’avifauna e dell’ittiofauna. Erodibilità del fondale e fattori di disturbo: Rilievi dell’erodibilità del fondale; Rapporto Intermedio; 2005. [Google Scholar]
  73. Magistrato alle Acque di Venezia (ora Provveditorato Interregionale alle OO. PP. del Veneto—Trentino Alto Adige—Friuli Venezia Giulia)—Thetis. Programma Generale delle Attività di Approfondimento del Quadro Conoscitivo di Riferimento per Gli Interventi Ambientali. 2° Stralcio Triennale (2003–2006) “Progetto ICSEL”; Attività A; Prodotto dal Concessionario, Consorzio Venezia Nuova: Venice, Italy, 2005. [Google Scholar]
  74. Wang, Y.; Naumann, U.; Wright, S.T.; Warton, D.I. Mvabund—An R package for model-based analysis of multivariate abundance data. Methods Ecol. Evol. 2012, 3, 471–474. [Google Scholar] [CrossRef]
  75. Hastie, T.; Tibshirani, R.; Friedman, J. The Elements of Statistical Learning, 2nd ed.; Springer: New York, NY, USA, 2009; ISBN 978-0-387-84857-0. [Google Scholar]
  76. Potter, I.C.; Tweedley, J.R.; Elliott, M.; Whitfield, A.K. The ways in which fish use estuaries: A refinement and expansion of the guild approach. Fish Fish. 2013, 16, 230–239. [Google Scholar] [CrossRef]
  77. Franco, A.; Elliott, M.; Franzoi, P.; Torricelli, P. Life strategies of fishes in European estuaries: The functional guild approach. Mar. Ecol. Progr. Ser. 2008, 354, 219–228. [Google Scholar] [CrossRef]
  78. Froese, R.; Pauly, D. FishBase. Available online: http://www.fishbase.org (accessed on 29 June 2019).
  79. Catalano, B.; Penna, M.; Riccato, F.; Fiorin, R.; Franceschini, G.; Antonini, C.; Zucchetta, M.; Cicero, A.M.; Franzoi, P. Manuale per la classificazione dell’Elemento di Qualità Biologica “Fauna Ittica” nelle lagune costiere italiane. Applicazione dell’indice nazionale HFBI (Habitat Fish Bio-Indicator) ai sensi del D.Lgs 152/2006; ISPRA: Roma, Italy, 2017; ISBN 9788844808716. [Google Scholar]
  80. Franco, A.; Franzoi, P.; Malavasi, S.; Zucchetta, M.; Torricelli, P. Population and habitat status of two endemic sand gobies in lagoon marshes—Implications for conservation. Estuar. Coast. Shelf Sci. 2012, 114, 31–40. [Google Scholar] [CrossRef]
  81. Rountree, R.A.; Able, K.W. Spatial and temporal habitat use patterns for salt marsh nekton: Implications for ecological functions. Aquat. Ecol. 2007, 41, 25–45. [Google Scholar] [CrossRef]
  82. Poizat, G.; Rosecchi, E.; Chauvelon, P.; Contournet, P.; Crivelli, A.J. Long-term fish and macro-crustacean community variation in a Mediterranean lagoon. Estuar. Coast. Shelf Sci. 2004, 59, 615–624. [Google Scholar] [CrossRef]
  83. Milardi, M.; Gavioli, A.; Lanzoni, M.; Fano, E.A.; Castaldelli, G. Meteorological factors influence marine and resident fish movements in a brackish lagoon. Aquat. Ecol. 2019, 53, 251–263. [Google Scholar] [CrossRef]
  84. Franco, A.; Riccato, F.; Torricelli, P.; Franzoi, P. Fish assemblage response to environmental pressures in the Venice lagoon. Trans. Waters Bull. 2009, 3, 29–44. [Google Scholar]
  85. Franco, A.; Malavasi, S.; Zucchetta, M.; Torricelli, P.; Franzoi, P. Environmental influences on fish assemblage in the Venice Lagoon, Italy. Chem. Ecol. 2006, 22, S105–S118. [Google Scholar] [CrossRef]
  86. Cavraro, F.; Varin, C.; Malavasi, S. Lunar-induced reproductive patterns in transitional habitats: Insights from a Mediterranean killifish inhabiting northern Adriatic Saltmarshes. Estuar. Coast. Shelf Sci. 2014, 139, 60–66. [Google Scholar] [CrossRef]
  87. Zucchetta, M.; Franco, A.; Torricelli, P.; Franzoi, P. Habitat distribution model for European flounder juveniles in the Venice lagoon. J. Sea Res. 2010, 64, 133–144. [Google Scholar] [CrossRef]
  88. Verdiell-Cubedo, D.; Oliva-Paterna, F.J.; Ruiz-Navarro, A.; Torralva, M. Assessing the nursery role for marine fish species in a hypersaline coastal lagoon (Mar Menor, Mediterranean Sea). Mar. Biol. Res. 2013, 9, 739–748. [Google Scholar] [CrossRef]
  89. Tournois, J.; Darnaude, A.M.; Ferraton, F.; Aliaume, C.; Mercier, L.; McKenzie, D.J. Lagoon nurseries make a major contribution to adult populations of a highly prized coastal fish. Limnol. Oceanogr. 2017, 62, 1219–1233. [Google Scholar] [CrossRef]
  90. Cavraro, F.; Zucchetta, M.; Malavasi, S.; Franzoi, P. Small creeks in a big lagoon: The importance of marginal habitats for fish populations. Ecol. Eng. 2017, 99, 228–237. [Google Scholar] [CrossRef]
  91. Sfriso, A.; Facca, C.; Ceoldo, S.; Marcomini, A. Recording the occurrence of trophic level changes in the lagoon of Venice over the ’90s. Environ. Int. 2005, 31, 993–1001. [Google Scholar] [PubMed]
  92. Sfriso, A.; Facca, C. Distribution and production of macrophytes and phytoplankton in the lagoon of Venice: Comparison of actual and past situation. Hydrobiologia 2007, 577, 71–85. [Google Scholar] [CrossRef]
  93. Whitfield, A.K.; Elliott, M. Fishes as indicators of environmental and ecological changes within estuaries: A review of progress and some suggestions. J. Fish Biol. 2002, 61, 229–250. [Google Scholar] [CrossRef]
  94. Cabral, H.; Fonseca, V.F.; Gamito, R.; Gonçalves, C.I.; Costa, J.L.; Erzini, K.; Gonçalves, J.; Martins, J.; Leite, L.; Andrade, J.P.; et al. Ecological quality assessment of transitional waters based on fish assemblages in Portuguese estuaries: The Estuarine Fish Assessment Index (EFAI). Ecol. Indic. 2012, 19, 144–153. [Google Scholar] [CrossRef]
  95. Cavraro, F.; Bettoso, N.; Zucchetta, M.; D’Aietti, A.; Faresi, L.; Franzoi, P. Body condition in fish as a tool to detect the effects of anthropogenic pressures in transitional waters. Aquat. Ecol. 2019, 53, 21–35. [Google Scholar] [CrossRef]
  96. Lavorel, S.; Garnier, E. Predicting changes in community composition and ecosystem functioning from plant traits: Revisting the Holy Grail. Funct. Ecol. 2002, 16, 545–556. [Google Scholar] [CrossRef]
  97. Franco, T.P.; Neves, L.M.; Araújo, F.G. Better with more or less salt? The association of fish assemblages in coastal lagoons with different salinity ranges. Hydrobiologia 2019, 828, 83–100. [Google Scholar] [CrossRef]
  98. Manzo, C.; Fabbrocini, A.; Roselli, L.; D’Adamo, R. Characterization of the fish assemblage in a Mediterranean coastal lagoon: Lesina Lagoon (central Adriatic Sea). Reg. Stud. Mar. Sci. 2016, 8, 192–200. [Google Scholar] [CrossRef]
  99. Pérez-Domínguez, R.; Maci, S.; Courrat, A.; Lepage, M.; Borja, A.; Uriarte, A.; Neto, J.M.; Cabral, H.; St. Raykov, V.; Franco, A.; et al. Current developments on fish-based indices to assess ecological-quality status of estuaries and lagoons. Ecol. Indic. 2012, 23, 34–45. [Google Scholar]
  100. Alvarez, M.C.; Franco, A.; Pérez-Domínguez, R.; Elliott, M. Sensitivity analysis to explore responsiveness and dynamic range of multi-metric fish-based indices for assessing the ecological status of estuaries and lagoons. Hydrobiologia 2013, 704, 347–362. [Google Scholar] [CrossRef]
  101. Reyjol, Y.; Argillier, C.; Bonne, W.; Borja, A.; Buijse, A.D.; Cardoso, A.C.; Daufresne, M.; Kernan, M.; Ferreira, M.T.; Poikane, S.; et al. Assessing the ecological status in the context of the European Water Framework Directive: Where do we go now? Sci. Total Environ. 2014, 497–498, 332–344. [Google Scholar] [CrossRef] [PubMed]
  102. Lepage, M.; Harrison, T.; Breine, J.; Cabral, H.; Coates, S.; Galván, C.; García, P.; Jager, Z.; Kelly, F.; Mosch, E.C.; et al. An approach to intercalibrate ecological classification tools using fish in transitional water of the North East Atlantic. Ecol. Indic. 2016, 67, 318–327. [Google Scholar] [CrossRef]
  103. Franco, A.; Fiorin, R.; Franzoi, P.; Torricelli, P. Threatened fishes of the world: Pomatoschistus canestrinii Ninni, 1883 (Gobiidae). Environ. Biol. Fishes 2005, 72, 32. [Google Scholar] [CrossRef]
  104. Franco, A.; Fiorin, R.; Zucchetta, M.; Torricelli, P.; Franzoi, P. Flounder growth and production as indicators of the nursery value of marsh habitats in a Mediterranean lagoon. J. Sea Res. 2010, 64, 457–464. [Google Scholar] [CrossRef]
  105. Pranovi, F.; Caccin, A.; Franzoi, P.; Malavasi, S.; Zucchetta, M.; Torricelli, P. Vulnerability of artisanal fisheries to climate change in the Venice Lagoon. J. Fish Biol. 2013, 83, 847–864. [Google Scholar]
  106. Pérez-Ruzafa, A.; Mompeán, M.C.; Marcos, C. Hydrographic, geomorphologic and fish assemblage relationships in coastal lagoons. Hydrobiologia 2007, 577, 107–125. [Google Scholar] [CrossRef]
  107. Pérez-Ruzafa, A.; Marcos, C. Fisheries in coastal lagoons: An assumed but poorly researched aspect of the ecology and functioning of coastal lagoons. Estuar. Coast. Shelf Sci. 2012, 110, 15–31. [Google Scholar] [CrossRef]
  108. Management of Coastal Lagoon Fisheries; Kapetsky, J.M.; Lasserre, G. (Eds.) FAO Studies and Reviews, GFCM 61; FAO: Rome, Italy, 1984.
  109. Ardizzone, G.D.; Cataudella, S.; Rossi, R. Management of coastal lagoon fisheries and aquaculture in Italy. AO Fish. Tech. Paper 1988, 293, 1–103. [Google Scholar]
  110. Nagelkerken, I.; Sheaves, M.; Baker, R.; Connolly, R.M. The seascape nursery: A novel spatial approach to identify and manage nurseries for coastal marine fauna. Fish Fish. 2015, 16, 362–371. [Google Scholar] [CrossRef]
  111. Brown, C.J.; Harborne, A.R.; Paris, C.B.; Mumby, P.J. Uniting paradigms of connectivity in marine ecology. Ecology 2016, 97, 2447–2457. [Google Scholar] [CrossRef] [PubMed] [Green Version]
  112. Whitfield, A.K.; Pattrick, P. Habitat type and nursery function for coastal marine fish species, withemphasis on the Eastern Cape region, South Africa. Estuar. Coast. Shelf Sci. 2015, 160, 49–59. [Google Scholar] [CrossRef]
  113. Day, J.W.; Rybczyk, J.; Scarton, F.; Rismondo, A.; Are, D.; Cecconi, G. Soil accretionary dynamics, sea-level rise and the survival of wetlands in Venice lagoon: A field and modelling approach. Estuar. Coast. Shelf Sci. 1999, 49, 607–628. [Google Scholar] [CrossRef]
  114. IPCC. Climate Change 2007: The Physical Science Basis. Contribution of Working Group I to the Fourth Assessment Report of the IPCC; Cambridge University Press: Cambridge, UK, 2007. [Google Scholar]
  115. Bellafiore, D.; Ghezzo, M.; Tagliapietra, D.; Umgiesser, G. Climate change and artificial barrier effects on the Venice Lagoon: Inundation dynamics of salt marshes and implications for halophytes distribution. Ocean Coast. Manag. 2014, 100, 101–115. [Google Scholar] [CrossRef]
Figure 1. The Venice lagoon and location of sampling sites. The sites are located either in saltmarsh creeks (red dots) or at saltmarsh edges (green). The dashed lines indicate the approximate positions of the main watersheds. The distribution of the saltmarsh (dark grey), lagoon channels (light blue) and main freshwater courses flowing into the lagoon (blue) are also shown. The red arrow indicates the location of the planned river diversion into the lagoon planned under the LIFE Lagoon ReFresh project.
Water 11 01354 g001
Figure 2. The average magnitude of the effect (and standard error) of relevant environmental and location factors estimated by the selected model. The values are calculated as the mean of the absolute (i.e., without sign) coefficients estimated for each species, weighted by average species biomass.
Water 11 01354 g002
Figure 3. The estimated coefficients (and standard errors) of relevant environmental and location factors for species accounting for 98% of assemblage biomass.
Water 11 01354 g003
Figure 4. Whole nekton assemblage biomass (g 100 m−2) predicted along the salinity gradient for each season investigated. The current salinity and the three scenarios of salinity reduction are highlighted. The dashed lines indicate the standard error of the prediction.
Water 11 01354 g004
Figure 5. Species biomass (g 100 m−2) predicted along the salinity gradient. The seasonal values were averaged. The current salinity and the three scenarios of salinity reduction are highlighted. The dashed lines indicate the standard error of the prediction.
Water 11 01354 g005
Figure 6. Biomass (g 100 m−2) predicted along the salinity gradient for ecological and trophic guilds. The seasonal values were averaged. The current salinity and the three scenarios of salinity reduction are highlighted. The dashed lines indicate the standard error of the prediction. Guilds are abbreviated as follows. ES: estuarine resident species; ESs: solely estuarine resident species; MED: marine estuarine-dependent species; Bmi: microbenthivores; DV: detritivores; Bma: macrobenthivores; HZ: hyperbenthivores-zooplanctivores; HP: hyperbenthivores-piscivores; OV: omnivores.
Water 11 01354 g006
Table 1. Generalised linear models (GLMs) formulations considered in this study, and a summary of likelihood ratio tests performed between pairs of models. For each model comparison, the predictors being tested are specified.
Model CategoryFormulaPredictors Included
m0Yi ~ intercept + εiNone
m1m0 + season + yearTemporal
m2m1 + sub-basinTemporal + geographical
m3.1m2 + temperatureTemporal + geographical + environmental
m3.2m2 + temperature + salinity
m3.3m2 + temperature + salinity + DO
m3.4m2 + temperature + salinity + DO + turbidity
m3.5m2 + temperature + salinity + DO + turbidity + grain
m3.6m2 + temperature + salinity + DO + turbidity + grain + algae
m4m3.x + locationTemporal + geographical + environmental + location (marsh creek or edge)
Test Testing the Effect of:
t1m0 vs. m1Temporal factor
t2m1 vs. m2Geographical factor, when only temporal factor was considered before
t3.1m2 vs. m3.1Each environmental factor, when temporal, geographical and all the significant previous environmental factors were considered before
t3.2m3.1 vs. m3.2
t3.3m3.2 vs. m3.3
t3.4m3.3 vs. m3.4
t3.5m3.4 vs. m3.5
t3.6m3.5 vs. m3.6
t4m3.x vs. m4Location factor, when temporal, geographical and all the significant environmental factors were considered before
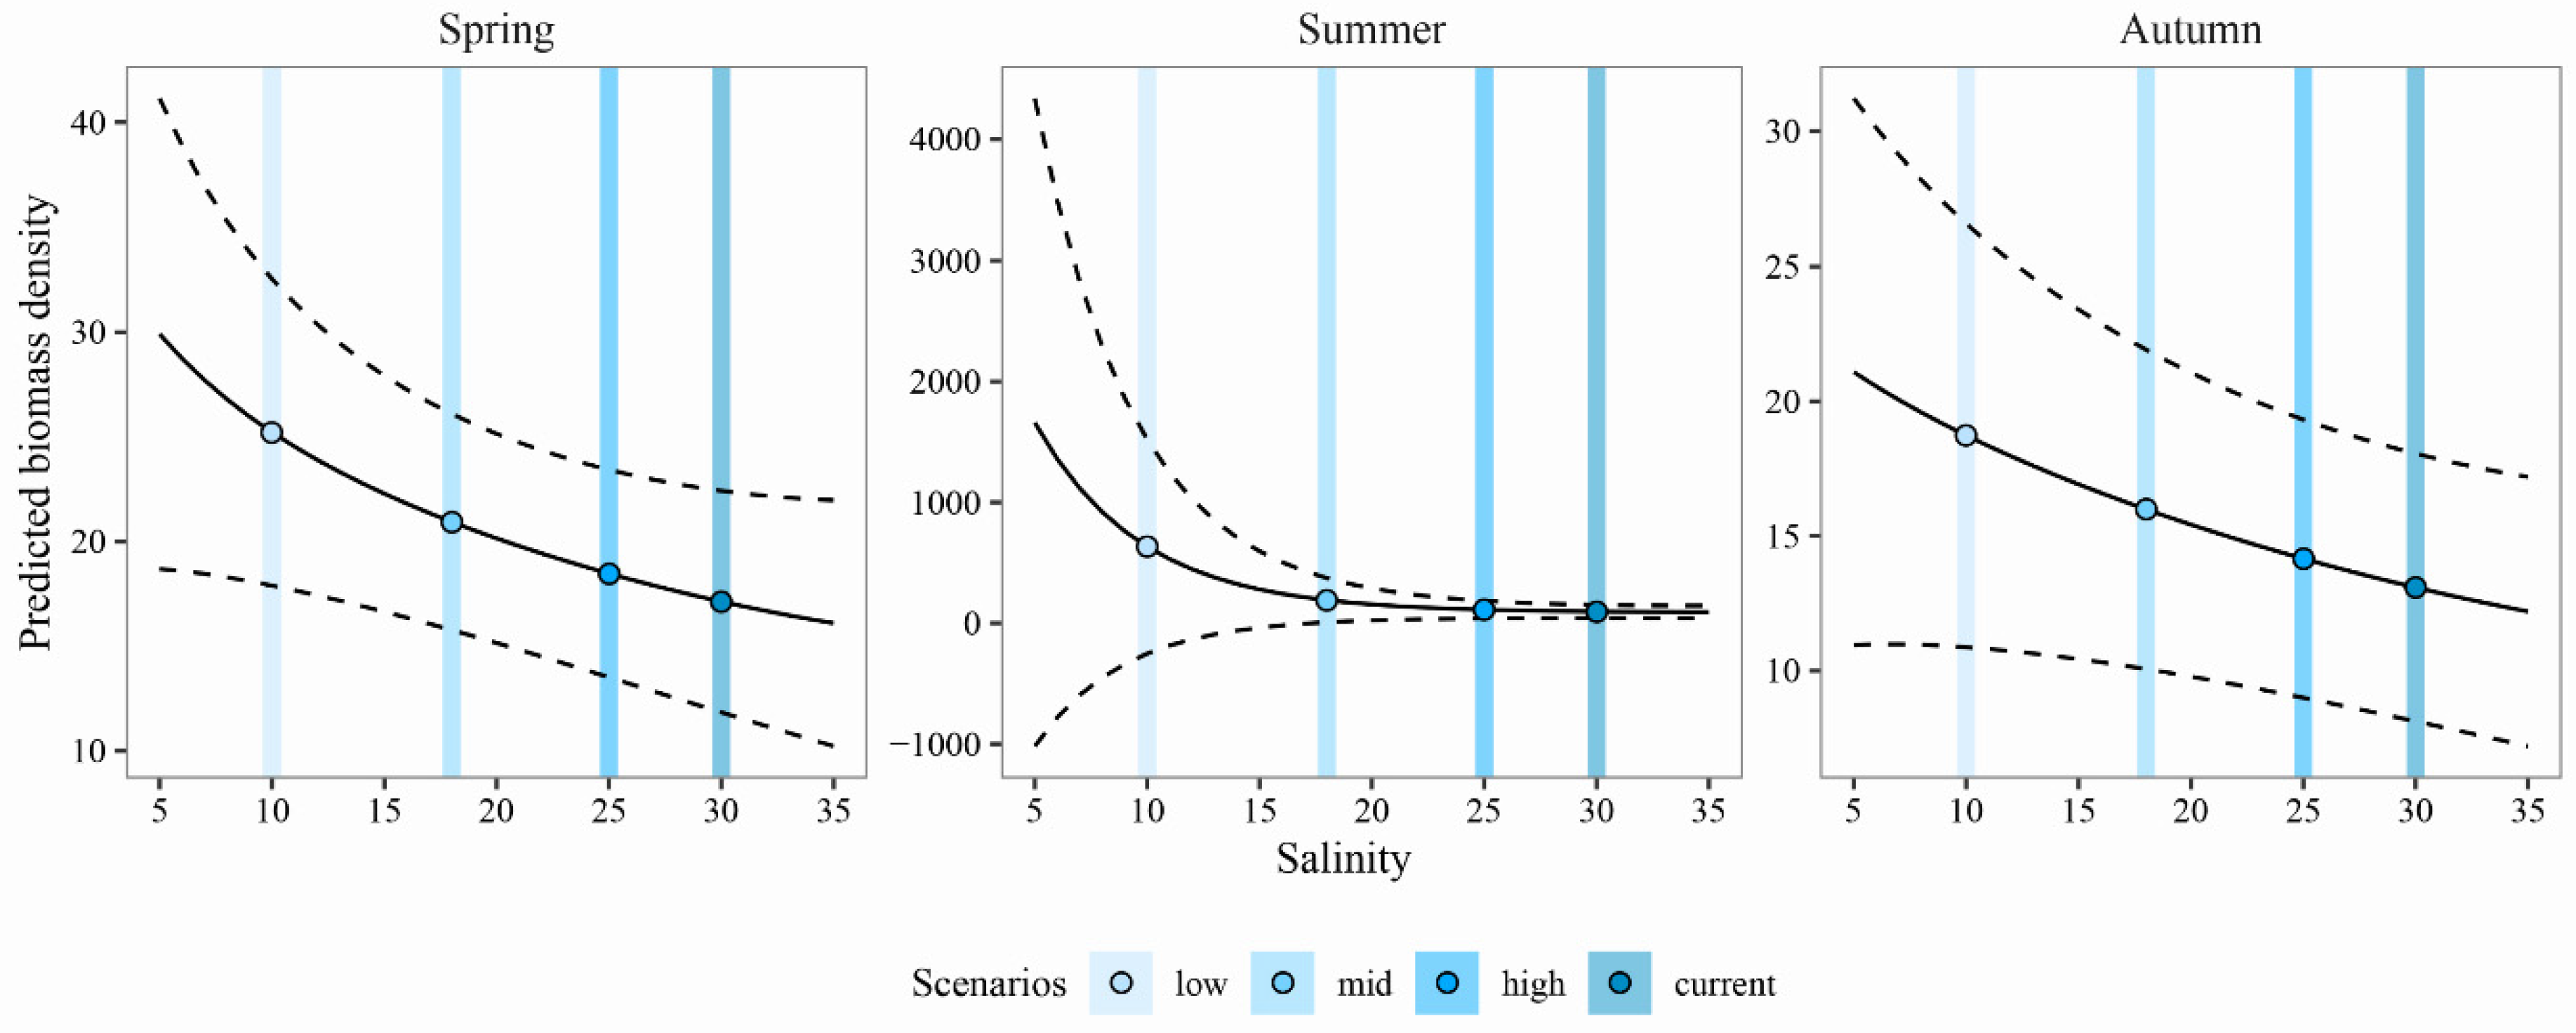
Table 2. The scenarios defined for predicting the expected nekton assemblage.
ScenarioSalinity (PSU)SeasonYearSub-BasinOther Environmental VariablesLocation
Low10Either spring, summer or autumnAverage sampling year considered in calibrationNorthernAverage values measured in the northern sub-basin during each seasonSaltmarsh edge
Mid18
High25
Current30
Table 3. Average and standard error values of Spearman’s coefficients calculated by cross-validation (k = 5) on species accounting for 98% of total biomass and on the whole assemblage. For each species the estuarine use functional guild (EUFG), the feeding mode functional guilds (FMFG) and the average biomass are reported. Guilds are abbreviated as follows. ES: estuarine resident species; ESs: solely estuarine resident species; MED: marine estuarine-dependent species; Bmi: microbenthivores; DV: detritivores; Bma: macrobenthivores; HZ: hyperbenthivores-zooplanctivores; HP: hyperbenthivores-piscivores; OV: omnivores.
Average Biomass (g 100 m−2)Spearman’s Coefficient
GroupSpeciesEUFGFMFGAverageStandard Error
DecapodsPalaemon elegansESBmi, OV0.930.600.004
Crangon crangonMEDBmi3.630.600.22
FishAtherina boyeriESHZ25.590.490.11
Pomatoschistus canestriniiESsBmi, HZ1.380.480.09
Chelon ramadaMEDHZ, DV22.430.420.15
Platichthys flesusMEDBmi, Bma, HP0.650.390.04
Pomatoschistus marmoratusESBmi, HZ0.460.350.08
Knipowitschia panizzaeESsBmi, HZ2.130.310.03
Aphanius fasciatusESsBmi, OV9.550.280.10
Chelon saliensMEDHZ, DV2.040.180.08
Sparus aurataMEDBmi, Bma, HZ0.530.160.003
Chelon auratusMEDHZ, DV4.680.140.22
Whole assemblage 0.460.05

