Article

Comparison of Otolith Readability and Reproducibility of Counts of Translucent Zones Using Different Otolith Preparation Methods for Four Endemic Labeobarbus Species in Lake Tana, Ethiopia

1
Department of Animal Science and Aquatic Ecology, University of Ghent, 9000 Ghent, Belgium
2
Department of Fisheries, Wetlands and Wildlife Management, Bahir Dar University, Bahir Dar 6000, Ethiopia
3
Flanders Research Institute for Agriculture, Fisheries and Food (ILVO), 8400 Ostend, Belgium
4
Department of Zoological Sciences, Addis Ababa University, Addis Ababa 1000, Ethiopia
5
Department of Biology, Bahir Dar University, Bahir Dar 6000, Ethiopia
*
Author to whom correspondence should be addressed.
Water 2019, 11(7), 1336; https://doi.org/10.3390/w11071336
Submission received: 10 May 2019 / Revised: 21 June 2019 / Accepted: 24 June 2019 / Published: 28 June 2019
(This article belongs to the Special Issue Ecology and Conservation of Freshwater Fishes Biodiversity)

Abstract

:
The analysis of fish age data is vital for the successful conservation of fish. Attempts to develop optimal management strategies for effective conservation of the endemic Labeobarbus species are strongly affected by the lack of accurate age estimates. Although methodological studies are key to acquiring a good insight into the age of fishes, up to now, there have not been any studies comparing different methods for these species. Thus, this study aimed at determining the best method for the endemic Labeobarbus species. Samples were collected from May 2016 to April 2017. Asteriscus otoliths from 150 specimens each of L. intermedius, L. tsanensis, L. platydorsus, and L. megastoma were examined. Six methods were evaluated; however, only three methods resulted in readable images. The procedure in which whole otoliths were first submerged in water, and subsequently placed in glycerol to take the image (MO1), was generally best. Except for L. megastoma, this method produced the clearest image as both the coefficient of variation and average percentage error between readers were lowest. Furthermore, except for L. megastoma, MO1 had high otolith readability and no systematic bias. Therefore, we suggest that MO1 should be used as the standard otolith preparation technique for the first three species, while for L. megastoma, other preparation techniques should be evaluated. This study provides a reference for researchers from Africa, particularly Ethiopia, to develop a suitable otolith preparation method for the different tropical fish species.

1. Introduction

The endemic Labeobarbus species in Lake Tana are the only remaining known intact species flock of large cyprinids in the world [1]. Labeobarbus species are the most economically and ecologically important fishes in Lake Tana. However, because of their migratory and spawning aggregation behaviours [2] and specialized endemic characteristics [3], Labeobarbus populations are highly susceptible to illegal fishing and environmental degradation. As a result, their abundance has markedly declined [4,5,6,7] and six of the seventeen species have already been listed in the IUCN (International Union for Conservation of Nature) Red List as threatened species [8,9]. Therefore, the conservation of these species is urgently needed.
In this regard, the local fisheries authorities have taken the responsibility to conserve these species. However, their attempts are hampered by a lack of information. Although there have been reports on some biological aspects and anthropogenic pressures [2,3,10,11,12,13,14,15,16,17], little is known about the life-history traits of the endemic Labeobarbus species in Lake Tana. Information about age, age at maturity, growth, mortality, and longevity of Labeobarbus spp., which are important indicators of the health of fish stock [18], is virtually non-existent.
To understand the current stock status of the Labeobarbus species, investigation of their life-history traits is crucial. In studying the life history traits of the Labeobarbus species, knowledge of the age structure of fish populations, which is the basis of quantitative stock assessments, is vital [19]. Age structures allow the determination of the age at maturity, growth and mortality rates, which are essential input parameters for stock assessment models [19]. Inaccurate age estimations result in biased stock assessment outputs, which in turn lead to incorrect implementation of fisheries management strategies [20,21]. Several hard structures such as otoliths, scales, vertebrae, and fin rays can be used for fish age determination, although otoliths and scales are most frequently used. Because of their non-lethal nature, scales have long been considered the most efficient and practical structures for age determination, but later, several studies have revealed them to be inaccurate [22,23,24,25]. The limitations of scales to reveal all growth zones, particularly for slow-growing and older fish, have been proven by various studies [19,24,25]. Even though they require sacrificing the fish, otoliths generally provide precise and accurate counts of growth zones [26].
As it is well known that the most adequate otolith preparation methods differ from one species to another, a description of the most suitable method is indispensable for precise and accurate age estimation. In developed countries, validated age determination methods have been established for many fish species. However, this has not been the case in developing countries like Ethiopia. This study is part of a large study about the stock assessment of the endemic Labeobarbus species in Lake Tana. The aim of the study is to compare different otolith preparation methods in order to select the method with the best contrast between translucent and opaque growth zones. Therefore, this study is a prerequisite to undertake more detailed studies on age validation, growth, and mortality. The findings of this study are the first attempts to describe the most suitable method for the four Labeobarbus species, and these will be adopted as a standard protocol in further age validation studies.

2. Materials and Methods
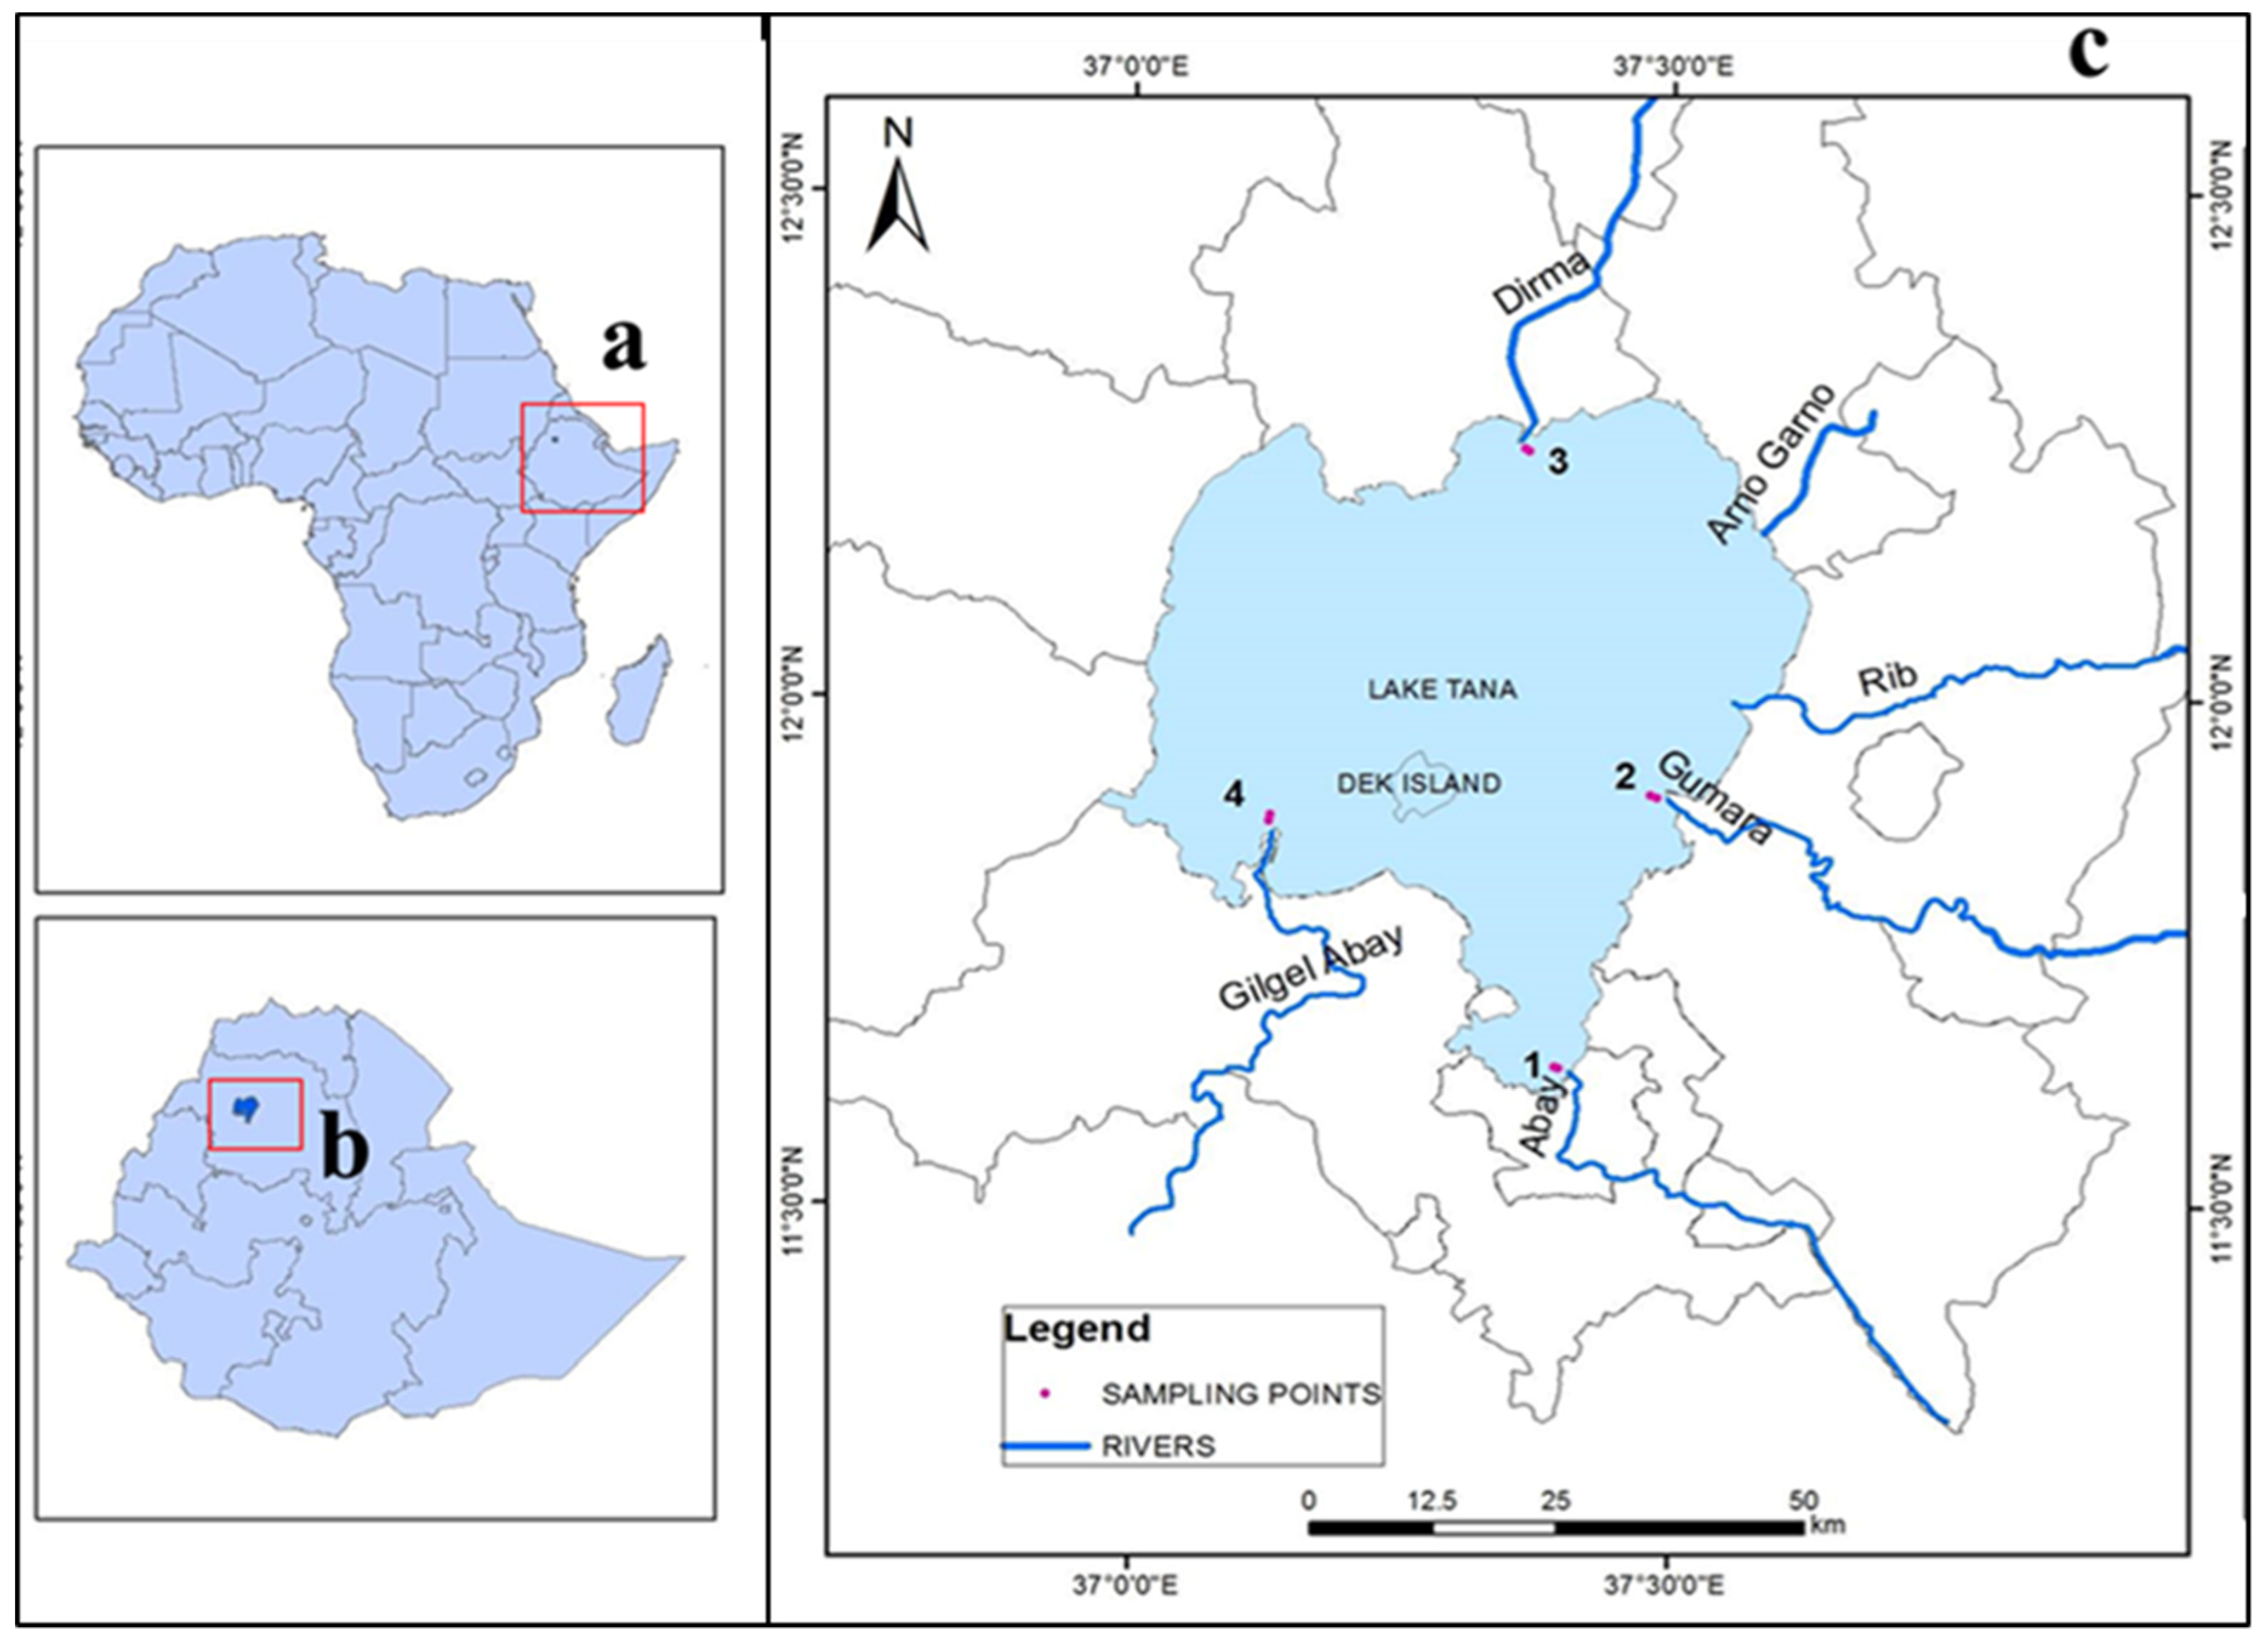
2.1. Study Area

Lake Tana is situated on the basaltic plateau of the north-western Ethiopian highlands at 12° N, 37°15′ E and at about 1800 m above sea level (Figure 1). Lake Tana, covering an area of approximately 3050 km2, is Ethiopia’s largest lake and contains half of the country’s surface freshwater. The climate is typical for a semi-arid region close to the equator. Lake Tana, as a tropical lake, has a relatively low temperature ranging from 20 to 27 °C [27].

2.2. Sampling Design

Four sampling sites were systematically distributed over the lake and together represent the open-water zone of the whole lake. For site selection, we considered the cardinal directions north, south, east, and west of the lake; presence of the major tributaries, which are an ideal breeding grounds of the migratory Labeobarbus species in the lake; and the major fishing grounds. Sampling was conducted each month from May 2016 to April 2017 at all four sites. We used 10 multi-mesh gill nets consisting of 6, 8, 10, 12, and 14 stretched mesh sizes and monofilament gill nets of 4 and 6 cm stretched mesh size. Multifilament gill nets were set for 16 h, around 16:00 to 08:00, and were lowered to the bottom using anchors. The monofilaments were set during the daytime from 08:00 to 10:00. The identification of Labeobarbus spp. to species level using keys took place immediately after capture [11]. The majority of the Labeobarbus spp. caught by gill net died, but those that were caught without major injury were quickly identified and returned to the lake. Fork length of each specimen (to the nearest 0.1 cm) and total weight (to the nearest 0.1 g) were measured in the field using a measuring board and a precision balance. After dissection, the gonad maturity of each specimen was determined using a seven-point maturity scale [28] and each fish was sexed. For growth zone counts, four species—L. intermedius, L. tsanensis, L. platydorsus, and L. megastoma—were selected. Species selection was based on their prevalence in the commercial catch. All specimens selected for growth zone counts were beheaded and samples were transported using an ice-box to the fisheries laboratory in Bahir Dar University for otolith extraction.

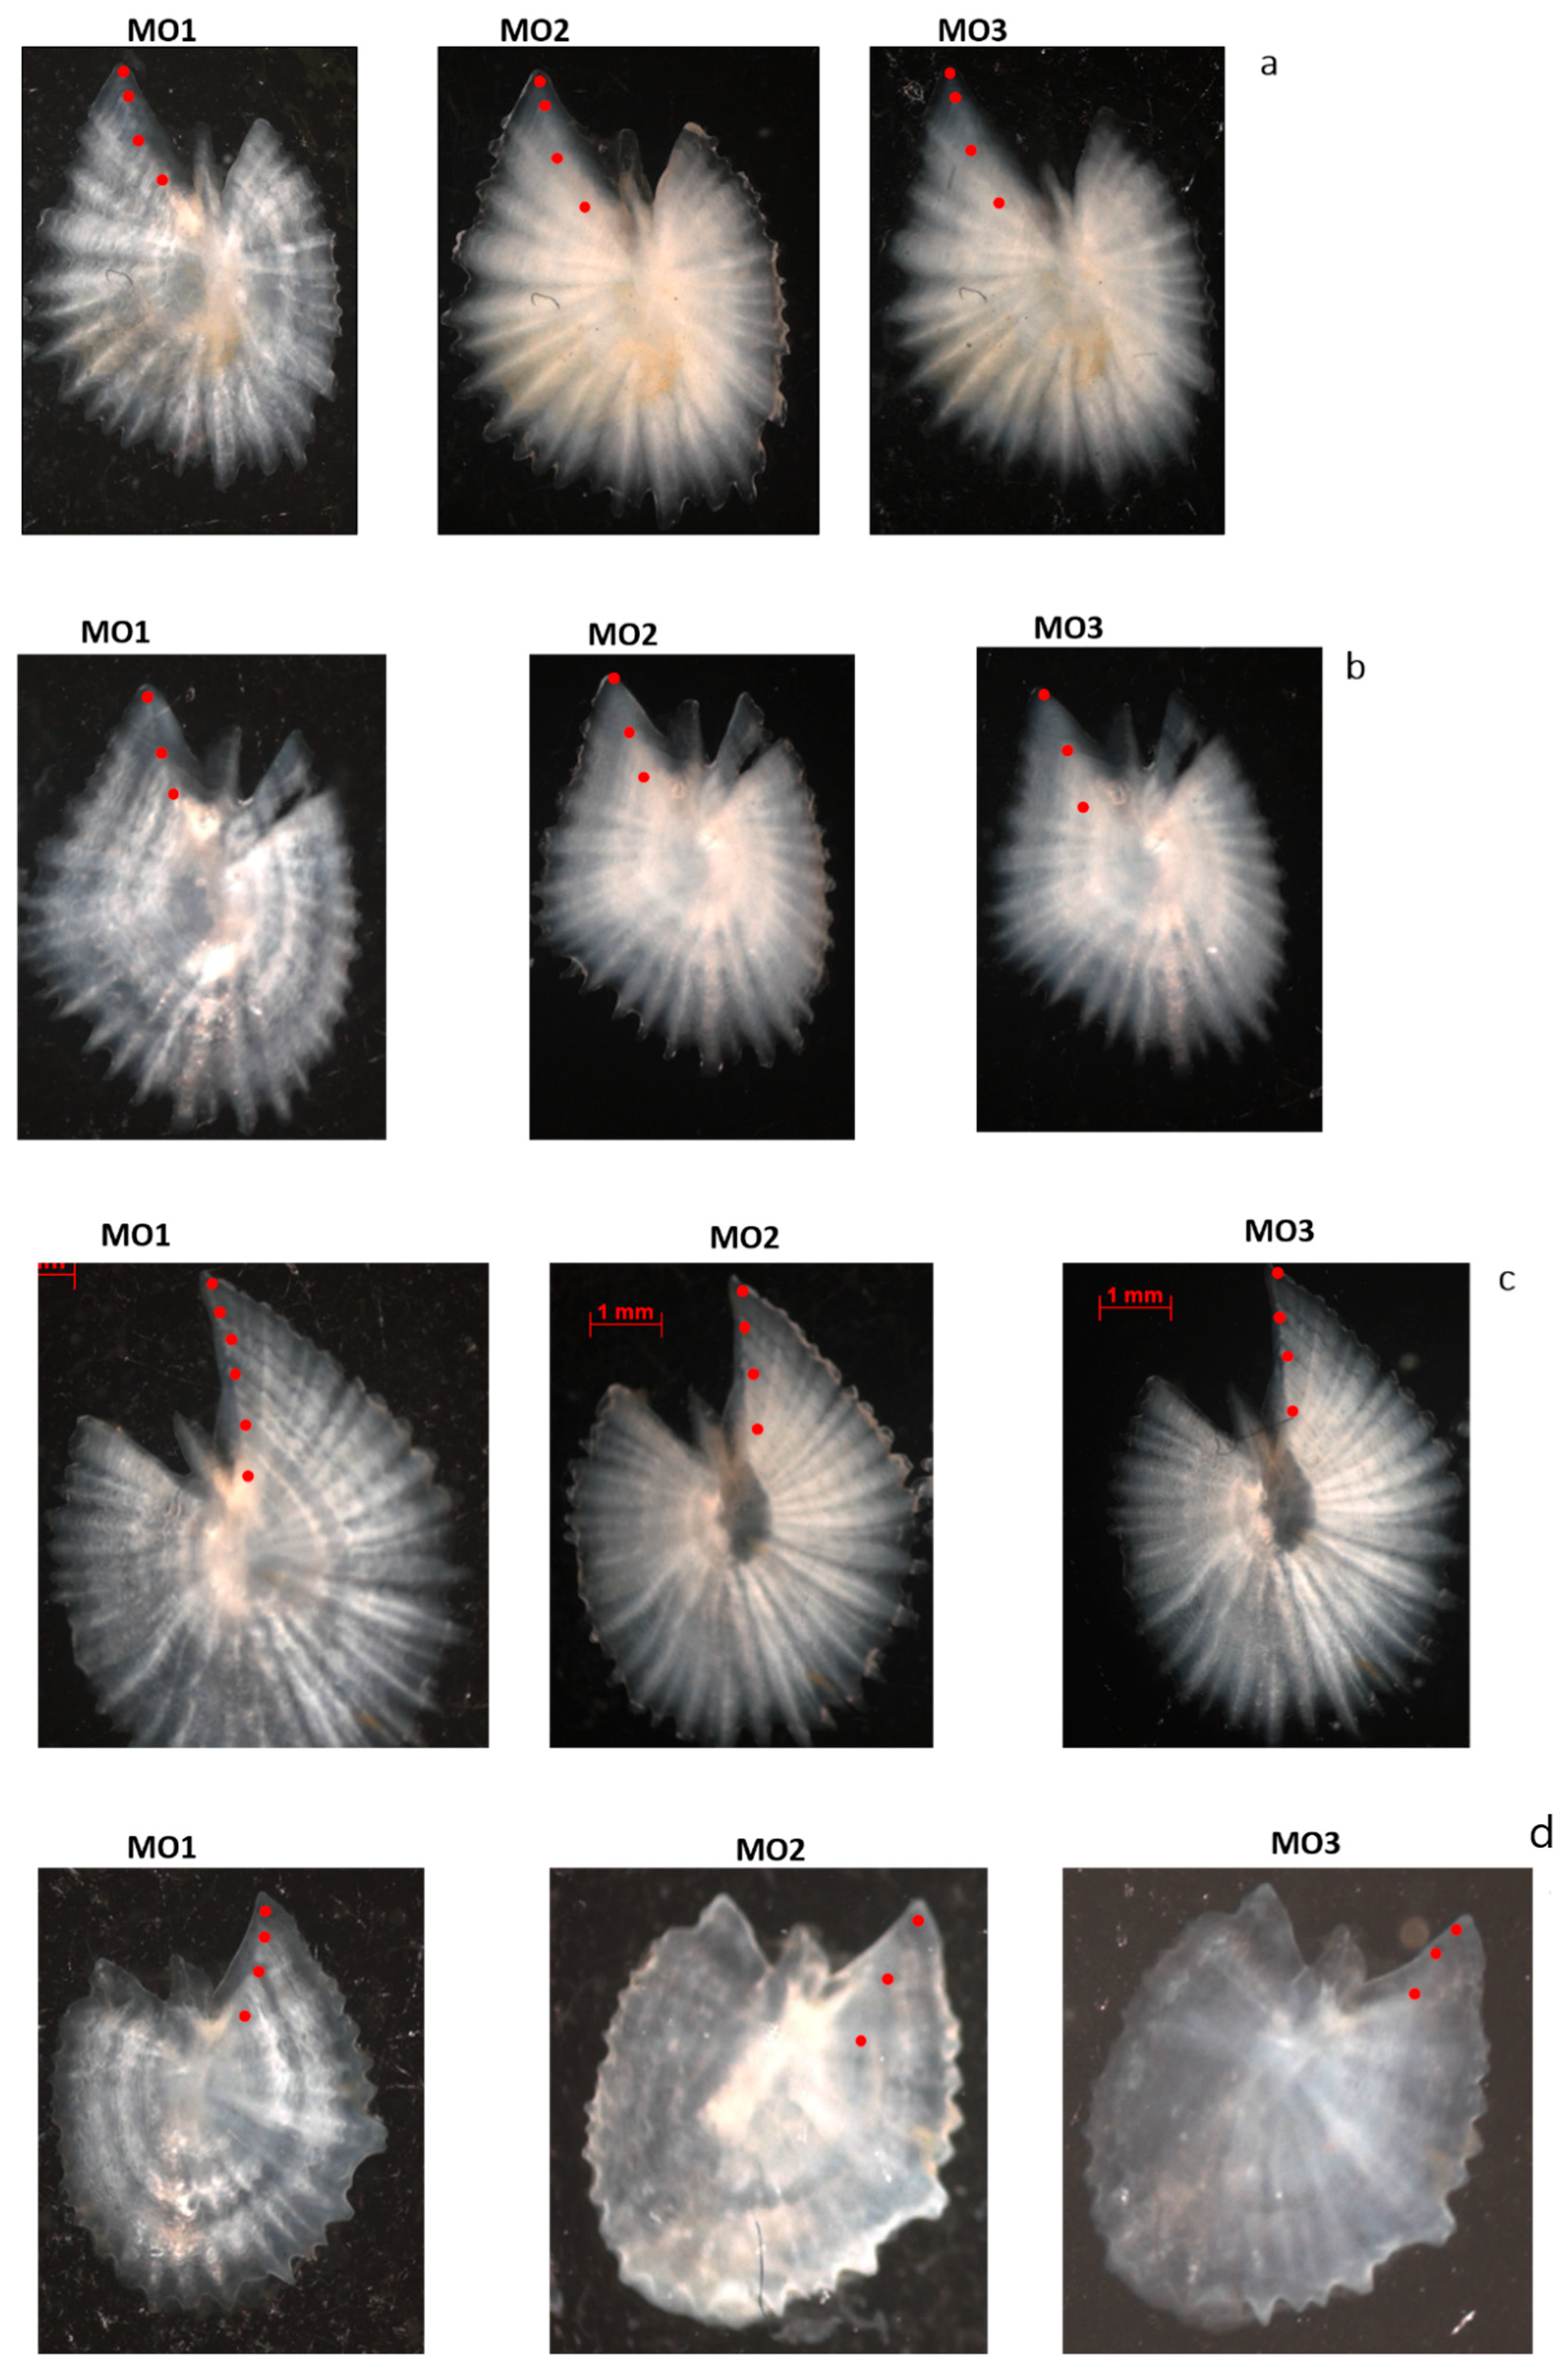
2.3. Otolith Preparation Methods

Of the three otolith pairs within the Cyprinidae family, asteriscus otoliths are the largest and have the most suitable hard structure for aging [29,30,31]. A total of 150 asteriscus otolith pairs were collected from each of the four Labeobarbus species. Otoliths were cleaned by removing the attached tissues and were preserved in 45% glycerol using labelled micro-centrifuge tubes. In order to ascertain the best method to obtain a clear view of the core, edge, and growth increments, we tried out a number of different otolith preparation methods. These preparation methods included (1) whole otoliths submerged in glycerol and water and (2) otoliths that were sectioned and stained. A detailed description of the different otolith preparation methods is given in the following sections. The left otolith was generally used, but if it was broken or lost, the right otolith was used instead.

2.3.1. Whole Otolith Submerged in Glycerol and Water

The effect of glycerol and water to enhance the visibility of the growth zones was evaluated. Whole otoliths were first immersed in glycerol at different time intervals. For example, the whole otoliths were immersed in glycerol for 2, 4, 6, 8, 12, 14, and 16 hours and the visibility of the growth zones at each time interval was examined. Similarly, the same otoliths were submerged in water following the same procedures used for glycerol. In order to remove the effect of glycerol, otoliths were rinsed using acetone, cleaned, and dried prior to submergence in water. The combined effect of glycerol and water was also evaluated. The whole otoliths were first submerged in glycerol before transferring them to a water medium to take the image for growth zone count, or vice versa. Whole otoliths were placed in a black bowl filled with glycerol or water using forceps and an image was taken using an AxioCam MRc camera attached to a stereo-microscope using reflected light at 10X magnification.

2.3.2. Sectioned and Stained Otoliths

Prior to sectioning, whole otoliths were cleaned using water, dried, and embedded in black resin. A mould with six rows was used to embed the otoliths. The black resin was first poured on each row and then, depending on the size of the otolith, 9–10 whole otoliths were placed on each row using forceps. The embedded otoliths were allowed to dry for 12 h. After fully drying, a top layer was added and allowed to harden for an extra 12 h before sectioning. Finally, an approximately 0.45–0.50 mm thick transverse section was cut through the nucleus using a high-speed saw rotating at 3000 rpm (ATM BRILLANT250).
After sectioning, otoliths were stained using 100% of a neutral red solution and the enhancement of growth zone visibility was checked at 1-minute intervals for 30 min. As this trial did not give a good result, we also tried to stain the otoliths using 50% of the solution. Moreover, as an alternative to the neutral red solution, alizarin solution was used. Using this solution, otoliths were stained for 30 min and growth zone enhancement was checked at 1-minute intervals. Additionally, otoliths were also stained for 1 h without interruption. Besides the sectioned otoliths, we also stained the whole otoliths using both solutions. Both reflected and transmitted light was used to take images of the sectioned and stained otoliths at 16X magnification.

2.3.3. Preliminary Evaluation of Otolith Preparation Techniques

A preliminary evaluation was made based on the clarity and contrast of the images (Figure 2). Of all the examined otolith preparation methods, three methods did not produce distinguishable growth zones. More specifically, (1) the method using sectioned otoliths, (2) the method using stained otoliths, and (3) the method using otoliths submerged in water and remained in the water to take the image. Thus, these methods were omitted at this stage and otolith preparation was continued using only the three methods that produced distinguishable growth zones, core, and edge. These methods are the following: (1) method 1: whole otoliths were first submerged in water for 16 h and the image was taken while the otolith was placed in glycerol (MO1), (2) method 2: whole otoliths were first submerged in glycerol for 14 h and the image was taken while the otolith was placed in water (MO2), and (3) method 3: whole otoliths submerged in glycerol and remained in glycerol to take image (MO3). For MO1, whole otoliths submerged in water for about 16 h resulted in clear images, whereas for MO2 and MO3, whole otoliths immersed in glycerol for about 14 h produced relatively good images. The data from these three methods were retained for data analysis
Otolith preparation and examination was undertaken in the Flanders Research Institute for Agriculture, Fisheries, and Food (ILVO) in Belgium. Growth zones were annotated on the digital otolith image using SmartDots software (www.smartdots.ices.dk). Growth zones were visible as translucent (dark) and opaque (light) zones when examined under reflected light. Counts of translucent zones were made along an anterio-dorsal transect situated on the otolith rostrum. All otoliths were examined by two experienced readers unfamiliar with these species and working independently. Readers had no previous knowledge on the date of capture, size, and sex of the fish. Each reader read each otolith once and the reader’s confidence to otolith readability was assigned as follows: easily readable (Q1), moderately readable (Q2), or unreadable (Q3).

3. Statistical Analysis

Translucent Zone Count Precision and Bias

Both statistical and graphical methods were used to compare the bias and precision between readers and methods. The precision between readers and methods was measured using the average percentage error (APE) [32], coefficient of variation (CV) [33], and percentage of agreement (PA). The APE and CV are the most suitable and statistically sound measurements of precision [19]. Although PA can be used as an index of precision, it is often not considered as a suitable measure as it widely varies among species as well as among ages within a species [32]. The PA is the ratio of the number of agreements between the paired readings to the total number of readings made by the two independent readers. The APE and CV were computed by the following formula:
A P E = 100 N J 1 N ( 1 R i 1 R | X i j X j | X j ) ,
C V = 100 N J 1 N ( i = 1 R ( X i j X j ) 2 R 1 X j ) ,
where N is the number of fish whose otoliths were read, R is the number of times otoliths were read, Xij is the ith read for the jth fish, and Xj is the average estimated growth zone count of the jth fish.
Count-bias plots were produced to visualize the deviation of readings between the methods and readers from the 1:1 equivalence line [34]. Although none of the three methods was validated, otolith images from MO1 were clearer and sharper, which would likely lead to fewer errors in growth zone count. Additionally, the precision of MO1 was better than the other methods for all four species. On this basis, we assumed that growth zone counts from MO1 are reliable and, therefore, we compared growth zone counts from MO2 and MO3 with those from MO1, which is considered as a reference count. Similarly, growth zone counts from MO2 were compared with those from MO3, because the precision for MO3 was better than for MO2. The null hypothesis that the mean of the none-reference counts did not significantly differ from the reference counts for each reference count was tested using a paired t-test. The mean difference of the growth zone counts assigned by the two readers for each method was determined using an independent t-test. One-way analysis of variance (ANOVA) was used to determine if there were significant differences among mean growth zone counts derived from the three methods. The null hypothesis that there is no symmetric difference in growth zone counts between readers and methods was tested using a Bowker’s chi-square symmetry test [35].
In order to reveal if the difference between the growth zone counts of the two readers and among methods was consistent, a linear regression was computed. The slope and intercept of the regression line were tested for significant difference from 1 and 0, respectively. For the regression analyses between readers, growth zone counts from reader 1 (R1) and reader 2 (R2) were used as an independent and a dependent variable, respectively. As both readers had relatively the same otolith reading experience and both of them were unfamiliar with these species, we randomly chose growth zone counts from R1 as the independent variable. The mean of the paired reads was used for the regression analyses between methods. For the regression analyses between MO1 and the other methods, growth zone counts from MO1 were used as an independent variable, while growth zone counts from MO3 were used as an independent variable for the regression analysis between MO2 and MO3.
The null hypothesis that the mean difference between paired growth zone counts is zero was tested using a paired t-test. Otolith readability based on the confidence rankings assigned by the two readers was tested using a Mann–Whitney U test. A Kruskal–Wallis test was used to determine otolith readability among methods. Confidence rankings from R1 were used for this analysis. The pairwise comparison of the otolith readability between methods was made using Dunn’s test with p-values adjusted with the Benjamini–Hochberg method. When a reader’s confidence to otolith readability was assigned as Q3 (an unreadable), it was discarded from the analysis to ensure equal sample sizes for the three methods. The periodicity of growth zone deposition was validated and the growth zone deposition rate in asteriscus otolith of the studied species was proven to be annual [36]. Data analysis was undertaken using R software (version 3.5.0, R Developer Core Team, R Foundation for Statistical Computing, Vienna, Austria).

4. Results

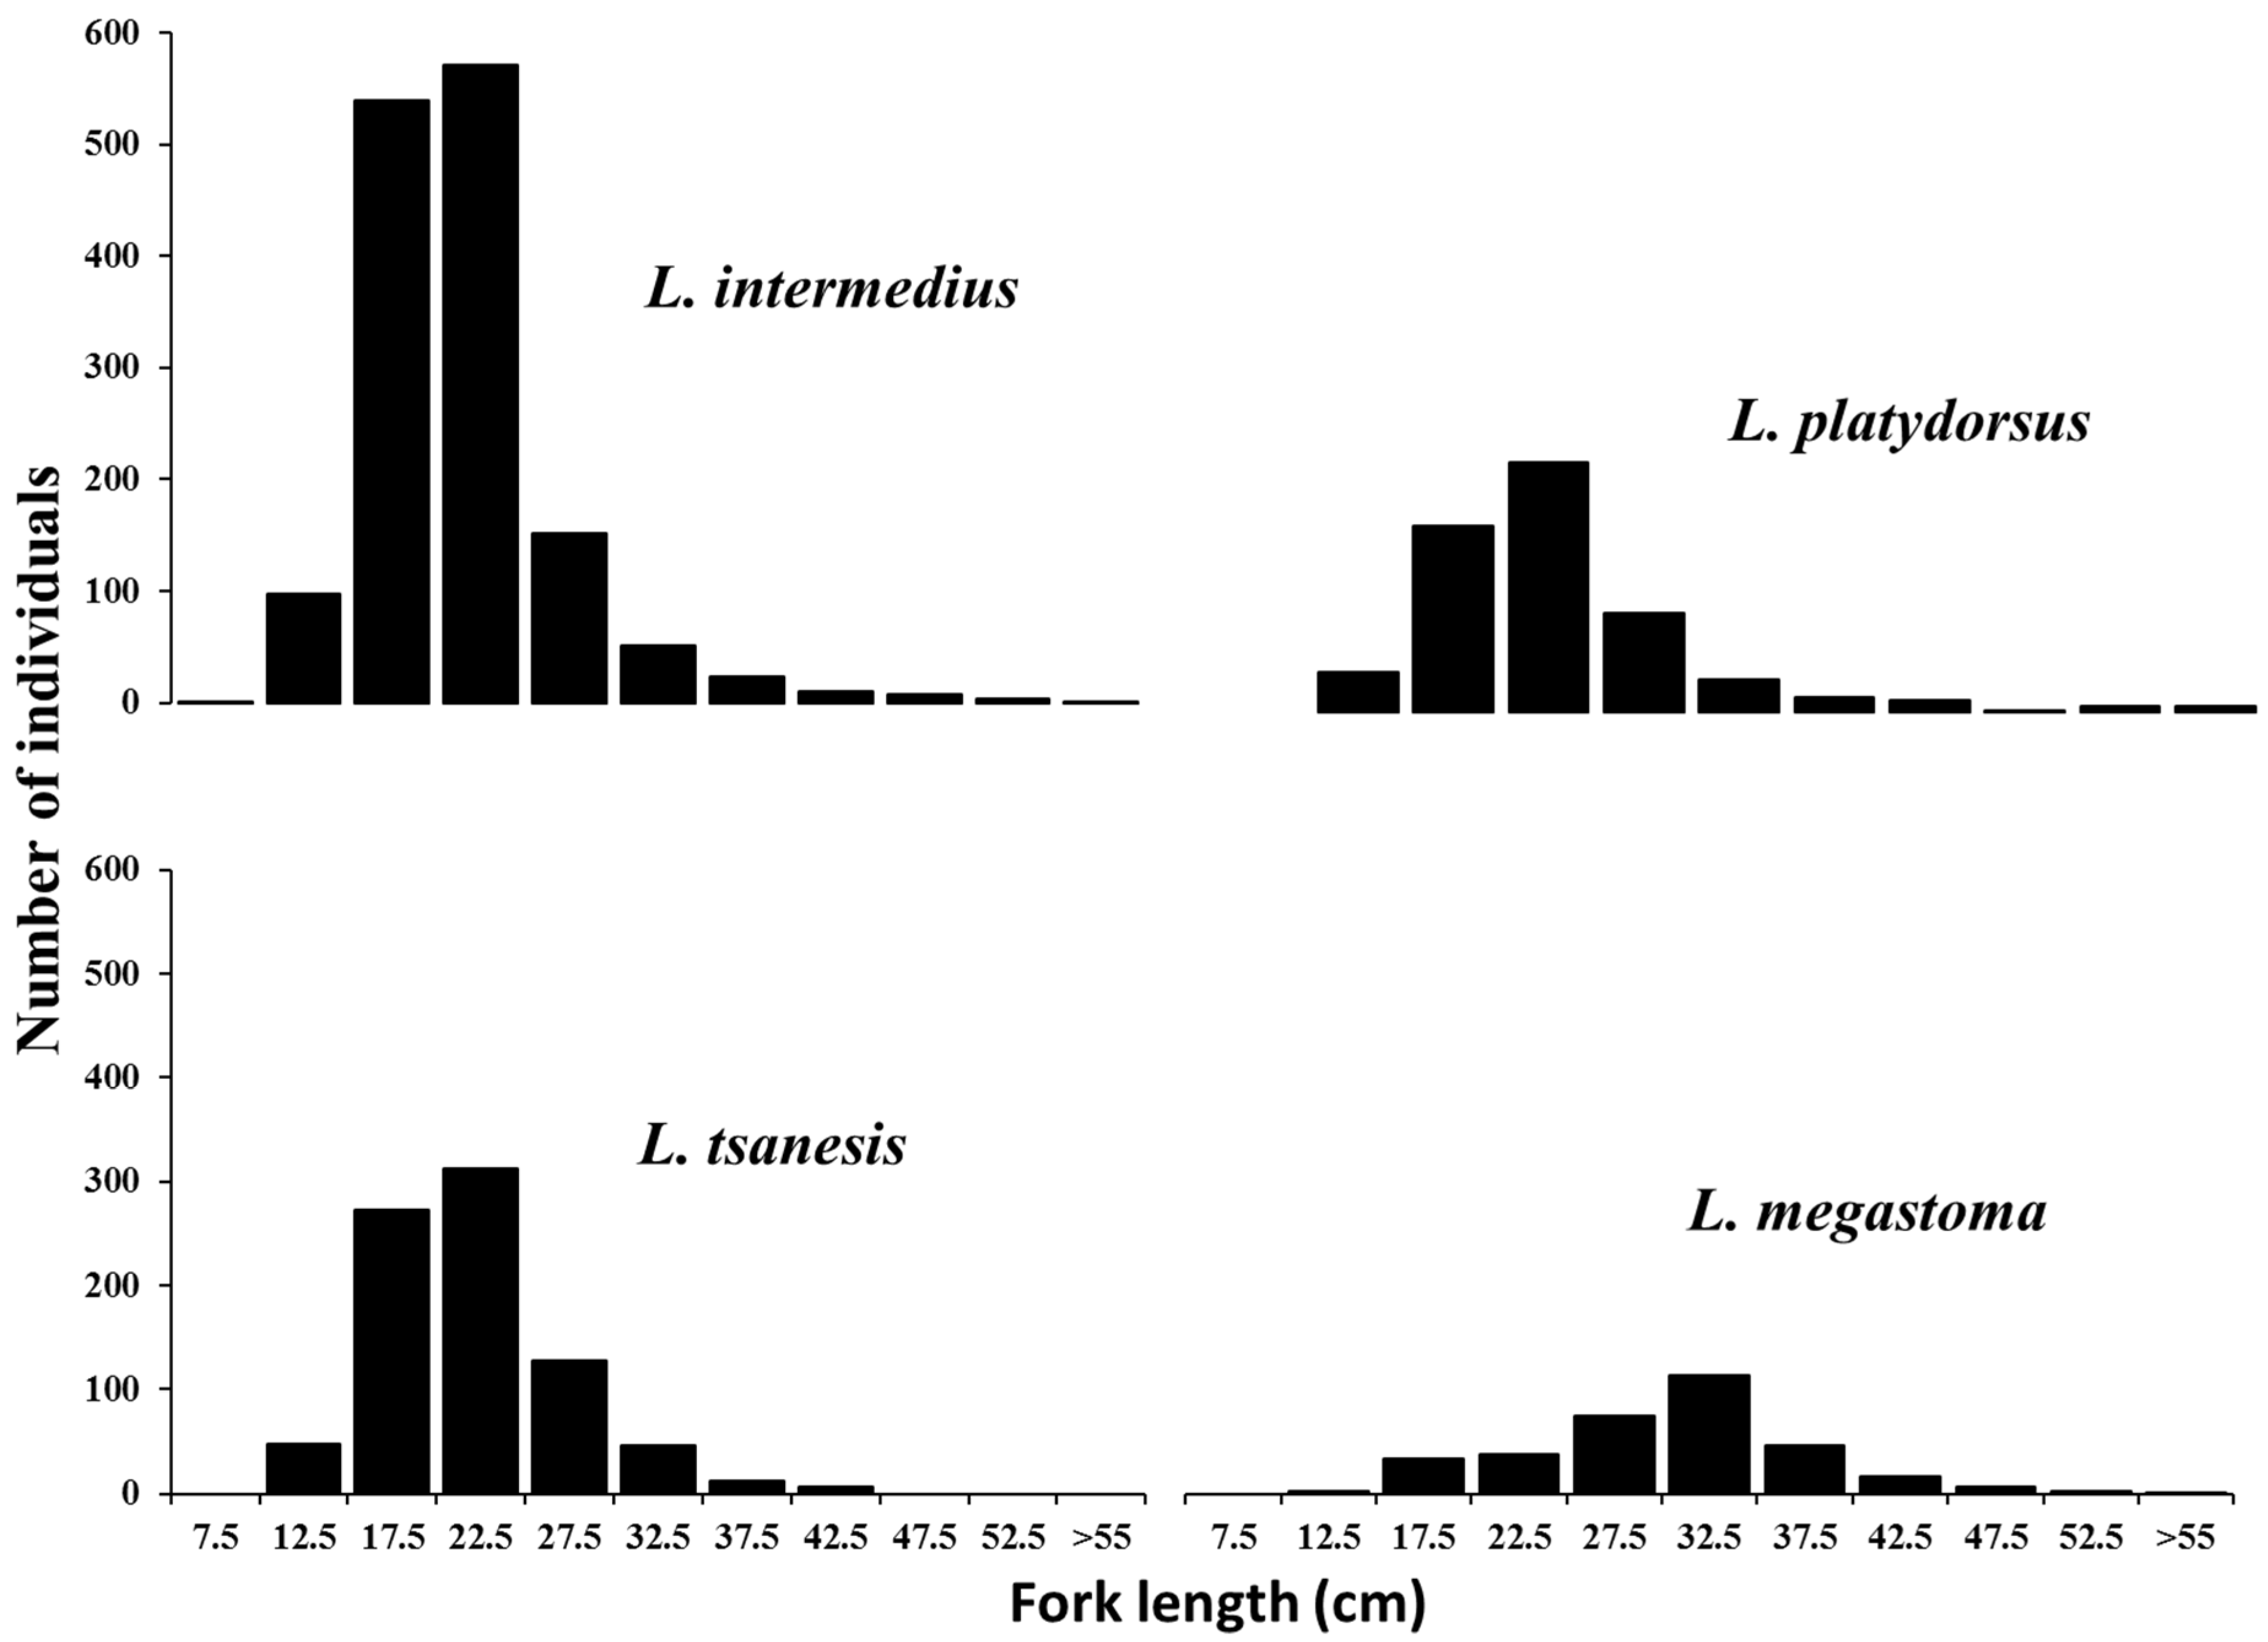
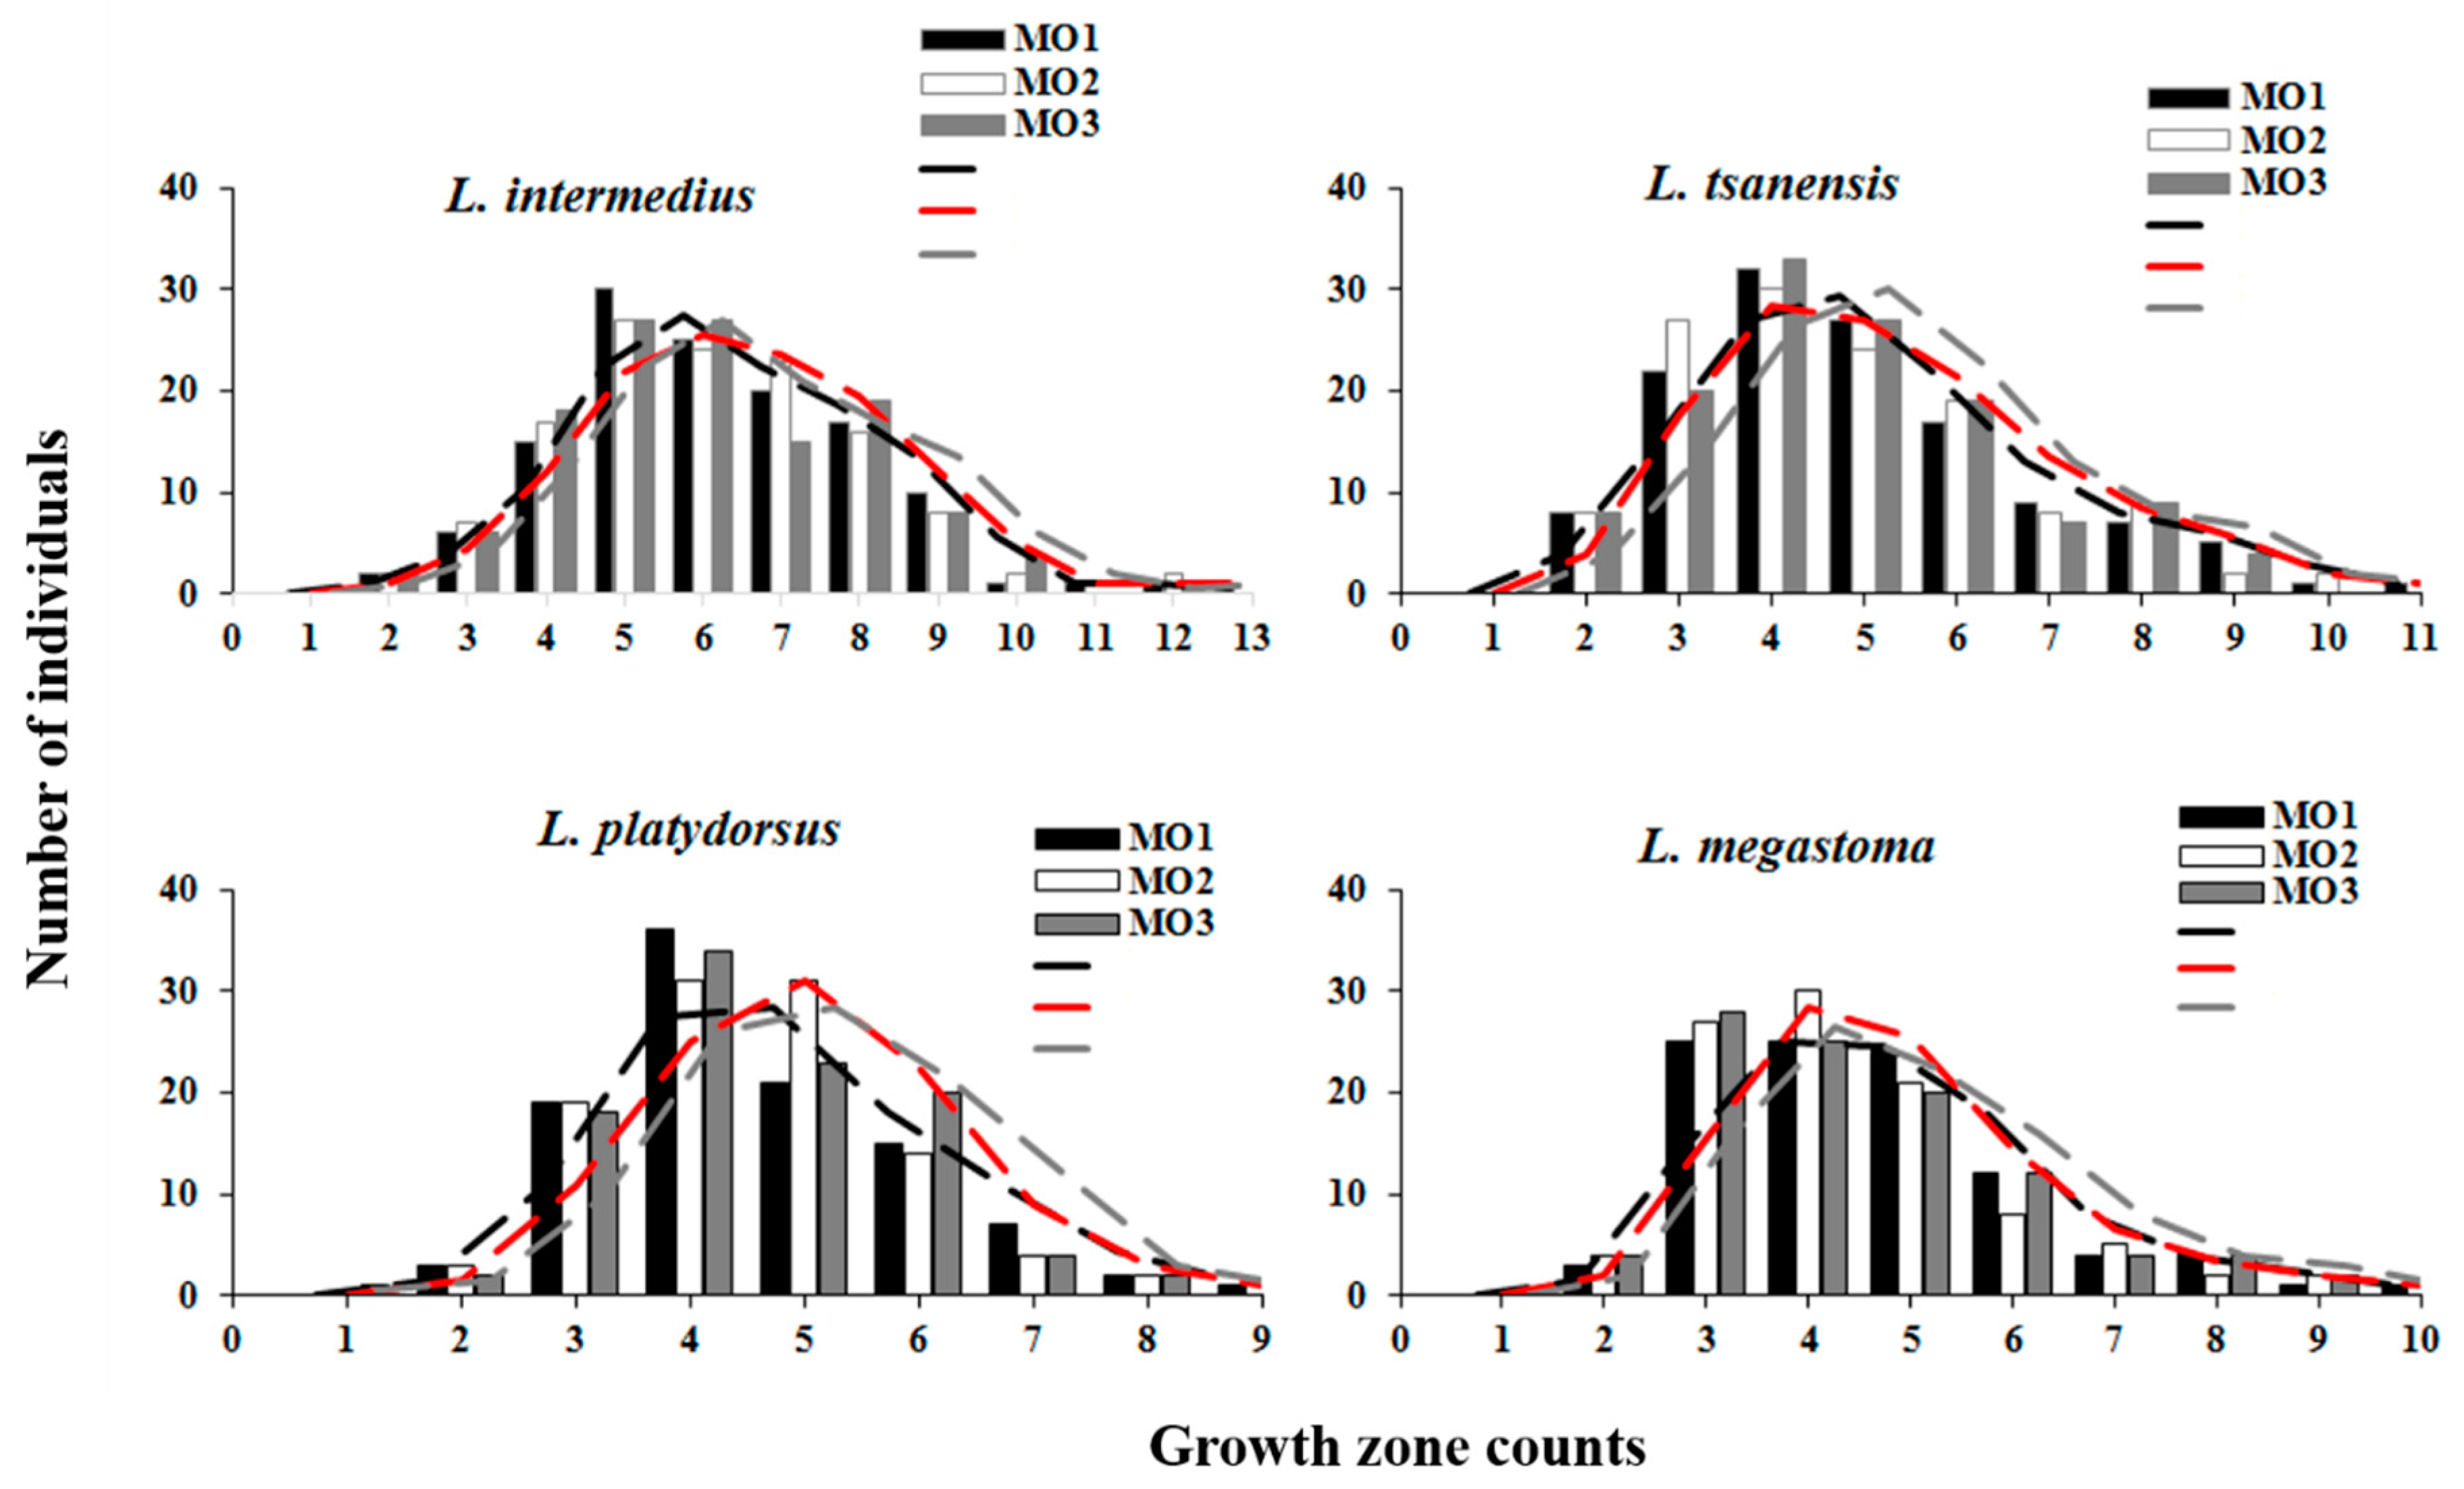
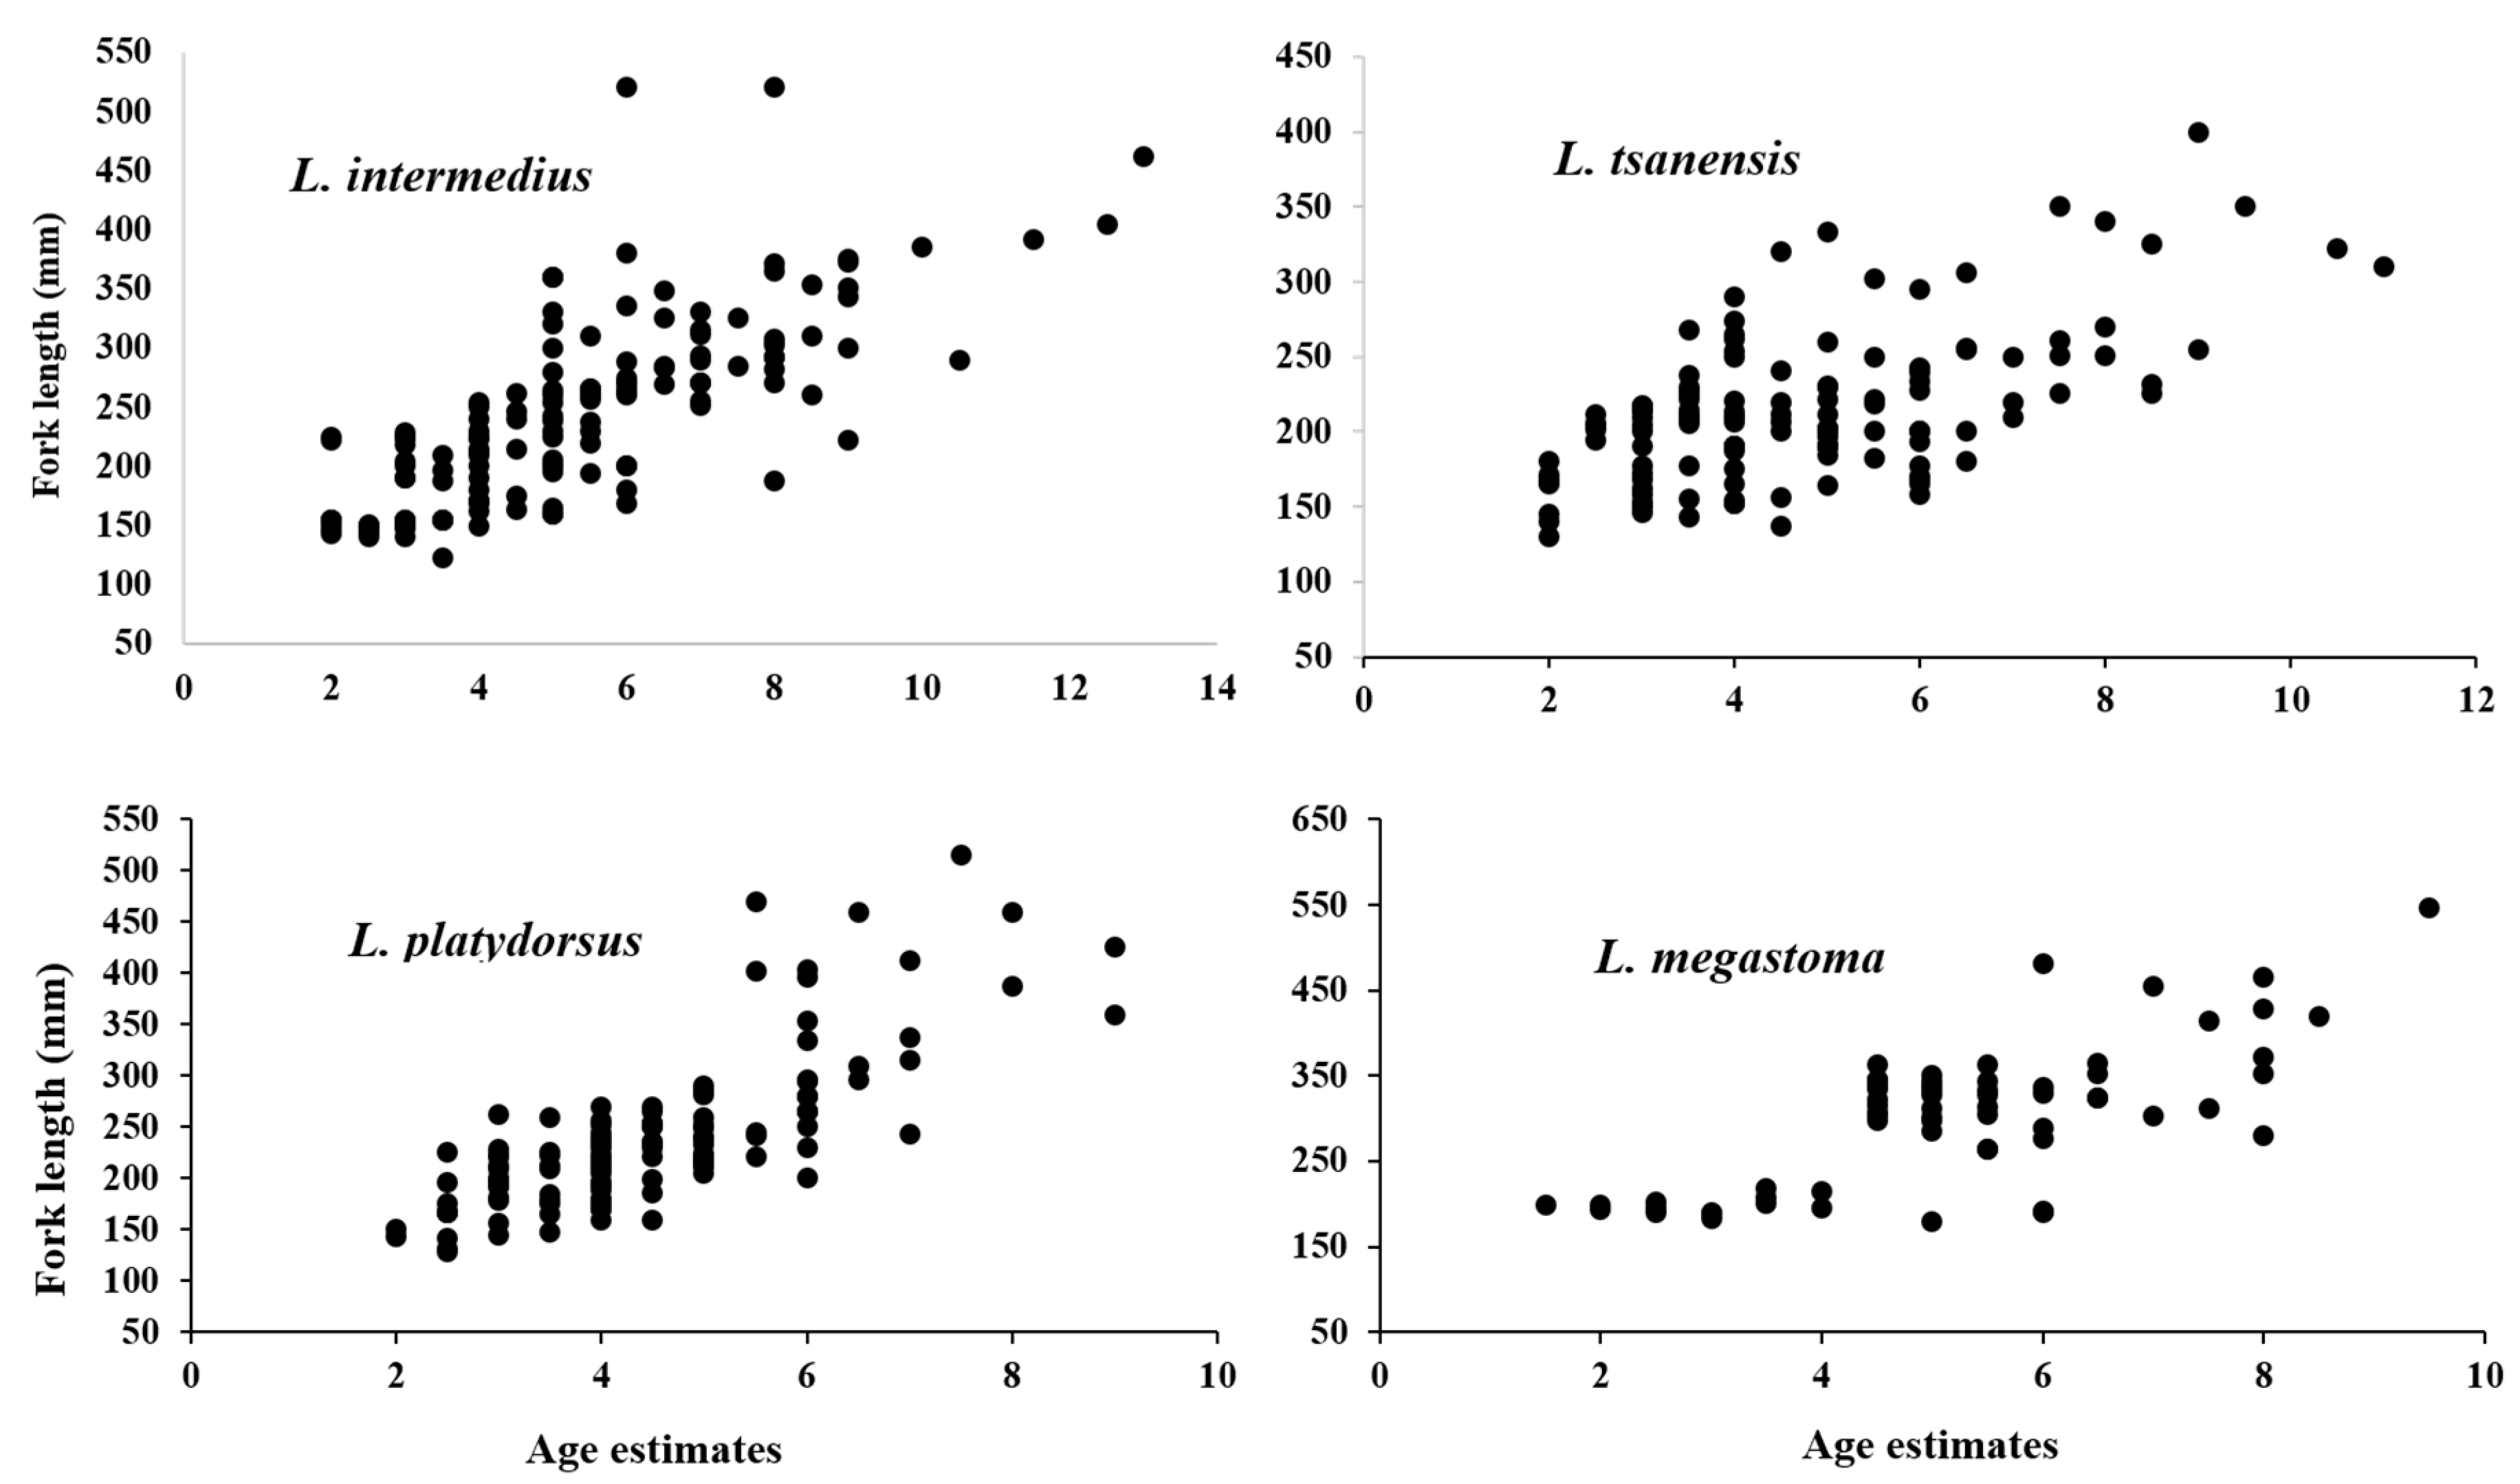
4.1. Length Frequency

Fish size ranged from 10–65 cm fork length (FL) for L. intermedius, 12–45 cm FL for L. tsanensis, 12–65 cm for L. platydorsus, and 12–57 cm for L. megastoma. The majority of the specimens of L. intermedius, L. tsanensis, and L. platydorsus were within the length groups of 15–20 cm (18 cm mid-length) and 20–25 cm (23 cm mid-length), while specimens with a fork length of more than 33 cm of were rarely caught (Figure 3). For L. megastoma, a high length frequency was recorded for specimens that were included within the length groups of 25–30 cm (28 cm mid-length) and 30–35 cm (38 cm mid-length), whereas specimens larger than 38 cm were rare (Figure 3).

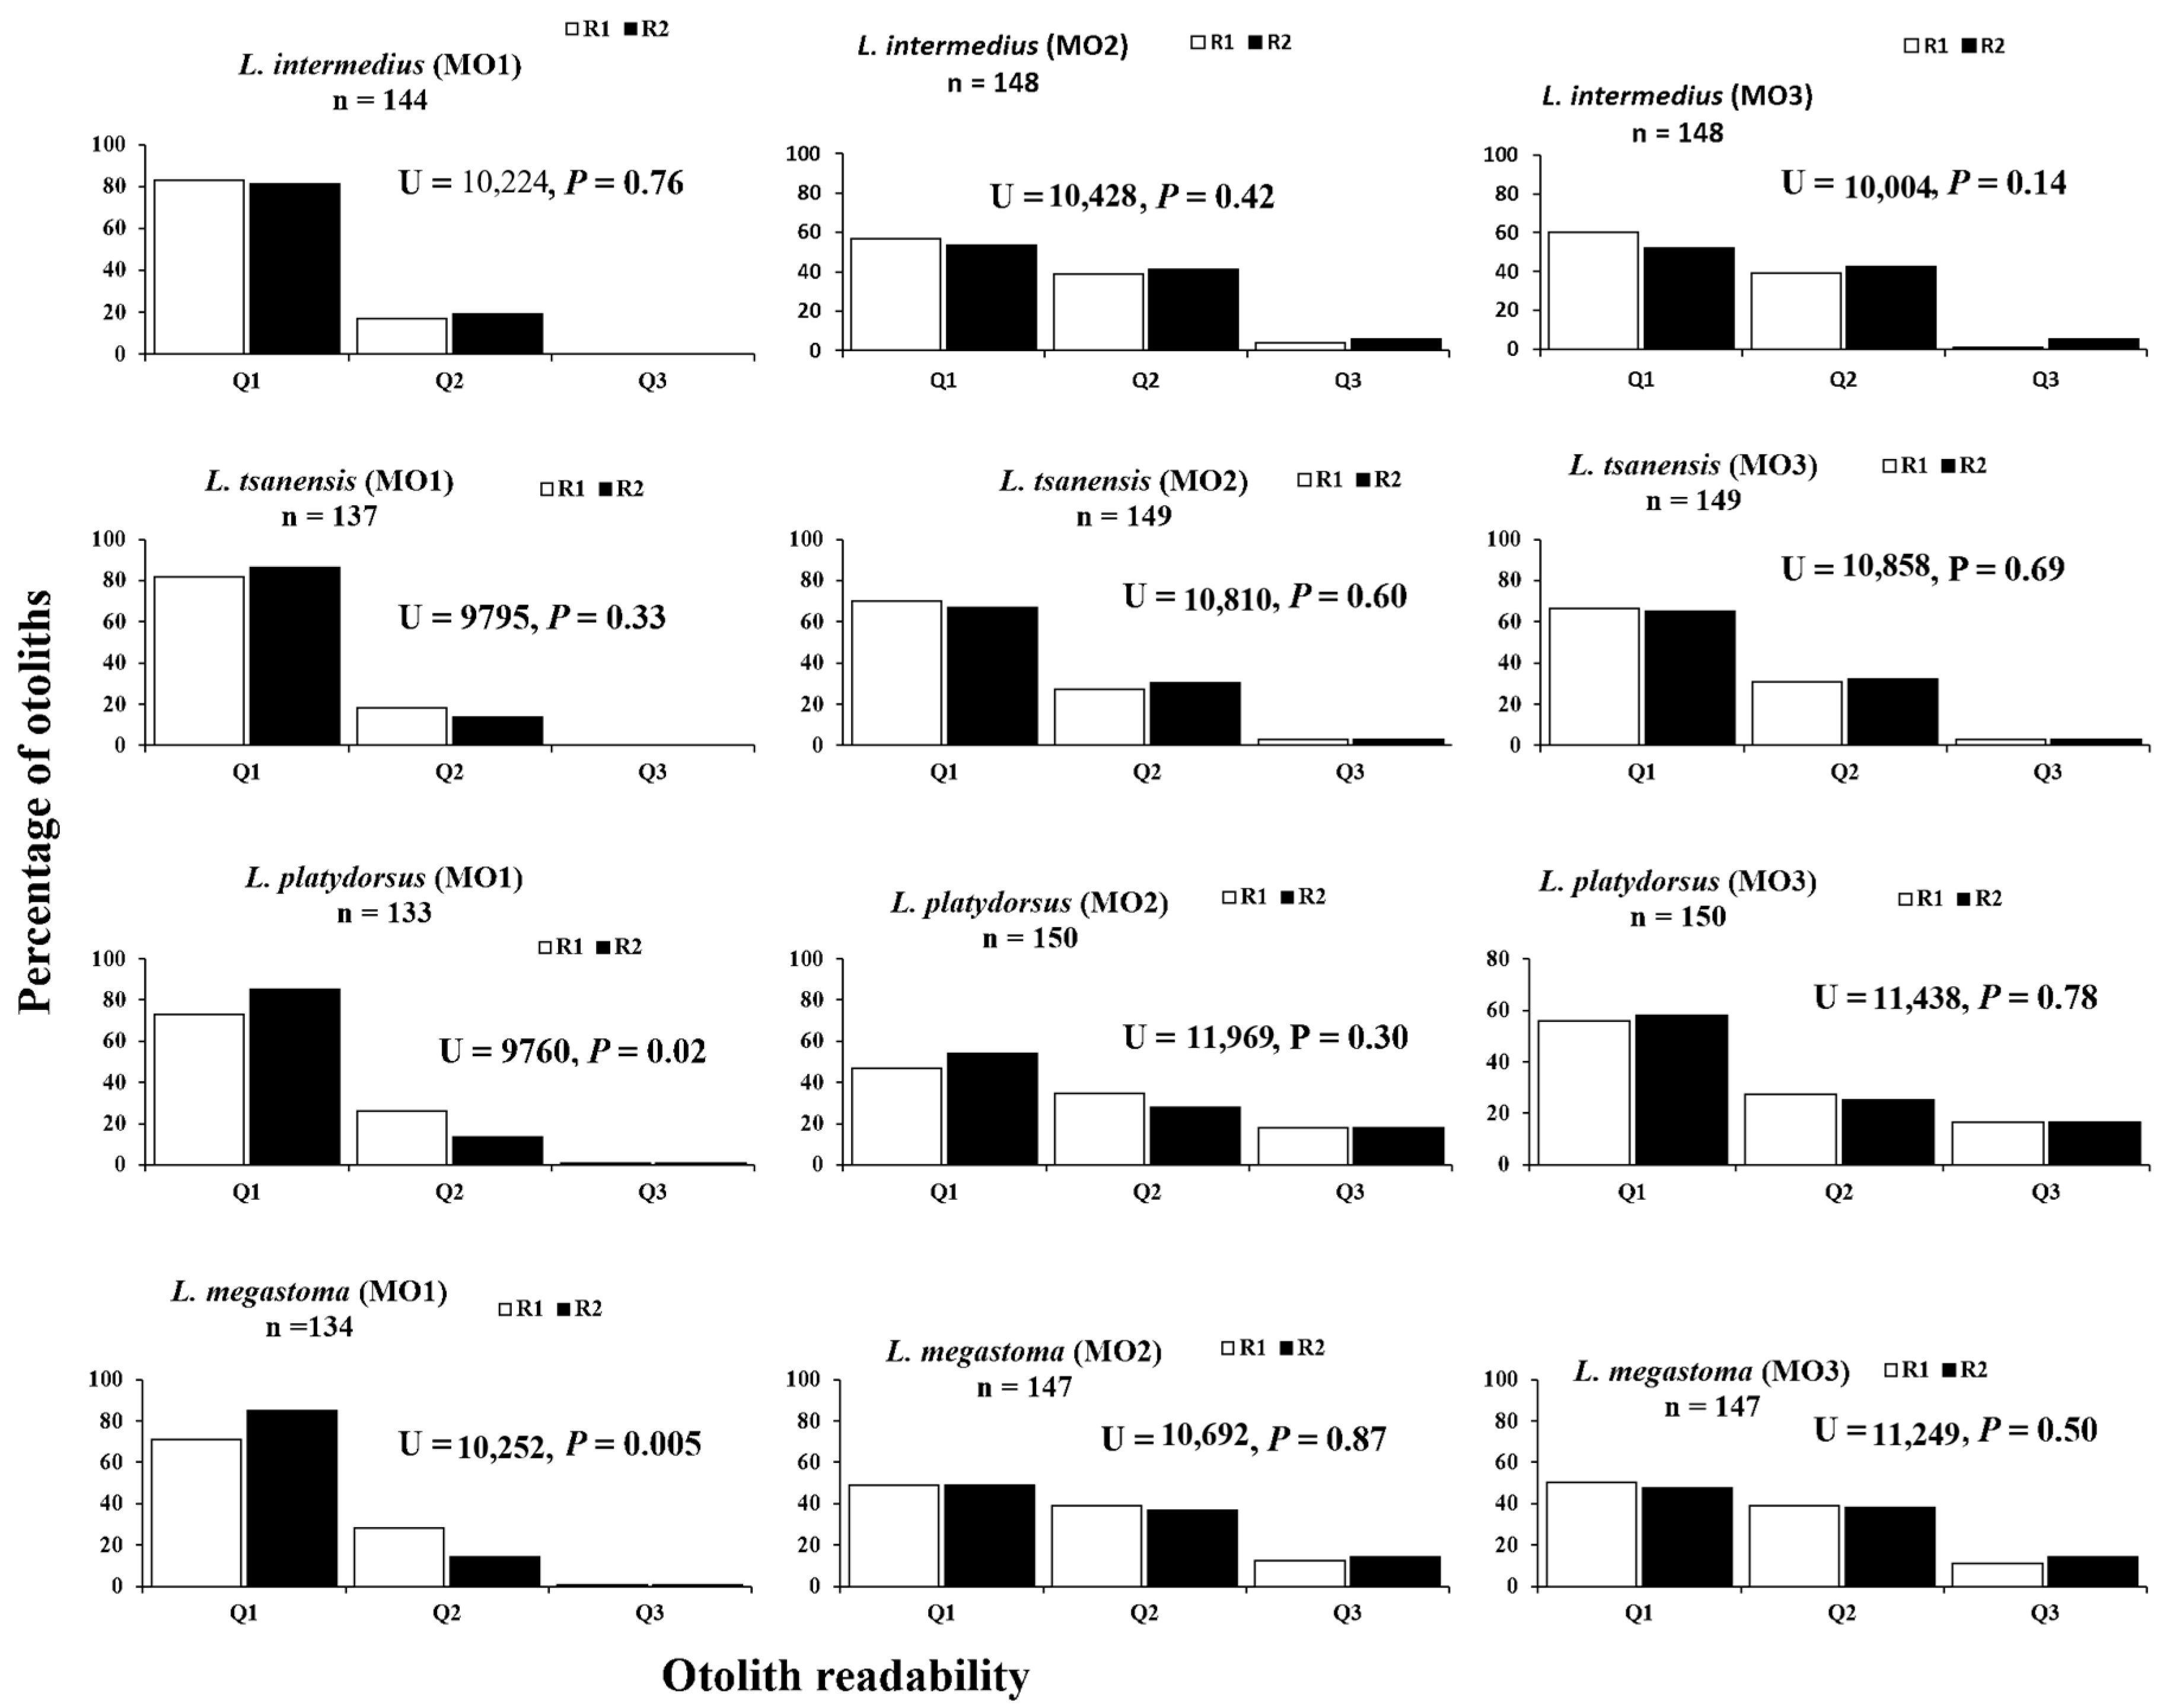
4.2. Otolith Readability

For both readers, otoliths prepared using MO1 resulted in higher readability than the other methods for the four species (Figure 4). Readability of the growth zones of otoliths prepared using MO2 and MO3 was inconsistent. It was often difficult to delineate the growth zones around most of the sections, which likely led to misinterpretations. Regarding the otoliths prepared using MO1, both readers were able to read the growth zones (Q1 and Q2) in 100% of the samples for L. intermedius and L. tsanensis and in 99% of the samples for L. platydorsus and L. megastoma, while there was a considerable number of unreadable (Q3) otoliths prepared by MO2 and MO3 (Figure 4). A Mann–Whitney U test indicated that the confidence rankings between readers for the three methods were not significantly different for L. intermedius and L. tsanensis (Figure 4). However, for L. platydorsus and L. megastoma, confidence rankings between readers for MO1 were significantly different. Confidence rankings among methods showed a significant difference (Table 1). For all four species, confidence rankings for MO1 were significantly different from the other methods, while there was no significant difference between MO2 and MO3 (Table 1). Therefore, the high level of readers’ confidence for MO1 likely led to a reliable count of growth zones with lower error levels.

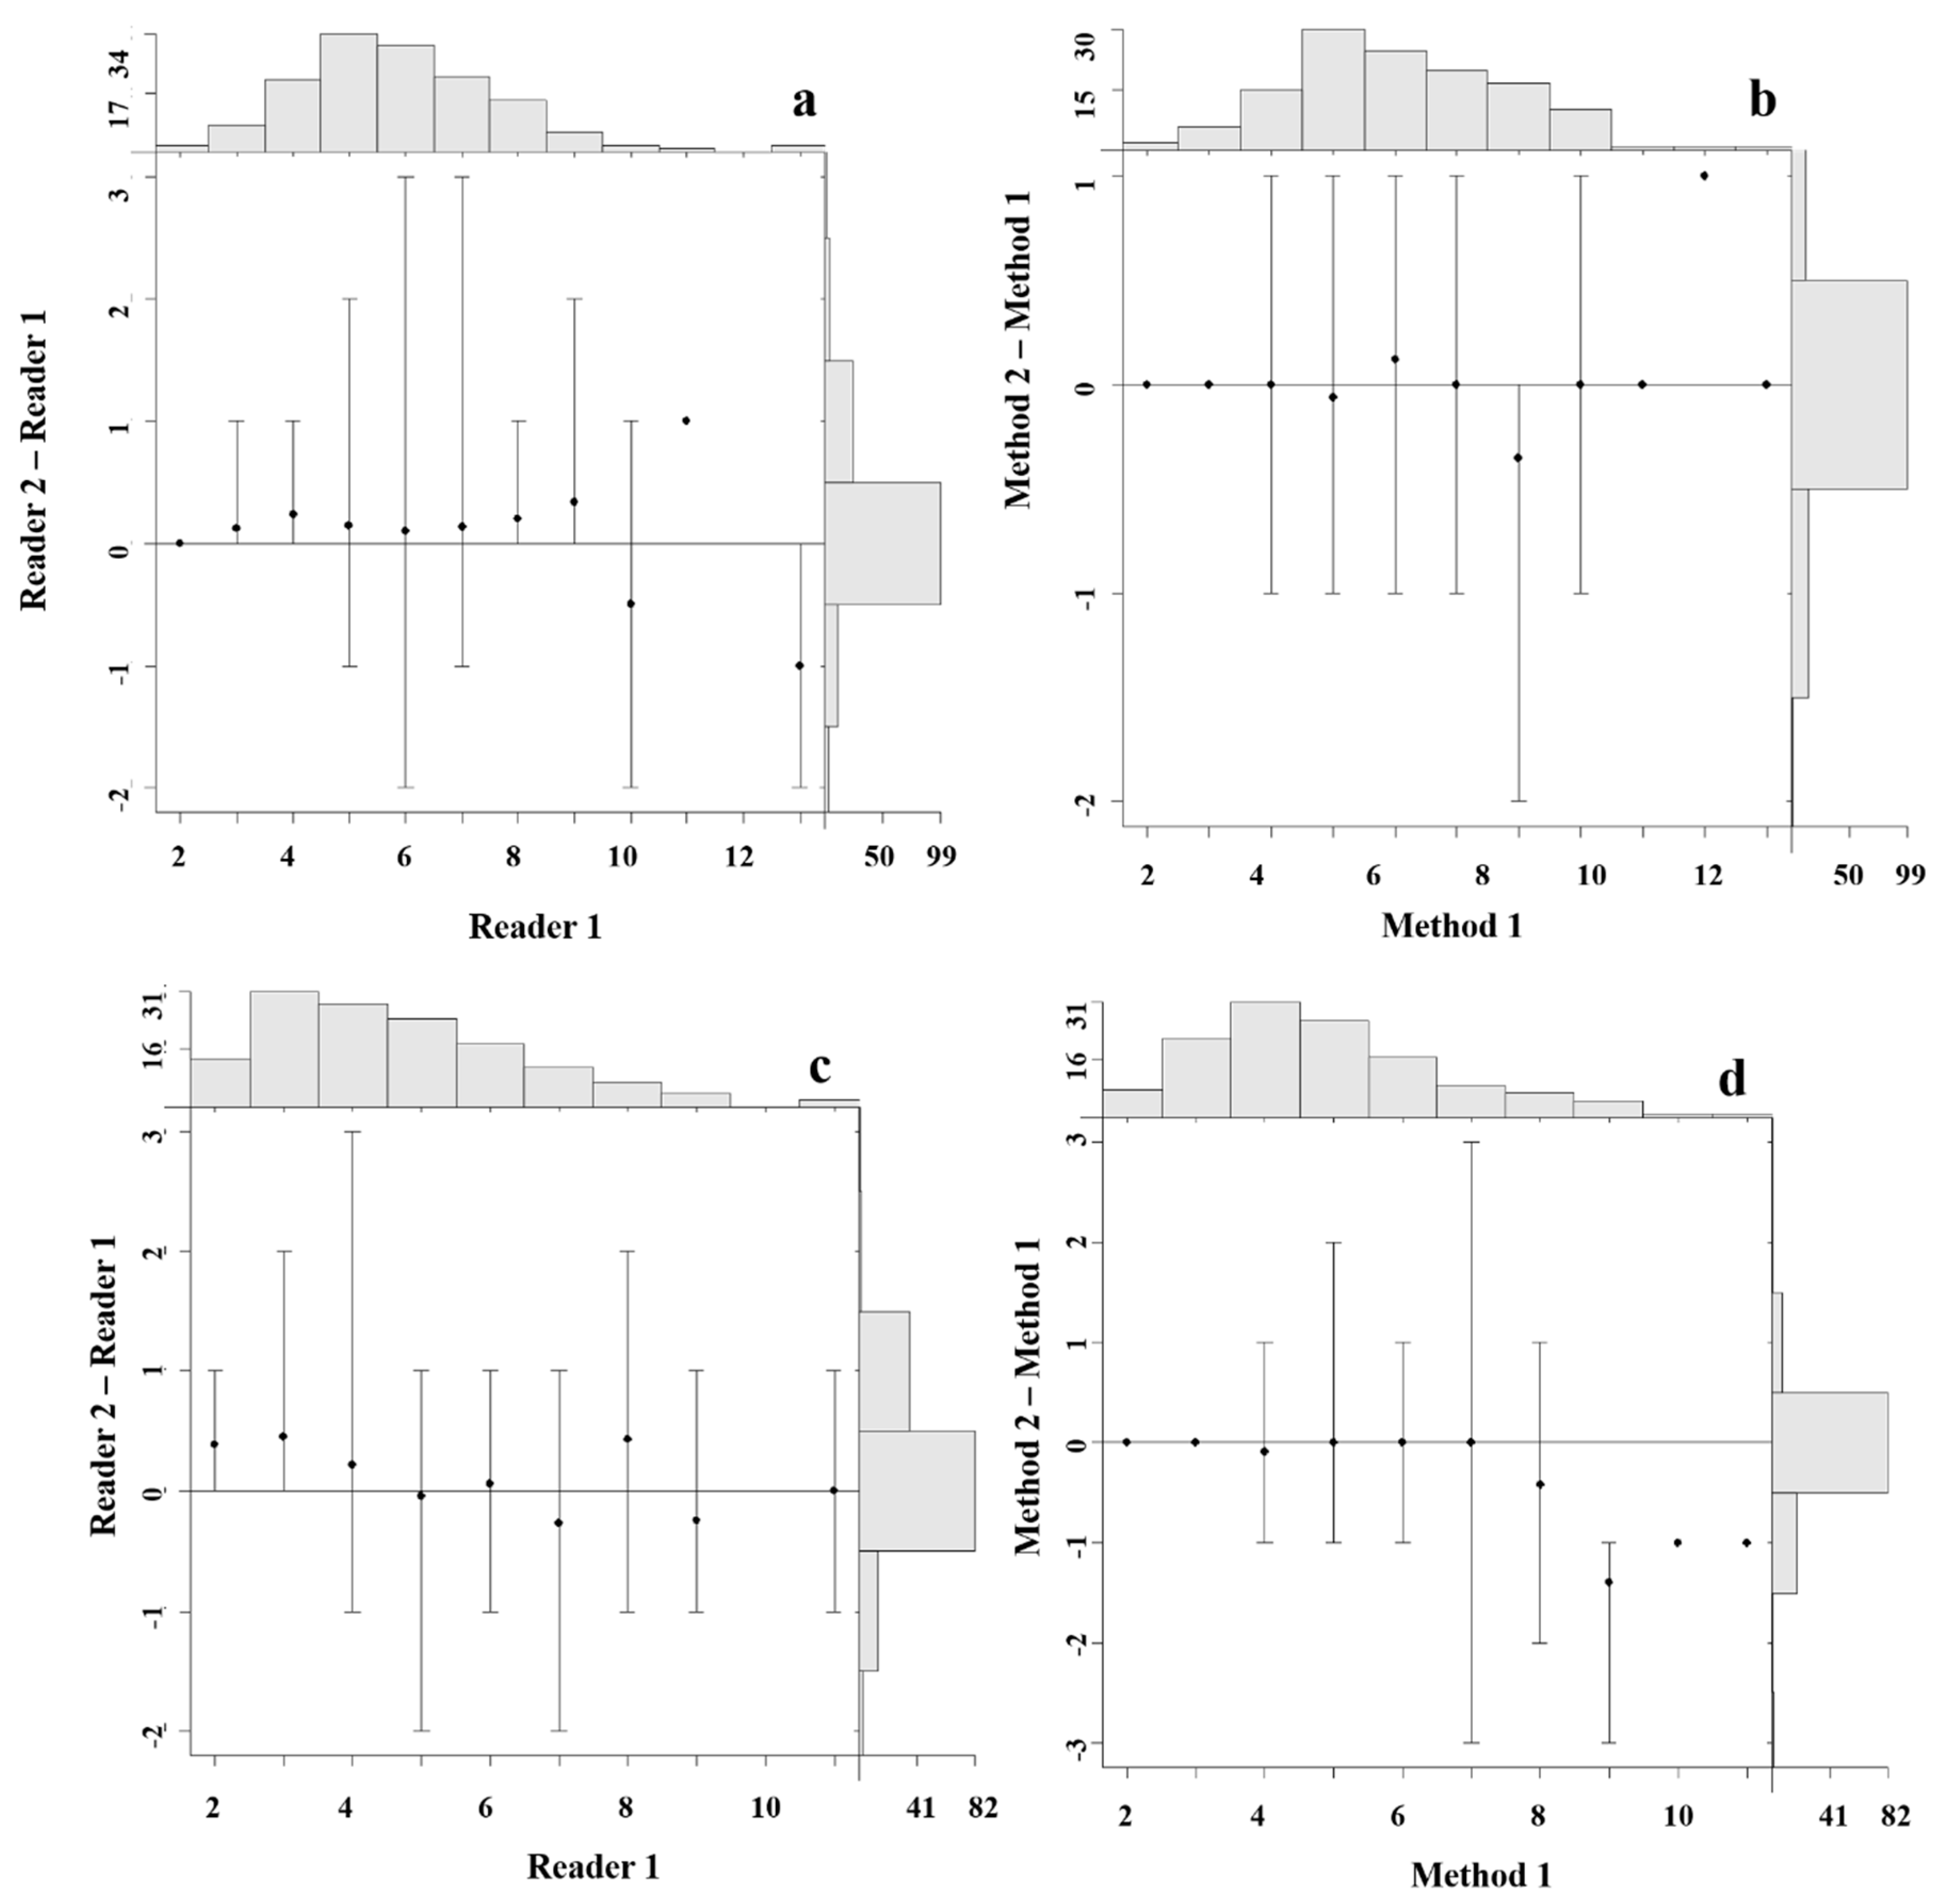
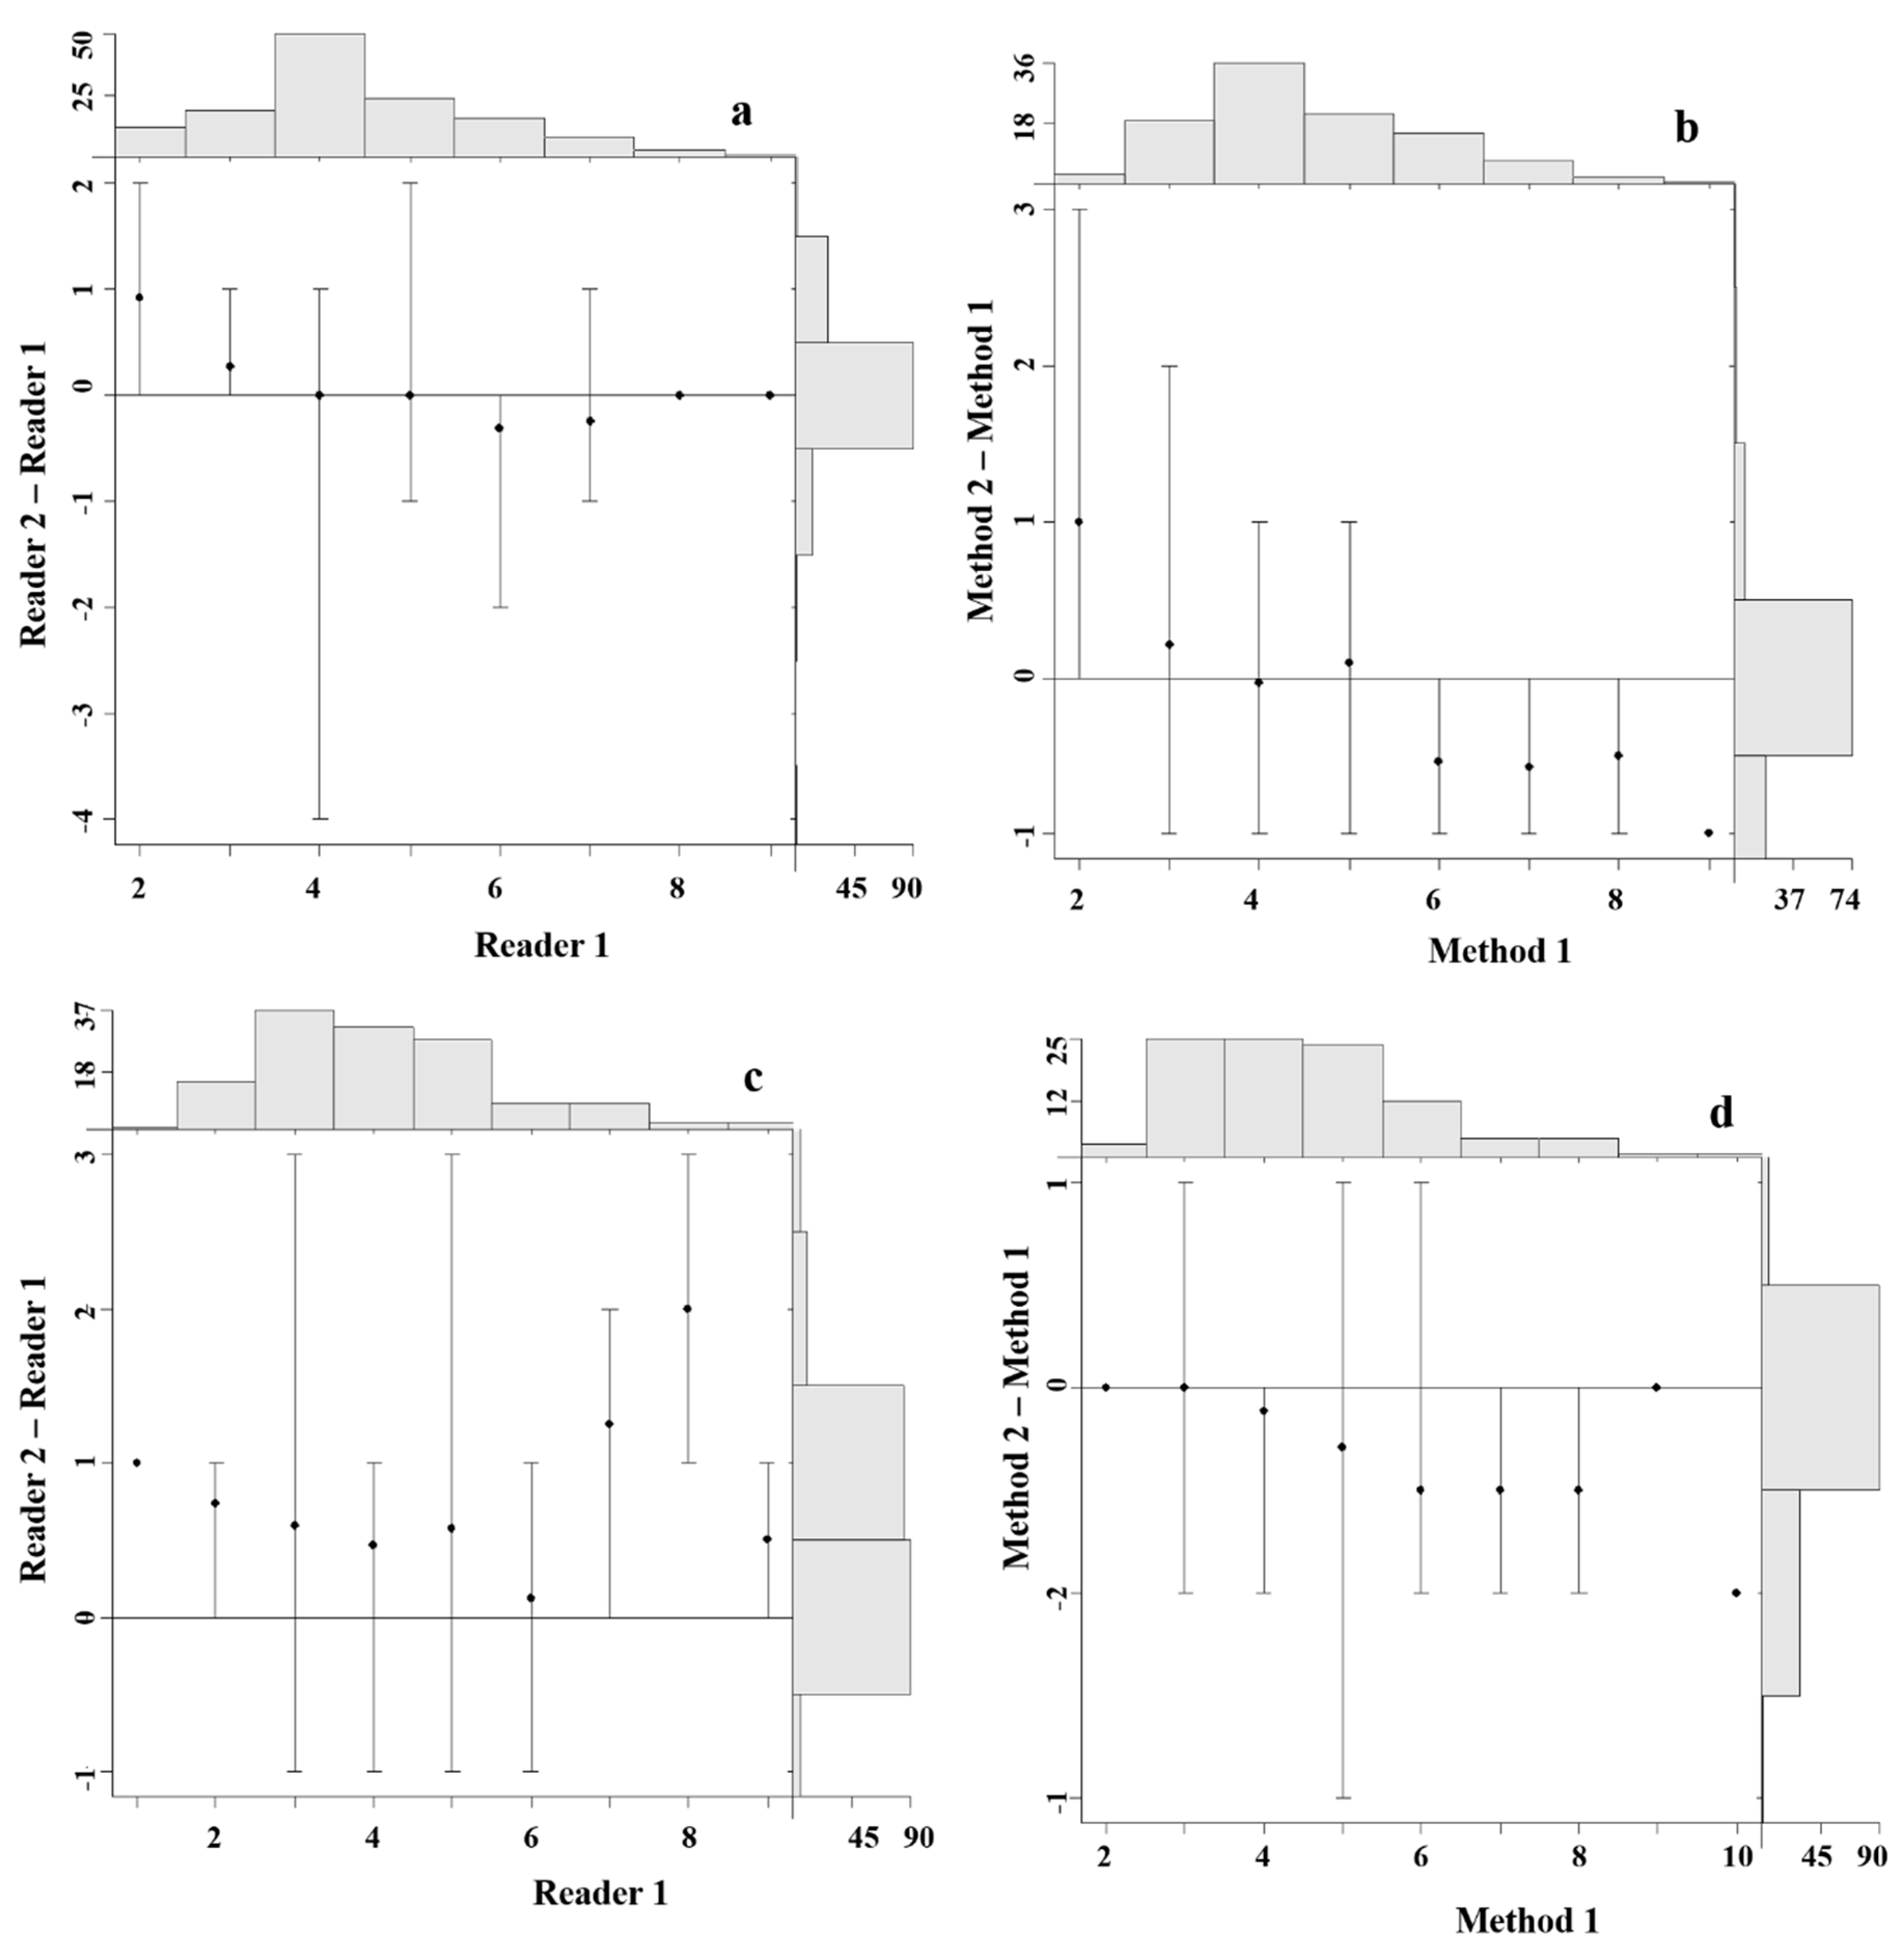
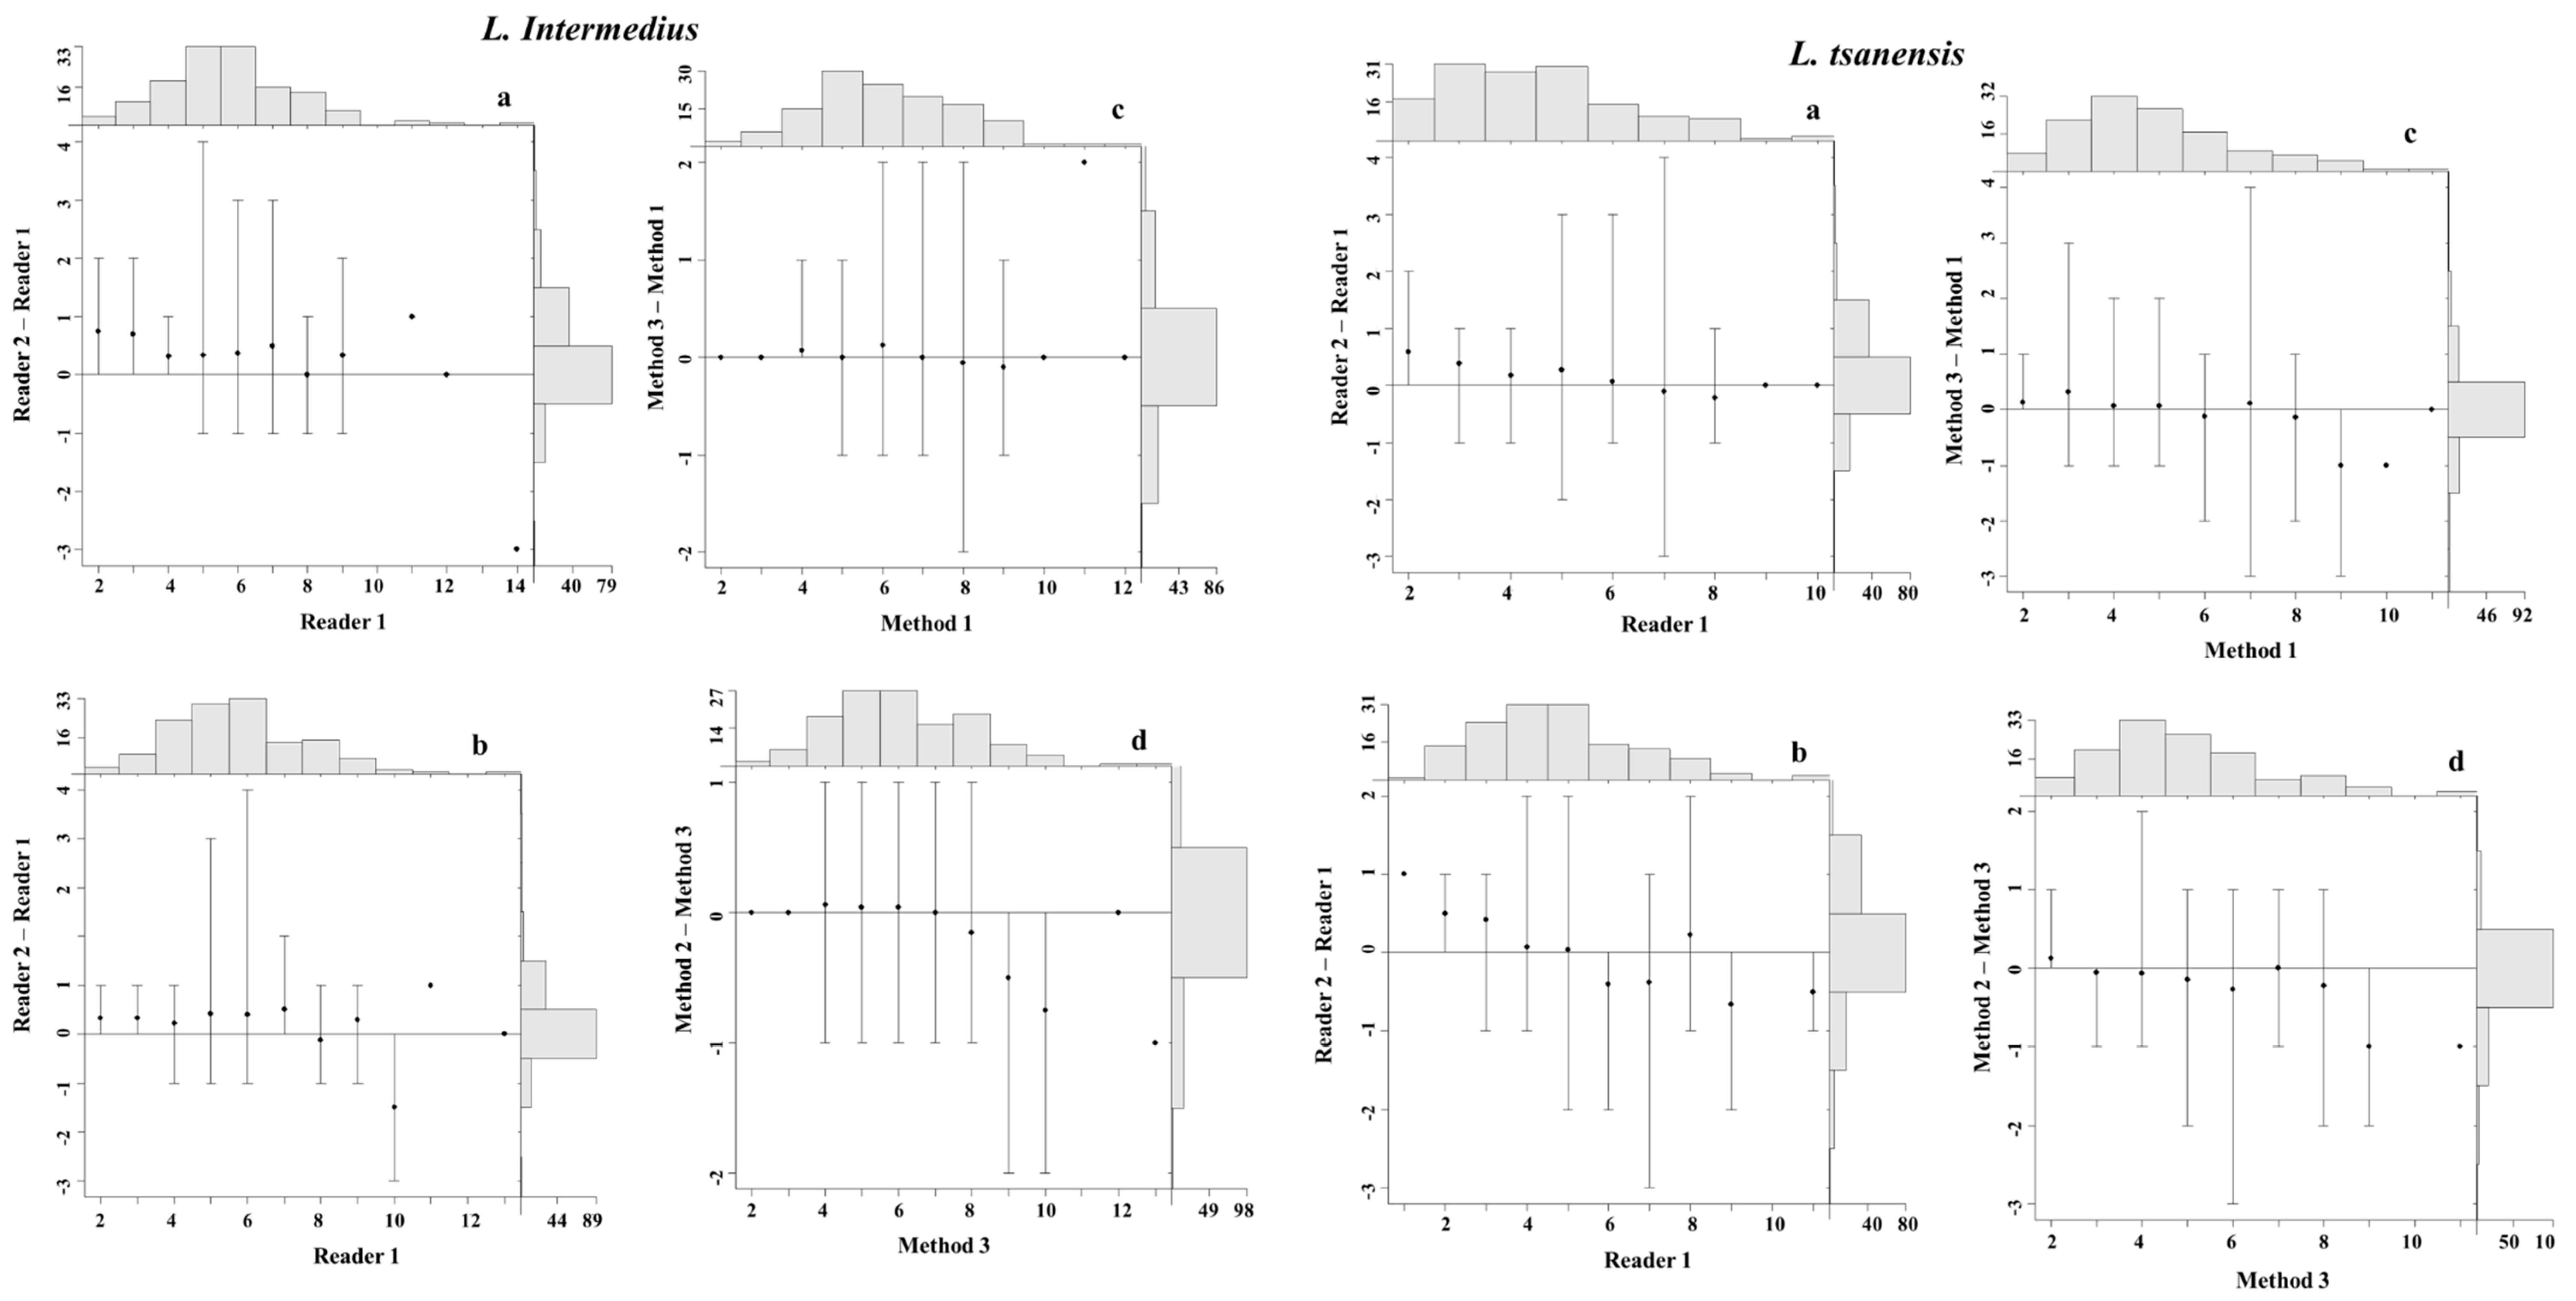
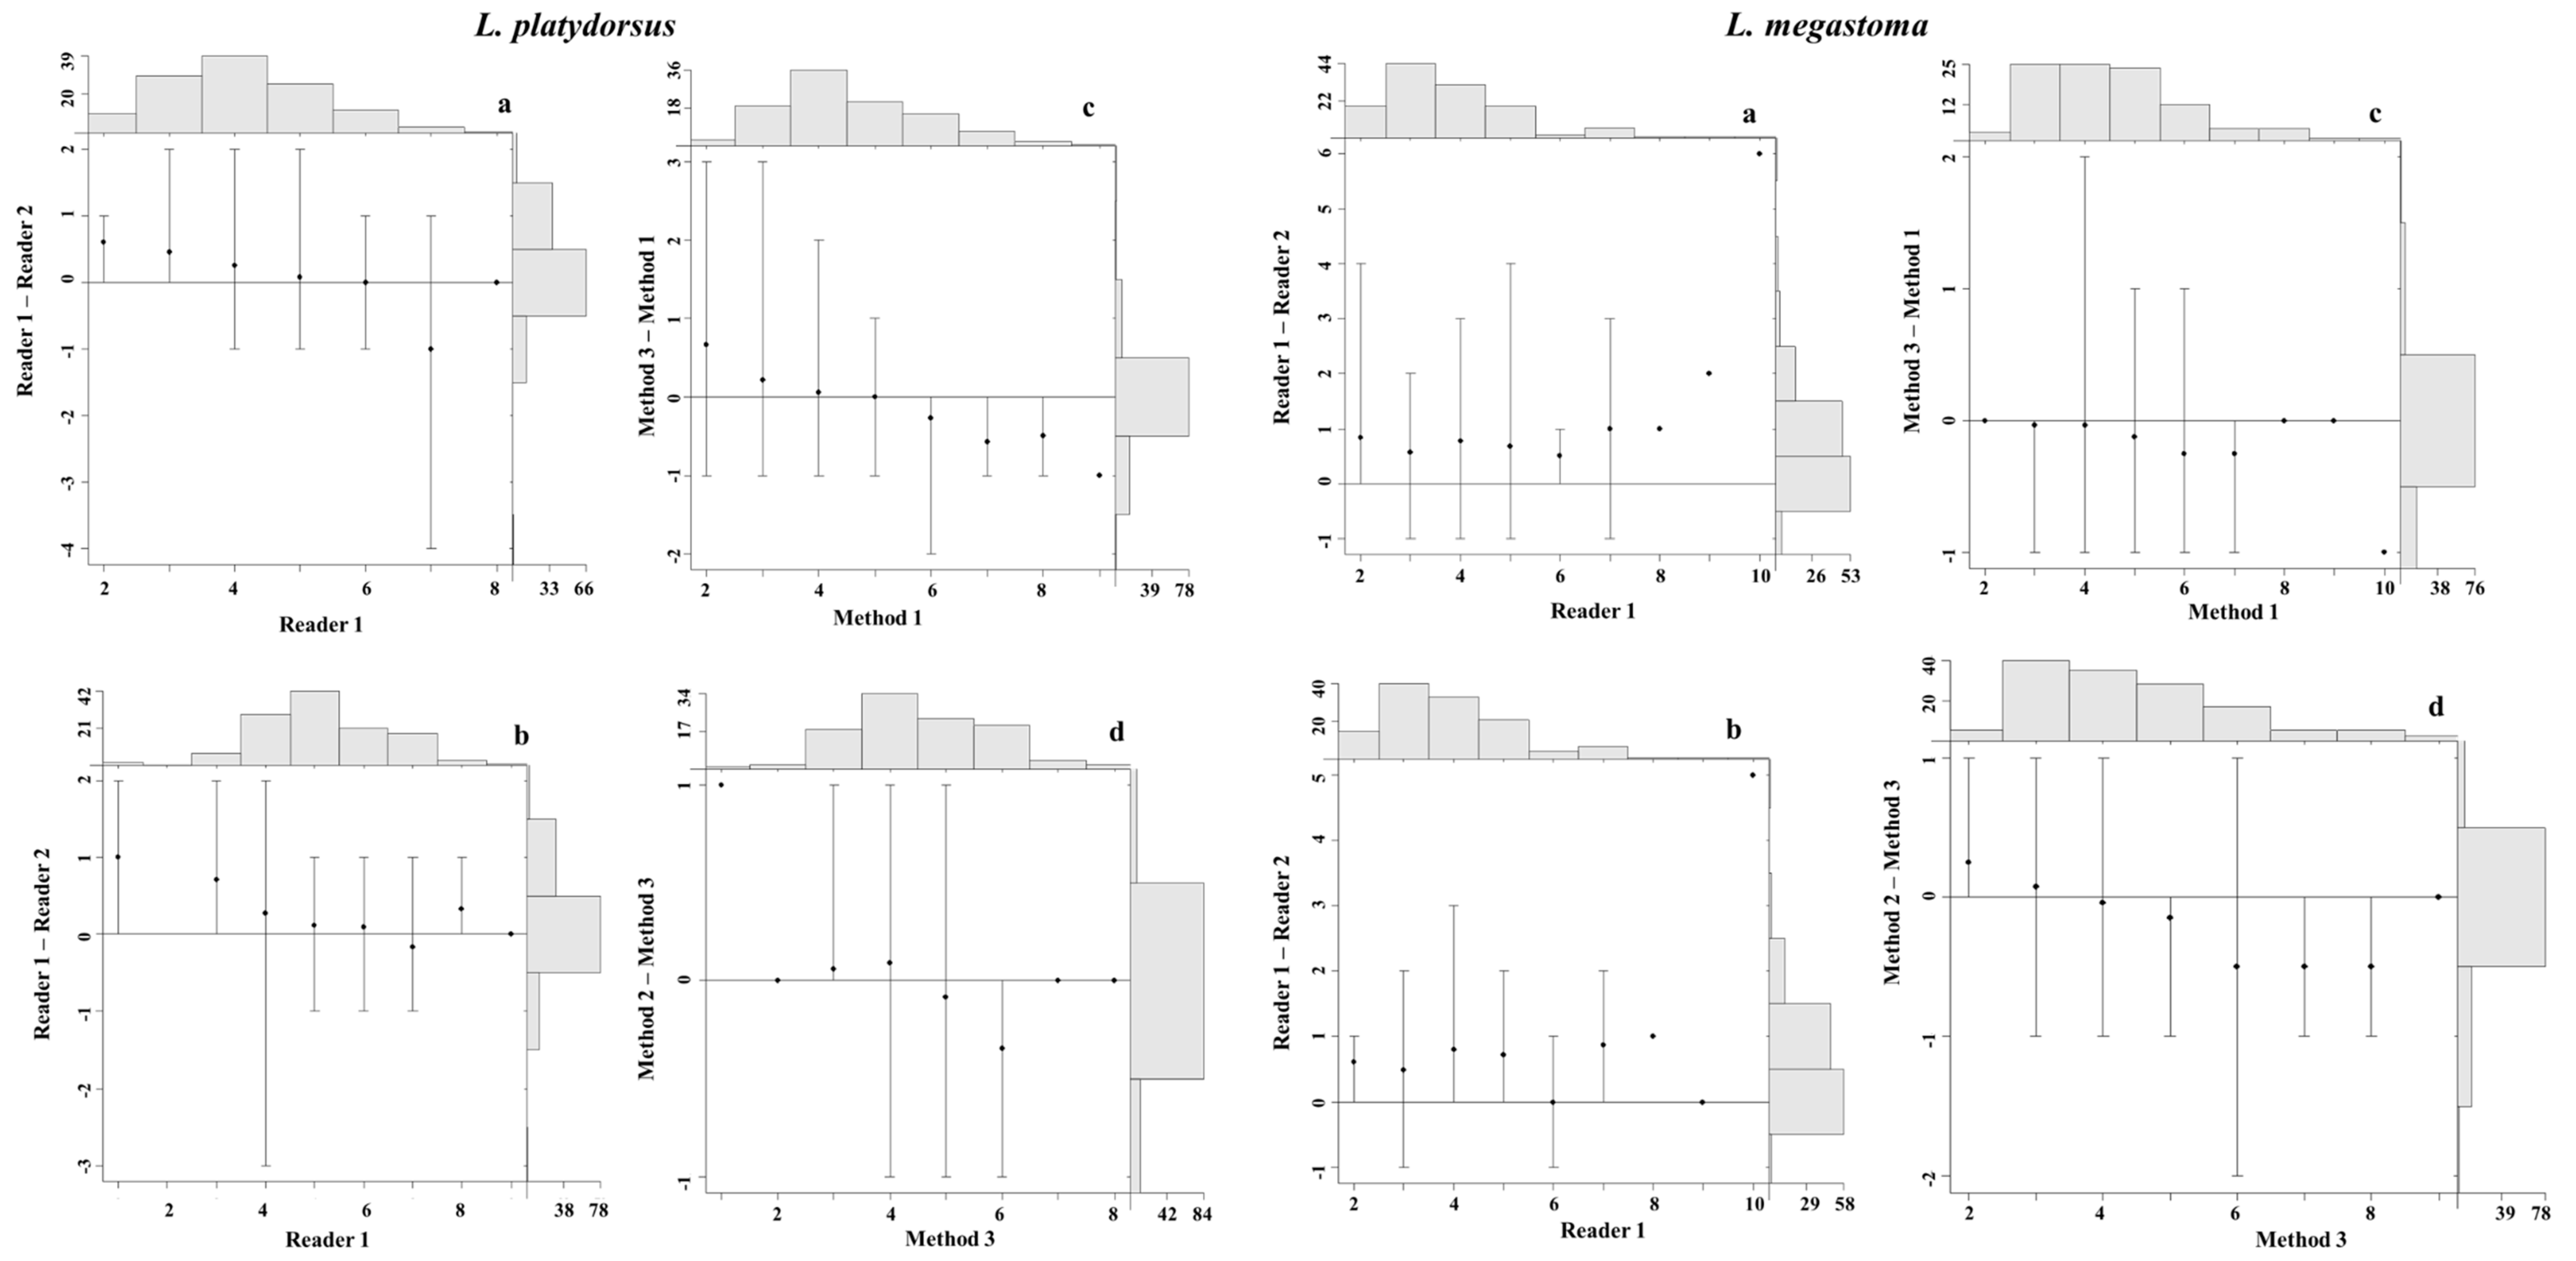
4.3. Precision and Bias between Readers

Age composition of the studied fish species based on the three methods did not exhibit large variation (Figure 5). Although growth zone counts distribution derived from MO3 was only slightly wider for L. intermedius, L. tsanensis, and L. platydorsus, while MO1 and MO2 resulted in the same growth zone counts distribution. For L. megastoma, growth zone counts distribution derived from MO1 was slightly wider than the other methods. Growth zone counts of 4 and 5 were dominant for L. tsanensis and L. platydorsus, while growth zone counts of 5 and 6 were dominant for L. intermedius, and 3–5 for L. megastoma. The relationship between length and growth zone counts for the four studied species is depicted in Figure 6.
The reproducibility and uncertainty of the growth zones counts from all three methods were evaluated by means of CV, APE, and PA with respect to comparisons between readers. The CV and APE values between readers were generally low for all methods for L. intermedius, L. tsanensis, and L. platydorsus, while these were relatively high for L. megastoma (Table 2). MO1 resulted in more precise age readings for L. intermedius, L. tsanensis, and L. platydorsus than did MO2 and MO3. This is indicated by the low CV and APE values (Table 2). For L. megastoma, MO1 and MO3 exhibited equal precision, while MO2 yielded relatively low precision (Table 2). In all three methods, the CV and APE values were the lowest for L. intermedius and generally the highest for L. megastoma. Growth zone count assignments by the two readers had a relatively poor percentage of agreement for all three methods and four species (Table 2). Compared with the PA of the other methods (Appendices Figure A1 and Figure A2), the PA between readers for MO1 was relatively high for L. intermedius (69%), L. tsanensis (60%), and L. platydorsus (68%). Additionally, the PA for MO1 at age 1 and ≥2 absolute differences, respectively, was low for L. intermedius (25%, 6%), L. tsanensis (34%, 5%), and L. platydorsus (29%, 3%) (Figure 7a,c, Figure 8a, histograms in the y-axis), while these values were relatively high for MO2 and MO3 (Appendices Figure A1 and Figure A2, histograms in the y-axis). However, for L. megastoma, the PA at age zero and 1 absolute differences was relatively the same for all three methods (Figure 8c and Appendices Figure A2, histograms in the y-axis). The PA for this species was low compared with the other species.
Overall, the mean non-reference growth counts did not significantly differ from each corresponding reference counts for all four species (paired t-test, p > 0.05). However, the mean difference between non-reference and reference growth zone counts (y-axis) plotted against the reference counts (x-axis) exhibited a minimal relative bias from the line of the agreement for each method and species (Figure 7a,c and Figure 8a,c and Appendices Figure A1 and Figure A2). For MO1, the mean non-reference growth zone counts for the young specimens of L. intermedius, L. tsanensis, and L. platydorsus were only slightly higher than the reference counts, but the reverse was true for the old specimens (Figure 7a,c, Figure 8c). However, for L. megastoma, mean non-reference growth zone counts for both the young and old specimens were higher than the reference counts (Figure 8c). In general, for L. intermedius, L. tsanensis, and L. platydorsus, differences from the line of the agreement were relatively small for MO1 (Figure 7a,c, Figure 8c) compared with the other methods (Appendices Figure A1 and Figure A2).

4.4. Precision and Bias among Aging Methods

The precision of age readings derived from the three methods for the four Labeobarbus species was generally good (Table 2). The lowest CV and APE values were computed from MO1 versus MO2 and MO2 versus MO3 for L. intermedius, L. tsanensis, and L. megastoma, while these values were low only between MO2 and MO3 for L. platydorsus (Table 2). The PA values between MO2 and MO3 were slightly higher than the other methods (Table 2). For all comparisons between methods, the discrepancy at a zero difference was high for all four species (Figure 7b,d and Figure 8b,d, and Appendices Figure A1 & Table A1, right, histograms in the y-axis), although the discrepancy at age 1 absolute difference was also high in some cases.
Even though there was no significant difference between the mean non-reference growth zone counts and each corresponding reference count (paired t-test, p > 0.05), the age bias plots for comparison of the three methods revealed a discrepancy from the line of agreement (Figure 7 and Figure 8 and Appendices Figure A1 and Figure A2, right). For most species, MO2 and MO3 underestimated the growth zone counts of old individuals relative to MO1. These trends were also apparent in plots of MO2 and MO3 counts of growth zones. Differences between the mean non-reference growth zone counts and the reference count increased with the number of growth counts for all three methods and four species. The discrepancy began at count 4 for L. megastoma, at count 6 for L. platydorsus, and at count 8 for L. intermedius and L. tsanensis (Figure 7 and Figure 8 and Appendices Figure A1 and Figure A2, right). This suggests that the level of count precision among methods could be lower when counting growth zone from old fish.

4.5. Statistical Comparisons of Growth Zones Counts between Readers and Methods

A one-way ANOVA test revealed no significant difference among mean growth zone counts derived from the three methods for all four species (L. intermedius, F(2, 381) = 0.04, p = 0.97; L. tsanensis, F(2, 384) = 0.23, p = 0.80, L. platydorsus, F(2, 309) = 0.05, p = 0.95; and L. megastoma, F(2, 294) = 0.48, p = 0.62). Except for L. megastoma, growth zone counts between readers for the three methods and three species were not significantly different (Table 3). This suggests that there was no significant count bias between readers, except for L. megastoma. Moreover, for L. intermedius, L. tsanensis, and L. platydorsus, there was no evidence of systematic disagreement for growth zone counts assigned between R1 and R2 using MO1 and MO3, while this was significantly different for L. megastoma (Table 4). However, the growth zone counts assigned between R1 and R2 using MO2 revealed symmetric bias for all four species (Table 4). No systematic bias in growth zone counts of the different methods was found, except those between MO1 and MO2 for L. megastoma (Table 4).
The regression and paired t-test analyses between readers and methods showed significant differences in some cases, generally indicating minimal bias between readers and methods (Appendix C). For MO2 and MO3, the slope and intercept of the linear regression between readers were significantly different from 1 and 0, respectively, for all four species, with the exception of the intercept for L. megastoma. Similarly, the mean difference of the paired readings for MO2 and MO3 showed a significant difference from 0 for the four species. However, for MO1, the slope and intercept of the linear regression between readers did not significantly differ from 1 and 0, respectively, for L. intermedius and the slope was not significantly different from 1 for L. megastoma. Additionally, the mean difference of the paired readings obtained from MO1 was not significantly different from 0 for L. platydorsus. Between readers, the mean paired difference for the four species was generally small for MO1 (<0.18), compared with MO2 and MO3.
With respect to the methods, the slope and intercept of the linear regression between MO1 and MO2 showed a significant difference from 1 and 0, respectively, for L. tsanensis, L. platydorsus, and L. megastoma. Similar results were observed from the regression analyses between MO1 and MO3 for L. tsanensis and L. platydorsus and between MO2 and MO3 for all four species. The comparisons between methods did not reveal significant mean paired differences from 0 for most of the cases (Appendix C).

5. Discussion and Conclusions

Age estimation based on the interpretation of growth zones usually involves judgment and subjective interpretation [19]. Errors in age determination are mainly related to the inconsistent periodicity of growth zones and systematic errors due to the validity of the otolith preparation method, interpretation problems of the aging structure, or experience level of age readers [21,37,38]. The latter could be minimized by describing a precise and accurate otolith preparation method [19]. The precision of otolith preparation methods can be computed using graphical and statistical methods, while a validated method for all age groups in the population is required to estimate accuracy [39]. Because validating all the proposed otolith preparation methods for all different age groups in the population is logistically challenging, it may be more efficient to select the most accurate technique first. The best method should, therefore, be validated for the rate of growth zone formation.
The process of growth zone formation is affected by a combination of factors including physical, chemical, environmental, and physiological aspects. Depending on these factors, different otolith preparation techniques may be considered as optimal [40]. Consequently, optimal otolith preparation techniques differ markedly among species. In order to assist the fisheries biologists and managers in selecting the best technique, we compared different otolith preparation techniques for the Labeobarbus species in Lake Tana. Selection of the appropriate otolith preparation method is dependent on the balance between readability (ease of annulus interpretation) and consistency (repeatability of growth zone counts) of the aging structures [41]. In this study, selection of the most suitable otolith preparation methods, out of the six evaluated methods, was undertaken based on clarity and contrast of the images. These methods that produced distinguishable growth zones, core, and edge were selected and compared to find the optimal method. Three methods including (1) the method using sectioned otoliths, (2) the method using stained otoliths, and (3) the methods using whole otoliths submerged in water and remained in the water to take the image did not produce readable structures and were omitted from the comparison, while the other three methods (MO1, MO2, and MO3) produced distinguishable growth zones, core, and edge. Similar to the findings of this study, problems with sectioned asteriscus otoliths to produce clear and readable growth zones were reported in previous studies [31,42,43,44,45,46]. Higher readability and consistent age estimates were produced from whole asteriscus otoliths immersed in methyl salicylate than sectioned otoliths [43,45]. Furthermore, both whole and sectioned asteriscus otoliths from Cyprinus carpio resulted in similar interpretation [47], but the authors noted that sectioned asteriscus otoliths obscured the visibility of opaque zones close to the margin.
A comparison of growth zone counts from the three suitable otolith preparation methods within this study revealed that MO1 produced readable and consistent results for L. intermedius, L. tsanensis, and L. platydorsus in Lake Tana. Concerning the reproducibility of growth zone counts derived from MO1 by the two readers, the CV and APE values for L. intermedius, L. tsanensis, and L. platydorsus were lower than the average values in the literature (CV 7.6%, APE 5.5%) [19], while these values calculated from MO2 and MO3 were slightly higher for most species. For L. megastoma, the CV and APE values between readers for the three methods were relatively high compared with average values in the literature. With respect to the methods, the CV and APE estimates were lower than the average values in the literature for the four species. The precision of the comparison between methods was generally higher than the precision of the readers. Additionally, except for L. megastoma, the count bias plots between readers for MO1 revealed less bias relative to MO2 and MO3. Furthermore, MO2 and MO3 underestimated actual growth zone counts, particularly for old individuals, relative to MO1. This is most likely because of the poor clarity of the images, suggesting that using these methods for precise and accurate growth zone counts of the Labeobarbus species is difficult. In contrast, the precision estimates and count bias plots indicated that MO1 provides consistent counts of growth zones for L. intermedius, L. tsanensis, and L. platydorsus. These results sustain the choice of this method for age determination of these species.
The suitability of MO1 for growth zone counts of the three Labeobarbus species was further supported by the statistical comparisons and by the assigned scores for readability, which were best for MO1. Except for L. megastoma, there was no evidence of a symmetric difference between R1 and R2 for MO1 and MO3, while this was significantly different for MO2 for all species. Although the regression and paired t-test analyses revealed significant difference for some of the cases, the slope and intercept of the linear regression for MO1 were much closer to 1 and 0, respectively, compared with the other methods. Moreover, the mean difference was smaller than 0.18 for MO1, while this difference was generally higher for the remaining methods. Otoliths prepared using MO1 were perceived to have good readability, as indicated by the quality scores given by readers, showing that growth zone interpretation was relatively easy for this method. Both readers felt growth zones on otoliths prepared by MO1 were better defined and relatively easy to interpret and had higher confidence than in growth zone counts they made from MO2 and MO3. More than 99% of the otolith samples prepared using MO1 were readable at AQ1 and AQ2 confidence rankings.
The underestimation of the growth zone counts, particularly for the older fish using MO2 and MO3 relative to MO1, occurs because of the presence of false rings, difficulty in following the growth zones around the otolith, and invisibility of growth zones at the edge of the otolith leading to misinterpretation of the growth zones. Imprecise and inaccurate interpretation of growth zones leads to incorrect estimation of growth and mortality parameters, which in turn may have drastic implications for fish stock assessment and fisheries management. The information generated will be useful to fisheries managers and researchers to select the most appropriate otolith preparation method for age determination of the selected fish species. Therefore, as MO1 resulted in less error, we conclude that this method should be accepted as standard protocol for preparation of the otolith of L. intermedius, L. tsanensis, and L. platydorsus for reading. Concerning L. megastoma, more research is needed before a conclusion can be drawn regarding the most suitable method. Description of the best otolith reparation method is the first step in the extraction of useful information about a fish. Although there have been efforts to compare different otolith preparation methods for some of the South African fish species [43], a lot still needs to be done to ascertain optimal method development and method selection for the tropical freshwater fish species. The aim of this study is to fill this gap by describing the best method for the Labeobarbus species in Lake Tana and providing a reference for researchers from Africa, particularly Ethiopia, to develop or select suitable otolith preparation methods for the different tropical fish species.

Author Contributions

S.G. conceived the main idea, collected and analyzed the data, and wrote the manuscript. K.B., A.G., S.B., W.A., P.G., and E.T. reviewed and edited the manuscript.

Funding

This research was funded by the Critical Ecosystem Partnership Fund (CEPF) and by the special research fund (BOF), Ghent University.

Acknowledgments

We would like to thank Ilse Maertens and Martine Moerman, Flanders Research Institute for Agriculture, Fisheries, and Food (ILVO), Belgium, for their valuable support in otolith preparation and reading. We are grateful to ILVO for providing us the SmartDots software.

Conflicts of Interest

The authors declare no conflict of interest. The funders had no role in the design of the study; in the collection, analyses, or interpretation of data; in the writing of the manuscript; or in the decision to publish the results.

Appendix A

Figure A1. Mean (points) and range (95% confidence interval) of differences in growth zone counts derived from MO2 (a) and MO3 (b) between two independent readers at the counts for the first reader (left) and difference between methods at the counts for MO1 (c) and at the counts for MO3 (d) for L. intermedius and L. tsanensis in Lake Tana (right). The horizontal solid line is the 1:1 equivalence line and marginal histograms are for growth zone counts of the first reader (top) and differences in growth zone counts between readers and methods.
Water 11 01336 g0a1

Appendix B

Figure A2. Mean (points) and range (95% confidence interval) of differences in growth zone counts derived from MO2 (a) and MO3 (b) between two independent readers at the counts for the first reader (left) and difference between methods at the counts for MO1 (c) and at the counts for MO3 (d) for L. platydorsus and L. megastoma in Lake Tana (right). The horizontal solid line is the 1:1 equivalence line and marginal histograms are for growth zone counts of the first reader (top) and differences in growth zone counts between readers and methods.
Water 11 01336 g0a2

Appendix C

Table A1. Statistical tests (regression and paired t-test) for the detection of bias of growth zone counts of the endemic Labeobarbus species between readers and methods.
StatisticsReaders and Methods Pairs
Reader 1 vs. Reader 2 (MO1)Reader1 vs. Reader 2 (MO2)Reader 1 vs. Reader 2 (MO3)MO1 vs. MO2MO1 vs. MO3MO2 vs. MO3
L. intermedius
Regression
Slope0.97 ± 0.030.92 ± 0.040.95 ± 0.040.99 ± 0.021.00 ± 0.030.92 ± 0.02
p0.3920.0330.2480.6600.8560.000
Intercept0.31 ± 0.200.84 ± 0.230.57 ± 0.260.03 ± 0.15−0.01 ± 0.210.42 ± 0.15
p0.1370.0000.0290.8260.9790.005
Paired t-test
Mean difference−0.139−0.345−0.2860.031−0.031−0.063
p0.0270.0000.0000.4820.6080.184
L. tsanensis
Regression
Slope0.92 ± 0.030.89 ± 0.040.87 ± 0.040.90 ± 0.030.90 ± 0.040.91 ± 0.03
p0.0120.0070.0000.0020.0090.002
Intercept0.56 ± 0.160.72 ± 0.190.68 ± 0.180.39 ± 0.170.54 ± 0.210.29 ± 0.15
p0.0000.0000.0000.0210.0100.060
Paired t-test
Mean difference−0.175−0.231−0.063−0.1160.0310.147
p0.0060.0020.3720.0630.6820.007
L. platydorsus
Regression
Slope0.83 ± 0.040.81 ± 0.560.87 ± 0.050.79 ± 0.040.82 ± 0.050.90 ± 0.03
p0.0000.0000.0040.0000.0000.002
Intercept0.09 ± 0.171.02 ± 0.240.73 ± 0.200.91 ± 0.200.81 ± 0.220.43 ± 0.15
p0.0000.0000.0000.0000.0000.006
Paired t-test
Mean difference−0.068−0.235−0.1630.0580.019−0.038
p0.2730.0010.0120.3680.7740.374
L. megastoma
Regression
Slope1.04 ± 0.041.17 ± 0.061.12 ± 0.050.89 ± 0.030.95 ± 0.030.88 ± 0.03
p0.3780.0060.0180.0000.1450.000
Intercept0.45 ± 0.190.12 ± 0.250.18 ± 0.210.30 ± 0.150.12 ± 0.160.41 ± 0.15
p0.0200.6180.3910.0480.4600.007
Paired t-test
Mean difference−0.609−0.760−0.6580.2120.101−0.111
p0.0000.0000.0000.0000.0490.033

References

  1. Nagelkerke, L.A.; Sibbing, F.A.; van den Boogaart, J.G.; Lammens, E.H.; Osse, J.W. The barbs (Barbus spp.) of Lake Tana: A forgotten species flock? Environ. Biol. Fishes 1994, 39, 1–22. [Google Scholar] [CrossRef]
  2. Anteneh, W.; Getahun, A.; Dejen, E.; Sibbing, F.A.; Nagelkerke, L.A.J.; De Graaf, M.; Wudneh, T.; Vijverberg, J.; Palstra, A.P. Spawning migrations of the endemic Labeobarbus (Cyprinidae, Teleostei) species of Lake Tana, Ethiopia: Status and threats. J. Fish Biol. 2012, 81, 750–765. [Google Scholar] [CrossRef] [PubMed]
  3. Sibbing, F.A.; Nagelkerke, L.A.J. Resource partitioning by Lake Tana barbs predicted from fish morphometrics and prey characteristics. Rev. Fish Biol. Fish. 2001, 10, 393–437. [Google Scholar] [CrossRef]
  4. de Graaf, M.; Machiels, M.A.M.; Wudneh, T.; Sibbing, F.A. Declining stocks of Lake Tana’s endemic Barbus species flock (Pisces, Cyprinidae): Natural variation or human impact? Biol. Conserv. 2004, 116, 277–287. [Google Scholar] [CrossRef]
  5. de Graaf, M.; van Zwieten, P.A.M.; Machiels, M.A.M.; Lemma, E.; Wudneh, T.; Dejen, E.; Sibbing, F.A. Vulnerability to a small-scale commercial fishery of Lake Tana’s (Ethiopia) endemic Labeobarbus compared with African catfish and Nile tilapia: An example of recruitment-overfishing? Fish. Res. 2006, 82, 304–318. [Google Scholar] [CrossRef]
  6. Dejen, E.; Anteneh, W.; Vijverberg, J. The Decline of the Lake Tana (Ethiopia) Fisheries: Causes and Possible Solutions. Land Degrad. Dev. 2017, 28, 1842–1851. [Google Scholar] [CrossRef]
  7. Gebremedhin, S.; Getahun, A.; Anteneh, W.; Bruneel, S.; Goethals, P. A Drivers-Pressure-State-Impact-Responses Framework to Support the Sustainability of Fish and Fisheries in Lake Tana, Ethiopia. Sustainability 2018, 10, 2957. [Google Scholar] [CrossRef]
  8. Getahun, A. Labeobarbus species. In The IUCN Red List of Threatened Species 2010; International Union for Conservation of Nature and Natural Resources: Gland, Switsersland, 2010. [Google Scholar]
  9. Snoeks, J.; Laleye, P.; Getahun, A.; Contreras-MacBeath, T. Labeobarbus macrophtalmus. In The IUCN Red List of Threatened Species; International Union for Conservation of Nature and Natural Resources: Gland, Switsersland, 2010. [Google Scholar]
  10. Nagelkerke, L.A.; Mina, M.V.; Wudneh, T.; Sibbing, F.A.; Osse, J.W. In Lake Tana, a unique fish fauna needs protection. Bioscience 1995, 45, 772–775. [Google Scholar]
  11. Nagelkerke, L.A.; Sibbing, F.A. The large barbs (Barbus spp., Cyprinidae, Teleostei) of Lake Tana (Ethiopia), with a description of a new species, Barbus osseensis. Neth. J. Zool. 2000, 50, 179–214. [Google Scholar] [CrossRef]
  12. de Graaf, M.; Machiels, M.; Wudneh, T.; Sibbing, F. Length at maturity and gillnet selectivity of Lake Tana’s Barbus species (Ethiopia): Implications for management and conservation. Aquat. Ecosyst. Health Manag. 2003, 6, 325–336. [Google Scholar] [CrossRef]
  13. de Graaf, M. Lake Tana’s Piscivorous Barbus (Cyprinidae, Ethiopia) Ecology-Evolution-Exploitation; WIAS: Berlin, Germany, 2003. [Google Scholar]
  14. Palstra, A.P.; de Graaf, M.; Sibbing, F.A. Riverine spawning and reproductive segregation in a lacustrine cyprinid species flock, facilitated by homing? Anim. Biol. 2004, 54, 393–415. [Google Scholar]
  15. Anteneh, W.; Getahun, A.; Dejen, E. Spawning migrations of Lake Tana Labeobarbus spp. (Teleostei: Cyprinidae) in the Ribb River, Ethiopia. Afr. J. Aquat. Sci. 2013, 38, 61–68. [Google Scholar] [CrossRef]
  16. Gebremedhin, S.; Mingist, M.; Getahun, A.; Anteneh, W. Spawning migration of Labeobarbus spp. (Pisces: Cyprinidae) of Lake Tana to Arno-Garno river, Lake Tana sub-basin, Ethiopia. SINET Ethiop. J. Sci. 2012, 35, 95–106. [Google Scholar]
  17. Gebremedhin, S.; Getahun, A.; Anteneh, W.; Gedif, B.; Gashu, B.; Tefera, B.; Berhanie, Z.; Alemaw, D. Effect of large weirs on abundance and diversity of migratory Labeobarbus species in tributaries of Lake Tana, Ethiopia. Afr. J. Aquat. Sci. 2017, 42, 367–373. [Google Scholar]
  18. Dwyer, K.S.; Walsh, S.J.; Campana, S.E. Age determination, validation and growth of Grand Bank yellowtail flounder (Limanda ferruginea). ICES J. Mar. Sci. 2003, 60, 1123–1138. [Google Scholar] [CrossRef]
  19. Campana, S. Accuracy, precision and quality control in age determination, including a review of the use and abuse of age validation methods. J. Fish Biol. 2001, 59, 197–242. [Google Scholar] [CrossRef]
  20. Beamish, R.J.; McFarlane, G. The forgotten requirement for age validation in fisheries biology. Trans. Am. Fish. Soc. 1983, 112, 735–743. [Google Scholar] [CrossRef]
  21. Marriott, R.J.; Mapstone, B.D. Consequences of inappropriate criteria for accepting age estimates from otoliths, with a case study for a long-lived tropical reef fish. Can. J. Fish. Aquat. Sci. 2006, 63, 2259–2274. [Google Scholar] [CrossRef]
  22. Braaten, P.J.; Doeringsfeld, M.R.; Guy, C.S. Comparison of age and growth estimates for river carpsuckers using scales and dorsal fin ray sections. N. Am. J. Fish. Manag. 1999, 19, 786–792. [Google Scholar] [CrossRef]
  23. Maceina, M.; Sammons, S. An evaluation of different structures to age freshwater fish from a northeastern US river. Fish. Manag. Ecol. 2006, 13, 237–242. [Google Scholar] [CrossRef]
  24. Kanwal, B.; Pathani, S. Age-growth, length-weight and condition factor of a hill stream fish, Gara lamta (Hamilton Buchanan) of Kumaun Himalaya. Nat. Sci. 2011, 9, 199–206. [Google Scholar]
  25. Khan, S.; Khan, M.A.; Miyan, K. Comparison of age estimates from otoliths, vertebrae, and pectoral spines in African sharptooth catfish, Clarias gariepinus (Burchell). Estonian J. Ecol. 2011, 60. [Google Scholar] [CrossRef]
  26. Steward, C.A.; DeMaria, K.D.; Shenker, J.M. Using otolith morphometrics to quickly and inexpensively predict age in the gray angelfish (Pomacanthus arcuatus). Fish. Res. 2009, 99, 123–129. [Google Scholar] [CrossRef]
  27. Dejen, E.; Vijverberg, J.; Nagelkerke, L.A.; Sibbing, F.A. Temporal and spatial distribution of microcrustacean zooplankton in relation to turbidity and other environmental factors in a large tropical lake (L.; Tana, Ethiopia). Hydrobiologia 2004, 513, 39–49. [Google Scholar] [CrossRef]
  28. Nagelkerke, L. The Barbs of Lake Tana, Ethiopia: Morphological Diversity and Its Implications for Taxonomy, Trophic Resource Partitioning, and Fisheries; Wageningen Agricultural University: Wageningen, The Netherlands, 1997. [Google Scholar]
  29. Brown, P.; Green, C.; Sivakumaran, K.; Stoessel, D.; Giles, A. Validating otolith annuli for annual age determination of common carp. Trans. Am. Fish. Soc. 2004, 133, 190–196. [Google Scholar] [CrossRef]
  30. Phelps, Q.E.; Edwards, K.R.; Willis, D.W. Precision of five structures for estimating age of common carp. N. Am. J. Fish. Manag. 2007, 27, 103–105. [Google Scholar] [CrossRef]
  31. Weyl, O.L.; Stadtlander, T.; Booth, A.J. Establishment of translocated populations of smallmouth yellowfish, Labeobarbus aeneus (Pisces: Cyprinidae), in lentic and lotic habitats in the Great Fish River system, South Africa. Afr. Zool. 2009, 44, 93–105. [Google Scholar] [CrossRef]
  32. Beamish, R.; Fournier, D. A method for comparing the precision of a set of age determinations. Can. J. Fish. Aquat. Sci. 1981, 38, 982–983. [Google Scholar] [CrossRef]
  33. Chang, W.Y. A statistical method for evaluating the reproducibility of age determination. Can. J. Fish. Aquat. Sci. 1982, 39, 1208–1210. [Google Scholar] [CrossRef]
  34. Ogle, D. Modified Age Bias Plot. Available online: http://derekogle.com/fishR/2017-04-14-Modified_AgeBiasPlot (accessed on 3 April 2019).
  35. Hoenig, J.; Morgan, M.; Brown, C. Analysing differences between two age determination methods by tests of symmetry. Can. J. Fish. Aquat. Sci. 1995, 52, 364–368. [Google Scholar] [CrossRef]
  36. Gebremedhin, S.; Bekaert, K.; Getahun, A.; Bruneel, S.; Anteneh, W.; Torreele, E.; Goethals, P. Comparison of Otolith Readability and Reproducibility of Counts of Translucent Zones Using Different Otolith Preparation Methods for Four Endemic Labeobarbus Species in Lake Tana, Ethiopia. Water 2019, 11, 1336. [Google Scholar] [CrossRef]
  37. Campana, S.E.; Thorrold, S.R. Otoliths, increments, and elements: Keys to a comprehensive understanding of fish populations? Can. J. Fish. Aquat. Sci. 2001, 58, 30–38. [Google Scholar] [CrossRef]
  38. Ogle, D. FishR Vignette. Von Bertalanffy Growth Models; Northland College: Ashland, WI, USA, 2013; Volume 54. [Google Scholar]
  39. Chilton, D.E.; Beamish, R.J. Age Determination Methods for Fishes Studied by the Groundfish Program at the Pacific Biological Station; Department of Fisheries and Oceans: Ottawa, ON, Canada, 1982.
  40. Campana, S.E. Chemistry and composition of fish otoliths: Pathways, mechanisms and applications. Mar. Ecol. Prog. Ser. 1999, 188, 263–297. [Google Scholar] [CrossRef]
  41. Zhu, X.; Rick, W.; Leonard, D.; Howland, K.; Mann, S.; Carmichael, T.J.; Tallman, R.F. Comparison of scales, pectoral fin rays, and otoliths for estimating age, growth, and mortality of lake whitefish, coregonus clupeaformis. In Great Slave Lake; Canadian Science Advisory Secretariat: Ottawa, ON, Canada, 2017. [Google Scholar]
  42. Winker, H.; Ellender, B.R.; Weyl, O.L.; Booth, A.J. Validation of growth zone deposition in otoliths of two large endemic cyprinids in Lake Gariep, South Africa. Afr. Zool. 2010, 45, 133–138. [Google Scholar] [CrossRef]
  43. Winker, H.; Weyl, O.; Booth, A.; Ellender, B. Validating and corroborating the deposition of two annual growth zones in asteriscus otoliths of common carp Cyprinus carpio from South Africa’s largest impoundment. J. Fish. Biol. 2010, 77, 2210–2228. [Google Scholar] [CrossRef] [PubMed]
  44. Ellender, B.; Weyl, O.; Winker, H. Age and growth and maturity of southern Africa’s largest cyprinid fish, the largemouth yellowfish Labeobarbus kimberleyensis. J. Fish. Biol. 2012, 81, 1271–1284. [Google Scholar] [CrossRef]
  45. Winker, H.; Weyl, O.L.; Booth, A.J.; Ellender, B.R. Life history strategy and population characteristics of an unexploited riverine cyprinid, Labeo capensis, in the largest impoundment in the Orange River Basin. Afr. Zool. 2012, 47, 85–99. [Google Scholar] [CrossRef]
  46. Taylor, G.C.; Peel, R.A.; Hay, C.J.; Weyl, O.L. Validation of the periodicity of growth zone formation in the otoliths of four fish species from the Upper Zambezi ecoregion, southern Africa. Afr. Zool. 2016, 51, 153–159. [Google Scholar] [CrossRef]
  47. Vilizzi, L.; Walker, K.F. Age and growth of the common carp, Cyprinus carpio, in the River Murray, Australia: Validation, consistency of age interpretation, and growth models. Environ. Biol. Fishes 1999, 54, 77–106. [Google Scholar] [CrossRef]
Figure 1. (a) The location of Ethiopia and Lake Tana in Africa, (b) the location of Lake Tana in Ethiopia, and (c) a map of the Lake Tana watershed showing the four study sites.
Water 11 01336 g001
Figure 2. Otoliths images prepared by the three different aging methods for L. intermedius (a), L. tsanensis (b), L. platydorsus (c), and L. megastoma (d). MO1, MO2, and MO3 represent aging method one, two, and three, respectively. Red dots are a number of growth zones.
Water 11 01336 g002
Figure 3. Length frequency distribution of the four dominant Labeobarbus spp. in Lake Tana.
Water 11 01336 g003
Figure 4. The bar graphs indicate the percentage of otoliths at each level of otolith readability (Q1 = readable, Q2 = moderately readable, and Q3 = unreadable). R1 refers to reader 1 and R2 refers to reader 2. The Mann–Whitney U test, which compares the confidence rankings between readers for each method, is also included.
Water 11 01336 g004
Figure 5. A number of individuals with the same number of growth zones in their otoliths examined using the three methods: MO1, MO2, and MO3 for the four dominant Labeobarbus species in Lake Tana. Mean of the paired reads from the two independent readers was used. The dotted black, red, and grey lines indicate the trend in the distribution of translucent growth zones counts for MO1, MO2, and MO3, respectively.
Water 11 01336 g005
Figure 6. Relationship between fork length and the count of the number of translucent zones in the otoliths for the four studied Labeobarbus species in Lake Tana.
Water 11 01336 g006
Figure 7. Mean (dots) and 95% confidence intervals of differences in counts of growth zones derived from the best method (MO1) between two independent readers at the readings for the first reader and difference between methods (MO1 and MO2) at the readings for MO1 for L. intermedius (a & b) and L.tsanensis (c & d) in Lake Tana. The horizontal solid line is the 1:1 equivalence line and marginal histograms are for counts of the first reader (top) and differences in counts between readers and methods.
Water 11 01336 g007
Figure 8. Mean (dots) and 95% confidence intervals of differences in counts of growth zones derived from the best method (MO1) between two independent readers at the readings for the first reader and difference between methods (MO1 and MO2) at the readings for MO1 for L. platydorsus (a & b) and L. megastoma (c & d) in Lake Tana. The horizontal solid line is the 1:1 equivalence line and marginal histograms are for counts of the first reader (top) and differences in counts between readers and methods.
Water 11 01336 g008
Table 1. Comparison of reader confidence among the three methods for the four endemic Labeobarbus species in Lake Tana. Q1 = readable, Q2 = moderately readable, and Q3 = unreadable. Numbers refer to the number of otolith under each readability level. Different superscript letters for the methods for each species indicate a significant difference. Confidence rankings from reader 1 (R1) were used for this analysis.
Aging MethodsReaders’ ConfidenceKruskal–Wallis Rank Sum Test
Q1Q2Q3Chi-Squaredfp-Value
L. intermedius
MO1a11925026.2520.000
MO2b85585
MO3b88582
L. tsanensis
MO1a1122509.6920.008
MO2b104414
MO3b99464
L. platydorsus
MO1a9735127.1020.000
MO2b705228
MO3b844125
L. megastoma
MO1a9538123.9720.000
MO2b725718
MO3b745716
Table 2. Average percentage error (APE, %), coefficient of variation (CV, %), and percentage of agreement (PA, %) to determine the precision of age readings. n = sample size and R = number of readings.
Between Readers
SpeciesMO1MO2MO3
nRCVAPEPAnRCVAPEPAnRCVAPEPA
L. intermedius144243691392755714426464
L. tsanensis137275601432965614329656
L. platydorsus133275681192965512329662
L. megastoma133211845125213942123211847
Between Methods
MO1 vs MO2MO1 vs MO3MO2 vs MO3
L. intermedius128232771282436712823277
L. tsanensis129243731292547112924378
L. platydorsus104254711042547510423281
L. megastoma992437199243779924379
Table 3. The mean number of growth zones counted by reader 1 (R1) and reader 2 (R2) for each of the three methods of four Labeobarbus species in Lake Tana.
MethodsReadert-Valuedfp-Value95% Confidence Intervals
R1(Mean)R2 (Mean)
L. intermedius
MO15.96.1−0.612850.54−0.59–0.31
MO25.86.1−1.452760.15−0.81–0.12
MO35.86.1−1.222770.22−0.75–0.17
L. tsanensis
MO14.74.9−0.752720.46−0.64–0.29
MO24.54.8−1.062840.29−0.66–0.20
MO34.84.8−0.282840.78−0.50–0.38
L. platydorsus
MO14.44.5−0.392630.70−0.41–0.27
MO24.14.3−1.452360.15−0.56–0.08
MO34.24.3−0.942440.35−0.50–0.18
L. megastoma
MO14.14.7−2.972590.003−1.01–(−0.20)
MO23.84.6−3.422290.000−1.20–(−0.32)
MO34.04.6−3.032330.003−1.09–(−0.23)
Table 4. Analysis of Bowker’s chi-square symmetry test, comparing pairs of growth zone counts between readers and methods applied to the four Labeobarbus species in Lake Tana. “ns” refers to no significant difference. “*” and “**” refers to significant difference at p = 0.01 and 0.001, respectively.
Between Readers
SpeciesMO1MO2MO3
dfChi-sqpdfChi-sqpdfChi-sqp
L. intermedius1719ns1928**1524ns
L. tsanensis1422ns1530*1521ns
L. platydorsus1019ns1020*1015ns
L. megastoma1558**1759**1358**
Between Methods
MO1 vs. MO2MO1 vs. MO3MO2 vs. MO3
L. intermedius97ns108ns109ns
L. tsanensis1314ns1612ns1315ns
L. platydorsus915ns1110ns46ns
L. megastoma816*711ns79ns

