Controlling Factors of Surface Water Ionic Composition Characteristics in the Lake Genggahai Catchment, NE Qinghai–Tibetan Plateau, China

MOE Key Laboratory of Tibetan Plateau Land Surface Processes and Ecological Conservation; Key Laboratory of Physical Geography and Environmental Processes; School of Geographical Science, Qinghai Normal University, Xining 810016, China
*
Author to whom correspondence should be addressed.
Water 2019, 11(7), 1329; https://doi.org/10.3390/w11071329
Submission received: 31 March 2019
/
Revised: 19 June 2019
/
Accepted: 20 June 2019
/
Published: 27 June 2019
(This article belongs to the Special Issue Environmental Chemistry of Water Quality Monitoring)
Abstract
:This study has determined the major ion compositions of surface waters within the basin of Lake Genggahai, northeastern Qinghai–Tibetan Plateau, China. The results showed that the anions in the groundwater and river water of Genggahai Lake are mainly HCO3−, and the cations are mainly Ca2+ + Na+. Evaporite, carbonate, and silicate in the basin all have an impact on the chemical composition of river water and groundwater. Among them, carbonate weathering has a relatively larger contribution. The grazing activities of herdsmen in the basin have had a certain degree of impact on the water quality of river basins and groundwater. The anion of lake water is dominated by Cl−, and the cation is mainly Na+. The content change is mainly affected by the change of corresponding ion content in groundwater coming into the lake and the evaporation of lake water. Among them, Cl− in lake water is more affected by the change of Cl− content in the groundwater coming into the lake, while Na+ in lake water is more affected by evaporation. More specifically, the low concentrations of Ca2+ and HCO3− in lake water were determined to be related to the photosynthesis of aquatic plants in the lake.
1. Introduction
The hydrogeochemistry of lakes and their basins not only reflects the water–rock interaction in basin areas, but is also an important indicator of any environmental changes [1]. At present, hydrochemistry can be used to understand the geological background and soil formation processes of basins, the vegetation cover and decomposition of organic matter, and processes such as the physical and chemical weathering of the basin rocks [2,3,4]. In addition, the study of basin hydrogeochemistry can be used to estimate the relationship between rock weathering-related carbon sinks and the global carbon flux [5], and water environment in the catchments [2]. Therefore, studying the hydrochemical characteristics of rivers and lakes has important scientific significance for the water cycle process and the protection of water resource environments [6,7]. Revealing the main ion sources and the main controlling factors are important topics for studying water environment and hydrological problems [8].
Based on the analysis of ion data characteristics of rainwater, river water, and lake water samples, Gibbs [2] pointed out that the three main controlling factors for the hydrochemical characteristics of surface water are atmospheric precipitation, rock weathering, and evaporation–crystallization. He also put forward the boomerang envelope model to describe the main anion and cation compositions of natural surface water. After that, there have been many studies on the main ion content of the world’s major water bodies and its relationship with the climatic conditions of the basin and the regional geological lithology, such as the Amazon River [9], the Ganga-Brahmaputra river system [10], the River Rhine in Europe [11], rivers in the Congo Basin [4], the Alaknanda River, Garhwal Himalaya, India [12], and the Seine River in France [13]. Domestically, Hu et al. [14] studied the hydrochemistry of Yangtze River, Yellow River, Yarlung Tsangpo River, Lancang River, and Yalu River, amongst others. They pointed out that the ionic composition of rivers in China is mainly affected by the erosion of carbonate and evaporite, and the influence of aluminosilicate weathering is less obvious comparing to the former two. Zhang et al. [15] and Zhu and Yang [16] analyzed the hydrochemical composition of major rivers around the Taklimakan Desert. They found that intense evaporation and weathering of the basin rocks have important contributions to the chemical composition of the river. Han and Liu [17] carried out a systematic study on the hydrochemistry of rivers in the Guizhou karst area and its formation causes. Chen et al. [18] and Zhang and Chen [19] performed a relatively systematical analysis on the hydrochemical characteristics of some rivers in China, such as the Yangtze River, Yellow River, Songhua River, and Pearl River.
With more than 3,000,000 km2 and an average altitude around 4500 m above sea level a.s.l. the Qinghai–Tibetan Plateau (QTP) is the highest and largest plateau in the world [20]. The QTP is the “Roof of the world” and the “Asian water tower” [21]. It has a special geographical location and fragile ecological environment [22,23]. This region is home to the lake group with the highest altitude, biggest number, and largest area on the planet [24]. Therefore, the hydrochemical characteristics of lakes and their basins in this region are sensitive to climate change responses [23]. Much research work has been carried out on rivers and lakes in the QTP, such as the Nam Co Lake waters in the central and southern QTP [25] and its basin rivers [26,27], Yamzhog Yumco basin lake waters and rivers [28], Drem-tso lake water [29], Daggyaima Co, Pung Co, Angrenjin Co, Dajia Co lake waters and the inflowing tributary rivers [30,31], the Qingshui River Basin in the central QTP [32] and other parts of the rivers and lake waters [33], the Hurleg Lake in the Qaidam Basin in the northern QTP [34], the Qinghai Lake Basin in the northeastern part of the QTP [35], and the catchment of Lake Donggi Cona [23].
In summary, research on the hydrochemistry of the QTP is mainly aimed at the development of a single water body. There is less comprehensive research on the hydrochemistry of multiple water bodies, such as groundwater, river water, and lake water in the entire basin. The research on the hydrochemistry of the QTP is relatively weak and the studies that have been carried out have short sampling periods or are based on short-term studies. Therefore, it is impossible to fully understand the hydrochemical composition characteristics and sources of water bodies in the basin. It is worth noting that compared with the southern and central parts of the QTP, there are few studies on hydrochemistry in the northeastern part of the QTP, and there is a lack of research on small basin lakes in this area. In fact, the study of small basin lakes can not only enrich the hydrochemistry data of the QTP lake, but also help to understand the evolution process of the lakes in the QTP.
Based on the ionic composition of water in the Genggahai Lake and its basin area, coupled with the changes in temperature, precipitation, evaporation and other factors, which were monitored during the study period, the present study discusses the basic factors that control the hydrochemical composition of the Genggahai basin. This study provides abundant data on the hydrochemical composition of lakes in the study area and helps to understand the process of material circulation in the lake basins of the Northeastern QTP.
2. Study Area
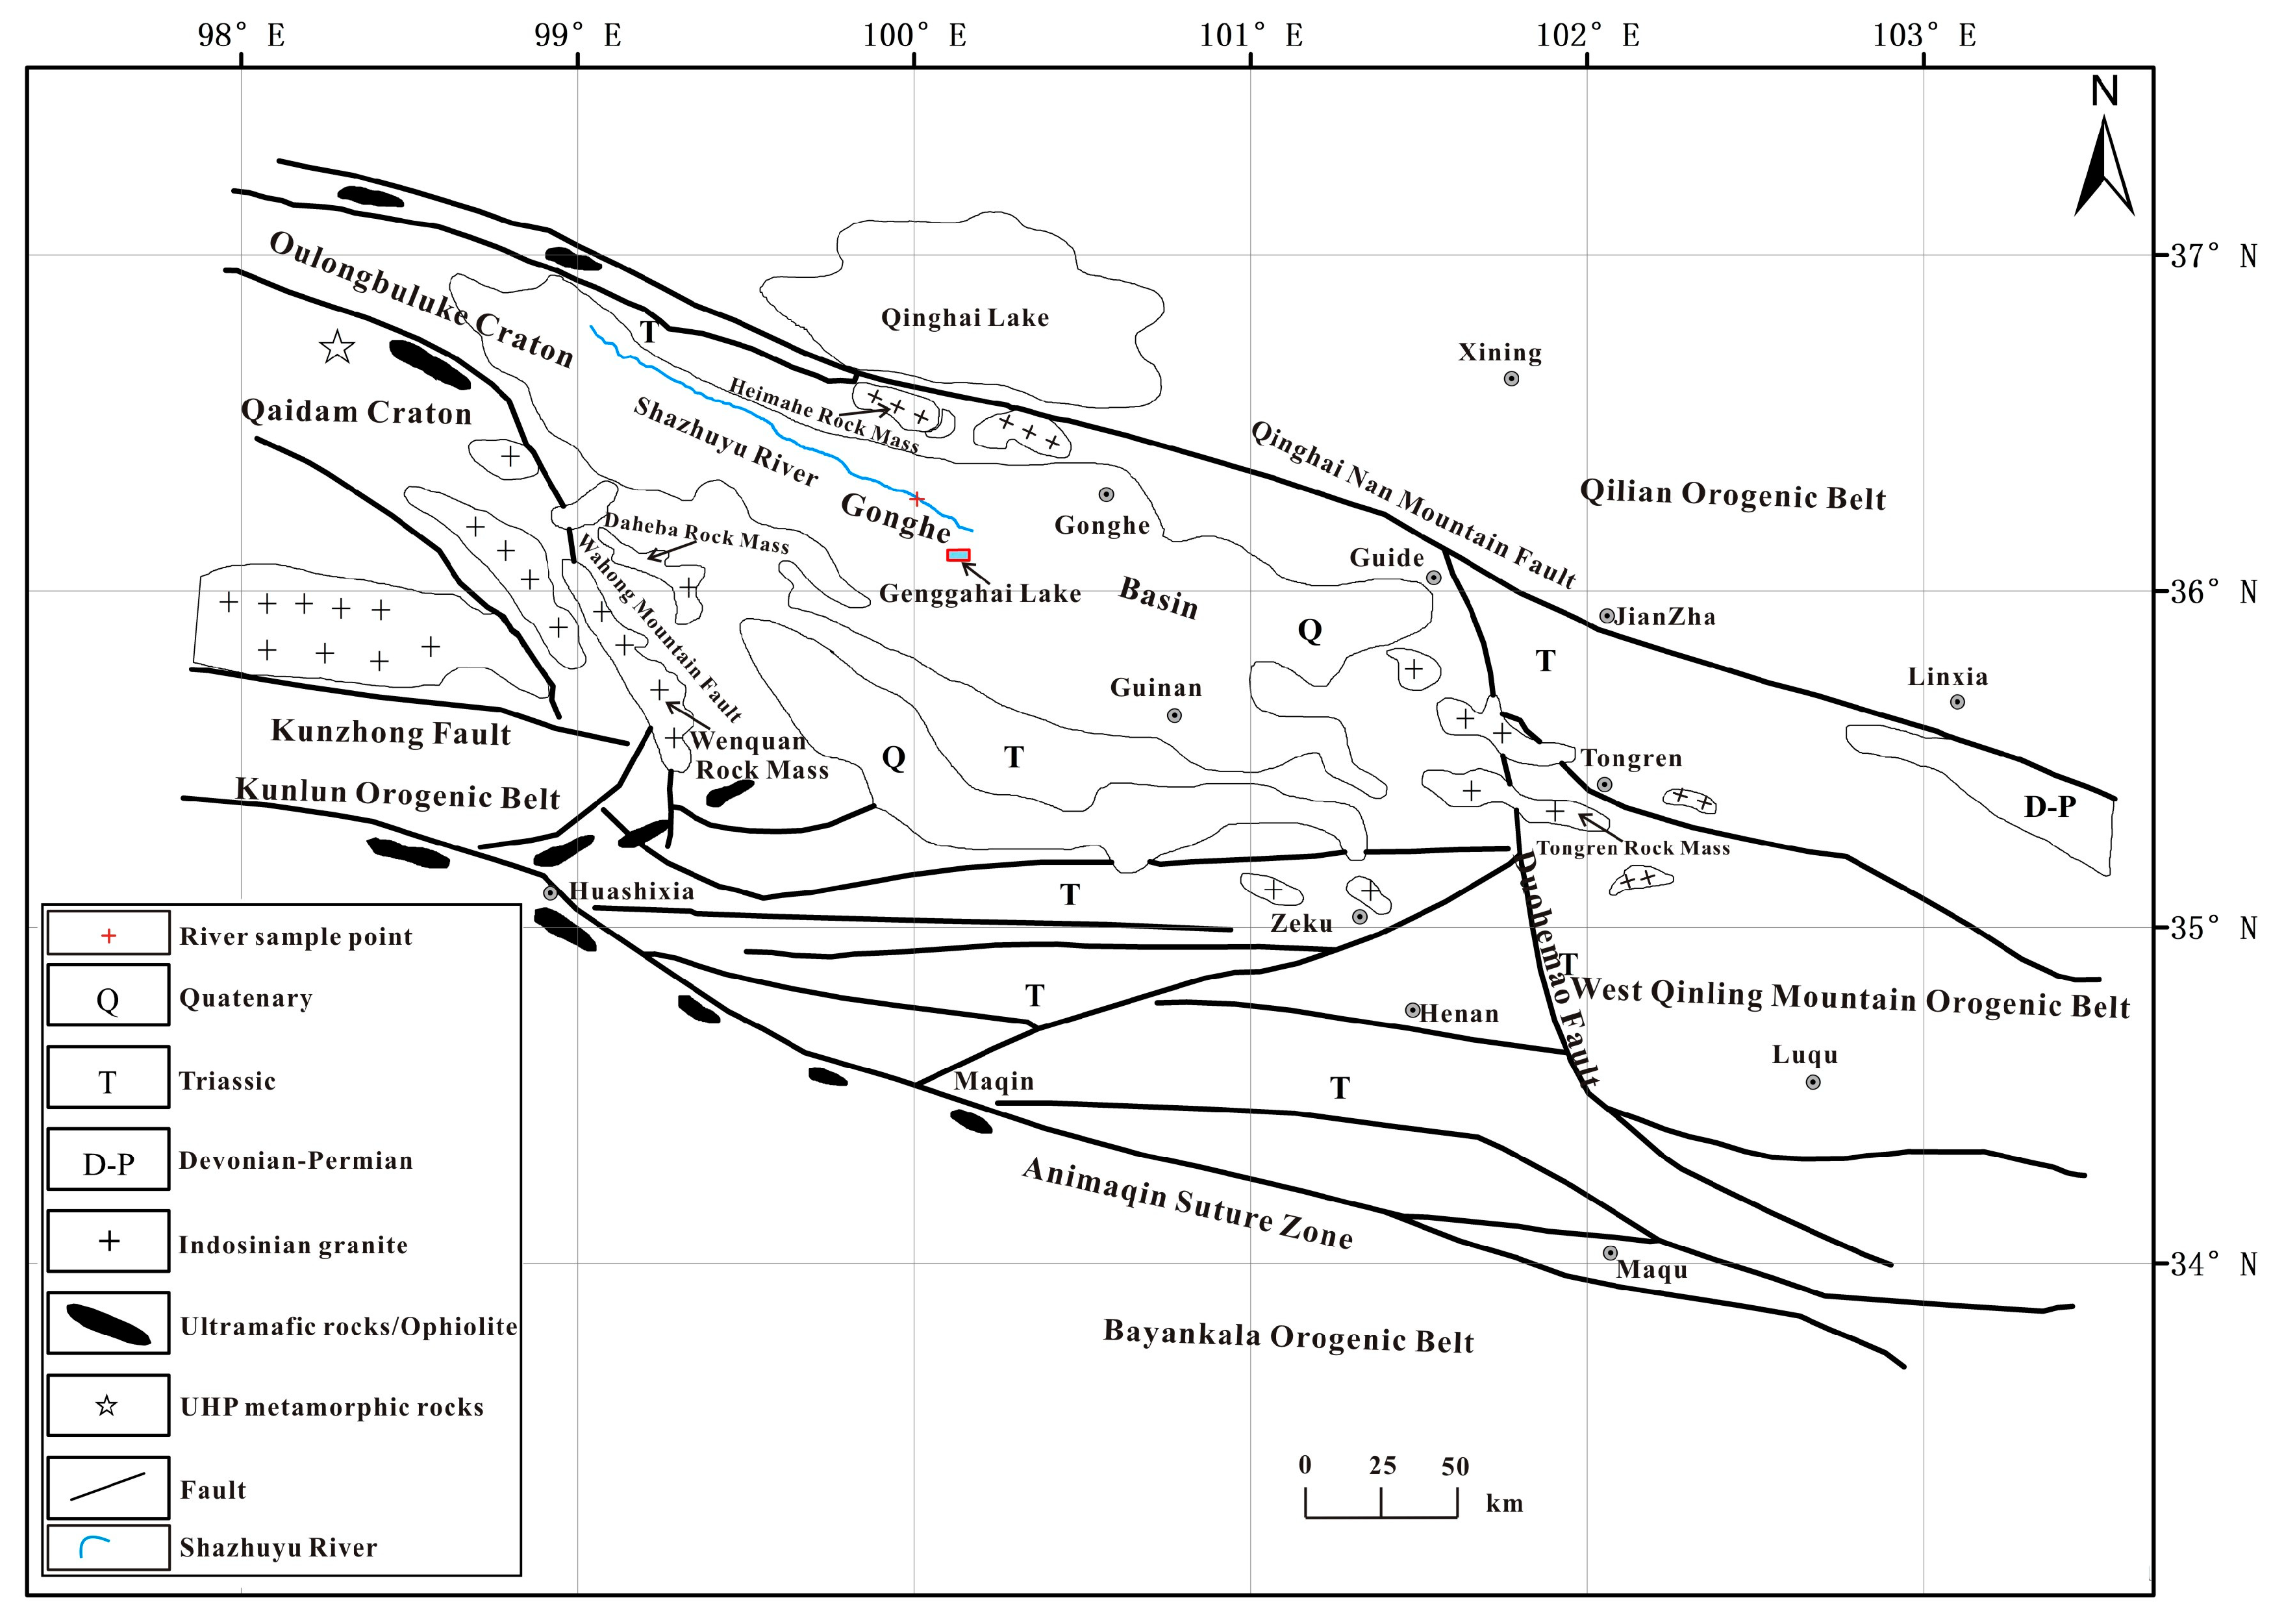
The Gonghe Basin is located in the Northeastern QTP. The basin is oriented along a NW–SE direction, and has a mean altitude of 3000 m a.s.l. The region is characterized by an alpine arid and semi-arid continental climate. The basin has an elongated shape and is surrounded by the Xiqing Mountain, Heka Mountain, Ela Mountain, Wahong Mountain, Waligong Mountain, and Qinghai Nan Mountain [36] (Figure 1). The geological structure of the basin is located in the composite terrane of the Qin Kun latitudinal tectonic system, the Hexi structural system, and the Qinghai–Tibet–Yunnan tectonic system in the shape of the Chinese character “歹” [36]. At present, the rock layers distributed in the highest stratum of the mountain around the basin are dominated by shallow marine facies limestone, sandstone, and shallow metamorphic slate and schist (Figure 1). The rock layers distributed in the interior of the basin are mainly fluvio-lacustrine sediments formed during the early Pleistocene and at the end of the middle Pleistocene [36]. The interior of the vast basin consists of flood basin facies developed by meandering and limnogenic facies consisting of grey–yellow, brownish-yellow, and grey–green fine sandstone, siltstone, mudstone, and sandy mudstone. It often contains multilayered fine conglomerate, gravel sandstone, and medium thick sandstone. The basin area is about 13,800 km2 and gradually decreases from northwest to southeast. The lowest part of the basin is the Yellow River water surface of Longyangxia, with an altitude of 2400 m a.s.l. [37]. Records from the Gonghe Meteorological station collected data from 1957 to 2000, and this data was used to calculate the mean annual temperature of this region (3.7 °C), the mean annual precipitation (300 mm), and the annual potential evaporation (between 1528 and 1937 mm).
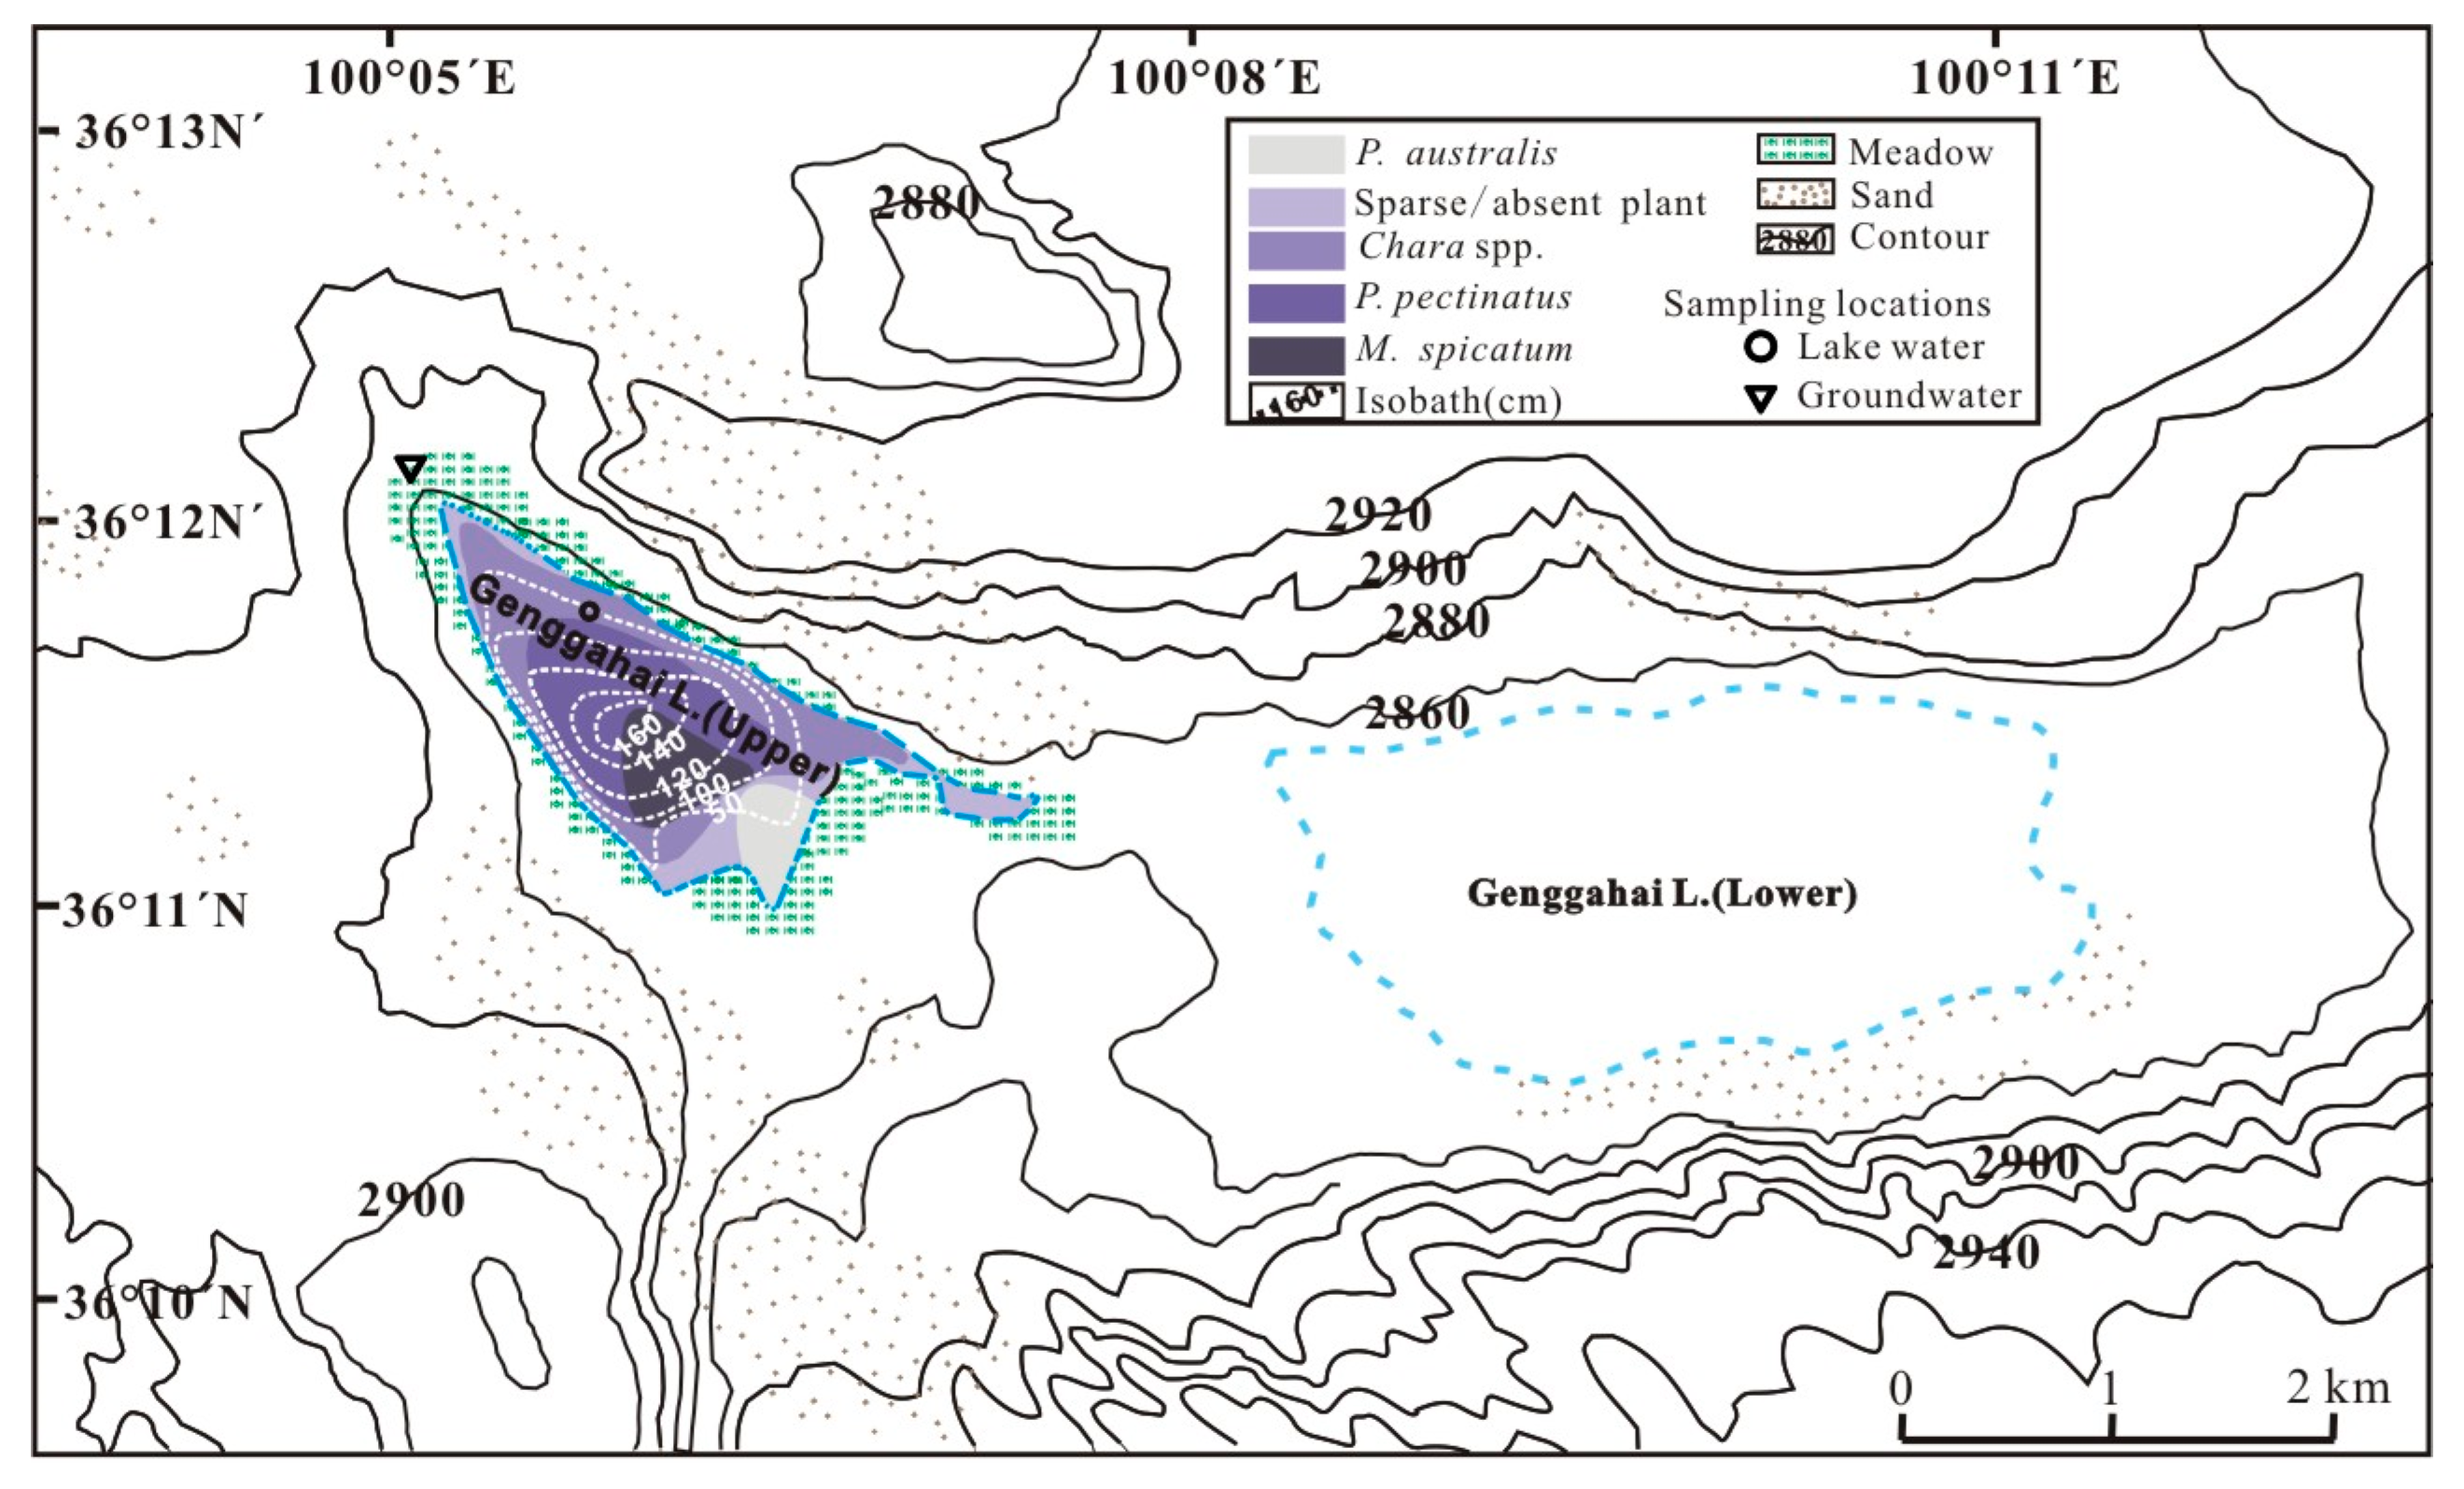
The Genggahai Lake is located in the central part of the Gognghe Basin at 36°11′ N, 100°06′ E. It consists of two separate basins, the Upper Genggahai Lake and the Lower Genggahai Lake (Figure 2). The Lower Genggahai Lake is nearly desiccated, with only a few sections that still contain water. The Upper Genggahai (hereinafter referred to as Genggahai) Lake has a surface elevation of 2860 m a.s.l., a present-day surface area of 2.0 km2, a maximum depth of 1.8 m, water salinity of 1 g L−1 and pH of 9.2 ± 0.5. Genggahai Lake is a monomictic lake. Groundwater is the main source of water in the Genggahai Lake, and the recharge potential area is approximately 4000 km2, which exceeds its surface area [39]. The tertiary clastic rock cranny pore water is distributed at the bottom of the Shazhuyu River valley. The quaternary loose rock pore water is widely distributed in the Genggahai basin [36]. The Genggahai Lake is a grassy shallow lake, in which abundant aquatic plants, including Potamogeton pectinatus, Myriophyllum spicatum, and Chara spp. (Figure 2), coexist with gastropods and mollusks [10]. Moreover, a vast field of reeds lies at the southeast part of the lake, while the entire lake is surrounded by grassland (Figure 2). In fact, desert grassland is the dominant vegetation type in the Genggahai catchment area. Moreover, aeolian activity is prevalent in this region [40]. The main human activity surrounding the lake is livestock grazing on the grassland by Tibetan herdsmen. The domestic yak (Bos grunniens) and the Tibetan sheep (Ovis aries) are the main livestock in this region. Overgrazing is one of the most important factors which leads to land desertification [41].
3. Materials and Methods
3.1. Data and Sample Collection
Water samples were collected from Genggahai Lake for three field seasons during the summer months, starting on 12 May 2012. The samples from Genggahai Lake were collected at a depth of approximately 20 cm. Groundwater and river surface water samples were also collected from the catchment area during this time period.
From May to September for each year between 2012 and 2015, a total of 19 lake water and groundwater samples, and 18 river water samples were collected monthly. When collecting the water sample, the pre-cleaned water sample bottle was repeatedly washed with water at the sampling point before sample collection. The water samples were collected in 500 mL polyethylene plastic bottles. The bottle cap was sealed with a sealing membrane and kept away from sunlight to ensure that the samples could later be analyzed for DIC (dissolved inorganic carbon) and ion concentrations. The TDS (total dissolved solids) content of the water was measured on-site with a portable AquaRead-1000 analyzer.
The daily mean evaporation (hereinafter referred to as evaporation) was calculated using the modified evaporation equation of Yang et al. [43] based on meteorological data from the Gonghe Station. The daily maximum temperature, minimum temperature, average temperature, precipitation, relative humidity, sunshine duration, average wind speed, and other data were obtained from the “Dataset of Daily Climate Data from Chinese Surface Stations” of the China Meteorological Data Service Center (http://data.cma.cn) [44].
3.2. Experimental Analysis
The water samples were first filtered using a 0.45 μm glass fiber prior to being analyzed. The DIC content of lake water was determined using of acid–base titration [45]. The concentration of Cl−, HCO3−, NO3−, and SO42− anions and Na+, Ca2+, Mg2+, and K+ cations in lake water were measured with an Ion Chromatography System (ICS-2500, Dionex, Sunnyvale, CA, USA) with a measurement accuracy of ±5%. The anion–cation average equivalent concentration balance error was less than 5%. The above tests were completed at the Key Laboratory of Western China’s Environmental Systems, Ministry of Education, Lanzhou University.
4. Results
4.1. Changes in the Ionic Concentration of Water in the Genggahai Lake Basin
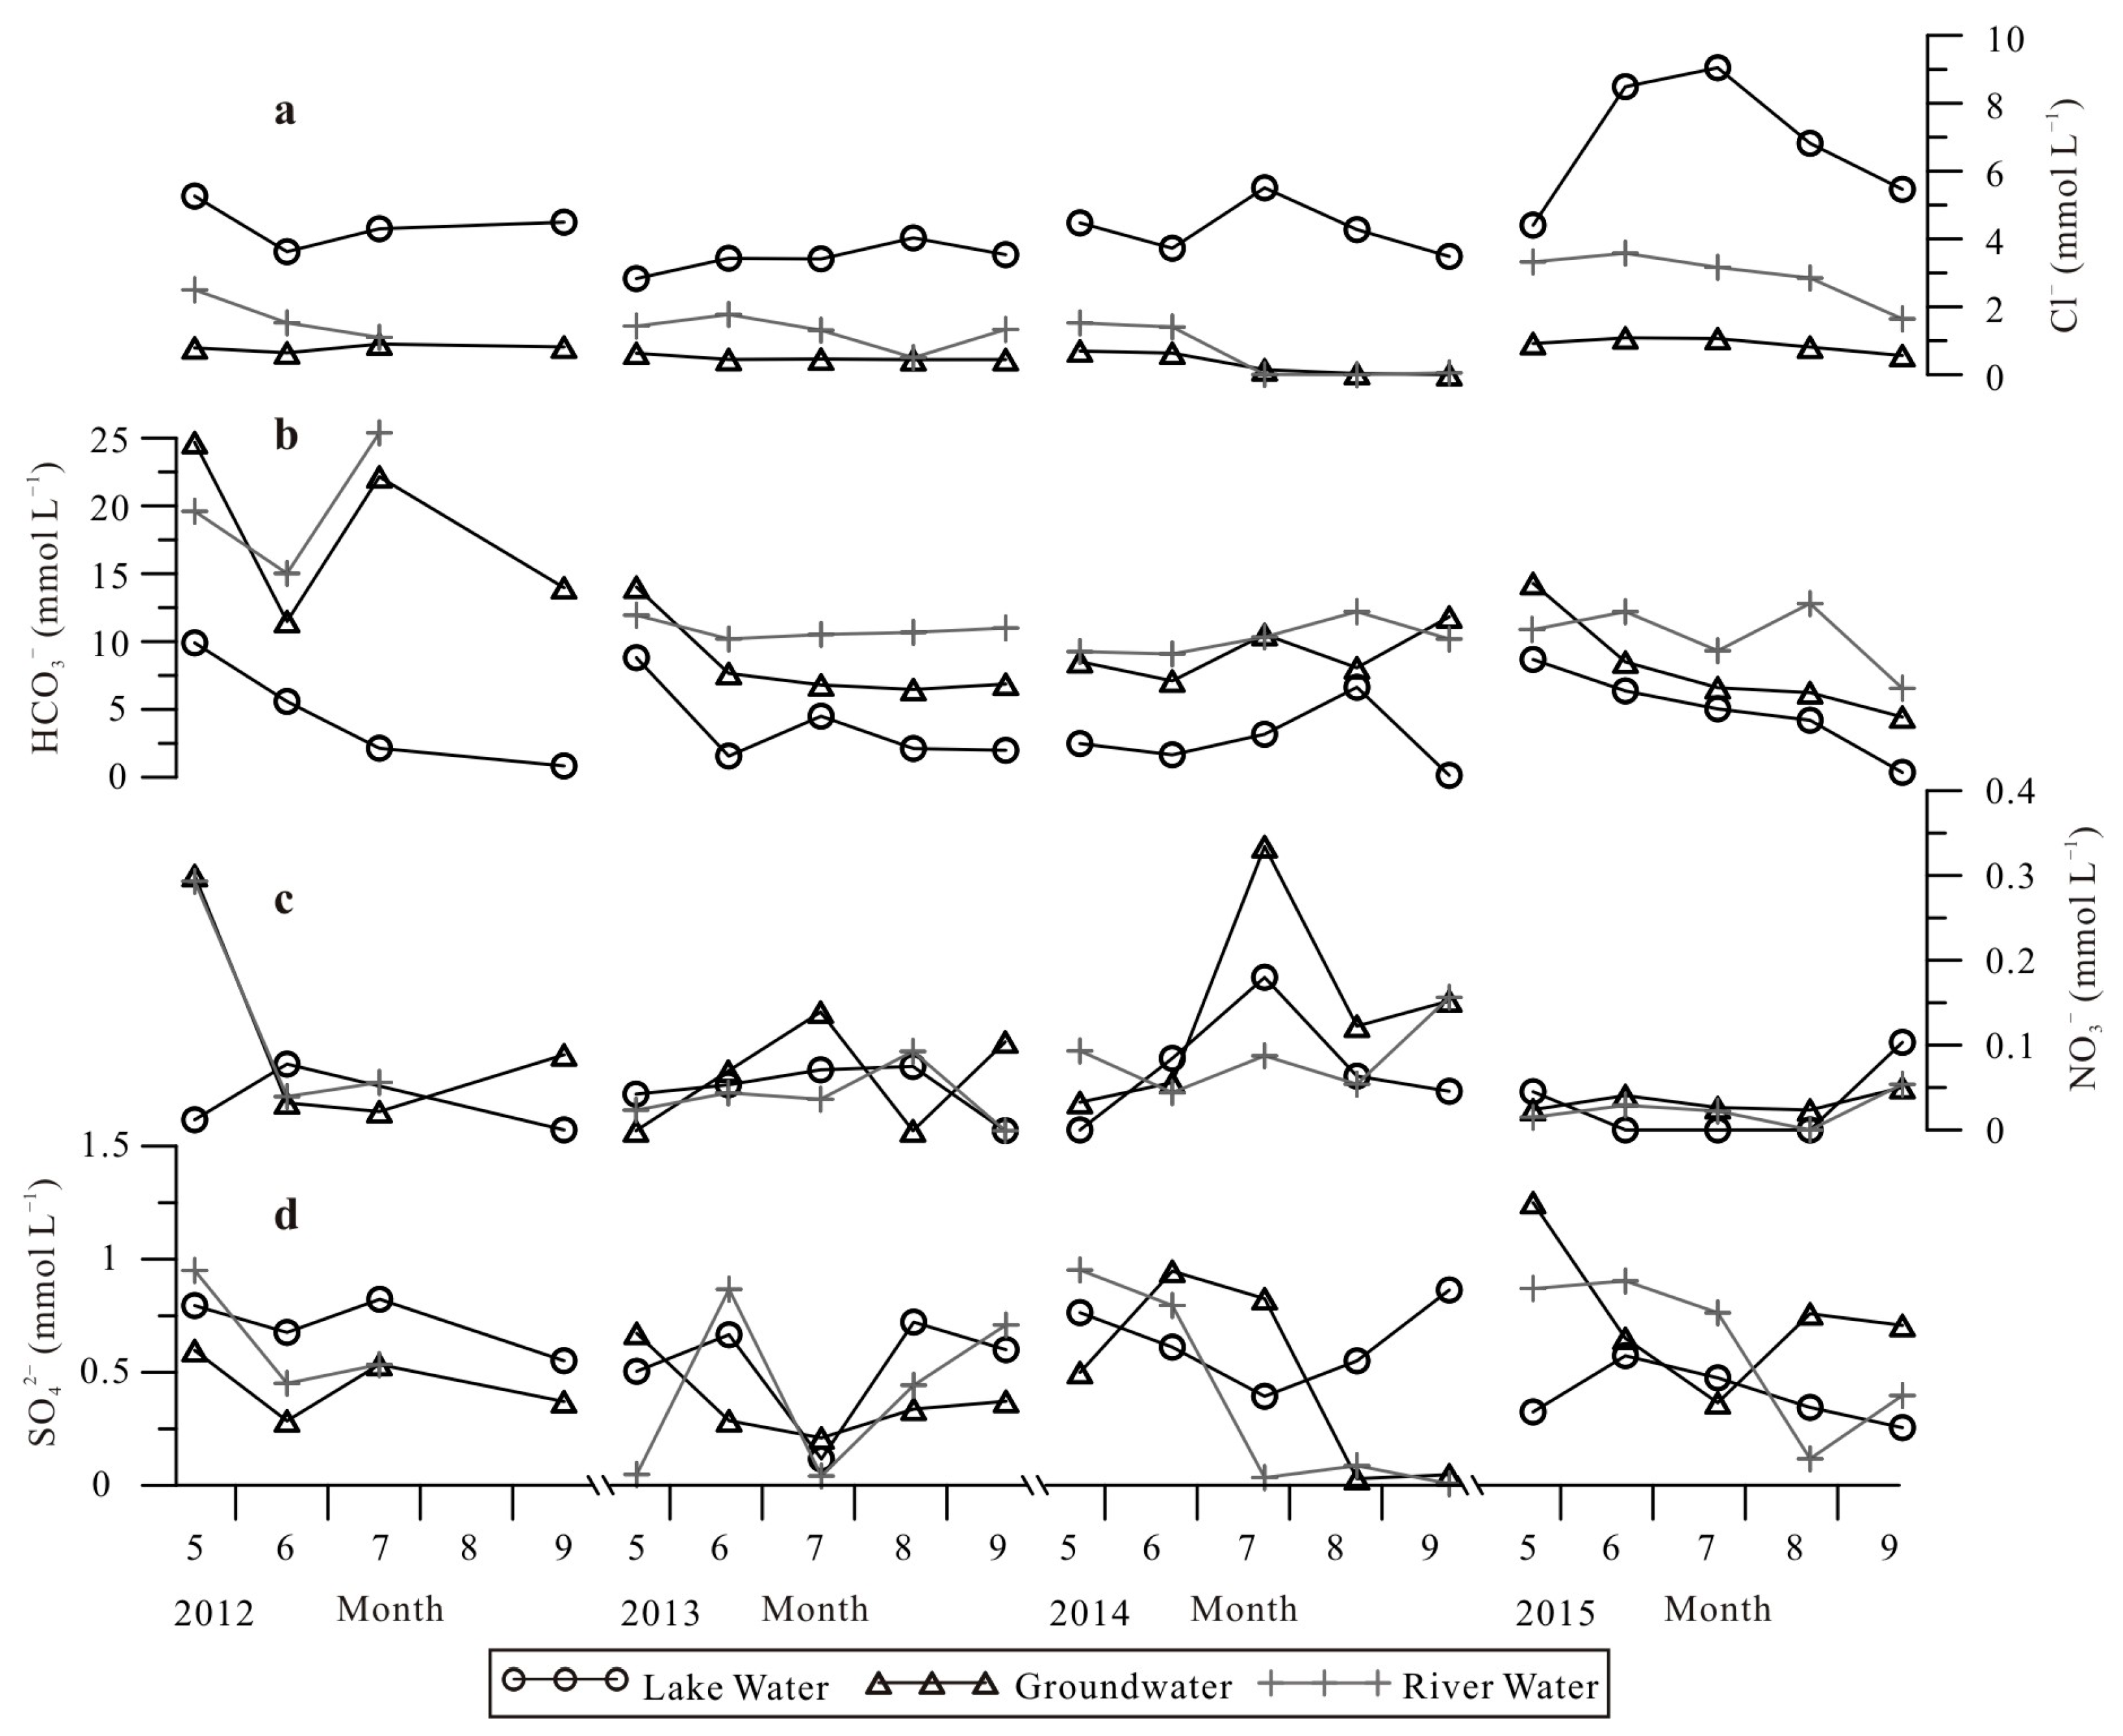
It is clear from Table 1 that the maximum concentration of Cl− was observed in lake water, with values ranging from 2.83 to 9.05 mmol L−1 and displaying varying degrees of increase in August 2013, July 2014, and July 2015 (Figure 3a). In comparison, the Cl− concentrations in river water and groundwater were low and with less fluctuations, with values ranging from 0.001 to 3.93 mmol L−1 and from 0.001 to 1.09 mmol L−1, respectively. On an interannual scale, the overall fluctuation of Cl− in different water bodies was relatively small between 2012 and 2014, with the fluctuation being more obvious in 2015 (Table 1 and Figure 3a).
The lowest concentration of HCO3− observed was the lake water, with values ranging from 0.14 to 9.90 mmol L−1. Additionally, the HCO3− concentration observed was higher at the beginning of the summer than at the end, and showed less fluctuations. In comparison, the concentrations of HCO3− in river water and groundwater were lower, with values ranging from 6.56 to 25.39 mmol L−1 and from 4.44 to 24.67 mmol L−1, respectively. In 2012, the HCO3− concentrations in river and groundwater were higher and showed more annual fluctuations, whereas from 2013 to 2015, the overall annual concentrations were lower and with fewer fluctuations (Table 1; Figure 3b).
The average concentrations of NO3− and SO42− in various water bodies were low, not exceeding 0.2 mmol L−1 and 1.00 mmol L−1, respectively (Table 1; Figure 3c,d).
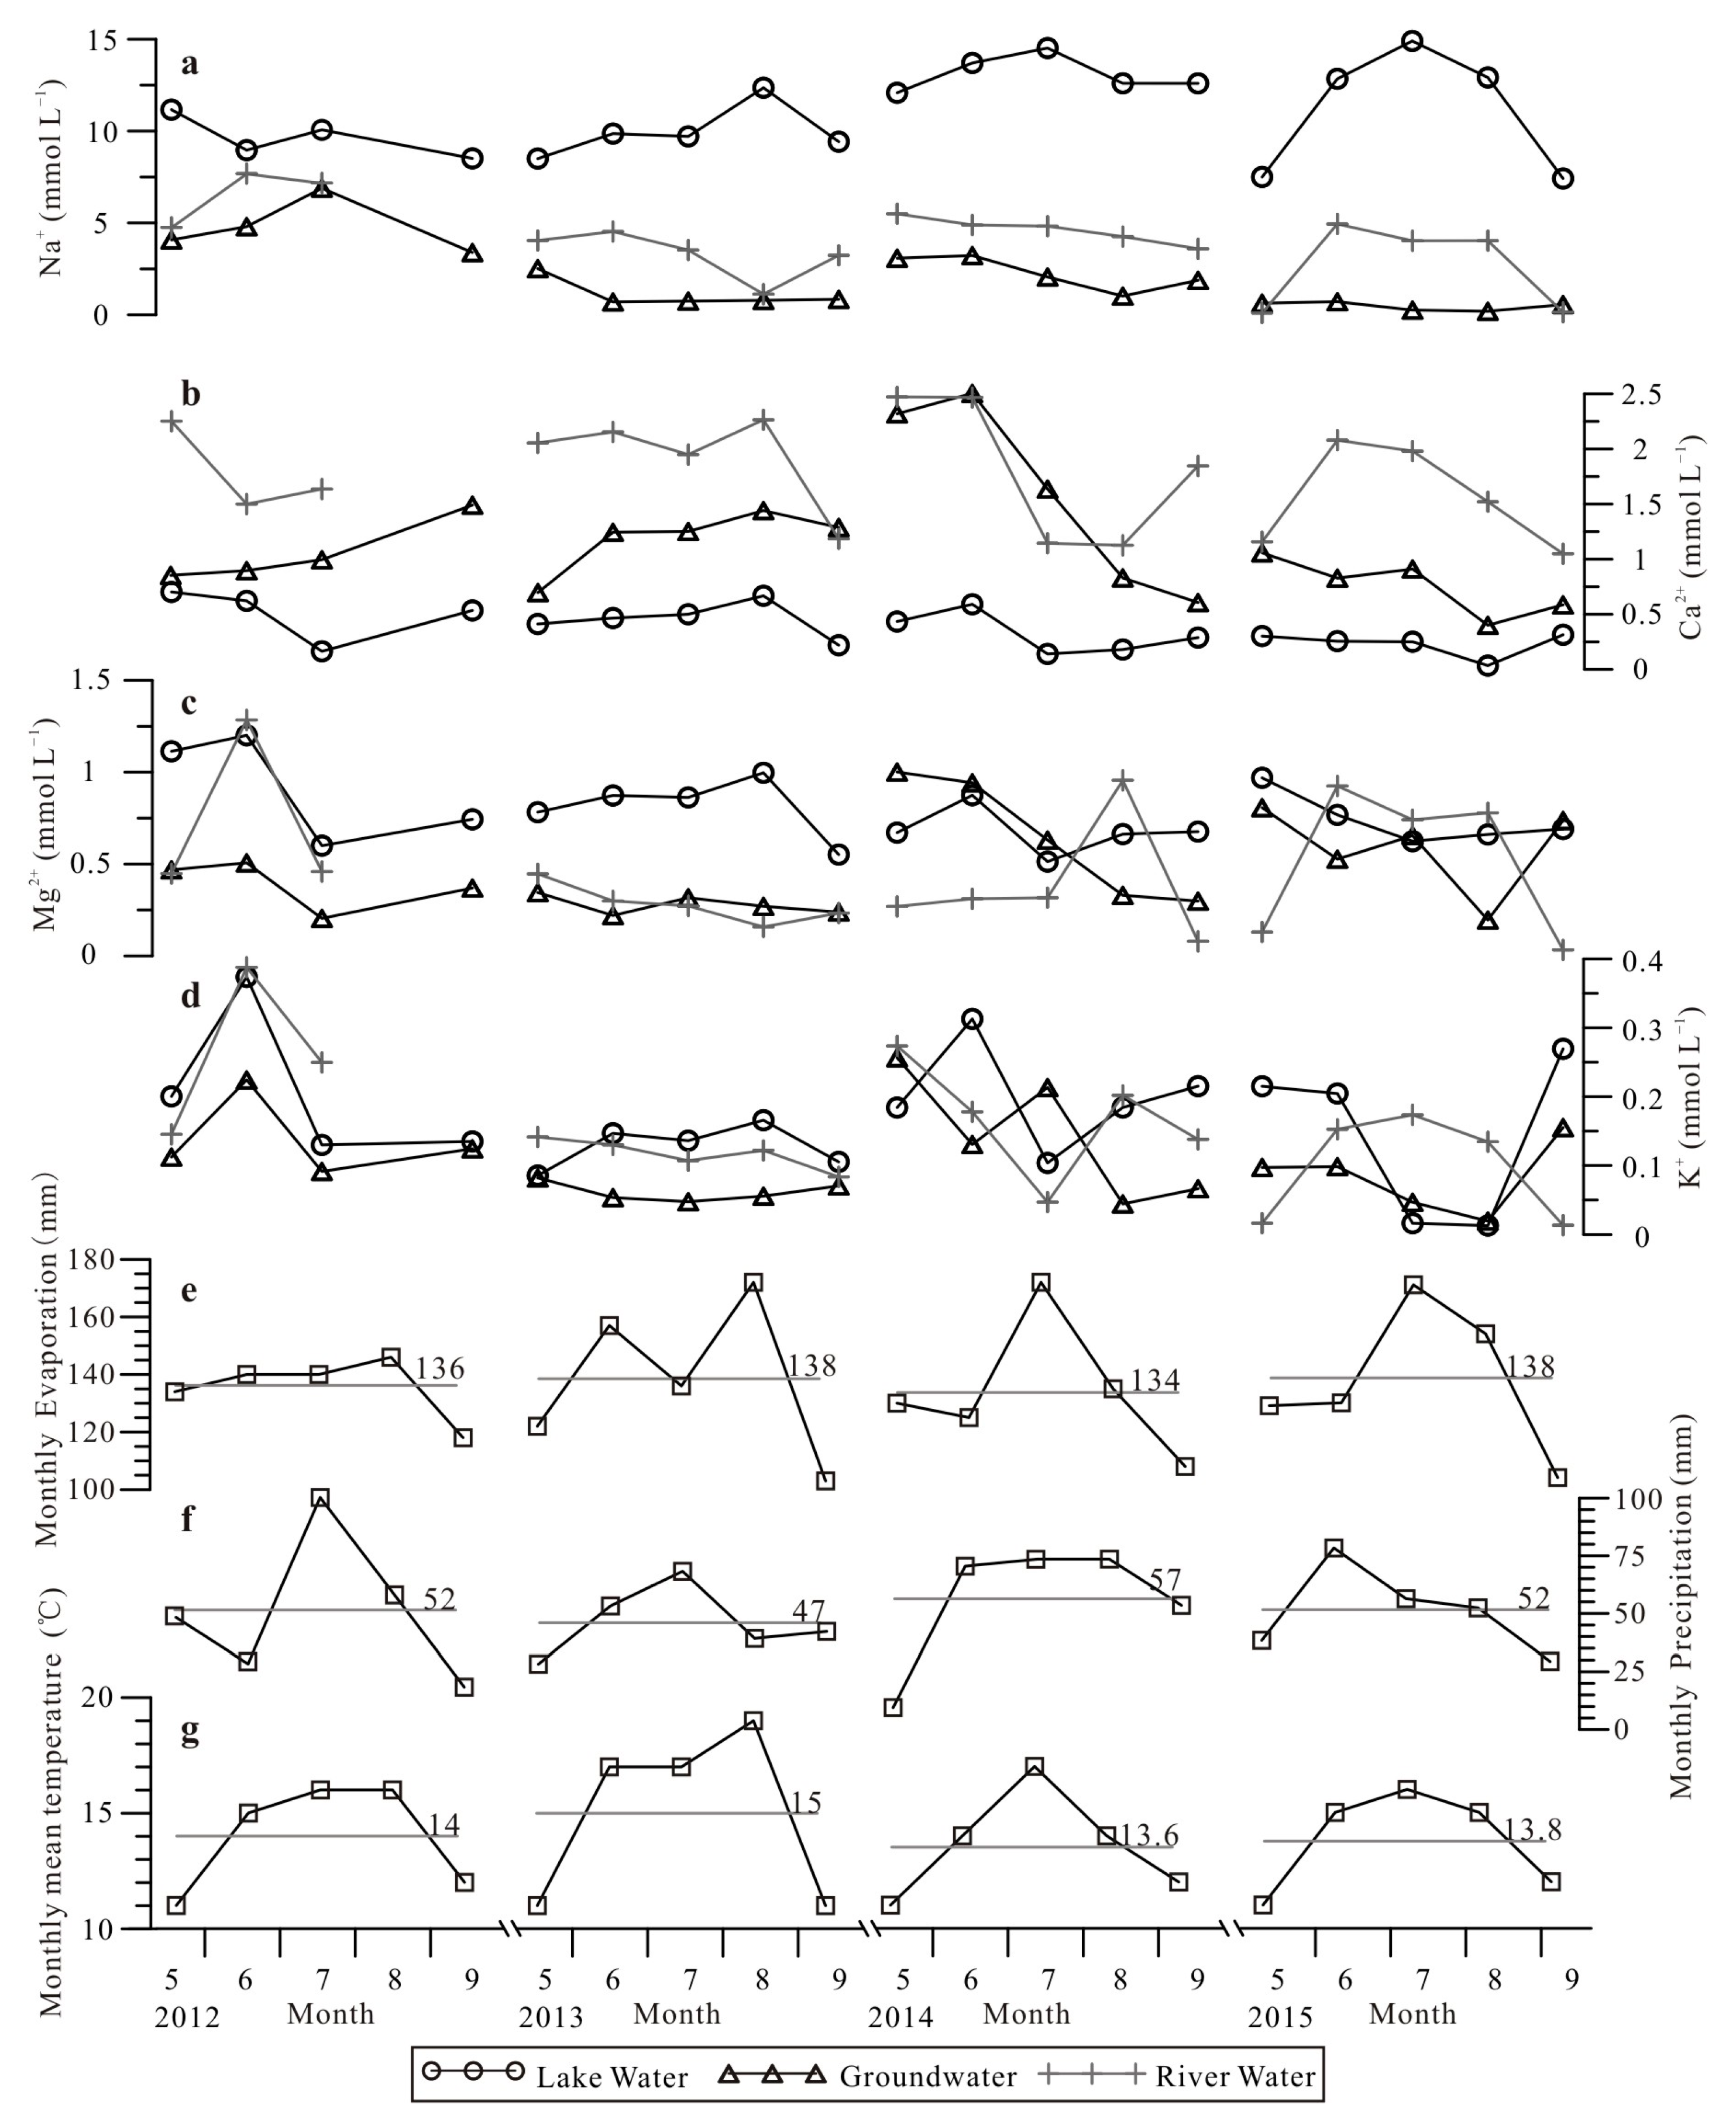
The highest Na+ concentration observed was the lake water, with values ranging from 7.01 to 15.00 mmol L−1. Its concentration showed varying degrees of increase in August 2013, July 2014, and July 2015. In addition, its overall concentration in 2012 and 2013 was lower than that in 2014 and 2015. In comparison, the concentrations of Na+ in river and groundwater were lower and showed less annual fluctuations, with values ranging from 0.10 to 9.13 mmol L−1 and from 0.20 to 6.89 mmol L−1, respectively (Table 1; Figure 4a). On an interannual scale, the Na+ concentrations in river and groundwater were higher in 2012 and lower in 2015.
The lowest Ca2+ concentration was observed in lake water, with values ranging from 0.03 to 0.70 mmol L−1, with slight decreases in July 2012 and July 2014. In comparison, the concentrations of Ca2+ were higher in river and groundwater, with values ranging from 1.05 to 2.47 mmol L−1 and from 0.40 to 2.50 mmol L−1, respectively (Table 1; Figure 4b). The observed concentration of Ca2+ was high in groundwater in 2014, whereas in river water, it was high in 2013.
4.2. Differences in Ionic Concentrations and Compositions of Various Water Bodies
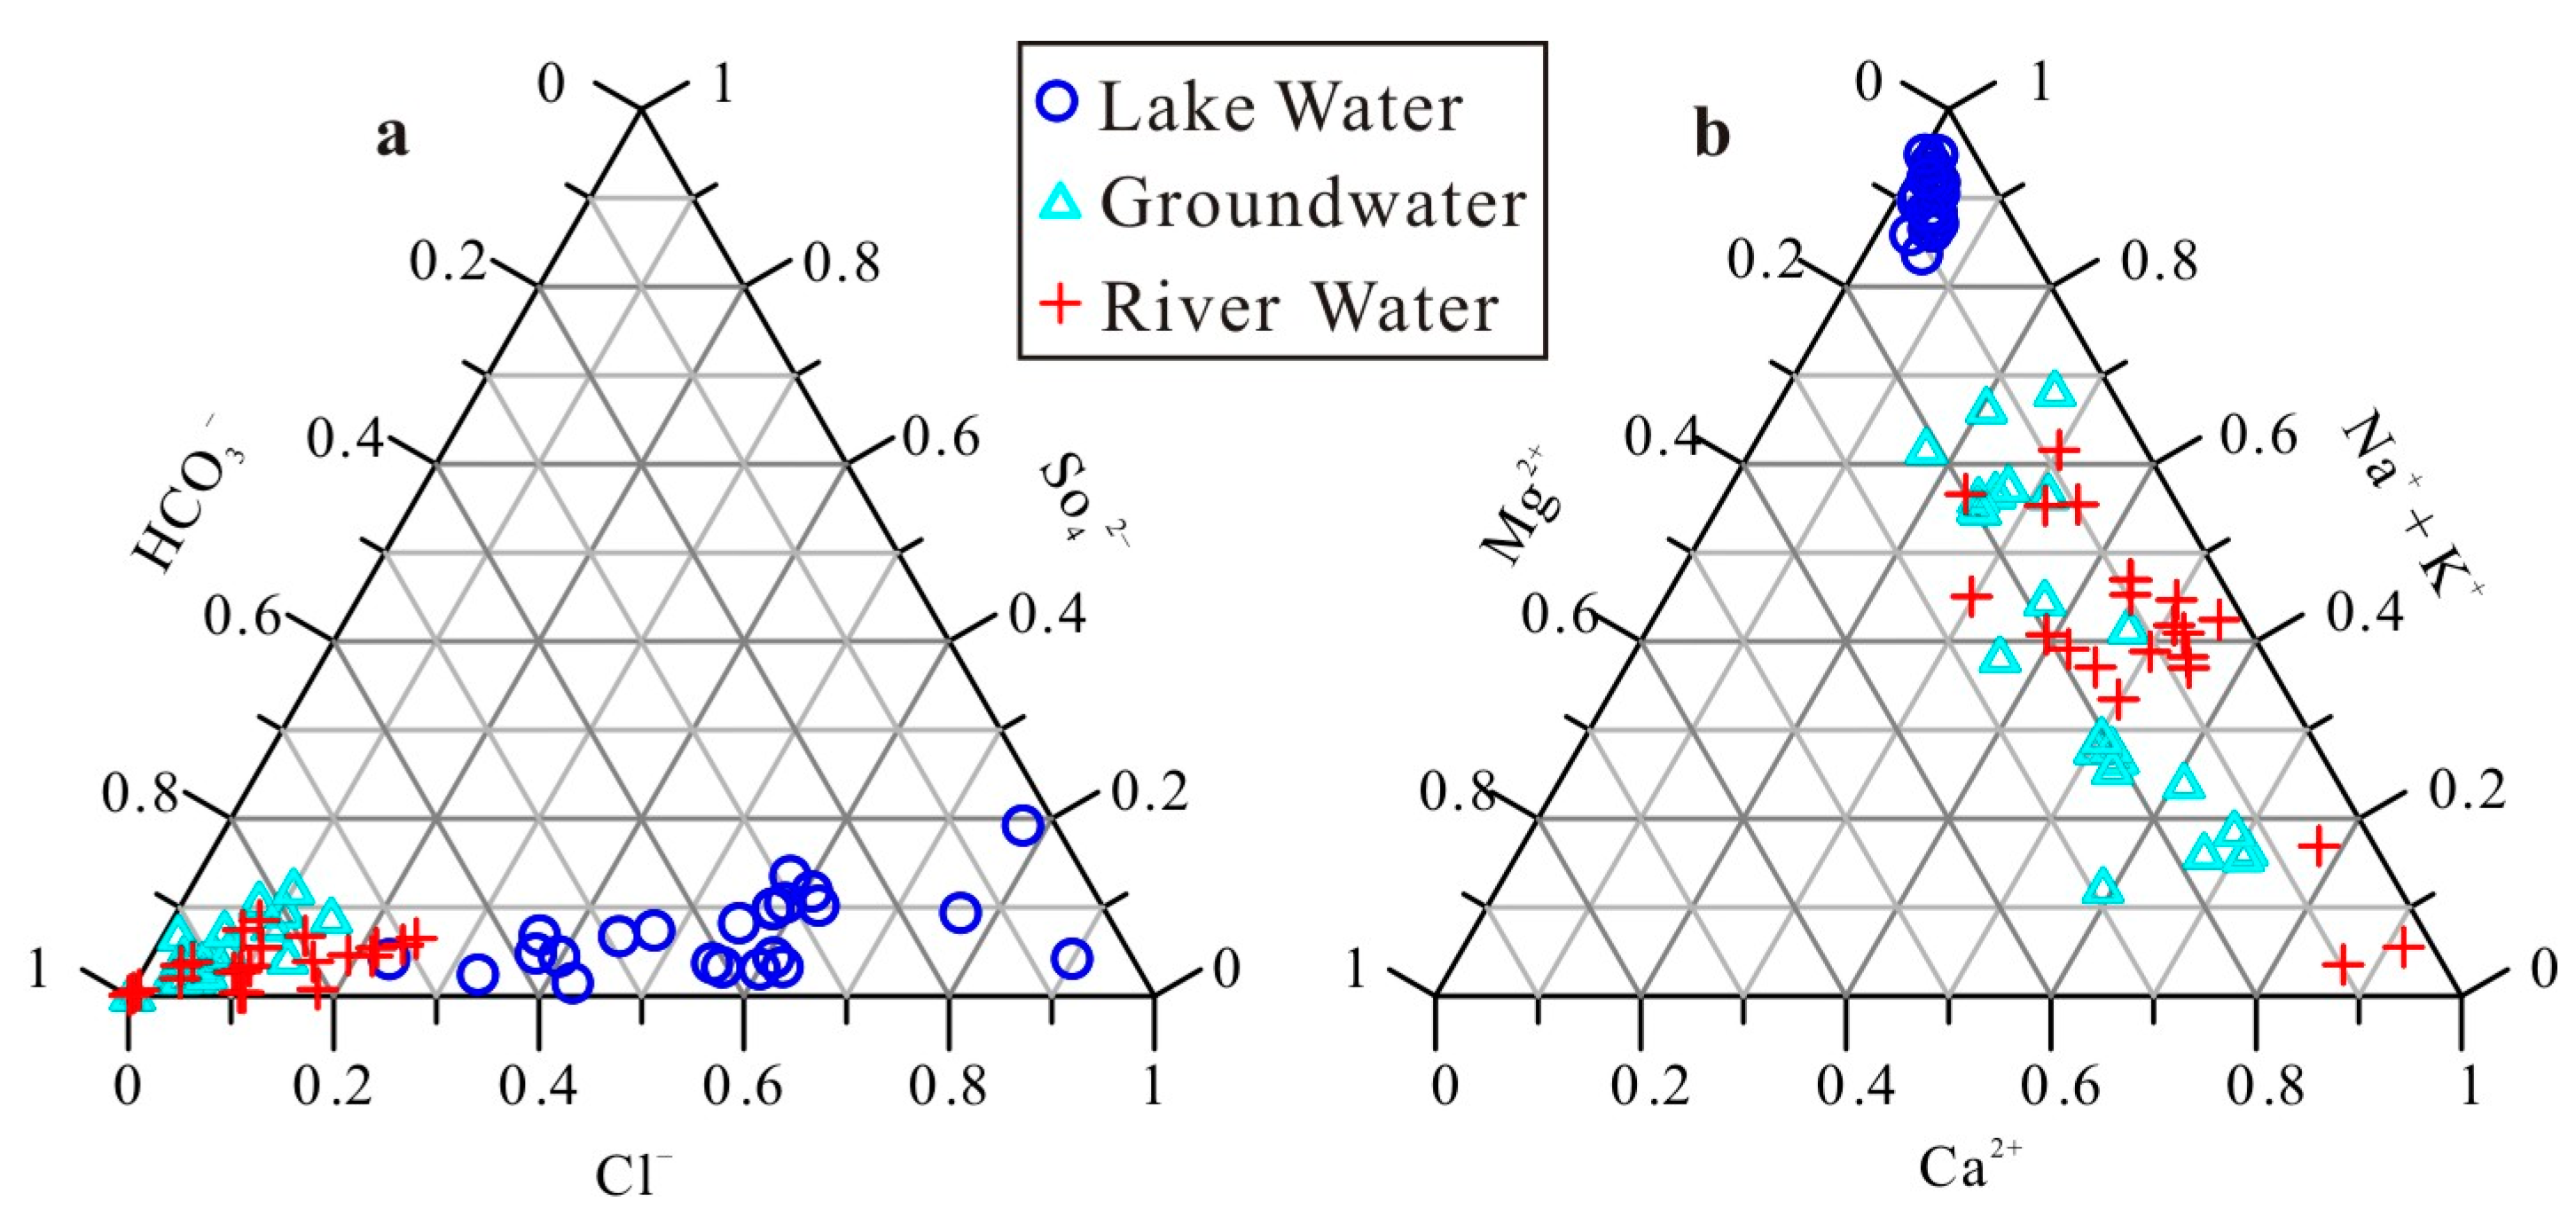
Ternary plots of the major ions in water can reflect the ionic composition and characteristics of a water body [35]. The dominant anion in the Genggahai Lake was Cl−, which accounted for 20% to 90% of the total anionic composition. Moreover, HCO3− accounted for a high proportion (up to 60%) of the total anionic concentration, whereas the concentration of SO42− was less than 20% (Figure 5a). The dominant cations in lake water were Na+ and K+, which accounted for more than 80% of the total cation content. The contents of Ca2+ and Mg2+ were notably lower, composing less than 10% and 20 %, respectively, of the total cation content (Figure 5b).
Unlike lake water, the dominant anion observed in groundwater and river water was HCO3−, which accounted for more than 70% of the total anion content. The Cl− concentration was lower, showing only small variations and generally not exceeding 20%–30% of the total anion content. The concentration of SO42− was also low, generally ranging from 10% to 20% of the total anion content (Figure 5a). The distribution of the cation concentration in river water mainly plots on the (Na+ + K+) − Ca2+ line in Figure 5b. In river water, Na+ + K+ accounted for 30%–60% of the total cation concentration; whereas in groundwater, the Na+ + K+ concentration was lower, accounting for about 10%–70% of the total cation concentration (Figure 5b). In addition, the concentrations of Ca2+ in these two types of water bodies were also relatively high, accounting for 20%–90% and 30%–60% of the total cation concentration, respectively; whereas Mg2+ accounted for less than 30% of the total cation content in all water types.
In summary, the observations concluded that in lake water, Cl− and Na+ were the primary anions and cations, respectively; whereas in groundwater and river water, HCO3− was the primary anion and Na+ and Ca2+ were the primary cations.
5. Discussion of Factors Controlling the Changes in Ionic Concentrations of the Genggahai Basin Water Bodies
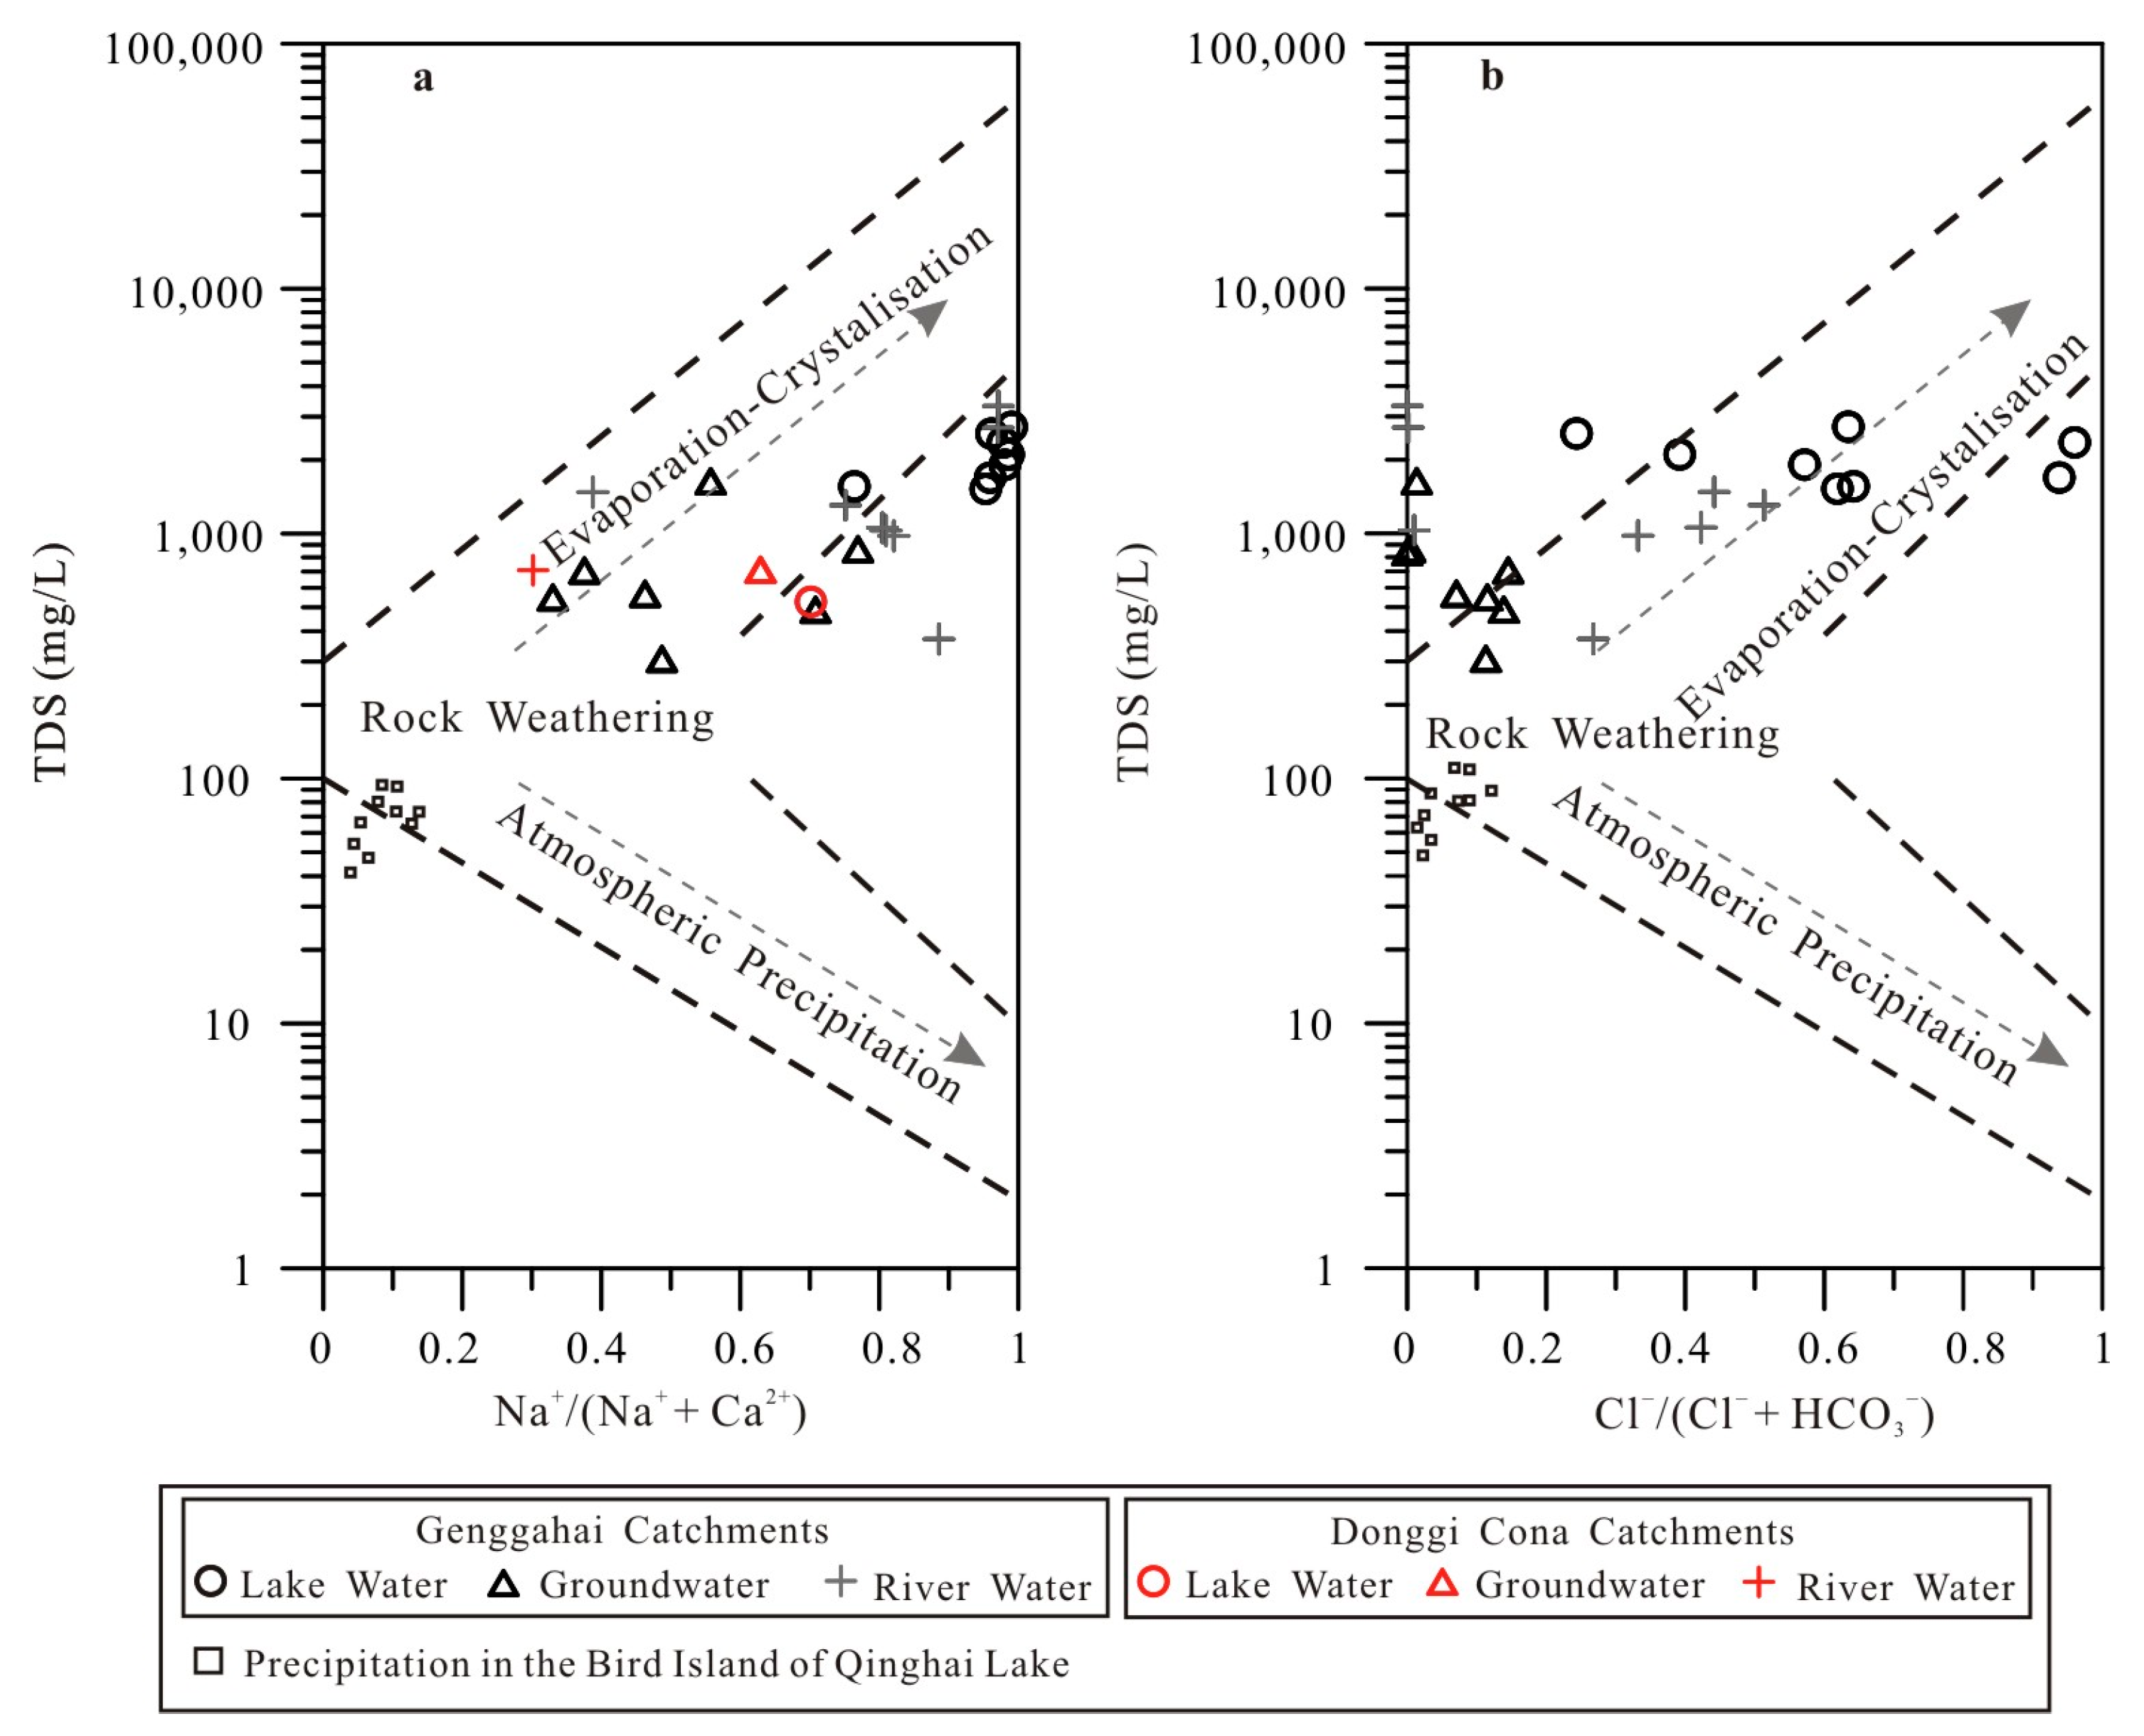
After analyzing the global hydrochemical compositions of the surface waters, Gibbs [2] proposed that the following three major factors control the surface water chemistry: rock weathering, atmospheric precipitation, and evaporation–crystallization process. In addition, Gibbs [2] used a TDS-Na+/(Na+ + Ca2+) diagram and a TDS-Cl−/(Cl− + HCO3−) diagram to distinguish the characteristics of ionic distribution in different natural water bodies. However, Gibbs’ model is based primarily on large lake and river samples and may not be suitable for small water bodies and small lakes in arid and semi-arid regions. For example, the ion compositions of water samples from tropical small African lakes with large salinity and alkalinity are far away from the Gibbs diagram, and the anion distribution is far from the Gibbs model [46].
It is clear from the Gibbs’ diagrams showing the hydrochemical data of different water bodies in the Genggahai basin (Figure 6), that the groundwater and the river water are in the transition zone that is controlled by rock weathering and evaporation–crystallization, and away from the area controlled by atmospheric precipitation; this indicates that the soluble ions in the groundwater and the river water are controlled by rock weathering. In addition, the groundwater is closer to the area controlled by rock weathering, whereas the river water is closer to the area controlled by evaporation–crystallization, which shows that the river water is more significantly affected by evaporation than groundwater. Due to fact that the concentrations of HCO3− in the river and groundwater are relatively high, the hydrochemical data of some river and groundwater samples are not shown on the Gibbs distribution diagram (Figure 6b). This is related to the widespread distribution of paleolake basin sediments from the early and middle Pleistocene formed in the basin [36].
Some of hydrochemical data from the lake water samples fall close to the upper limit of the evaporation–crystallization control zone, while data from other samples fall outside the range of the Gibbs diagram, which could be attributed to two processes; either the Na+ and TDS contents of the Genggahai Lake water were relatively high due to evaporation, or the vigorous photosynthetic activity of Chara spp. lead to high precipitation of calcite and aragonite, which lowered the Ca2+ content (Figure 6a). These findings are consistent with the results of Weynell et al. [23] on the hydrochemistry of the Lake Donggi Cona (Figure 6a).
As mentioned above, there are no surface inflows to the Genggahai Lake, and groundwater and precipitation are the main sources of replenishment. Unfortunately, no precipitation samples were collected from the Genggahai basin. Considering that the Bird Island of Qinghai Lake is closer to Genggahai (straight-line distance is about 100 km), in addition, both areas are located in the northeastern part of the QTP. Therefore, we referred to the ion content data of the precipitation samples from the Bird Island of Qinghai Lake. The hydrochemical data of Bird Island rainwater falls in the rock weathering control zone of the Gibbs model (Figure 6) [35]. This indicates that the dissolved matter in the rainwater of Bird Island is weakly affected by ocean evaporation and may be mainly controlled by the dissolution of atmospheric CaCO3 particles [35]. From this, it is speculated that the rainfall in the Genggahai basin may have similar hydrochemical characteristics to that of the island.
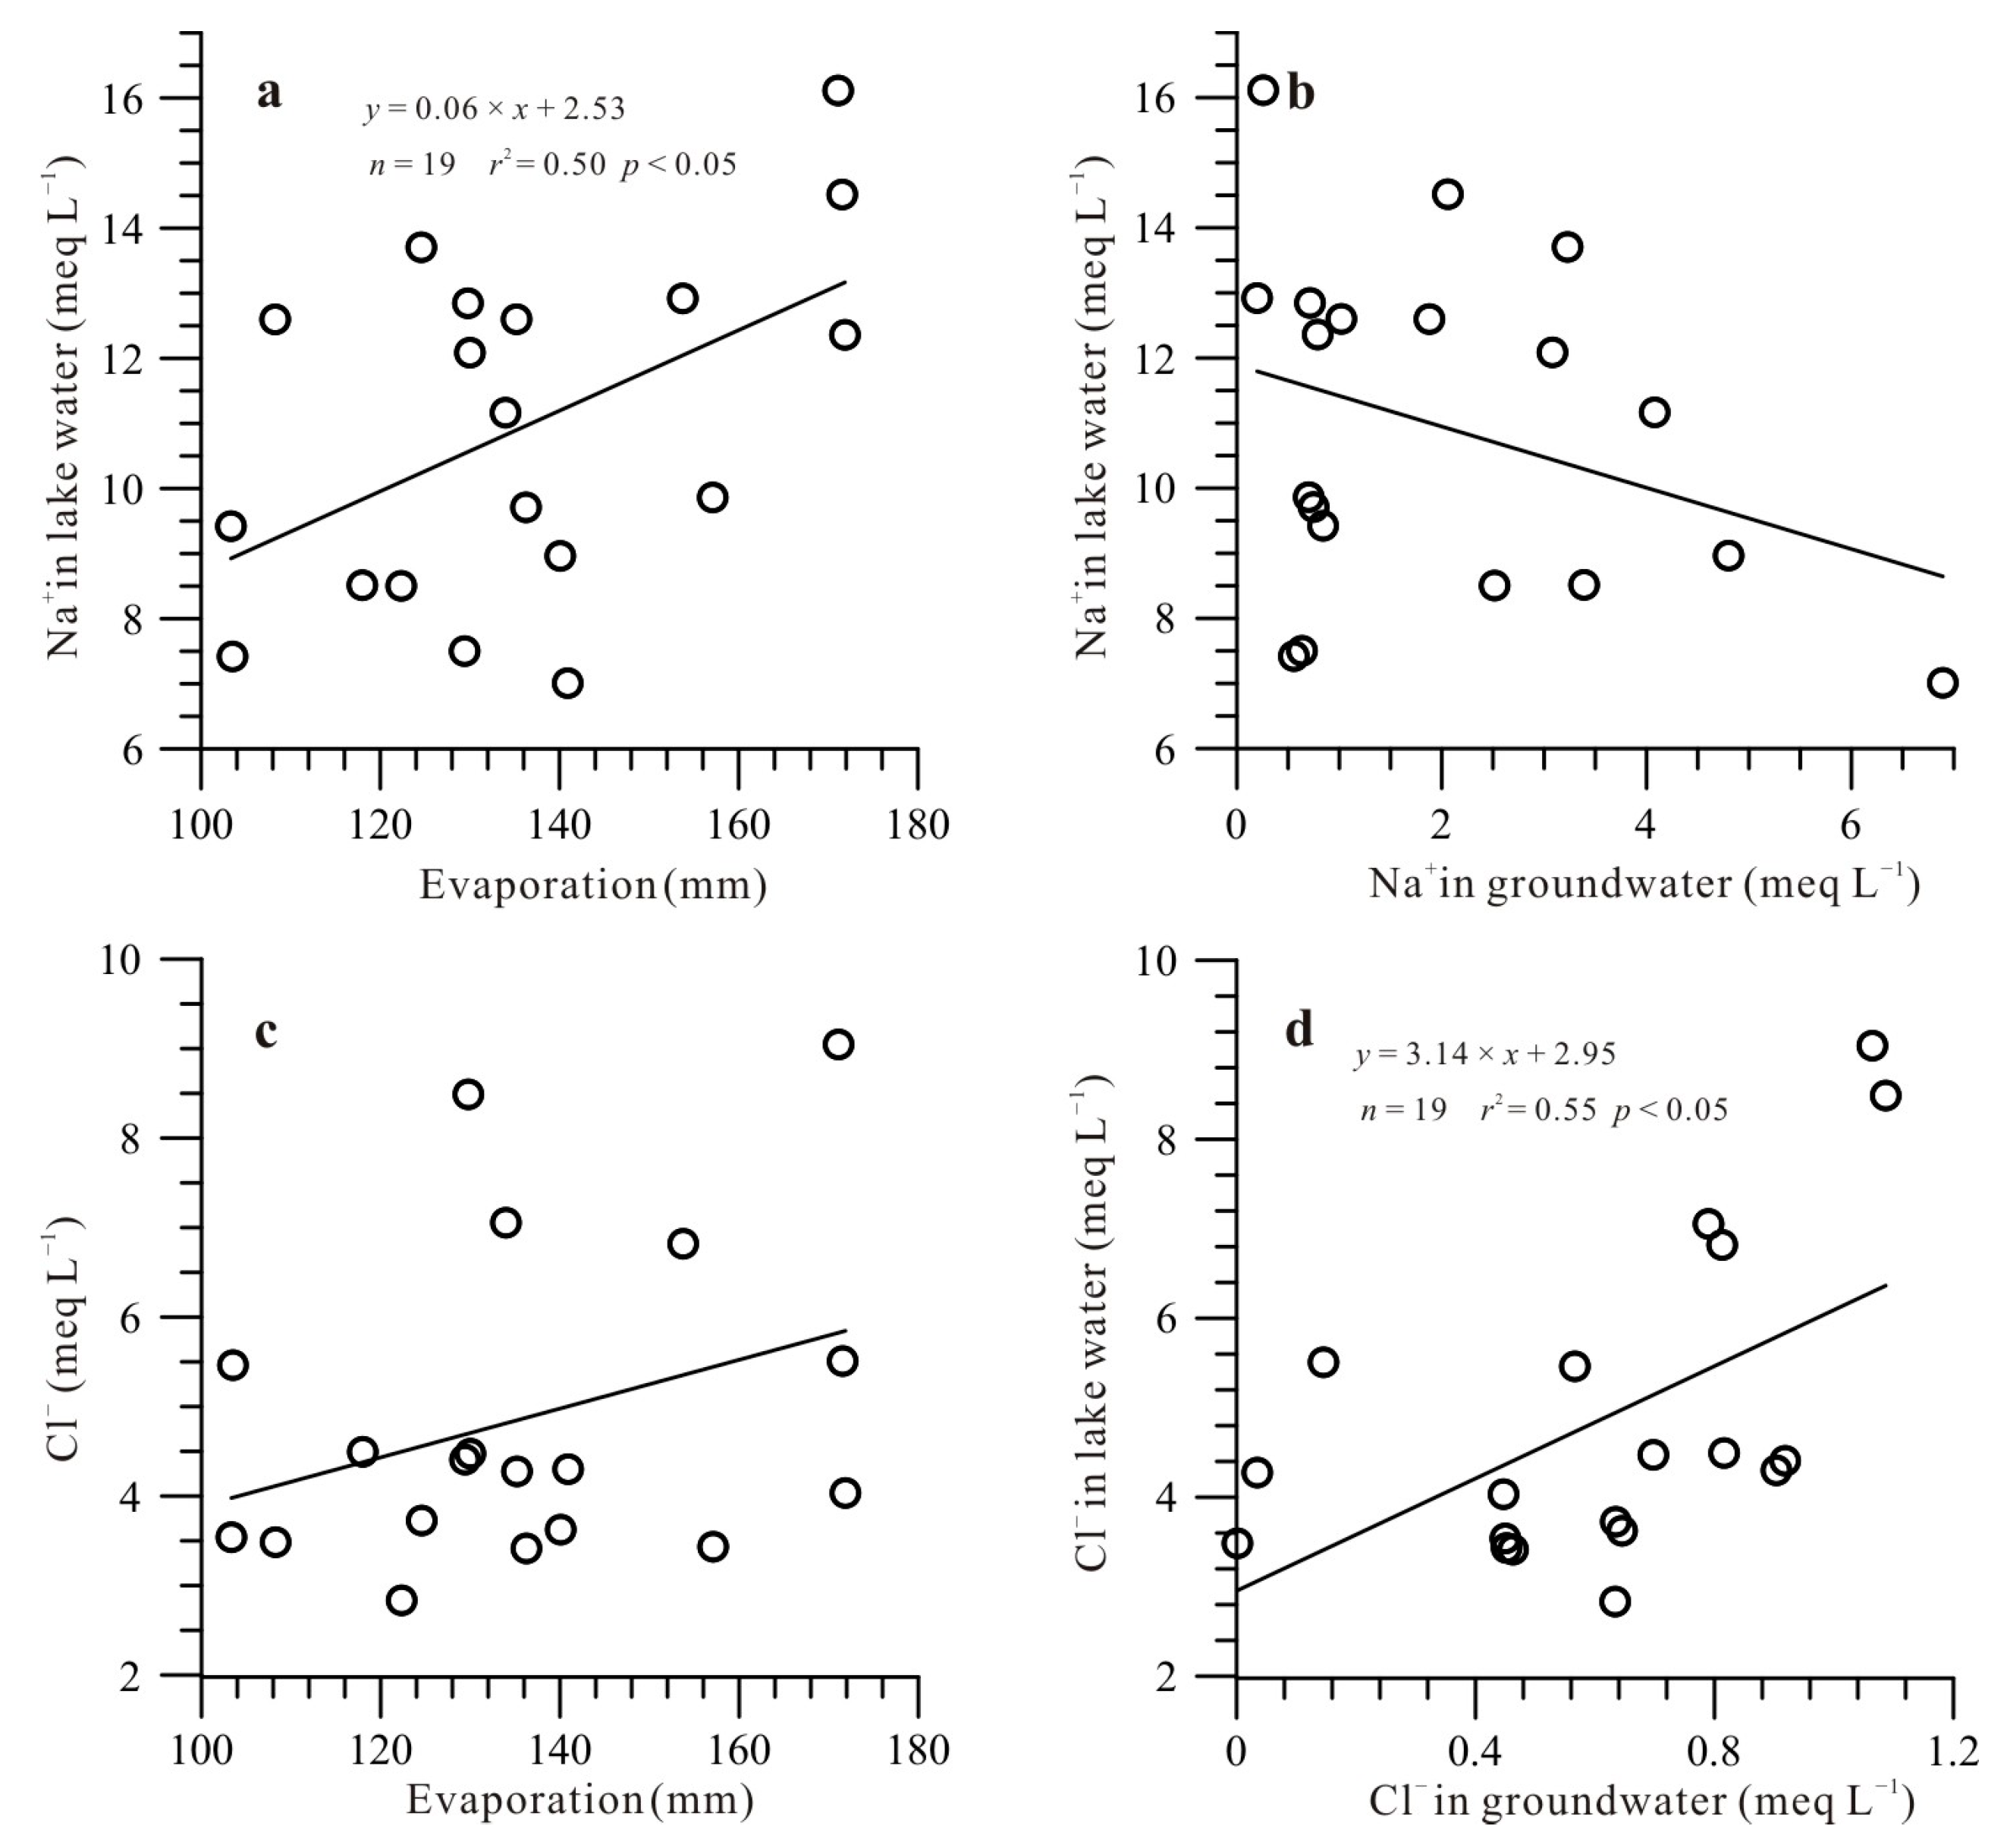
The lake water anion is dominated by Cl− and the cation is mainly Na+. Evaporation is an intense process due to the vast surface area of the lake, thus making the Cl− concentration and Na+ concentration of the lake water higher than that of the groundwater or river waters. A significant positive correlation between the Na+ content of the lake and the evaporation of the basin also illustrated this point (Figure 7a). Specifically, in August 2013, July 2014, and July 2015, the concentration of Na+ in the lake water increased, which can be attributed to a high degree of evaporation and a low amount of precipitation during these three periods (Figure 4a,e,f). However, the lake water Cl− content and basin evaporation did not exhibit a correlation (Figure 7c). This might be related to the relatively stable Cl− content of groundwater coming into the lake (Figure 3a) and the fact that it is significantly positively correlated to the lake water Cl− content (Figure 7d). In addition, no correlations were observed between the lake water Cl− content and basin evaporation (Figure 7c) as well as the lake Na+ content and the Na+ content of groundwater coming into the lake (Figure 7b). This indicates that the lake water Na+ content may be more affected by evaporation, while the fluctuation of lake water Cl− content may be more related to changes in the Cl− content of groundwater coming into the lake.
The Ca2+ and HCO3− content of lake water were lower than that of river water and groundwater (Figure 3b; Figure 4b). Studies have shown that the best growing season for Chara spp. is from May to August [47,48,49]. On the one hand, the photosynthesis process of the Chara spp. reduces the pCO2 in the lake water, and enables the rapid precipitation of carbonate, which results in the lower Ca2+ and HCO3− content of lake water than that of river water and groundwater. On the other hand, during the enhanced period of photosynthesis of Chara spp., a large amount of carbonate precipitate can be fixed on the plant wall to form carbonate crust. Studies have shown that the Genggahai Chara spp. carbonate crust content can account for 34%–57% of the dry weight of the Chara plant [50], and even 60%–77% in other areas [51,52]. During July 2012 and July 2014, the Ca2+ concentration decreased, which was related to the increase in temperature and the intensified photosynthetic activity of Chara spp. during these periods (Figure 4b,g). In August 2013 and July 2015, the temperature increased, but the corresponding Ca2+ contents did not decrease; this is possibly a result of the increases in Ca2+ contents in the groundwater during the corresponding periods (Figure 4b,g).
6. Ion Sources
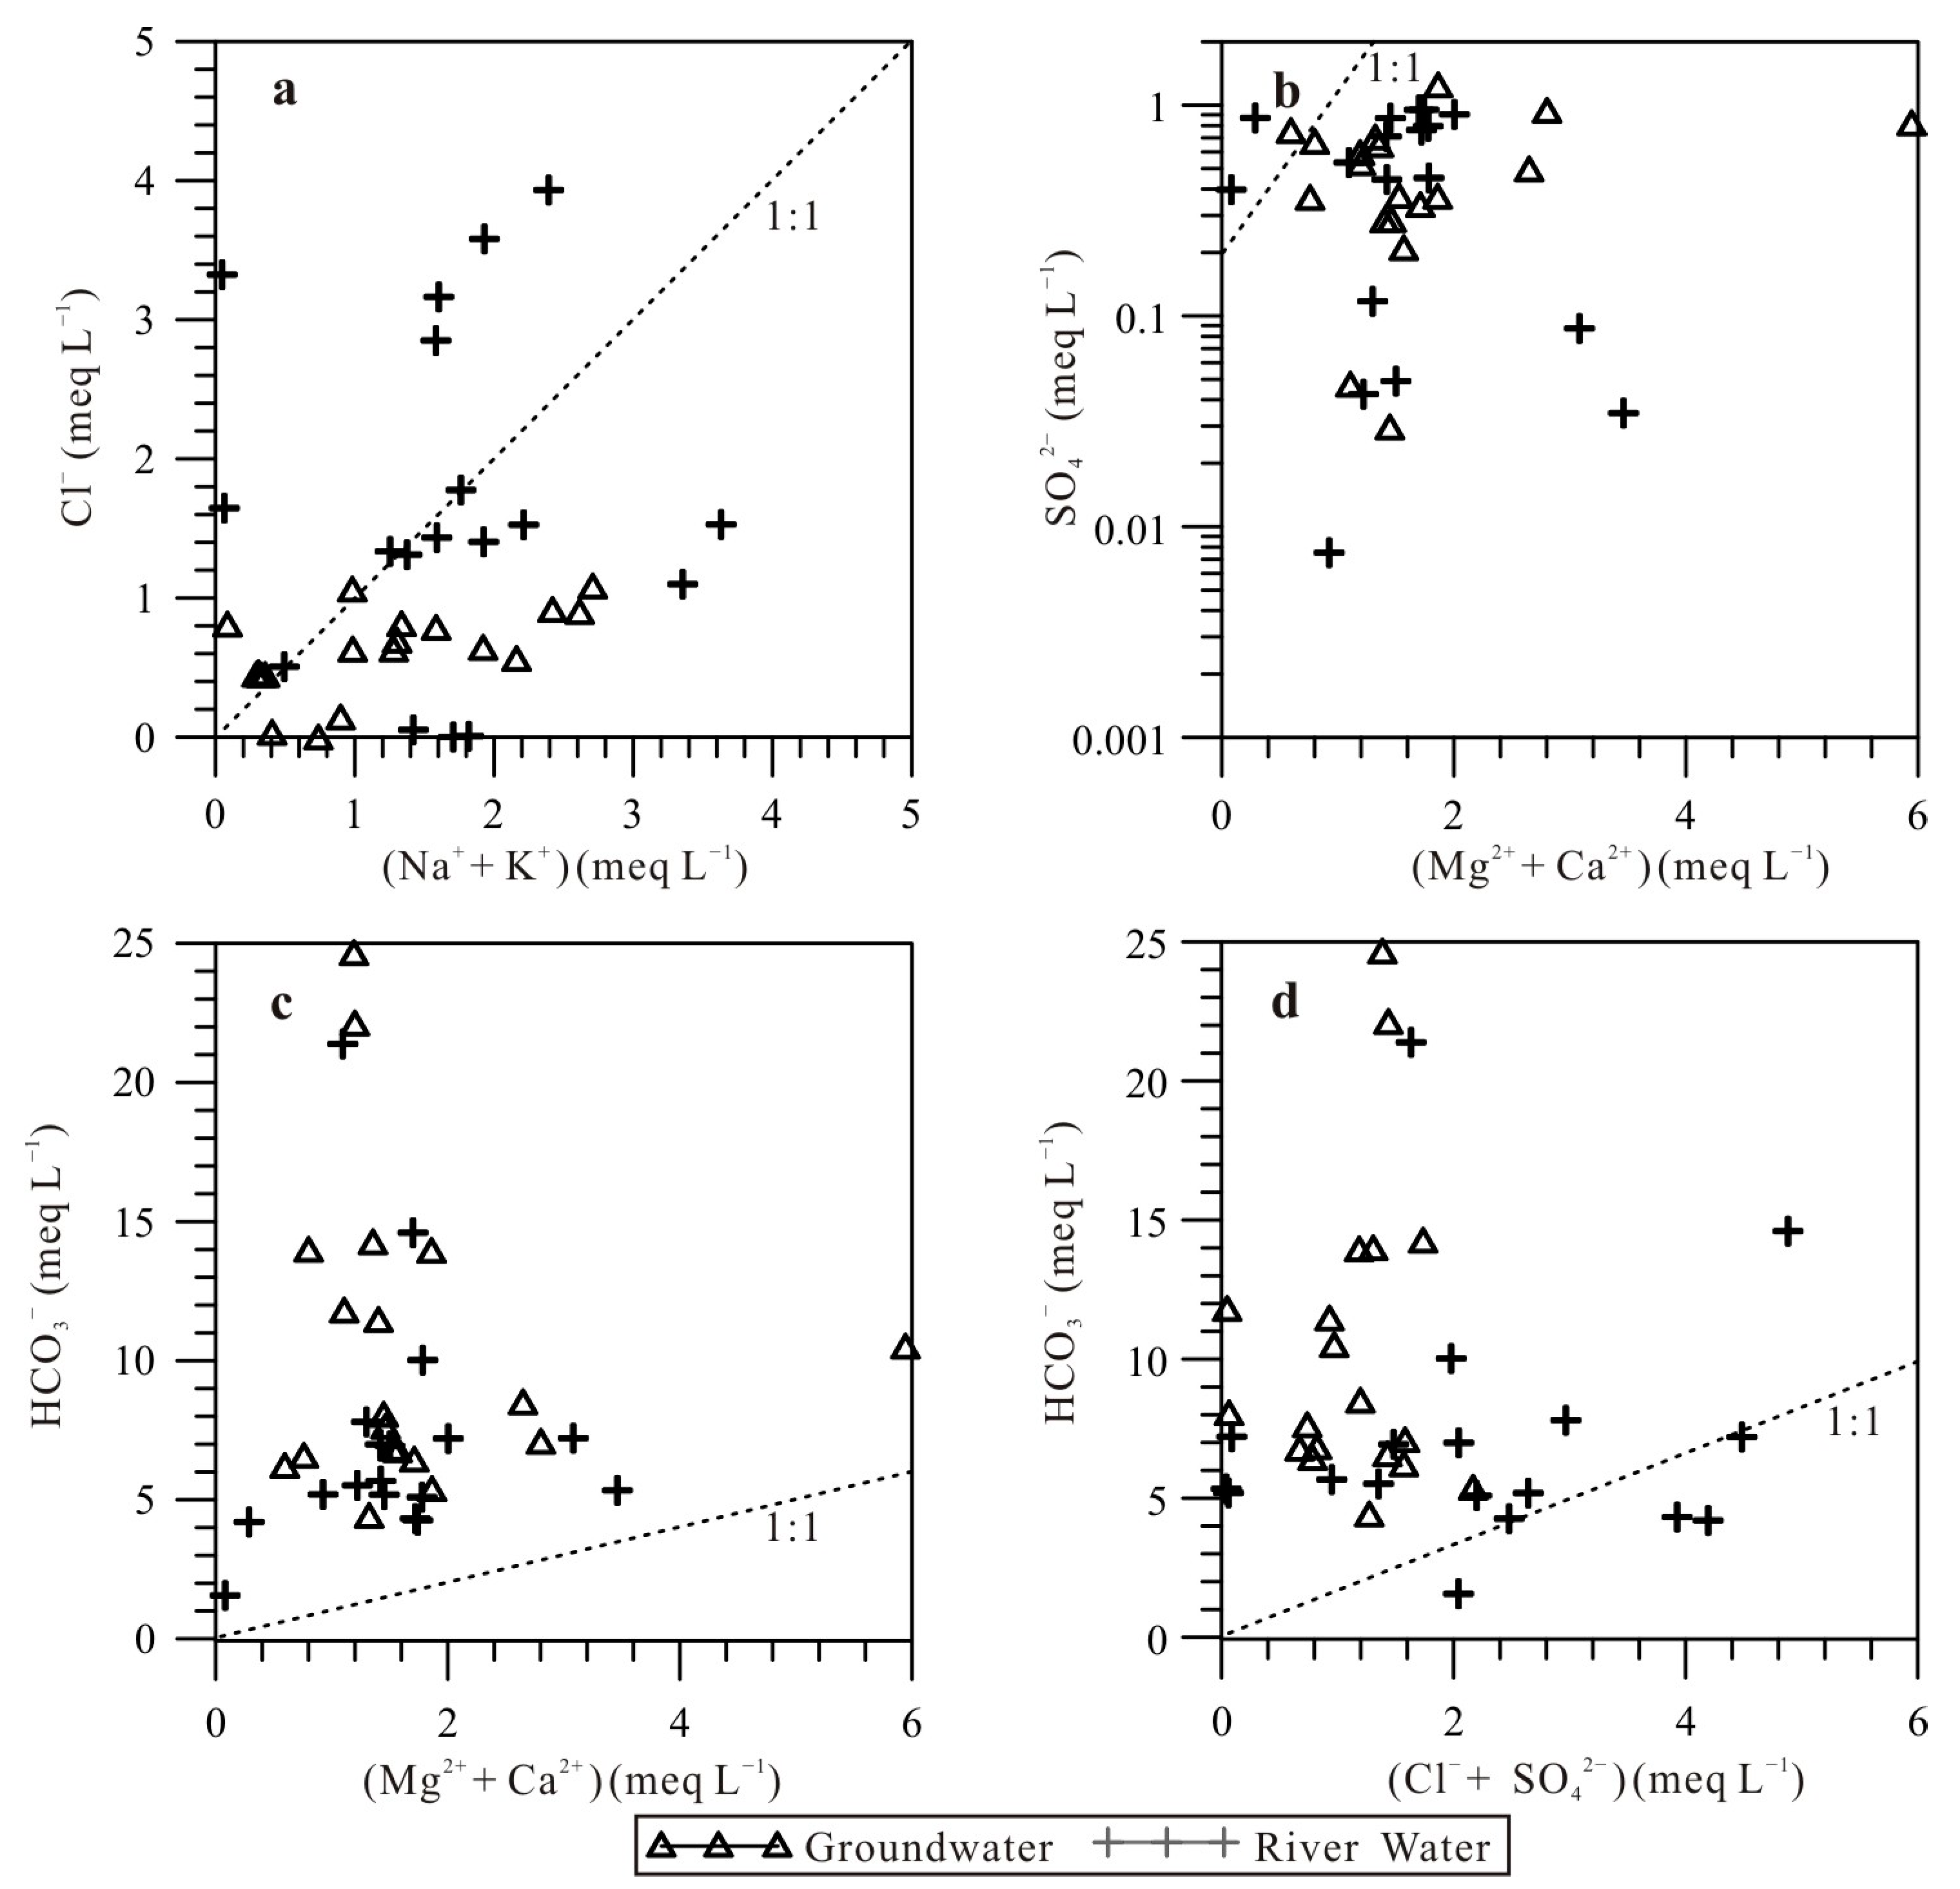
The anions of groundwater in the Genggahai basin and Shazhuyu river water are mainly HCO3−, and the cations are mainly Ca2+ and Na+. Na+ and K+ in water are from the weathering products of evaporite and silicate. Ca2+ and Mg2+ are mainly from carbonate, evaporite, and silicate. HCO3− is mainly from carbonate rock. Cl− and SO42− are mainly from the dissolution of evaporite [16,53]. If Na+ and Cl− in groundwater coming into the lake and Shazhuyu river water are only from the dissolution of evaporite, then the variation of Na+ and Cl− content in river water and groundwater should be roughly similar [15]. In fact, the variation of Na+ and Cl− content in river water and groundwater is quite different, reflecting that there may be other sources in addition to the dissolution of Na+ in the groundwater from the evaporite. As shown in Figure 8a, most of the river water and groundwater Cl−/(Na+ + K+) are located below the 1:1 line and far away from the line, indicating that the weathering of the silicate rock in the basin has a significant impact on the change of Na+ in the water [54]. Similarly, the river water and groundwater SO42−/(Ca2+ + Mg2+) are mostly located below the 1:1 line (Figure 8b), indicating the weathering of carbonate and silicate in the basin has an important impact on the Ca2+ and Mg2+ in the water body. In addition, the river water and groundwater HCO3−/(Ca2+ + Mg2+) (Figure 8c) and HCO3−/(Cl− + SO42−) (Figure 8d) are mostly above the 1:1 line, indicating that the carbonate weathering in the basin has a stronger impact on the ion content in river water and groundwater than the silicate weathering. This further confirms the important contribution of the ancient lacustrine sediments [36] formed in the basin during the Early and Middle Pleistocene to the ions in the basin water bodies.
The selective weathering of bedrock minerals by rivers gives river waters different hydrochemical characteristics, thus exhibiting their specific elemental ratios. The ratio of river water (Ca2+ + Mg2+)/(Na+ + K+) can be used as an indicator to determine the relative strength of different rock weathering in the basin [35]. The ratio of (Ca2+ + Mg2+)/(Na+ + K+) in Shazhuyu River is 1.37, which is lower than the world average (2.2) [52], far lower than the Indus River controlled by carbonate weathering (6.0) [52]. However, the (Ca2+ + Mg2+)/(Na+ + K+) ratio of the Shazhuyu River water is higher than that of the rivers around the Taklimakan Desert (0.89) affected by evaporite [16]. This again shows that although evaporite has an effect on the hydrochemical composition of the Genggahai basin, carbonate weathering has a greater impact on the hydrochemical composition of the Genggahai basin. The presence of substances formed from aquatic life in natural water, such as nitrogen-containing compounds, sulfur, and phosphorus compounds (NH4+, NO2−, NO3−, SO42−, H2PO4−, etc.), can, to a certain extent, reflect the effects of organisms or human activities on the hydrochemical compositions [13,55]. The average NO3− content of river water samples in the study area is 3.68 μg g−1, which is similar to that in the rivers in the Taklimakan Desert (3.63 μg g−1) [16]. The average NO3− content of groundwater samples in the study area is 6.40 μg g−1. The NO3− content of river water and groundwater are all higher than the river water average in Asia (0.7 μg g−1) and the world average of river water (1 μg g−1) [56]. This suggests that the content of NO3− in the Shazhuyu River and groundwater is probably affected by human activities, which may be mainly related to herdsmen’s grazing activities in the basin.
7. Conclusions
- (1)
- The chemical composition of the water samples in the Genggahai basin falls in the middle–upper wing of the boomerang envelope model proposed by Gibbs, indicating that the chemical composition of the water sample in the study area is affected by rock weathering and evaporation–crystallization.
- (2)
- The groundwater and river anions in the Genggahai basin are dominated by HCO3−, which is from the rock weathering and dissolution in the basin. The cation is mainly Ca2+ + Na+. Evaporite, carbonate, and silicate in the basin all have an impact on the hydrochemical composition of river water and groundwater. Among them, the largest contribution of carbonate weathering mainly comes from rock weathering and dissolution. The grazing activities of herdsmen in the basin have had a certain degree of impact on the water quality of river basins and groundwater.
- (3)
- The anion of lake water is mainly Cl−, and the cation is mainly Na+. The content change is mainly affected by the change of corresponding ion content in groundwater coming into the lake and the evaporation of lake water. Among them, Cl− in lake water is more affected by the change of Cl− content in the groundwater coming into the lake, while Na+ in lake water is more affected by evaporation. The low content of Ca2+ and HCO3− in the lake water is related to the photosynthesis of aquatic plants in the lake.
Author Contributions
Conceptualization, Y.J. and X.J.; Writing—original draft preparation, Y.J. and X.J.; Writing—review and editing, X.J., D.Y. and X.M.
Funding
This research was funded by grants from the Natural Science Foundation of Qinghai Province [No. 2019-ZJ-939Q &2017-ZJ-961Q] and the National Natural Science Foundation of China [No. 41,801,094] and the Foundation for the young researchers of Qinghai Normal University [No. 2018zr014].
Acknowledgments
We thank reviewers for their constructive comments and suggestions to improve the early version of this paper. We also thank Y. Li and F.S. Li and G.G. Wang for their assistance in field work.
Conflicts of Interest
The authors declare no conflict of interest.
References
- Wang, S.M.; Dou, H.S. Lake Cadaster of China; Science Press: Beijing, China, 1998. [Google Scholar]
- Gibbs, R.J. Mechanisms controlling world water chemistry. Science 1970, 170, 1088–1090. [Google Scholar] [CrossRef] [PubMed]
- Meybeck, M. Global Chemical Weathering of Surficial Rocks Estimated from River Dissolved Loads. Am. J. Sci. 1987, 287, 401–428. [Google Scholar] [CrossRef]
- Négrel, P.; Allègre, C.J.; Duprè, B.; Lewin, E. Erosion sources determined by inversion of major and trace element ratios and strontium isotopic ratios in river water: The Congo Basin case. Earth Planet. Sci. Lett. 1993, 120, 59–76. [Google Scholar] [CrossRef]
- Liu, Z.H. New progress and prospects in the study of rock-weathering-related carbon sinks. Chin. Sci. Bull. 2012, 57, 95–102. [Google Scholar] [CrossRef]
- Zhu, H.Y.; Chen, Y.J.; Liu, J.Z.; Gao, S. Variation and evolution of groundwater chemistry in the middle and lower reaches of the Tarim River. Arid Land Geogr. 2013, 36, 8–18. [Google Scholar]
- Hao, Y.L.; Chen, J.F.; Zhang, C.C.; Yan, Y.X. Hydrochemical characteristics of the irrigation area in the middle reaches of the Heihe River Basin. Arid Land Geogr. 2011, 34, 575–583. [Google Scholar]
- Nian, F.H.; Li, X. A comprehensive review of the research on hydrography in arid lands in China. Arid Land Geogr. 2000, 23, 91–95. [Google Scholar]
- Gibbs, R.J. Water chemistry of the Amazon River. Geochim. Cosmochim. Acta 1972, 36, 1061–1066. [Google Scholar] [CrossRef]
- Sarin, M.M.; Krishnaswami, S.; Dilli, K.; Somayajulu, B.L.K.; Moore, W.S. Major ion chemistry of the Ganga-Brahmaputra river system: Weathering processes and fluxes to the Bay of Bengal. Geochim. Cosmochim. Acta 1989, 53, 997–1009. [Google Scholar] [CrossRef]
- Weijden, C.H.V.D.; Middelburg, J.J. Hydrogeochemistry of the River Rhine: Long term and seasonal variability, elemental budgets, base levels and pollution. Water Res. 1989, 23, 1247–1266. [Google Scholar] [CrossRef]
- Singh, A.K.; Hasnain, S.I. Major ion chemistry and weathering control in a high altitude basin: Alaknanda River, Garhwal Himalaya, India. Hydrol. Sci. J. 1998, 43, 825–843. [Google Scholar] [CrossRef] [Green Version]
- Roy, S.; Gaillardet, J.; Allègre, C.J. Geochemistry of dissolved and suspended loads of the Seine River, France: Anthropogenic impact, carbonate and silicate weathering. Geochim. Cosmochim. Acta 1999, 63, 1277–1292. [Google Scholar] [CrossRef]
- Hu, M.H.; Stallard, R.F.; Edmond, J.M. Major ion chemistry of some large Chinese rivers. Nature 1982, 298, 550–553. [Google Scholar]
- Zhang, J.; Takahashi, K.; Wushiki, H.; Yabuki, S.; Xiong, J.-M.; Masuda, A. Water geochemistry of the rivers around the Taklimakan Desert (NW China): Crustal weathering and evaporation processes in arid land. Chem. Geol. 1995, 119, 225–237. [Google Scholar] [CrossRef]
- Zhu, B.Q.; Yang, X.P. Natural water chemistry and its origin in Taklimakan Desert. Chin. Sci. Bull. 2007, 52, 1561–1566. [Google Scholar]
- Han, G.; Liu, C.Q. Water geochemistry controlled by carbonate dissolution: A study of the river waters draining karst-dominated terrain, Guizhou Province, China. Chem. Geol. 2004, 204, 1–21. [Google Scholar] [CrossRef]
- Chen, J.S.; Wang, F.Y.; Xia, X.H. Geochemistry of water quality of the Yangtze River Basin. Earth Sci. Front. 2006, 13, 74–85. [Google Scholar]
- Zhang, L.T.; Chen, J.S. The relationship between the composition of the major ion of China and regional natural factors. Sci. Geogr. Sin. 2000, 3, 236–240. [Google Scholar]
- Royden, L.H.; Burchfiel, B.C.; Van der Hilst, R. The Geological Evolution of the Tibetan Plateau. Science 2008, 321, 1054–1058. [Google Scholar] [CrossRef] [Green Version]
- Tang, M.C.; Liu, Y.X.; Feng, S. A new millenary warm period maybe emerged. Plateau Meteorol. 2002, 21, 128–131. [Google Scholar]
- An, Z.; Kutzbach, J.E.; Prell, W.L.; Porter, S.C. Evolution of Asian monsoons and phased uplift of the Himalaya–Tibetan plateau since Late Miocene times. Nature 2001, 411, 62–66. [Google Scholar]
- Weynell, M.; Wiechert, U.; Zhang, C.J. Chemical and isotopic (O, H, C) composition of surface waters in the catchment of Lake Donggi Cona (NW China) and implications for paleoenvironmental reconstructions. Chem. Geol. 2016, 435, 92–107. [Google Scholar] [CrossRef]
- Ma, R.H.; Yang, G.S.; Duan, H.T.; Jiang, J.H.; Wang, S.M.; Feng, X.Z.; Li, A.N.; Kong, F.X.; Xue, B.; Wu, J.L.; et al. China’s lake at present: Number, area and spatial distribution. Sci. China Earth Sci. 2011, 41, 394–401. [Google Scholar] [CrossRef]
- Li, C.D.; Kang, S.C.; Liu, Y.Q.; Hou, J.Z.; Guo, J.M.; Liu, X.B.; Cong, Z.Y.; Zhang, Q.G. Distribution of major ions in waters and their response to regional climatic change in Tibetan lakes. J. Lake Sci. 2016, 28, 743–754. [Google Scholar] [Green Version]
- Gao, T.G.; Kang, S.C.; Zhang, Q.G.; Zhou, S.Q.; Xu, Y.W. Major ionic features and their sources in the Nam Co Basin over the Tibetan Plateau. Environ. Sci. 2008, 29, 3009–3016. [Google Scholar]
- Wang, J.B.; Zhu, L.P.; Ju, J.T.; Wang, Y. Water chemistry of Eastern Nam Lake area and inflowing rivers in Tibet. Sci. Geogr. Sin. 2009, 29, 288–293. [Google Scholar]
- Sun, R.; Zhang, X.Q.; Zheng, D. Spatial variations and its causes of water chemical property in Yamzhog Yumco Basin, South Tibet. Acta Geogr. Sin. 2013, 68, 36–44. [Google Scholar]
- Wang, L.J.; Zen, C.; Wang, G.X.; Shi, X.N.; Zhang, F. Chemical characteristics and impact factors of the Drem-tso Lake and supplying runoff in the Southern Tibet. Arid Land Geogr. 2017, 40, 737–745. [Google Scholar]
- Wang, P.; Shang, Y.N.; Shen, L.C.; Wu, K.Y.; Xiao, Q. Characteristics and Evolution of Hydrochemical composition of freshwater lake in Tibetan Plateau. Environ. Sci. 2013, 34, 874–881. [Google Scholar]
- Li, H.; Li, J.; Liu, X.L.; Yang, X.; Zhang, W.; Wang, J.; Niu, Y.Q. Composition characteristics and source analysis of major ions in four small Lake-watersheds on the Tibetan Plateau, China. Environ. Sci. 2015, 36, 430–437. [Google Scholar]
- Guo, Y.W.; Li, Y.Z.; Wang, X.M.; Li, S.T.; Geng, X.; Cao, F.X. Hydrochemical characteristics of Qingshui River Basin in the Tibetan Plateau. Saf. Environ. Eng. 2012, 19, 70–73. [Google Scholar]
- Zhang, J.Y.; Lei, G.L.; Song, R.Q.; Zheng, Y.P. Water Chemistry of Lake and River in the Central Tibetan Plateau. Available online: http://www.paper.edu.cn/releasepaper/content/201605-186 (accessed on 11 April 2016).
- Li, J.; Li, M.H.; Fang, X.M.; Wu, F.L.; Meng, Q.Q.; Zhang, Z.G.; Liu, X.M. Hydrochemical characteristics of the Hurleg Lake. Arid Land Geogr. 2015, 38, 43–51. [Google Scholar]
- Hou, Z.H.; Xu, H.; An, Z.S. Major ion chemistry of waters in Lake Qinghai catchment and the possible controls. Earth Environ. 2009, 11–19. [Google Scholar] [CrossRef]
- Dong, G.R.; Gao, S.Y.; Jin, J. Desertification and Controls in the Gonghe Basin, Qinghai Province; Science Press: Beijing, China, 1993; pp. 1–166. [Google Scholar]
- Zhang, D.S.; Gao, S.Y.; Shi, M.Y.; Ha, S.; Yan, P. Land Desertification in Qinghai Plateau and Its Control Technique; Science Press: Beijing, China, 2009. [Google Scholar]
- Zhang, H.F.; Chen, Y.L.; Xu, W.C.; Liu, R.; Yuan, H.L.; Liu, X.M. Granitoids around Gonghe basin in Qinghai province: Petrogenesis and tectonic implications. Acta Petrol. Sin. 2006, 22, 2910–2922. [Google Scholar]
- Qiang, M.R.; Song, L.; Jin, Y.X.; Li, Y.; Liu, L.; Zhang, J.W.; Zhao, Y.; Chen, F.H. A 16-ka oxygen-isotope record from Genggahai Lake on the northeastern Qinghai-Tibetan Plateau: Hydroclimatic evolution and changes in atmospheric circulation. Quat. Sci. Rev. 2017, 162, 72–87. [Google Scholar] [CrossRef]
- Qiang, M.R.; Liu, Y.Y.; Jin, Y.X.; Song, L.; Huang, X.T.; Chen, F.H. Holocene record of eolian activity from Genggahai Lake, northeastern Qinghai-Tibetan Plateau, China. Geophys. Res. Lett. 2014, 41, 589–595. [Google Scholar] [CrossRef]
- Yang, S.Q.; Gao, W.S.; Sui, P.; Chen, Y.D. Quantitative research on factors of soil desertification in Gonghe Basin. Acta Ecol. Sin. 2005, 25, 3181–3187. [Google Scholar]
- Qiang, M.R.; Song, L.; Chen, F.H.; Li, M.Z.; Liu, X.X.; Wang, Q. A 16-ka lake-level record inferred from macrofossils in a sediment core from Genggahai Lake, northeastern Qinghai-Tibetan Plateau (China). J. Paleolimnol. 2013, 49, 575–590. [Google Scholar] [CrossRef]
- Yang, X.P.; Ma, N.N.; Dong, J.F.; Zhu, B.Q.; Xu, B.; Ma, Z.B.; Liu, J.Q. Recharge to the inter-dune lakes and Holocene climatic changes in the Badain Jaran Desert, western China. Quat. Res. 2010, 73, 10–19. [Google Scholar] [CrossRef]
- Dataset of Daily Climate Data from Chinese Surface Stations. Available online: http://data.cma.cn/dataService/cdcindex/datacode/SURF_CLI_CHN_MUL_DAY_V3.0/show_value/normal.html (accessed on 17 May 2016).
- State Environmental Protection Administration. Water and Waste Water Detection Analysis Met; Science Press: Beijing, China, 2002. [Google Scholar]
- Kilham, P. Mechanisms Controlling the Chemical Composition of Lakes and Rivers: Data from Africa. Limnol. Oceanogr. 1990, 35, 80–83. [Google Scholar] [CrossRef]
- Andrews, M.; Davison, I.R.; Andrews, M.E.; Raven, J.A. Growth of Chara Hispida: I. Apical Growth and Basal Decay. J. Ecol. 1984, 72, 873–884. [Google Scholar] [CrossRef]
- Andrews, J.E.; Coletta, P.; Pentecost, A.; Riding, R.; Dennis, S.; Dennis, P.F.; Spiro, B. Equilibrium and disequilibrium stable isotope effects in modern charophyte calcites: Implications for palaeoenvironmental studies. Palaeogeogr. Palaeoclimatol. Palaeoecol. 2004, 204, 101–114. [Google Scholar] [CrossRef]
- Jin, Y.X.; Qiang, M.R.; Liu, Y.Y.; Li, Y.; Li, H.; Li, F.S. Variations in carbon and oxygen isotopes of carbonate and water environments: A case study from Genggahai Lake, northeastern Qinghai-Tibetan Plateau. Chin. Sci. Bull. 2015, 60, 847–856. [Google Scholar] [CrossRef] [Green Version]
- Jin, Y.X. Stable Isotopes of Modern Carbonate from Genggahai Lake, Northeastern Qinghai-Tibetan Plateau: Implications for Environmental Changes; Lanzhou University: Lanzhou, China, 2017. [Google Scholar]
- Hutchinson, G.E.A. Treatise on Limnology Volum I: Geopraphy; John Wiley: Newyork, NY, USA, 1975. [Google Scholar]
- Urbaniak, J. Estimation of Carbonate and Element Content in Charophytes-Methods of Determination. Pol. J. Environ. Stud. 2010, 19, 413–417. [Google Scholar]
- Ahmad, T.; Khanna, P.P.; Chakrapani, G.J.; Balakrishnan, S. Geochemical characteristics of water and sediment of the Indus river, Trans-Himalaya, India: Constraints on weathering and erosion. J. Asian Earth Sci. 1998, 16, 333–346. [Google Scholar] [CrossRef]
- Wang, D.C.; Zhang, R.Q.; Shi, Y.H. Basic of Hydrogeology; Geology Press: Beijing, China, 2005. [Google Scholar]
- Yang, X. Chemistry and late Quaternary evolution of ground and surface waters in the area of Yabulai Mountains, western Inner Mongolia, China. Catena 2006, 66, 135–144. [Google Scholar] [CrossRef]
- Liu, Y.J.; Cao, L.M.; Li, Z.L.; Wang, H.N.; Chu, T.Q. Elemental Geochemistry; Science Press: Beijing, China, 1984. [Google Scholar]
Figure 1.
Simplified geological map around Gonghe Basin and location of the study site (modified from Zhang et al. [38]).
Figure 1.
Simplified geological map around Gonghe Basin and location of the study site (modified from Zhang et al. [38]).

Figure 2.
Genggahai Lake and its physical environment, and the spatial distribution of modern aquatic vegetation in the lake [42].
Figure 2.
Genggahai Lake and its physical environment, and the spatial distribution of modern aquatic vegetation in the lake [42].

Figure 3.
Variations in concentrations of major anions in surface water from Genggahai Lake and water bodies within its drainage area during May to September each year from 2012 to 2015. (a) Cl− concentration; (b) HCO3− concentration; (c) NO3− concentration; (d) SO42− concentration.
Figure 3.
Variations in concentrations of major anions in surface water from Genggahai Lake and water bodies within its drainage area during May to September each year from 2012 to 2015. (a) Cl− concentration; (b) HCO3− concentration; (c) NO3− concentration; (d) SO42− concentration.

Figure 4.
The variations in concentrations of major surface water cations from Genggahai Lake and water bodies within its drainage area (a–d) and variations in monthly evaporation (e), monthly precipitation (f) and monthly mean temperature (g) in Gonghe Station during May to September each year from 2012 to 2015. The grey horizontal line indicates the average value.

Figure 5.
Ternary plots of major anion (a) and cations (b) concentrations in surface water from Genggahai Lake and its drainage area.
Figure 5.
Ternary plots of major anion (a) and cations (b) concentrations in surface water from Genggahai Lake and its drainage area.

Figure 6.
Gibbs diagram of the water bodies within the Genggahai Lake (a) TDS-Na+/(Na+ + Ca2+); (b) TDS-Cl−/(Cl− + HCO3−).
Figure 6.
Gibbs diagram of the water bodies within the Genggahai Lake (a) TDS-Na+/(Na+ + Ca2+); (b) TDS-Cl−/(Cl− + HCO3−).

Figure 7.
The relationship between the Cl− and Na+ concentration of lake water and the Cl− and Na+ concentration of groundwater and evaporation in Gonghe Station. (a) The relationship between the Na+ concentration of lake water and evaporation in Gonghe Station; (b) The relationship between the Na+ concentration of lake water and the Na+ concentration of groundwater; (c) The relationship between the Cl− concentration of lake water and evaporation in Gonghe Station; (d) The relationship between the Cl− concentration of lake water and the Cl− concentration of groundwater.

Figure 8.
Scatter plot of ion concentrations of river water and groundwater. (a) Cl− and (Na+ + K+); (b) SO42− and (Ca2+ + Mg2+); (c) HCO3−:(Ca2+ + Mg2+); (d) HCO3−:(Cl− + SO42−).
Figure 8.
Scatter plot of ion concentrations of river water and groundwater. (a) Cl− and (Na+ + K+); (b) SO42− and (Ca2+ + Mg2+); (c) HCO3−:(Ca2+ + Mg2+); (d) HCO3−:(Cl− + SO42−).


Table 1.
Variations in ion concentrations of surface water from Genggahai Lake and its drainage area from May to September for each year between 2012 and 2015.
Table 1.
Variations in ion concentrations of surface water from Genggahai Lake and its drainage area from May to September for each year between 2012 and 2015.
| Water Bodies | n | Variation Range/Mean Value | Anion Content (mmol L−1) | Cation Content (mmol L−1) | ||||||
|---|---|---|---|---|---|---|---|---|---|---|
| Cl− | HCO3− | NO3− | SO42− | Na+ | Ca2+ | Mg2+ | K+ | |||
| Lake water | 19 | Variation range | 2.83–9.05 | 0.14–9.90 | 0–0.18 | 0.12–1.01 | 7.01–15.00 | 0.03–0.70 | 0.51–1.20 | 0.01–0.37 |
| Mean | 4.89 | 4.04 | 0.05 | 0.58 | 10.84 | 0.38 | 0.79 | 0.17 | ||
| Groundwater | 19 | Variation range | 0.001–1.09 | 4.44–24.67 | 0–0.33 | 0.03–1.25 | 0.20–6.89 | 0.40–2.50 | 0.20–1.00 | 0.02–0.26 |
| Mean | 0.62 | 10.76 | 0.09 | 0.51 | 2.16 | 1.13 | 0.47 | 0.11 | ||
| River water | 18 | Variation range | 0.001–3.93 | 6.56–25.39 | 0–0.06 | 0.01–0.95 | 0.10–9.13 | 1.05–2.47 | 0.03–1.28 | 0.01–0.39 |
| Mean | 1.74 | 12.78 | 0.07 | 0.51 | 4.63 | 1.77 | 0.48 | 0.16 | ||
Note: n is the sample number (the same below).
© 2019 by the authors. Licensee MDPI, Basel, Switzerland. This article is an open access article distributed under the terms and conditions of the Creative Commons Attribution (CC BY) license (http://creativecommons.org/licenses/by/4.0/).
Share and Cite
MDPI and ACS Style
Jin, Y.; Jin, X.; Yang, D.; Mao, X. Controlling Factors of Surface Water Ionic Composition Characteristics in the Lake Genggahai Catchment, NE Qinghai–Tibetan Plateau, China. Water 2019, 11, 1329. https://doi.org/10.3390/w11071329
AMA Style
Jin Y, Jin X, Yang D, Mao X. Controlling Factors of Surface Water Ionic Composition Characteristics in the Lake Genggahai Catchment, NE Qinghai–Tibetan Plateau, China. Water. 2019; 11(7):1329. https://doi.org/10.3390/w11071329
Chicago/Turabian StyleJin, Yanxiang, Xin Jin, Dengxing Yang, and Xufeng Mao. 2019. "Controlling Factors of Surface Water Ionic Composition Characteristics in the Lake Genggahai Catchment, NE Qinghai–Tibetan Plateau, China" Water 11, no. 7: 1329. https://doi.org/10.3390/w11071329
Note that from the first issue of 2016, this journal uses article numbers instead of page numbers. See further details here.