Article

Insights into the Kinetics of Intermediate Formation during Electrochemical Oxidation of the Organic Model Pollutant Salicylic Acid in Chloride Electrolyte

1
Department of Civil- and Environmental Engineering, Norwegian University of Science and Technology, 7491 Trondheim, Norway
2
Department of Chemistry and Bioscience, Aalborg University, 6700 Esbjerg, Denmark
3
Faculty of Applied Sciences, Ton Duc Thang University, Ho Chi Minh City, Vietnam
*
Author to whom correspondence should be addressed.
Water 2019, 11(7), 1322; https://doi.org/10.3390/w11071322
Submission received: 28 May 2019 / Revised: 18 June 2019 / Accepted: 21 June 2019 / Published: 26 June 2019
(This article belongs to the Special Issue Removal of Organic Pollution in Water Environment)

Abstract

:
The present study investigated the kinetics and formation of hydroxylated and chlorinated intermediates during electrochemical oxidation of salicylic acid (SA). A chloride (NaCl) and sulfate (Na2SO4) electrolyte were used, along with two different anode materials, boron doped diamond (BDD) and platinum (Pt). Bulk electrolysis of SA confirmed the formation of both hydroxylated and chlorinated intermediates. In line with the density functional theory (DFT) calculations performed in this study, 2,5- and 2,3-dihydroxybenzoic acid, 3- and 5- chlorosalicylic acid and 3,5-dichlorosalicylic acid were the dominating products. In the presence of a chloride electrolyte, the formation of chlorinated intermediates was the predominant oxidation mechanism on both BDD and Pt anodes. In the absence of a chloride electrolyte, hydroxylated intermediates prevailed on the Pt anode and suggested the formation of sulfonated SA intermediates on the BDD anode. Furthermore, direct oxidation at the anode surface only played a subordinate role. First order kinetic models successfully described the degradation of SA and the formation of the observed intermediates. Rate constants provided by the model showed that chlorination of SA can take place at up to more than 60 times faster rates than hydroxylation. In conclusion, the formation of chlorinated intermediates during electrochemical oxidation of the organic model pollutant SA is confirmed and found to be dominant in chloride containing waters.

1. Introduction

Mono- and polycyclic aromatic compounds present in wastewaters such as landfill leachate, pose a special challenge when it comes to their removal from the water matrix. Greater parts of them are non-biodegradable, persist in the aquatic environment and demand a dedicated treatment step for their removal. Such persistent organic pollutants can be produced intentionally, such as pesticides, or are unintentionally produced during water disinfection [1]. They may enter the human body through the food chain via bioaccumulation [2]. Many persistent organic pollutants are suspected to be carcinogenic or have other detrimental effects on the aquatic environment [3]. Studies have shown that advanced oxidation processes (AOP) in general [4], and thereof electrochemical oxidation (EO) [5] specifically, are effective treatment processes for the removal of persistent organic pollutants. AOPs mainly focus on the formation of hydroxyl radicals by different means [6,7]. Hydroxyl radicals are non-selective, highly reactive oxidants and their presence leads to partial degradation or even complete oxidation to CO2 of organic pollutants. During EO, adsorbed hydroxyl radicals are formed via the electrolytic discharge of water in the electrochemical cell (Equation (1)) [8]:
MO x + H 2 O MO x ( · OH ) + H + + e
A competing side reaction may occur during the electrolytic discharge of water, the so-called oxygen evolution (Equation (2)) [8]:
MO x ( · OH ) MO x + 1 2 O 2 + H + + e
The occurrence of oxygen evolution is subject to the oxygen evolution over-potential of the anode material. In the same way, the transfer of oxygen from the adsorbed hydroxyl radicals to the organic compound (R) depends on the anode material [9]. Commonly, two different electrochemical oxygen transfer reaction (EOTR) mechanisms are distinguished [8]. The first EOTR mechanism takes place at anodes that have a low oxygen evolution over-potential, also known as active anodes (e.g., platinum, Pt) [8]. Hereby, the adsorbed hydroxyl radical reacts with the anode surface, forming higher oxides (MOx+1), which in turn react with the organic pollutant (Equation (3)):
MO x ( · OH ) MO x + 1 + H + + e MO x + 1 + R MO x + RO
where MOx+1/MOx is the surface redox couple and also called active oxygen. The second EOTR mechanism takes place at anodes with high oxygen evolution over-potential, also known as non-active anodes (e.g., BDD). Hereby, no formation of higher oxides occurs. Instead, the adsorbed hydroxyl radicals react directly with the organic compound, which at best leads to its complete combustion to CO2 (Equation (4)):
MO x ( · OH ) + R MO x + mCO 2 + nH 2 O + H + + e
Depending on the anode material, the active oxygen is called chemisorbed (active anodes) or physisorbed (non-active anodes). In order to be able to conduct EO, the sole presence of an organic pollutant and water molecules is not enough. Electrolytes need to be present, to transfer the charge across the electrochemical cell. Almost all wastewaters contain electrolytes of different natures and thus facilitate the treatment via EO. However, electrolytes do not only transfer charges, but electrochemically active electrolytes may also undergo oxidation at the anode surface. Halide electrolytes will form active halide species under such circumstances, for example NaCl will react to active chlorine. These active species will in turn react with the organic pollutants, resulting in their partial chemical oxidation, a process also known as mediated oxidation (MEO) [10]. Bonfatti et al. [11] proposed the following mechanisms for active chlorine mediated electrochemical oxidation:
2 Cl Cl 2 + 2 e
Cl 2 + 2 OH ClO + Cl + 2 H + HOCl + H + + Cl
MO x ( · OH ) + Cl MO x ( HOCl ) ads
MOx ( HOCl ) ads + R CO 2 + H 2 O + Cl
Halogenated organic pollutants however are not favored reaction products, since they are generally more toxic than the mother compound and thus disadvantageous for the treatment process [12]. In the same way as the electrolytes, the organic pollutants can also be directly oxidized at the anodes surface, via a direct electron transfer (DET) between the organic pollutant and the anode [13]. DET is restricted and only occurs within the particular electrochemical window specific to a certain anode material, which in turn is limited by the above-mentioned oxygen evolution over-potential.
In this study, salicylic acid (SA) is used as a model compound for organic pollutants. SA is the main metabolite of acetylsalicylic acid, a commonly known and widely used painkiller. SA has aromatic properties and can be used to represent organic pollutants during electrochemical oxidation. Furthermore, chlorinated SA intermediates have been recently assigned to the group of disinfection by-products (DBP), which are not only of concern due to their cytotoxicity and growth inhibition ability but also because they act as a precursor to form regulated DBPs such as trihalomethanes (THMs). Consequently, this study investigates the degradation of SA in chloride and non-chloride electrolytes and investigates the different oxidation processes and the corresponding formation of intermediates.
Degradation pathways for SA during EO have been reported on previously. Guinea et al. [14] proposed a degradation pathway via hydroxylation of SA, using a BDD anode and cathodic generation of hydrogen peroxide. In the first oxidation step, SA reacted with the hydroxyl radicals originating from the hydrogen peroxide to form three different dihydroxybenzoic acids (dHBAs): 2,3 dihydroxybenzoic acid (23dHBA), 2,5 dihydroxybenzoic acid (25dHBA) and 2,6 dihydroxybenzoic acid (26dHBA). The different dHBAs were next proposed to be further oxidized to lower molecular weight carboxylic acids such as maleic or α-ketoglutaric acid. In a third oxidation step, the low molecular weight carboxylic acid was then degraded to oxalic acid and finally carbon dioxide (CO2). Others suggested trihydroxybenzoic acids (tHBA), namely 234tHBA, 235tHBA and 246tHBA as possible degradation products of SA [15]. However, chlorinated products of SA formed during EO have not been reported. It is anticipated that chlorine atoms originating from the MEO primarily substitute at the para position of the hydroxyl group of SA, followed by a second substitution at the ortho position [16]. This assumption is endorsed by Broadwater et al. [17], where they identified different chlorinated SA intermediates by the simple chlorination of SA via the addition of NaOCl. Thus, it is expected that we will mainly find 3-chlorosalicylic acid (3ClSA) and 5-chlorosalicylic acid (5ClSA) and the combined product 3,5-dichlorosalicylic acid (35dClSA). The uncertainty that comes along with the expected chlorinated SA products can be reduced further by the implementation of preliminary density function theory (DFT) computations. These computations will help us to anticipate possible reaction products and thus facilitate the analytical process for their identification. The oxidation pathway of SA via DET is also included in this study as only a few studies investigated the DET of SA. Torriero et al. [18], used cyclic voltammetry (CV) to demonstrate irreversible DET of SA on a glassy carbon (GC) electrode, and Wudarska et al. [19] reported on the electro-reduction behavior of SA and acetylsalicylic acid during CV using a Pt electrode
The aim of this study is to gain more insight into the degradation of SA during EO with emphasis on the formation of chlorinated SA intermediates. Chlorinated intermediates, unlike their mother compound SA, belong to newly defined DBPs and therefore it is essential to elucidate their formation during EO and fill this gap of knowledge. Hydroxylated intermediates are also investigated, since they originate from the reaction with hydroxyl radicals, which are important for the removal of persistent organic pollutants. Kinetic models for the degradation of SA and the formation of intermediates are developed using DFT and tested through bulk electrolysis in different electrolytes. Model results provided rate constants that are used to assess the importance of different oxidation processes contributing to the degradation of SA. In addition, CV on BDD electrodes for SA are reported and add valuable information on the electroactive behavior of SA, which has been previously reported for different electrode materials and electrochemical reduction by [18,19], respectively.

2. Materials and Methods

Investigation of EOTR and MEO for SA was done by bulk electrolysis. Different mechanisms were identified via the reaction products of the parent compounds. The expected reaction products during bulk electrolysis were anticipated based on DFT computations for both EOTR and MEO. In addition, two different anode materials were tested, BDD and Pt, due to EOTR being highly dependent on the anode material. MEO is greatly affected by the supporting electrolyte, hence two different electrolytes were compared (NaCl and Na2SO4). A kinetic model has been developed in order to predict the degradation of SA and the formation of the reaction products during bulk electrolysis. Furthermore, CV was used to gain information about the electro-activity of SA. Its fate during CV was assessed by using different supporting electrolytes and anode materials. The CV results allow for conclusions to be drawn about the presence or absence of the DET mechanism during bulk electrolysis of SA.

2.1. Cyclic Voltammetry

SA and the two electrolytes (NaCl and Na2SO4) were purchased from VWR international AnalaR NORMAPUR. Stock solutions of SA were prepared with demineralized water with a concentration of 1 g/L. The stock solution was kept up to a month and stored in the dark at 4 °C. Electrolyte solutions were prepared with demineralized water. Cyclic voltammetry experiments were carried out with an µAUTOLABIII/FRA2 (Metrohm) using a 7.07 × 10⁻⁶ m2 platinum rotating disc electrode (Pt-RDE, Metrohm), a 1.24 × 10⁻⁵ m2 boron doped diamond rotating disc electrode (BDD-RDE, neoCoat) and a 1.19 × 10⁻⁴ m2 glassy carbon rod (GC-rod) electrode (Metrohm AG, Hersiau, Switzerland). A Pt wire was used as an auxiliary electrode. The speed of the rotating disc electrode was set to 100 rpm for all experiments. A platinum wire served as a counter electrode and an Ag/AgCl (3M) was used as a reference electrode. All experiments were performed at room temperature (20 °C) using 25 mL electrolyte at a concentration of 0.1 M and a SA concentration of 500 mg/L. The scanning rate was 1 V/s and 5 consecutive scan cycles were run at the time and the potential was swept between −1 and 2 V. CV results were analyzed using NOVA 2.0 software (Metrohm).

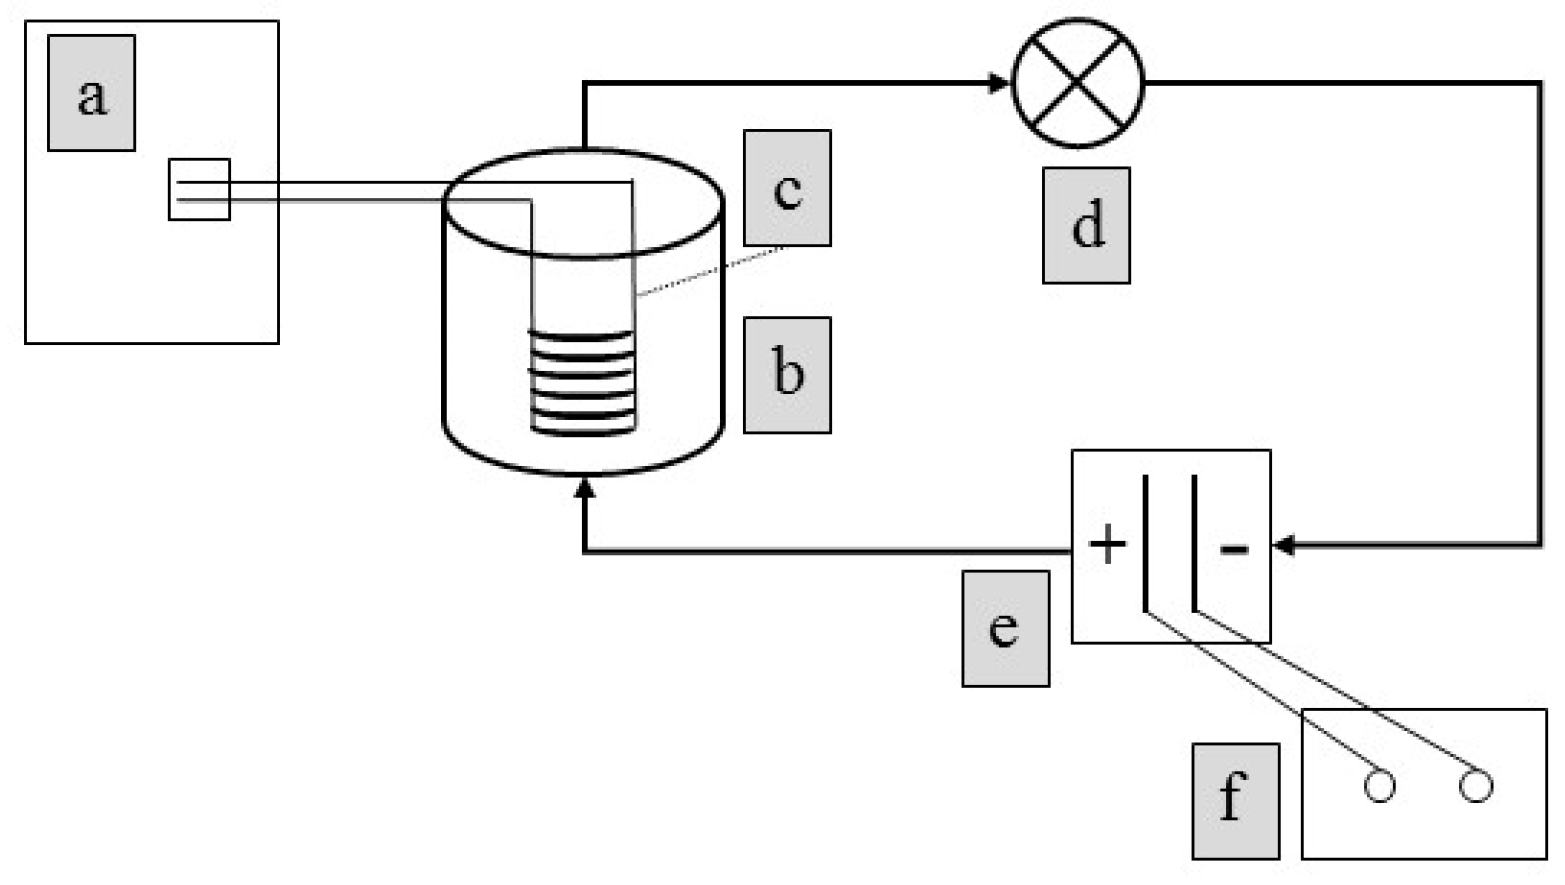
2.2. Bulk Electrolysis

The same chemicals as for CV were used and stock solutions were prepared and stored likewise. Bulk electrolysis experiments were carried out, using a micro flow cell (ElectroCell Europe AS, Denmark). Experiments were conducted in galvanostatic mode with an applied current density (japp) of 43 mA/cm2. Two different anode materials were used, platinum (Pt) with titanium (Ti), as supporting material and a boron doped diamond (BDD) with niobium (Nb) as supporting material together with a stainless-steel cathode. Both, cathode and anode had an active area of 10 cm2. Two polytetrafluoroethylene turbulence-enhancing meshes were placed between the anode and cathode (4 mm inter-electrode cap). The working- and counter-electrode were cooled during the experiment with a tab water stream (ca. 7 °C) from the rear side. The solution (2500 mL) in the tank was magnetically stirred and pumped with a peristaltic pump (Masterflex Cole-Parmer Instrument Co., Vernon Hills, IL, USA) via Teflon tubing to the micro flow cell with a flow rate of 380 mL/min. A cooling coil (stainless steel) immersed into to the solution and connected to a chiller (FP50-ME, Julabo GmbH, Seelbach, Germany) assured a stable temperature (25 °C) during all experiments. The electrolyte concentration used during bulk electrolysis was 0.05 M for both, NaCl and Na2SO4. Figure 1 depicts the scheme of the electrolysis set up.
The mass transfer coefficient (km) was obtained by the diffusion limiting current technique [20] according to Chatzismyeon et al. [21]. Different concentrations (4–24 mM) of potassium ferro cyanide (K4[Fe(CN)6]) and ferri cyanide (K3[Fe(CN)6]) in 2:1 ratio were anodically oxidized and polarization curves were generated. The limiting currents were determined by the formula:
I lim = ( AnFk m ) C b
where Ilim: limiting current (A), A: electrode surface (m2), n: number of exchanged electrons (n = 1 for ferro/ferri cyanide couple), F: Faraday constant (C/mol), km: mass transfer coefficient (m/s), Cb: bulk concentration of ferro cyanide (mol/m3). The ratio of Ilim to Cb is obtained from the slope when plotting different ferro/ferri cyanide concentration versus the limiting current (plateau) from the polarization curves. The calculated km value is inserted into the following Equation (10), describing the initial limiting current density (jlim(t = 0)) for the given experimental conditions when BDD anodes are used [22]:
j lim ( t ) = nFk m COD ( t )
where: n: number of electrons exchanged with anode (n = 4 when considering chemical oxygen demand (COD)), COD (t): initial bulk COD concentration at time t = 0).

2.3. Sample Analysis

Samples obtained from bulk electrolysis were analyzed using an UPLC (Waters, Milford, MA, USA) with XEVO TQ-XS triple quadrupole mass spectrometer (Waters) with a 2.1 mm × 100 mm high strength silica T3 column (Waters). The UPLC-MS/MS was operated in multiple reaction monitoring mode using electrospray ionization. Water (HPLC grade, VWR) with 2 mM ammonium formate (Sigma-Aldrich, Merck KGaA, Darmstadt, Germany) and 0.1% formic acid (VWR International LLC, Radnor, PA, USA) was used as solvent A and acetonitrile (HPLC grade, VWR) with 2 mM ammonium formate (Sigma-Aldrich) and 0.1% formic acid (VWR) was used as solvent B. For the SA method, a flow of 0.4 mL/min was constantly maintained and deuterated SA (SA-d6, Sigma-Aldrich) was used as an internal standard. Standards for the selection of expected SA products 23dHBA, 25dHBA, 26dHBA, 3ClSA, 4ClSA, 5ClSA and 35dClSA were purchased from Sigma-Aldrich, all analytical grade. Data processing was carried out using the ‘Targetlynx’ software (Waters).
Active chlorine in bulk electrolysis samples was measured with the DPD (N, N-diethyl-p-phenylenediamine) colorimetric method using DPD powder pillows for 5 mL (Hach, Loveland, CO, USA) and a portable DR300 colorimeter (Hach).

2.4. Density Functional Theory Simulations

DFT simulations were performed to study the relative stability of different products, as well as the electronic property of SA in reaction. All calculations were done with the Gaussian 09 package [23]. Unrestricted spin calculation using Lee-Yang-Parr (B3LYP) [24] functional and def2-TZVPP basis set [25,26] were employed. An implicit solvation model for water was considered using a solvation model based on the quantum mechanical charge density (SMD) [27]. Natural bond theory (NBO) [28] was used to analyze the spin and charge density of the molecules (Figure 2). The default values of Gaussian 09 were used for the convergence of energy and force in the DFT calculations. A similar set up was successfully employed to study to electro-chemical reaction [29].

2.5. Kinetic Modelling

A mathematic model predicting the degradation of SA and its intermediates with different electrode materials was developed. A degradation mechanism of SA with NaCl as the supporting electrolyte is proposed in Figure 3. Note that in the case of using Na2SO4 as supporting electrolyte, the formation of chlorinated intermediates does not take place.
A first order kinetic equation was chosen to describe each reaction rate (Equation (11)). Calculations were performed in Matlab (version 2017, The MathWorks, Inc., Natick, MA, USA) to find the numerical solution to the set of ordinary differential equations. Reaction rate constants were determined by fitting the experimental data to the model using the least squares method. The fitting quality was estimated by the correlation coefficient R2.
d [ SA ] dt =   ( k 1 + k 2 + k 3 + k 4 + k 5 ) [ SA ] d [ SA ] dt =   ( k 1 + k 2 + k 3 + k 4 + k 5 ) [ SA ] d [ 23 dHBA ] dt =   k 2 [ SA ] k 6 [ 23 dHBA ] d [ 25 dHBA ] dt =   k 3 [ SA ] k 7 [ 25 dHBA ] d [ 3 ClSA ] dt =   k 4 [ SA ] ( k 8 + k 10 ) [ 3 ClSA ] d [ 5 ClSA ] dt =   k 5 [ SA ] ( k 9 + k 11 ) [ 5 ClSA ] d [ 35 dClSA ] dt =   k 10 [ 3 ClSA ] + k 11 [ 5 ClSA ] k 12 [ 35 dClSA ]

3. Results and Discussion

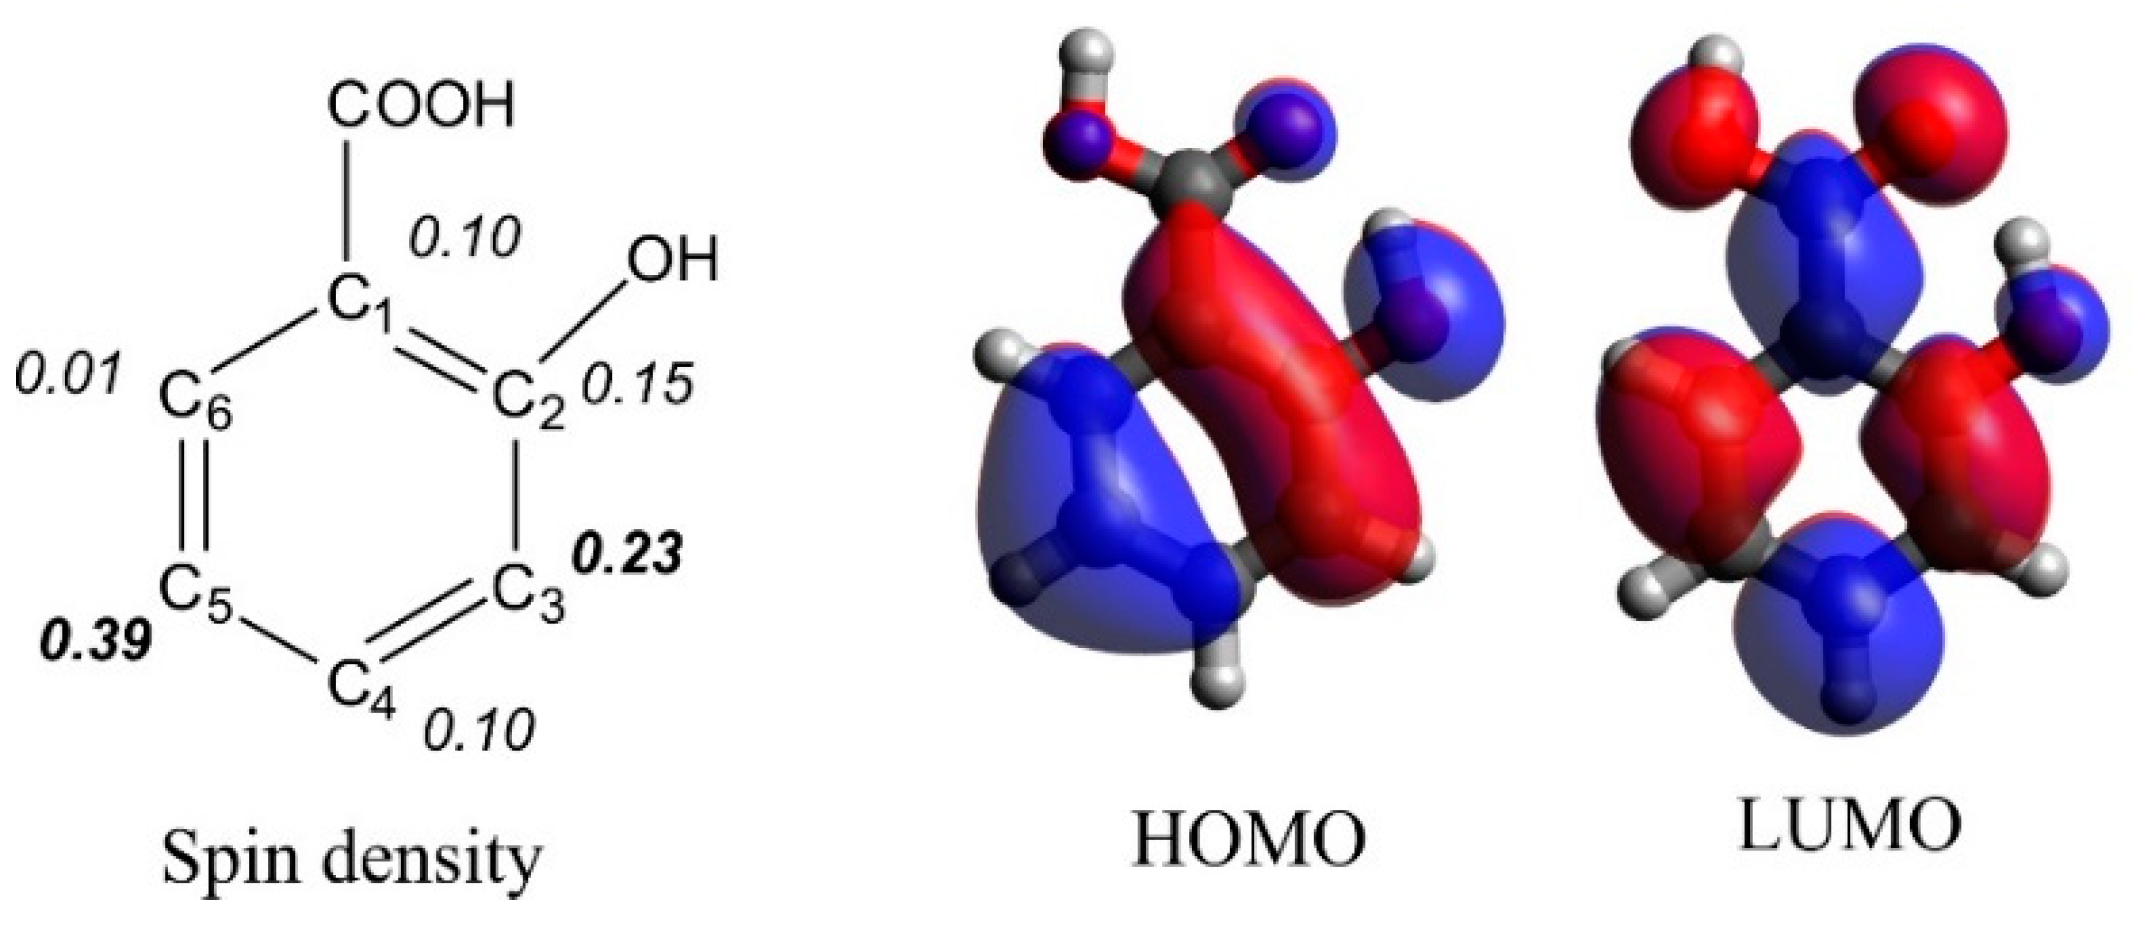
3.1. Prediction of Salicylic Acid Intermediate Formation by DFT Simulations

Considering the formation of hydroxylated and chlorinated products, there are six possibilities to bond to a carbon atom (from C1–C6) of SA (Figure 2). However, due to steric effects, the attacking position at C1 and C2 is very unstable, hence the possibility to bond with OH and Cl at position C3, C4, C5, and C6 was investigated. Table 1 presents the relative stability of the products, the most stable one (relative energy = 0.00 kJ/mol) was chosen as reference. For both the hydroxylated and mono-chlorinated products, the most stable structure is at position C4, while position 4,5 and position 3,5 are the most stable structures for di-chlorinated species. When looking at the experimental data, it shows that the most favorable attacking positions are at C3 and C5 position (discussed in Section 3.2.2 & 3.2.3). Thus, the most favorable intermediates observed during the experiments cannot be fully explained by the relative stability of products based on DFT calculations. It is therefore proposed that the mechanism and kinetics play an important role here. Consequently, further investigations of the electronic structure of the radical SA by DFT and NBO theory were performed. In particular, the spin density (Figure 2) shows that its maximum is at position C3 and C5. The spin density corresponds to the reactivity of the SA radical in the electrochemical oxidation reaction. Simply based on this assessment, it is possible to predict that the attraction of OH and Cl will be favorable at the C3 and C5 position. This is in agreement with the experimental data, where the byproducts for both hydroxylation and chlorination were observed at the C3 and C5 position.

3.2. Oxidation of Salicylic Acid and Intermediate Formation

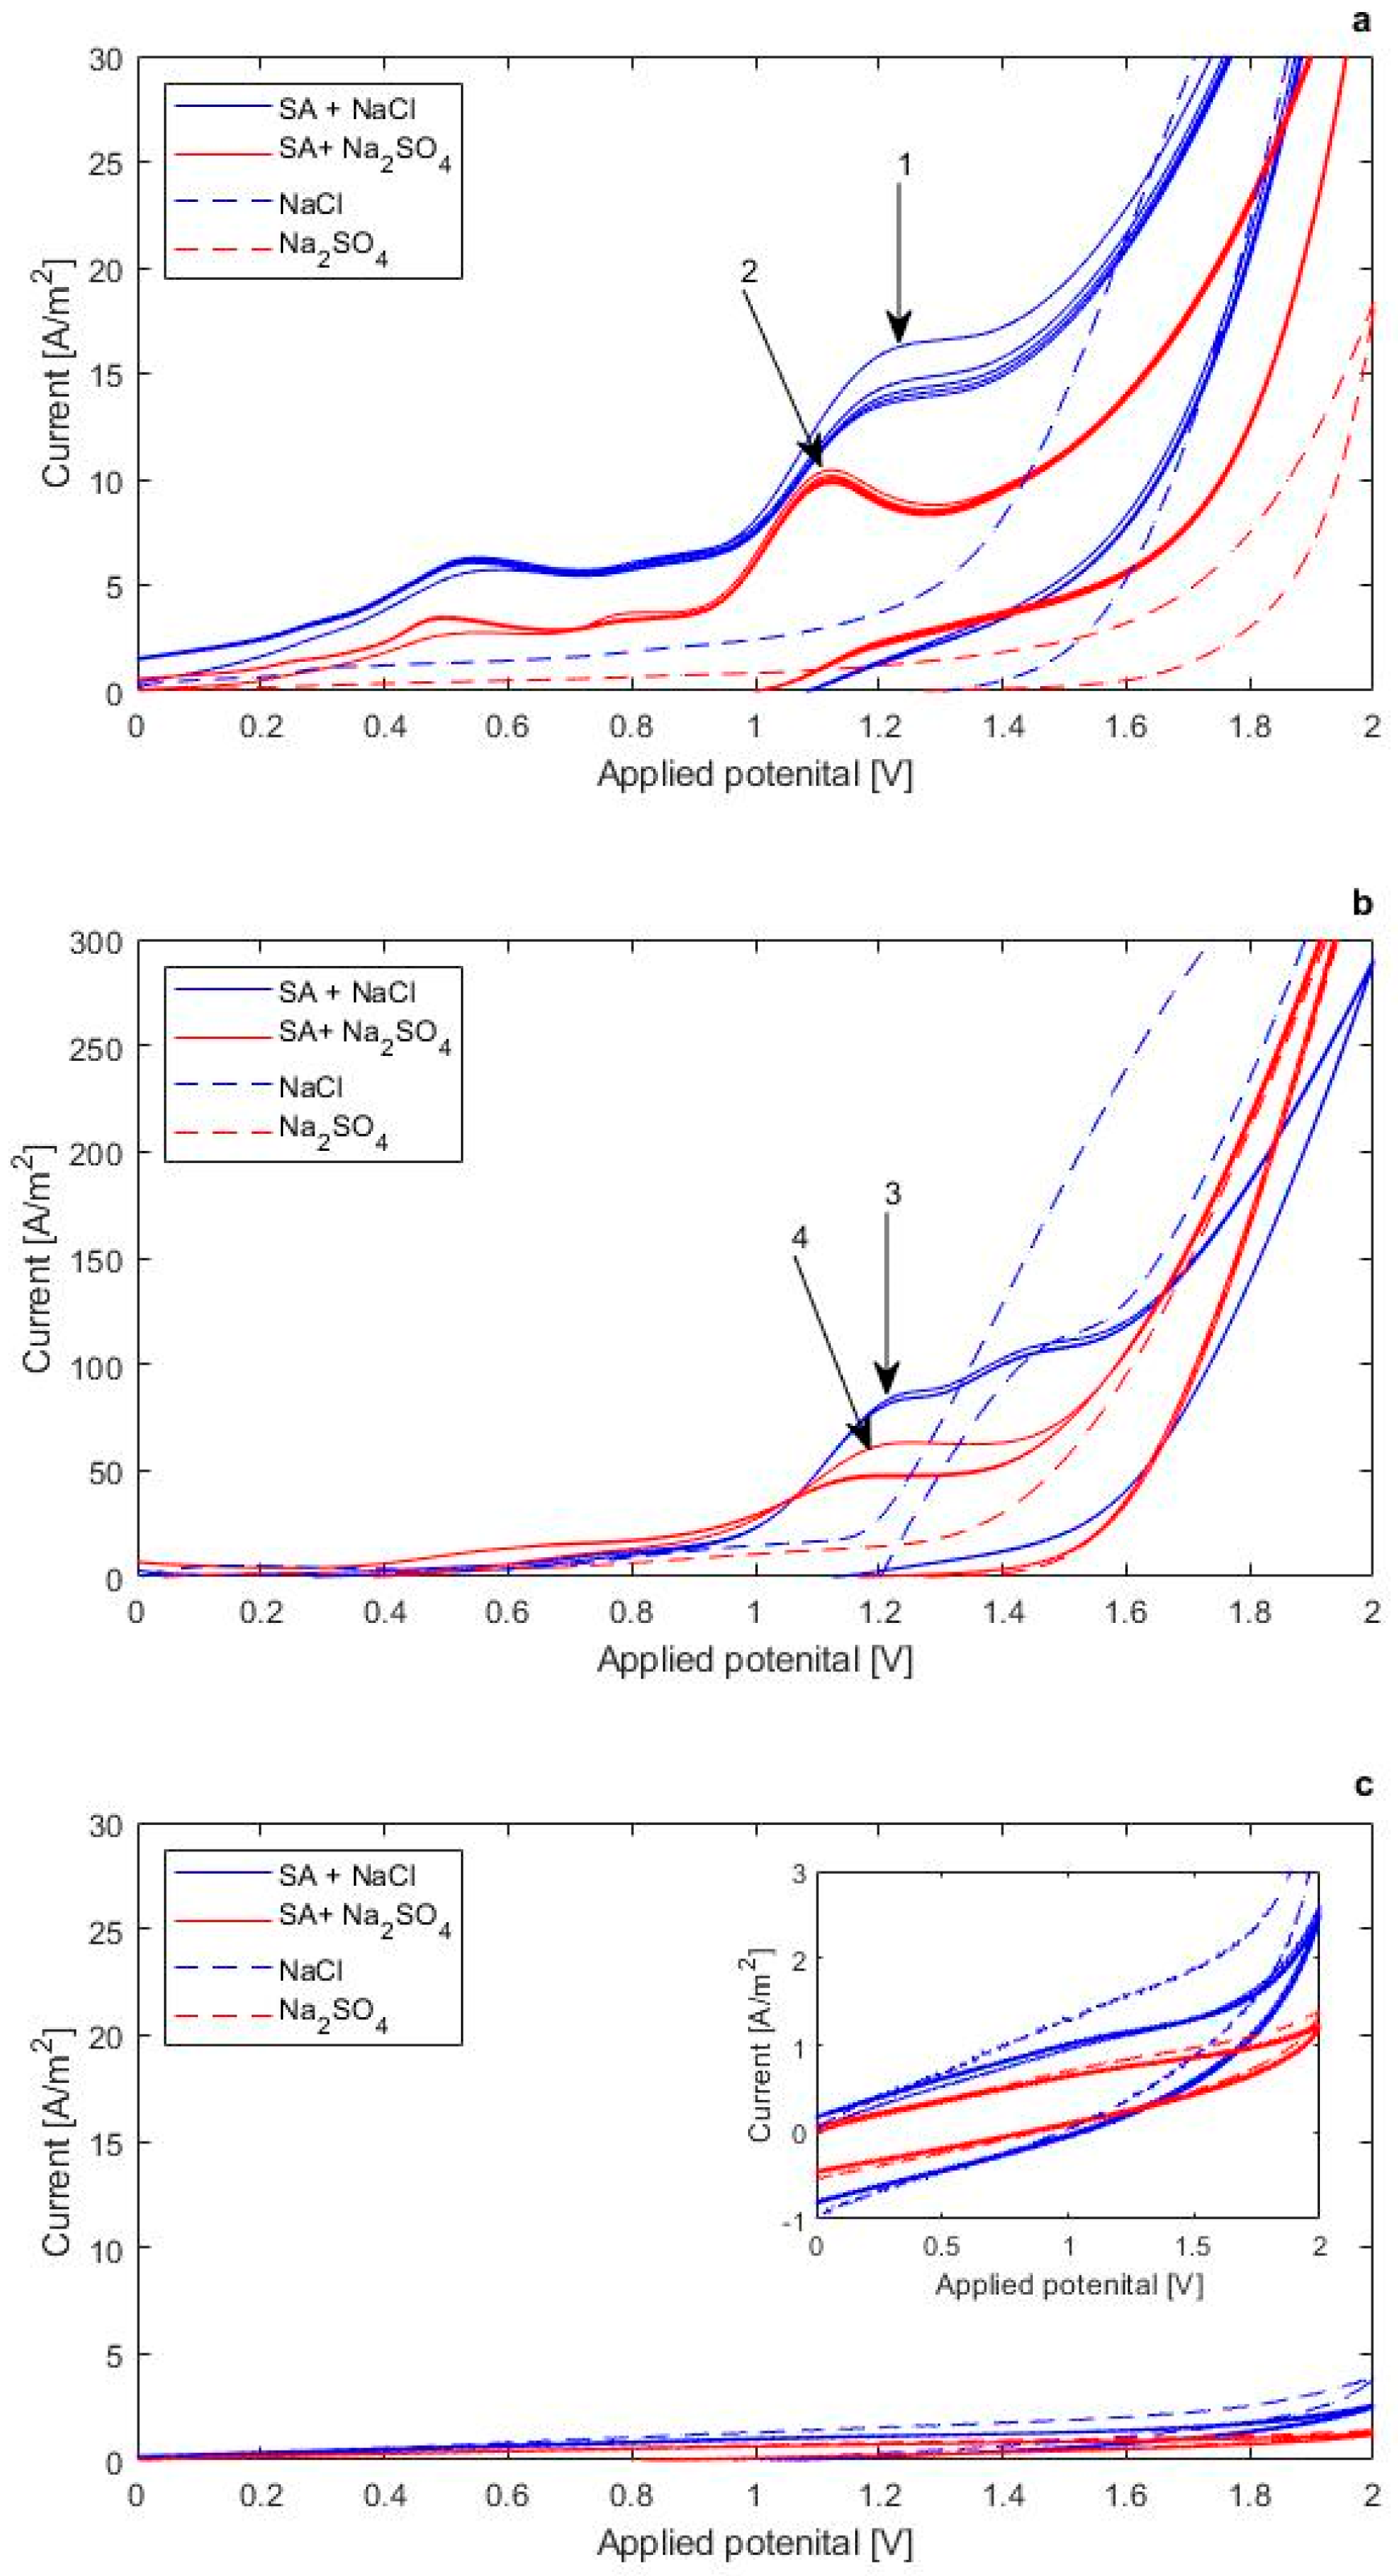
3.2.1. Electro-activity of Salicylic Acid

CV has been used to evaluate the electro-activity of SA. First, a GC rod was used as a baseline for the later comparison with different anode materials. GC is not prone to fouling, unlike the Pt electrode, yet it has an active surface, unlike BDD, meaning that compounds contained in the water matrix have a proper affinity to the anode surface. In a second step, the electro-activity of SA was assessed with a Pt and BDD electrode, which corresponded to the anode materials used for the bulk electrolysis experiments. CV using a GC anode revealed that SA is electro-active, as indicated by the anodic oxidation peak potential Epa observed during the forward scan (Figure 4a).
No reversibility of the oxidation peak was observed during a reverse reduction scan of SA. This is in agreement with electrochemical irreversibility being a typical feature for phenolic compounds [30]. The use of two different supporting electrolytes, NaCl and Na2SO4, indicates that NaCl leads to a higher anodic peak current ipa (Figure 4a, peak nr. 1) than Na2SO4 (Figure 4a, peak nr. 2) for SA. A higher anodic peak current for one supporting electrolyte indicates that the diffusion of the model compound towards the electrode surface is more efficient in NaCl than in Na2SO4, which can be associated to the different size of anions (Cl and SO42−) [31]. Looking at the Epa for GC and Pt anode, there is a slight shift towards a more positive potential for SA when NaCl is used instead of Na2SO4. The exact values for Epa for each electrode material and supporting electrolyte are presented in Table 2.
In addition, SA exhibits a higher ipa and a shift in Epa in the first scan cycle compared to scan cycles 2–5 when using GC (Figure 4a) and Pt (Figure 4b, peak nr. 3 & 4) anodes. A lower Epa in the second and more consecutive scan cycles can be attributed to the formation of a polymeric layer during the EO, which covers the electrode surface [32]. This results in a decreased ipa for the consecutive scan cycles. Only a slight or no decrease of ipa is observed after the second scan cycle which suggests that the polymeric layer is not developing any further. CV of SA on the BDD anode exhibited no oxidation peak Epa (Figure 4c), which shows that SA does not undergo oxidation by DET. This is attributed to the non-active nature of BDD anodes, and results in a low affinity towards compounds contained in the water matrix. This behavior makes BDD anodes less prone to polymeric fouling than the active Pt anodes [8]. Contrary to our findings, Louhichi et al. [33] observed that SA is electro active on BDD electrodes during CV. They further state that a decreasing oxidation peak with increasing cycle numbers suggests a polymeric layer built up on the BDD anode. Furthermore, Montilla et al. [34] observed an anodic oxidation peak of the structurally similar benzoic acid on BDD anodes during CV. Differences in both studies include higher analyte concentrations, a different electrolyte (1M H2SO4 or 0.5 M HClO4) and a considerably lower pH. In addition, the setup used in this study includes an RDE while it was not specified in the above-mentioned studies. Despite the fact that DET of SA on BDD electrodes was not observed in this study, BDD anodes are expected to outperform Pt anodes during bulk electrolysis of SA due to less electrode fouling and the formation of the more freely available physisorbed hydroxyl radicals [8].
CV results could verify the electro-activity of SA on active anodes (GC and Pt). The results confirm that electrons are directly exchanged between SA and these anodes, which contributes to the partial oxidation of SA. Thus, the use of different anode materials and electrolytes emphasized their impact on DET. Recorded anodic peak currents on Pt and GC electrodes showed that NaCl facilitated the transport of SA towards the electrode transport compared to Na2SO4.

3.2.2. Formation of Hydroxylated Salicylic Acid Intermediates

Bulk electrolysis was performed to investigate the oxidation of SA via EOTR. The original experimental data can be found in the supporting material (Tables S1–S4). With the NaCl-BDD setting, two hydroxylated products (23dHBA and 25dHBA) could be identified and quantified whereas the third expected hydroxylated product (26HBA) could not be detected at any time. Detected dHBAs were present after 10 min and they remained at a constant concentration throughout the experiment (Figure 5b). A concentration of 1.07 × 10⁻⁶ M and 4.85 × 10⁻⁶ M for 23dHBA and 25dHBA, respectively suggests a balanced formation and degradation during EO. Guinea et al. [14] also identified 25dHBA to be the most abundant among the three investigated dHBAs. A higher SA concentration (1.20 × 10⁻³ M) and cathodically generated hydrogen peroxide were used in that study, resulting in a significantly higher amount of each dHBA product. This explains why 26dHBA (limit of quantification (LOQ) of 10 nM) was not found in the present study but was found as a degradation product of SA by Guinea et al. [14].
When the NaCl-Pt setting was used, both, 23dHBA and 25dHBA could be identified and quantified, but 26dHBA could not be detected. In contrast to the BDD anode, the hydroxylated products do not show a constant production rate but do reach a maximum concentration after 60 min with 0.24 × 10⁻⁵ M and 0.69 × 10⁻⁵ M for 23dHBA and 25dHBA, respectively (Figure 5d). It is also notable that, after reaching a maximum concentration, both hydroxylated products are only eliminated again to a certain extent, similar to the observation on the BDD electrode. The final concentration was 0.13 × 10⁻⁵ M for 23dHBA and 0.56 × 10⁻⁵ M for 25dHBA. It should be noted that the absolute concentration of dHBAs detected was considerably higher than with the BDD anode, specifically 18% higher for 23dHBA and 13% higher for 25dHBA. This behavior can be attributed to the quasi freely available physisorbed hydroxyl radicals on BDD, which readily react with SA and lead to its complete mineralization (Equation (4)). However, on Pt anodes the hydroxyl radicals are chemisorbed (Equation (3)) and thus exhibit a lower oxidation power, which results in a lower amount of complete mineralized SA and a higher amount of the intermediate degradation products such as 23dHBA and 25dHBA. Similar findings have been reported by Madsen et al. [35].
Using the Na2SO4-BDD setting, 23dHBA and 25dHBA could also be identified and are depicted in Figure 6a,b, but 26dHBA was not detected. Both hydroxylated compounds were present as when NaCl was used. 23dHBA is present after 10 min at constant concentration of 1.3 × 10⁻⁶ M. 25dHBA shows the same pattern as 23dHBA with a concentration of 5.7 × 10⁻⁶ M.
With the Na2SO4-Pt setting, 23dHBA and 25dHBA could be observed yet 26dHBA could not be detected. However, the hydroxylated products differ in the concentration profile from the results obtained with the other three settings. A clear increase over time of both 23dHBA and 25dHBA is shown in Figure 6d with 3.24 × 10⁻⁶ M and 1.24 × 10⁻⁵ M as final concentrations for 23dHBA and 25dHBA, respectively.

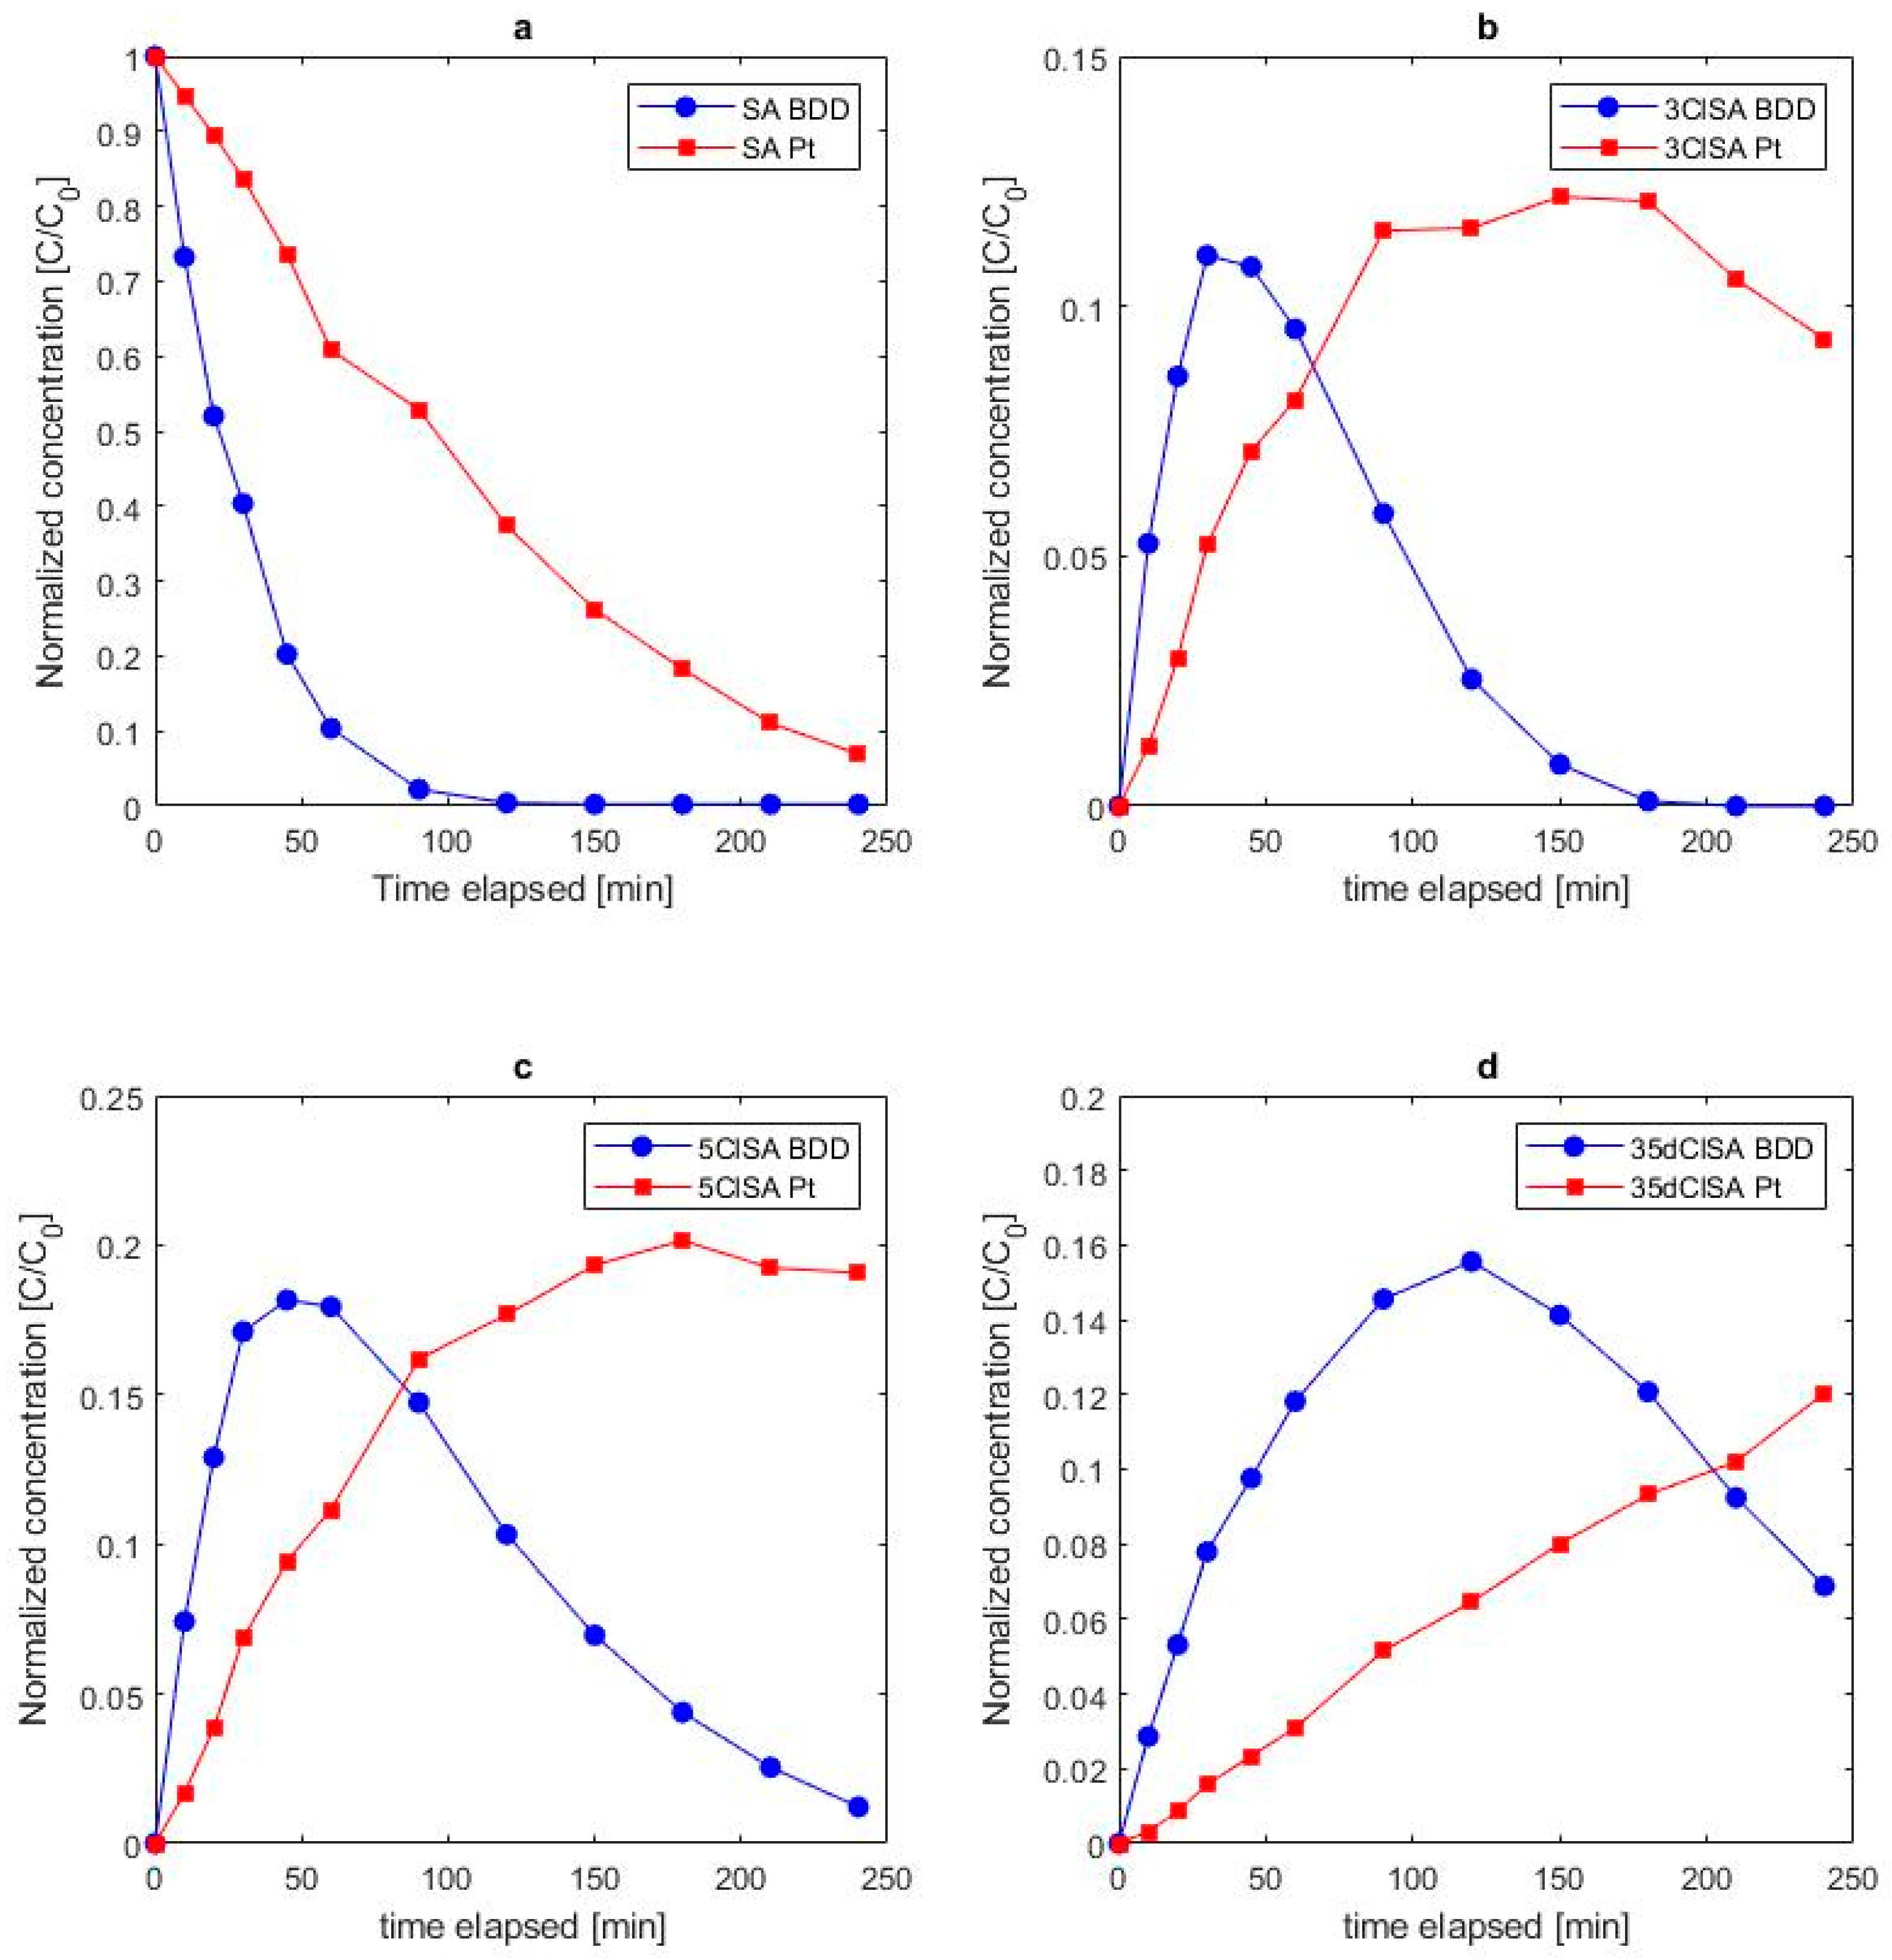
3.2.3. Formation of Chlorinated Salicylic Acid

On the BDD anode with NaCl as the supporting electrolyte, the formation of 3ClSA, 5ClSA and 35dCLSA was observed instantly after the beginning of the experiment (Figure 5a). 3ClSA reached the maximum concentration (4.10 × 10⁻⁵ M) after 45 min and was further oxidized completely after 180 min. Likewise, 5ClSA reached its peak concentration (6.72 × 10⁻⁵ M) after 45 min and was almost completely oxidized (4.64 × 10⁻⁶ M) by the end of the experiment. 35dClSA reached its peak concentration (5.80 × 10⁻⁵ M) after 120 min and exhibited a final concentration of 2.56 × 10⁻⁵ M. The observed chlorinated salicylic acid products were formed as expected based on the previous DFT calculations and as suggested by Farinholt et al. [16] and Broadwater et al. [17].
Using a Pt anode showed the same chlorinated product formation i.e., 3ClSA, 5ClSA and 35dClSA (Figure 5c). All three identified chlorinated products were observed right after the beginning of the experiment. 3ClSA reached its peak concentration (4.17 × 10⁻⁵ M) after 150 min and decreased thereafter to a final concentration of 3.19 × 10⁻⁵ M. The peak concentration of 5ClSA (6.90 × 10⁻⁵ M) was reached after 180 min and decreased to a final concentration of 6.49 × 10⁻⁵ M. For 35DClSA a steady formation and no point of concentration inflection was reached until the end of the experiment where the final concentration amounted to 4.11 × 10⁻⁵ M.
Comparing the formation of the chlorinated products on BDD and Pt electrode (Figure 7) it shows that the maximum concentration of 3ClSA (BDD: 4.10 × 10⁻⁵ M, Pt: 4.18 × 10⁻⁵ M) and 5ClSA (BDD: 6.77 × 10⁻⁵ M, Pt: 6.90 × 10⁻⁵ M) are about equal. The LOQ corresponds to 1.50 × 10⁻⁷ M for both, 3ClSA and 5ClSA. For 35dClSA, a peak concentration (5.80 × 10⁻⁵ M) was only detected with the BDD electrode (Figure 5a). The experimental time of 240 min was too short to detect a peak concentration of 35dClSA with the Pt electrode and no apparent plateau was reached by the end of the experiment (Figure 5c).

3.2.4. Influence of Electrolyte Mediated Bulk Oxidation on Intermediate Formation

The two electrolytes form different reactive species that contribute to the MEO of SA. According to the reactivity of the oxidizing species formed, they also have a major impact on the degradation kinetics. The production of free chlorine was lower with the NaCl-Pt than with the NaCl-BDD setting. A final concentration of 9.3 mg Cl2/L was measured with the Pt anode by the end of the experiment compared to 166 mg Cl2/L with the BDD anode. This demonstrates that BDD not only favors the production of quasi-free hydroxyl radicals [8], but also favors the production of active chlorine Equations (7) and (8) and the consequent chlorine oxidation of organic compounds, which is the governing oxidation mechanism during EO when using NaCl as a supporting electrolyte. However, the similar production of hydroxylated products of SA on NaCl-BDD, NaCl-Pt and Na2SO4-BDD indicates that the hydroxylation takes part to the same extent regardless of electrolyte and anode material for the three mentioned parameter combinations. These findings show that in all three cases, hydroxylation competes with MEO since the formation of hydroxylated products does not increase. That leads to the further conclusion that despite the hydroxylation of SA there is also an MEO process, which governs the oxidation of SA on Na2SO4-BDD. This assumption is endorsed by the results of Farhat et al. [36] whereby they confirmed the important role of sulfate radicals formed on BDD anodes on the degradation of organic pollutants. Farhat et al. [36] suggested two possible pathways of sulfate radical formation on BDD anode, either via DET of SO42− or by the reaction of H2SO4 or HSO4 with the anodically generated hydroxyl radicals. Further, they suggest a nonradical activation of persulfate (S2O82−) that involves increasing the oxidation rate of organic contaminants. The Na2SO4-Pt parameter setting differs in its result compared to the other three parameter settings with regards to the concentration profile of the two hydroxylated compounds. The maximum concentration of both 23dHBA and 25dHBA differ by more than a factor 2 compared to the obtained concentration with the three other parameter settings. Since hydroxyl radical production is less on Pt than on BDD there is less mediating oxidizing species formed, as confirmed above concerning active chlorine species. Additionally, sulfate active species are not present when the Pt anode is used since the oxidation potential of sulfate (2.01 V vs. standard hydrogen electrode) exceeds the potential window of the Pt anode (depicted in Figure 4b) and oxygen evolution starts before sulfate oxidation. Thus, oxidation of SA at the Pt anode and Na2SO4 supporting electrolyte is governed by the higher oxides formed at active electrode surfaces, which are less reactive than the physically adsorbed hydroxyl radicals at the BDD anodes. This is reflected in slower overall degradation kinetics. Thus, the lack of oxidative species other than the higher oxides at the Pt anode surface explains why the partial oxidation of 23dHBA and 25dHBA is governing the process and not complete mineralization.

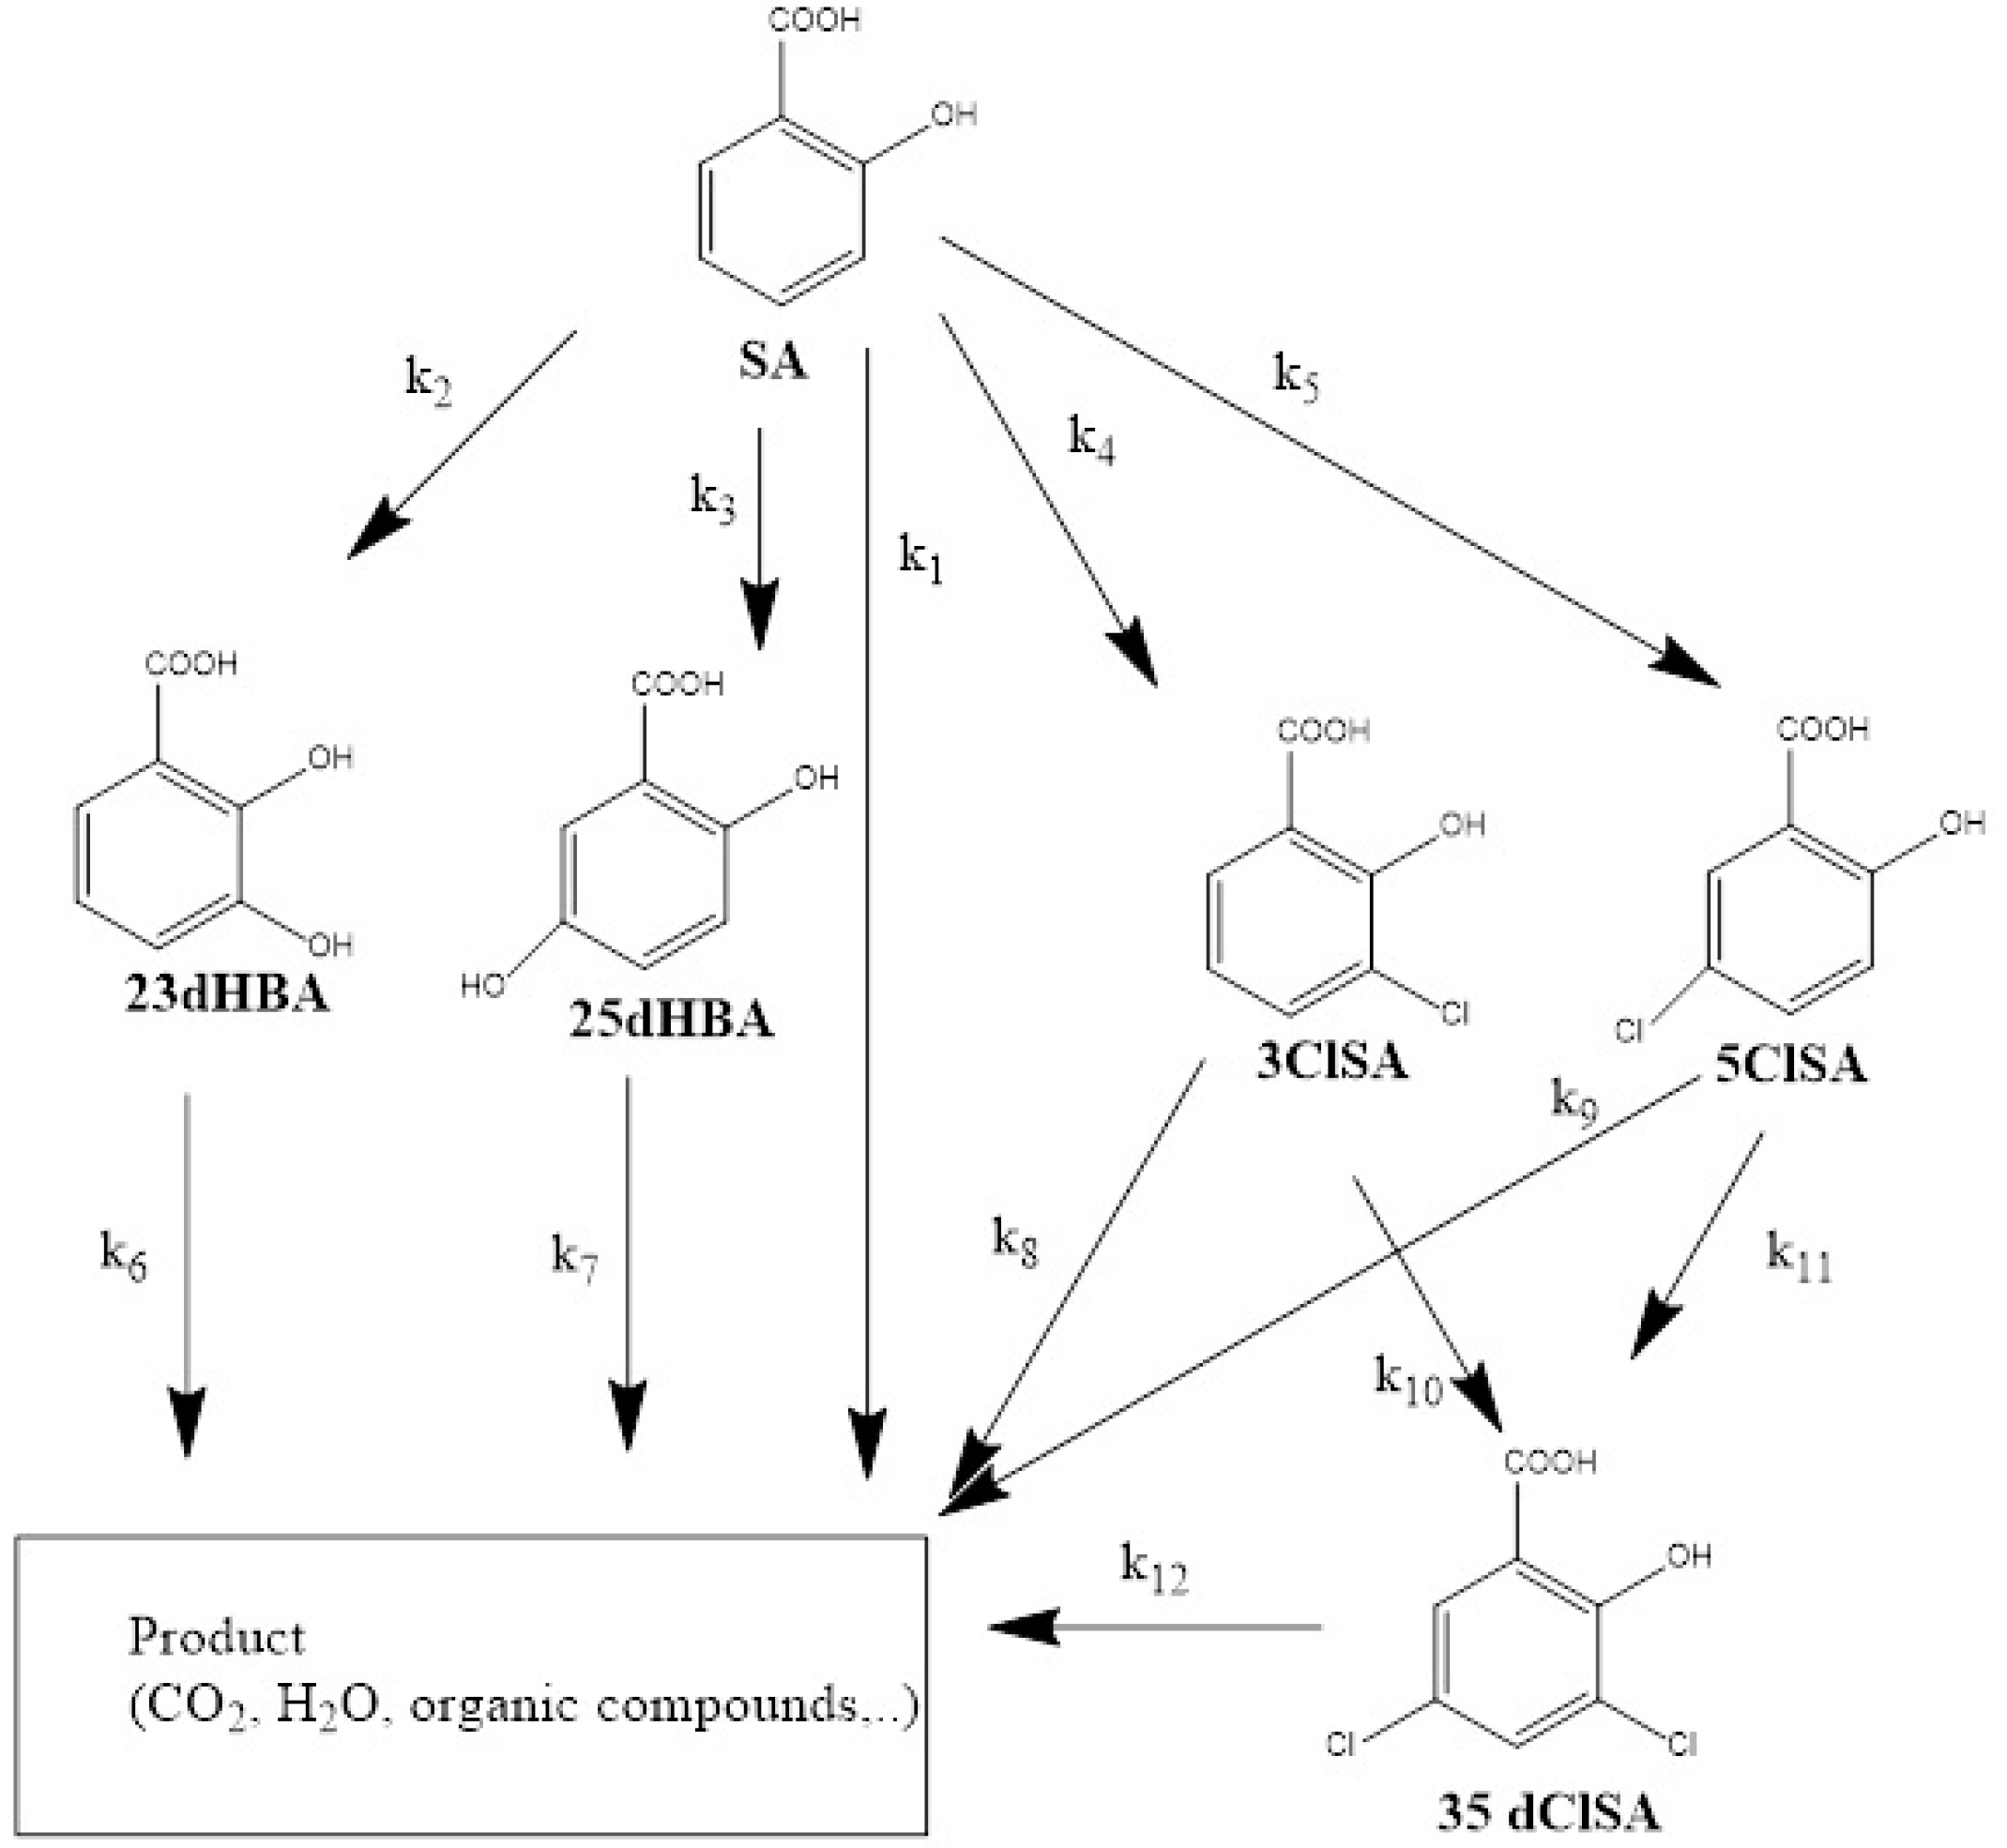
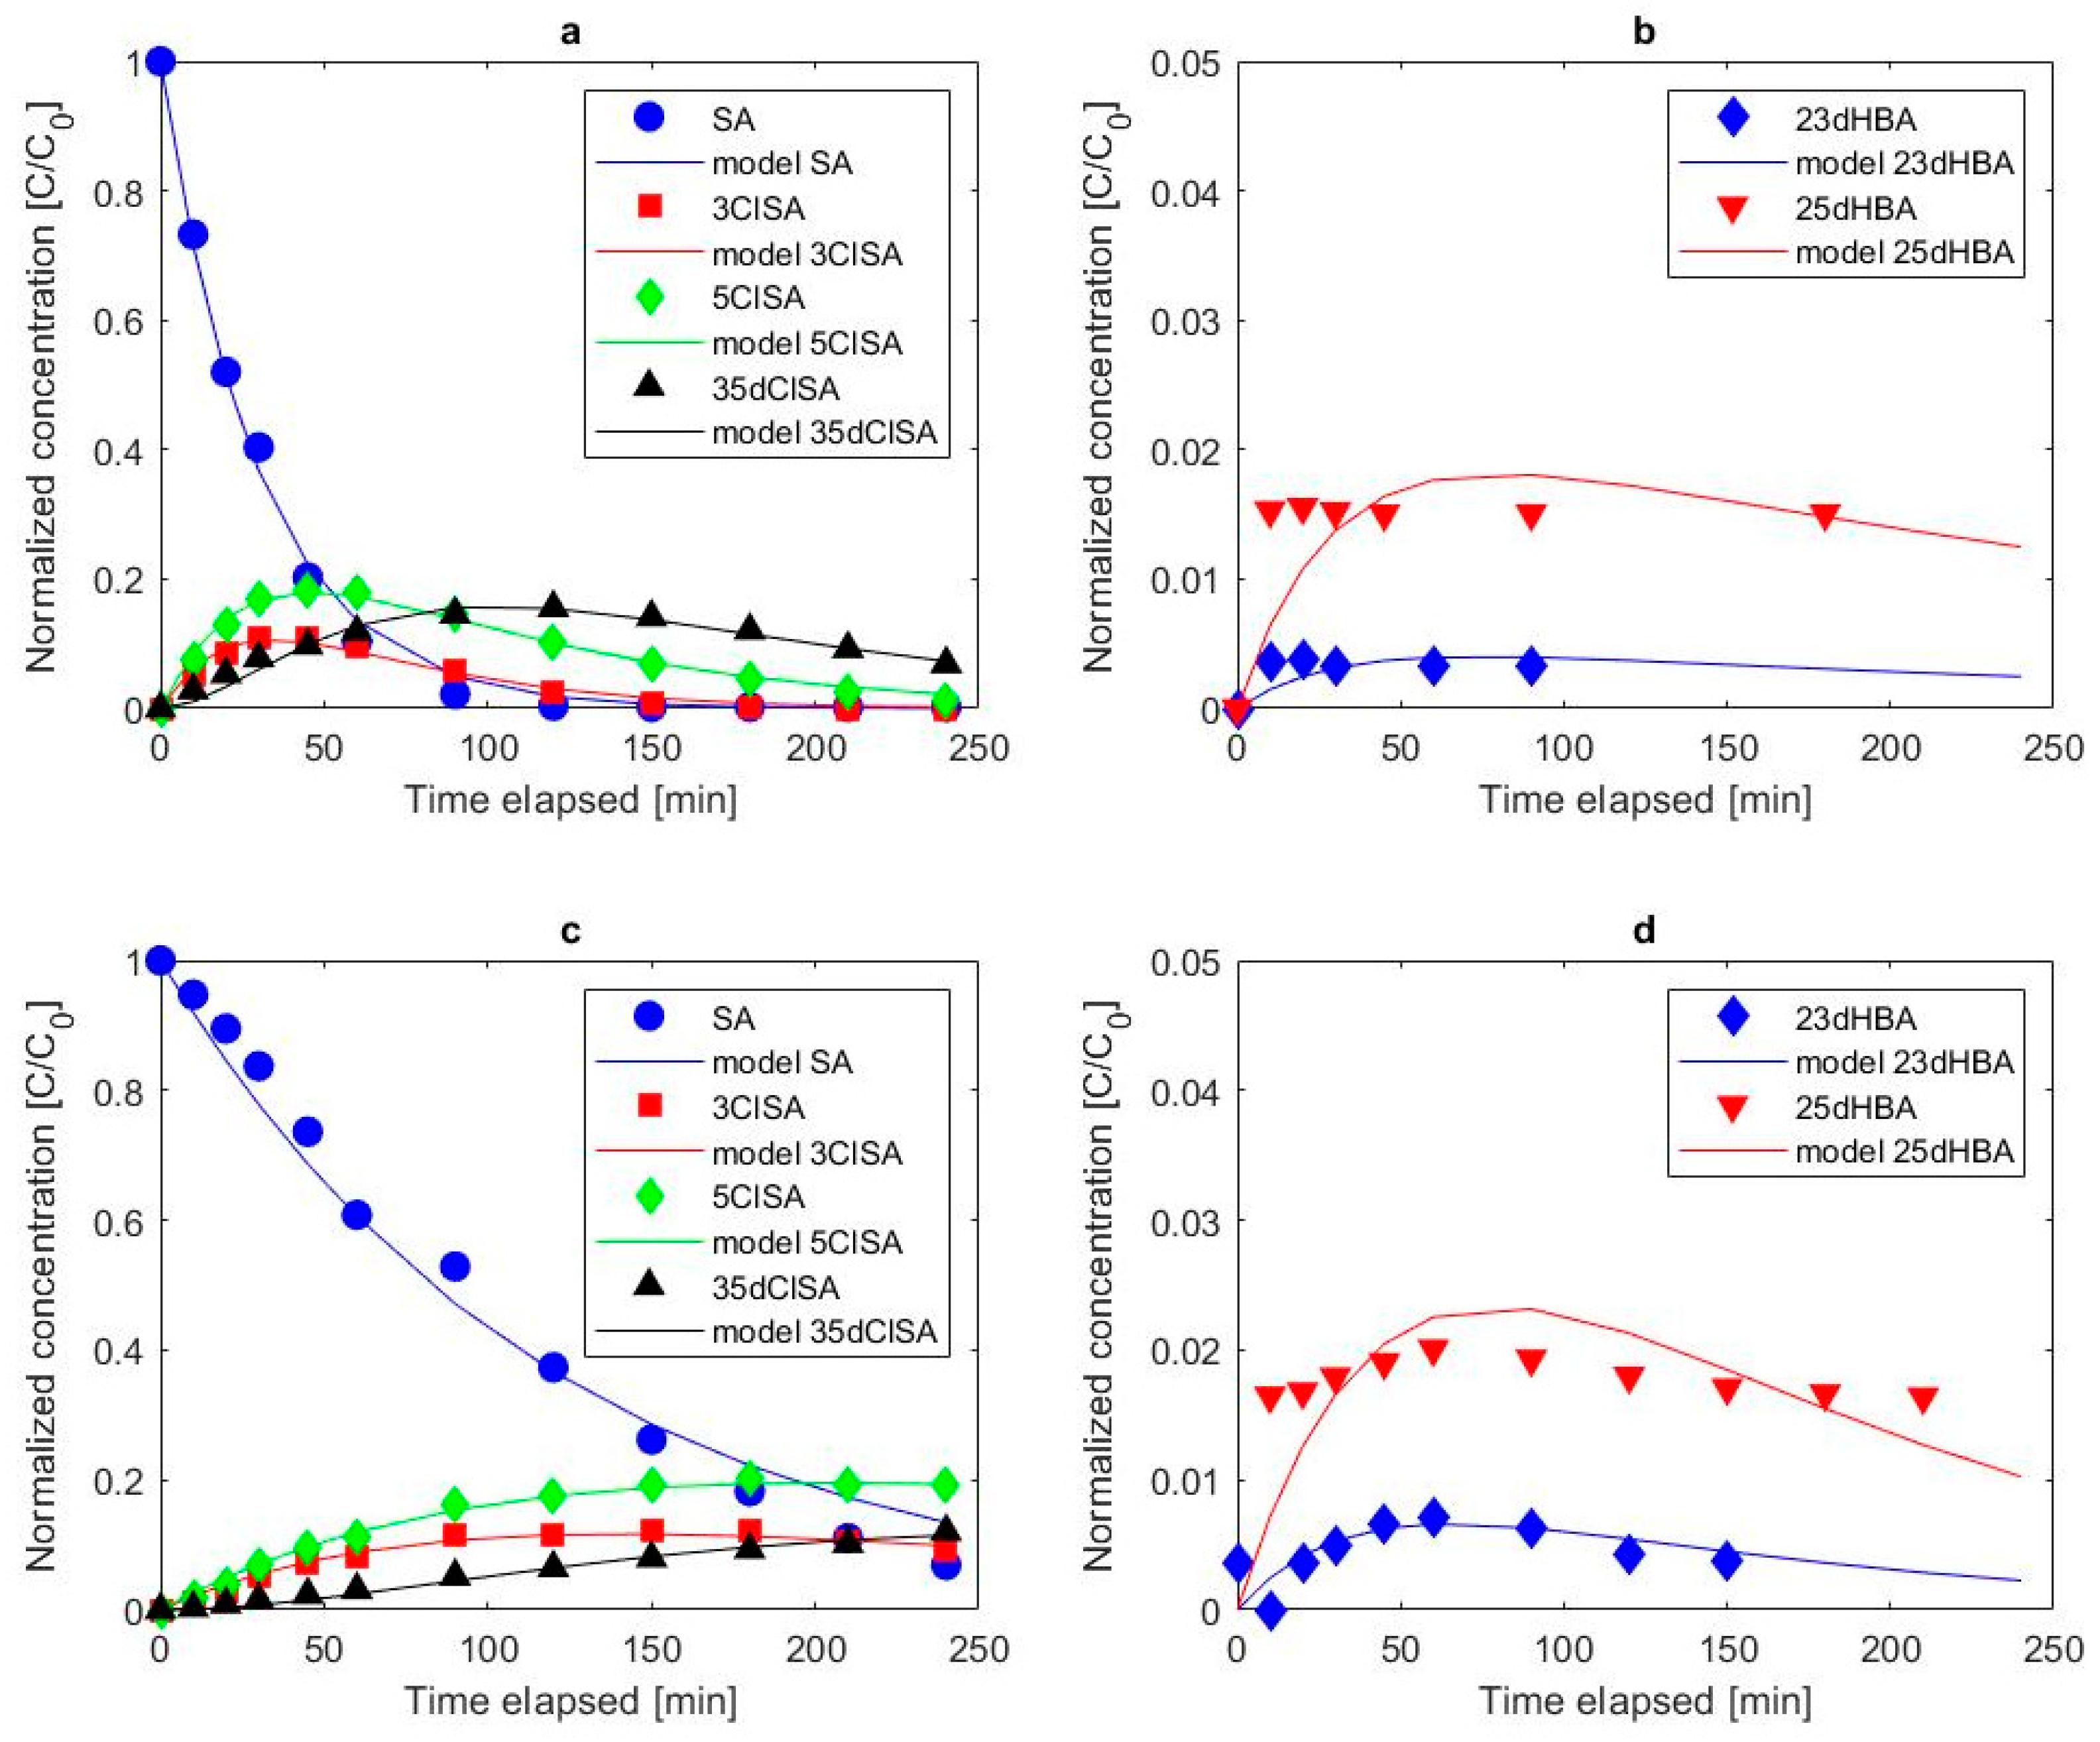
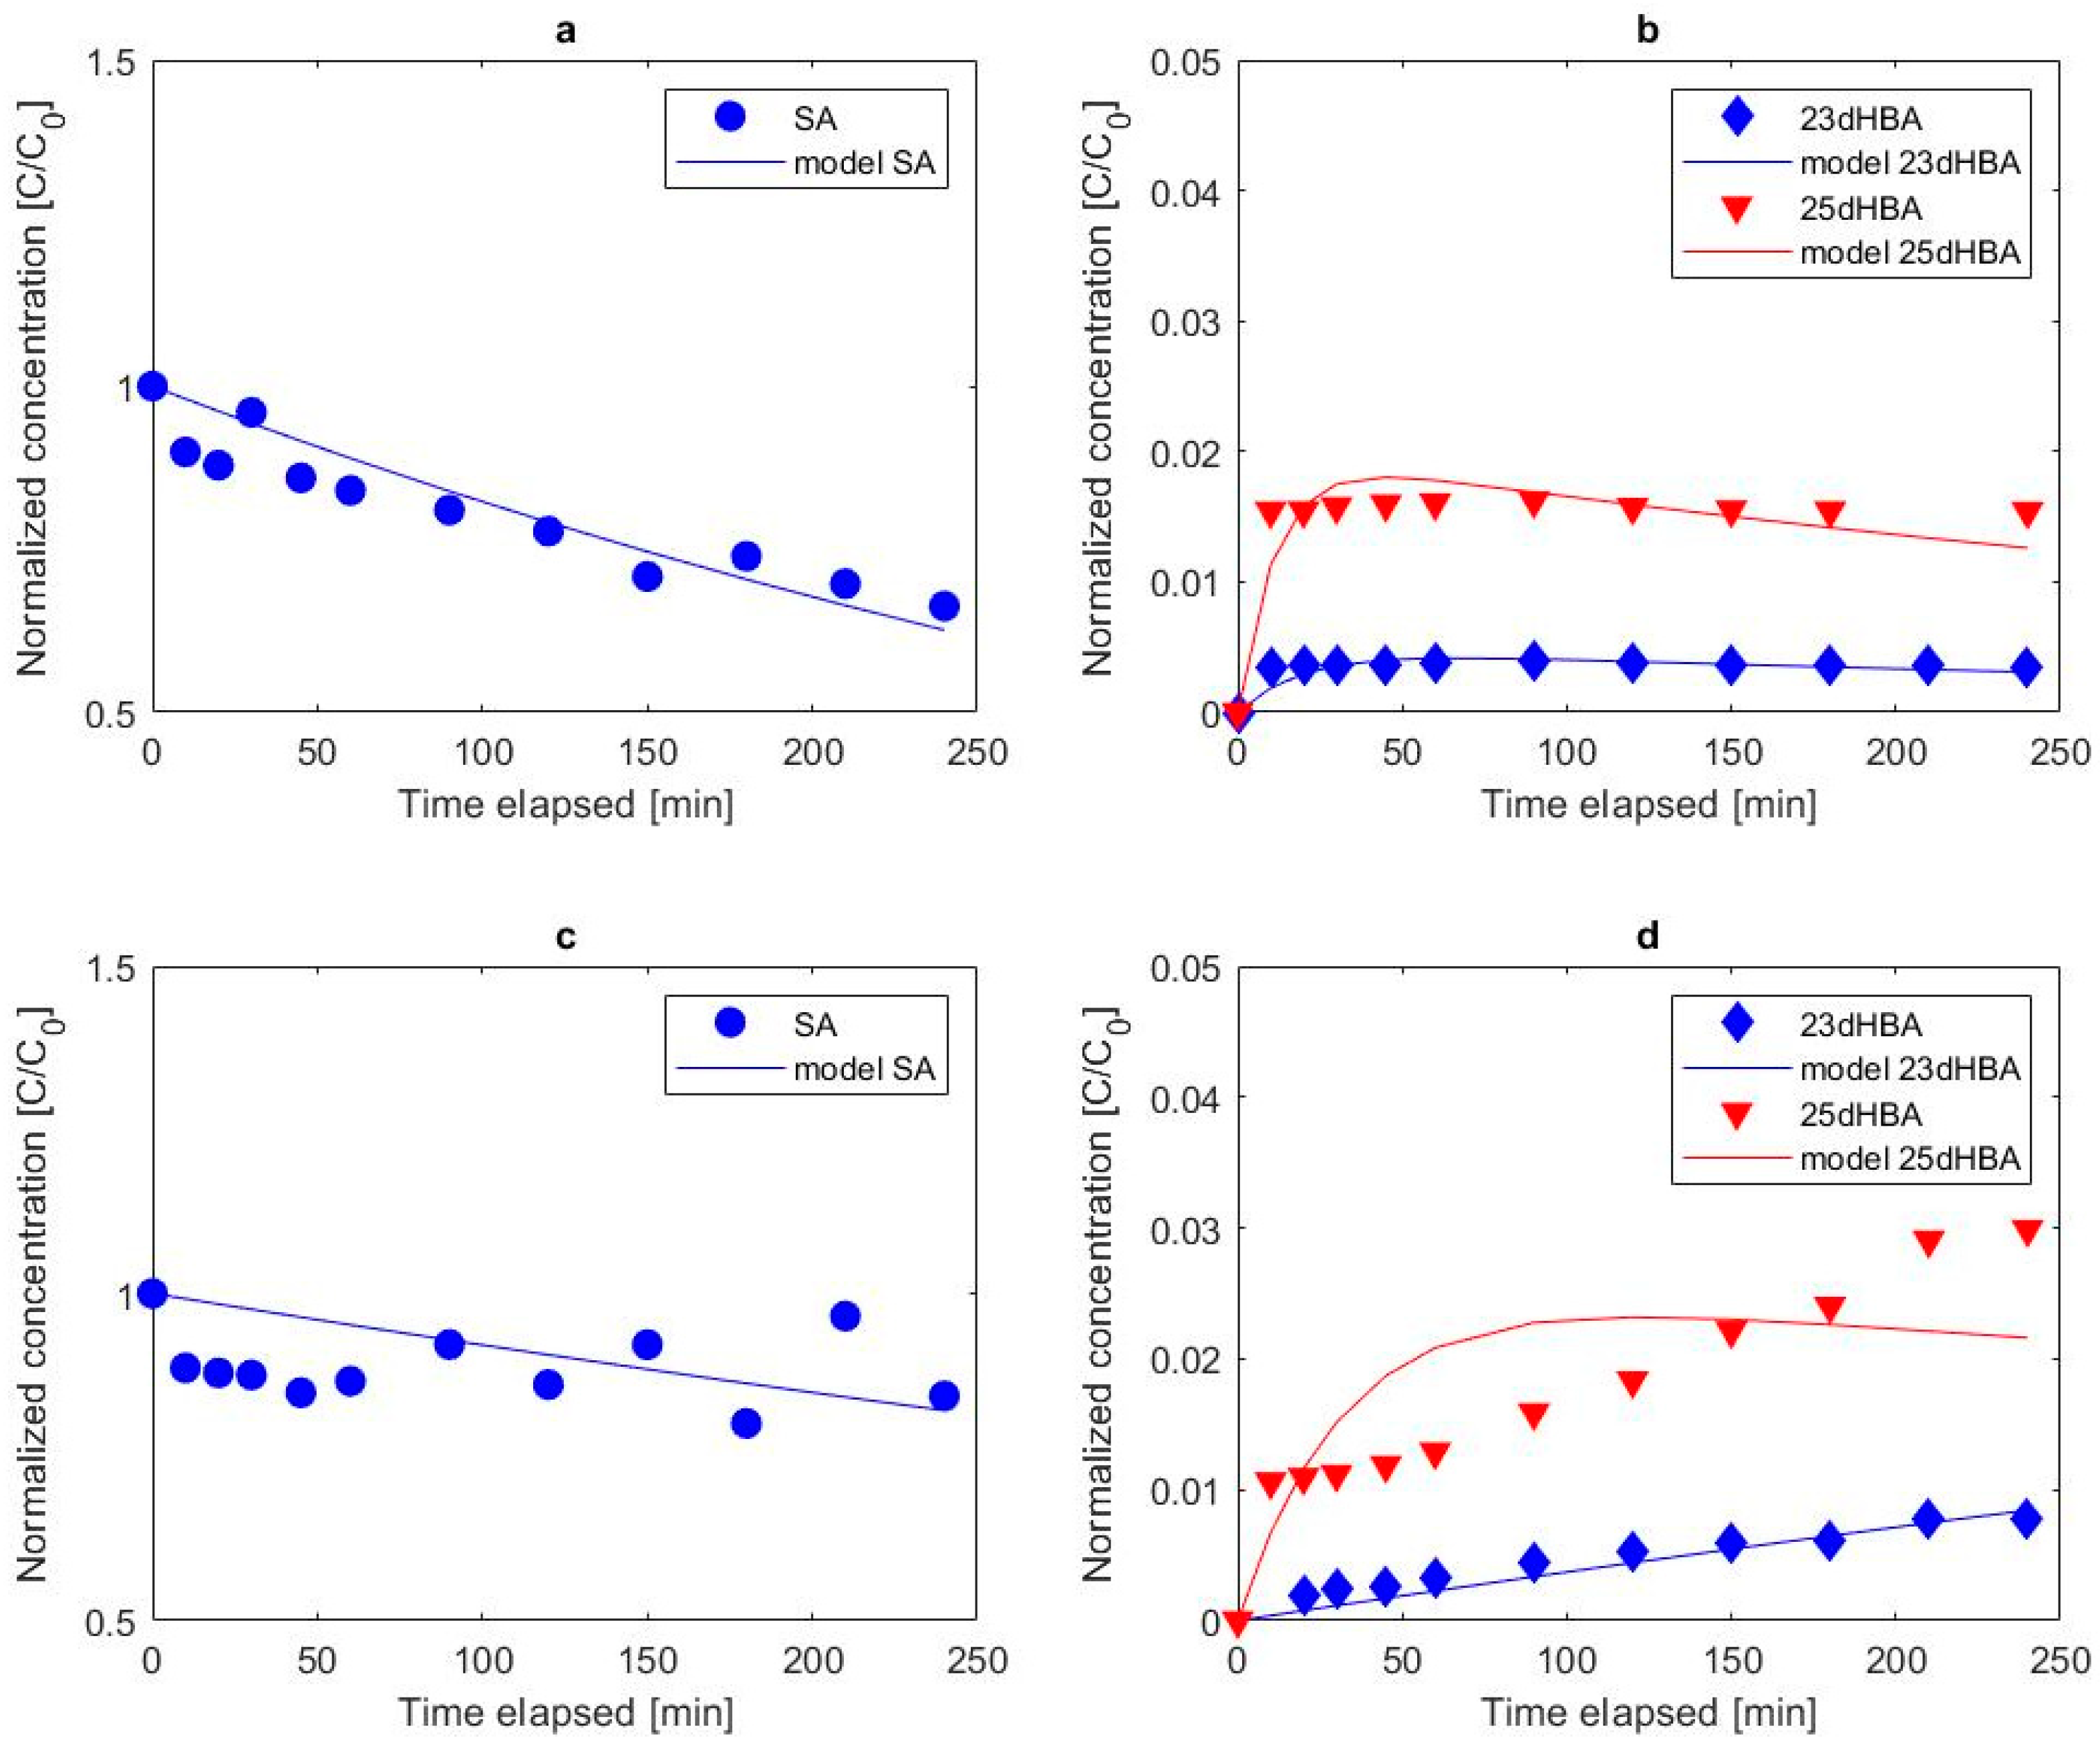
3.3. Overall Degradation Kinetics of Salicylic Acid

A degradation of 50 mg/L (362’004 nM) SA was followed over time for all four parameter settings and the apparent first order rate constants (kSA) are presented in Table 3. Figure 5a depicts the results using BDD in combination with NaCl as the supporting electrolyte. SA could not be detected after 120 min (LOD of 30 nM). The kinetic behavior observed for SA was in accordance with the theory of the chosen mass transfer limiting conditions on BDD electrodes [22], where the applied current was higher than the limiting current (8 mA/cm2). Oxidation of SA on Pt followed the same pattern as on the BDD anode and is depicted in Figure 5c. However, no complete degradation of SA was achieved during the experimental time whereby 7% of the initial SA concentration was still present at the end of the experiment. When Na2SO4 is used as the electrolyte the degradation of SA proceeds at a more moderate rate than with NaCl. For the Na2SO4-BDD setting, 66% of the initial SA concentration could still be observed at the end of the experiment (Figure 6a). The Na2SO4-Pt setting leads to a nearly constant concentration of SA with a final concentration corresponding to 84% of the initial SA concentration (Figure 6c).
The proposed chemical kinetic model (Figure 3) was fitted to the experimental data of SA, hydroxylated and chlorinated products and the corresponding computed results are depicted in Figure 5 and Figure 6. In addition, Table 3 summarizes the rate constants (k) and the fitting quality (R2) for the four different parameter settings.
The formation of hydroxylated products (k2 and k3) of SA are adequately described by the model and exhibit a R2 between 77% and 88% for all four parameter settings. The only exception is 25dHBA with the Na2SO4-Pt setting and a R2 of 64%, which means a less adequate fit of the model and the experimental data. This discrepancy can be explained by the scattered experimental data of SA and in consideration of the low amount of 25dHBA that is produced, i.e., less than 3% of SA is degraded to 25dHBA (Figure 6d). Because the kinetic model is assuming first order kinetics and the experimental data of 25dHBA does not exhibit clear first order kinetics, the fitting of the model to the experimental data is less accurate. Looking at the rate constants of the hydroxylated degradation products, it is evident that 25dHBA is formed faster (k3) than 23dHBA (k2) for all four parameter settings. These results are supported by the DFT calculation where the relative energy for 23dHBA was calculated to be higher than for 25dHBA, which means that 25dHBA is the more stable product. The degradation of the hydroxylated products to other organic products or complete combustion to CO2 is expressed through k6 and k7 for 23dHBA and 25dHBA, respectively and is generally faster than their formation.
Formation and degradation of chlorinated products of SA are described to an exceeding extent by the suggested kinetic model. R2 for both, BDD and Pt anode are between 93% and 97%. The formation of 5ClSA proceeds at a faster rate (k5) than the formation of 3ClSA (k4) on both anode materials. Similar to the hydroxylation of SA, this can also be explained by the preliminary DFT calculations with the predicted relative energy for each compound (Table 1). The relative energy is lower for 5ClSA than for 3ClSA making 5ClSA the more stable product. The decrease of 3ClSA and 5ClSA consists of the formation of 35dClSA (k10 & k11) and the degradation to other organic products or complete combustion to CO2 (k8 & k9). The sums of k8 and k10 for 3ClSA and k9 and k10 for 5ClSA represent their degradation rate and show that 5ClSA is degraded at faster rate than 3ClSA on both anode materials. The degradation rate (k12) of 35dClSA is slower than the one of the mono chlorinated SA on both, BDD and Pt anode.
When comparing the rate constants of hydroxylation and chlorination of SA it becomes evident that chlorination takes place at considerably faster rates than hydroxylation. On BDD anodes, the formation of 3ClSA is a factor 49 and 11 faster than the formation of 23dHBA and 25dHBA, respectively. Likewise, the formation of 5ClSA is a factor 63 and 14 faster than the formation of 23dHBA and 25dHBA, respectively. The same pattern can be observed for when the Pt anode is used yet the hydroxylation and chlorination rates differ less than with the BDD anode. 3ClSA is formed by a factor 8 and 3 faster than 23dHBA and 25dHBA, respectively. According to this, the formation of 5ClSA is a factor 10 and 3 faster than the formation of 23dHBA and 25dHBA, respectively. In conclusion, chlorination governs the degradation of SA during electrochemical oxidation, no matter the electrode material.
Finally, the kinetic model also provided the apparent rate constant of the SA degradation (kSA), which consists of the sum of k1 to k5. Whereby k1 accounts for the formation of other, not investigated organic products, the oxidation product of SA resulting from DET or other oxidation mechanisms of SA (Figure 3). Further, the degradation of SA to hydroxylated (k2 and k3) and chlorinated (k4 and k5) products are also accounted for in the apparent rate constant kSA. The proposed kinetic model does not provide an individual rate constant for DET and thus its contribution to the degradation of SA is out of scope of this study. However, when NaCl is used instead of Na2SO4, k1 is more than a factor 1.01 × 10¹¹ higher for both anode materials and thus contributing to a higher degree to kSA as when k1 is obtained with Na2SO4. It indicates that if chlorination is not contributing to k1 in terms of complete combustion of SA to CO2 or by the formation of other, not investigated chlorinated compounds the value of k1 becomes significantly lower. This suggests that DET of SA, remains a mechanism that contributes to k1 but plays a minor role in its degradation pathway. By comparing the different values for kSA for the four parameter settings (Table 3) it becomes evident that the degradation of SA is in general faster with NaCl is used than with Na2SO4. However, among experiments using the same electrolyte, the use of a BDD anode resulted in a higher kSA than with a Pt anode. On a BDD anode, the kSA is a factor 17 higher for NaCl than for Na2SO4, and on a Pt anode the kSA is a factor 10 higher for NaCl than for Na2SO4. Regardless of the parameter settings, the proposed kinetic model describes the experimental data of the SA degradation via kSA to an exceeding extent with an R2 of 92% or higher.

4. Conclusions

  • This study confirms the formation of chlorinated intermediates. Three different chlorinated oxidation products were identified, 3ClSA, 5ClSA and 35dClSA, whereby 5ClSA was more frequently detected than 3ClSA and 35dClSA.
  • Hydroxylation of salicylic acid via anodically generated hydroxyl radicals was confirmed via the identification and quantification of 23dHBA and 25dHBA. 25dHBA was more frequently formed than 23dHBA.
  • Density functional theory and natural bond theory computations revealed the highest spin density at the C3 and C5 atom of salicylic acid. This explains the formation of the observed chlorinated and hydroxylated intermediates of salicylic acid, and why other intermediates like 26dHBA or 4ClSA were not detected.
  • In chloride electrolyte, oxidation via mediating oxidizing species was found to be the governing oxidation process on both tested anode materials, whereas hydroxylation took place but at much lower rates than chlorination.
  • Cyclic voltammetry confirmed of direct electron transfer of salicylic acid on Pt anodes, but not on BDD electrodes. The proposed kinetic model adequately describes the degradation of salicylic acid, and the formation of its chlorinated and hydroxylated intermediates and corresponding rate constants could be derived.

Supplementary Materials

The following are available online at https://www.mdpi.com/2073-4441/11/7/1322/s1, Tables S1–S4: original experimental data, Table S5: LOQ values of analysed compounds

Author Contributions

N.A., J.M., C.H. and T.M. conceived and designed the experiments. N.A. performed the experiments and analyzed the data. T.T and N.L.M. performed the DFT and NBT computations. T.T.T. wrote and validated the kinetic model. N.A. and T.T wrote the manuscript. J.M., C.H. and T.M reviewed and edited the manuscript. J.M., C.H. and T.M supervised the work.

Funding

This work is funded by the Norwegian University of Science and Technology (NTNU) and Søndre Helgeland Miljøverk IKS (SHMIL, Norway).

Acknowledgments

The authors acknowledge the computational resources of the Norwegian Metacentre for Computational Science (NOTUR). A special thank goes to Kåre Andre Kristiansen for his invaluable support in the MS-lab.

Conflicts of Interest

The authors declare no conflict of interest.

References

  1. Fuoco, R.; Giannarelli, S. Integrity of aquatic ecosystems: An overview of a message from the South Pole on the level of persistent organic pollutants (POPs). Microchem. J. 2019, 148, 230–239. [Google Scholar] [CrossRef]
  2. Li, Z. Health risk characterization of maximum legal exposures for persistent organic pollutant (POP) pesticides in residential soil: An analysis. J. Environ. Manag. 2018, 205, 163–173. [Google Scholar] [CrossRef] [PubMed]
  3. Jones, K.C.; de Voogt, P. Persistent organic pollutants (POPs): State of the science. Environ. Pollut. 1999, 100, 209–221. [Google Scholar] [CrossRef]
  4. Wang, F.; Smith, D.W.; El-Din, M.G. Application of advanced oxidation methods for landfill leachate treatment–A review. J. Environ. Eng. Sci. 2003, 2, 413–427. [Google Scholar] [CrossRef]
  5. Panizza, M.; Delucchi, M.; Sirés, I. Electrochemical process for the treatment of landfill leachate. J. Appl. Electrochem. 2010, 40, 1721–1727. [Google Scholar] [CrossRef]
  6. Andreozzi, R.; Caprio, V.; Insola, A.; Marotta, R. Advanced oxidation processes (AOP) for water purification and recovery. Catal. Today 1999, 53, 51–59. [Google Scholar] [CrossRef]
  7. Dewil, R.; Mantzavinos, D.; Poulios, I.; Rodrigo, M.A. New perspectives for Advanced Oxidation Processes. J. Environ. Manag. 2017, 195, 93–99. [Google Scholar] [CrossRef] [Green Version]
  8. Comninellis, C.; Chen, G. Electrochemistry for the Environment; Springer: New York, NY, USA, 2010. [Google Scholar] [CrossRef]
  9. Foti, G.; Gandini, D.; Comninellis, C.; Perret, A.; Haenni, W. Oxidation of organics by intermediates of water discharge on IrO2 and synthetic diamond anodes. Electrochem. Solid State Lett. 1999, 2. [Google Scholar] [CrossRef]
  10. Martínez-Huitle, C.A.; Ferro, S. Electrochemical oxidation of organic pollutants for the wastewater treatment: Direct and indirect processes. Chem. Soc. Rev. 2006, 35, 1324–1340. [Google Scholar] [CrossRef]
  11. Bonfatti, F.; Ferro, S.; Lavezzo, F.; Malacarne, M.; Lodi, G.; de Battisti, A. Electrochemical Incineration of Glucose as a Model Organic Substrate II. Role of Active Chlorine Mediation. J. Electrochem. Soc. 2000, 147, 592–596. [Google Scholar] [CrossRef]
  12. Stucki, S.; Kötz, R.; Carcer, B.; Suter, W. Electrochemical waste water treatment using high overvoltage anodes Part II: Anode performance and applications. J. Appl. Electrochem. 1991, 21, 99–104. [Google Scholar] [CrossRef]
  13. Iniesta, J.; Michaud, P.; Panizza, M.; Cerisola, G.; Aldaz, A.; Comninellis, C. Electrochemical oxidation of phenol at boron-doped diamond electrode. Electrochim. Acta 2001, 46, 3573–3578. [Google Scholar] [CrossRef]
  14. Guinea, E.; Arias, C.; Cabot, P.L.; Garrido, J.A.; Rodríguez, R.M.; Centellas, F.; Brillas, E. Mineralization of salicylic acid in acidic aqueous medium by electrochemical advanced oxidation processes using platinum and boron-doped diamond as anode and cathodically generated hydrogen peroxide. Water Res. 2008, 42, 499–511. [Google Scholar] [CrossRef] [PubMed]
  15. Feng, L.; van Hullebusch, E.D.; Rodrigo, M.A.; Esposito, G.; Oturan, M.A. Removal of residual anti-inflammatory and analgesic pharmaceuticals from aqueous systems by electrochemical advanced oxidation processes, A. review. Chem. Eng. J. 2013, 228, 944–964. [Google Scholar] [CrossRef]
  16. Farinholt, L.H.; Stuart, A.P.; Twiss, D. The Halogenation of Salicylic Acid. J. Am. Chem. Soc. 1940, 62, 1237–1241. [Google Scholar] [CrossRef]
  17. Broadwater, M.A.; Swanson, T.L.; Sivey, J.D. Emerging investigators series: Comparing the inherent reactivity of often-overlooked aqueous chlorinating and brominating agents toward salicylic acid. Environ. Sci. Water Res. Technol. 2018, 4, 369–384. [Google Scholar] [CrossRef]
  18. Torriero, A.A.J.; Luco, J.M.; Sereno, L.; Raba, J. Voltammetric determination of salicylic acid in pharmaceuticals formulations of acetylsalicylic acid. Talanta 2004, 62, 247–254. [Google Scholar] [CrossRef]
  19. Wudarska, E.; Chrzescijanska, E.; Kusmierek, E. Electroreduction of Salicylic Acid, Acetylsalicylic Acid and Pharmaceutical Products Containing these Compounds. Port. Electrochim. Acta 2014, 32, 295–302. [Google Scholar] [CrossRef]
  20. Wragg, A.A.; Tagg, D.J.; Patrick, M.A. Diffusion-controlled current distributions near cell entries and corners. J. Appl. Electrochem. 1980, 10, 43–47. [Google Scholar] [CrossRef]
  21. Chatzisymeon, E.; Xekoukoulotakis, N.P.; Diamadopoulos, E.; Katsaounis, A.; Mantzavinos, D. Boron-doped diamond anodic treatment of olive mill wastewaters: Statistical analysis, kinetic modeling and biodegradability. Water Res. 2009, 43, 3999–4009. [Google Scholar] [CrossRef] [Green Version]
  22. Panizza, M.; Kapalka, A.; Comninellis, C. Oxidation of organic pollutants on BDD anodes using modulated current electrolysis. Electrochim. Acta 2008, 53, 2289–2295. [Google Scholar] [CrossRef]
  23. Frisch, D.J.F.M.J.; Trucks, G.W.; Schlegel, H.B.; Scuseria, G.E.; Robb, M.A.; Cheeseman, J.R.; Scalmani, G.; Barone, V.; Mennucci, B.; Petersson, G.A.; et al. Gaussian 09, revision B.01. 2010. Available online: http://gaussian.com/ (accessed on 13 October 2018).
  24. Becke, A.D. Density-functional exchange-energy approximation with correct asymptotic behavior. Phys. Rev. A 1988, 38, 3098–3100. [Google Scholar] [CrossRef]
  25. Weigend, F.; Furche, F.; Ahlrichs, R. Gaussian basis sets of quadruple zeta valence quality for atoms H-Kr. J. Chem. Phys. 2003, 119, 12753–12762. [Google Scholar] [CrossRef]
  26. Weigend, F. Accurate Coulomb-fitting basis sets for H. to Rn. Phys. Chem. Chem. Phys. 2006, 8, 1057–1065. [Google Scholar] [CrossRef] [PubMed]
  27. Marenich, A.V.; Cramer, C.J.; Truhlar, D.G. Universal Solvation Model Based on Solute Electron Density and on a Continuum Model of the Solvent Defined by the Bulk Dielectric Constant and Atomic Surface Tensions. J. Phys. Chem. B 2009, 113, 6378–6396. [Google Scholar] [CrossRef] [PubMed]
  28. Foster, J.P.; Weinhold, F. Natural hybrid orbitals. J. Am. Chem. Soc. 1980, 102, 7211–7218. [Google Scholar] [CrossRef]
  29. Jing, Y.; Chaplin, B.P. Mechanistic Study of the Validity of Using Hydroxyl Radical Probes To Characterize Electrochemical Advanced Oxidation Processes. Environ. Sci. Technol. 2017, 51, 2355–2365. [Google Scholar] [CrossRef]
  30. Evans, D.; Hart, J.P.; Rees, G. Voltammetric Behaviour of Salicylic Acid at a Glassy Carbon Electrode and Its Determination in Serum Using Liquid Chromatography With Amperometric Detection. Analyst 1991, 116, 803–806. [Google Scholar] [CrossRef]
  31. Dubois, D.; Moninot, G.; Kutner, W.; Jones, M.T.; Kadish, K.M. Electroreduction of Buckmlnsterfullerene, Electrolyte, and Temperature Effects Aprotic Solvents: Solvent Supporting. J. Phys. Chem. 1992, 7137–7145. [Google Scholar] [CrossRef]
  32. Lee, J.H.Q.; Koh, Y.R.; Webster, R.D. The electrochemical oxidation of diethylstilbestrol (DES) in acetonitrile. J. Electroanal. Chem. 2017, 799, 92–101. [Google Scholar] [CrossRef]
  33. Louhichi, B.; Bensalash, N.; Gadri, A. Electrochemical oxidation of benzoic acid derivatives on boron doped diamond: Voltammetric study and galvanostatic electrolyses. Chem. Eng. Technol. 2006, 29, 944–950. [Google Scholar] [CrossRef]
  34. Montilla, F.; Michaud, P.A.; Morallon, E.; Vazquez, J.L.; Comninellis, C.; Morallón, E.; Vázquez, J.L. Electrochemical oxidation of benzoic acid at boron-doped diamond electrodes. Electrochim. Acta 2002, 47, 3509–3513. [Google Scholar] [CrossRef]
  35. Madsen, H.T.; Søgaard, E.G.; Muff, J. Chemosphere Study of degradation intermediates formed during electrochemical oxidation of pesticide residue 2,6-dichlorobenzamide (BAM) at boron doped diamond (BDD) and platinum–iridium anodes. Chemosphere 2014, 109, 84–91. [Google Scholar] [CrossRef] [PubMed]
  36. Farhat, A.; Keller, J.; Tait, S.; Radjenovic, J. Removal of Persistent Organic Contaminants by Electrochemically Activated Sulfate. Environ. Sci. Technol. 2015, 49. [Google Scholar] [CrossRef] [PubMed]
Figure 1. Scheme of electrolysis setup; a: chiller; b: tank; c: cooling coil; d: peristaltic pump; e: electrolytical cell; f: power supply.
Water 11 01322 g001
Figure 2. Electronic structure of salicylic acid (SA) radical: ppin density calculated by natural bond theory (NBO) method (left) and highest occupied molecular orbital—lowest unoccupied molecular orbital (HOMO-LUMO) (right).
Water 11 01322 g002
Figure 3. Simplified chemical kinetic model for the degradation of SA.
Water 11 01322 g003
Figure 4. Cyclic voltammetry (CV) for SA in different supporting electrolytes and different anode materials (1V/s, 5 consecutive scan, current normalized for working electrode area). (a) GC, (b) Pt, (c) BDD.
Water 11 01322 g004
Figure 5. Experimental data and model with chloride (NaCl) as the supporting electrolyte: boron doped diamond (BDD) anode (a) and (b), Pt anode (c) and (d); normalized concentrations with respect to initial SA concentration.
Water 11 01322 g005
Figure 6. Experimental data and model with sulfate (Na2SO4) as the supporting electrolyte: BDD anode (a) and (b), Pt anode (c) and (d); normalized concentrations with respect to initial SA concentration.
Water 11 01322 g006
Figure 7. Normalized concentration profiles with respect to initial molar SA concentration [C0]: SA (a) chlorinated degradation products (bd) on BDD and Pt electrodes.
Water 11 01322 g007
Table 1. Relative energy of hydroxylated and chlorinated products.
Position Hydroxylate ProductRelative Energy (kJ/mol)Position Mono-Chlorinated ProductRelative Energy (kJ/mol)Position Di-Chlorinated productRelative Energy (kJ/mol)
40.040.04,50.0
610.853.93,50.1
515.739.73,44.8
318.2629.64,617.0
n/an/an/an/a3,625.5
n/an/an/an/a5,632.6
Table 2. Overview of peak potentials Epa (V) vs. Ag/AgCl (3M) for different anode materials and supporting electrolytes (scan rate: 1 V/s).
AnodeGCPtBDD
ElectrolyteNaClNa2SO4NaClNa2SO4NaClNa2SO4
Epa (V) SA1.201.071.221.15n/an/a
Table 3. Summary rate equations and fitting quality of the kinetic model.
Rate Constants (1/min)NaCl/BDDNaCl/PtNa2SO4/BDDNa2SO4/Pt
k11.28 × 10−22.24 × 10−33.32× 10−142.22 × 10⁻¹⁴
k21.75 × 10−42.89 × 10−42.41× 10−43.87 × 10⁻⁵
k37.62 × 10−48.17 × 10−41.71 × 10−37.82 × 10⁻⁴
k48.56 × 10−32.27 × 10⁻³n/an/a
k51.10 × 10−22.75 × 10⁻³n/an/a
k63.63 × 10−32.53 × 10−25.07 × 10−23.20 × 10⁻¹³
k72.89 × 10−31.80 × 10−28.70 × 10−23.05× 10⁻²
k82.22 × 10−142.22× 10⁻¹⁴n/an/a
k99.81 × 10−32.22 × 10⁻¹⁴n/an/a
k102.59 × 10−25.96 × 10⁻³n/an/a
k113.55 × 10−32.53 × 10⁻³n/an/a
k129.96 × 10−37.71 × 10⁻³n/an/a
kSA, Σ(k1–k5)3.33 × 10−28.37 × 10−31.95 × 10−38.21 × 10−4
Fitting Quality, R2 (%)
SA98%96%95%92%
23dHBA77%88%87%88%
25dHBA78%80%88%64%
3ClSA94%95%n/an/a
5ClSA96%97%n/an/a
35dClSA93%96%n/an/a

