Article

Modeling of Heavy Metal (Ni, Mn, Co, Zn, Cu, Pb, and Fe) and PAH Content in Stormwater Sediments Based on Weather and Physico-Geographical Characteristics of the Catchment-Data-Mining Approach

1
Department of Geotechnics and Water Engineering, Faculty of Environmental, Geomatic and Energy Engineering, Kielce University of Technology, Kielce 25-314, Poland
2
Department of Water and Wastewater Technology, Faculty of Environmental, Geomatic and Energy Engineering, Kielce University of Technology, Kielce 25-314, Poland
3
Systems Research Institute of Polish Academy of Sciences, Warsaw 01-447, Poland
*
Author to whom correspondence should be addressed.
Water 2019, 11(3), 626; https://doi.org/10.3390/w11030626
Submission received: 31 January 2019 / Revised: 19 February 2019 / Accepted: 22 March 2019 / Published: 26 March 2019

Abstract

:
The processes that affect sediment quality in drainage systems show high dynamics and complexity. However, relatively little information is available on the influence of both catchment characteristics and meteorological conditions on sediment chemical properties, as those issues have not been widely explored in research studies. This paper reports the results of investigations into the content of selected heavy metals (Ni, Mn, Co, Zn, Cu, Pb, and Fe) and polycyclic aromatic hydrocarbons (PAHs) in sediments from the stormwater drainage systems of four catchments located in the city of Kielce, Poland. The influence of selected physico-geographical catchment characteristics and atmospheric conditions on pollutant concentrations in the sediments was also analyzed. Based on the results obtained, statistical models for forecasting the quality of stormwater sediments were developed using artificial neural networks (multilayer perceptron neural networks). The analyses showed varied impacts of catchment characteristics and atmospheric conditions on the chemical composition of sediments. The concentration of heavy metals in sediments was far more affected by catchment characteristics (land use, length of the drainage system) than atmospheric conditions. Conversely, the content of PAHs in sediments was predominantly affected by atmospheric conditions prevailing in the catchment. The multilayer perceptron models developed for this study had satisfactory predictive abilities; the mean absolute error of the forecast (Ni, Mn, Zn, Cu, and Pb) did not exceed 21%. Hence, the models show great potential, as they could be applied to, for example, spatial planning for which environmental aspects (i.e., sediment quality in the stormwater drainage systems) are accounted.

1. Introduction

A rapid increase in urbanization has been observed in the last few decades, especially in cities. Intense anthropogenic activity is a contributing factor in the deterioration of the natural environment. That includes, among other things, the creation of increasingly larger areas of public use that are impermeable to stormwater. The resultant high rate of runoff discharge may lead to the uncontrolled pollution of natural waters. Consequently, it is necessary to develop separate stormwater drainage systems intended for stormwater collection and treatment [1,2,3].
The composition of stormwater and sediments formed in stormwater drainage systems shows high variability [4,5,6]. The complex dynamics seen in these phenomena depend on many factors. They include catchment management and the sealing of its surface, road network structure and type of road surface, traffic volume, area topography, and the deposition of atmospheric pollution (the amount of pollutants carried from the atmosphere to the surface) [7,8]. Conversely, deposition and washing-off are affected by variations in atmospheric conditions (e.g., duration and intensity of precipitation) over an annual cycle [9]. Sediments accumulated in drains and also the drainage system facilities pose a serious environmental hazard. Due to large amounts of and contamination with heavy metals and polycyclic aromatic hydrocarbons (PAHs), these toxic sediments create a major hazard to living organisms. They are also a principal source of the surface pollution of flowing waters (stormwater receivers). As a result, significant contamination of the receiver may lead to changes in the local biota and biodiversity of dependent ecosystems [10,11,12,13].
In order to select appropriate measures to reduce the adverse impact of stormwater and stormwater-transported particles on the receiver, it is necessary to understand the process of pollution transport. It is equally important to investigate the impact of changes in catchment management and use on the concentration of pollutants (heavy metals, PAHs) in stormwater sediments. In the literature, many studies on the quality of stormwater can be found. The studies mainly focus on stormwater discharged into receivers at highwater stages [10,14,15]. Far fewer studies concern the quality of sediments accumulated in stormwater drainage systems with respect to their use or management [9,16]. Research papers rarely deal with the possibility of forecasting sediment quality based on the parameters that describe catchment physiography and weather conditions, which can be easily determined with the use of GIS techniques. Simple models with satisfactory predictive capabilities would provide an important tool to support decision-making processes related to land use and stormwater management in urban catchments.
This study aims to: (i) confirm the validity of the research hypothesis that it is possible to predict the quality of sediments produced in urban stormwater drainage systems on the basis of generally available data, and (ii) to offer a methodology for designing predictive models of stormwater sediment quality that could be a tool to support the rational management of stormwater sediments.

2. Methods and Materials
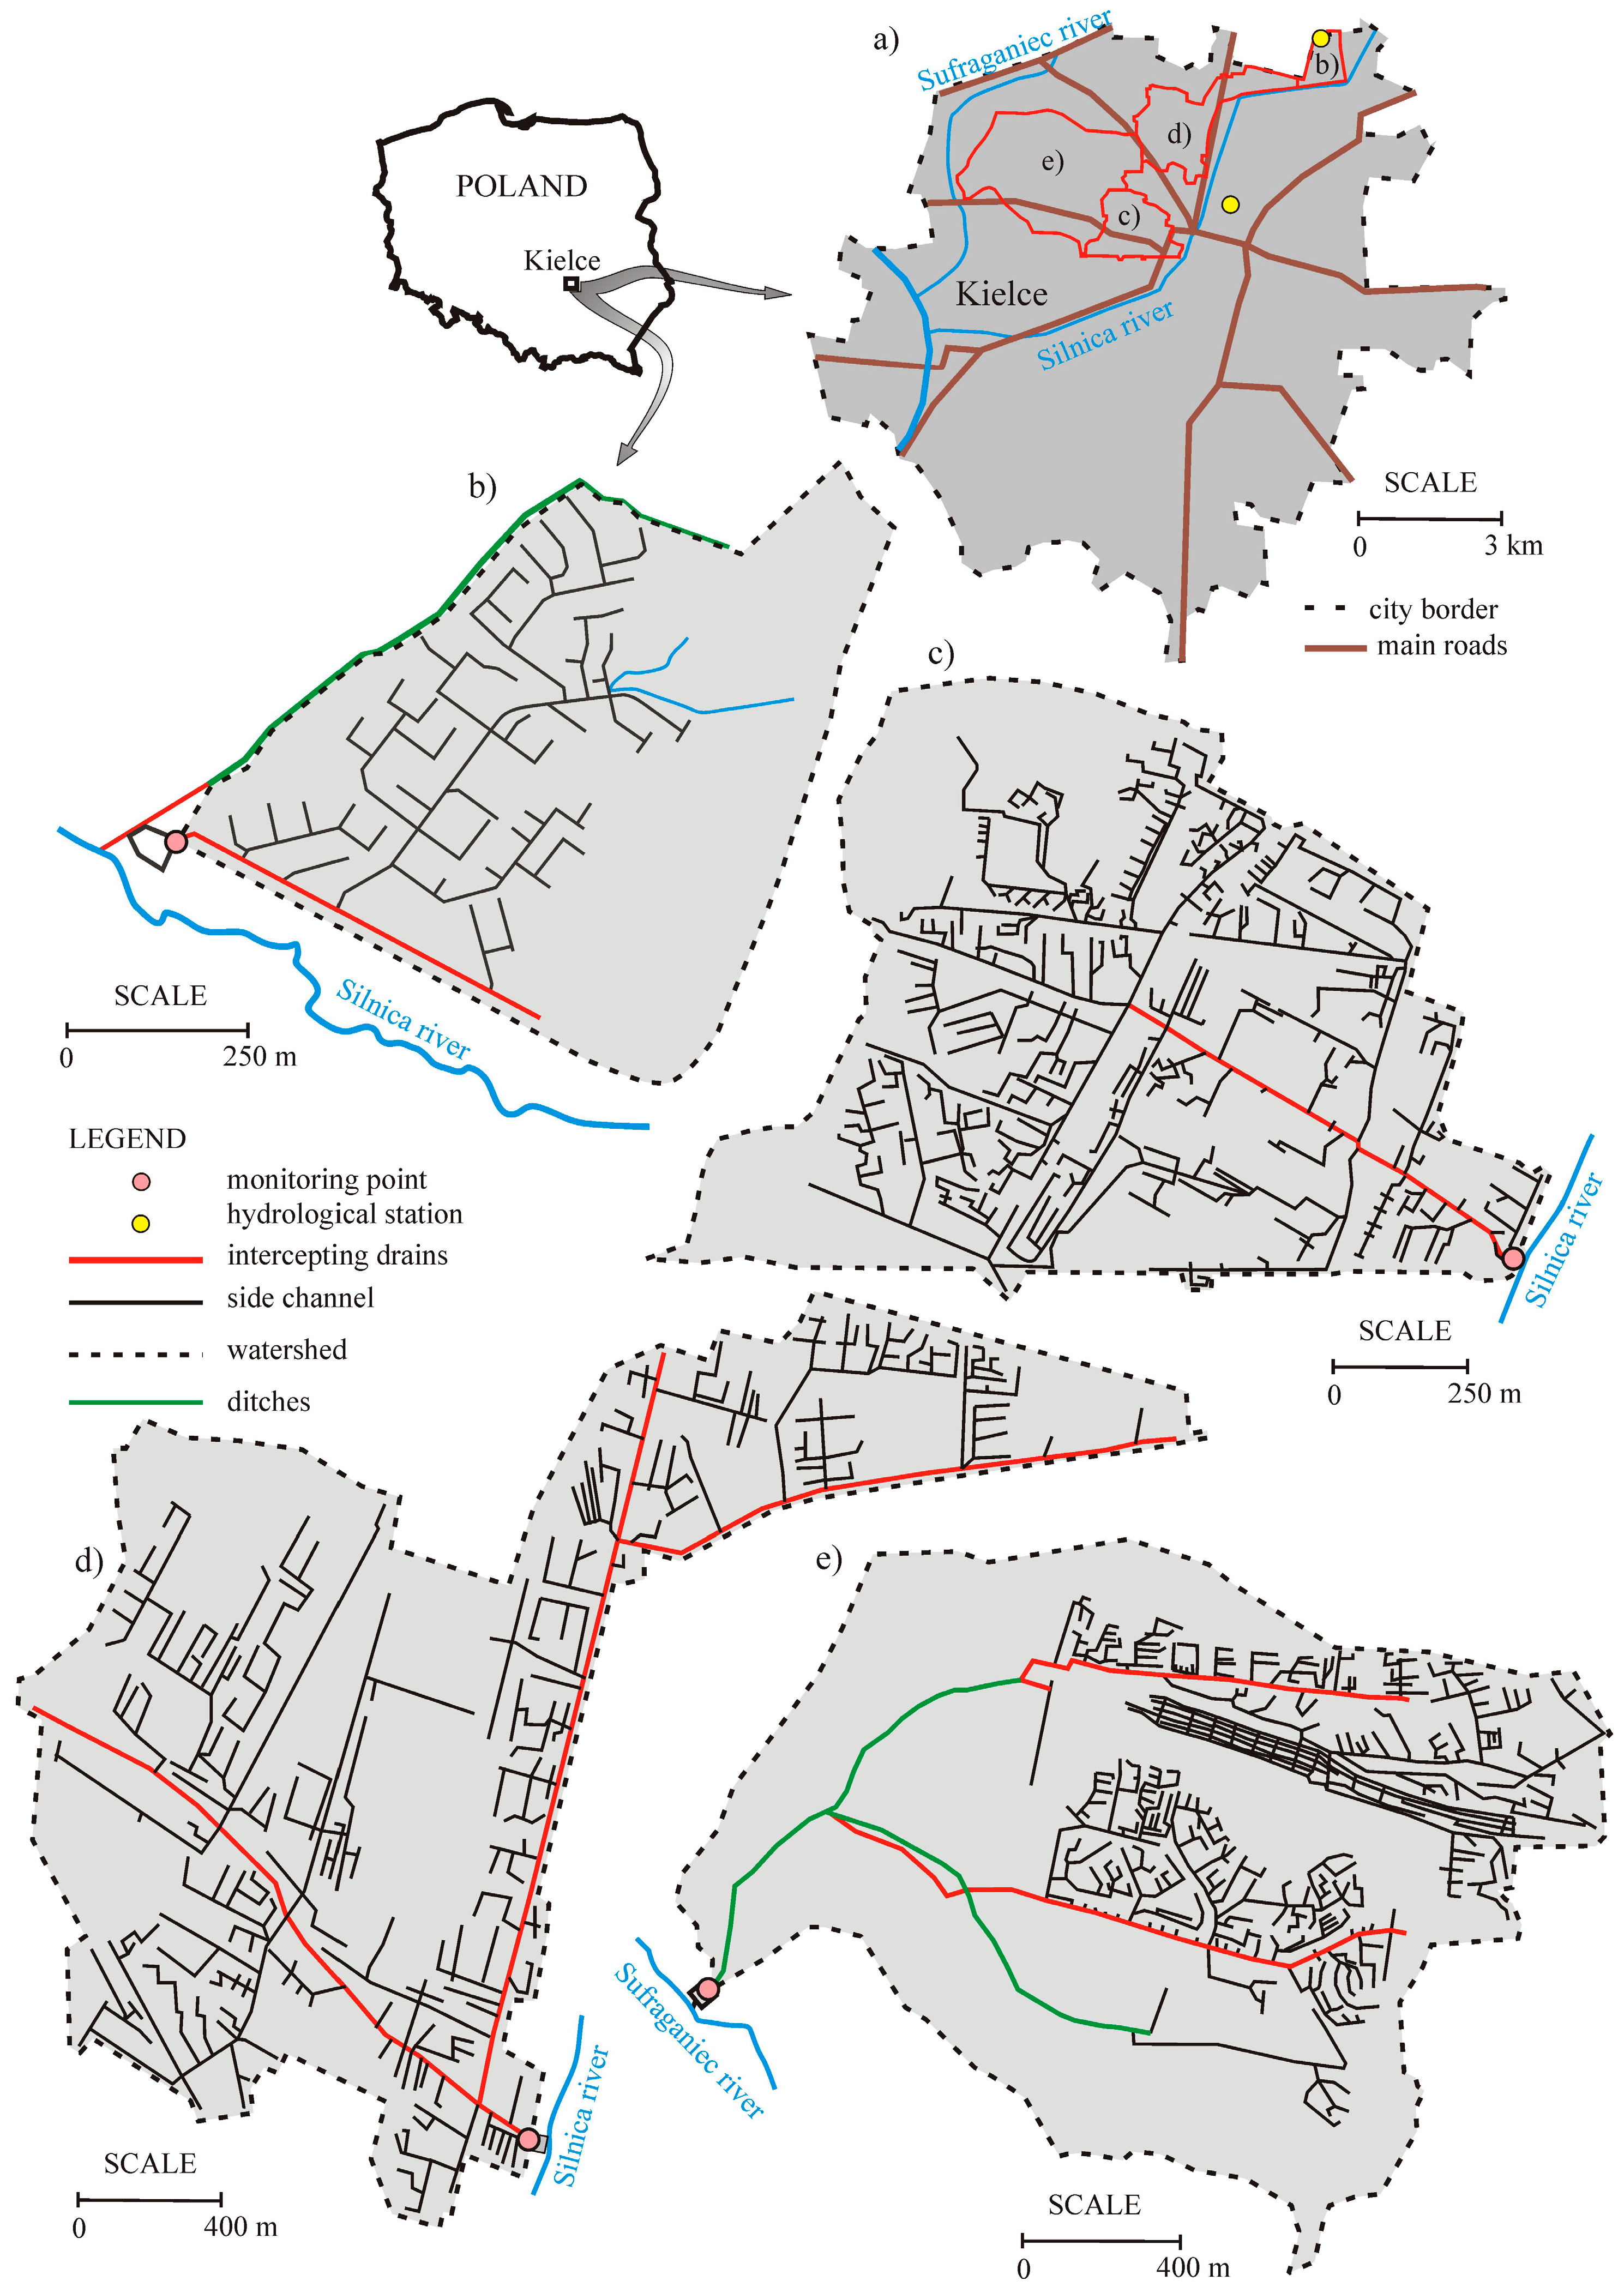
2.1. Study Area

The study covered four urban catchments located in the northwestern part of Kielce, Poland (Figure 1). These catchments differ in terms of area, land features, development, and length of the drainage system. The catchment of the Jarząbek stormwater treatment plant (SWTP) has the largest area (A = 805 ha). Covering 38.70% of its total area, green areas prevail in the catchment, whereas industrial areas constitute 22.30% (Table 1). Stormwater from the catchment is drained through a network with a total length of Lpip = 38.0 km. The drainage system consists of two main collectors with diameters of ϕ = 300–1800 mm, equipped with more than 300 street stormwater inlets and two open ditches with a length of 5.20 km. The highest point in the catchment area rises to 339.00 m a.s.l., while the lowest point lies at 245.00 m a.s.l. The slope of the catchment is 3.38%.
The Jesionowa SWTP catchment (A = 355 ha) is the second largest. Located in the northwestern part of Kielce, it includes highly urbanized areas. The stormwater drainage network, with a total length of Lpip = 16.0 km (ϕ = 200–1500 mm), contains approximately 300 street inlets. The catchment land use consists of industrial sites with large commercial facilities (71.30%) and low-rise residential buildings (14.10%). The elevation of the catchment’s highest point is 315.00 m a.s.l., whereas the lowest is 265.00 m a.s.l. The catchment slope is 2.65%.
The Kaczmarka SWTP catchment is located in the very center of Kielce (Figure 1). The land use includes predominantly high-rise residential buildings (36.60%), industrial and service areas (26.20%), and other residential buildings (24.20%). The drainage system consists of a main collector (ϕ = 300–600 mm) that is 2.1 km long, as well as side channels (ϕ = 200–1000 mm), with a total length of 13.4 km. About 400 stormwater inlets and connections to residential and commercial buildings are included in the system. The highest point in the catchment area is Karczówka Hill, lying at 339.00 m a.s.l. The lowest point is located at 258.00 m a.s.l. The catchment slope is 5.2%.
The Witosa SWTP catchment, with a total area of 82.0 ha, is the smallest. The drainage system consists of the main collector (ϕ = 1200–1400 mm) and side channels (ϕ = 300–800 mm), with a total length of 7.65 km. The system collects stormwater from the residential development of nearly 400 single- and multifamily houses. The drainage system contains 192 stormwater street inlets and connections that allow collecting stormwater from the roofs of the buildings. The residential development, with an area of 36.5 ha, constitutes 44.5% of the catchment. The remaining part, namely 45.5 ha, consists of green spaces. The highest point of the catchment is at 365.50 m a.s.l., while the lowest lies at 291.25 m a.s.l. The catchment slope is 8.2%.

2.2. Collection and Preparation of Samples and Chemical Analysis of Sediments

Samples of stormwater sediments from the studied urban catchments were collected in the years 2012–2016. Sediments were sampled after each rainfall event in the spring–summer seasons and additionally after snowmelt events in the autumn–winter seasons. Sediment sampling sites are shown in Figure 1. Immediately after collection, sediment samples were placed into sterile polyethylene containers, in compliance with international standards. Containers with samples were tightly sealed and transported to the laboratory for physicochemical analyses. In the laboratory, stormwater sediment samples were naturally dried to obtain an air-dried condition. Dried sediments were sieved (2 mm) to remove the gravel fraction and plant debris and were finally crushed. Sediment samples prepared in this way were stored in prewashed glass containers at room temperature.
For heavy metal determination, the sediment samples were oven-dried at 80 °C on glass dishes until constant weight. Each of the weighed samples (approximately 0.5 g) was transferred into Teflon vessels and then digested with 8 mL of HNO3 in a microwave oven (Multiwave 3000, Anton Paar, Graz, Austria). The digestates were left to cool at room temperature and then filtered through a 0.45-μm nitrocellulose membrane filter. The filtered digestates were diluted with distilled and deionized water to 100 mL in a volumetric flask. The total concentrations of selected heavy metals were determined using inductively coupled plasma–atomic emission spectrometry (ICP-AES) (Perkin Elmer Optima 8000, Waltham, MA, USA) with certified multielement standards. Analytical blanks and standard reference material were run in the same way as the samples, and heavy metal concentrations were determined using standard solutions prepared in the same acid matrix. Total heavy metal concentrations were determined in accordance with the PN-EN ISO 11885:2009 standard [17].
Samples of 1 g of sediment were extracted in dichloromethane using deuterated internal standards (naphthalene d-8, benzo(a)anthracene d-12). Extracts were purified on silica columns to solid phase (SPE) in a J. Baker apparatus (Centre Valley, PA, USA) and evaporated to the final volume of 1 mL. Analyses were carried out using gas chromatograph with mass detection (GC-MS, Focus DSQ Single Quadrupole, Waltham, MA, USA). The total content of 16 compounds from the PAH group in sediments from the stormwater drainage systems was determined in accordance with PN-EN 15527:2008 standard [18].

2.3. Precipitation and Atmospheric Data

It was found that in the years 2012–2016, the number of rainfall days ranged from 189 to 209, the number of snowfall days from 36 to 78, and that of days with fog from 137 to 188. Additionally, in the periods that preceded the events for which sediment quality tests were conducted, the number of days of individual categories was as follows: precipitation, 7–60; snowfall, 1–70; and fog, 25–71. The total rainfall depth in the rainfall events according to DWA-A 118 [19] ranged from 3.0 to 45.2 mm.

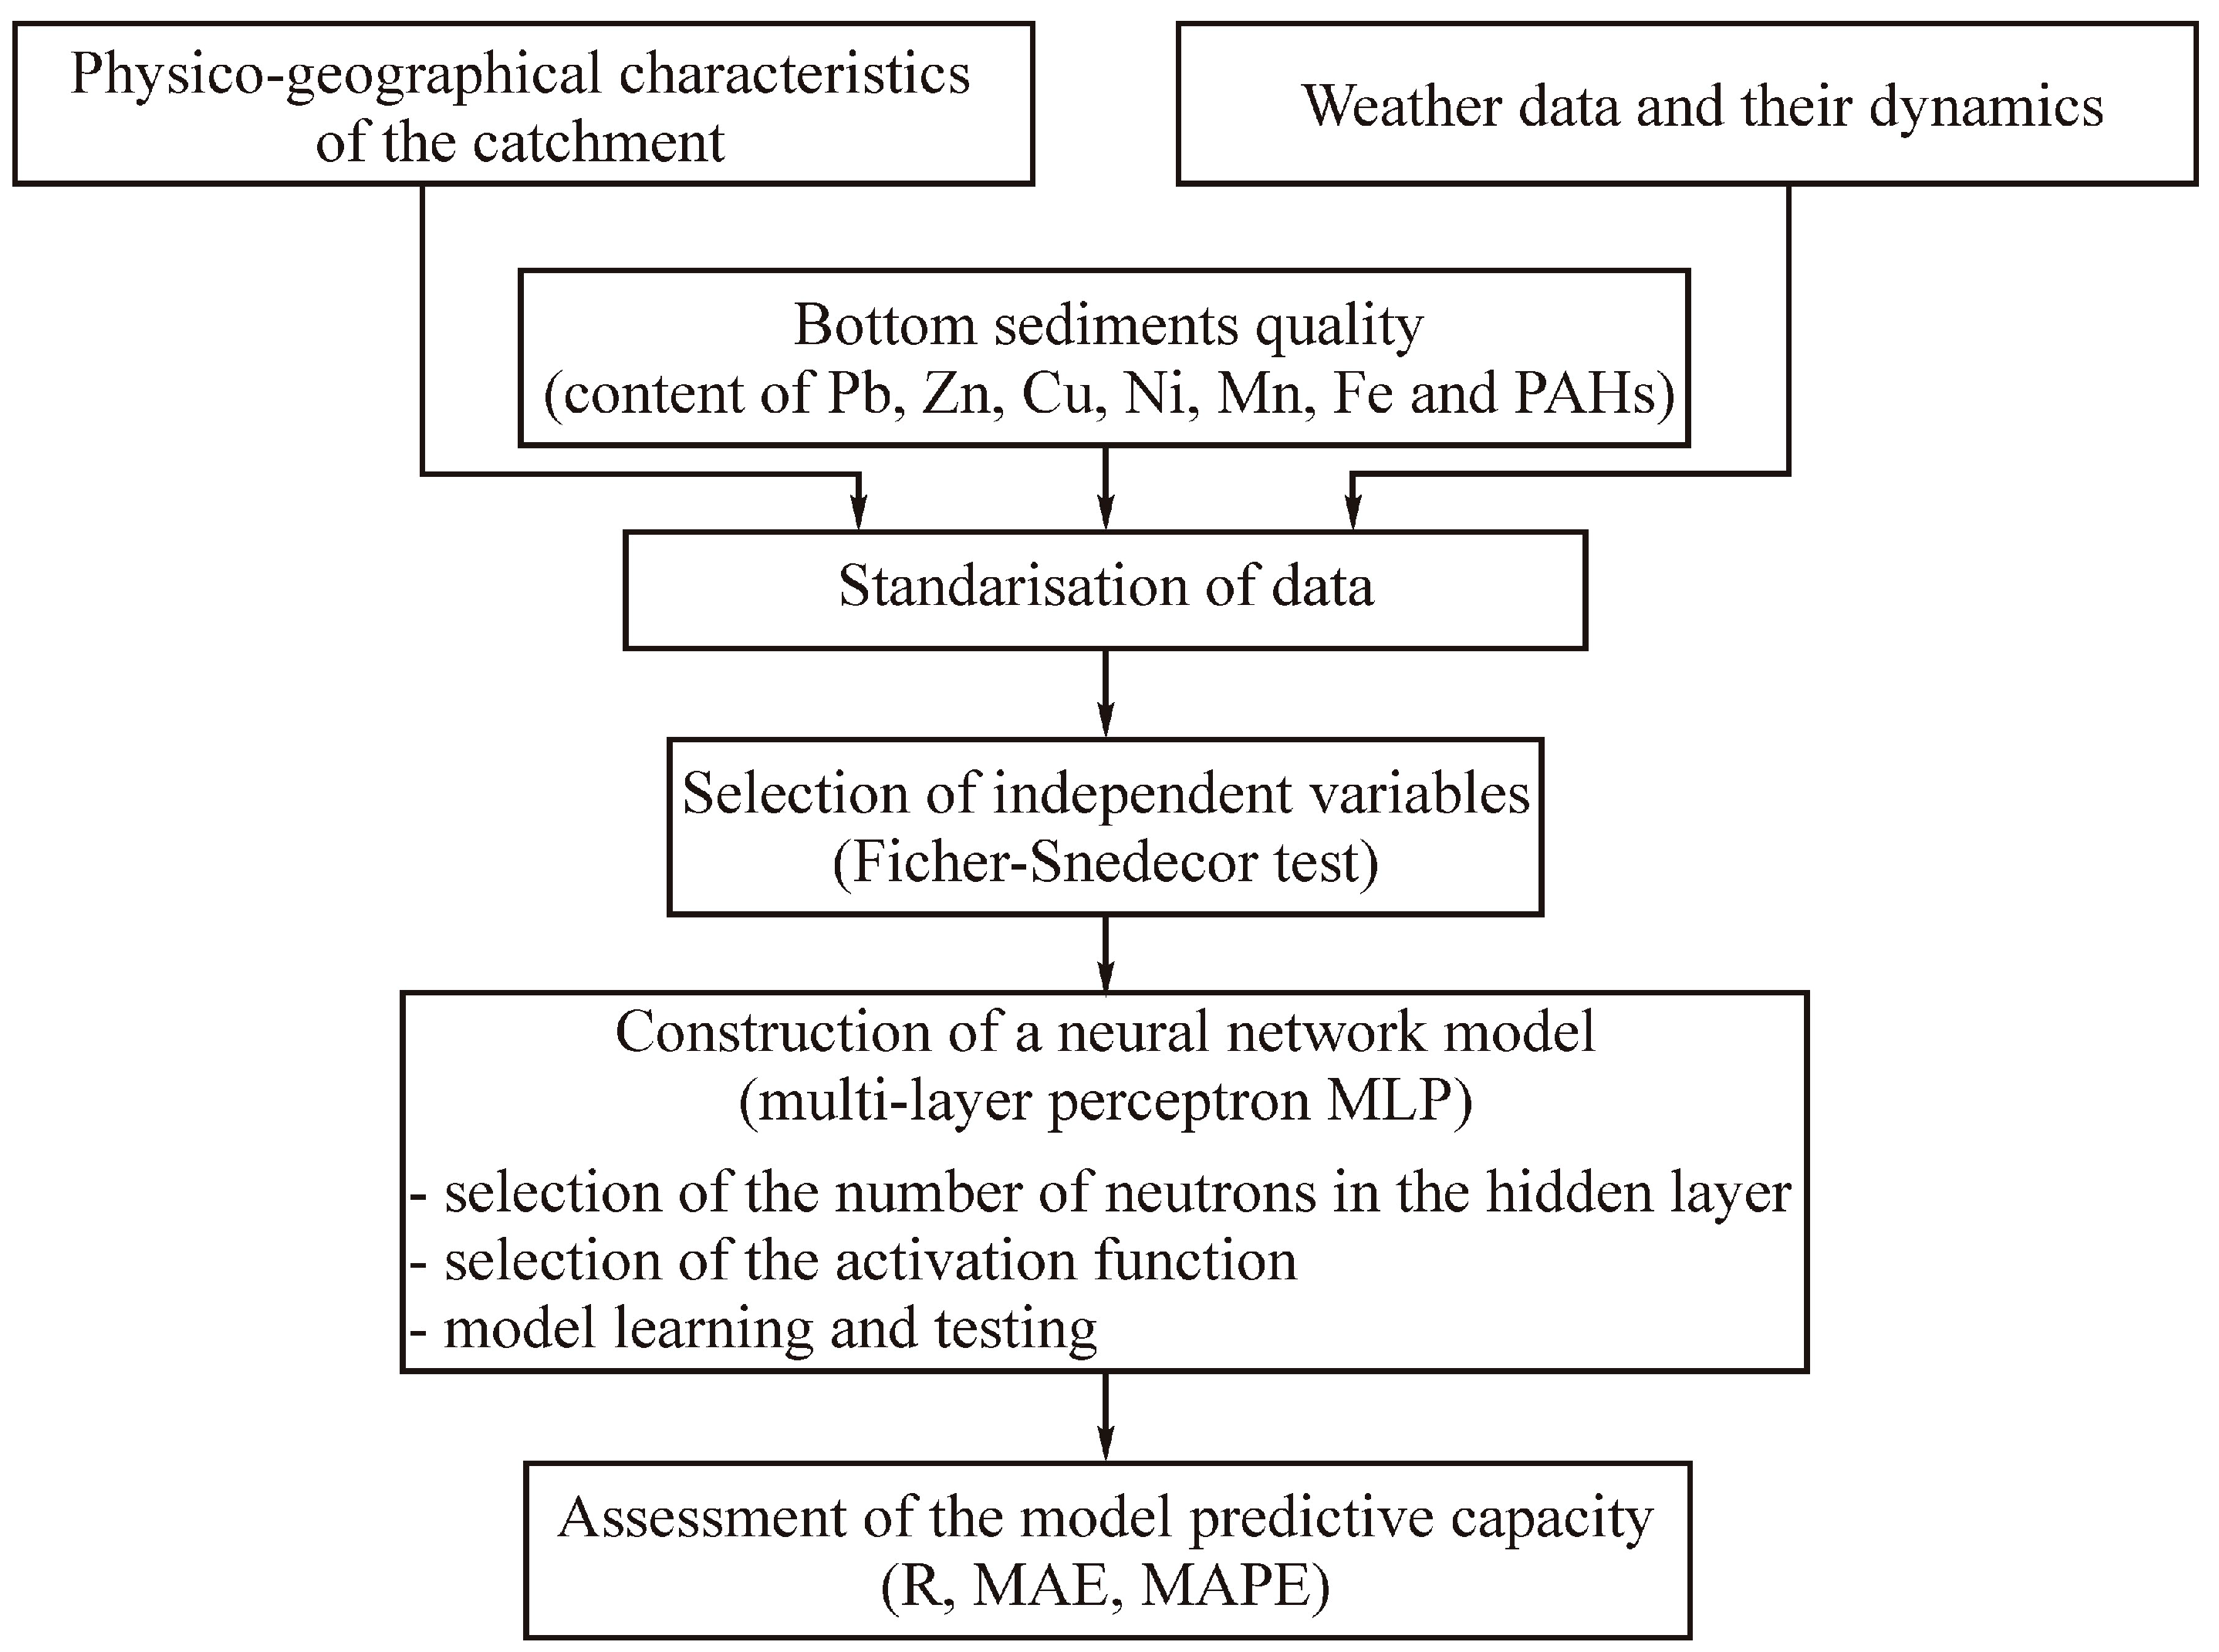
2.4. Construction of the Model for Sediment Quality Forecasts

2.4.1. Computational Procedure

Due to the degree of complexity involved, a number of variables characterizing the catchment and weather conditions were initially adopted for the problem description. Before commencing further analyses, those data were normalized and standardized [20]. Then, from the set of potential independent variables (Equation (1)), those whose influence on the simulation results was negligible were eliminated. In the next stage, artificial neural network (ANN) models (i.e., multilayer perceptron (MLP) networks) were built. The calculation diagram of the adopted test procedure is illustrated in Figure 2.

2.4.2. Independent Variables and Their Selection

A small number of studies have dealt with prediction of sediment quality in stormwater drainage systems [21]. That mainly results from the complex processes involved in the formation and transport of sediments and pollutants within the catchment. In a vast majority of papers, the factors that influence the quality of sediments are defined in general terms [22,23,24,25,26,27]. The studies state that the quality of sediments depends on atmospheric conditions, catchment characteristics, or stormwater runoff dynamics. The findings are generally not supported by appropriate statistical analyses aimed at a deeper understanding of the causes of sediment quality variability or quantitative descriptions of the studied processes. In view of the above, a general form of a model proposed for forecasting the quality of sediments is as follows (the general formula was modified for individual pollutants):
C = f ( A , Z i , Δ H , L p i p , P , F ( T p , T s n , T f o ) t )
where A is the catchment area; Zi is the manner of the catchment management; ΔH is the catchment height difference; Lpip is the length of the drainage system; P is the amount of rainfall in the period preceding the events under consideration; and F(Tp,Tsn,Tfo)t is a function that takes into account the number of days with rainfall, snowfall, and fog in the period preceding (t), the event of concern (in the analyses, this value was variable and most events resulted from the last event preceding those covered by the calculations).
The Fischer–Snedecor test was used to eliminate independent variables that were irrelevant from the point of view of forecasting the concentration of selected pollutants in stormwater sediments. Two hypotheses are formulated in the Fischer–Snedecor test: (i) zero hypothesis (H0), stating that the structural parameters are not significantly different from zero (α1 = α2 = …αk = 0), and (ii) alternative hypothesis (HA), stating that there is at least one parameter significantly different from zero (α1 ≠ 0, α2 ≠ 0,…,αk ≠ 0). The test statistic F is then determined in the form:
F = R 2 k 1 R 2 n ( k + 1 )
where R is the correlation coefficient, n is the number of measurements, and k is the number of adopted independent variables
For the assumed significance level α, a critical value of F(α,k,n − (k+1)) is determined. If FF′, there are no grounds for rejecting H0, whereas if F > F′, hypothesis H0 should be rejected in favor of HA. For the adopted independent variables (describing the catchment characteristics and atmospheric conditions) at the significance level α = 0.05, the values of the test probability p and test statistics F were determined. When the given value of p for the considered variable (xi) was less than α = 0.05, this variable was taken into account in further analyses.

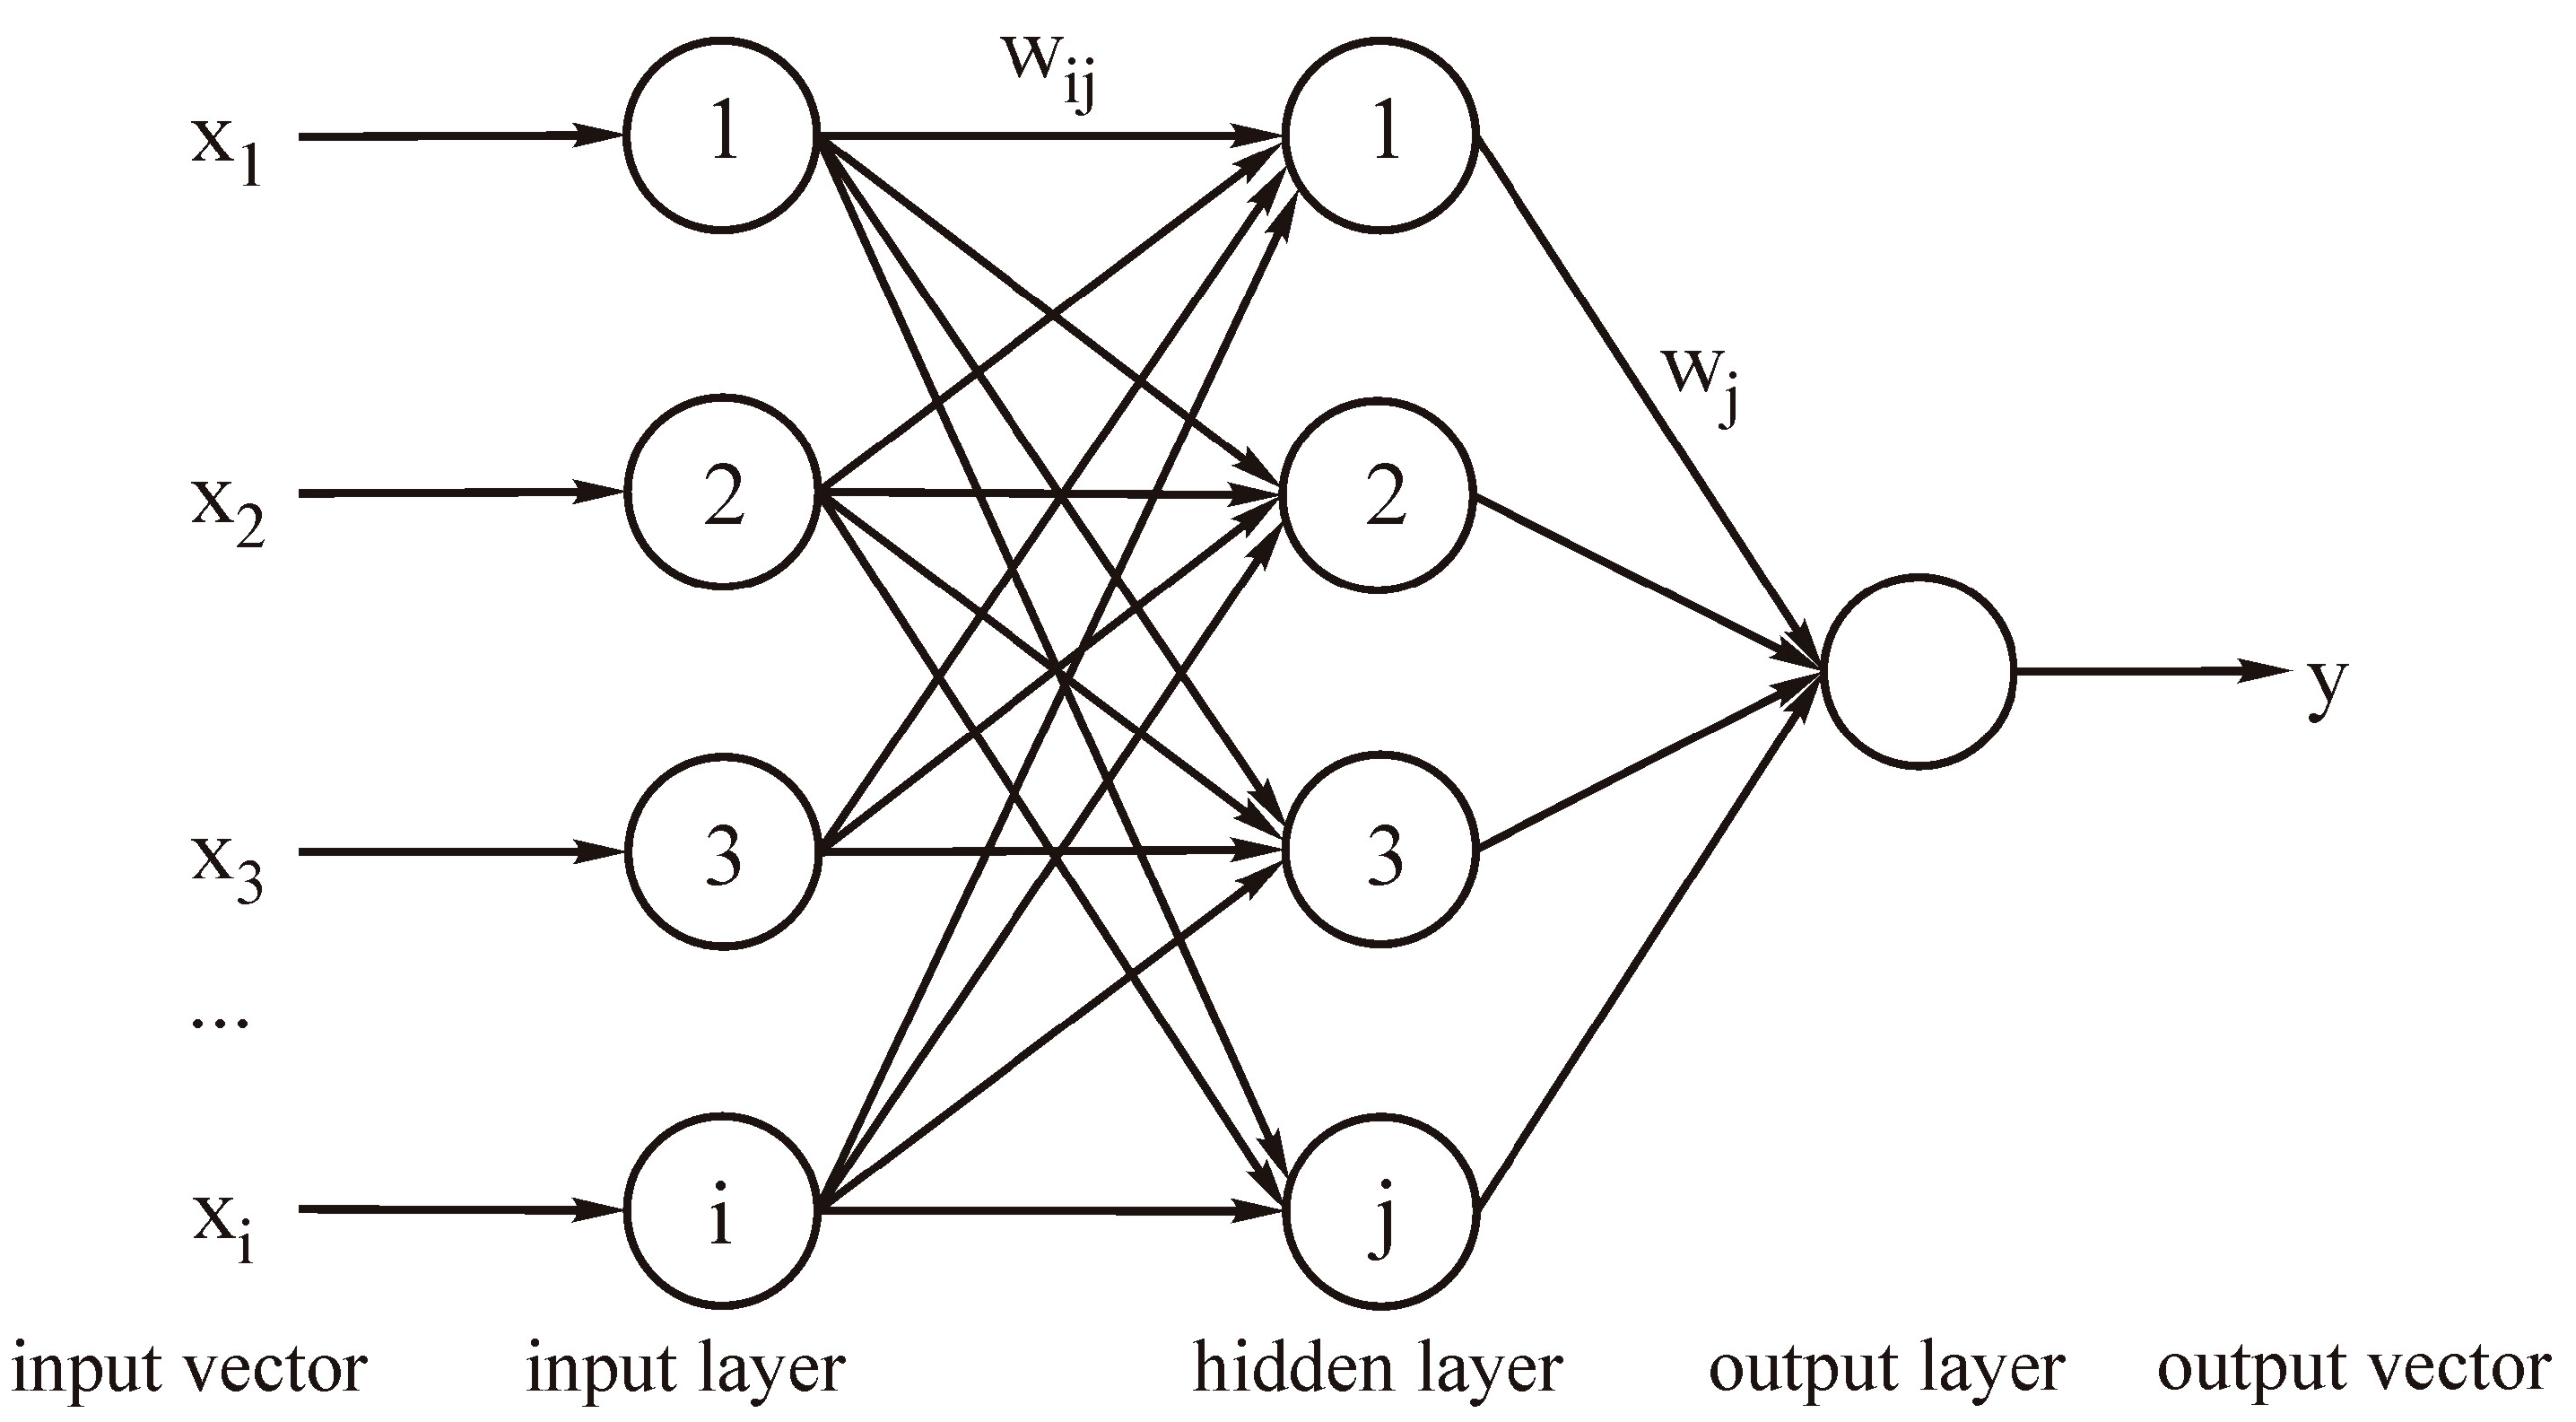
2.4.3. ANN–Multilayer Perceptron (MLP) Network

ANNs have a very wide range of application, as they can be used to model different phenomena [28]. Many different ANN structures have been developed. One of the most commonly used is the feed-forward MLP neural network. Networks of this type have been frequently employed to forecast stormwater quantity and quality [29] and also to size and control the operation of facilities located in drainage systems [30,31]. In the MLP network model, the input signals (xi) supplied to the input layer are multiplied by the weights (wij) and transferred to the neurons of the subsequent (hidden) layer, in which they are summed up (Figure 3).
The resulting sums are transformed by means of a linear or nonlinear activation function f and then transferred to the neurons (or neuron) of the output layer. The estimation of weights (wij) in the ANN model, which takes place at the training stage using appropriate numerical algorithms [20], is necessary to determine the minimum of the following function:
E = 1 2 n × i = 1 n ( y n y n ) 2
The values of the outputs (y) will be calculated from the formula:
y = j = 1 j w j f × ( i = 1 i w i j × x i + b j )
where I is the number of model inputs, J is the number of neurons in the hidden layer, wij represents the values of weights between inputs and neurons of the hidden layer, bj represents the loads on neurons of the hidden layer, wj represents the values of weights between neurons of the hidden layer and the neurons of the output layer, and f is the activation function.
The optimal structure of the MLP neural network for the number of neurons ranging from i to 2 × i + 1 [32] was sought for determined independent variables (xi) explaining the concentration of selected pollutants in stormwater sediments. For computations in the hidden and output layers, the following activation functions were considered: (i) linear, (ii) exponential, (iii) hyperbolic tangent, and (iv) sine. Due to the significant influence of the initial values of weights in ANN models on the simulation results and model optimization problems, each neural network model (having a fixed number of neurons and activation functions) was generated many times (5000 times) for different boundary conditions. To determine the values of weights (wij), the Broyden–Fletcher–Goldfarb–Shanno algorithm was applied at the stage of model training [20]. MATLAB software was used to build the neural network models. In the computations, the datasets covering 70 precipitation events were partitioned into three sets, namely, training (60%), testing (20%), and validating (20%).

2.4.4. Assessment of the Model Fit to Experimental Data

The model fit was assessed using the following measures [33]:
correlation coefficient (R)
R = i = 1 n ( q n q a v n ) × ( q f q a v f ) i = 1 n ( q n q a v n ) 2 × i = 1 n ( q f q a v f ) 2
mean relative error (MAPE)
M A P E = 1 n × i = 1 n | q n q f | q n × 100 %
mean absolute error (MAE)
M A E = 1 n × i = 1 n | q n q f | × 100 %
where N is the total number of analyzed data, qn is the measured value, qf is the value forecast for the n-th measurement qn, qavn is the average of the measured values, and qavf is the average of the forecast values.

3. Results and Discussions

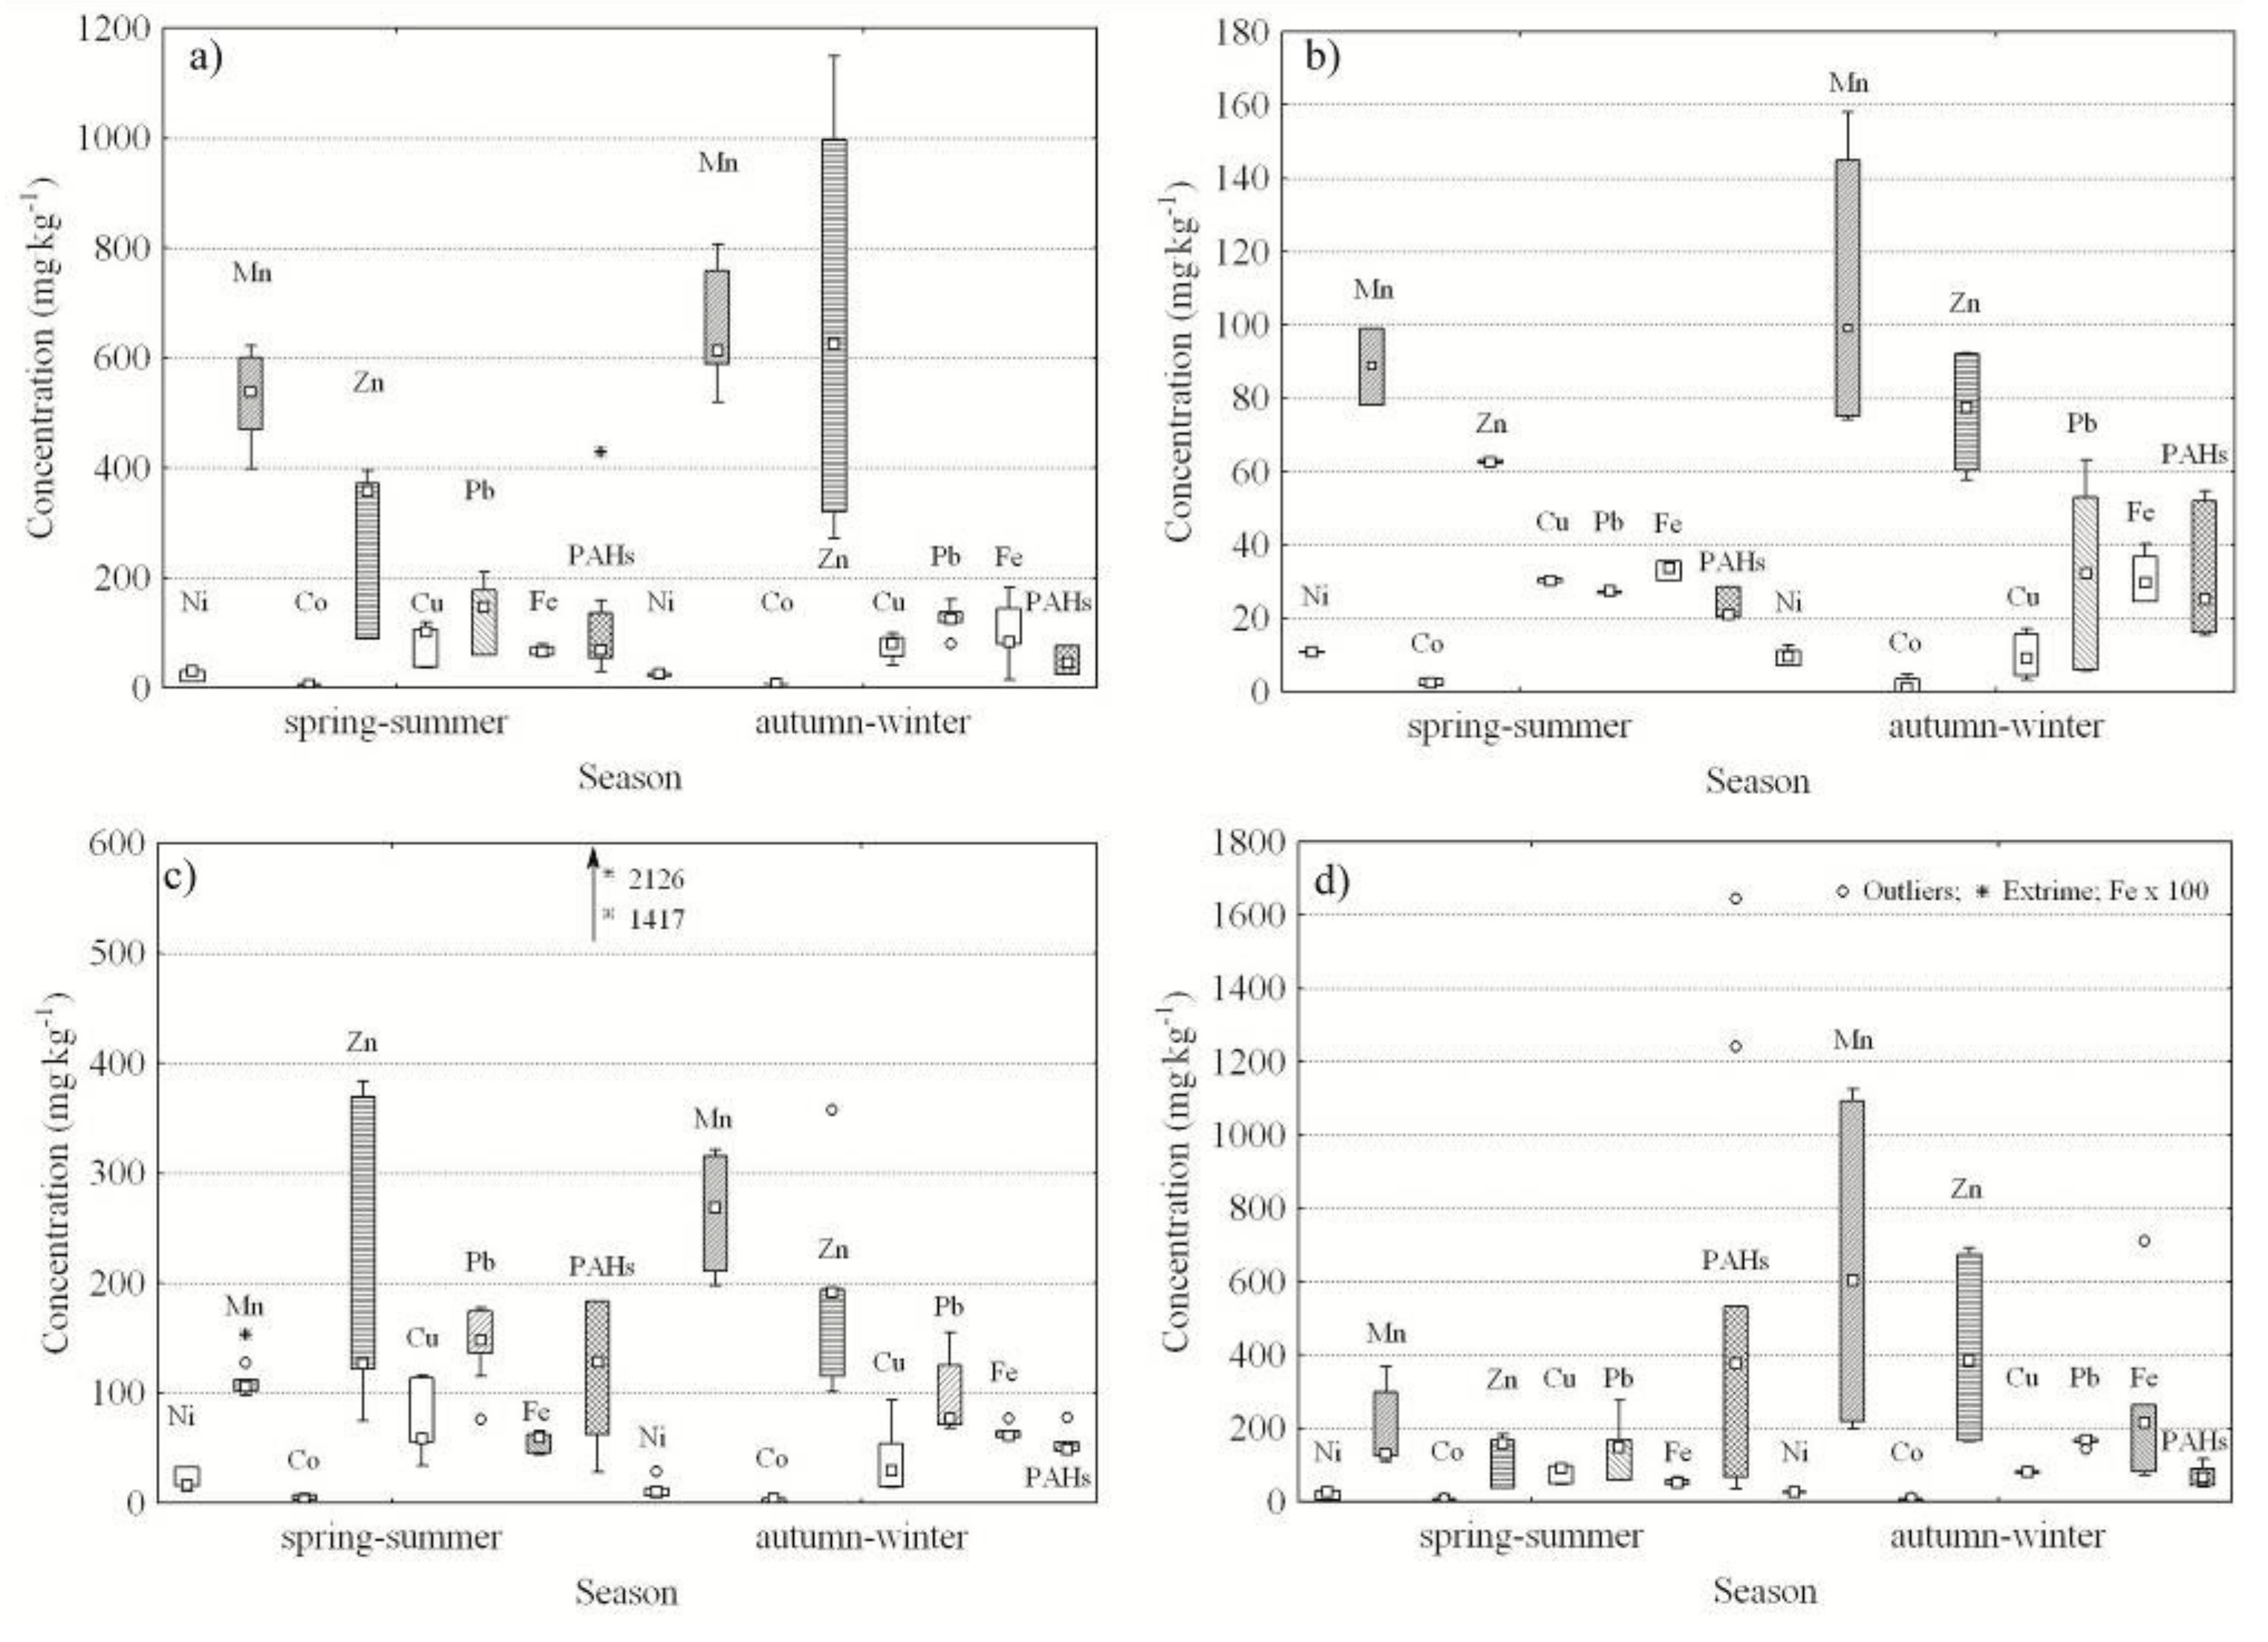
3.1. Contamination of Stormwater Sediments

The presence of elements such as iron, manganese, zinc, lead, cobalt, copper, and nickel was found in the tested samples. High variability of heavy metal contents in stormwater sediments from catchments that differ in land use indicates the complex nature and dynamics of pollutants washing-off and also the diverse sources of pollution [34,35]. Iron had the largest share in the total content of heavy metals. Its highest concentrations were observed in samples collected from the Jarząbek SWTP catchment (4563–71023 mg kg−1) and the lowest in samples from the Kaczmarka SWTP catchment (2455–4036 mg kg−1) (Figure 4). The element with second largest content was manganese, the highest concentrations of which were observed in sediments from the Jarząbek SWTP (1093 mg kg−1). A slightly lower content of manganese was found in sediments from the Witosa SWTP (806 mg kg−1). In the remaining two catchments, the content of this element did not exceed 321 mg kg−1. High concentrations of iron and manganese in the catchments of concern can be attributed to the combustion of fossil fuels in stoves of individual households and tenement houses located in the city center [36].
Sediments also showed a high content of zinc. For the Witosa SWTP, the level of this metal reached the value of 1148 mg kg−1 (Figure 4). Slightly lower concentrations of zinc were found in the sediments from the Jarząbek SWTP, namely, 693 mg kg−1. In the samples from two other catchments, the maximum zinc content ranged from 92 to 383 mg kg−1. Zinc occurs naturally in Poland’s soils, and the amounts vary from 30 to 125 mg kg−1 [37]. Elevated zinc values in sediments show the adverse impact of anthropogenic activity. Therefore, it can be concluded that the results directly reflect the influence produced by land use in a given catchment. Lead concentration ranged from 6 to 275 mg kg−1, with the highest content found in samples from the Jarząbek SWTP and the lowest in those from the Kaczmarka SWTP. Cobalt, the content of which did not exceed 13 mg kg−1, was the least abundant metal in the sediments. Elevated copper content was observed in the sediments from the Witosa SWTP (37.6–119.0 mg kg−1), the Jesionowa SWTP (14.1–116.3 mg kg−1), and the Jarząbek SWTP (48.5–99.3 mg kg−1) catchments. In the sediments from the Kaczmarka SWTP, the concentrations of this element were much lower and did not exceed 31 mg kg−1.
Nickel content did not exceed 13 mg kg−1 for sediments collected from the Kaczmarka SWTP, and 30 mg kg−1 for the remaining SWTPs. The results reported in this study show differences in the chemical composition of stormwater sediments. Additionally, they indicate the importance of the effect produced by impermeable surface type and catchment geomorphology on sediment properties. Lack of green spaces and great vertical height difference in the catchment contribute to faster penetration of trace elements into river ecosystems.
In spite of major differences in concentrations of individual elements in sediments from the stormwater drainage systems and dissimilarities in the characteristics of the catchments of concern, metals were arranged in a similar, serial order. The content of heavy metals for sediments from the Jarząbek and Kaczmarka SWTP catchments formed the following series: Fe > Mn > Zn > Pb > Cu > Ni > Co. Regarding sediments from the two other catchments (Witosa and Jesionowa SWTPs), this series differed only in the location of manganese and zinc: Fe > Zn > Mn > Pb > Cu > Ni > Co. Sharley et al. [38] obtained a similar distribution of pollutant concentrations in stormwater sediments. Based on the testing results of sediments from more than 100 reservoirs located in a stormwater drainage system, the researchers ranked the metal content in the following way: Fe (6360–46100 mg kg−1) > Zn (12–4940 mg kg−1) > Mn (25–1850 mg kg−1) > Cu (6–1090 mg kg−1) > Pb (9–456 mg kg−1) > Ni (4–159 mg kg−1) > Co (2–31 mg kg−1).
The highest concentrations of PAH compounds were observed for sediments collected during spring melts from the catchments of the Jesionowa and the Jarząbek SWTPs. The values amounted to 28.5–2126.3 and 35.7–1643.6 mg·kg−1, respectively (Figure 4). The catchments are located in the immediate neighborhood of the point source of pollution (i.e., coal-fired power and heating plant). In the sediments from the remaining catchments, the PAH concentration values were much lower. In the sediments from the Kaczmarka SWTP, the maximum value was 54.8 mg kg−1, and in the case of the Witosa SWTP, it was 429.0 mg kg−1.

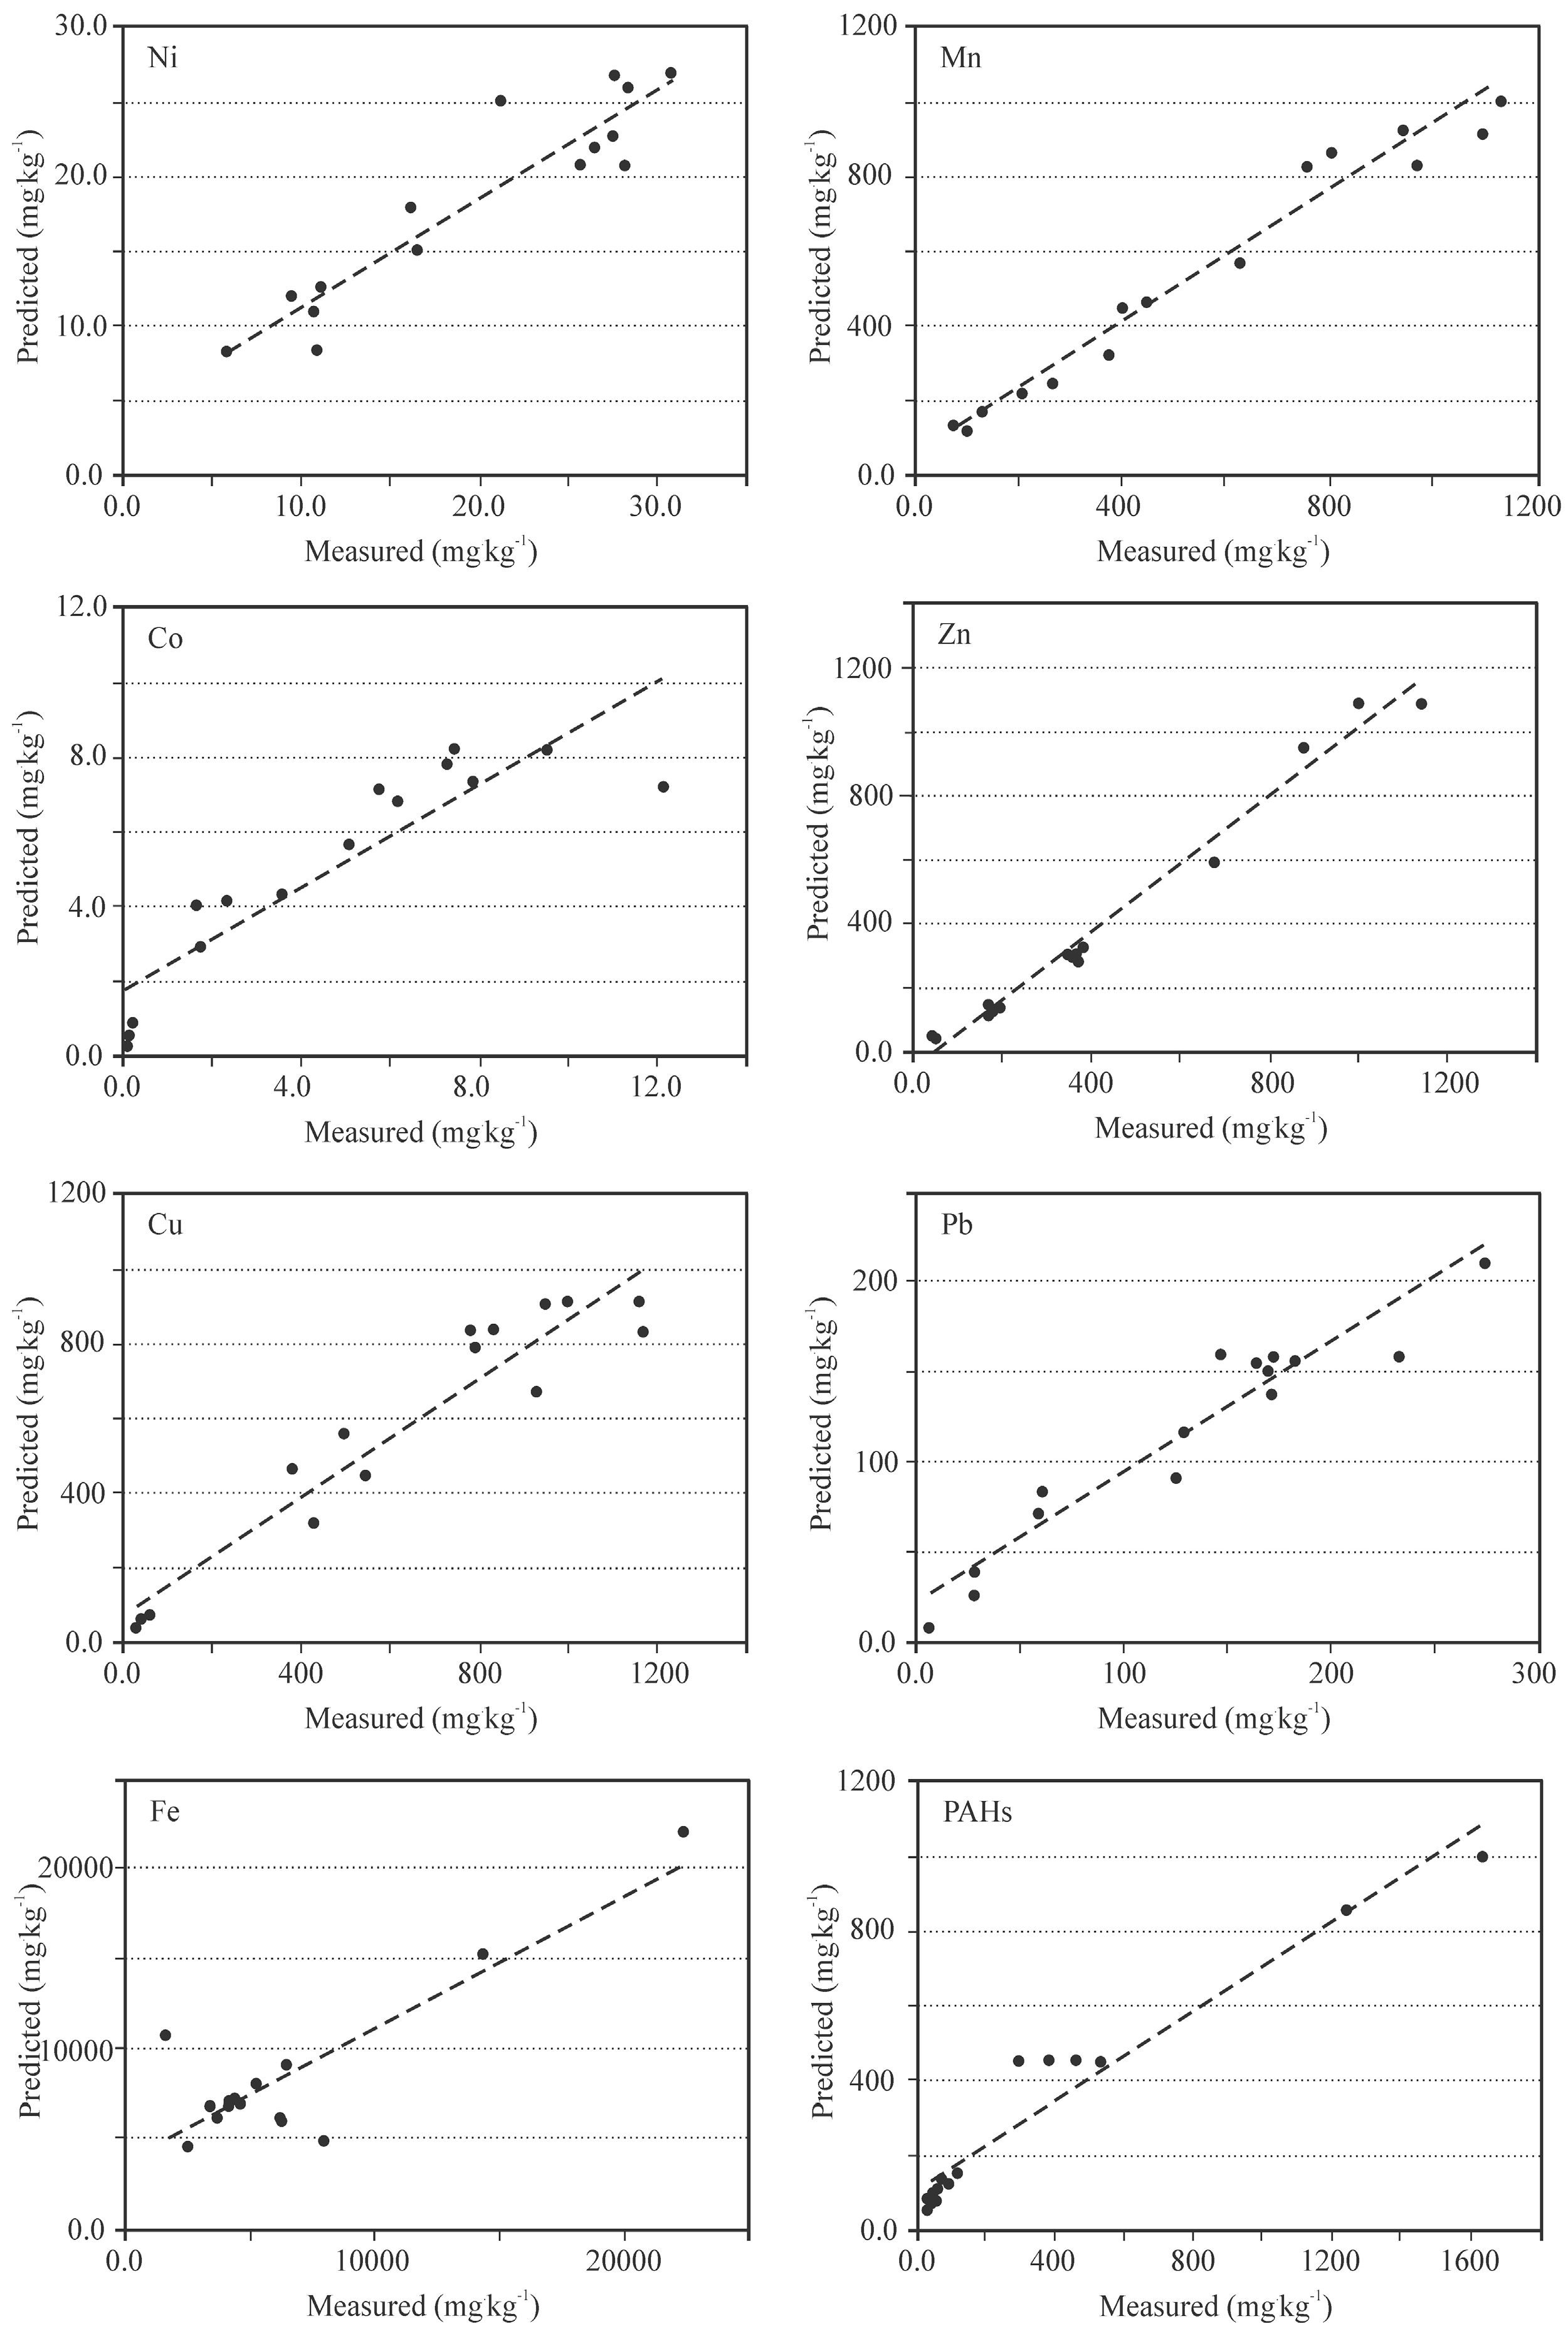
3.2. Predicted Concentration of Selected Pollutants in Stormwater Sediments

The results of the F-test confirm that the content of the selected heavy metals in the sediments was determined by the catchment characteristics and weather conditions. However, a decisive influence of weather conditions was seen only for PAH concentration (Table 2). That also derives from the fact that wet deposition was the main source of stormwater sediment contamination with PAH compounds in the catchments of concern. PAH compounds emitted into the atmosphere from the combustion of fossil fuels (coal and petroleum products) in industrial boilers and vehicular exhaust emissions are deposited on the surface mainly through precipitation [39,40].
Based on the analysis of the characteristics of independent variables describing the heavy metal content in stormwater sediments, it is possible to make indirect conclusions about the sources of pollution. The length of the drainage system is directly related to the length of transportation routes from which stormwater and sediments enter the system through street inlets. The significance of this variable for the assessment of sediment quality points to traffic as a source of pollution (transit routes carrying a large volume of traffic are located in the catchments). The share of industrial areas in the catchments, with heavy traffic of delivery vehicles, is also a contributing factor. Low-rise buildings, which are mainly single-family houses, use heating boilers that require solid fuels. That is another source of pollution (ashes and heavy metals) of the catchments. With intense precipitation, the pollutants are washed off, and together with particulate matter (on which adsorption occurs), they are discharged into the drainage system. There, pollutants form stormwater sediments. That translates into the importance of weather indicators.
Several artificial neural networks, namely, multilayer perceptron networks, were developed based on the designated independent variables (Table 2) and adopted methodology of model creation (Figure 2). The determined parameters (number of neurons, activation functions in the hidden and output layers) describing the structure of the MLP models are listed in Table 3. The values of measures (R, MAE, MAPE) of the models fit to experimental data are also shown in the same table. On the basis of the data in Table 3, it can be stated that the number of neurons in the hidden layer ranges from 8 to 14 for individual neural networks. Additionally, analyses indicate that the number of neurons for individual MLP models was not higher than recommended [32]. The results show that the models were not overtrained and can be used in practical applications, such as land use planning and management, especially in urban areas. Only in the case of Co did the obtained models show unsatisfactory predictive capabilities (Table 3). In the Kaczmarka SWTP catchment, when the cobalt concentration in sediments was close to 0 mg kg−1, the computations produced values of 0.2 mg kg−1, which significantly affected the MAPE measure. In the remaining catchments (Witosa, Jesionowa, and Jarząbek SWTPs), the difference between forecast and measured values did not exceed 15%. Average relative errors of the forecast of the examined heavy metals (test set) did not exceed 21% (Ni, Mn, Zn, Cu, and Pb) and 48% for Fe. In the case of PAHs, however, the value of MAPE oscillated within the range of 100%.
Taking into account the obtained range of variability of individual pollutants in sediments in the catchments of concern and the results of computations shown in Figure 5, it can be concluded that the results of modeling are satisfactory for most of the considered pollution indicators. Admittedly, the determined models do not ensure very high congruence between estimates and measurements (e.g., at the level of 90%). Nevertheless, the networks provide a valuable tool to estimate the quality of sediments. Such a task has not been tackled by other researchers yet. The importance of ANN applications lies in the fact that they offer the possibility of optimizing the urbanization of catchments. Additionally, it is possible to account for aspects that have been disregarded so far but which have a significant impact on the conditions of receiving waters.

4. Conclusions

The analyses performed for the study confirm that it is possible to forecast the content of selected pollutants (Ni, Mn, Co, Zn, Cu, Pb, Fe, and PAHs) in stormwater sediments on the basis of atmospheric data and catchment physico-geographic characteristics with the use of multilayer perceptron neural networks. The analyses also allowed the identification of independent variables that affect, to the greatest extent, the explanation of the variability of the analyzed pollution indices. The variables included the catchment characteristics, namely, area, land use, height difference, length of stormwater drainage system, and also atmospheric characteristics, namely, precipitation depth; air temperature; and a number of snowy, rainy, and foggy days. It was shown that the content of heavy metals (Ni, Mn, Co, Zn, Cu, Pb, and Fe) in sediments is determined by the physical properties of the catchment, the length of the drainage system, and atmospheric conditions. Conversely, PAH content depends mainly on weather conditions. The approach proposed in this study involved the development of forecasting models. They can be widely used as a tool supporting spatial planning and development. The model makes it possible to predict the effects of potential changes to catchment land use on the quality of stormwater sediments and, thus, sediment impact on the aquatic environment of flowing receiving waters.
It is advisable to carry out further research and analyses aimed at developing an integrated tool to simulate the quality of sediments and stormwater within closed drainage systems. This will allow the study of complex relationships and water–sediment interactions.

Author Contributions

Conceptualization, Ł.B. and B.S.; Methodology, Ł.B., B.S. and A.S.; Software, B.S.; Writing-Original Draft, Ł.B., B.S., A.S. and J.S.

Funding

The work was founded by the Polish Ministry of Science and Higher Education, the RID project, according to the agreement: 025/RID/2018/19 of 28/12/2018 with total budget of 12 000 000 PLN.

Conflicts of Interest

The authors declare no conflict of interests.

References

  1. Arora, A.S.; Reddy, A.S. Development of multiple linear regression models for predicting the stormwater quality of urban sub-watersheds. Bull. Environ. Contam. Toxicol. 2014, 92, 36–43. [Google Scholar] [CrossRef] [PubMed]
  2. Ivanovsky, A.; Belles, A.; Criquet, J.; Dumoulin, D.; Noble, P.; Alary, C.; Billon, G. Assessment of the treatment efficiency of an urban stormwater pond and its impact on the natural downstream watercourse. J. Environ. Manag. 2018, 226, 120–130. [Google Scholar] [CrossRef] [PubMed]
  3. Ma, Y.; Hao, S.; Zhao, H.; Fang, J.; Zhao, J.; Li, X. Pollutant transport analysis and source apportionment of the en tire non-point source pollution process in separate sewer systems. Chemosphere 2018, 211, 557–565. [Google Scholar] [CrossRef]
  4. Goonetilleke, A.; Thomas, E.; Ginn, S.; Gilbert, D. Understanding the role of land use in urban stormwater quality management. J. Environ. Manag. 2005, 74, 31–42. [Google Scholar] [CrossRef] [PubMed] [Green Version]
  5. Leutnant, D.; Muschalla, D.; Uhl, M. Distribution-Based Calibration of a Stormwater Quality Model. Water 2018, 10, 1027. [Google Scholar] [CrossRef]
  6. Wei, T.; Wijesiri, B.; Jia, Z.; Li, Y.; Goonetilleke, A. Re-thinking classical mechanistic model for pollutant build-up on urban impervious surfaces. Sci. Total Environ. 2019, 651, 114–121. [Google Scholar] [CrossRef]
  7. Nawrot, N.; Wojciechowska, E. Osady powstające w systemie kanalizacji deszczowej zlewni zurbanizowanej—Przegląd literatury (Evaluation of the quality of sediments from the stormwater drainage system in urban area—literature review). In Inżynieria Środowiska—Młodym Okiem; Skoczko, I., Piekutin, J., Woroniecka, N., Mielniczuk, P., Eds.; Oficyna Wydawnicza Politechniki Białostockiej: Białystok, Poland, 2017; pp. 34–53. [Google Scholar]
  8. Wang, J.; Zhao, Y.; Zhang, P.; Yang, L.; Xu, H.; Xi, G. Adsorption characteristics of a novel ceramsite for heavy metal removal from stormwater runoff. Chin. J. Chem. Eng. 2018, 6, 96–103. [Google Scholar] [CrossRef]
  9. Sałata, A.; Bąk, Ł.; Dąbek, L.; Ozimina, E. Assessment of the degree of pollution of sediments from the rainstorm sewer system in the urbanized catchment. Desalin. Water Treat. 2016, 50, 1478–1489. [Google Scholar] [CrossRef]
  10. Zgheib, S.; Moilleron, R.; Chebbo, G. Priority pollutants in urban stormwater: Part 1—Case of separate storm sewers. Water Res. 2012, 46, 6683–6692. [Google Scholar] [CrossRef]
  11. Revitt, D.M.; Lundy, L.; Coulon, F.; Fairley, M. The sources, impact and management of car park runoff pollution: A review. J. Environ. Manag. 2014, 146, 552–567. [Google Scholar] [CrossRef] [Green Version]
  12. Sánchez, A.S.; Cohim, E.; Kalid, R.A. A review on physicochemical and microbiological contamination of roof-harvested stormwater in urban areas. Sustain. Water Qual. Ecol. 2015, 6, 119–137. [Google Scholar] [CrossRef]
  13. Książek, S.; Kida, M.; Koszelnik, P. The occurrence and sources of polycyclic aromatic hydrocarbons in bottom sediments of the Wisłok river. Pol. J. Nat. Sci. 2016, 31, 373–386. [Google Scholar]
  14. Aryal, R.; Vigneswaran, S.; Kandasamy, J.; Naidu, R. Urban stormwater quality and treatment. Korean J. Chem. Eng. 2010, 27, 1343–1359. [Google Scholar] [CrossRef]
  15. Walaszek, M.; Bois, P.; Laurent, J.; Lenormand, E.; Wanko, A. Micropollutants removal and storage efficiencies in urban stormwater constructed wetland. Sci. Total Environ. 2018, 645, 854–864. [Google Scholar] [CrossRef]
  16. Valentyne, A.; Crawford, K.; Cook, T.; Mathewson, P.D. Polycyclic aromatic hydrocarbon contamination and source profiling in watersheds serving three small Wisconsin, USA cities. Sci. Total Environ. 2018, 627, 1453–1463. [Google Scholar] [CrossRef]
  17. PN-EN ISO 11885:2007. Water Quality—Determination of Selected Elements by Inductively Coupled Plasma Optical Emission Spectrometry; Polski Komitet Normalizacyjny: Warsaw, Poland, 2009; p. 42. [Google Scholar]
  18. PN-EN 15527:2008. Characterisation of Waste. Determination of Polycyclic Aromatic Hydrocarbons (PAH) in Waste Using Gas Chromatography Mass Spectrometry; Polski Komitet Normalizacyjny: Warsaw, Poland, 2008; p. 37. [Google Scholar]
  19. DWA-A 118, 2006. Hydraulic Dimensioning and Verification of Drain and Sewer Systems; German Association for Water, Wastewater and Waste: Hennef, Germany, 2006. [Google Scholar]
  20. Rutkowski, L. Artificial Intelligence Methods and Techniques; PWN: Warszawa, Poland, 2006; p. 452. [Google Scholar]
  21. Weinstein, J.E.; Crawford, K.D.; Garner, T.R. Chemical and Biological Contamination of Stormwater Detention Pond Sediments in Coastal South Carolina; South Carolina Sea Grant Consortium & South Carolina Department of Health and Environmental Control: Charleston, CA, USA, 2008; p. 83. [Google Scholar]
  22. Wallinder, I.O.; Leygraf, C.; Karlén, C.; Heijerick, D.; Janssen, C.R. Atmospheric corrosion of zinc-based materials: Runoff rates, chemical speciation and ecotoxicity effects. Corros. Sci. 2001, 43, 809–816. [Google Scholar] [CrossRef]
  23. Adachi, K.; Tainosho, Y. Characterization of heavy metal particles embedded in tire dust. Environ. Int. 2004, 30, 1009–1017. [Google Scholar] [CrossRef]
  24. Polkowska, Ż.; Namieśnik, J. Road and roof runoff waters as a source of pollution in a big urban agglomeration (Gdansk, Poland). Ecol. Chem. Eng. 2008, 15, 375–385. [Google Scholar]
  25. Wei, Q.; Zhu, G.; Wu, P.; Cui, L.; Zhang, K.; Zhou, J.; Zhang, W. Distributions of typical contaminant species in urban short-term storm runoff and their fates during rain events: A case of Xiamen City. J. Environ. Sci. (China) 2010, 2, 533–539. [Google Scholar] [CrossRef]
  26. Murphy, L.U.; Cochrane, T.A.; O’Sullivan, A. The Influence of Different Pavement Surfaces on Atmospheric Copper, Lead, Zinc, and Suspended Solids Attenuation and Wash-Off. Water Air Soil Pollut. 2015, 226. [Google Scholar] [CrossRef]
  27. Yuan, Q.; Guerra, H.B.; Kim, Y. An Investigation of the Relationships between Rainfall Conditions and Pollutant Wash-Off from the Paved Road. Water 2017, 9, 232. [Google Scholar] [CrossRef]
  28. Xia, M.; Craig, P.M.; Wallen, C.M.; Stoddard, A.; Mandrup-Poulsen, J.; Peng, M.; Schaeffer, B.; Liu, Z. Numerical simulation of salinity and dissolved oxygen at Perdido Bay and adjacent coastal ocean. J. Coast. Res. 2011, 27, 73–86. [Google Scholar] [CrossRef]
  29. May, D.B.; Sivakumar, M. Prediction of urban stormwater quality using artificial neural networks. Environ. Modell. Softw. 2009, 24, 296–302. [Google Scholar] [CrossRef]
  30. Mounce, S.R.; Shepherd, W.; Sailor, G.; Shucksmith, J.; Saul, A.J. Predicting combined sewer overflows chamber depth using artificial neural networks with rainfall radar data. Water Sci. Technol. 2014, 69, 1326–1333. [Google Scholar] [CrossRef] [PubMed] [Green Version]
  31. Pochwat, K. The use of artificial neural networks for analyzing the sensitivity of a retention tank. E3S Web Conf. 2018. [Google Scholar] [CrossRef]
  32. Hecht-Nielsen, R. Kolmogorov’s mapping neural network existence theorem. In Proceedings of the 1st IEEE International Joint Conference of Neural Networks, New York, NY, USA, 24–27 June 1987; Volume 3, pp. 11–13. [Google Scholar]
  33. Fach, S.; Sitzenfrei, R.; Rauch, W. Assessing the relationship between water level and combined sewer overflow with computational fluid dynamics. In Proceedings of the 11th International Conference on Urban Drainage, Edinburgh, Scotland, UK, 31 August–5 September 2008. [Google Scholar]
  34. Brown, J.N.; Peake, B.M. Sources of heavy metals and polycyclic aromatic hydrocarbons in urban stormwater runoff. Sci. Total Environ. 2006, 359, 145–155. [Google Scholar] [CrossRef]
  35. Ignatavičius, G.; Valskys, V.; Bulskaya, I.; Paliulis, D.; Zigmontienė, A.; Satkūnas, J. Heavy metal contamination in surface runoff sediments of the urban area of Vilnius. Est. J. Earth Sci. 2017, 66, 13–20. [Google Scholar] [CrossRef]
  36. Czaplicka, A.; Ślusarczyk, Z.; Szarek-Gwiazda, E.; Bazan, S. Rozkład przestrzenny związków żelaza i manganu w osadach dennych Jeziora Goczałkowickiego (Spatial distribution of iron and manganese compounds in bottom sediments of the Goczalkowice Dam Reservoir). Ochrona Srodowiska 2017, 39, 47–54. [Google Scholar]
  37. Kabata-Pendias, A.; Pendias, H. Pierwiastki Śladowe w Środowisku Biologicznym (Trace Elements in the Biological Environment); Wydawnictwo Geologiczne: Warszawa, Poland, 1993; p. 299.
  38. Sharley, D.J.; Sharp, S.M.; Marshall, S.; Jeppe, K.; Pettigrove, V.J. Linking urban land use to pollutants in constructed wetlands: Implications for stormwater and urban planning. Landsc. Urban Plan. 2017, 162, 80–91. [Google Scholar] [CrossRef]
  39. Kubiak, M.S. Wielopierścieniowe węglowodory aromatyczne (WWA)—Ich występowanie w środowisku i w żywności (Polycyclic Aromatic Hydrocarbons (PAHs)—Their occurrence in the environment and food). Probl. Hig. Epidemiol. 2013, 94, 31–36. [Google Scholar]
  40. Rusin, M.; Marchwińska-Wyrwał, E. Zagrożenia zdrowotne związane ze środowiskowym narażeniem na wielopierścieniowe węglowodory aromatyczne (WWA) (Health hazards involved with an environmental exposure to polycyclic aromatic hydrocarbons (PAHs)). Environ. Med. 2014, 17, 7–13. [Google Scholar]
Figure 1. Study area: (a) location in the city of Kielce, Poland, (b) Witosa stormwater treatment plant (SWTP) catchment, (c) Kaczmarka SWTP catchment, (d) Jesionowa SWTP catchment, and (e) Jarząbek SWTP catchment.
Water 11 00626 g001
Figure 2. Algorithm for the development of the multilayer perceptron (MLP) model predicting the content of selected pollutants in stormwater sediments.
Water 11 00626 g002
Figure 3. Exemplary MLP neural network structure.
Water 11 00626 g003
Figure 4. Maximum, minimum, and median values of heavy metal and polycyclic aromatic hydrocarbon (PAH) concentrations in stormwater sediments: (a) Witosa SWTP, (b) Kaczmarka SWTPP, (c), Jesionowa SWTP, and (d) Jarząbek SWTP.
Water 11 00626 g004
Figure 5. Predicted vs observed heavy metal and PAH concentrations in stormwater sediments.
Water 11 00626 g005
Table 1. Catchment characteristics.
CatchmentACatchment Land UseΣLpipΔH
Low-Rise BuildingsHigh-Rise BuildingsIndustrial AreasGreen SpacesOthers
ha% kmm
Witosa8244.50--55.50-7.6547.3
Jesionowa35514.103.5071.304.107.0016.0050.0
Kaczmarka22424.2036.6026.208.104.9015.5081.0
Jarząbek80519.4012.2022.3038.707.4038.0094.0
Table 2. F- and p-values for the Fischer–Snedecor test.
NiMnCoZn
VariableFpVariableFpVariableFpVariableFp
Top9.030.0004dH20.050.0000dH27.680.0000P46.880.0000
dH7.840.0010P18.200.0000Lpip20.030.0000season9.500.0033
Zn7.480.0014Lpip13.500.0000Zp20.030.0000dH7.530.0013
Lpip7.170.0004Zp13.500.0000Tgreen20.030.0000Top6.720.0026
Zp7.170.0004Tgreen13.500.0000Zn17.940.0000Lpip5.700.0019
Tgreen7.170.0004season9.540.0032Zw12.070.0001Zp5.700.0019
P5.900.0016dT4.490.0389P3.270.0287Tgreen5.700.0019
Tfo5.680.0059Zn4.090.0227Top3.320.0442dT5.620.0214
Tsn5.680.0059Zw3.630.0336 Zn3.600.0344
CuPbFePAH
VariableFpVariableFpVariableFpVariableFp
Zn16.530.0000Zn20.750.0000season7.610.0080Tfo6.670.0026
Zp12.950.0000Zp13.580.0000dT4.640.0358Tsn6.670.0026
Lpip12.950.0000Lpip13.580.0000Zn4.030.0238P4.370.0083
Tgreen12.950.0000Tgreen13.580.0000dH3.980.0247Top3.730.0307
dH9.540.0003Top11.830.0000Zw3.420.0402
Top9.430.0003Tfo9.670.0002
P6.270.0010Tsn9.670.0002
Tfo5.710.0058P8.060.0001
Tsn5.710.0058dH6.360.0034
dT5.160.0273Zw5.960.0047
Table 3. Parameters describing the structure of the neural networks and models fit to experimental data.
Pollutants in Stormwater SedimentsNHidden LayerOutput LayerTrainingTesting
RMAEMAPERMAEMAPE
mg kg−1%mg kg−1%
Ni11exptanh0.8543.1519.650.8453.2817.88
Mn8tanhlog0.97452.1025.550.97945.7619.83
Co14tanhlog0.9130.731008.490.8710.89931.25
Zn13explog0.93046.4426.790.97540.2220.50
Cu14explog0.8948.4315.160.8819.8019.77
Pb14explog0.89720.9418.040.86822.1419.33
PAH14lintanh0.753135.33119.150.850100.31100.71
Fe8tanhlin0.4813424.8856.150.5813124.8847.15

