Article

Flood Susceptibility Mapping Using GIS-Based Analytic Network Process: A Case Study of Perlis, Malaysia

by
Umar Lawal Dano
1,
Abdul-Lateef Balogun
2,*,
Abdul-Nasir Matori
2,
Khmaruzzaman Wan Yusouf
2,
Ismaila Rimi Abubakar
3,
Mohamed Ahmed Said Mohamed
4,5,
Yusuf Adedoyin Aina
6 and
Biswajeet Pradhan
7,8
1
Department of Urban & Regional Panning, Imam Abdulrahman Bin Faisal University, P.O. Box 1982, Dammam 32141, Saudi Arabia
2
Geospatial Analysis and Modelling Research Group, Department of Civil & Environmental Engineering, Universiti Teknologi PETRONAS, Seri Iskandar 32610, Perak Darul Ridzuan, Malaysia
3
College of Architecture and Planning, Imam Abdulrahman Bin Faisal University (formerly, University of Dammam), P.O. Box 1982, Dammam 32141, Saudi Arabia
4
Architectural Department, College of Architecture, Sudan University of Science and Technology, Khartoum P.O. Box 11111, Sudan
5
Architectural Department, College of Engineering, Hail University, Hail P.O. Box 2440, Saudi Arabia
6
Department of Geomatics Engineering Technology, Yanbu Industrial College, Yanbu 41912, Saudi Arabia
7
Center for Advanced Modeling and Geospatial Information Systems (CAMGIS), Faculty of Engineering and IT, University of Technology Sydney, Sydney, NSW 2007, Australia
8
Department of Energy and Mineral Resources Engineering, Choongmu-gwan, Sejong University, 209 Neungdong-ro, Gwangjin-gu, Seoul 05006, Korea
*
Author to whom correspondence should be addressed.
Water 2019, 11(3), 615; https://doi.org/10.3390/w11030615
Submission received: 31 December 2018 / Revised: 6 March 2019 / Accepted: 11 March 2019 / Published: 25 March 2019
(This article belongs to the Special Issue Flood Modelling: Regional Flood Estimation and GIS Based Techniques)

Abstract

:
Understanding factors associated with flood incidence could facilitate flood disaster control and management. This paper assesses flood susceptibility of Perlis, Malaysia for reducing and managing their impacts on people and the environment. The study used an integrated approach that combines geographic information system (GIS), analytic network process (ANP), and remote sensing (RS) derived variables for flood susceptibility assessment and mapping. Based on experts’ opinion solicited via ANP survey questionnaire, the ANP mathematical model was used to calculate the relative weights of the various flood influencing factors. The ArcGIS spatial analyst tools were used in generating flood susceptible zones. The study found zones that are very highly susceptible to flood (VHSF) and those highly susceptible to flood (HSF) covering 38.4% (30,924.6 ha) and 19.0% (15,341.1 ha) of the study area, respectively. The results were subjected to one-at-a-time (OAT) sensitivity analysis to verify their stability, where 6 out of the 22 flood scenarios correlated with the simulated spatial assessment of flood susceptibility. The findings were further validated using real-life flood incidences in the study area obtained from satellite images, which confirmed that most of the flooded areas were distributed over the VHSF and HSF zones. This integrated approach enables network model structuring, and reflects the interdependences among real-life flood influencing factors. This accurate identification of flood prone areas could serve as an early warning mechanism. The approach can be replicated in cities facing flood incidences in identifying areas susceptible to flooding for more effective flood disaster control.

1. Introduction

The occurrence of natural catastrophes has significantly increased in recent times due to various factors such as environmental degradation, climatic change, rapid population growth, and intensified and improper land uses [1]. Some of the impacts of natural disasters on human settlements include severe injuries and fatalities, damage to properties and infrastructure, economic losses as well as social disruptions [2]. Among natural disasters, flood deserves special attention because it is one of the most frequent and costliest in terms of human and economic losses: it constitutes 31% of the total economic damages resulting from natural disasters globally [3].
Asian countries, including Malaysia, are highly vulnerable to floods because of their geographic locations and other factors [4]. About 90% of natural disaster related injuries in Malaysia are caused by flood with average yearly cost of around USD205 million [5]. According to Malaysia’s Department of Irrigation and Drainage, around 29,000 km2 of land area and over 4.82 million people or 22% of the total population are affected by floods annually [6], with residents of low-lying areas, especially close to riverbanks, being the most susceptible to flash floods [7]. Floods are mainly triggered by the occurrence of intense monsoonal rainfall, which ranges between 2000 to 3000 mm annually. The resultant huge concentration of run-off exceeding the absorptive capability of the natural drainage system cause severe damages [6]. Several houses are being flooded, traffic flow interrupted, and lives are lost in extreme cases [8].
Due to Malaysia’s high susceptibility to floods, various stakeholders are continuously seeking permanent solutions to the country’s flood menace [
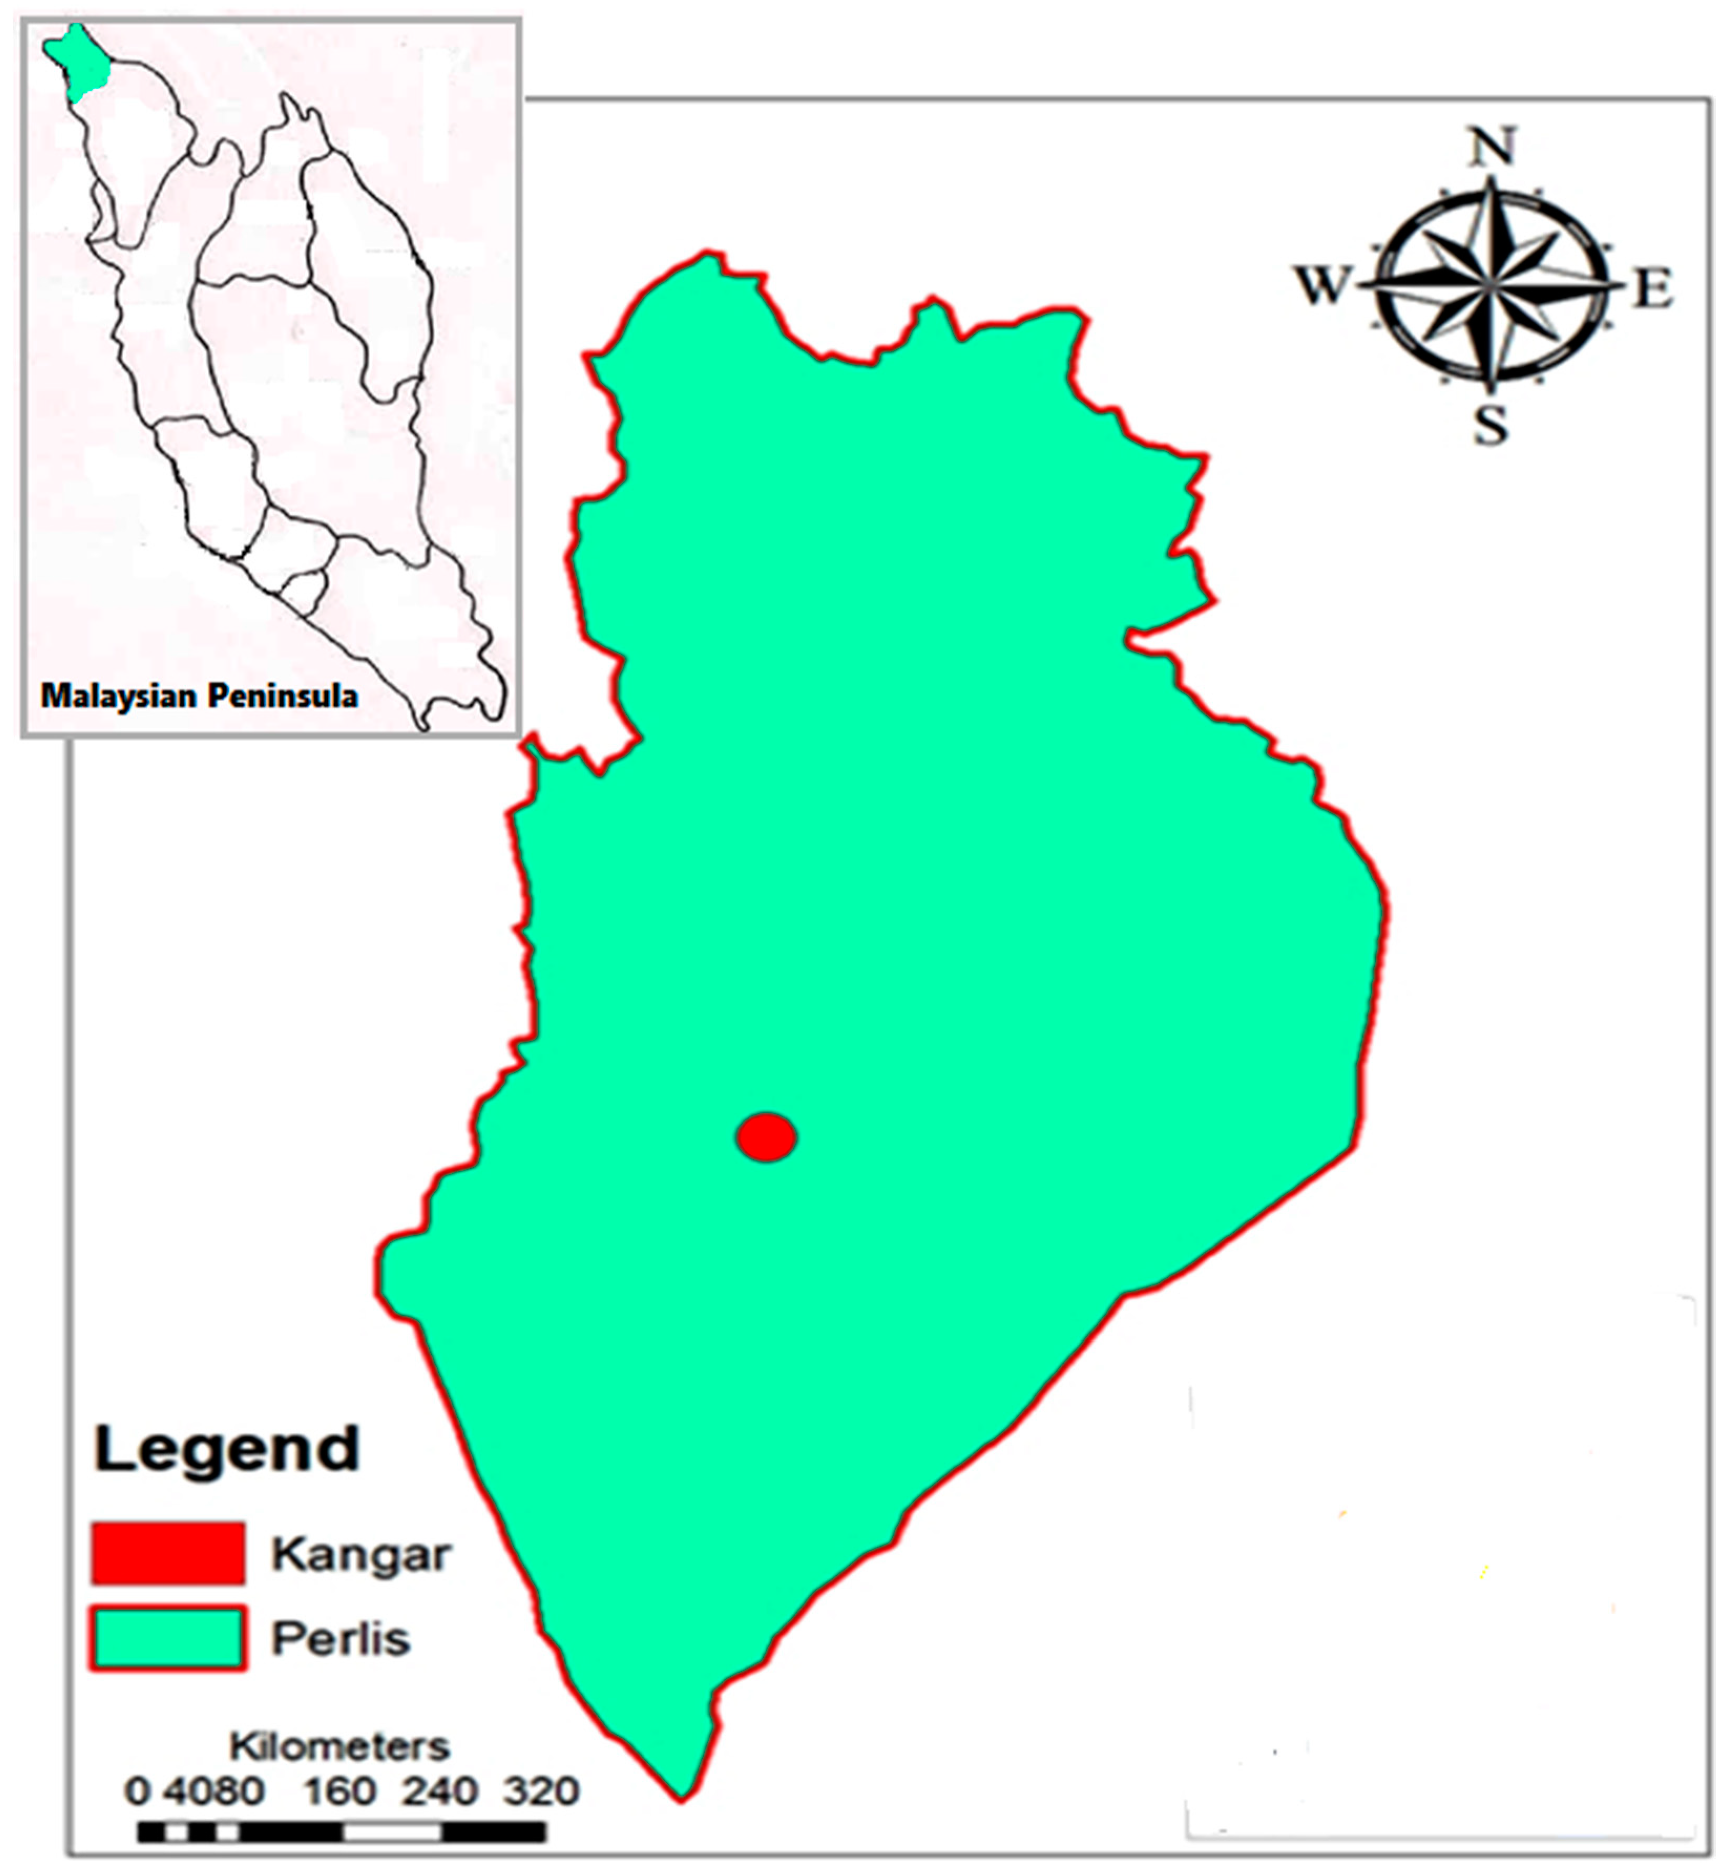
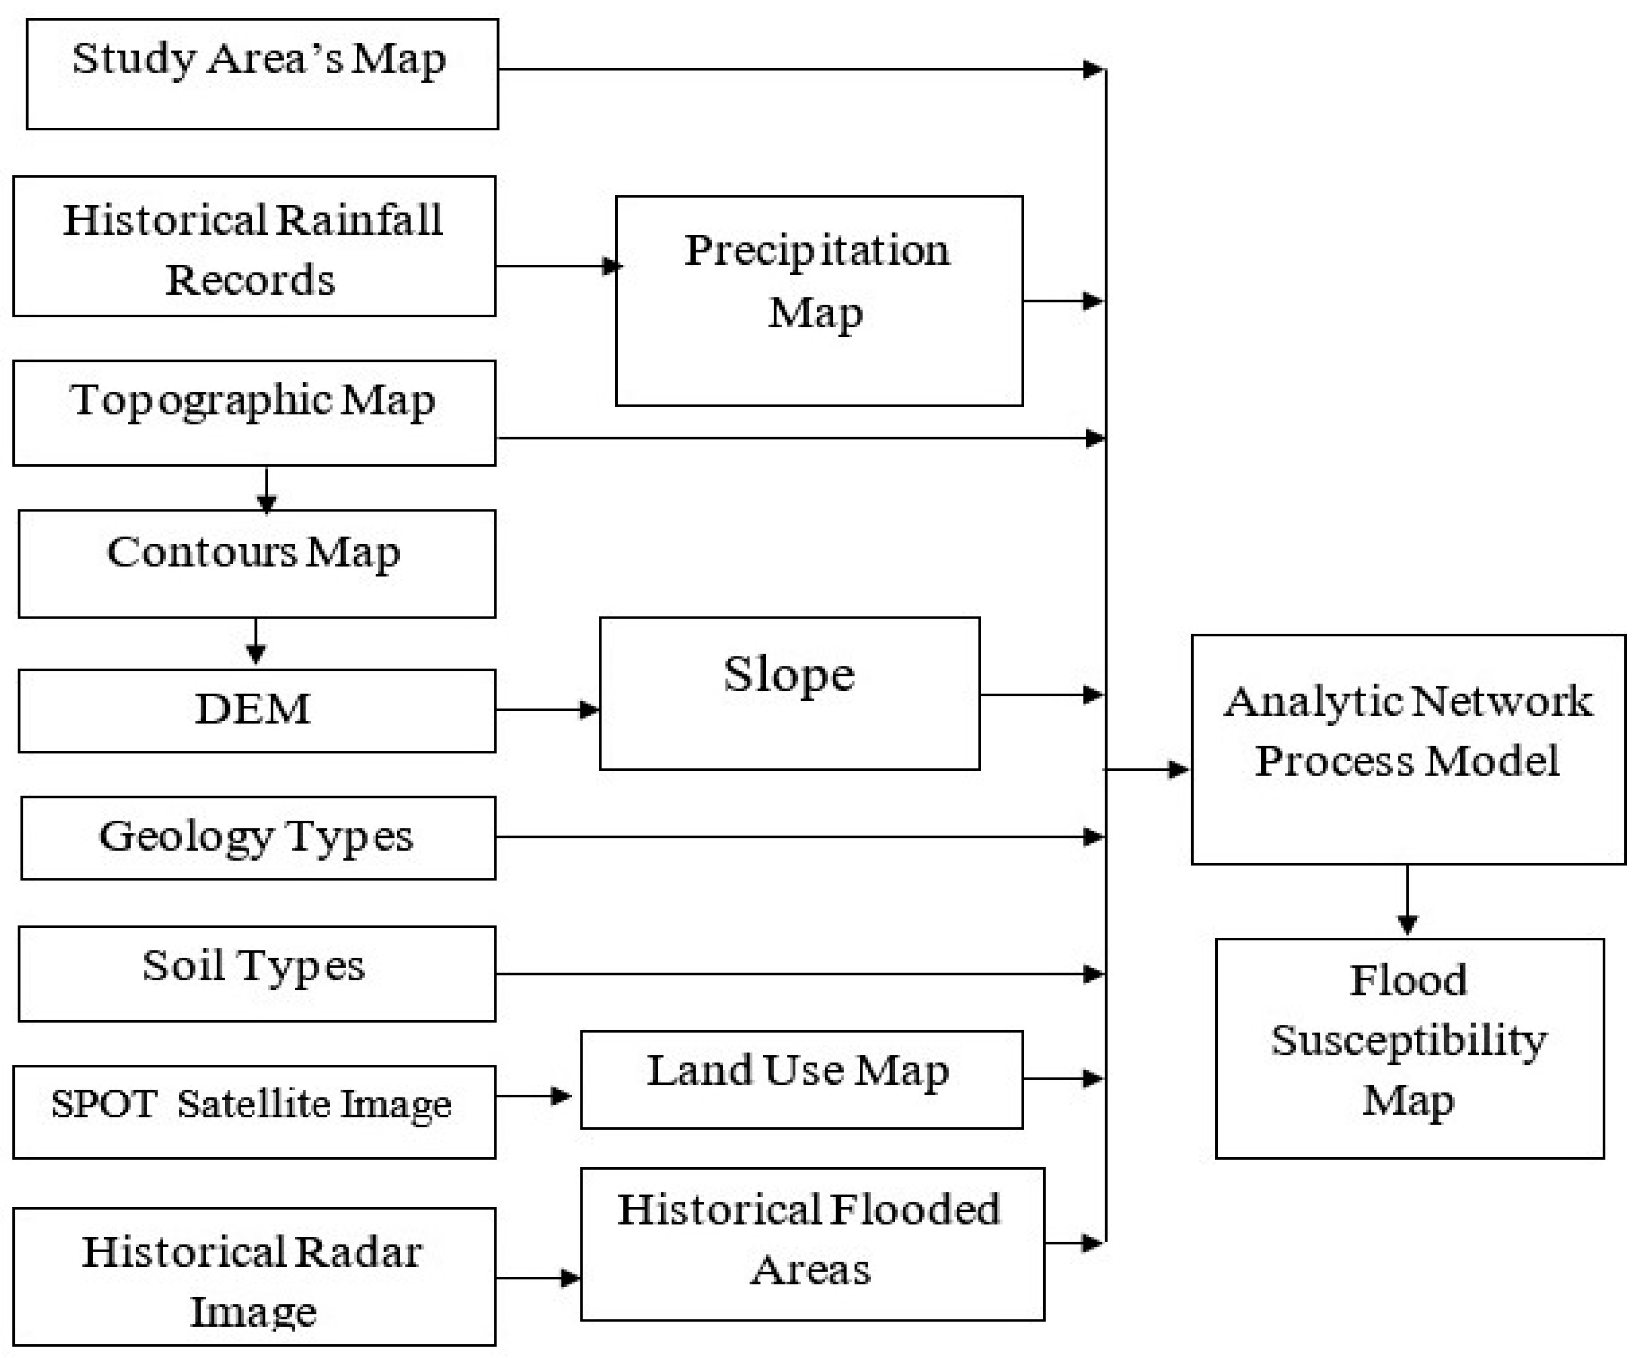
9]. Indeed, an effective and systematic way of managing periodic flood disasters requires mapping flood susceptible areas and understanding potential flood triggering factors. This study, therefore, integrates GIS capability with experts’ judgments to help in assessing and mapping current and future flood incidences in Malaysia, targeting Perlis area as a case study. The analytical network process (ANP), a type of multi-criteria tool for decision making, is used to assess and rank experts’ input on the significance of various flood causing factors and possible mitigation measures. There is a dearth of published research that combined GIS-based ANP model and RS to forecast flood susceptible zones in Perlis, Malaysia. Recent studies that adopted the ANP method have not incorporated remote sensing microwave images such as Radar Satellite (RADARSAT) into the analysis [10,11,12]. Moreover, Perlis is in the northern part of Malaysia that is regarded as the “rice bowl” of the country [13]. The frequent flood occurrences in the area might affect the food security of the entire country. This study, therefore, bridges this gap by first reviewing relevant literature on flood forecasting, followed by a description of the study area in Section 3. Section 4 and Section 5, respectively, explain the methodology employed in the study and presents the findings. Section 6 discusses the results and Section 7 concludes the paper with some key recommendations.

2. Literature Review

Flood is a natural and persistent overflow of huge quantity of water that occurs as a result of intense and prolonged rainfall and ends in exceeding the absorptive capability of the ground, and capacity of rivers, streams, and coastal areas [14]. A review of literature on flood vulnerability analysis has shown that researchers are increasingly using multi-criteria decision-making tools (MCDT) to assess the risk of flooding [15]. For example, GIS has been used to compute flood vulnerability index based on social and physical criteria in several urban areas [16]. One of the most common approaches of flood forecasting is integrating GIS with the analytic hierarchy process (AHP) and its many variants [17].
Also, different RS tools have also been used to evaluate the vulnerability of an area to flooding. For instance, SPOT (Systeme Pour l’Observation de la Terre [Satellite for observation of Earth]) imageries were utilized along with a digital elevation model (DEM) in the delineation of the monsoon flood in Bangladesh [18]. DEM has been used to analyze the vulnerability of a coastal industrial city to flooding due to predicted sea level rise [19] and multi-sensor RS data has been utilized to analyze the causes of recurrent flash flood in Jeddah city, Saudi Arabia [20]. In another study, Landsat Thematic Mapper band 7 with the Near Infrared band 4 have been used to delineate flooded areas [21]. Similarly, advanced very-high-resolution radiometer (AVHRR) data has been employed for regional flood studies [22], as well as amplitude change detection technique using multi-pass synthetic aperture radar (SAR) data for identifying flooded areas [23]. Other studies have analyzed the depth of flood using AVHRR imageries from National Oceanic and Atmospheric Administration (NOAA) based on the tonal variation (the relative brightness or color) of the flooded water in the images [24,25]. Other techniques such as artificial neural network (ANN), decision tree (DT), and adaptive neuro-fuzzy interface systems (ANFIS) model among others can deal with the issues of uncertainties in flood assessment but are sometimes complex and difficult to handle [26].
In recent times, due to the need to handle the complex data required for flood vulnerability analysis in a more efficient way and account for likely uncertainties, various advanced machine learning algorithms and statistical models such as multivariate regression models have been explored [27]. Other studies have used support vector machine models [28], ANN model [29], ANFIS [30], a combination of fuzzy logic and support vector machine [31], integrated machine learning and statistical models [32], DT algorithm [33], logistic regression [34], and an ensemble of regression trees and support vector machine [35]. Despite the recent focus on quantitative methods of flood vulnerability analysis, qualitative approaches such as the AHP and ANP are still being adopted [36,37] due to their relative simplicity in computing flood influencing parameters. The weights of each of the parameter considered in an AHP model are determined by expert opinions unlike the quantitative methods that require rigorous training and computations [28]. Though the AHP model has the drawbacks of expert bias and unsuitability for global application [28], it could still be effectively applied on a regional or local scale. In a recent study of Riyadh, the AHP model was adopted in identifying flood vulnerability zones [38].

Analytic Hierarch Process (AHP) and Analytic Network Process (ANP)

AHP is a mathematical-based model developed by Thomas Saaty [39] in the early 1970s to simplify and improve the process of decision-making. It comprises six major steps: problem definition; decomposing the problem into a hierarchy; carrying out pair-wise comparison; calculating the maximum eigenvalues and eigenvectors; calculating the consistency ratio to check the consistency of the matrix; and aggregating the relative important weights of a decision to arrive at the final weighting for decision alternatives [40]. Indeed, AHP has been recognized among researchers, practitioners, and decision-makers for its application in assessing various geo-hazards problems including flood and landslide susceptibility [41], slope failure [42], groundwater vulnerability [43], and urban seismic vulnerability [44]. However, some inconsistencies were pinpointed especially during the early and middle period of its discovery. For instance, as a top-down decision or hierarchy model, criteria and alternatives are assumed to be independent from each other, which rarely holds true in real-life situations [45]. Moreover, bias could occur when the criteria and sub-criteria correlate with each other.
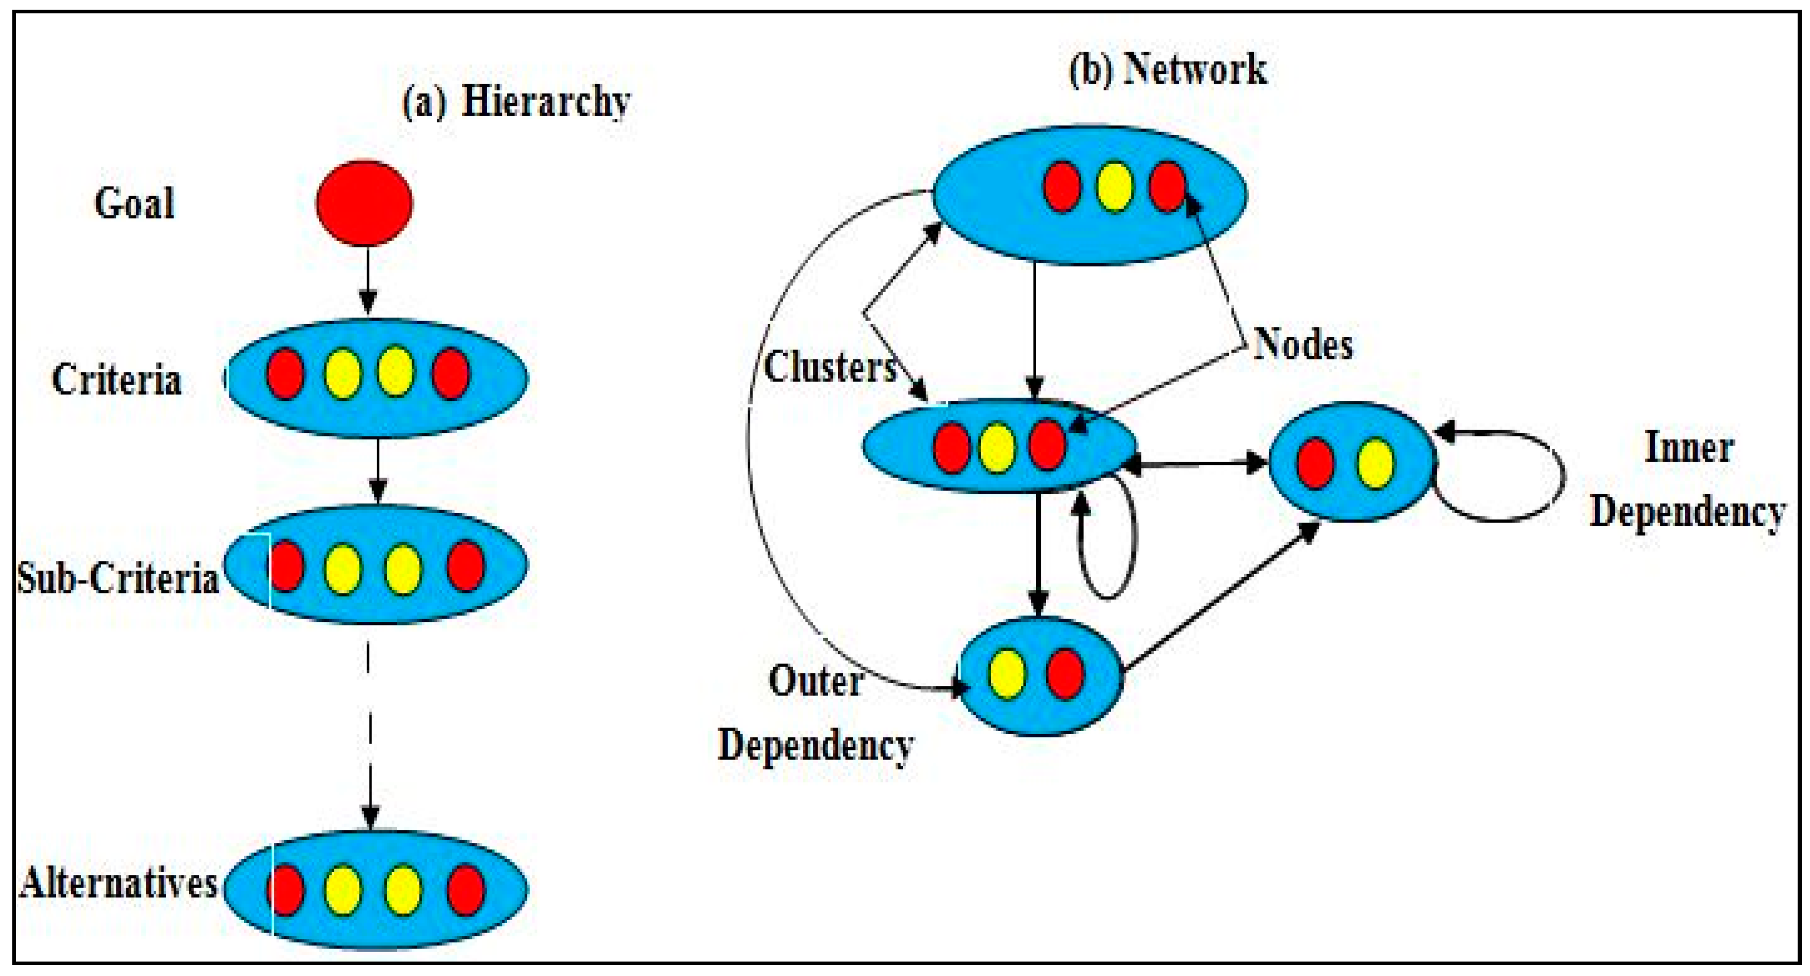
Therefore, to improve decision-making processes and overcome some of the shortcomings of AHP, particularly the assumed independence of decision factors, the ANP model was developed as an improved generalization of the AHP method to deal with the problem of inner-dependences between elements in a network. Similar to the AHP, ANP uses experts’ judgments as inputs for evaluating decision factors in multi-criteria decision-making problems such as flood susceptibility mapping. The ANP organizes elements into networks of clusters and nodes. Clustering is a means of classifying similar elements or factors within the same group. Elements contained in clusters are referred to as nodes and the ANP model supports comparison between nodes in the same cluster (inner-dependence) and with nodes in other clusters (outer-dependence). Nodes in typical Multi-Criteria Decision-Making (MCDM) applications have unequal degrees of influence and estimating the degree of influence or significance of each factor is essential for producing valid susceptibility maps. Therefore, it is necessary to perform intra and inter comparison of nodes and clusters in order to prioritize the various conditioning factors as a means of establishing their respective levels of significance.
Thus, the ANP allows the interdependences between decision factors to be considered, allowing network model structuring, which is good for reflecting interdependences between real-life factors such as those that influence flood occurrence. A key innovation of the ANP is its network structure, which enables interactions between elements of different clusters and dependences between the elements in the same cluster to be considered. ANP’s strength lies in its ability to handle the complexities of everyday decision-making problems, which many other decision systems might not handle effectively [40]. ANP is a relatively simple, intuitive approach that can measure all tangible, intangible, individual, and shared values or criteria in the flood susceptibility model. Its ease of use and facilitation of better communication among multiple diverse stakeholders makes it appealing to a broad range of users, particularly for addressing complex real-life problems such as flooding [46]. ANP’s structured analysis facilitates continuous conversations leading to the gathering of relevant information from every participant in the group thereby enabling the achievement of consensus. Such a robust model that enables input from multiple diverse stakeholders and aggregation of different flood conditioning factors, including indirect dependencies between the factors, can aid decision results that are likely to be more consistent with real-world decision situations [47]. Hence, these reasons influence the choice of ANP for this study. Figure 1 illustrates the structural difference between the AHP and ANP.

3. Study Area

This study’s integrated flood forecasting approach was implemented in the flood prone city of Perlis, situated in Peninsular Malaysia. The scope involved the entire State (Figure 2), with a population of 227,025 people based on 2010 statistics [48]. The main economic activities in Perlis are agriculture: paddy, oil palm, rubber, fruit farms and sugar cane plantations, which make up about 54.5% of its total area. Forest, bushes, shrubs, and rivers cover about 32.7% of the total area. Paddy is mostly located at the low-lying areas of the southern parts, while rubber and sugar cane plantations are mostly found in the northern areas of higher elevation. It also has a small industrial area.
Perlis lies at latitude 6°43′19″ N and longitude 100°07′59″ E, with an elevation of 6 m (19ft) above sea-level. The climate is usually hot and wet, with two distinct rainy periods characterized by heavy downpour, and a drought season. It experiences a monsoon tropical climate and ‘winter winds’ (east coast wind from Teluk Siam). The drought period spanning the months of December to March is associated with the northeast monsoon. The two periods of rainfall are associated with the advance and retreat of the southwestern monsoon in April–May and September–October. The latter period produces greater depths of rainfall. The average annual temperature is 27 °C, while the mean annual rainfall is between 2000 to 3000 mm. The rainfall peaks during the post-equinoctial transition periods between the monsoons. Analysis of rainfall data indicates higher mean monthly rainfall between May to November, with less rainfall in December to March. Severe flood disasters were recorded in 2010 and 2011, impacting people and causing damages to properties. The 2010 flood was described as the worst disaster in the state in 30 years [49]. Over 50 million Malaysian Ringgit (RM) was lost and 13,711 people were evacuated [8].

4. Materials and Methods

4.1. ANP Questionnaire Survey

This study adopted a mixed quantitative (including spatial data) and qualitative (expert opinion) approach. The qualitative data was obtained from 16 experts in related fields such as hydrology, civil and environmental engineering, geology, geomorphology, and urban and regional planning. Some of these experts were consulted through visits to the study area. Contacts were subsequently established during the first stage of the study through different platforms including conferences and online. Experts were selected based on their expertise and experience in flood forecasting and management, making them competent to provide meaningful and unbiased information required for ANP modeling (Table 1). Focused expert discussions and literature review provided guidelines for selecting flood causative factors (rainfall, slope, land use, soil type, and geology), which were then classified into sub-criteria that are included in the questionnaire [5,50]. A sample of the questionnaire used in this study is presented in Appendix B.
First, a pilot survey was conducted to correct ambiguities and check wordings of the instrument to ensure that the respondents clearly understood the questions. After multiple revisions, the final version of the questionnaire was distributed to 22 experts to obtain their relative preference rankings of the criteria and only 16 responses were retrieved (Table 1). The reason for considering many respondents was to avoid bias in gauging their judgments [51], otherwise judgment from a few experts suffices [52].
The ANP was implemented using Super Decision based on the Saaty’s scale of measurement (https://www.superdecisions.com/index.php) [53]. The software was used for pair-wise comparison of judgments and subsequently to derive weights for each decision element using mathematical techniques including eigenvalue, mean transformation, and row geometric mean. The decision elements in ANP are represented as clusters and nodes. The clusters are the parent factors viz.: land use, geology, slope, soil type, and rainfall; while the nodes are the sub-factors of the parent factors. The validity of the output was assessed using the derived weights from the comparison matrix. For example, if the value for the calculated matrix with an acceptable consistency judgment is X, thus the comparative weight is calculated using this equation: Xw = λ max w , where λ stands for non-zero eigenvalue of a consistent matrix X [54]. The consistency index (CI) and consistency ratio (CR) were calculated to ascertain the consistency of the judgments derived from the experts. The CR was computed using this equation: CR = CI/RI, where RI is random index values derived from a standard table, which is randomly generated (Table 2). The random inconsistency index was obtained by averaging the consistency index of a randomly generated reciprocal matrix from a scale of 1–9 (Table 3), and it is not appropriate for the consistency ratio to be more than 0.10.

Group Preferences Aggregation

To derive criteria weights that are truly reflective of the combined views of various experts, the individual ratings were combined to obtain a single consensus preference matrix. There are four methods of combining individual pair-wise comparison matrices to derive a single consensus pair-wise comparison matrix that is generally acceptable to all: (i) vote or compromise; (ii) separate models or players; (iii) consensus; and (iv) geometric mean approach [55,56]. The arithmetic mean method has also been implemented in some cases [57]. The geometric mean method was adopted in this study because it is more appropriate for aggregating individual preferences of experts as it is consistent with the meaning of both judgments and priorities in pair-wise comparison models [58]. It also maintains the reciprocal property in the resultant pair-wise comparison matrix, which is exactly required for the ANP methodology [59]. The mathematical definition of a geometric mean (∏) is the root of the product of numbers, as shown in Equation (1) below.
= a 1 × a 2 × a 3 × a 4 × a 5 a n n
where,
  • n = the number of respondents;
  • a = the value assigned by each respondent.

4.2. Spatial Database Creation

Spatial database for the flood influencing factors was created to enable the integration of the ANP model. Table 4 describes the spatial data used in this study. As mentioned earlier, five flood-influencing factors known to trigger flood in the study area were considered. GIS was used to convert the factors into a grid spatial database, and the flood influencing factors were extracted from the database. Analysis was done by using GIS to generate the flood susceptible zones based on the ANP mathematical model using a weighted linear combination (WLC) method. The WLC method permits evaluation map layers to be overlaid. Thematic map layers were produced to represent all criteria influencing flood generation in the study area. The thematic map layers were assigned weights derived from the ANP model so that each map layer depicts its relative level of influence in flood generation. The overall methodology employed for this analysis is shown in Figure 3.

4.3. Flood Extent Extraction from RADAR Image

A level-3 RADARSAT image obtained from [62] was used in this study. Data post-processing aimed at refining the data using a suitable filter in preparation for further analysis was performed. This involved classification, accuracy assessment, raster to vector conversion, vector overlaying, etc. Lee filter was employed in filtering the image using a 3 × 3 filter size and a noise variance of 0.25 to smoothen the noise. The flood extent extraction model was developed using ENVI 4.8 [64] and ArcGIS 9.3 software [65] to extract the maximum extent of the historical flood from the RADARSAT flood image of the study area (Table 4). In extracting the water bodies, the normal water extent, paddy fields oversaturated with water and the mountain shadow extent were included. However, in producing the pure flood extent, the normal water extent, non-flooded paddy field and mountain shadows were removed, while the flooded paddy fields were incorporated into the flood extent extraction model to avoid underestimating the flood impact. Hence, the flood extent modeling approach involved two separate modeling processes: normal water extraction and flooded paddy area extraction. Although paddy fields are typically flooded due to irrigation, they become overflooded when flood waters in the paddy fields remain stagnant for days before the river level subsides and allows the water to flow out to sea [66].
Figure 4 shows the methodology used for the flooded area extraction from RADARSAT image using ENVI 4.8 software [64]. In validating the flood extent map, three methods were used. First, the post-flood RADARSAT-1 image dated January 2011 was used to assess the correlation between the flood extent extraction map and post-flood image. Second, the accuracy assessment algorithms viz.: (i) neural network algorithm; (ii) parallel-pipe algorithm; and (iii) minimum distance algorithm were used to evaluate and select the optimal algorithm. The neural network algorithm yielded the best result with overall accuracy of 99.77% and kappa coefficient 0.99, followed by parallel-pipe algorithm (98.64% accuracy and 0.92 coefficient), and then minimum distance algorithm (96.77% accuracy and 0.83 coefficient). The kappa coefficient is an accuracy indicator used in image classification accuracy assessment where 0 implies lack of agreement between the ground truth image and the classified image and 1 implies complete agreement.
Third, the adopted methodology was used in validating the flood extent map because the findings of a study conducted in Kedah State [15], neighboring the southern area of Perlis, correspond with the flood influencing factors tested herein.

4.4. Preparation of DEM and Thematic Layers

The topographic database was used to produce the digital elevation model (DEM). A Scale 1:50,000 topographic map was adopted in extracting the contours and survey-based points with certain elevation values, and a DEM was generated with a resolution of 10 m to calculate the degrees of slope. Similarly, a 1:250,000 soil map was used to produce the soil types’ thematic layer while a 2005 SPOT 5 satellite image was used to classify the land use categories of the study area using the supervised classification method. The SPOT satellite image was chosen for this study since the resolution capability of SPOT’s panchromatic (black and white) sensor was 10 m, while its multi-spectral sensor can have a resolution of up to 20 m. Here the multi-spectral image of Perlis with a resolution of 20 m was chosen. In multi-spectral images, three bandwidths were used—i.e., green, red, and near-infrared bandwidths. In contrast, the human eye sees using three visual bands—i.e., red, blue, and green bands. This image was processed using ENVI 4.8 [64] software to develop the land use map of Perlis. The selection of a multi-spectral satellite image rather than an aerial photograph facilitated the land use map processing. This was due to the ability of the near infrared band to differentiate much more clearly between foliage and water bodies. In the classification process, the representative training areas of each land cover were chosen using reference data such as maps and field investigations. The land use map has been categorized into six classes: forested areas, paddy fields, rubber plantation, sugar cane plantation, and existing human settlements.
Rainfall data from 14 different rainfall gauge locations covering the entire Perlis state were collected from the Department of Irrigation and Drainage, Malaysia [63]. The amount of rainfall recorded over a period of eleven years from 2001 to 2011 was used in this study. The mean annual rainfall for each rainfall gauge was inputted into the GIS, where Kriging interpolation method based on Gaussian function was used. The rainfall data is sparse with low spatial resolution due to the limited number of available stations. Lastly, a 1:250,000 geology map was used to create the outcrops thematic layer. The flood influencing factors were represented in GIS as thematic layers for the application of the ANP model. The derived weights were calculated from the ANP mathematical model and the combination of all the clusters and their nodes were further integrated into GIS system using the weighted linear combination method (WLC) for the simulation of flood susceptible areas in the study region. The flood susceptibility levels of the different locations within the study area were divided into five classes: hardly susceptible to flooding (1); very little susceptibility to flooding (2); moderately susceptible to flooding (3); highly susceptible to flooding (4); and very highly susceptible to flooding (5). The classification signifies an increasing level of susceptibility to flooding with Class 1 being the least susceptible and safest while Class 5 is the most susceptible and hazardous. Furthermore, the simulated spatial flood susceptibility assessment was validated by superimposing the flood extent extraction model over the spatial flood forecasting model.

5. Results

5.1. Flood Susceptibility Mapping Using ANP Model

The ANP model was used to forecast the likely areas that will be subjected to future flooding in Perlis and to superimpose these susceptible areas with the extracted historical floods extent of the area detected from RADARSAT images and field surveys. The analysis indicates that there are basically five clusters, where each of these clusters has its own nodes from within. Each cluster has a loop indicating the presence of inner-dependences between the nodes of a given cluster. There are also outer-dependences and feedbacks indicated with one-way and two-way arrows, respectively. Therefore, the pair-wise comparisons of both the clusters and nodes were carried out based on the ANP network structure as shown in Figure 5.
The initial (unweighted) super-matrix, weighted super-matrix, and limit super-matrix were calculated. The limit super-matrix is illustrated in Table 5 which comprises the normalized by cluster weights and the final limit super-matrix. Based on the derived weights calculated from the ANP mathematical model, the clusters and their nodes were combined using GIS’ weighted linear combination method.

5.2. Flood Susceptibility Result

The susceptibility analysis considered these flood triggering factors: land use; settlement information; soil types; rainfall; slope; and geology; in deriving susceptibility as used in similar studies [50]. As shown in Figure 6, the areas are the very highly susceptible to flooding (VHSF) areas accounting for 38.4% (30,924.6 ha), highly susceptible to flooding (HSF) 19.0% (15,341.1 ha), moderately susceptible to flooding (MSF) 27.6% (22,256.7 ha), very little susceptibility to flooding (VLSF) 8.2% (6590.4 ha), and hardly susceptible to flooding (HSF) 6.7% (5437.0 ha). The flood susceptibility indices employed in this study are based on literature review [50].

6. Discussion

This study illustrates the robustness of coupling ANP as a decision-making tool with geospatial technologies in flood disaster susceptibility mapping, based on experts’ judgments. By using the ANP model, two shortcomings of the AHP technique were avoided namely its assumption of decision elements to be independent, which rarely occur in a real-life situation and the issue of rank reversal. Thus, ANP enabled the modeling of the interdependence of the factors responsible for flood disaster occurrence.
The findings of the study indicate that the flood vulnerable areas in Perlis are situated in the southern part of the state. According to our findings, alluvium deposit, paddy fields, flat slope, and low humidity clay soil are the most important factors influencing flood generation in the southern part of the study area with susceptibility levels of 34.1% (27,773.7 ha), 49% (39,863 ha), 83.0% (68,934.6 ha), and 40.7% (33,220.4 ha) respectively. This corresponds with the results of Adiat et al. [50] that conducted a similar study in Kedah State bordering the southern part of Perlis. To produce their flood susceptibility map, the authors utilized similar factors adopted in the present study such as soil type, geology, rainfall, and slope. The presence of these factors in various proportions within a location trigger flood. For instance, similar geology types were confirmed to be present in Perlis in the study of Arafin and Lee [67], which prevent the percolation of storm water into the ground resulting in water overflow. Despite using different MCDM approaches for different study areas with similar flood conditioning factors, these studies present similar outcomes. The prioritization of the conditioning factors by the respective experts also highlighted the significance of land use, geology, rainfall, and slope in influencing a region’s flood susceptibility. According to their findings, the highly susceptible flood areas in Kedahare located at the border with the southern part of Perlis, corresponding to this present study’s outcome. Similarly, Azizat and Omar [68] considered factors such as geology, soil type, rainfall, and slope (DEM) in mapping Perlis’ flood hazard areas. Frequency ratio, statistical index, and Poisson method were used in that study and the flood susceptibility results correspond with the result of this present study. The similarity in results is likely due to the consistency in experts’ judgements regarding flood triggering factors at all levels for the separate studies. Outcomes of integrated MCDM-GIS models are largely influenced by the prioritization of the flood triggering factors by experts. This underscores the significance of carefully selecting experts with sound knowledge of the terrain for reliable hazard susceptibility mapping. In this instance, the outcome of the experts-model based map corresponds with the susceptibility levels of the study areas from field observation and Azizat and Omar’s [68] integrated methods, thus confirming the reliability of the integrated ANP model adopted in this study.
Thereafter, sensitivity analysis, which is a collection of methods used for evaluating the degree of sensitivity of the spatial multi-criteria model output to slight changes in the input values was performed [69]. It is recommended that a sensitivity analysis should be carried out after every multi-criteria analysis to monitor/verify the stability of results because of possible uncertainties in the experts’ judgments [70]. There are two common methods of sensitivity analysis namely: (i) modification of weights obtained from the experts, and (ii) the assumption of equal weights for all factors. The main purpose of the sensitivity analysis is to examine how sensitive the choices are in relation to the changes in the criteria weights. This is quite imperative in the situation where uncertainties exist in the definition of the importance of different factor(s). The answers to the questions of ‘what if analysis’ can be addressed through a sensitivity analysis. Hence, the sensitivity analysis is recommended for all kinds of multi-criteria analysis. However, because of the sophisticated network structure of the ANP model, this kind of analysis is hardly conducted [
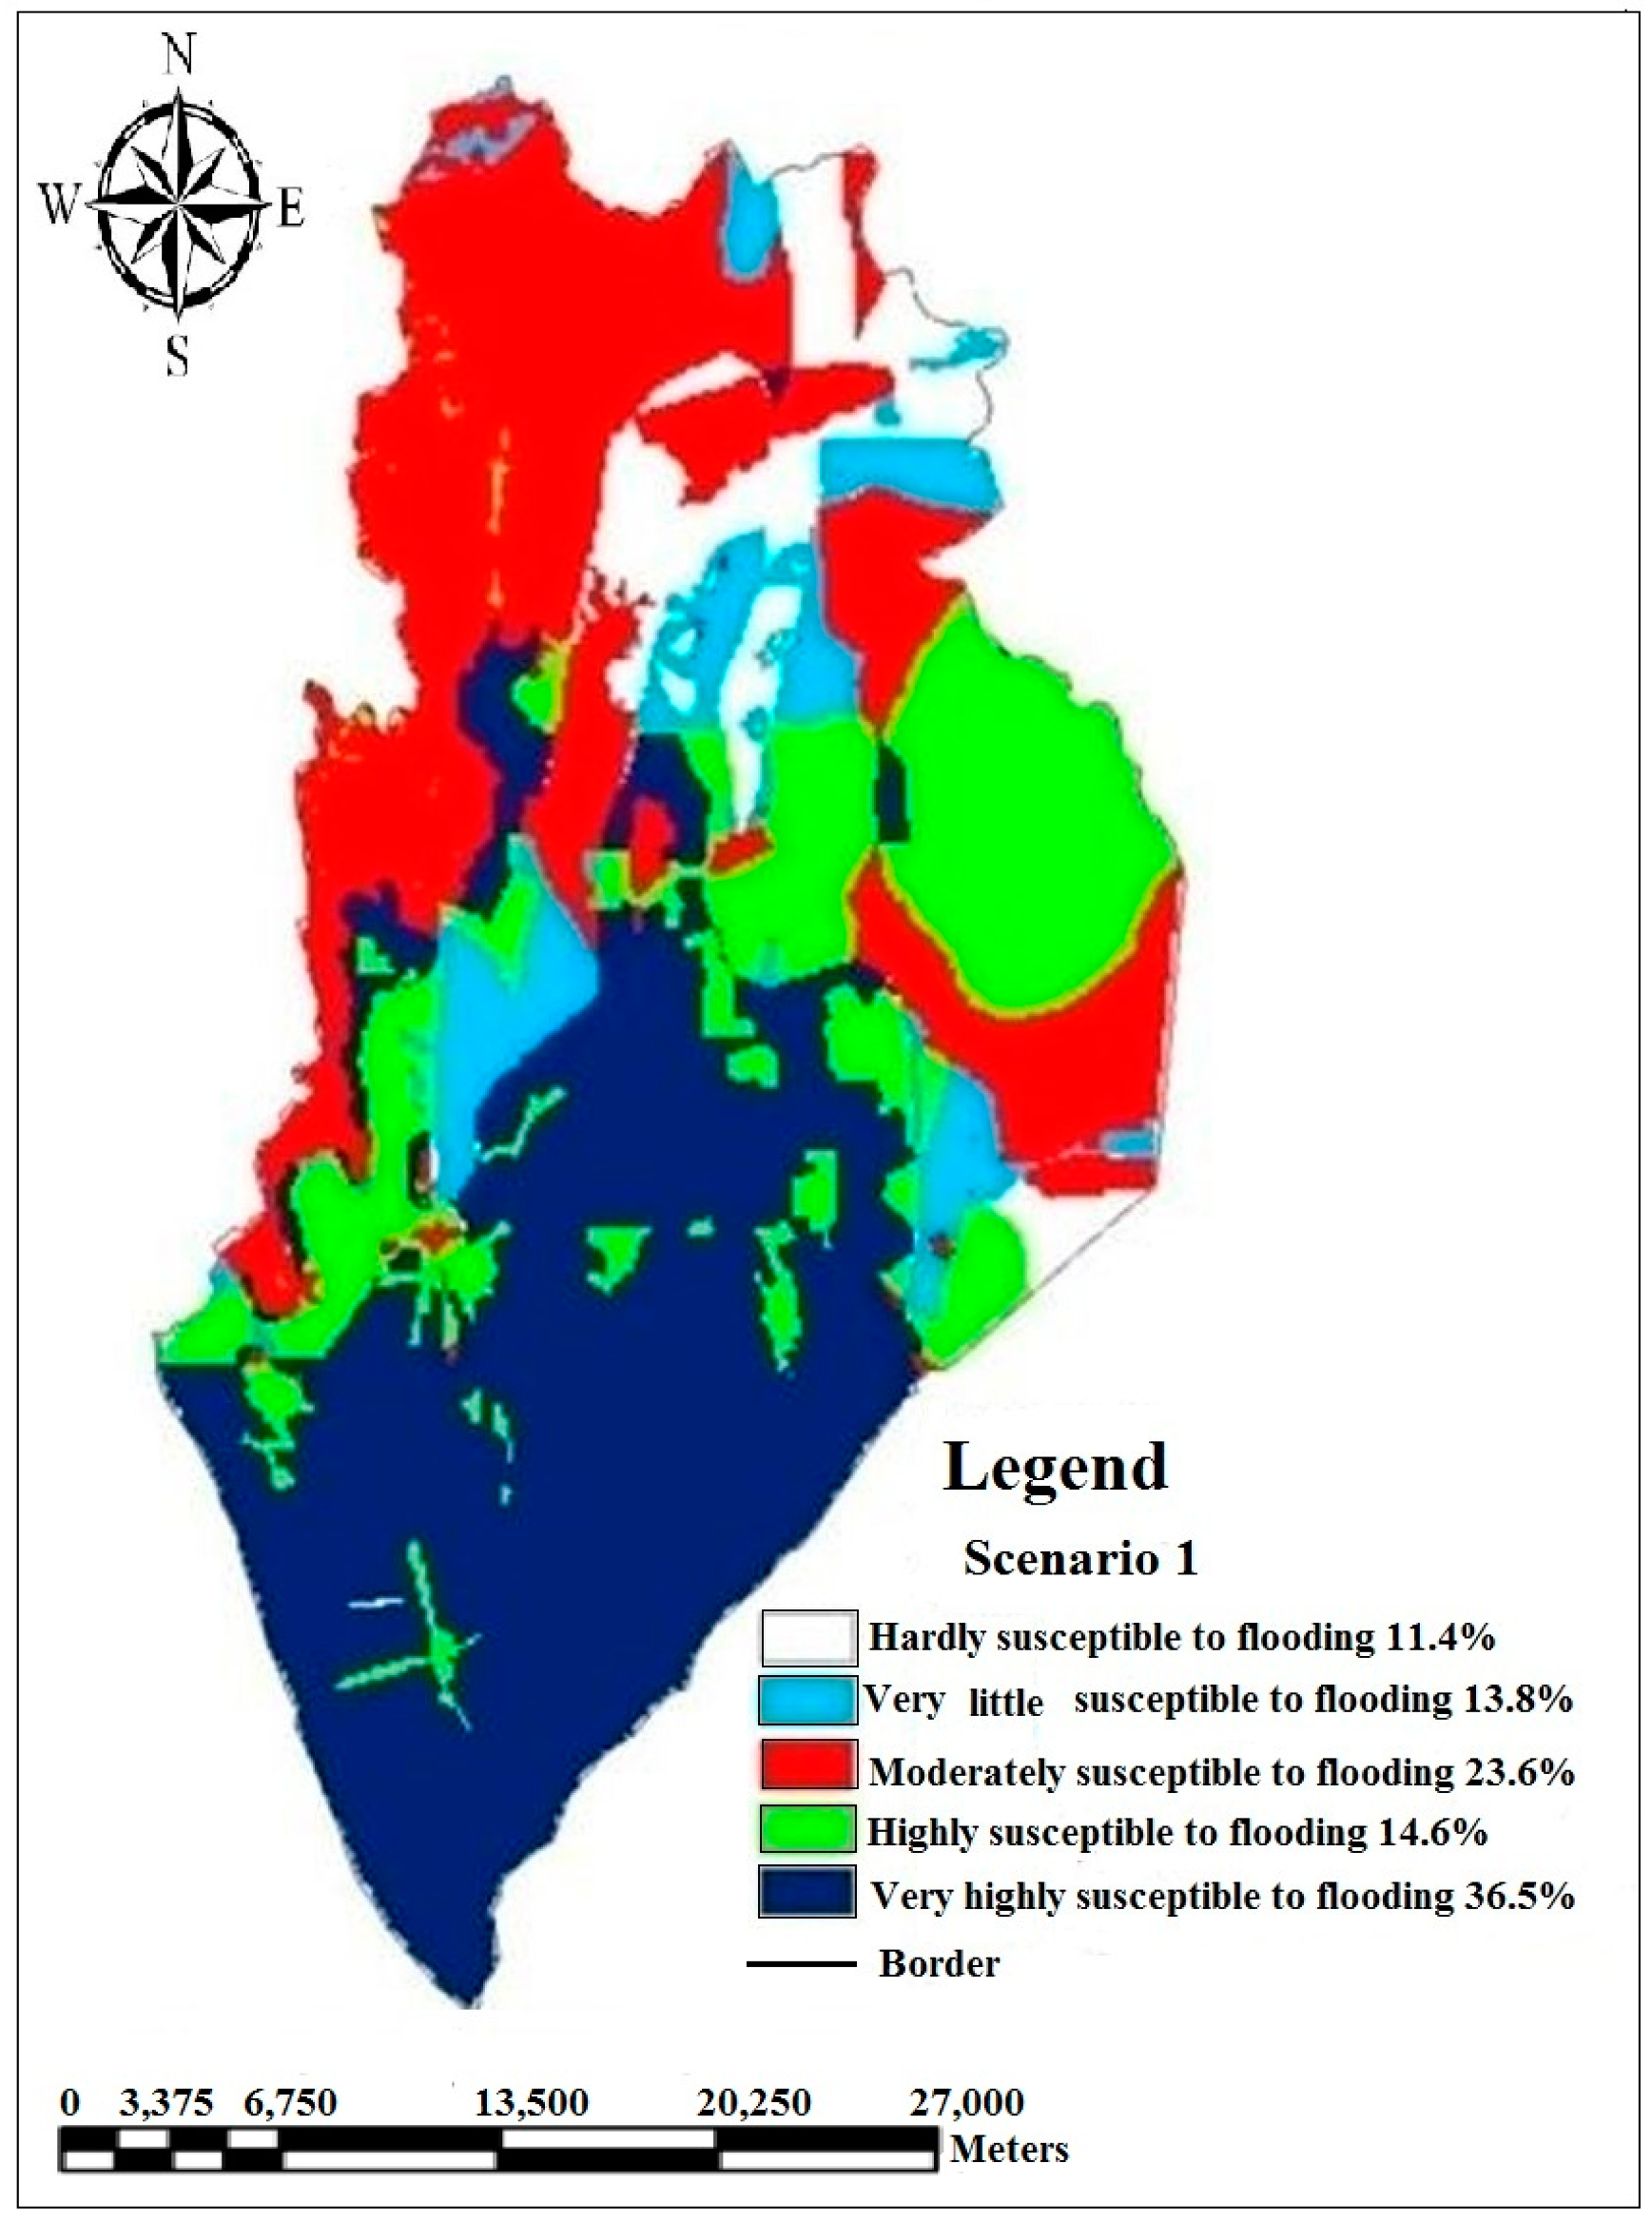
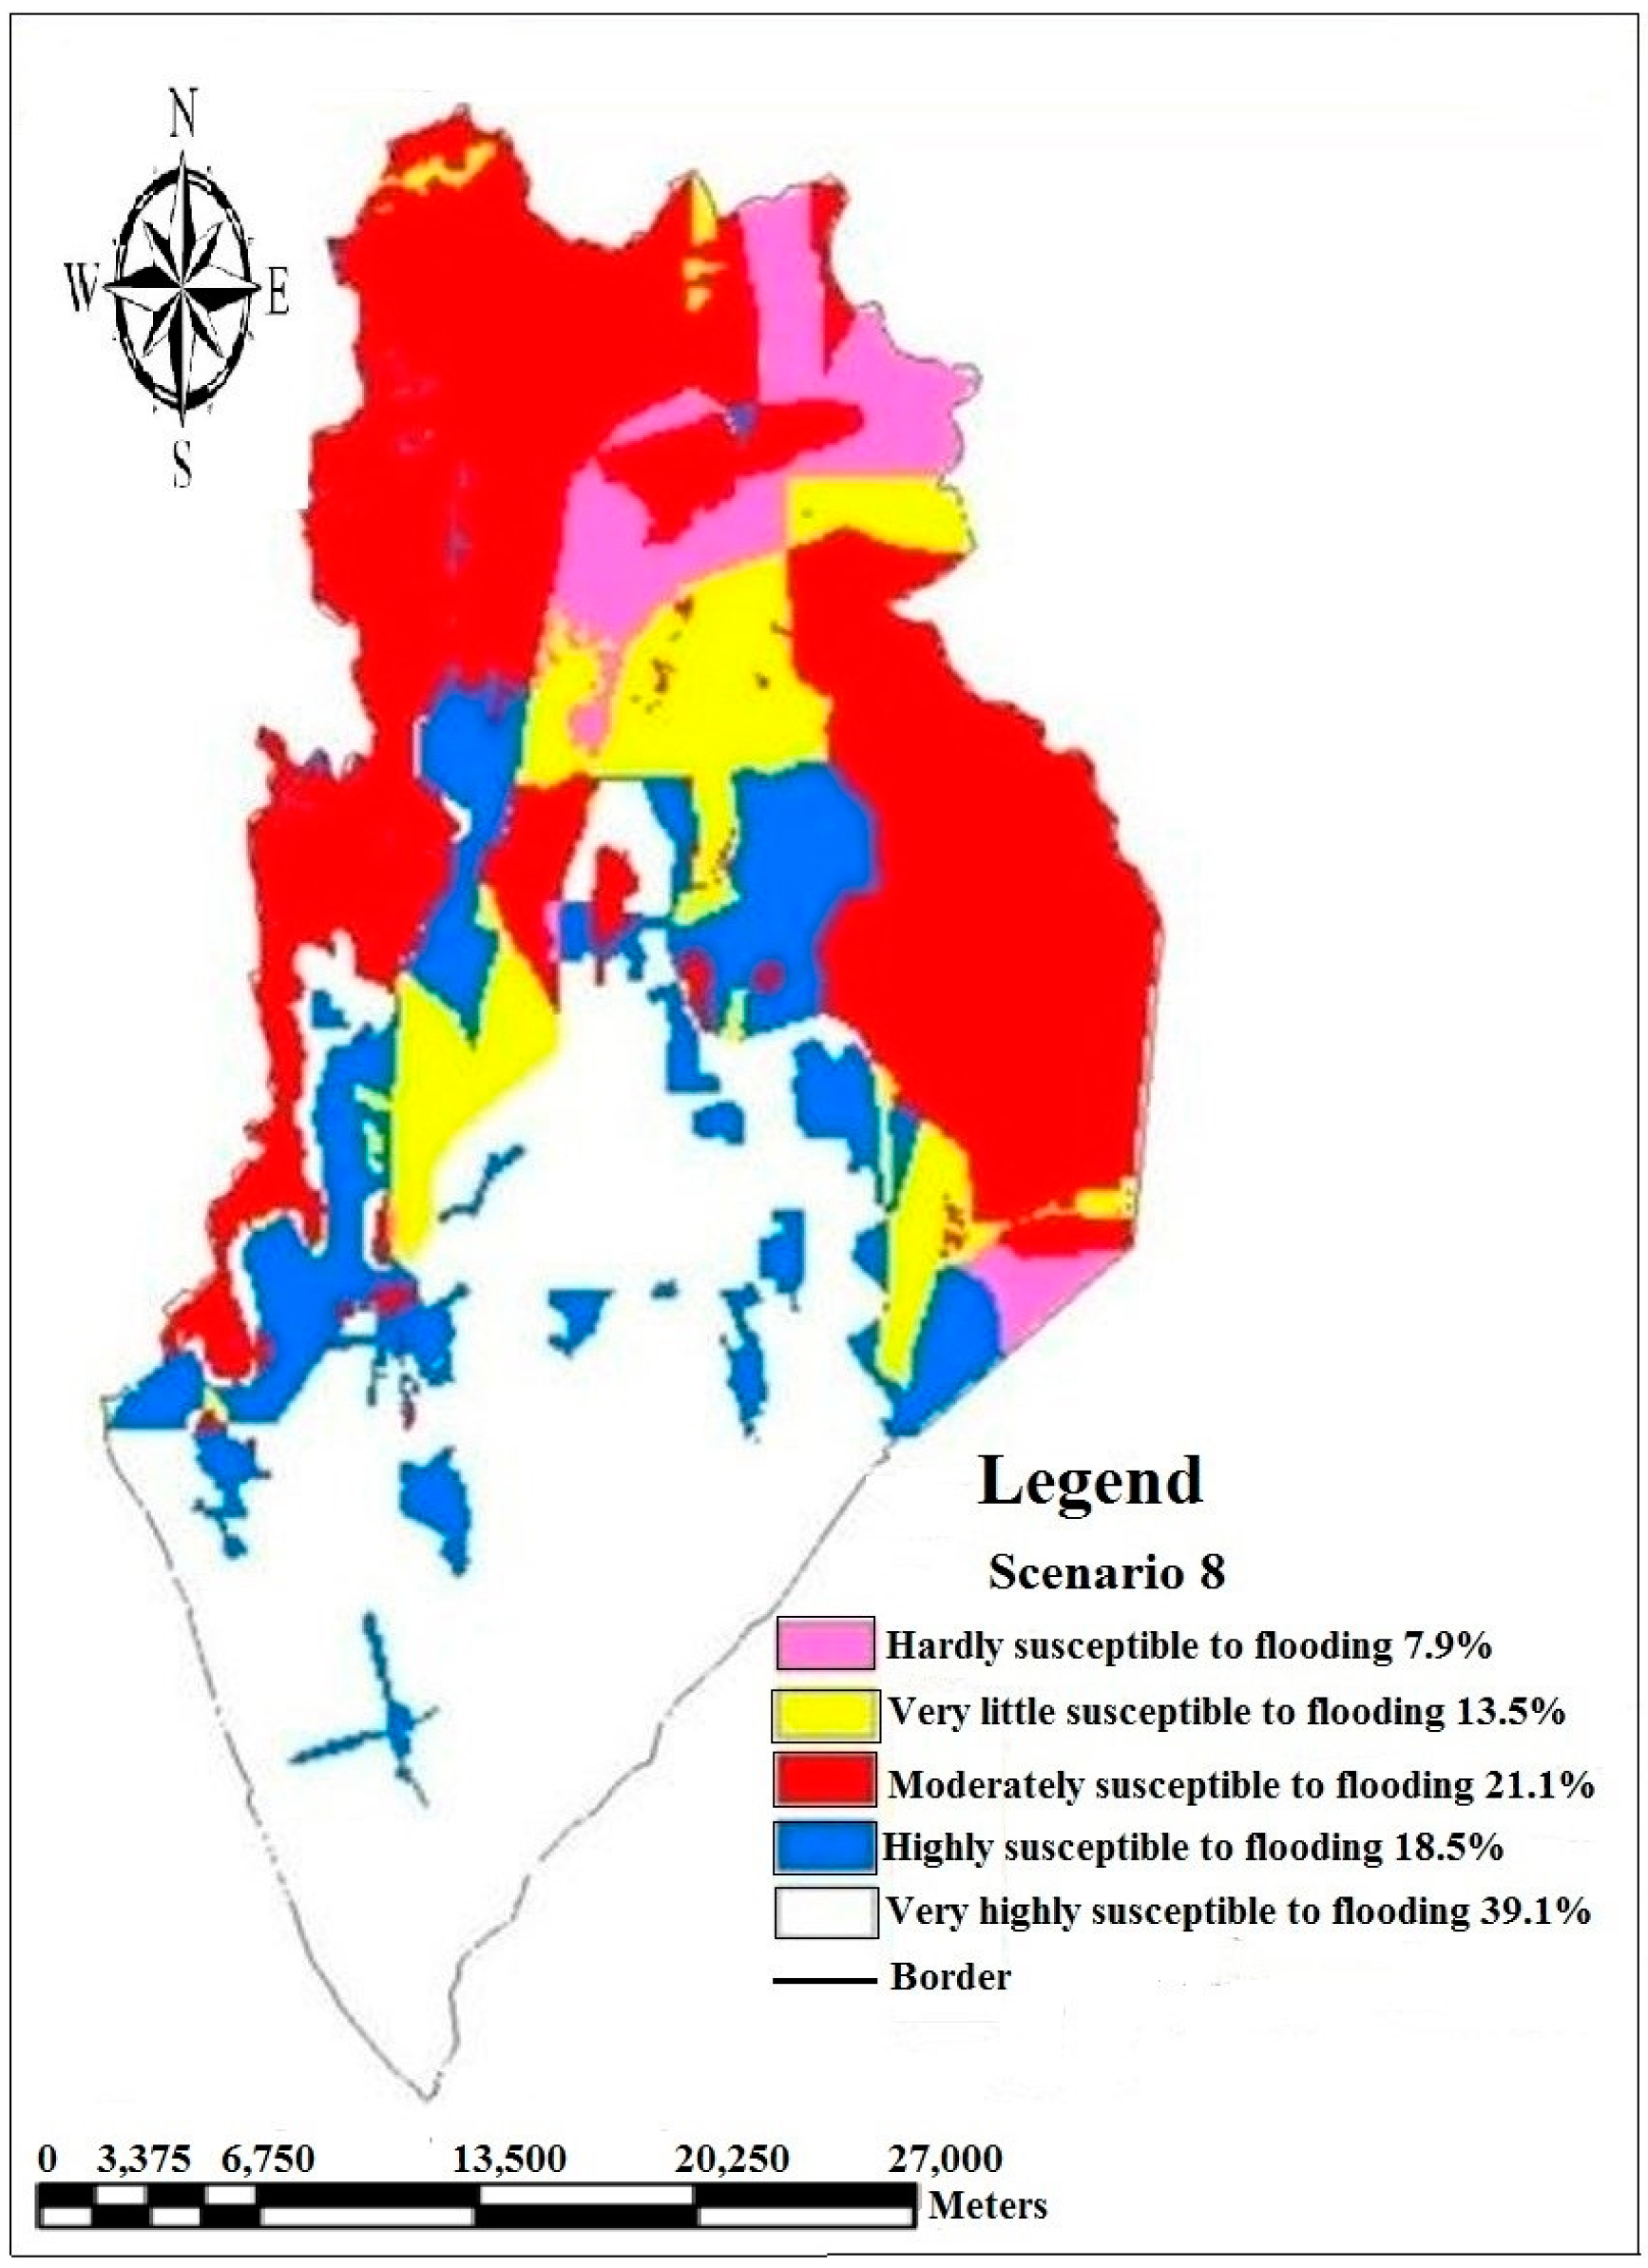
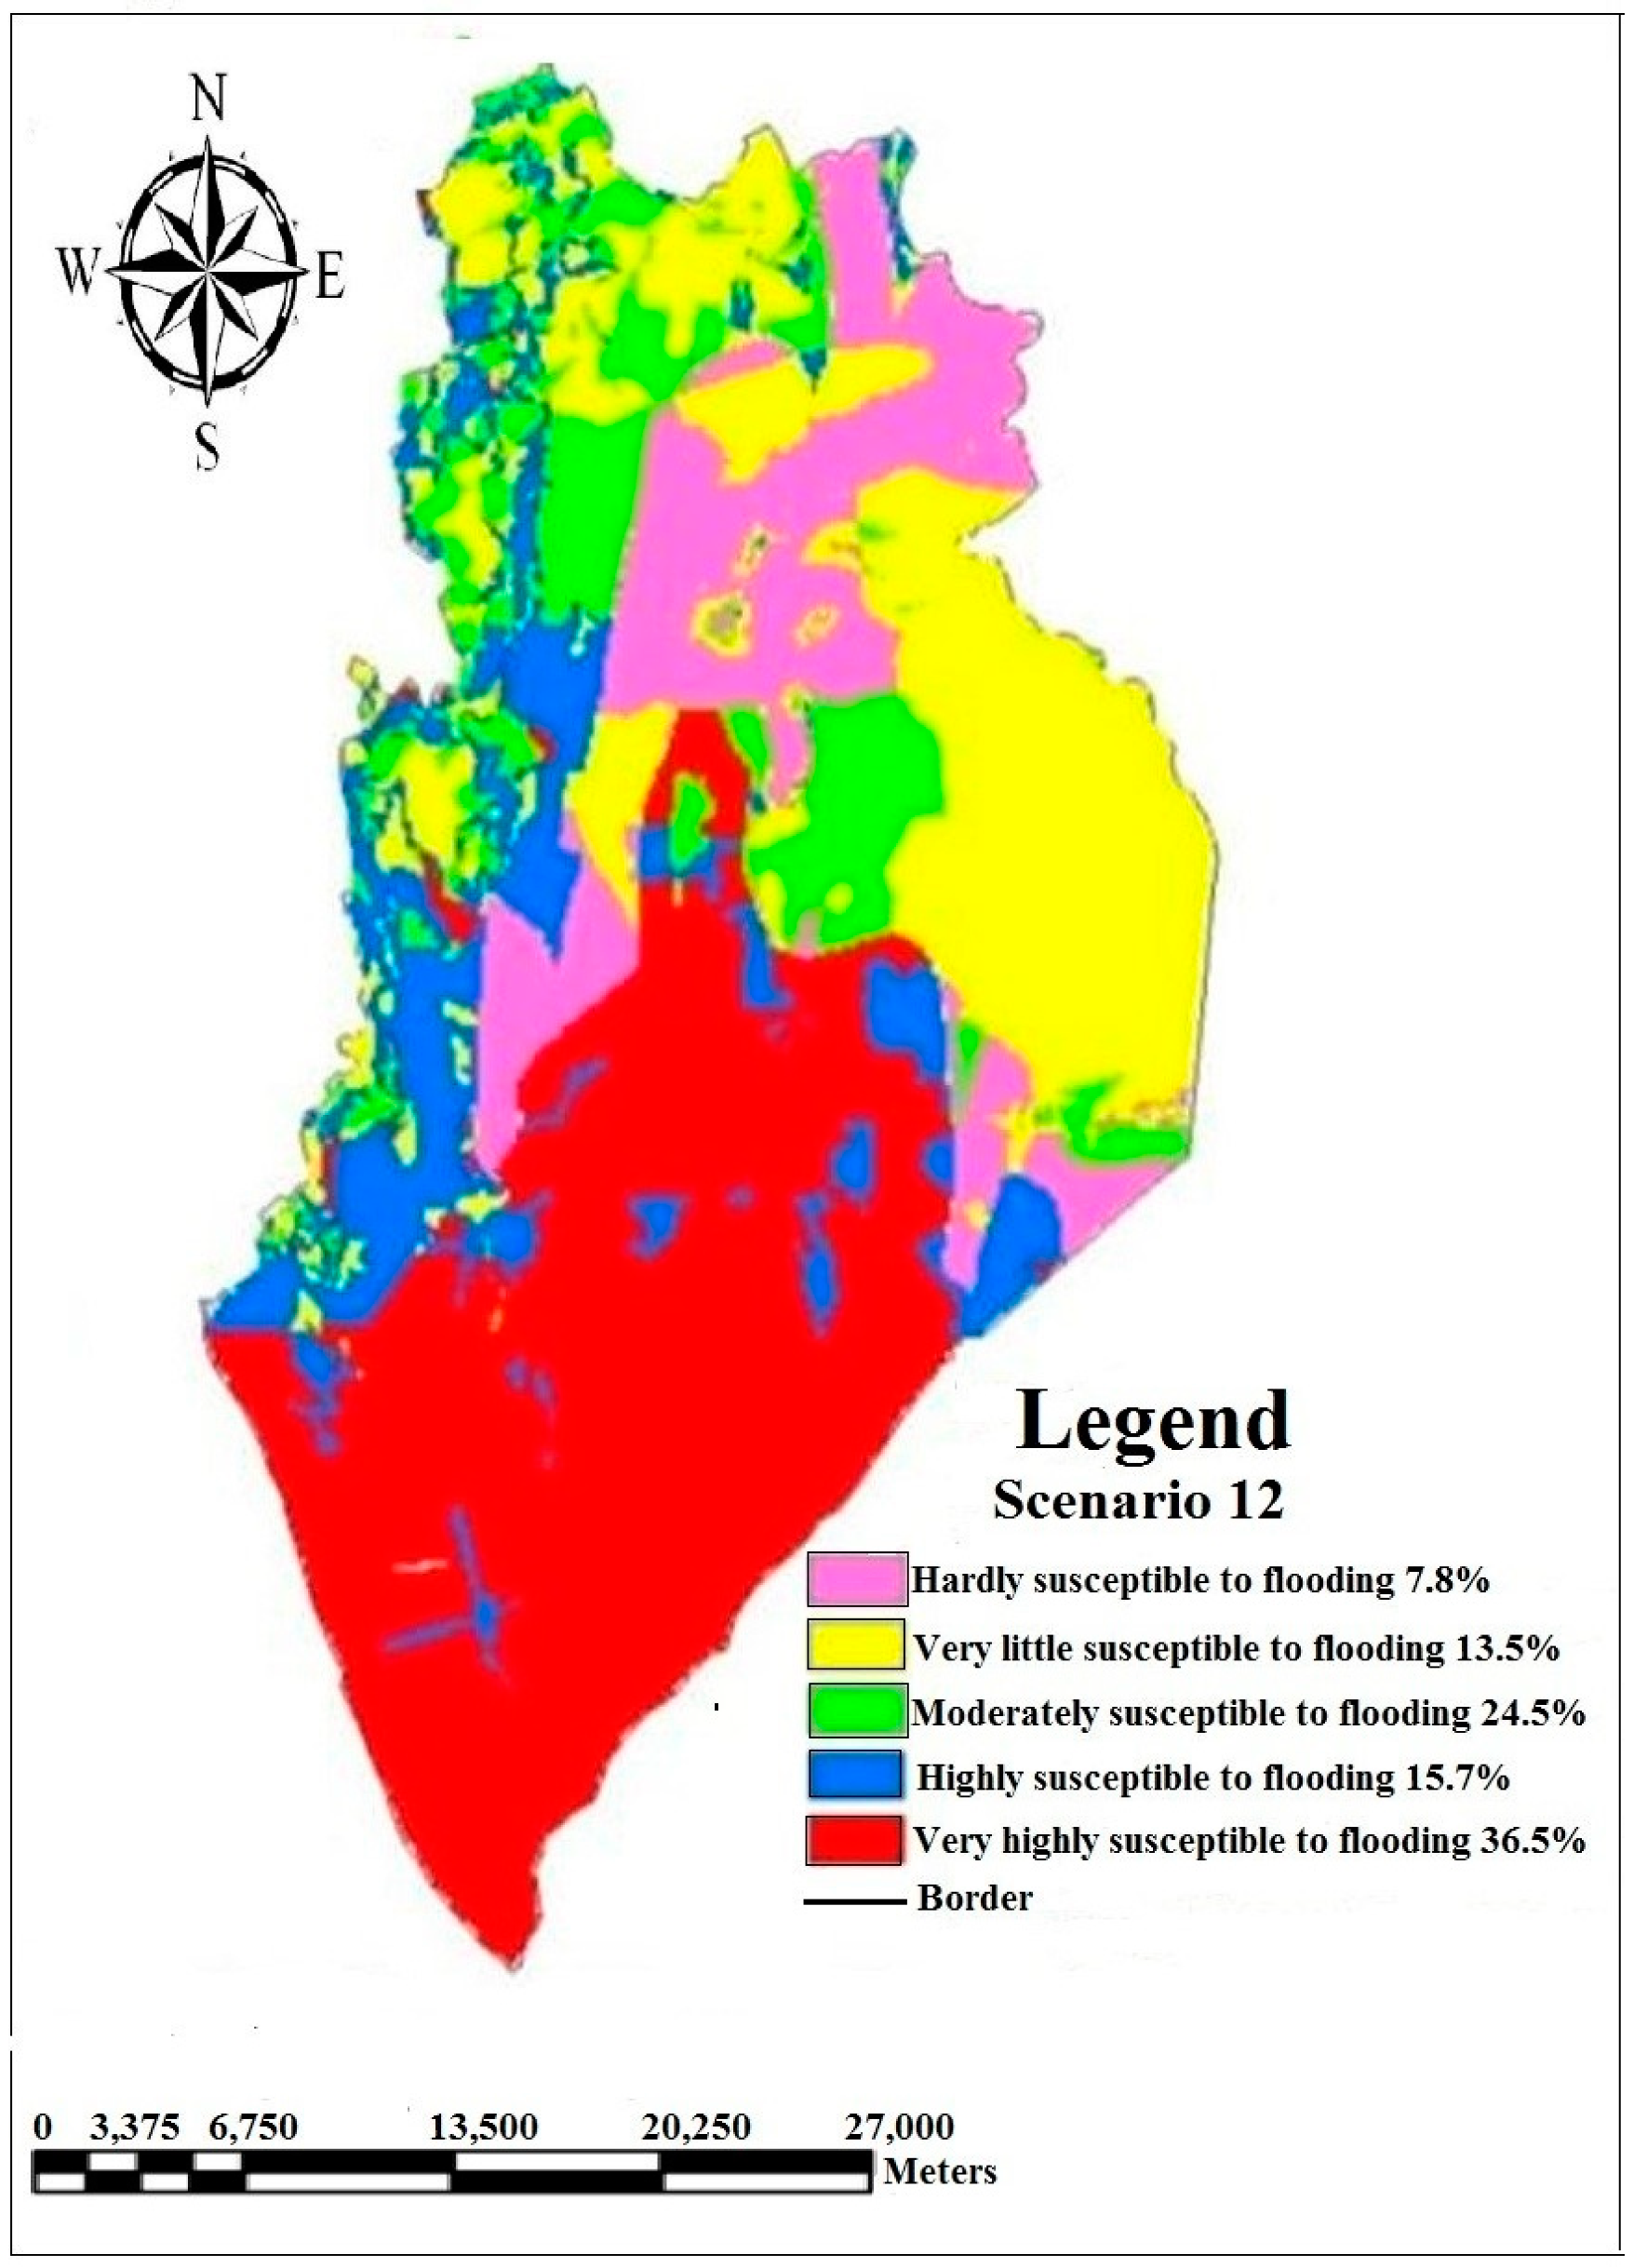
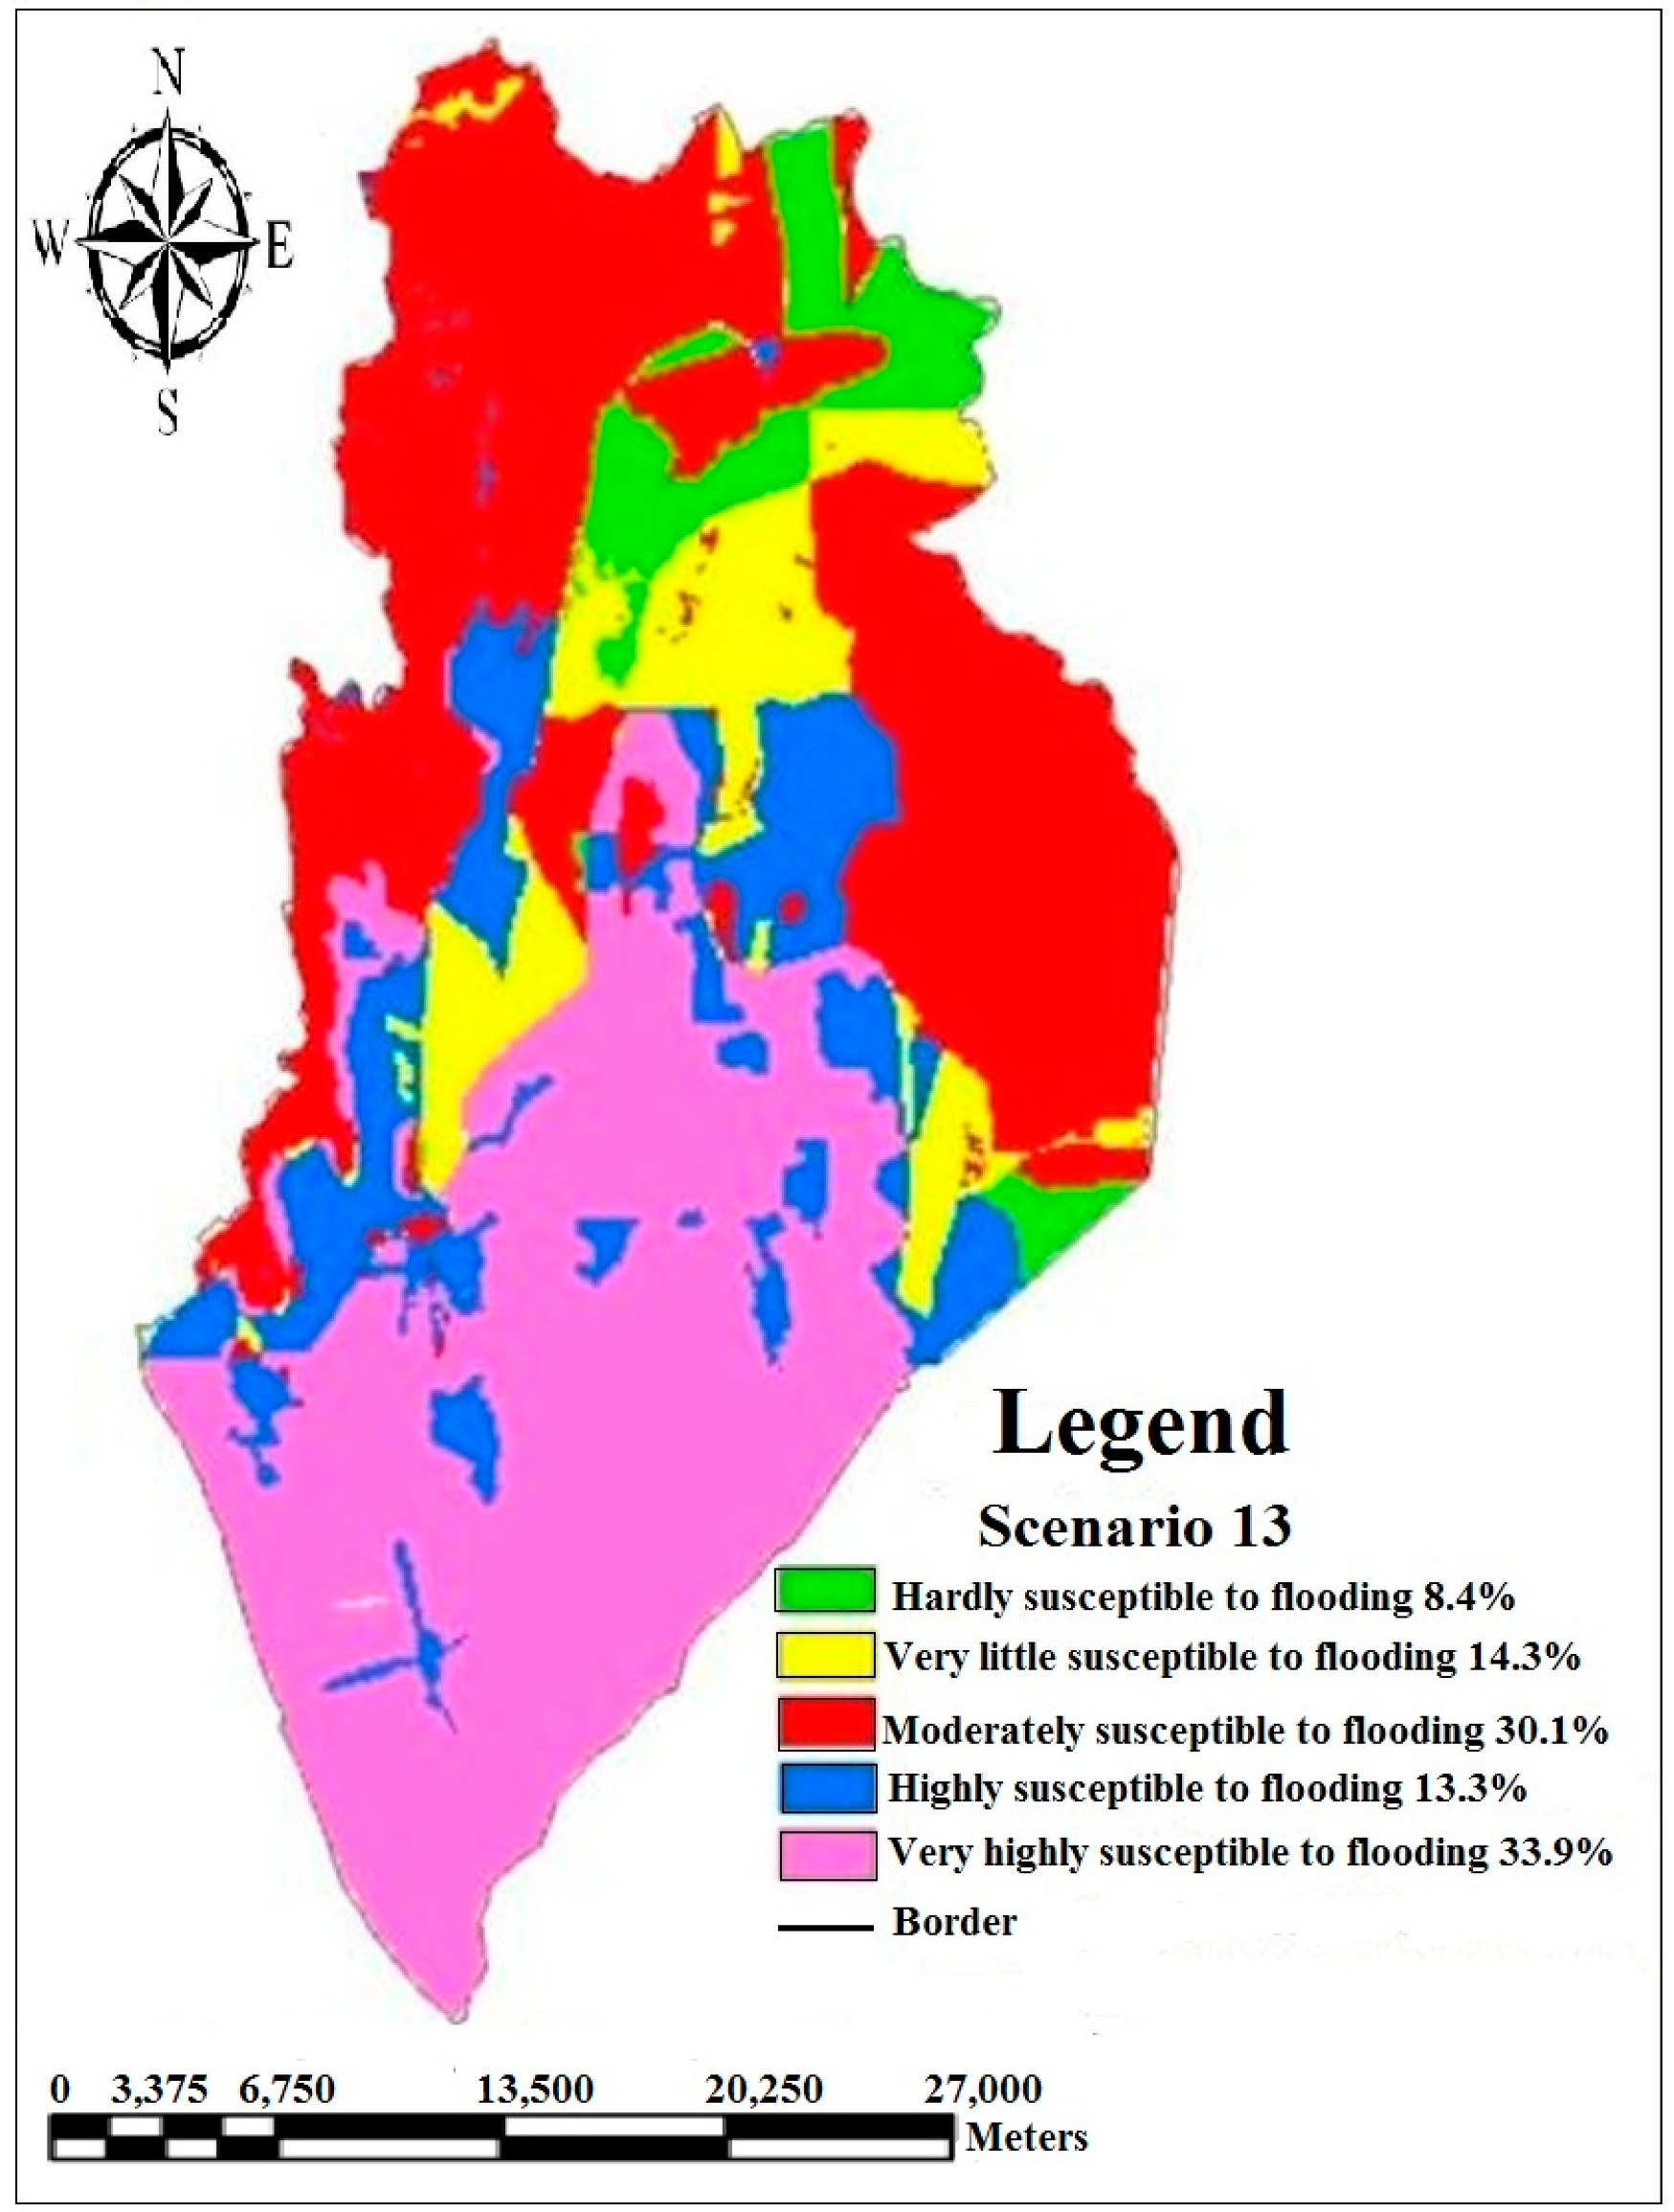
71]. In this study therefore, to test the robustness of spatial flood susceptibility model, one-at-a-time (OAT) sensitivity analysis was used by modifying the weights of each criterion. The OAT is the most common and simplest technique used in changing the weight of one criterion at a time in order to understand the effect of the change on the outputs. Thus, the weights were modified by running 22 scenarios of the flood susceptible zones. Different sets of values of the sub-criteria were systematically altered to explore their impacts on the overall weights, which were subsequently input into the GIS software to generate different flood susceptibility maps.
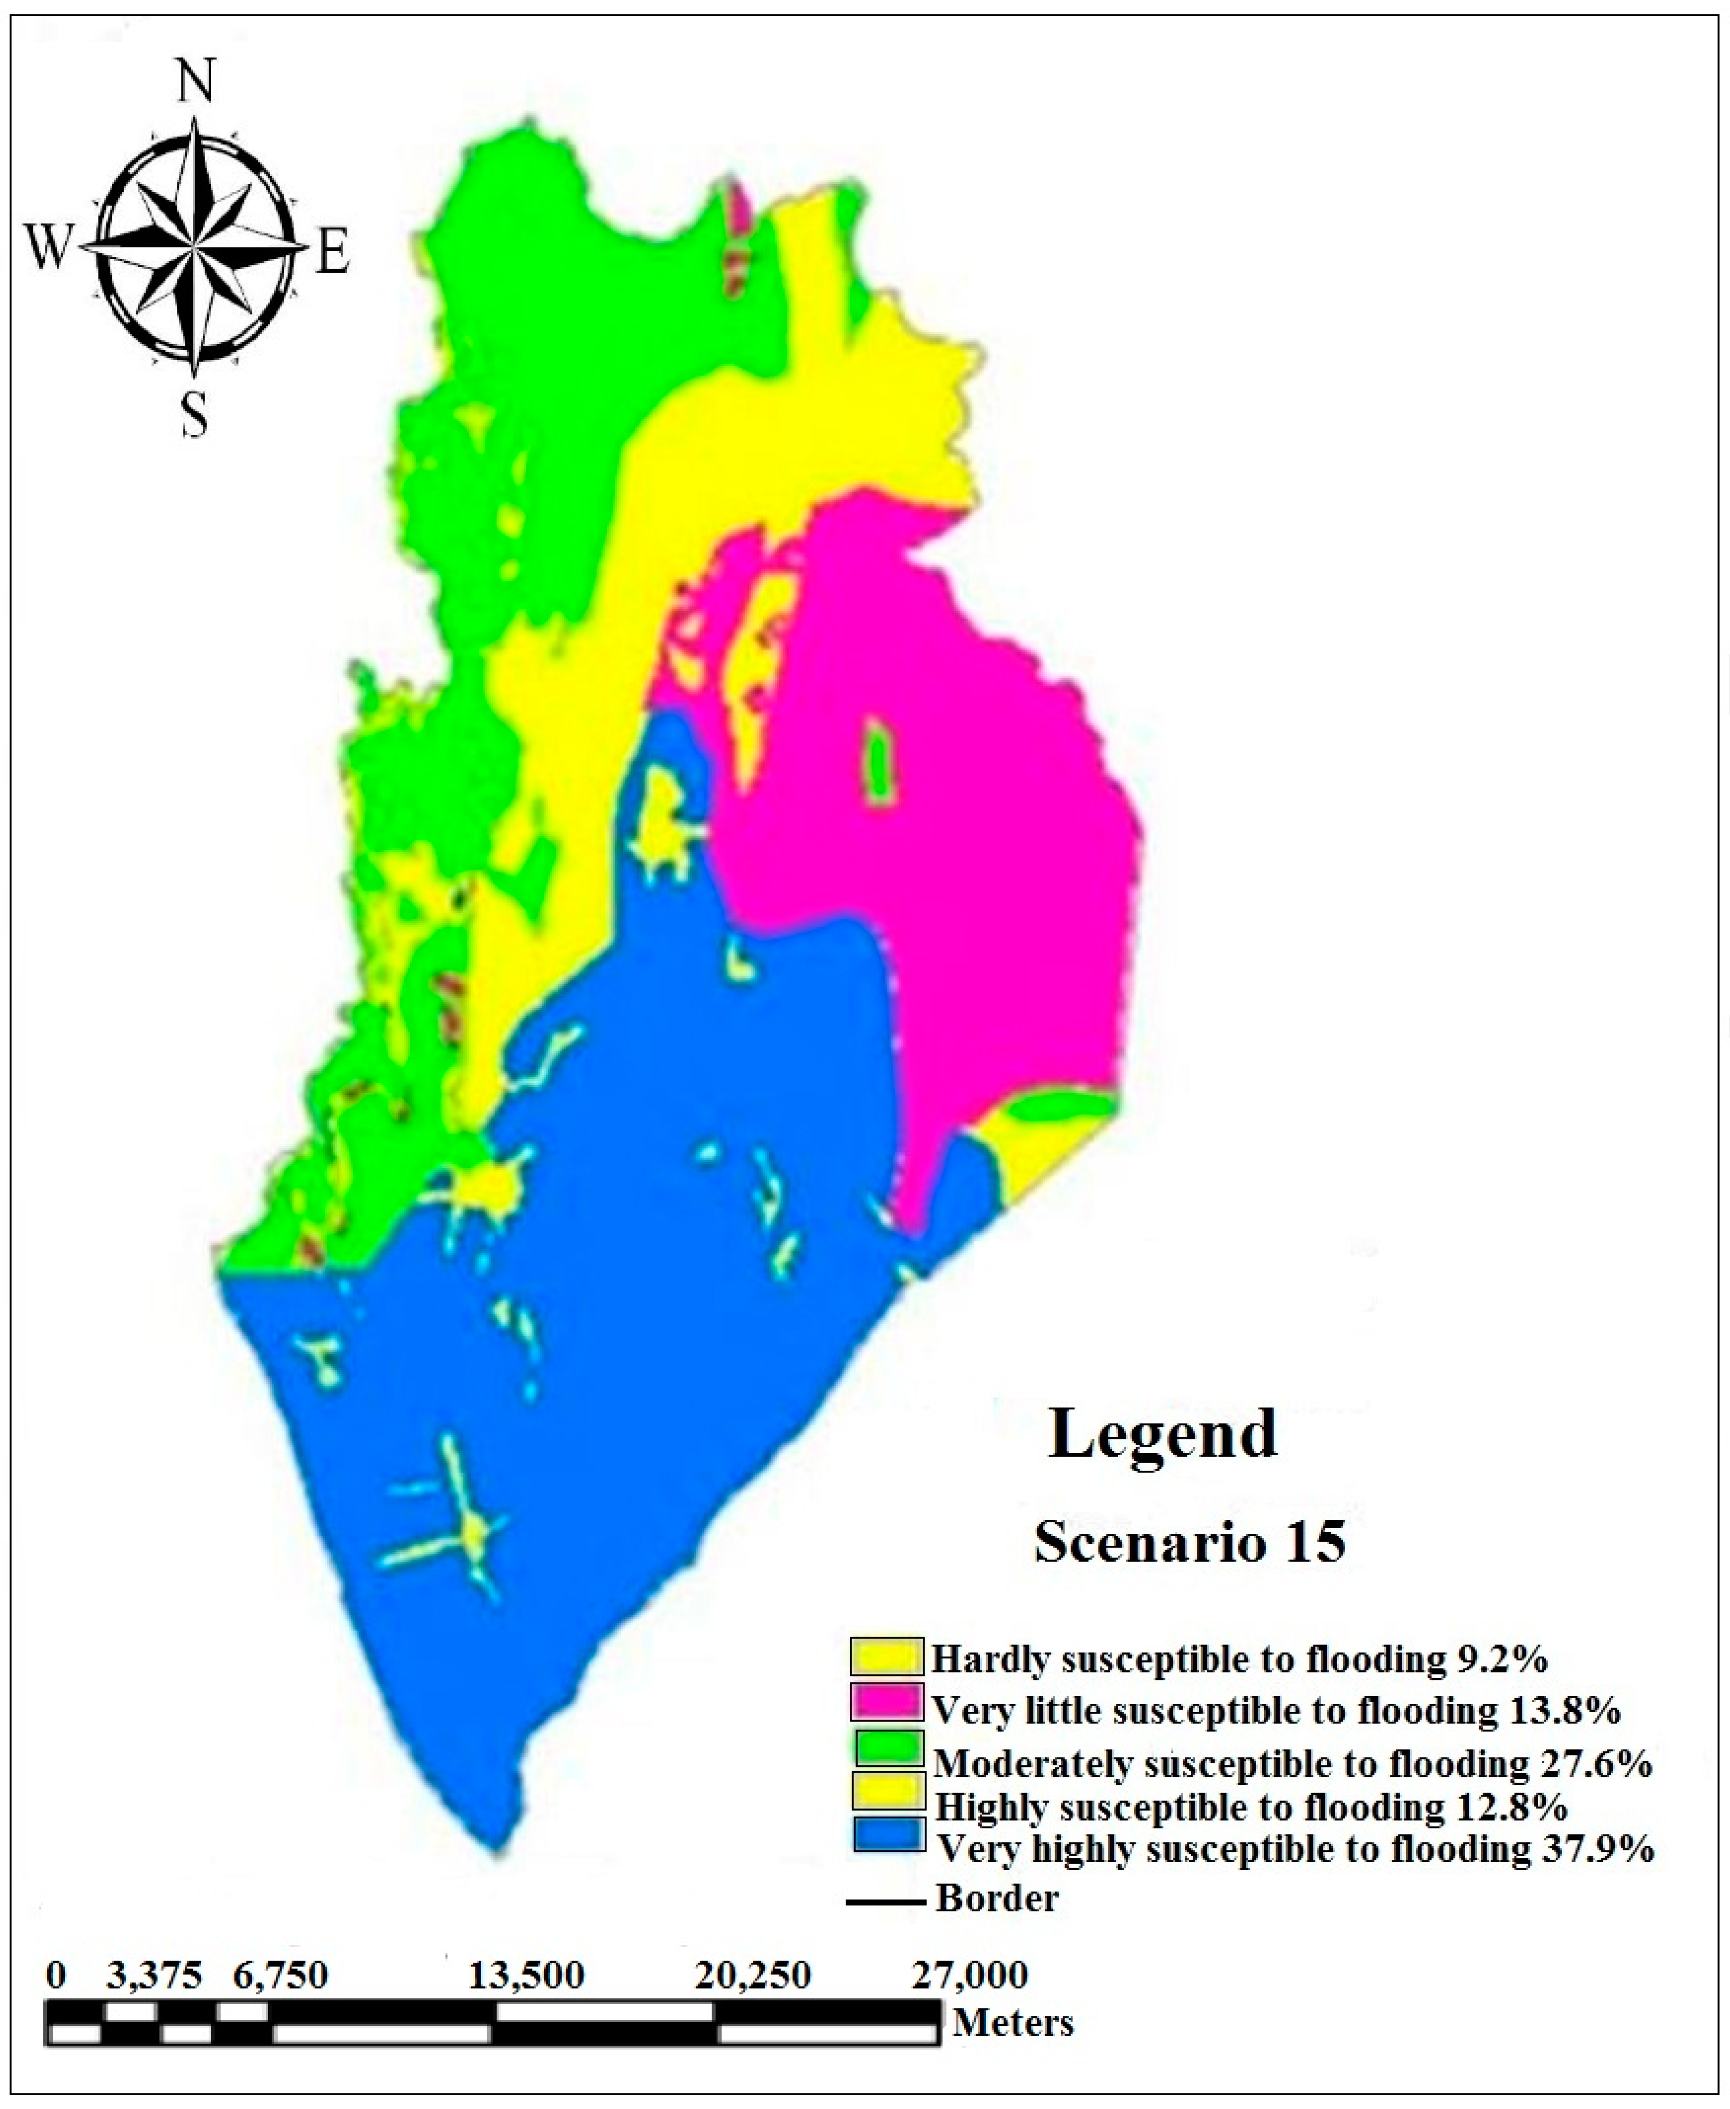
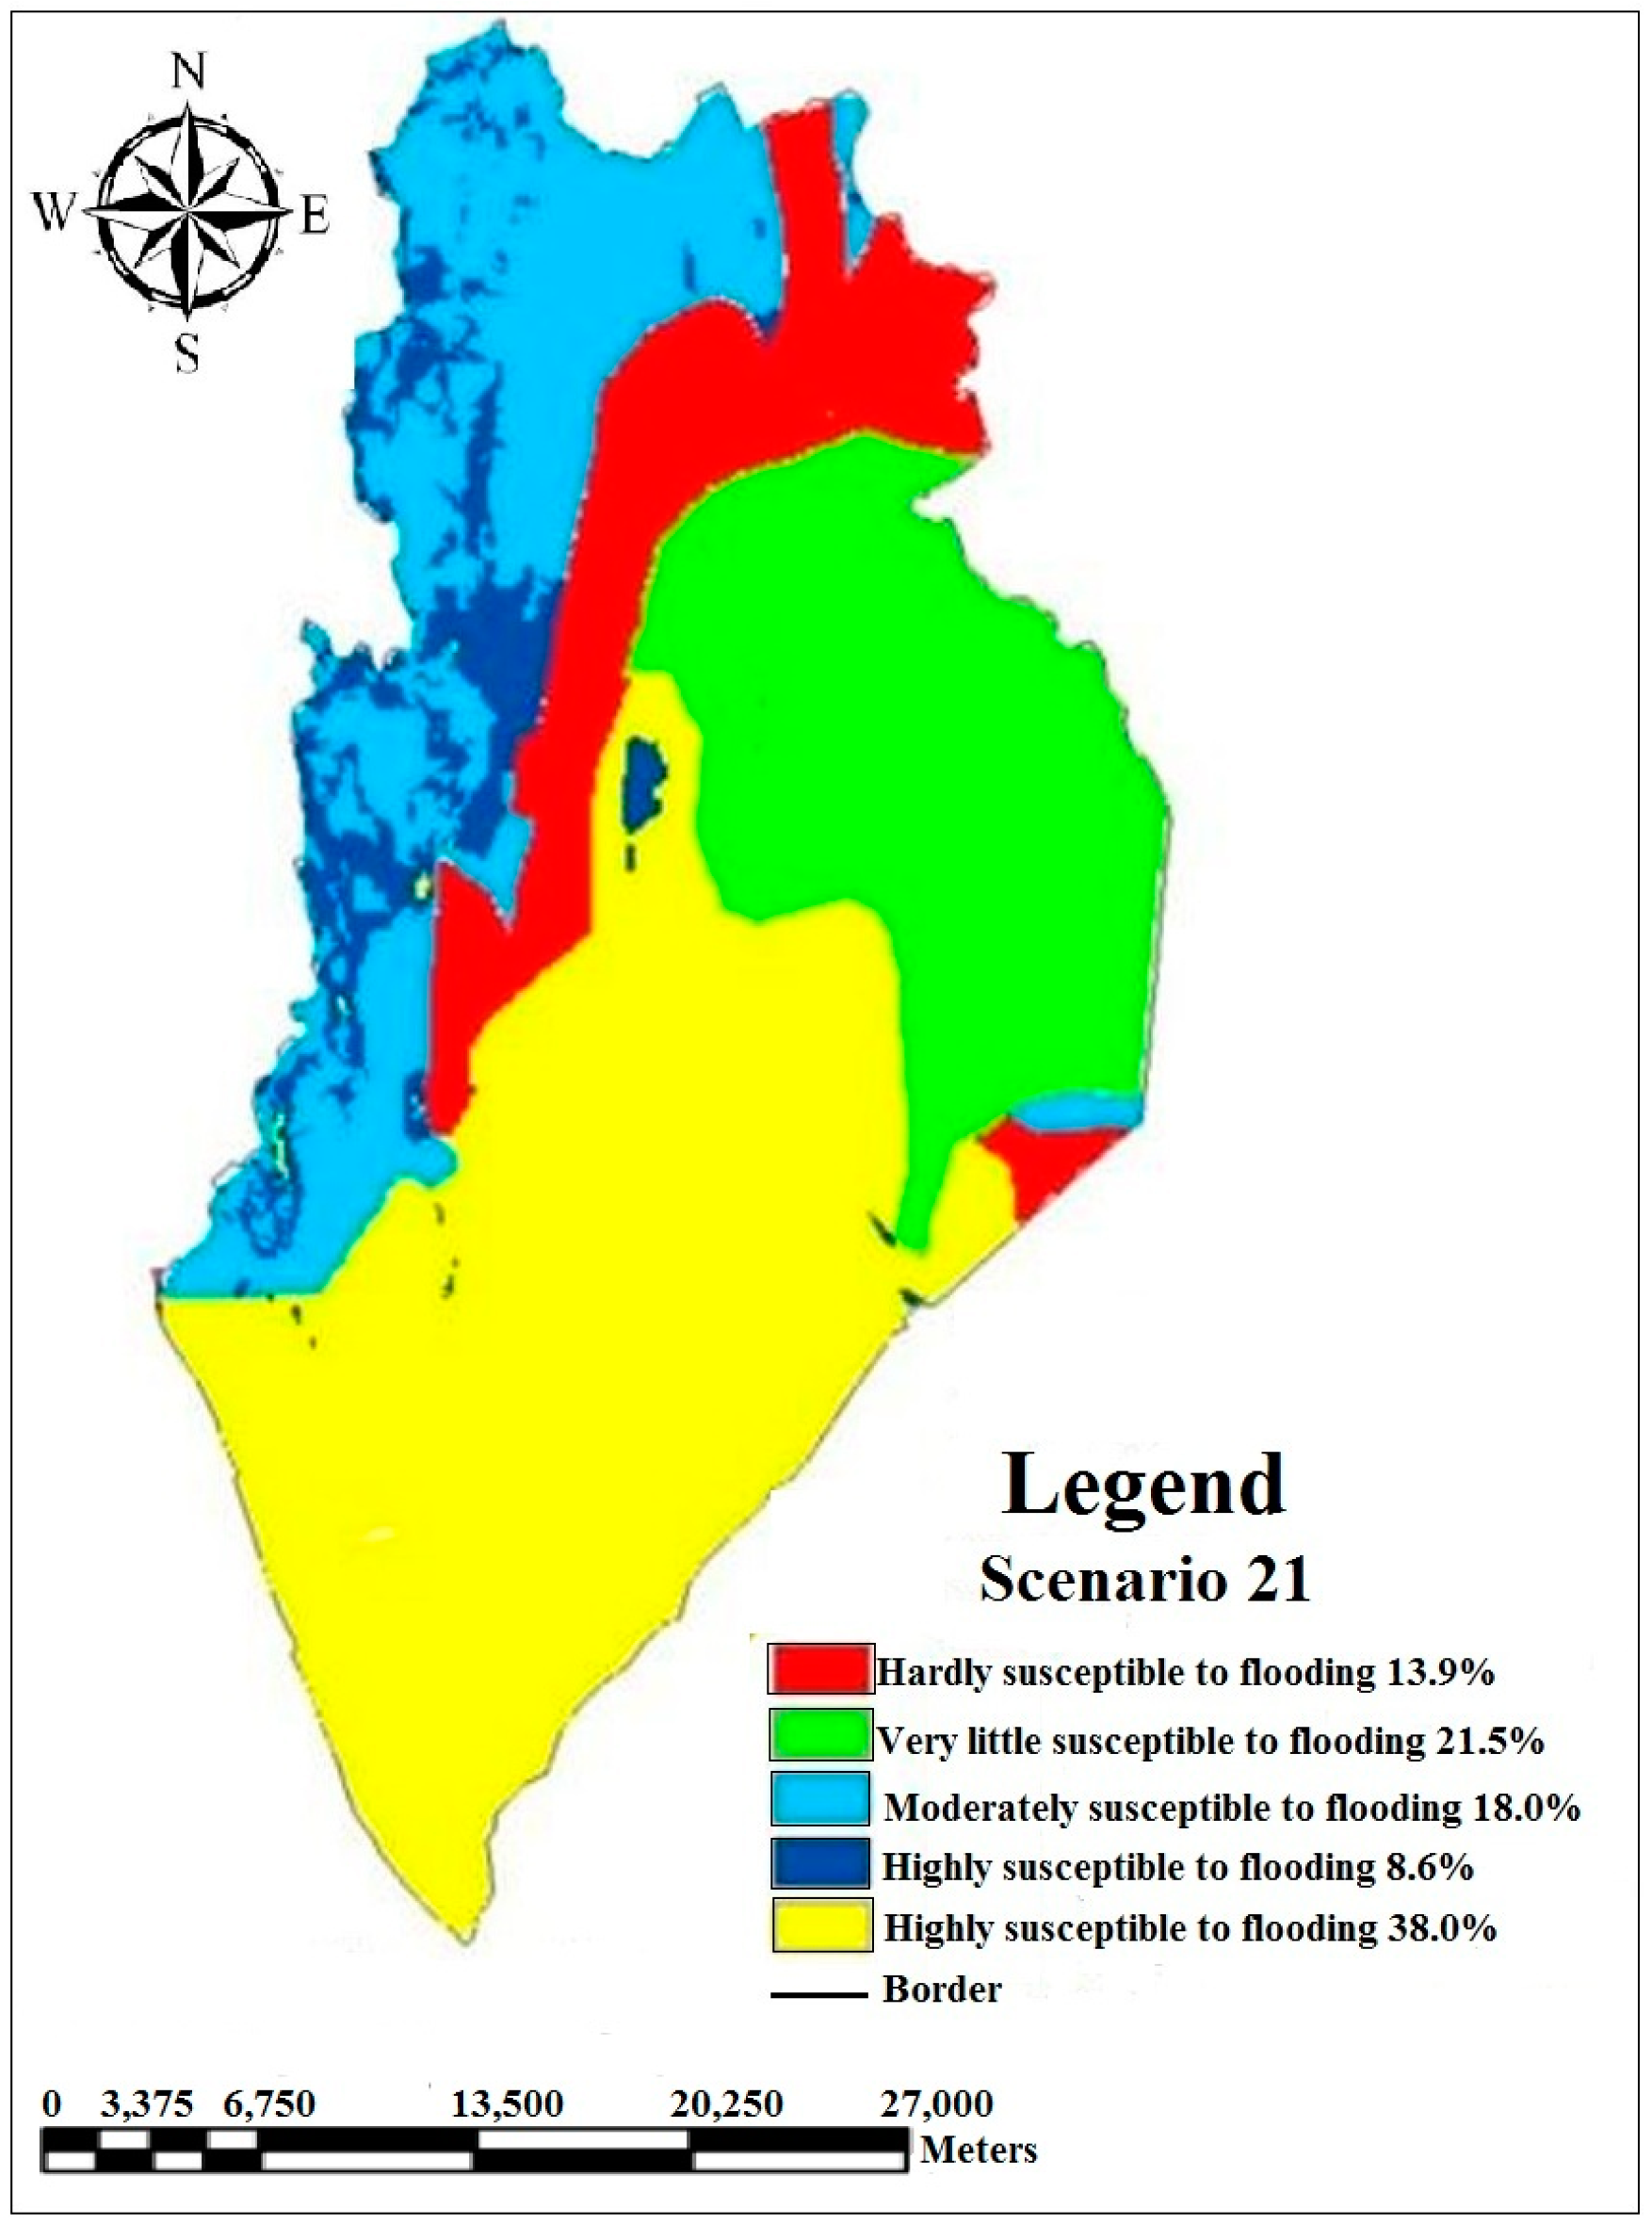
Based on the sensitivity analysis results, only six out of the total scenarios correspond with the developed spatial flood susceptibility map: alluvium, paddy fields, major rainfall, moderate rainfall, flat slope, and low humidity clay soil as demonstrated in the Scenario 1, Scenario 8, Scenario 12, Scenario 13, Scenario 15, and Scenario 21 respectively (Table 6). These scenarios were chosen based on their conformity with the original spatial flood forecasting model developed herein as shown in Appendix A Figure A1, Figure A2, Figure A3, Figure A4, Figure A5 and Figure A6. This is because they showed almost the same trend with the developed model. In summary, the modified scenarios verified the strength of the study’s spatial flood susceptibility model. The remaining 16 scenarios that show negative results are not presented here.
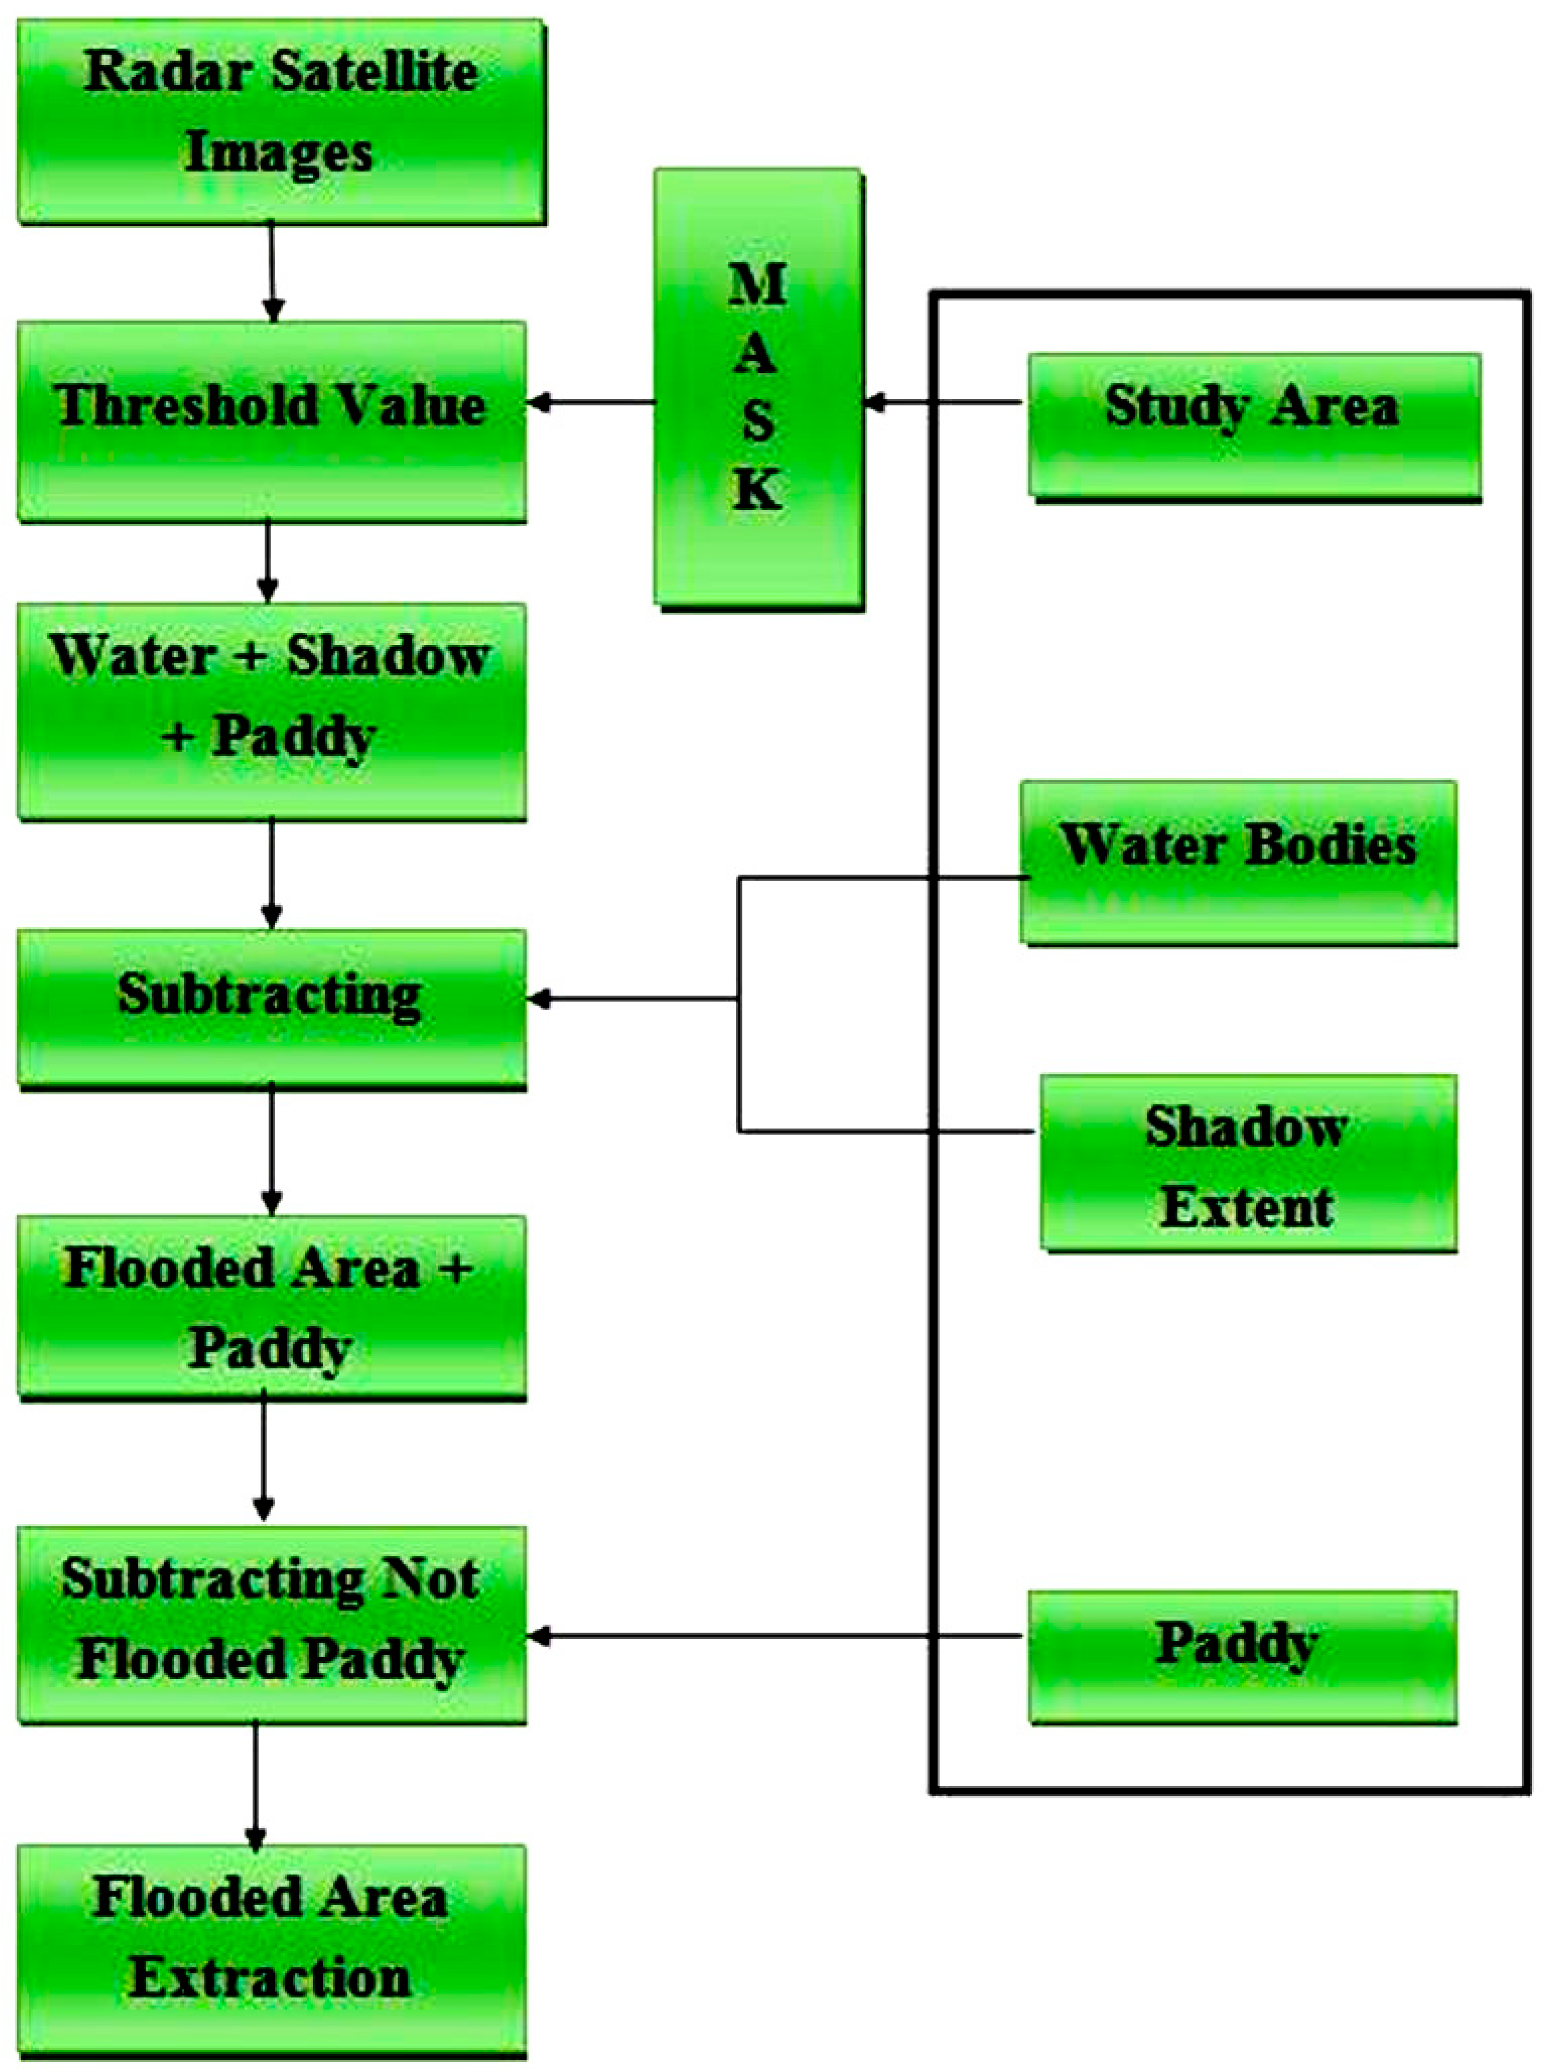
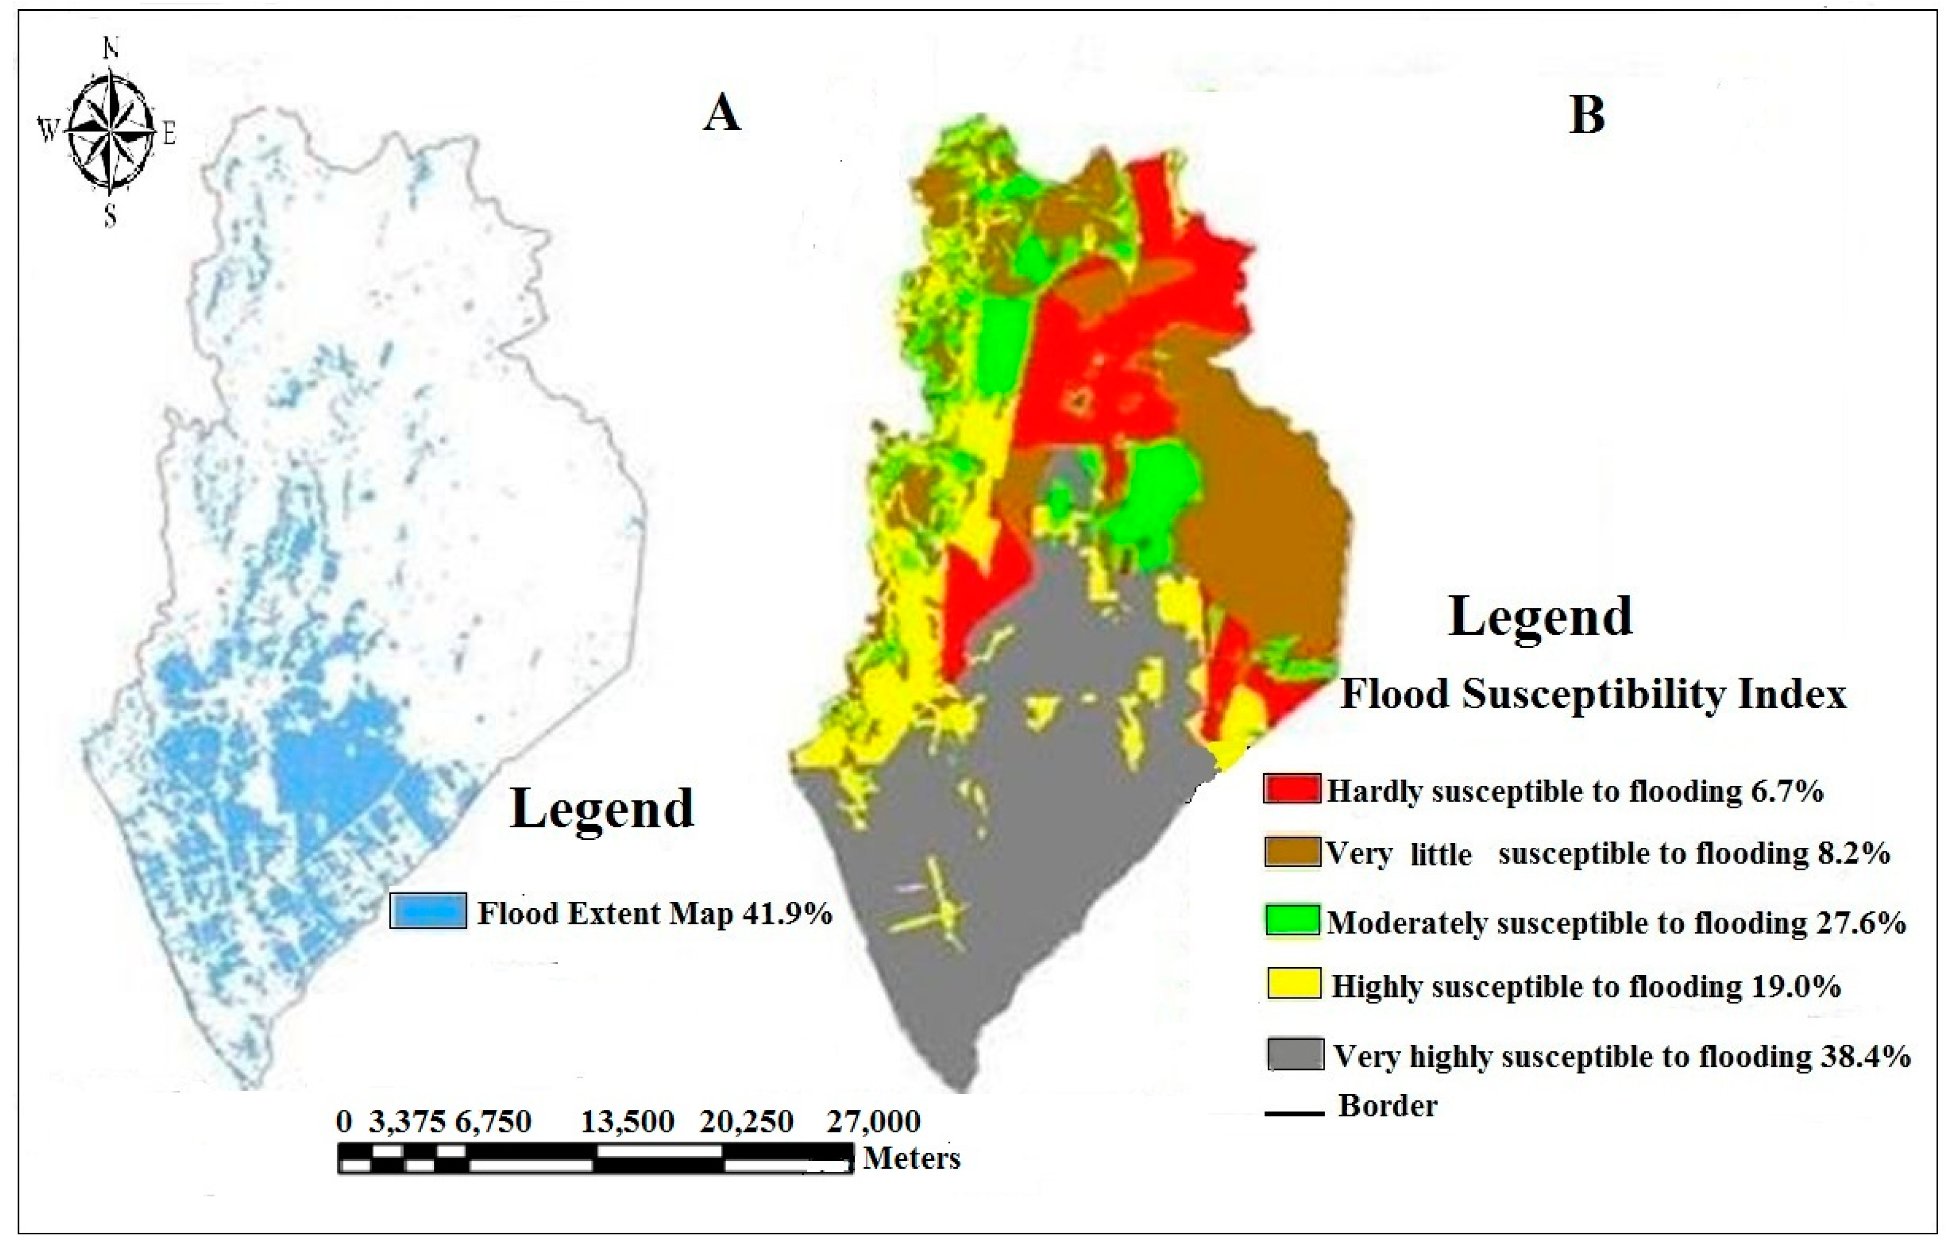
Similarly, reliability and validity analyses of the spatial flood forecasting model were carried out using two forms of validations namely: (i) superimposing the flood extent model over the spatial flood susceptibility model using GIS to determine matches between the flood extent information and the flood susceptibility model, (ii) comparing the flood susceptibility model with the spatial information of the study area such as the slope, land use, outcrops, and soil type data layers. In validating the spatial flood susceptibility model using real-life flood incident in the study area, radar satellite images of the November 2010 flooding were used. 
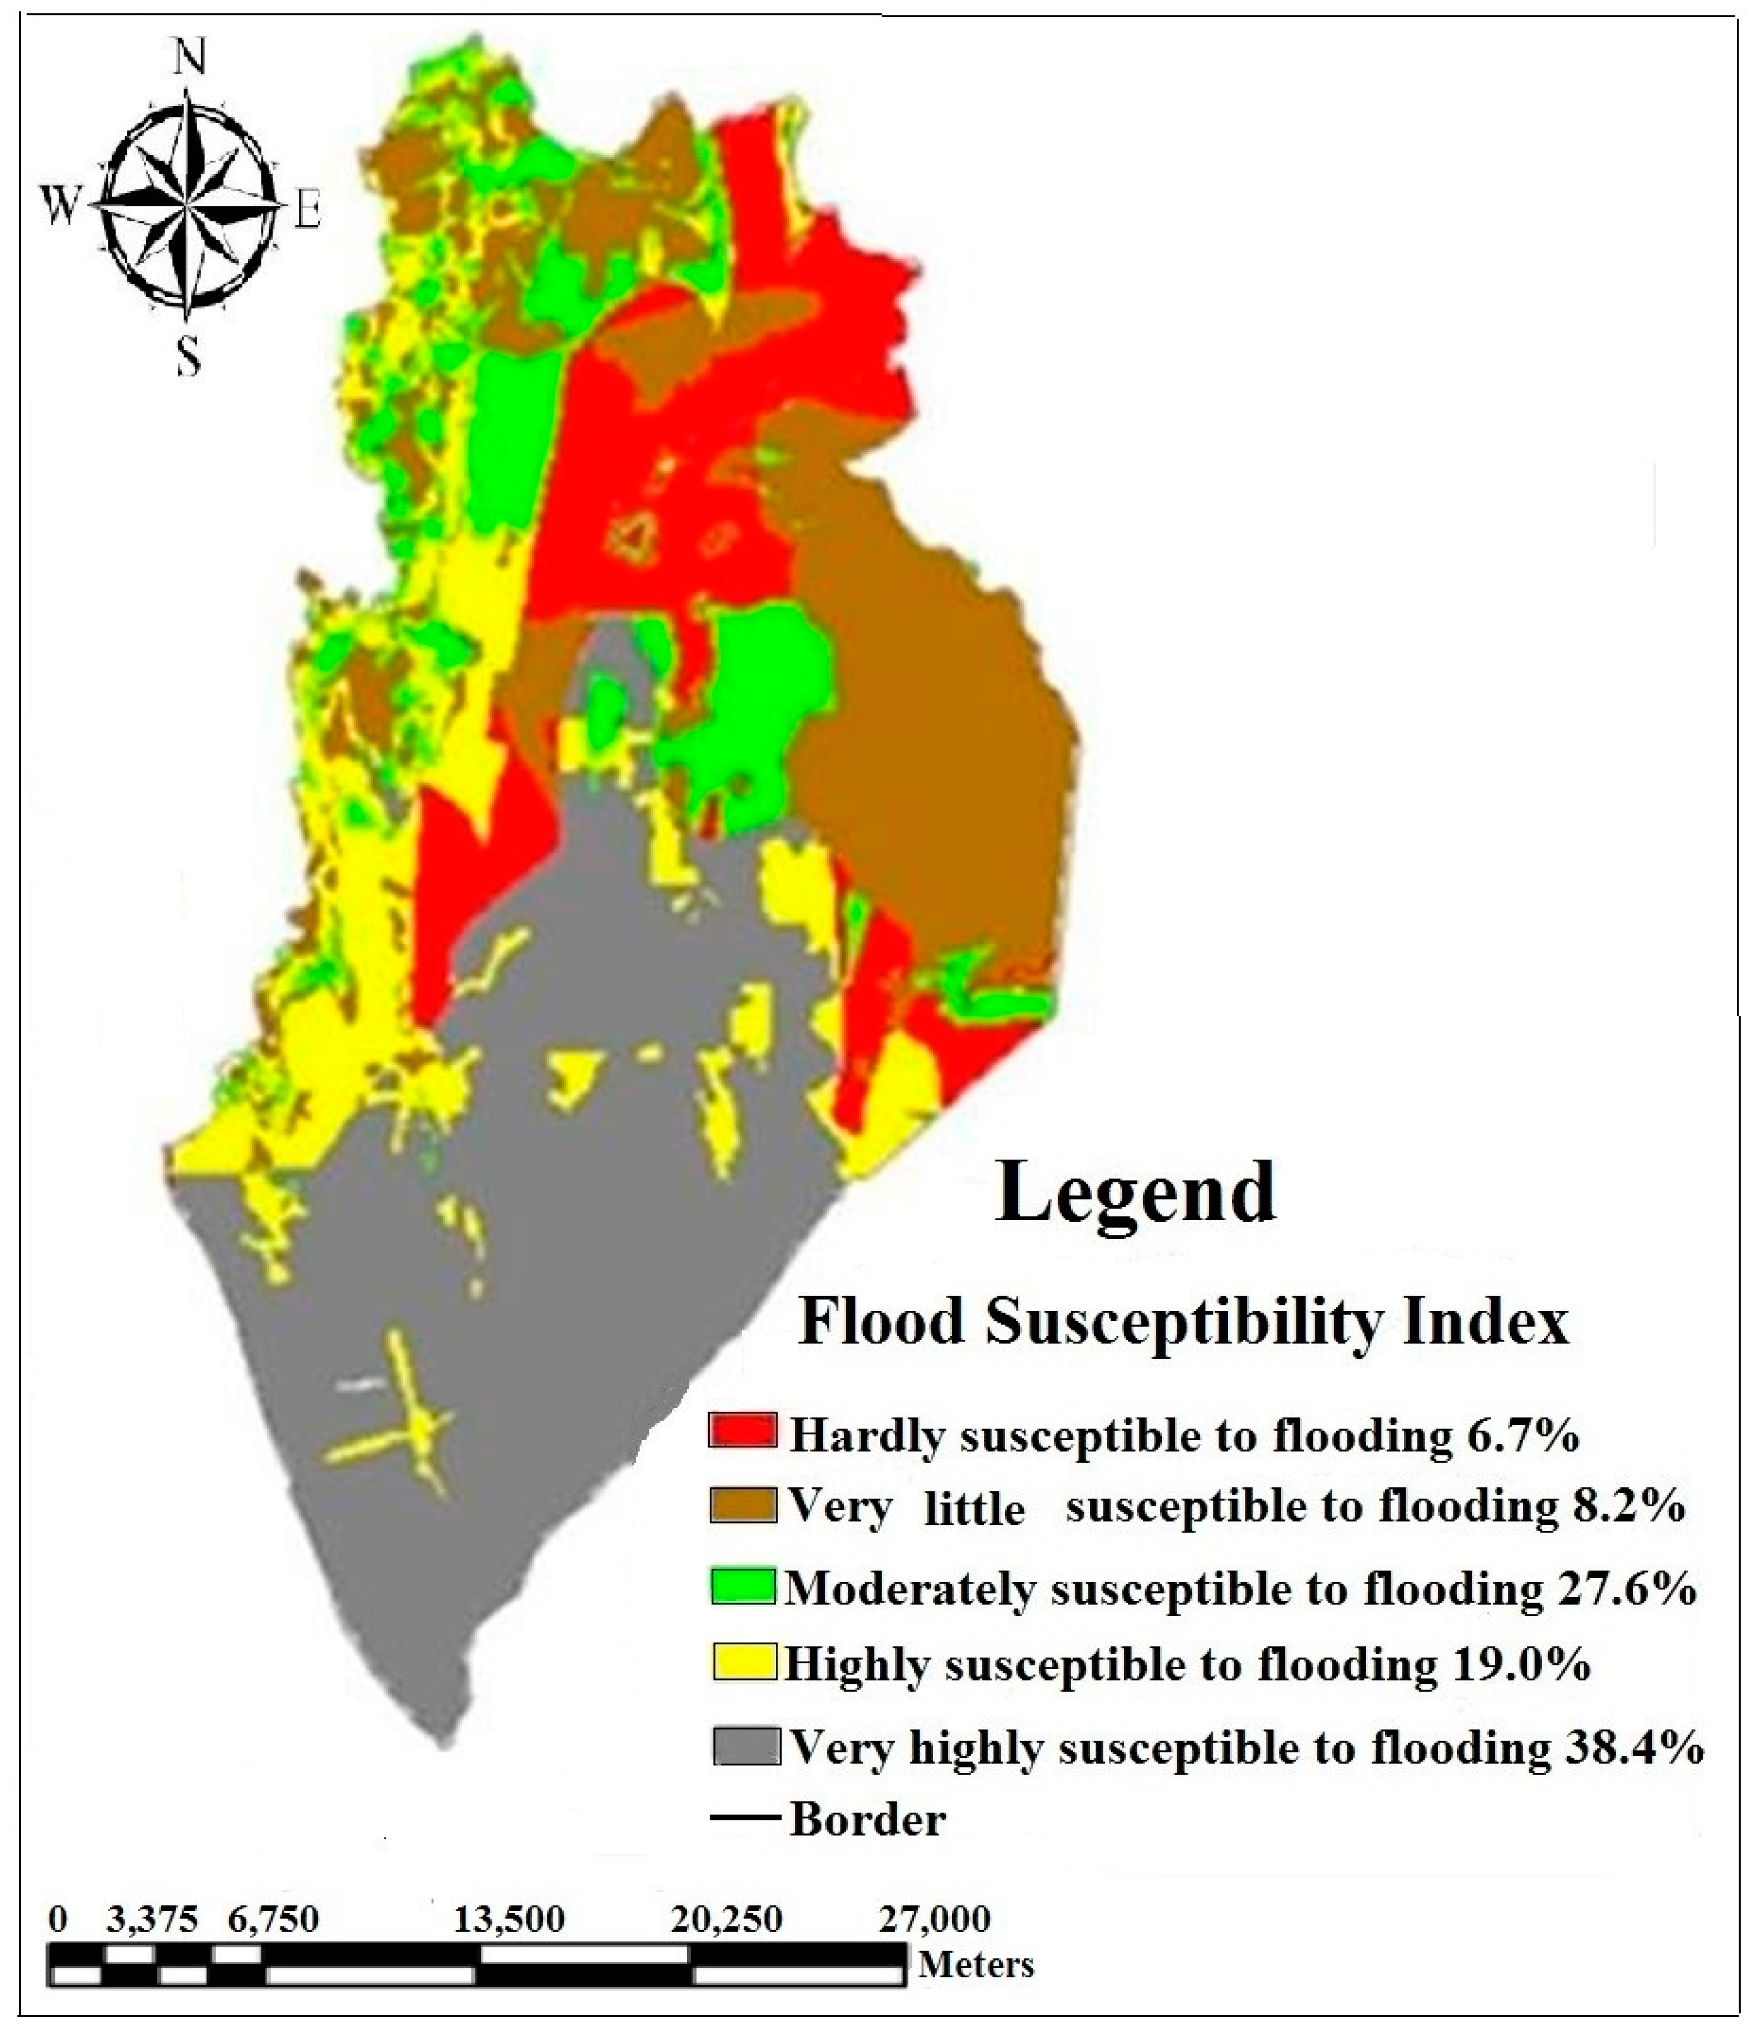
Figure 7 illustrates the side by side views of the spatial flood susceptibility model and the flood extent model developed based on the real-life flood incident of the study area. From the comparison of these images in Figure 7A,B, it is observed that the flooded areas were found to be scattered over the areas forecasted to be very highly and highly susceptible to flooding. Similarly, 
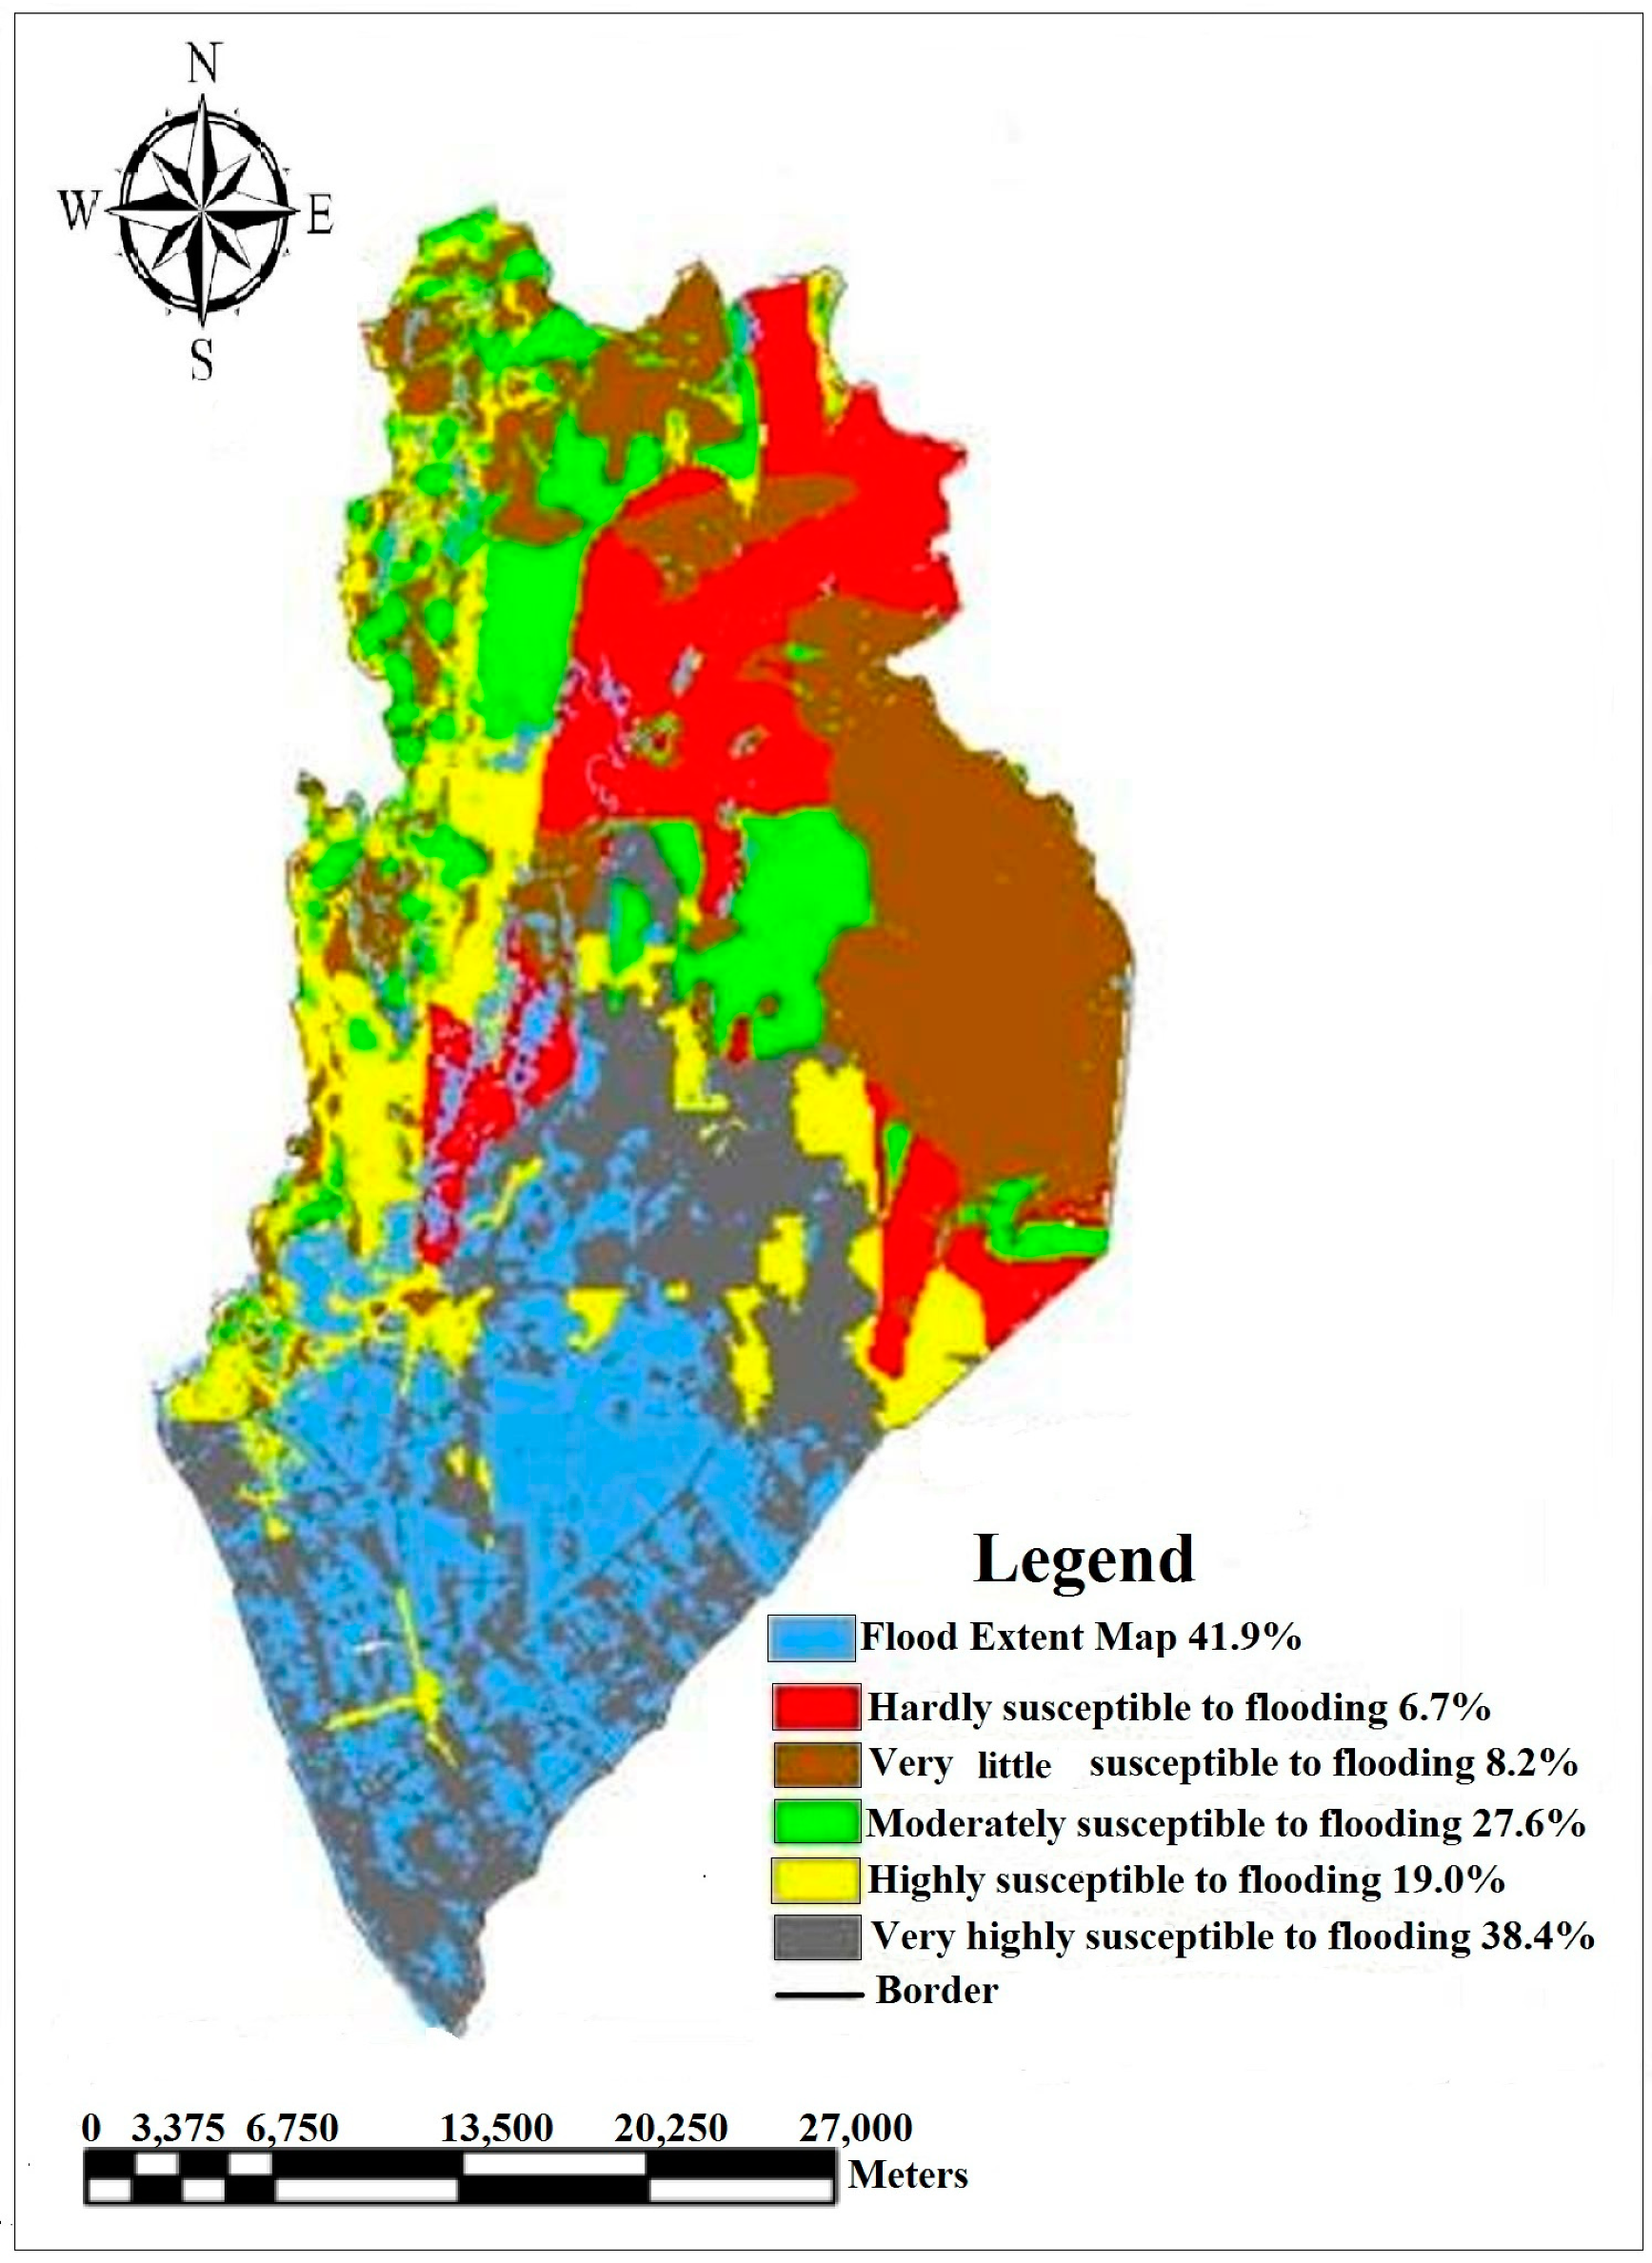
Figure 7A was superimposed over Figure 7B to observe the relationship between the two as shown in Figure 8. Table 7 presents the susceptibility levels of the spatial flood susceptibility model as well as the magnitude of the flood extent model.
An analysis of the superimposed image indicates that 38.4% (30,924.6 ha) of the flooded areas are dispersed over the areas identified as very highly susceptible to flooding and 19.0% (15,341 ha) in highly susceptible to flooding (Figure 8). Therefore, this shows a significant match between the spatial ANP flood susceptibility model with the real-life flood extent model of the study area.
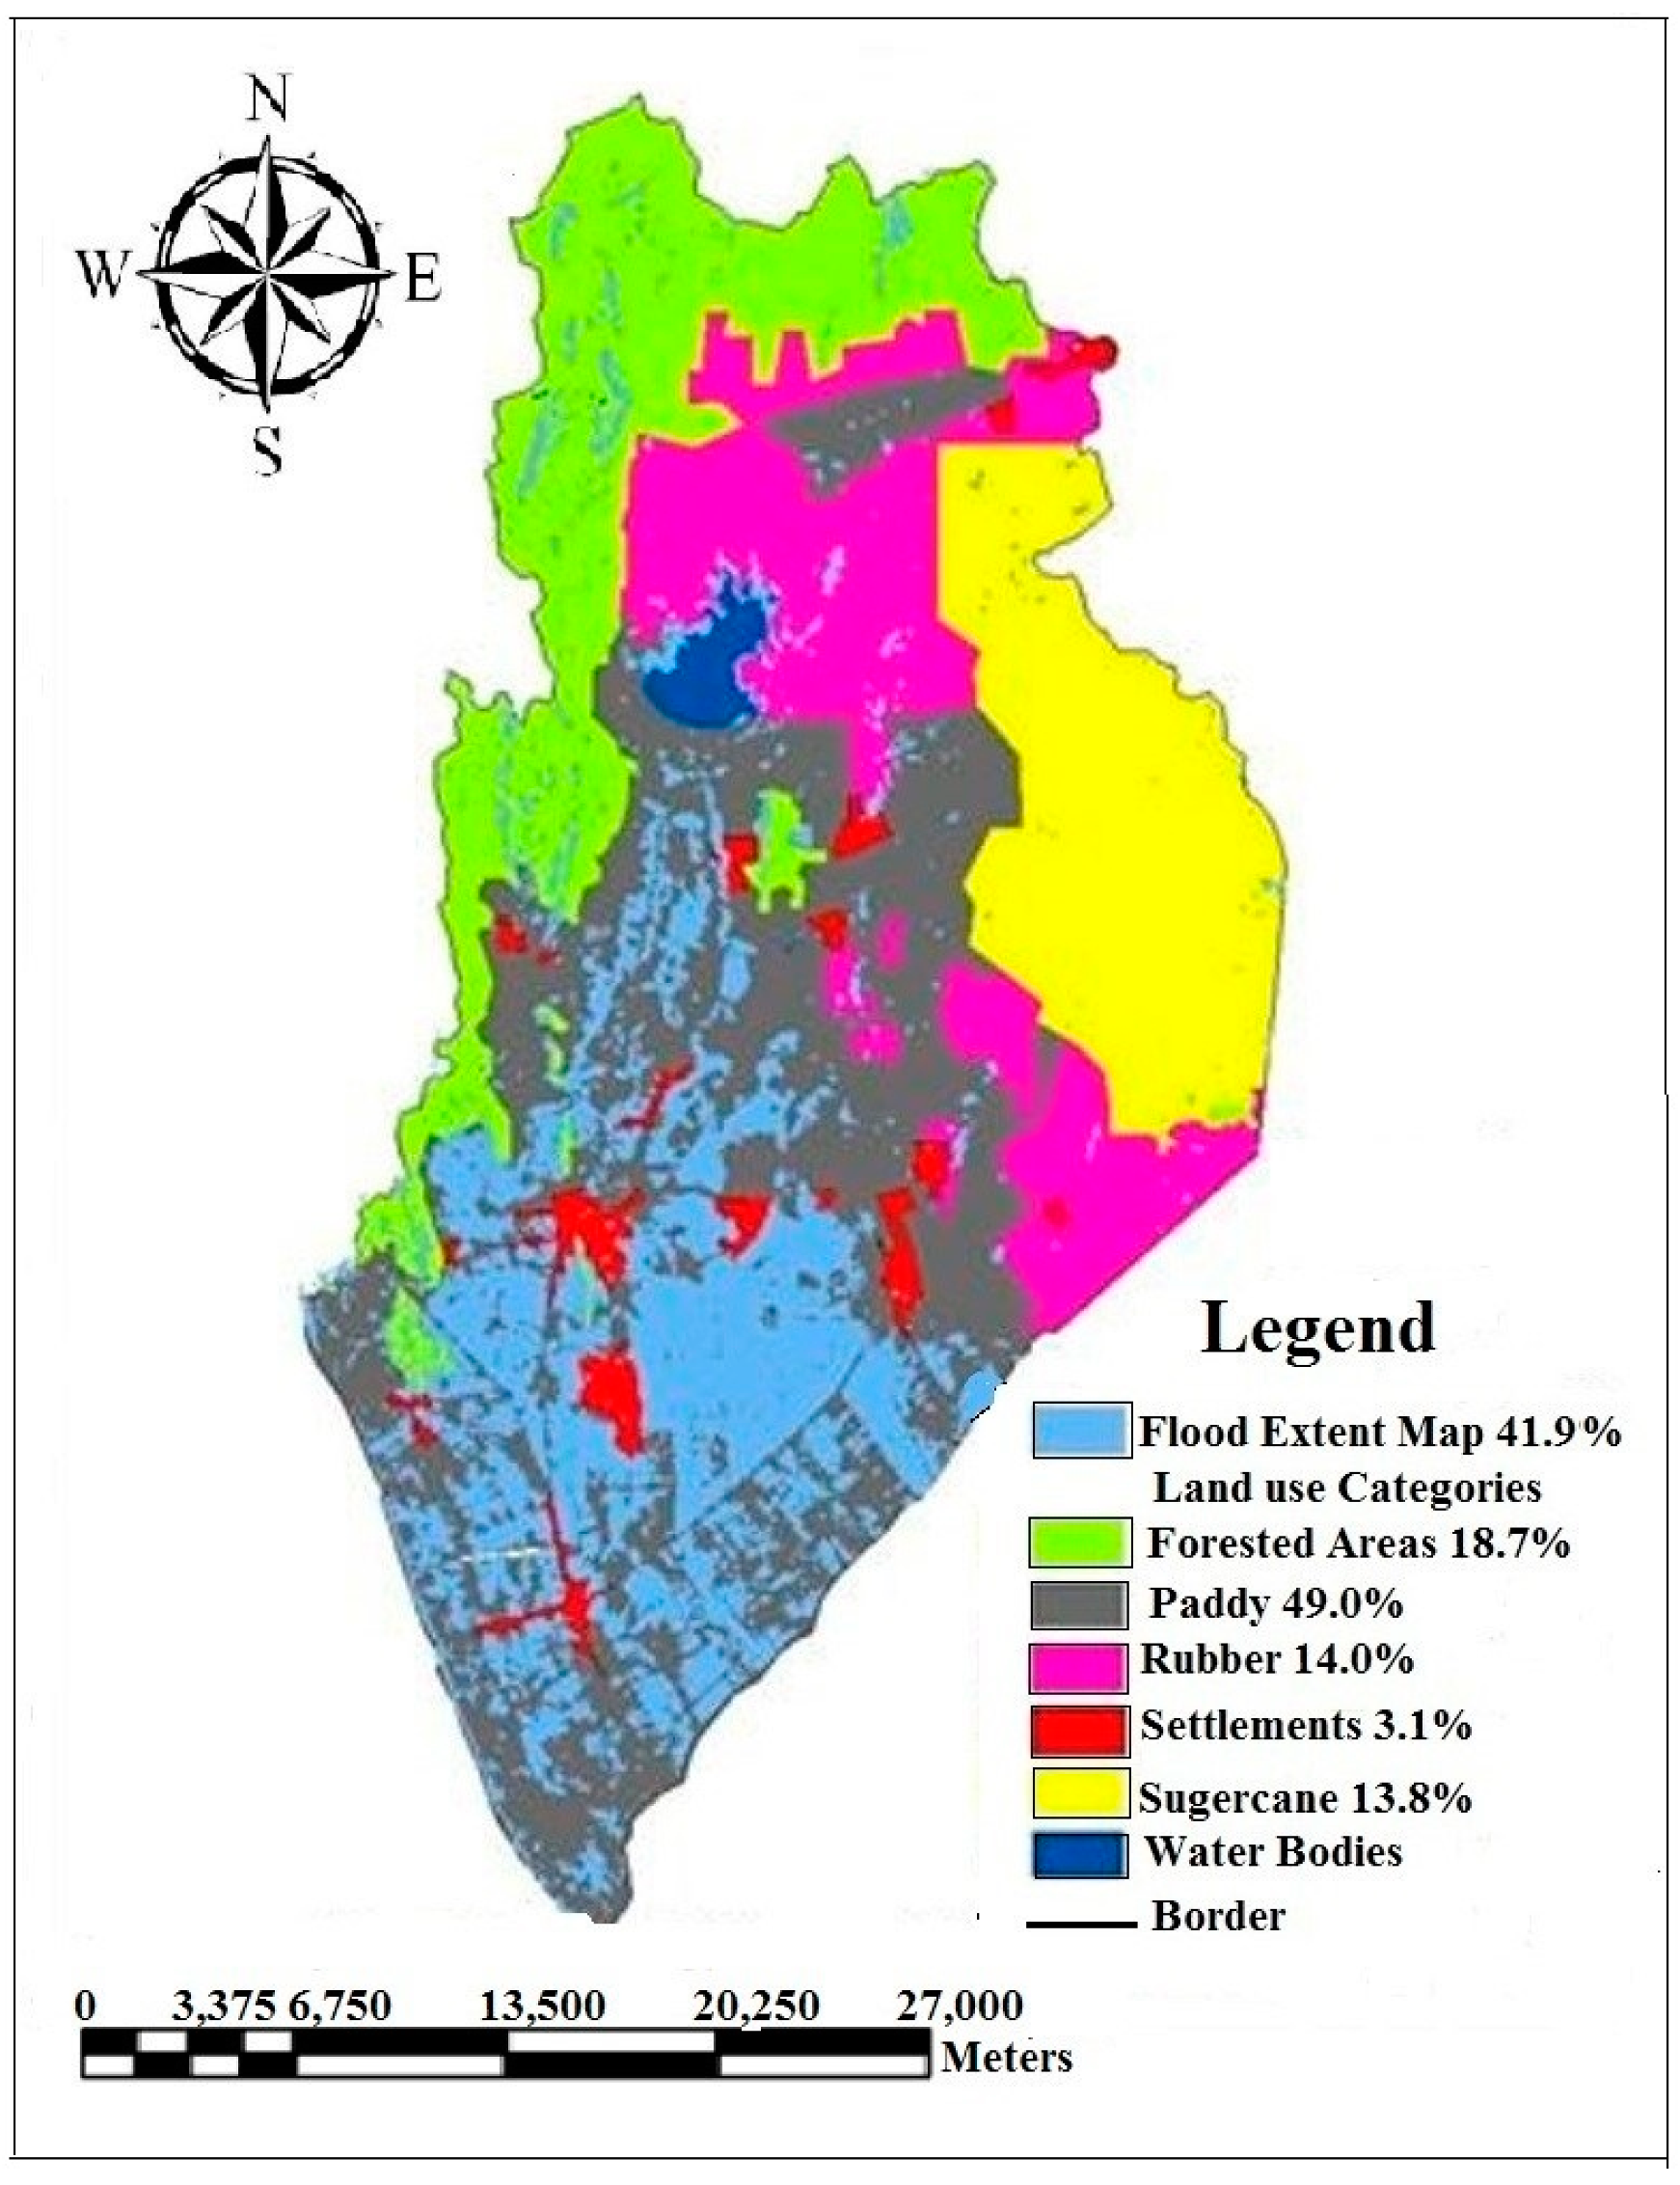
Moreover, the spatial information obtained were also used as the second form of validation in this study. Alluvium deposit, paddy fields, flat slope, and low humidity clay soil data layers were as well used in validating the spatial flood susceptibility model in this study. This was done by superimposing the flood extent model with the spatial information of the study area. Figure 9 shows the major flooded areas were found to be in the major paddy fields areas, represented in dark-grey color, which formed 49% (39,863 ha) of the total study area (Table 8).
Therefore, this study’s findings indicate that the area is characterized by paddy fields overburdened by clay, which is impervious; hence, the percentage of permeation of rainfall in the study area will be very low thus increasing its susceptibility to flooding. Similarly, regarding the geology, flat slope, and low humidity clay soil of the area, which cannot be changed, it implies that the area might have to live with flood incidences. This further explains the reason why the flood susceptibility of each accounts for 34.1% (alluvium), 49% (paddy fields), 83.0% (flat slope), and 40.7% (low humidity clay soil) respectively.

7. Conclusions and Recommendations

This study has successfully produced a detailed flood susceptibility map of Perlis. Flood influencing factors were ranked using integrated ANP and geospatial technologies. Different scenarios were simulated and used in assessing the robustness of the flood susceptibility model. Scenarios that corresponded with the model were identified (Appendix A: Figure A1, Figure A2, Figure A3, Figure A4, Figure A5 and Figure A6). The findings of the study indicate that the southern part of the study area is the most vulnerable to flooding as shown in Figure 9. This part contains substantial amount of alluvium deposits, paddy fields with clays, and a flat surface, which trigger flooding. Thus, the developed flood susceptibility map can be used to offer a long-term early warning information on areas that are likely to be affected by flood disaster to enhance disaster preparedness and mitigation. Therefore, the local planning authority should collaborate with all stakeholders, including department of health, agriculture, the disaster management unit, and the civil societies to enlighten the public about areas that are highly susceptible to flooding. The flood susceptibility map can serve as a current and reliable source of flood information for the study area that delineates all flood vulnerable zones, and therefore should be utilized in updating the current land use policies of the area as well as the existing policies guiding natural hazards emergency management to avoid future damages. Moreover, to ensure that the flood susceptibility map remains up to date, the planning authority should establish a five-year period to review and update the flood susceptibility map [72]. This is by revisiting the flood study to ensure that the developed model and calibrated data remain up to data and useful.
Also, the flood susceptibility model could serve as a valuable reference material for future studies and stimulate more interest in the integration of GIS-based ANP and RS techniques. It has the potential to promote the development and use of hybrid approaches to further enhance flood forecasting and management procedures. The number of published works on the use of ANP and GIS-based ANP model seem minimal in comparison to other integrated approaches [73,74]. This is despite the sizeable volume of articles on flood and related natural hazards published globally. With the projected increase in flood catastrophe in coming years, it is expected that more researches will be undertaken using GIS-based ANP and remote sensing and other analytical tools for optimal flood forecasting and management. Future research should utilize the normalized difference water index for water body extraction. Similarly, the computational fluid dynamics software can be used to delineate the flood areas and for compare real-life flood extent with modeled data.

Author Contributions

Conceptualization, U.L.D. and A.-N.M.; Methodology, U.L.D., A.-L.B., I.R.A., and Y.A.A.; Software, U.L.D.; Validation, U.L.D., A.-N.M., and M.A.S.M.; Formal analysis, U.L.D., A.-L.B., and A.-N.M.; Investigation, U.L.D. and M.A.S.M.; Resources, K.W.Y., U.L.D., and A.-N.M.; Data curation, K.W.Y. and U.L.D.; Writing—original draft preparation, U.L.D., A.-L.B., and A.-N.M.; Writing—review and editing, B.P., I.R.A., A.-L.B., and Y.A.A.; Supervision, A.-N.M. and K.W.Y.; Project administration, U.L.D., A.-N.M., and A.-L.B.

Funding

This research received no external funding.

Conflicts of Interest

The authors declare no conflict of interest.

Appendix A

Figure A1. Importance of alluvium (Scenario 1).
Water 11 00615 g0a1
Figure A2. Importance of paddy fields (Scenario 8).
Water 11 00615 g0a2
Figure A3. Importance of major rainfall (Scenario 12).
Water 11 00615 g0a3
Figure A4. Importance of moderate rainfall (Scenario 13).
Water 11 00615 g0a4
Figure A5. Importance of flat slope (Scenario 15).
Water 11 00615 g0a5
Figure A6. Importance of low humidity clay soils (Scenario 21).
Water 11 00615 g0a6

Appendix B. Questionnaire Example

Example of the nodes comparison questionnaire: Comparison of nodes in rainfall cluster with nodes in soil type cluster.
Question: With respect to flood generation, given that the area has little rainfall (250–300mm), which node is more responsible for flood generation?
Low humidity clay soil9[]. 7[]. 5[]. 3[]. 1[]. 3[]. 5[]. 7[]. 9[]Red/yellow latosol on older alluvium
Low humidity clay soil9[]. 7[]. 5[]. 3[]. 1[]. 3[]. 5[]. 7[]. 9[]Red/yellow latosol on sedimentary rocks
Low humidity clay soil9[]. 7[]. 5[]. 3[]. 1[]. 3[]. 5[]. 7[]. 9[]Lithosols & shallow latosols
Red/yellow latosol on older alluvium9[]. 7[]. 5[]. 3[]. 1[]. 3[]. 5[]. 7[]. 9[]Red/yellow latosol on sedimentary rocks
Red/yellow latosol on older alluvium9[]. 7[]. 5[]. 3[]. 1[]. 3[]. 5[]. 7[]. 9[]Lithosols & shallow latosols
Example of the cluster comparison questionnaire
Question: With respect to flood generation, which cluster is more responsible for flood generation?
Geology9[]. 7[]. 5[]. 3[]. 1[]. 3[]. 5[]. 7[]. 9[]Slope gradient
Geology9[]. 7[]. 5[]. 3[]. 1[]. 3[]. 5[]. 7[]. 9[]Soil type
Geology9[]. 7[]. 5[]. 3[]. 1[]. 3[]. 5[]. 7[]. 9[]Rainfall
Slope gradient9[]. 7[]. 5[]. 3[]. 1[]. 3[]. 5[]. 7[]. 9[]Soil type
Slope gradient9[]. 7[]. 5[]. 3[]. 1[]. 3[]. 5[]. 7[]. 9[]Rainfall
Soil type9[]. 7[]. 5[]. 3[]. 1[]. 3[]. 5[]. 7[]. 9[]Rainfall

References

  1. Caruso, G.D. The legacy of natural disasters: The intergenerational impact of 100 years of disasters in Latin America. J. Dev. Econ. 2017, 127, 209–233. [Google Scholar] [CrossRef]
  2. Adeagbo, A.; Daramola, A.; Carim-Sanni, A.; Akujobi, C.; Ukpong, C. Effects of natural disasters on social and economic well being: A study in Nigeria. Int. J. Disaster Risk Reduct. 2016, 17, 1–12. [Google Scholar] [CrossRef]
  3. Yalcin, G.; Akyurek, Z. Analysing flood vulnerable areas with multicriteria evaluation. In Proceedings of the 20th ISPRS congress, Istanbul, Turkey, 12–23 July 2004; pp. 359–364. [Google Scholar]
  4. Islam, R.; Kamaruddin, R.; Ahmad, S.A.; Jan, S.J.; Anuar, A.R. A review on mechanism of flood disaster management in Asia. Int. Rev. Manag. Mark. 2016, 6, 29–52. [Google Scholar]
  5. Pradhan, B. Flood susceptible mapping and risk area delineation using logistic regression, GIS and remote sensing. J. Spat. Hydrol. 2010, 9, 1–18. [Google Scholar]
  6. Toriman, M.I.; Hassan, A.J.; Gazim, M.B.; Mokhtar, M.; Mastura, S.A.S.; Jaafar, O.; Karim, O.; Azlina, N.; Aziz, A. Integration of 1-d hydrodynamic model and GIS approach in flood management study in Malaysia. Res. J. Earth Sci. 2009, 1, 22–27. [Google Scholar]
  7. Toriman, M.E.; Kamarudin, M.K.A.; Idris, M.; Jamil, N.R.; Gazim, M.B.; Abd Aziz, N. Sediment concentration and load analyses at Chini river, Pekan, Pahang Malaysia. Res. J. Earth Sci. 2009, 1, 43–50. [Google Scholar]
  8. The Straits Times. Heavy Rain Causes Flash Floods in Several Parts of Malaysia. 2018. Available online: https://www.straitstimes.com/asia/se-asia/heavy-rain-causes-flash-floods-in-several-parts-of-malaysia (accessed on 19 March 2019).
  9. Toriman, M.E.; Yusop, Z.; Mokhtar, M.; Juahir, H. Application of GIS for detecting changes of Sungai Langat channel. Malays. J. Civ. Eng. 2006, 18. [Google Scholar] [CrossRef]
  10. Wang, Y.; Hong, H.; Chen, W.; Li, S.; Pamučar, D.; Gigović, L.; Drobnjak, S.; Bui, D.T.; Duan, H. A Hybrid GIS Multi-Criteria Decision-Making Method for Flood Susceptibility Mapping at Shangyou, China. Remote Sens. 2019, 11, 62. [Google Scholar] [CrossRef]
  11. Eldrandaly, K.A.; AL-Amari, M.A. An expert GIS-based ANP-OWA decision making framework for tourism development site selection. Int. J. Intell. Syst. Appl. 2014, 6, 1. [Google Scholar] [CrossRef]
  12. Alizadeh, M.; Ngah, I.; Hashim, M.; Pradhan, B.; Pour, A. A hybrid analytic network process and artificial neural network (ANP-ANN) model for urban earthquake vulnerability assessment. Remote Sens. 2018, 10, 975. [Google Scholar] [CrossRef]
  13. Tan, M.L.; Samat, N.; Chan, N.W.; Lee, A.J.; Li, C. Analysis of Precipitation and Temperature Extremes over the Muda River Basin, Malaysia. Water 2019, 11, 283. [Google Scholar] [CrossRef]
  14. Leopold, L.B.; Wolman, M.G.; Miller, J.P. Fluvial Processes in Geomorphology; Courier Corporation: Chelmsford, MA, USA, 2012. [Google Scholar]
  15. Lim, K.-S. Methodology for Evaluating Flood Damage Reduction Alternatives Using a GIS-Based MCDA Interactive Model; Colorado State University: Fort Collins, CO, USA, 2008. [Google Scholar]
  16. Nahiduzzaman, K.M.; Aldosary, A.S.; Rahman, M.T. Flood induced vulnerability in strategic plan making process of Riyadh city. Habitat Int. 2015, 49, 375–385. [Google Scholar] [CrossRef]
  17. Yahaya, S.; Ahmad, N.; Abdalla, R.F. Multicriteria analysis for flood vulnerable areas in Hadejia-Jama’are River basin, Nigeria. Eur. J. Sci. Res. 2010, 42, 71–83. [Google Scholar]
  18. Brouder, J.A.M. Flood Study in the Meghna-Dhonagoda Polder, Bangladesh. In Proceedings of the 15th Asian Conference on Remote Sensing, Bangalore, India, 17–23 November 1994; Volume TS3007, pp. 1–9. [Google Scholar]
  19. Aina, Y.; Aleem, K. Assessing the Vulnerability of an Industrial City to Predicted Sea Level Rise using SRTM and GPS Observations: The Case of Yanbu, Saudi Arabia. Int. J. Geoinforma 2014, 10, 73–81. [Google Scholar]
  20. Youssef, A.M.; Sefry, S.A.; Pradhan, B.; Alfadail, E.A. Analysis on causes of flash flood in Jeddah city (Kingdom of Saudi Arabia) of 2009 and 2011 using multi-sensor remote sensing data and GIS. Geomat. Nat. Hazards Risk 2016, 7, 1018–1042. [Google Scholar] [CrossRef]
  21. Wang, Y.; Colby, J.; Mulcahy, K. An efficient method for mapping flood extent in a coastal floodplain using Landsat TM and DEM data. Int. J. Remote Sens. 2002, 23, 3681–3696. [Google Scholar] [CrossRef]
  22. Huh, O.K.; Ali, A.; Quadir, D.A. Mapping of Green Leaf Biomass Over Bangladesh with NOAA Satelitte AVHRR Data; Coastal Studies Institute Louisiana State University: Baton Rouge, LA, USA, 1985. [Google Scholar]
  23. Nico, G.; Pappalepore, M.; Pasquariello, G.; Refice, A.; Samarelli, S. Comparison of SAR amplitude vs. coherence flood detection methods-a GIS application. Int. J. Remote Sens. 2000, 21, 1619–1631. [Google Scholar] [CrossRef]
  24. Islam, M.M.; Sado, K. Development of flood hazard maps of Bangladesh using NOAA-AVHRR images with GIS. Hydrol. Sci. J. 2000, 45, 337–355. [Google Scholar] [CrossRef] [Green Version]
  25. Islam, M.M.; Sado, K. Flood hazard assessment in Bangladesh using NOAA AVHRR data with geographical information system. Hydrol. Process. 2000, 14, 605–620. [Google Scholar] [CrossRef]
  26. Tehrany, M.S.; Pradhan, B.; Mansor, S.; Ahmad, N. Flood susceptibility assessment using GIS-based support vector machine model with different kernel types. Catena 2015, 125, 91–101. [Google Scholar] [CrossRef]
  27. Tehrany, M.S.; Pradhan, B.; Jebur, M.N. Flood susceptibility analysis and its verification using a novel ensemble support vector machine and frequency ratio method. Stoch. Environ. Res. Risk Assess. 2015, 29, 1149–1165. [Google Scholar] [CrossRef]
  28. Tehrany, M.S.; Lee, M.-J.; Pradhan, B.; Jebur, M.N.; Lee, S. Flood susceptibility mapping using integrated bivariate and multivariate statistical models. Environ. Earth Sci. 2014, 72, 4001–4015. [Google Scholar] [CrossRef]
  29. Jabbari, A.; Bae, D.-H. Application of Artificial Neural Networks for Accuracy Enhancements of Real-Time Flood Forecasting in the Imjin Basin. Water 2018, 10, 1626. [Google Scholar] [CrossRef]
  30. Termeh, S.V.R.; Kornejady, A.; Pourghasemi, H.R.; Keesstra, S. Flood susceptibility mapping using novel ensembles of adaptive neuro fuzzy inference system and metaheuristic algorithms. Sci. Total Environ. 2018, 615, 438–451. [Google Scholar] [CrossRef]
  31. Hong, H.; Tsangaratos, P.; Ilia, I.; Liu, J.; Zhu, A.-X.; Chen, W. Application of fuzzy weight of evidence and data mining techniques in construction of flood susceptibility map of Poyang County, China. Sci. Total Environ. 2018, 625, 575–588. [Google Scholar] [CrossRef] [PubMed]
  32. Shafizadeh-Moghadam, H.; Valavi, R.; Shahabi, H.; Chapi, K.; Shirzadi, A. Novel forecasting approaches using combination of machine learning and statistical models for flood susceptibility mapping. J. Environ. Manag. 2018, 217, 1–11. [Google Scholar] [CrossRef] [PubMed]
  33. Khosravi, K.; Pham, B.T.; Chapi, K.; Shirzadi, A.; Shahabi, H.; Revhaug, I.; Prakash, I.; Bui, D.T. A comparative assessment of decision trees algorithms for flash flood susceptibility modeling at Haraz watershed, northern Iran. Sci. Total Environ. 2018, 627, 744–755. [Google Scholar] [CrossRef]
  34. Lim, J.; Lee, K.-S. Flood Mapping Using Multi-Source Remotely Sensed Data and Logistic Regression in the Heterogeneous Mountainous Regions in North Korea. Remote Sens. 2018, 10, 1036. [Google Scholar] [CrossRef]
  35. Choubin, B.; Moradi, E.; Golshan, M.; Adamowski, J.; Sajedi-Hosseini, F.; Mosavi, A. An Ensemble prediction of flood susceptibility using multivariate discriminant analysis, classification and regression trees, and support vector machines. Sci. Total Environ. 2019, 651, 2087–2096. [Google Scholar] [CrossRef]
  36. Liu, J.; Xu, Z.; Chen, F.; Chen, F.; Zhang, L. Flood Hazard Mapping and Assessment on the Angkor World Heritage Site, Cambodia. Remote Sens. 2019, 11, 98. [Google Scholar] [CrossRef]
  37. Luu, C.; von Meding, J. A Flood Risk Assessment of Quang Nam, Vietnam Using Spatial Multicriteria Decision Analysis. Water 2018, 10, 461. [Google Scholar] [CrossRef]
  38. Mahmoud, S.H.; Gan, T.Y. Multi-criteria approach to develop flood susceptibility maps in arid regions of Middle East. J. Clean. Prod. 2018, 196, 216–229. [Google Scholar] [CrossRef]
  39. Saaty, T.L. The Analytical Hierarchy Process, Planning, Priority, Resource Allocation; RWS Publications: Pittsburgh, PA, USA, 1980. [Google Scholar]
  40. Aragonés-Beltrán, P.; Poveda-Bautista, R.; Jiménez-Sáez, F. An in-depth analysis of a TTO’s objectives alignment within the university strategy: An ANP-based approach. J. Eng. Technol. Manag. 2017, 44, 19–43. [Google Scholar] [CrossRef]
  41. Althuwaynee, O.F.; Pradhan, B.; Lee, S. A novel integrated model for assessing landslide susceptibility mapping using CHAID and AHP pair-wise comparison. Int. J. Remote Sens. 2016, 37, 1190–1209. [Google Scholar] [CrossRef]
  42. Althuwaynee, O.F.; Pradhan, B. Ensemble of Data-Driven EBF model with Knowledge Based AHP Model for Slope Failure Assessment in GIS Using Cluster Pattern Inventory. In Proceedings of the FIG Congress 2014, Kuala Lumpur, Malaysia, 16–21 June 2014. [Google Scholar]
  43. Neshat, A.; Pradhan, B.; Dadras, M. Groundwater vulnerability assessment using an improved DRASTIC method in GIS. Resour. Conserv. Recycl. 2014, 86, 74–86. [Google Scholar] [CrossRef]
  44. Alizadeh, M.; Hashim, M.; Alizadeh, E.; Shahabi, H.; Karami, M.; Beiranvand Pour, A.; Pradhan, B.; Zabihi, H. Multi-Criteria Decision Making (MCDM) Model for Seismic Vulnerability Assessment (SVA) of Urban Residential Buildings. ISPRS Int. J. Geo-Inf. 2018, 7, 444. [Google Scholar] [CrossRef]
  45. Neaupane, K.M.; Piantanakulchai, M. Analytic network process model for landslide hazard zonation. Eng. Geol. 2006, 85, 281–294. [Google Scholar] [CrossRef]
  46. Lin, Y.; Cheng, H.-P.; Tseng, M.-L.; Tsai, J.C. Using QFD and ANP to analyze the environmental production requirements in linguistic preferences. Expert Syst. Appl. 2010, 37, 2186–2196. [Google Scholar] [CrossRef]
  47. Wan, S.-P.; Xu, G.-L.; Dong, J.-Y. Supplier selection using ANP and ELECTRE II in interval 2-tuple linguistic environment. Inf. Sci. 2017, 385, 19–38. [Google Scholar] [CrossRef]
  48. Department of Statistics Malaysia. Population and Housing Census of Malaysia; Department of Statistics Malaysia: Putrajaya, Malaysia, 2010; p. 13.
  49. MERCY Malaysia. MERCY Malaysia Annual Report 2011; MERCY Malaysia: Kuala Lumpur, Malaysia, 2011. [Google Scholar]
  50. Adiat, A.K.; Nawawi, M.N.M.; Abdullah, K. Integration of Geographic Information System and 2D Imaging to investigate the effects of subsurface conditions on flood occurrence. Mod. Appl. Sci. 2012, 6, 11. [Google Scholar] [CrossRef]
  51. Ishizaka, A.; Labib, A. Review of the main developments in the analytic hierarchy process. Expert Syst. Appl. 2011, 38, 14336–14345. [Google Scholar] [CrossRef]
  52. Saaty, T.L.; Sagir, M. Extending the measurement of tangibles to intangibles. Int. J. Inf. Technol. Decis. Mak. 2009, 8, 7–27. [Google Scholar] [CrossRef]
  53. Super Decisions. Available online: https://www.superdecisions.com/index.php (accessed on 2 February 2019).
  54. Contreras, F.; Hanaki, K.; Aramaki, T.; Connors, S. Application of analytical hierarchy process to analyze stakeholders preferences for municipal solid waste management plans, Boston, USA. Resour. Conserv. Recycl. 2008, 52, 979–991. [Google Scholar] [CrossRef]
  55. Şener, Ş.; Şener, E.; Nas, B.; Karagüzel, R. Combining AHP with GIS for landfill site selection: A case study in the Lake Beyşehir catchment area (Konya, Turkey). Waste Manag. 2010, 30, 2037–2046. [Google Scholar] [CrossRef]
  56. Lin, H.-Y.; Hsu, P.-Y.; Yeh, Y.-T. Application of the AHP in data warehouse system selection decisions for SMEs in Taiwan. Int. J. Manag. Enterp. Dev. 2006, 3, 599–617. [Google Scholar] [CrossRef]
  57. Balogun, A.-L.; Matori, A.-N.; Hamid-Mosaku, A.I. A fuzzy multi-criteria decision support system for evaluating subsea oil pipeline routing criteria in East Malaysia. Environ. Earth Sci. 2015, 74, 4875–4884. [Google Scholar] [CrossRef]
  58. Forman, E.; Peniwati, K. Aggregating individual judgments and priorities with the analytic hierarchy process. Eur. J. Oper. Res. 1998, 108, 165–169. [Google Scholar] [CrossRef]
  59. Aczél, J.; Saaty, T.L. Procedures for synthesizing ratio judgements. J. Math. Psychol. 1983, 27, 93–102. [Google Scholar] [CrossRef]
  60. Department of Survey & Mapping (Jabatan Ukurdan Pemetaan Malaysia), Malaysia. Available online: https://www.jupem.gov.my/ (accessed on 2 February 2019).
  61. Department of Minerals and Geosciences (Jabatan Mineral dan Geosains). Available online: https://www.jmg.gov.my/awam/penerbitan/data-terbuka-jmg (accessed on 2 February 2019).
  62. MRSA (Malaysian Remote Sensing Agency). RADARSAT Image. Available online: http://www.remotesensing.gov.my/portal/index.php (accessed on 7 July 2018).
  63. Department of Irrigation and Drainage (Jabatan Pengairandan Saliran), Malaysia. Available online: https://www.water.gov.my/ (accessed on 2 February 2019).
  64. Harris Geospatial Solutions (n.d). ENVI 4.3. Available online: https://www.harrisgeospatial.com/Company/Core-Technology (accessed on 2 February 2019).
  65. Environmental Systems Research Institute. ArcGIS Desktop Help 9.3, including 9.3.1. 25 April 2009. Available online: http://webhelp.esri.com/arcgisdesktop/9.3/index.cfm?TopicName=welcome (accessed on 2 February 2019).
  66. Nasuruddin, M.G. Flooding and Development. 2017. Available online: https://www.thesundaily.my/archive/flooding-and-development-HUARCH5101902017 (accessed on 6 February 2019).
  67. Arafin, M.S.; Lee, C. A resistivity survey for groundwater in Perlis using offset Wenner technique. In Karst Water Resources, Proceedings of the Ankara-Antalya Symposium, Ankara, Turkey, 7–12 July 1985; IAHS Publ.: London, UK, 1985; pp. 221–232. [Google Scholar]
  68. Azizat, N.; Omar, W.M.S.W. Assessment of Three Flood Hazard Mapping Methods: A Case Study of Perlis. In Proceedings of the 1st International Conference on Civil & Environmental Engineering (CENVIRON 2017), Penang, Malaysia, 28–29 November 2017; EDP Sciences: Les Ulis, France, 2018; Volume 34, p. 02028. [Google Scholar]
  69. Malczewski, J. GIS and Multicriteria Decision Analysis; John Wiley & Sons: Hoboken, NJ, USA, 1999. [Google Scholar]
  70. Mészáros, C.; Rapcsák, T. On sensitivity analysis for a class of decision systems. Decis. Support Syst. 1996, 16, 231–240. [Google Scholar] [CrossRef]
  71. Nekhay, O.; Arriaza, M.; Boerboom, L. Evaluation of soil erosion risk using Analytic Network Process and GIS: A case study from Spanish mountain olive plantations. J. Environ. Manag. 2009, 90, 3091–3104. [Google Scholar] [CrossRef]
  72. Abubakar, I.R. The role of GIS in the planning, implementation and management of university environmental management system—Case of KFUPM, Saudi Arabia. In Proceedings of the 2nd National GIS Symposium in Saudi Arabia, Dammam, Saudi Arabia, 23–25 April 2007. [Google Scholar]
  73. Matori, A.N.; Lawal, D.U. Flood Disaster Forecasting: A GIS-based Group Analytic Hierarchy Process Approach. Appl. Mech. Mater. 2014, 567, 717–723. [Google Scholar] [CrossRef]
  74. Dano, L.U.; Matori, A.N.; Wan Yusof, K.; Hashim, A.M.; Aminu, M.; Sabri, S.; Balogun, A.; Mokhtar, M.R.M. Group-based Decision Support for Flood Hazard Forecasting: A Geospatial Technology-based Group Analytic Hierarchy Process Approach. Res. J. Appl. Sci. Eng. Technol. 2013, 7, 4838–4850. [Google Scholar]
Figure 1. AHP (a) and ANP (b) structures.
Water 11 00615 g001
Figure 2. Map of Perlis showing its capital city.
Water 11 00615 g002
Figure 3. Flow chart of spatial analysis methodology.
Water 11 00615 g003
Figure 4. Flow chart for flooded area extraction from RADARSAT image [4].
Water 11 00615 g004
Figure 5. ANP-based network of the flood susceptibility assessment.
Water 11 00615 g005
Figure 6. Flood susceptibility map using ANP model.
Water 11 00615 g006
Figure 7. (A) Flood extent extraction model of November 2010 flood in Perlis state; (B) flood susceptibility map using ANP model.
Water 11 00615 g007
Figure 8. Superimposed image of the flood extent model and the spatial flood susceptibility model.
Water 11 00615 g008
Figure 9. Super imposition of the flood extent model over the land use layer.
Water 11 00615 g009
Table 1. Distribution of survey respondents by expertise.
Respondents’ ExpertiseNumber of RespondentsPercentage
Hydrology637.5
Civil and environmental engineering425.0
Geology318.8
Urban and regional planning212.5
Geomorphology16.3
Total16100
Table 2. Values of random inconsistency indices (adapted from Saaty [39]).
Matrix Size12345678910
Average Random Inconsistency0.000.000.580.901.121.241.321.411.451.49
Table 3. Interpretation of ANP measurement scale (adapted from Saaty [39]).
Degree of ImportanceDefinitionInterpretation
1Equal importanceTwo element making equal contribution to the goal
3Somewhat more importantModerate importance of element over the other element
5Much more importantEssential or strong importance
7Very much importantVery strong importance
9Extremely importantExtreme importance
Scale, 2, 4, 6 and 8Intermediate valuesThese are required when comprise between two adjacent judgment is needed
ReciprocalsIf v is the judgment value when i is compared to j, then 1/v is the judgment value when j is compared to i.
Table 4. Spatial data layers used in the study area.
DataYearScaleInformation ExtractedSource
Topography Map of Perlis19801:50,000Digital Elevation Model (Slope)Department of Survey & Mapping, Malaysia [60]
Geology Map of the Malaysian Peninsula19851:250,000Different classes of geologyDepartment of Minerals and Geosciences, Malaysia [61]
Soil Map of the Malaysian Peninsula19621:250,000Soil typesDepartment of Minerals and Geosciences, Malaysia [61]
SPOT Image2005-Land use map: land use categories classificationMalaysian Agency for Remote Sensing [62]
Rainfall Gauge Data2001–2011-Amount of rainfall, 2001 to 2011Department of Irrigation and Drainage, Malaysia [63]
RADARSAT Image2010-Flood extent mapMalaysian Agency for Remote Sensing [62].
Table 5. Priority vectors of the nodes.
Flood Influencing FactorsNormalized by Cluster WeightsLimit Super-Matrix
Alluvium (ALL)0.500.10
Chuping limestone (CHL)0.140.03
Granite (GN)0.040.01
Sand, gravel, and clay (SGC)0.040.01
Setul limestone (SLI)0.060.01
Shale & siltstone (SS)0.220.04
Forested areas (FA)0.130.02
Paddy fields (PF)0.510.09
Rubber farms (RU)0.060.01
Water bodies (WB)0.310.05
Little rainfall 250–300mm (LR)0.190.04
Major rainfall 350–400mm (MA-R)0.380.08
Moderate rainfall 300–350mm (MO-R)0.350.08
Very little rainfall 200–250mm (VLR)0.090.02
Flat slope 0–8% (FSL)0.420.09
Gentle slope 2–8% (GSL)0.320.07
Moderate steep slope 15–30%0.060.01
Rolling slope 8–15% (RSL)0.150.03
Steep slope 30–60% (SSL)0.050.01
Lithosols and shallow latosols (LSL)0.190.04
Low humidity clay soil (LHC)0.600.11
Rey/yellow latosols on older alluvium (R/Y ALL)0.070.01
Rey/yellow latosols on sedimentary rocks (R/Y SED)0.140.03
Summation5.001.00
Table 6. Sensitivity analysis.
Sub-criteriaLimitingScenario 1Scenario 8Scenario 12Scenario 13Scenario 15Scenario 21
ALL0.100.200.090.090.090.090.09
CHL0.030.020.020.020.020.020.02
GN0.010.000.000.000.000.000.00
SGC0.010.000.000.000.000.000.00
SLI0.010.010.010.010.010.010.01
SS0.040.040.040.040.040.040.04
FA0.020.020.020.020.020.020.02
PF0.090.090.190.090.090.090.09
RU0.010.000.000.000.000.000.00
WB0.050.050.050.050.050.050.05
LR0.040.040.040.040.040.040.04
MA-R0.080.080.080.180.080.080.08
MO-R0.080.070.070.070.180.070.07
VLR0.020.010.010.010.010.010.01
FSL0.090.090.090.090.090.190.09
GSL0.070.060.060.060.060.060.06
MSL0.010.010.010.010.010.010.01
RSL0.030.030.030.030.030.030.03
SSL0.010.000.000.000.000.000.00
LSL0.040.030.030.030.030.030.03
LHC0.110.110.110.110.110.110.21
R/Y ALL0.010.010.010.010.010.010.01
R/Y SED0.030.020.020.020.020.020.02
Summation1.0 1.01.01.01.01.0
Table 7. Susceptibility levels of spatial flood susceptibility model and the magnitude of flood extent model.
Spatial Flood Susceptibility ModelArea (ha)Percentage of Area (%)
Hardly susceptible to flooding (HSF)5437.06.7
Very little susceptible to flooding (VLSF)6590.58.2
Moderately susceptible to flooding (MSF)22,253.527.6
Highly susceptible to flooding (HSF)15,341.019.0
Very susceptible to flooding (VHSF)31,922.438.4
Total81,544.4100
Flood Extent Model33,966.241.9
Table 8. Area of land use attributes and the magnitude of flood extent model.
Land UseArea (ha)Area (%)
Settlements2654.63.1
Paddy39,863.049.0
Sugarcane11,207.813.8
Rubber11,847.914.0
Forested Areas15,222.118.7
Water Bodies748.91.4
Total81,544.4100
Flood Extent Extraction Model from Real Life Situation33,966.241.9

