Water Security Assessment of China’s One Belt and One Road Region
by
 , ,
, ,
Zhaofang Zhang
1, 
Weijun He
2,*,
Min An
1,2,*,
Dagmawi Mulugeta Degefu
3,
Liang Yuan
2,
Juqin Shen
1,4,
Zaiyi Liao
3 and
Xia Wu
5 1
Business School, Hohai University, Nanjing 211100, China
2
College of Economics and Management, China Three Gorges University, Yichang 443002, China
3
Faculty of Engineering and Architectural Science, Ryerson University, Toronto, M5B 2K3, Canada
4
Institute of Environmental Accounting and Assets Management, Nanjing 211100, China
5
School of Law and Public Administration, China Three Gorges University, Yichang 443002, China
*
Authors to whom correspondence should be addressed.
Water 2019, 11(3), 607; https://doi.org/10.3390/w11030607
Submission received: 15 February 2019
/
Revised: 20 March 2019
/
Accepted: 21 March 2019
/
Published: 23 March 2019
(This article belongs to the Special Issue Water Security)
Abstract
:The sustainable development of socioeconomic and environmental systems are highly dependent on water capital and water utilization efficiency. Nowadays, a significant portion of the world is facing water security issues due to a combination of various factors. As a result, socioeconomic and environmental systems are threatened. China is also currently experiencing problems. Water security assessment helps to identify key determining factors for optimal water utilization, so the authors present the Driving Forces-Pressures-Carrying Capacity-State-Impacts-Responses (DPSCIR) water security assessment framework. Unlike previous methods, the proposed framework incorporates the carrying capacity of the environment, and as a result, yields assessment results that are more realistic. As a case study, the proposed framework coupled with the entropy method is applied to assess the water security status of the One Belt and One Road (B&R) region in China. In addition, the water security level of the provinces and municipalities in this region are simulated for the time period from 2017 to 2022 using the Grey Prediction Model. The results show that Responses, State, Pressures, and Carrying Capacity Subsystems greatly influence water security of the region. According to the assessment, water security of the area improved from 2011 to 2016. The results portray the following trend among the three subregions of the study area, the water security of the 21st Maritime Silk Road (One Road) area is better than Silk Road Economic Belt (One Belt) and the Strategy Support and Pivotal Gateway (SSPG) of B&R areas. Generally, from the evaluation results it can be concluded that only focusing on the subsystem of Responses cannot entirely address the water security problems within the B&R area. Therefore, to ensure sustainable water security in the region and in the country, the government needs to design water resource management mechanisms that take all the subsystems into account.
1. Introduction
Currently, different parts of the world are facing serious water scarcity challenges [1]. The Middle East and South Asia are typical examples [2]. In 1962 and 2014, freshwater availability per capita throughout the world was 13,360.32 m3 and 5925.67 m3, respectively [3]. This shows a decrease of almost 1500 m3 every ten years. With the growing population, more water will be needed to produce the estimated 60% of the extra food needed by 2050 [4]. This is seriously increasing the vulnerability of socioeconomic and ecological systems’ changes in water quantity and quality [5]. Uneven temporal and spatial distribution of water resources is the main cause of water shortage. This case is no different in China. As a result, even though water is abundant in China, the per capita water availability is only 2061 m3. The country ranked 125th in terms of per capita water availability in the world [6]. Hence, water resource management studies are highly encouraged in order to obtain insights that can be used to improve the country’s water security status.
Assessing water scarcity can be one of the ways to obtain insights into the water security of an area [7]. Most of the previous studies on water scarcity evaluate water scarcity as demand- or population-driven [8,9]. Thus, at present, popular understandings of water scarcity are based on water insufficiency [10]. Quantifying the water issues only with these determining parameters might not help us to understand the real reasons behind water scarcity, such as water mismanagement [11,12] and uneven water distribution due to economic reasons or environmental factors [13,14]. It is only when we have an accurate understanding of the reasons behind water scarcity that appropriate solutions can be designed and implemented [15]. This is why assessing water security is useful. Assessing water security will capture the issues associated with water in a broader context than water scarcity.
Many scholars have carried out a large number of studies on water security. The concept of water security originated in the 1940s and has undergone through three phases [16] and is still a changing concept [17,18]. Water security is defined as sustainable utilization of water resources, adequate in both quantity and quality, for human well-being, socio-economic development, and ecological conservation, including an acceptable level of risk of water-related disasters [19,20,21,22,23,24]. A comprehensive water security assessment is critical to sustainable water management [25]. It can be used to design adaptive water management regimes. Therefore, a water security assessment is one of the main components of any comprehensive water resource management [26,27] and assessing the status of water security is one of the topics that needs to be investigated first. Water security assessments assist to ascertain a general picture of the issues that require an all-encompassing solution [28]. Research on water security assessments mainly involves water-related risks [29], water-poverty [30], water-vulnerability [31,32], and water security governance [33]. Water security problems have a complex nature which is rooted not only in the availability of freshwater resources relative to water demand, but also on social and economic factors [34]. For example, Vörösmarty (2010) [35] appraised the threat of human activities and biodiversity dangers which are being affected from water insecurity by considering: 23 indicators, including catchment disturbance, pollution, water resource development, and biotic factors. Lautze and Manthrithilake (2012) [36] assessed water security by considering five critical dimensions (i.e., basic needs, agricultural production, the environment, risk management, and independence) for 46 countries in the Asia–Pacific region. Sustainable Development Goal (SDG) 6 [37] provides a good base for water security indicators selection. However, there is still room for improvement. It is not advisable to completely apply the SDG 6 indicators into the assessment framework of water security [38,39]. Hence, SDG 6 indicators need to be combined with specific goals, which will guide our indicators selection.
As for methods used to assess water security, the most common evaluation models are the SES-Model [40], Water GAP3 model [4], system dynamics model [41], and DPSIR model [42]. The Driving Forces-Pressures-Carrying Capacity-State-Impacts-Responses (DPCSIR) [43,44] framework is developed based on the DPSIR model. Compared to other methodologies, the DPCSIR framework [45] can take socioeconomic activities and the ecosystem into account to produce better results. Both methodological frameworks can be applied to identify the factors that threaten water security. However, the DPSIR model has two flaws in the assessment of water security. Firstly, even though it considers the impact of human social and economic activities on the water environment when reflecting the causes of water security problems, it does not take into account the Carrying Capacity of the environment. It is worth noting that in the analysis of regional water security problems, not all water security problems come from human activities but may also come from changes in the ecological environment itself. Secondly, the model is not comprehensive enough to take into account the interactions between social and economic factors, and the environment. This might ultimately lead to inaccurate results of water resources security assessment.
To fill these research gaps, we use the DPCSIR model to build a water security assessment index. In addition, most previous studies are focused on assessing the water security status for a target year rather than carrying out a dynamic time series assessment. In this article, the authors use the entropy method to calculate the weights of the different determining factors, and carry out a comprehensive water security assessment and prediction of China’s B&R Region using the DPCSIR model. The insights for the article might help policymakers understand and identify current water security issues in the study area. Furthermore, based on the assessment, possible courses of action to mitigate water insecurity problems are forwarded.
2. Materials and Methods
2.1. Study Area
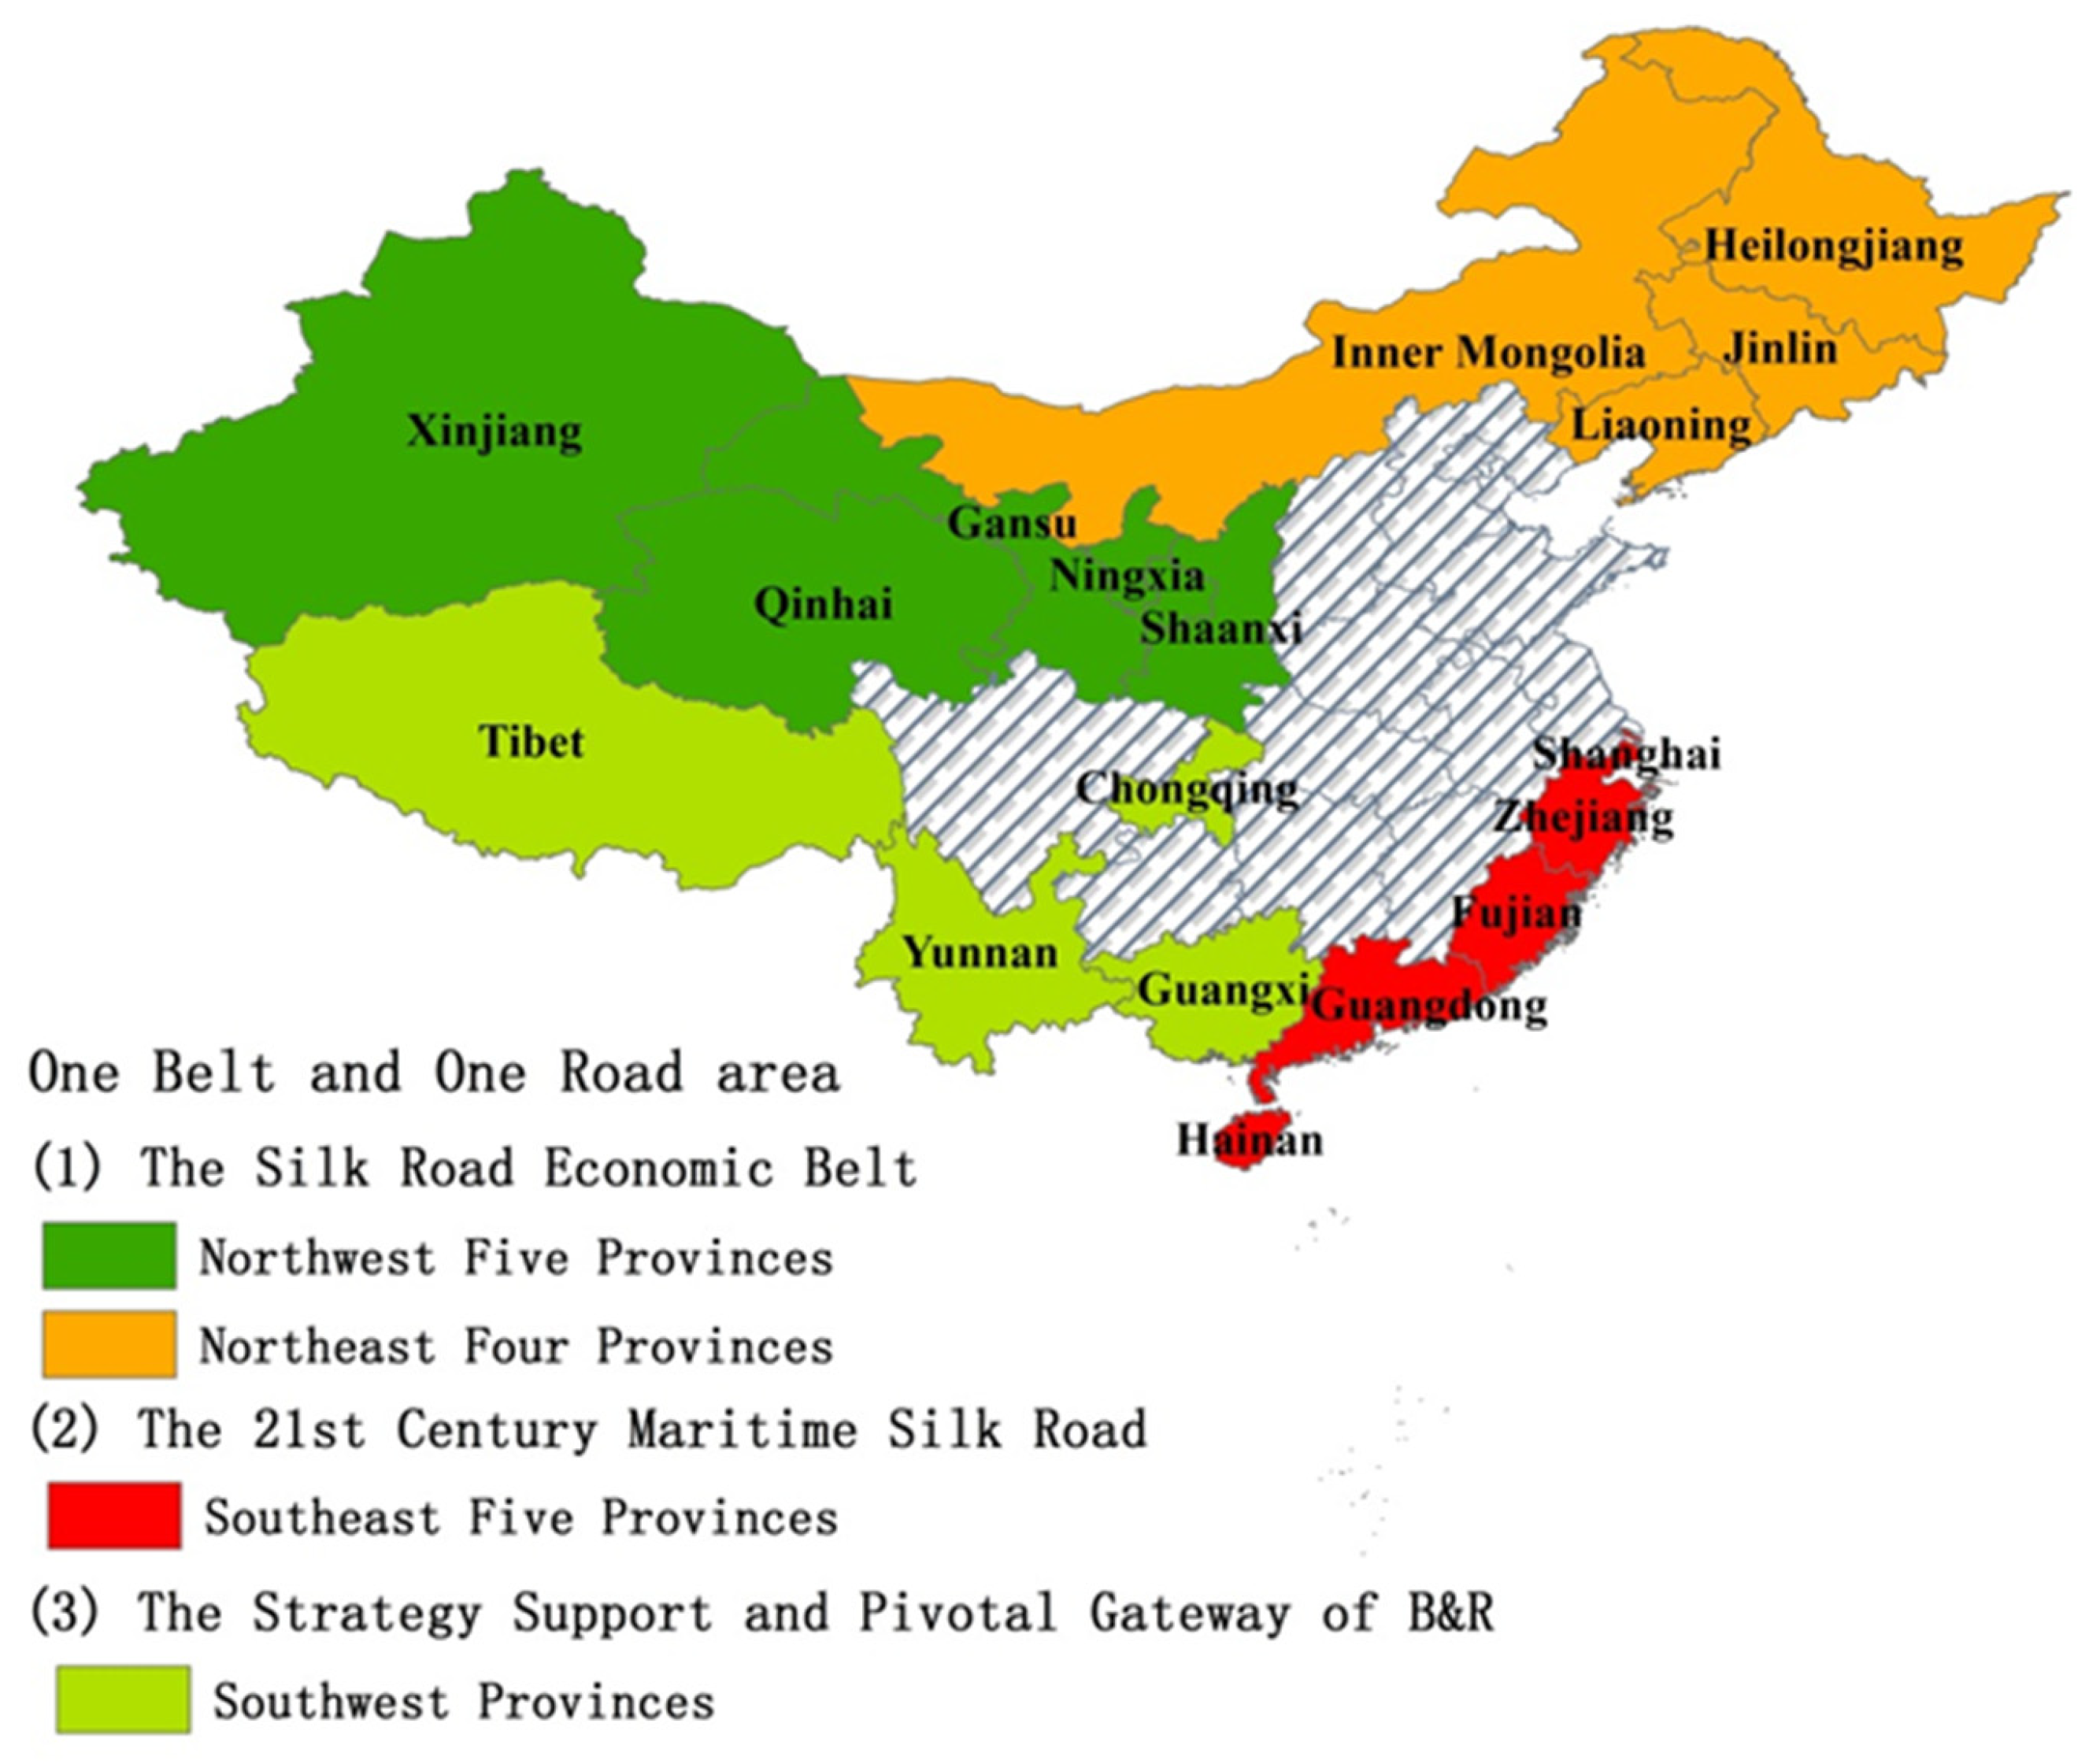
One Belt and One Road (B&R) is China’s most important development initiative. It is one of the three main economic development strategies in China. The B&R initiative is an international and regional cooperation initiative proposed by President Xi Jinping of China during his visit to central Asian and Southeast Asian countries in 2013 [46]. It is an initiative of trans-regional cooperation promoting common economic development and enhancing China’s contribution to global sustainable development. The initiative covers a large surface area compared to the country’s other strategies. Its land-cover accounts for 77.83% of the whole country. Its GDP was 5324.59 US billion dollars, accounting for 47.53% of China’s total GDP in 2016. The urbanization rate of the B&R area in China was 57.21%, lower than the urbanization rate in China’s developed regions, such as Shanghai (87.9%) [47], which indicated the region still has development potential. It includes 5895.4 million people (42.64% of China’s population) and is home to various resources and intensive economic sectors.
In order to implement the initiative, the Chinese government has formulated special plans for the 18 provinces and municipalities in China included in the initiative [48]. This is because these areas are now facing over-exploitation, severe pollution, and resource shortages. Most of these areas lie on the country’s borders. One of the challenges of these areas is their declining water security level. The water consumption in this area had increased from 290.0 billion m3 in 2003 to 328.3 billion m3 in 2016, and the growth rate reached 13.14%. Hence, the water resource demand of the region is huge and shows an increasing trend. Therefore, how to guarantee the water security of the area to promote sustainable economic growth has become an urgent issue to be addressed.
At present, most of the research on the B&R initiative focuses on different topics, such as politics, industry guidance, and policy implementation [49,50,51,52,53,54]. However, there is a lack of study focusing on water security in the part of the region covered by the initiative within China. Water insecurity might hinder China’s sustainable development and pose a serious risk to the implementation of the B&R initiative. Hence, carrying out a systematic water security assessment of the provinces and municipalities of China within the B&R helps to identify the water security problems and put forward effective solutions.
The B&R initiative consists of 18 provinces and municipalities in China. It is divided into three regions according to their geographic location (see Figure 1). The Silk Road Economic Belt (One Belt) includes Inner Mongolia, Liaoning, Jilin, Heilongjiang, Xinjiang, Shaanxi, Gansu, Ningxia, and Qinghai, while Shanghai, Fujian, Guangdong, Zhejiang, and Hainan are located in the 21st Maritime Silk Road (One Road). The Strategy Support and Pivotal Gateway of One Belt and One Road Initiative area (SSPG area) includes Guangxi, Yunnan, Tibet, and Chongqing.
2.2. Methods
2.2.1. The DPCSIR Model
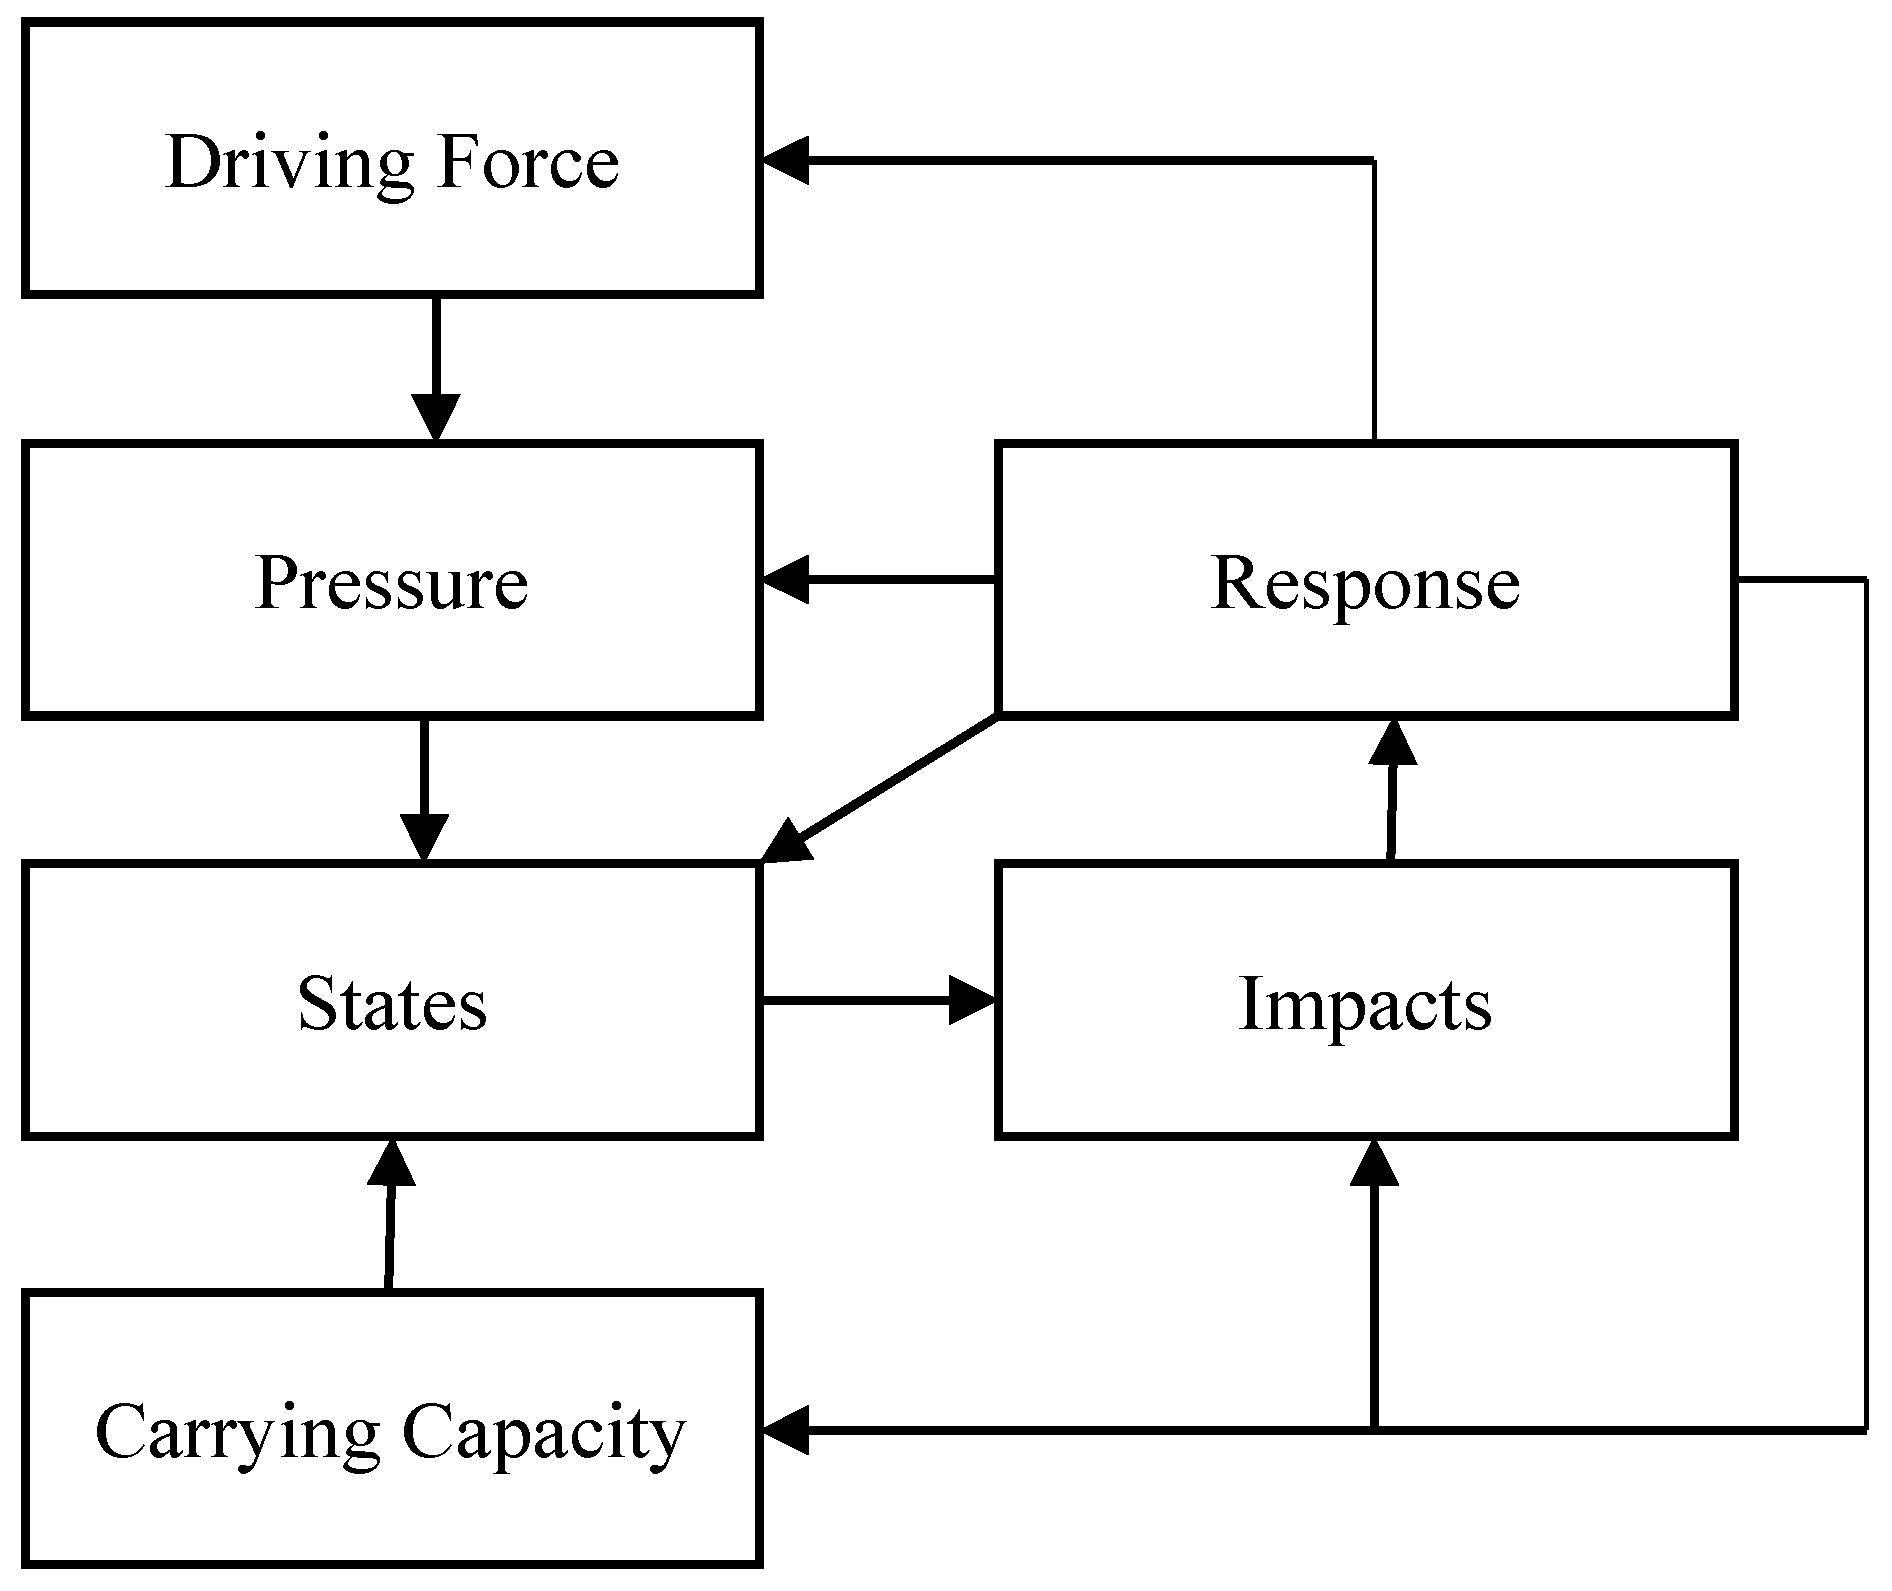
The Driving Forces-Pressures-State-Carrying Capacity-Impacts–Responses (DPCSIR) model was proposed by Wang et al. (2011) [45]. This framework is developed from the PSR and DPSIR models [55,56]. The reason why we use the DPCSIR framework to assess comprehensive water security is that it takes into account the causal chain caused by environmental problems and considers population growth and social and economic development as long-term Driving Forces to investigate the pressures on the environment as well as the feedback effect caused by environmental changes. This will help us to understand the causal relationship and influence between economic activities and the environment at different scales.
The interrelationship between the subsystems of the DPCSIR models is shown in Figure 2. Driving Forces are the socio-economic factors that drive human activities, which raise or mitigate pressures on ecosystems. Pressures are the impact of human activities on the environment. The Carrying Capacity reflects the capacity of the environment to support human activities. The State subsystem represents the current status of the environment. Impacts are the effect of environmental deterioration. Responses refer to the reactions by society to address environmental issues.
2.2.2. The Entropy-Weighted Method
Based on the chosen indicators, water security can be measured as follows:
The first step is data standardization.
where is the normalized value; is the original value; is the maximum value; and is the minimum value of the corresponding factor.
The second step is the calculation of the weights. The entropy method is based on Shannon Entropy [57] and is used to calculate the weights [58,59]. The concept of entropy is born from information theory, which is a measure of uncertainty. The entropy method has been widely used because it can objectively calculate the weight of assessment factors. If the factor is considered to be important, it will be given a higher weight coefficient.
The detailed procedures for the entropy method are as follows:
(1) Calculating the proportion of the index value in the year for the index item .
where is the number of years; is the number of evaluation indicators.
(2) The entropy of the index can be determined as follows:
(3) After the entropy value of the index is determined, the weight of the index can be computed as follows.
The third step is the calculation of water security level.
2.2.3. Classical Grey Prediction Model
The Grey Prediction Model [60] is often used to process data and establish a Grey Model to make a quantitative prediction of a future development trend. It has shown excellent ability in solving problems for which effective information is incomplete and uncertain and this can proceed with correlation analysis by identifying the development trend and degree of difference between system factors. Therefore, it is widely used in numerical prediction [61,62,63]. The Grey Prediction Model is used to predict the water security for the time period from 2017 to 2022. The specific steps are as follows:
Let be the original sequence, and be the new sequence, then the new sequence need satisfy .
Step 1: Construct the cumulative data matrix and a constant term vector .
Step 2: Calculate the parameters and .
Step 3: Put the parameters and into the equation.
Step 4: Calculate the simulation value: .
Step 5: Calculate the average relative error (), variance ratio (), small error probability and test the simulation value. is the simulation value of the model, is the relative error, is a standard deviation of the original sequence , and is the standard deviation of relative sequence , represents the residual probability.
2.2.4. Reliability Analysis
Cronbach’s Alpha coefficient is used to analyze the reliability of the built assessment framework [60]. It’s crucial that the processed data is standardized and has a higher reliability coefficient. This will ensure the high credibility of the index. We followed De Vellis’s [64] test to present the results. The coefficient ranges are 0.60–0.65 (not preferable), 0.65–0.7 (acceptable value), 0.70–0.80 (pretty good), 0.80–0.90 (very good).
2.3. Indicator Selection and Data Source
The indicators are selected based on the scope of each subsystem and existing literature [65,66,67]. Considering the principles of representation, hierarchy, and ease of using the data, 30 relevant indicators are selected to build the water security assessment framework in this paper. The data used in this article is mainly from the official yearbooks (see Table 2).
3. Results and Discussion
3.1. Reliability Analysis and Entropy Weights
Reliability analysis of the assessment framework containing the 30 indicators is obtained using SPSS 22 (Han, 2015) [60]. The results show the Cronbach’s Alpha of the 30 factors is 0.730 which indicates that the processed data has high reliability. Therefore, these selected factors can objectively reflect the water security status of the study area.
According to the relative importance of each factor, the judgment matrix is constructed, and the weighted value of each index is determined by entropy (see Table 3).
3.2. Comprehensive Water Security Analysis of China’s B&G Region
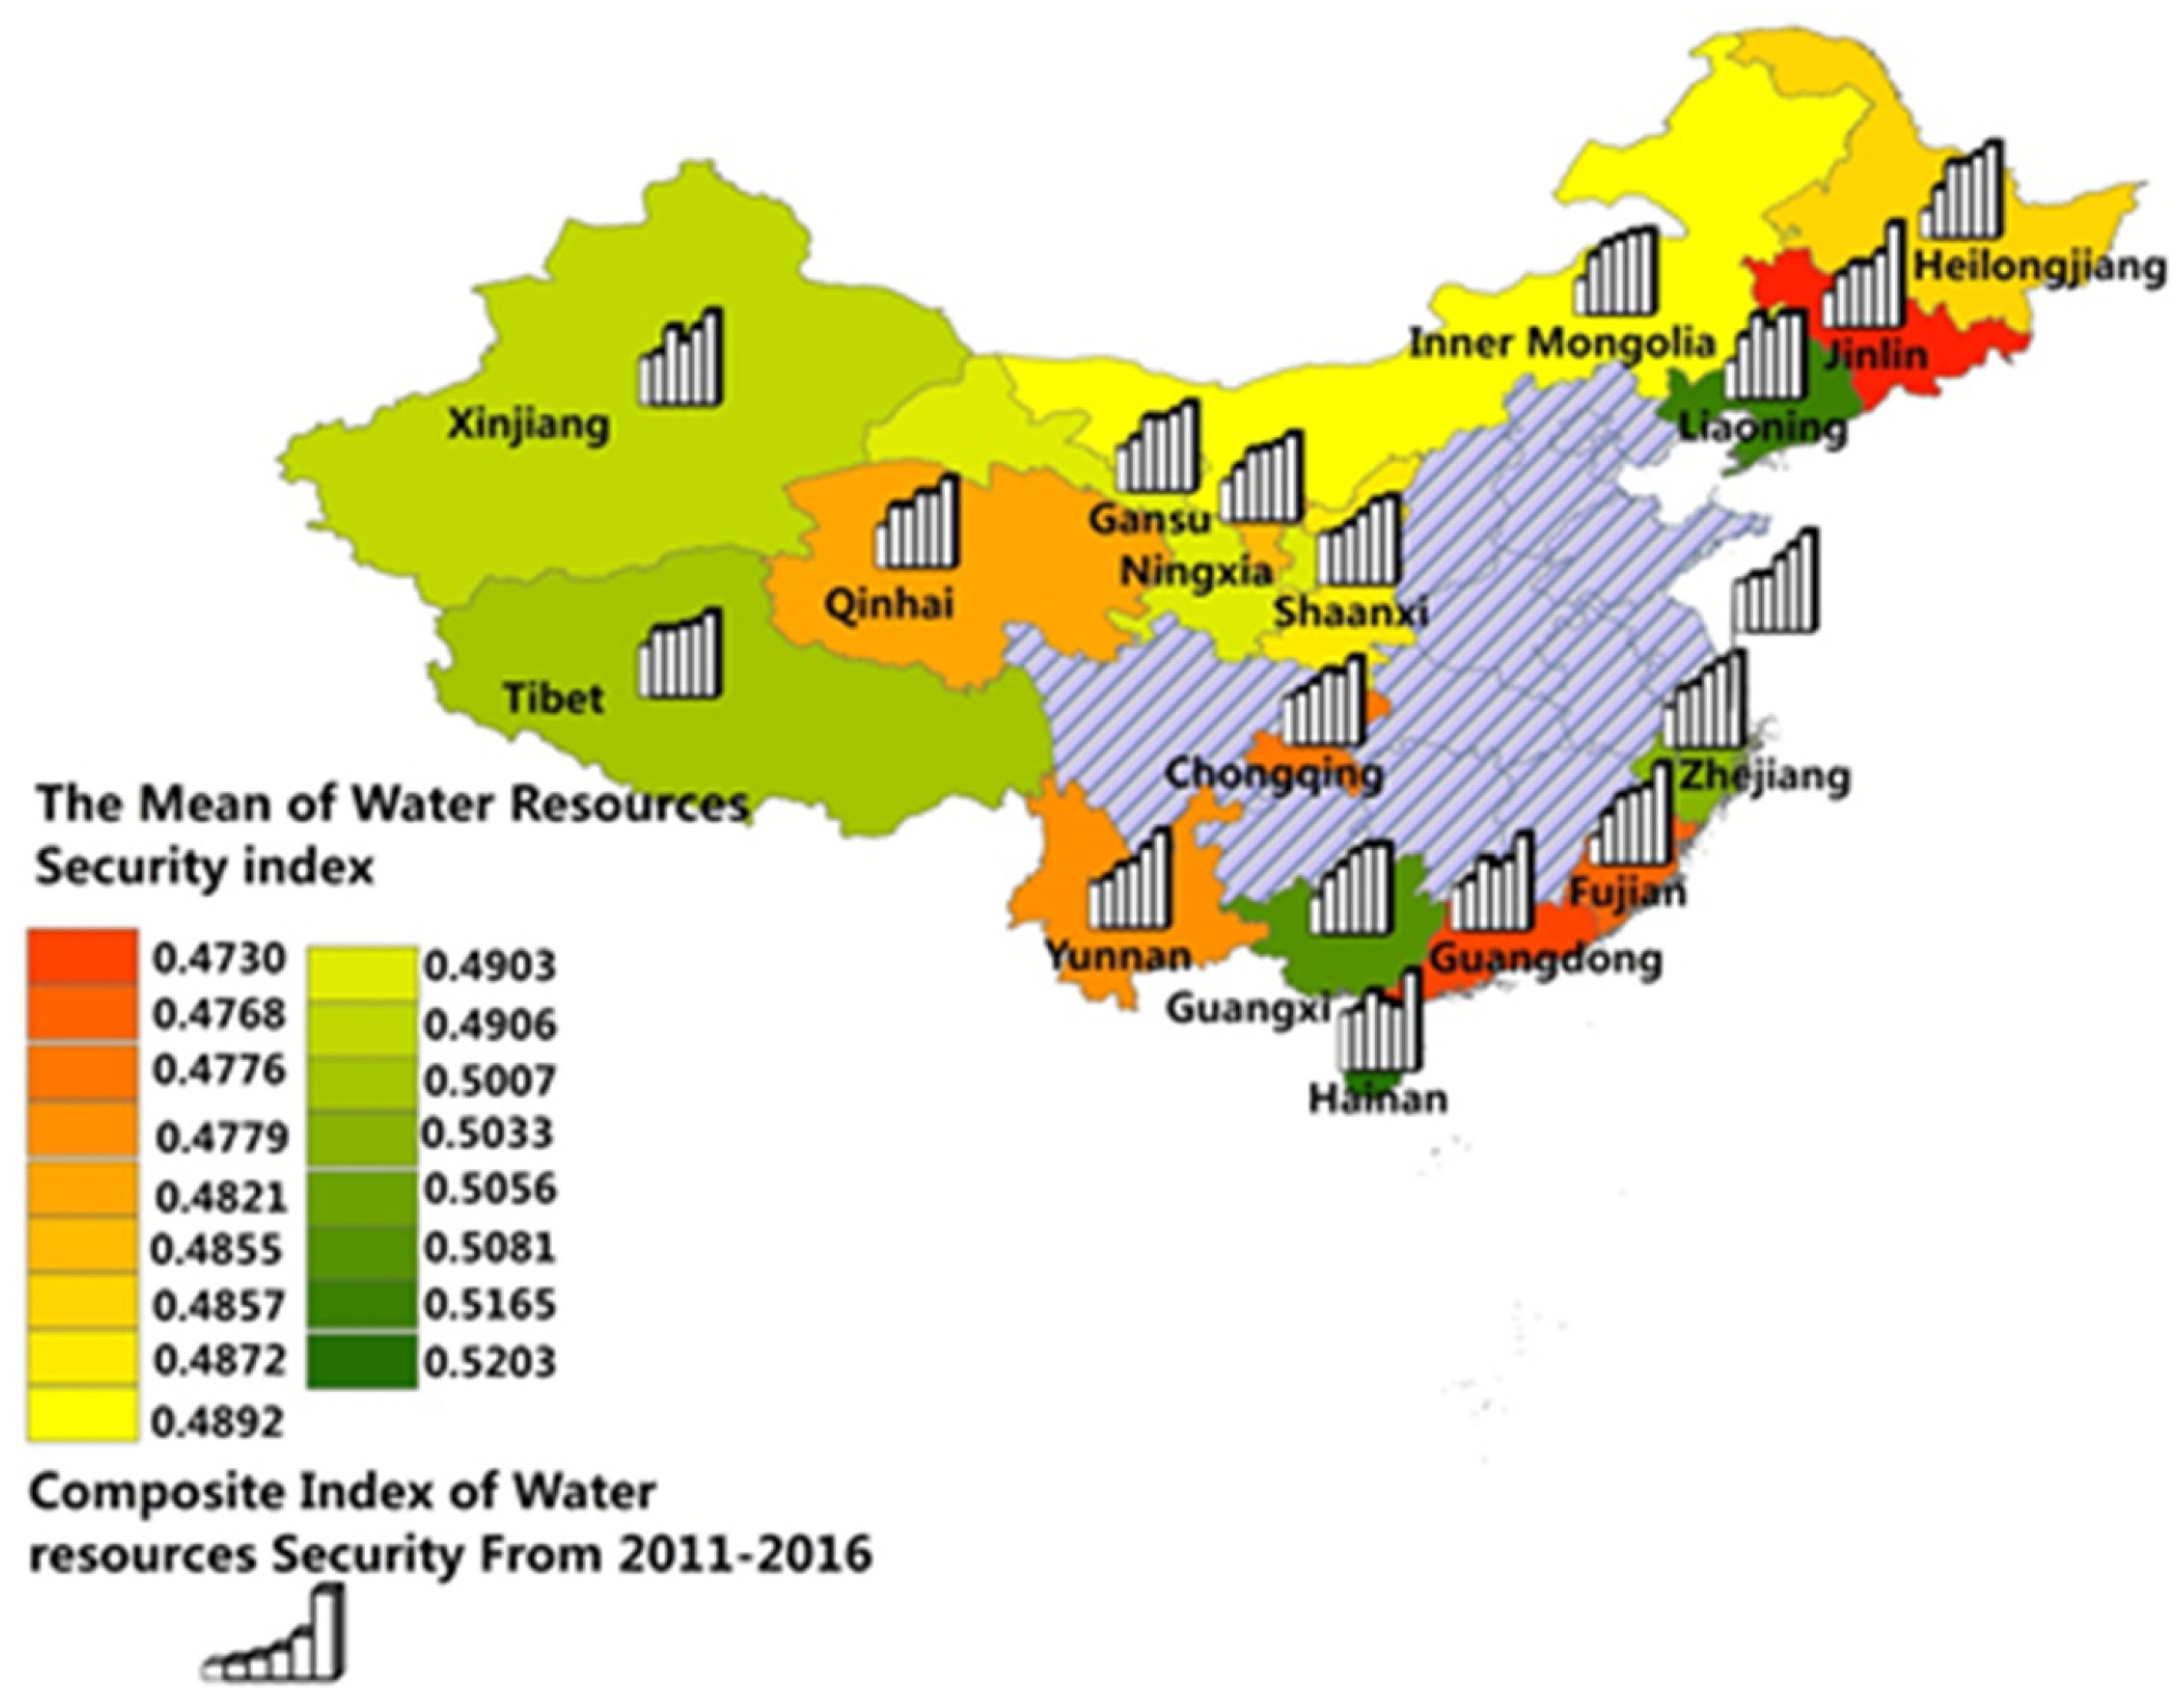
Generally, the results show that the water security level of the 18 provinces and municipalities in the B&R region has improved by various degrees within the past 6 years. According to our water security assessment, the One Road area is slightly doing better than the other two regions. Fujian, Heilongjiang, Jilin, Guangxi, and Inner Mongolia have all experienced faster water security growth rates and achieved growth rates of over 19.00% (See Table 4). It’s worth noting that the average water security value for 2011 was much lower than that of 2016, which indicated that the B&R China’s regional water resources ecosystem was seriously damaged and its sustainable development capacity was significantly weakened in 2011. The main reasons for this phenomenon were that China experienced large-scale, multiple, and severe floods and droughts in 2010 [72], which had a negative impact on the water security index in 2011. Therefore, the water security index in 2011 was relatively low. On the other hand, the Chinese government began to implement the strictest water resource management system and water ecological civilization construction since 2012 and the water security assessment showed an increasing trend year by year.
The overall water security trend shows the One Belt area is better than the SSPG area, and the SSPG area is better than the One Road area. Provinces and municipalities, such as Hainan, Liaoning, Guangxi, Shanghai, Zhejiang, and Tibet, have a score that exceeded 0.5 (See Table 4 and Figure 3). We observe that most provinces and municipalities have attached great importance to water resource security in the past few years and achieved remarkable results through continuous improvement by increasing technological investment focusing on water use efficiency and decommissioning of backward production facilities with a high water footprint. This result concurs with the research done by Tan (2016) [73]. The research showed that the average of regional comprehensive water efficiency of the One Belt area and the SSCG area had been increasing during the time period from 2000–2013. Inner Mongolia, Heilongjiang, and Jilin achieved a higher ranking than other provinces and municipalities.
From assessing the water security status of specific provinces and municipalities, it can be seen that Liaoning, Jilin, and Heilongjiang in the One Belt region have benefited from having a good economic and technological foundation, as a result, their overall water security is relatively better. However, in recent years, the progress of water resource protection initiatives is comparatively not significant due to slow economic development and insufficient technological progress. Some provinces in the area, such as Inner Mongolia, Shanxi, Gansu, Qinghai, Ningxia, and Xinjiang, ranked far behind in terms of their water security status. This is mainly due to low water capital and slow economic development. Furthermore, the lack of sufficient attention to this problem affects the score of the Responses subsystem, leading to the low water security improvement rate. Our results concur with Zuo [74]. We observe that most of the provinces and municipalities of water insecurity are located in geographical areas with low precipitation, high population density, and slow economic development.
However, rapid economic development may also lead to water security problems. Sometimes it is hard to balance economic development and environmental sustainability [75]. For instance, even though Guangdong and Fujian have better-developed economies within the B&R area of China, with GDP ranked 1st and 3rd in 2016 [71], their water security level is relatively low. One reason for this situation is that water resource management efforts have been insufficient. This results in low water resource utilization efficiency and high environmental pollution. Another reason is the “resource curse” which makes people who live in regions of high water availability less sensitive to water saving schemes [76]. The average annual growth rate of water security for Fujian and Guangdong is relatively high, ranked the first and the eighth respectively. Hence, water security has a great prospect for improvement. The Strategy Support and Pivotal Gateway of the B&R area containing Guangxi, Tibet, and Yunnan have better water security, while Chongqing’s is not that good. Chongqing needs to promote water saving measures to improve its water security.
Although the overall water security assessment shows a growing trend from 2011–2016, it obscures nonlinear growth. This is a reason why the marginal growth rate analysis is needed to show these changes. Looking at the marginal growth rate (see Appendix Table A2), the annual marginal growth rate of various provinces and cities has shown different declining trends, which means that it will be increasingly difficult to improve the water security level in the following years. The marginal rate of Liaoning, Guangdong, Hainan, and Xinjiang in 2014 had a larger degree of decline, the decline rate was 13.43%, 10.01%, 12.26%, and 17.04%, respectively. In order to study the reasons for this phenomenon, we calculate the marginal growth rate of each index in the above four provinces and screen out the impact indicators that cause the marginal growth rate to decrease greatly and rank them according to the influence of the weight of the six subsystems (See Appendix Table A3). In summary, fewer Responses to water ecological protection, weakened the Carrying Capacity, the continuous growth of water consumption and sewage discharge, and the slowing economic development lead to this nonlinear phenomenon, thus it is necessary to maintain the sustainability of water security protection policies.
3.3. Subsystem Assessment
The result shows that the subsystems of Responses, State, Pressures, and Carrying Capacity have the greatest effect on water security. Each subsystem has different impacts on water resources in various provinces and municipalities. The weight of each subsystem is determined by the entropy method (see in Appendix Table A1 and Figure 4).
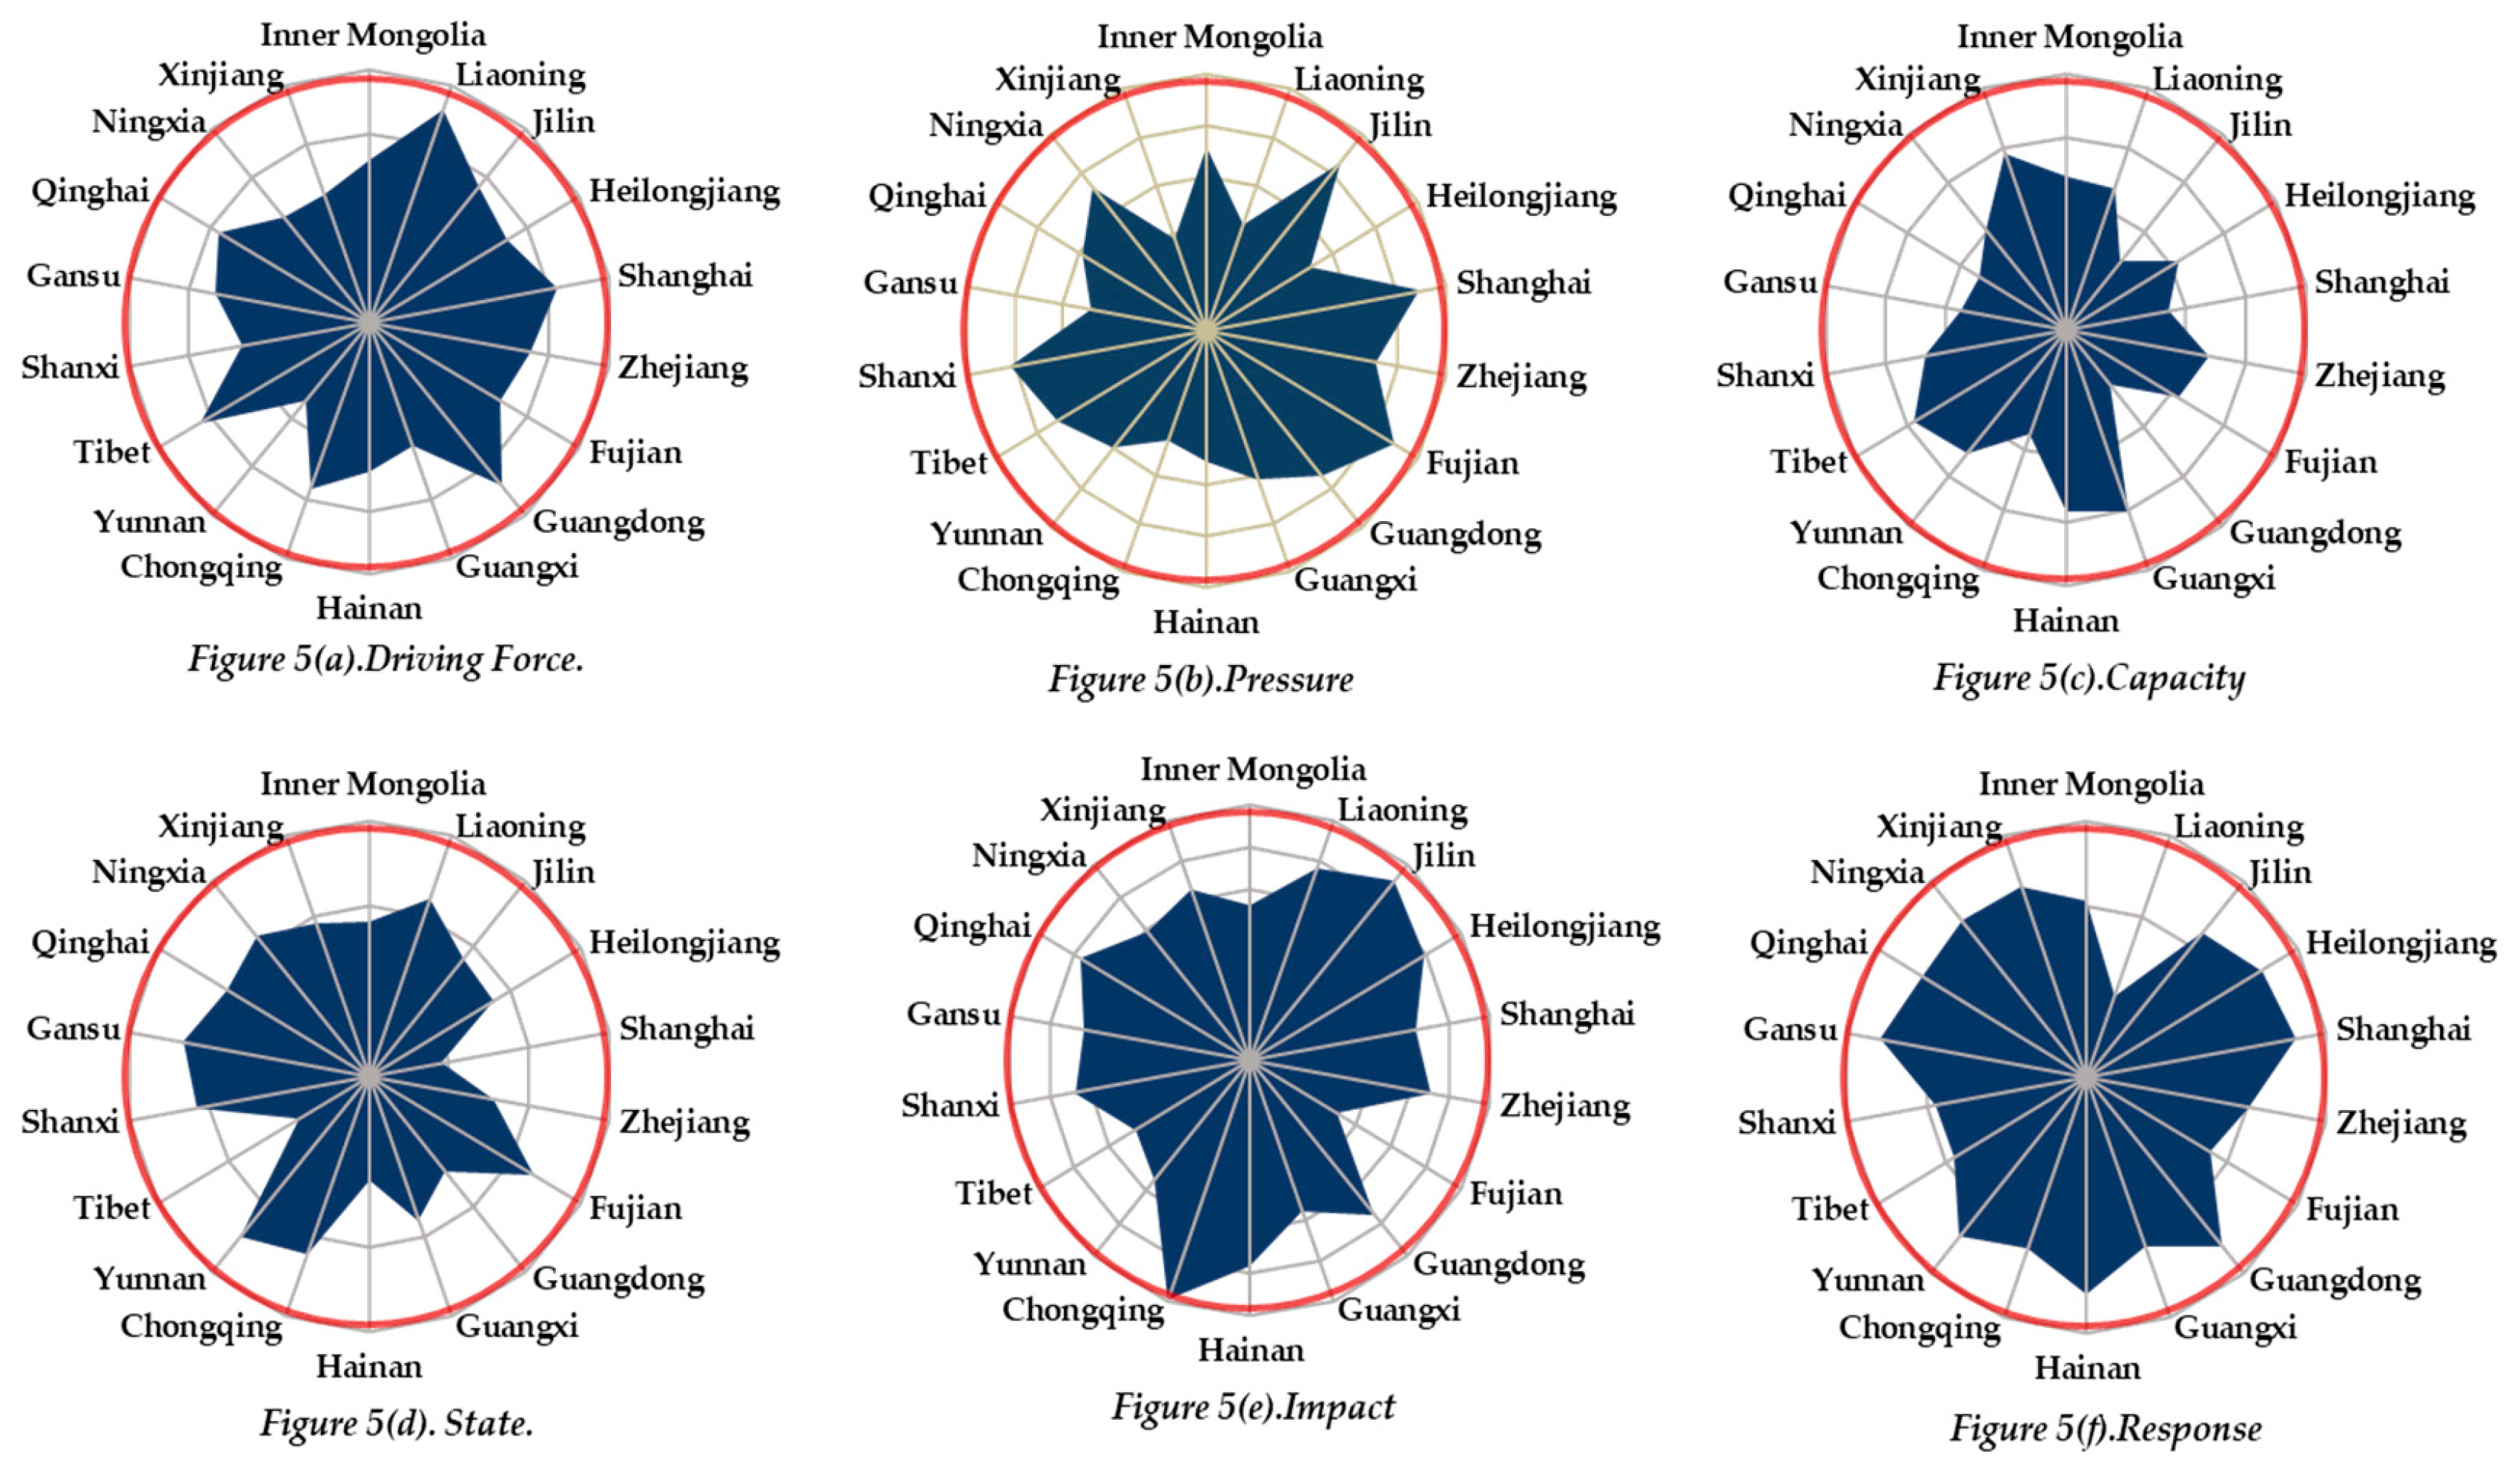
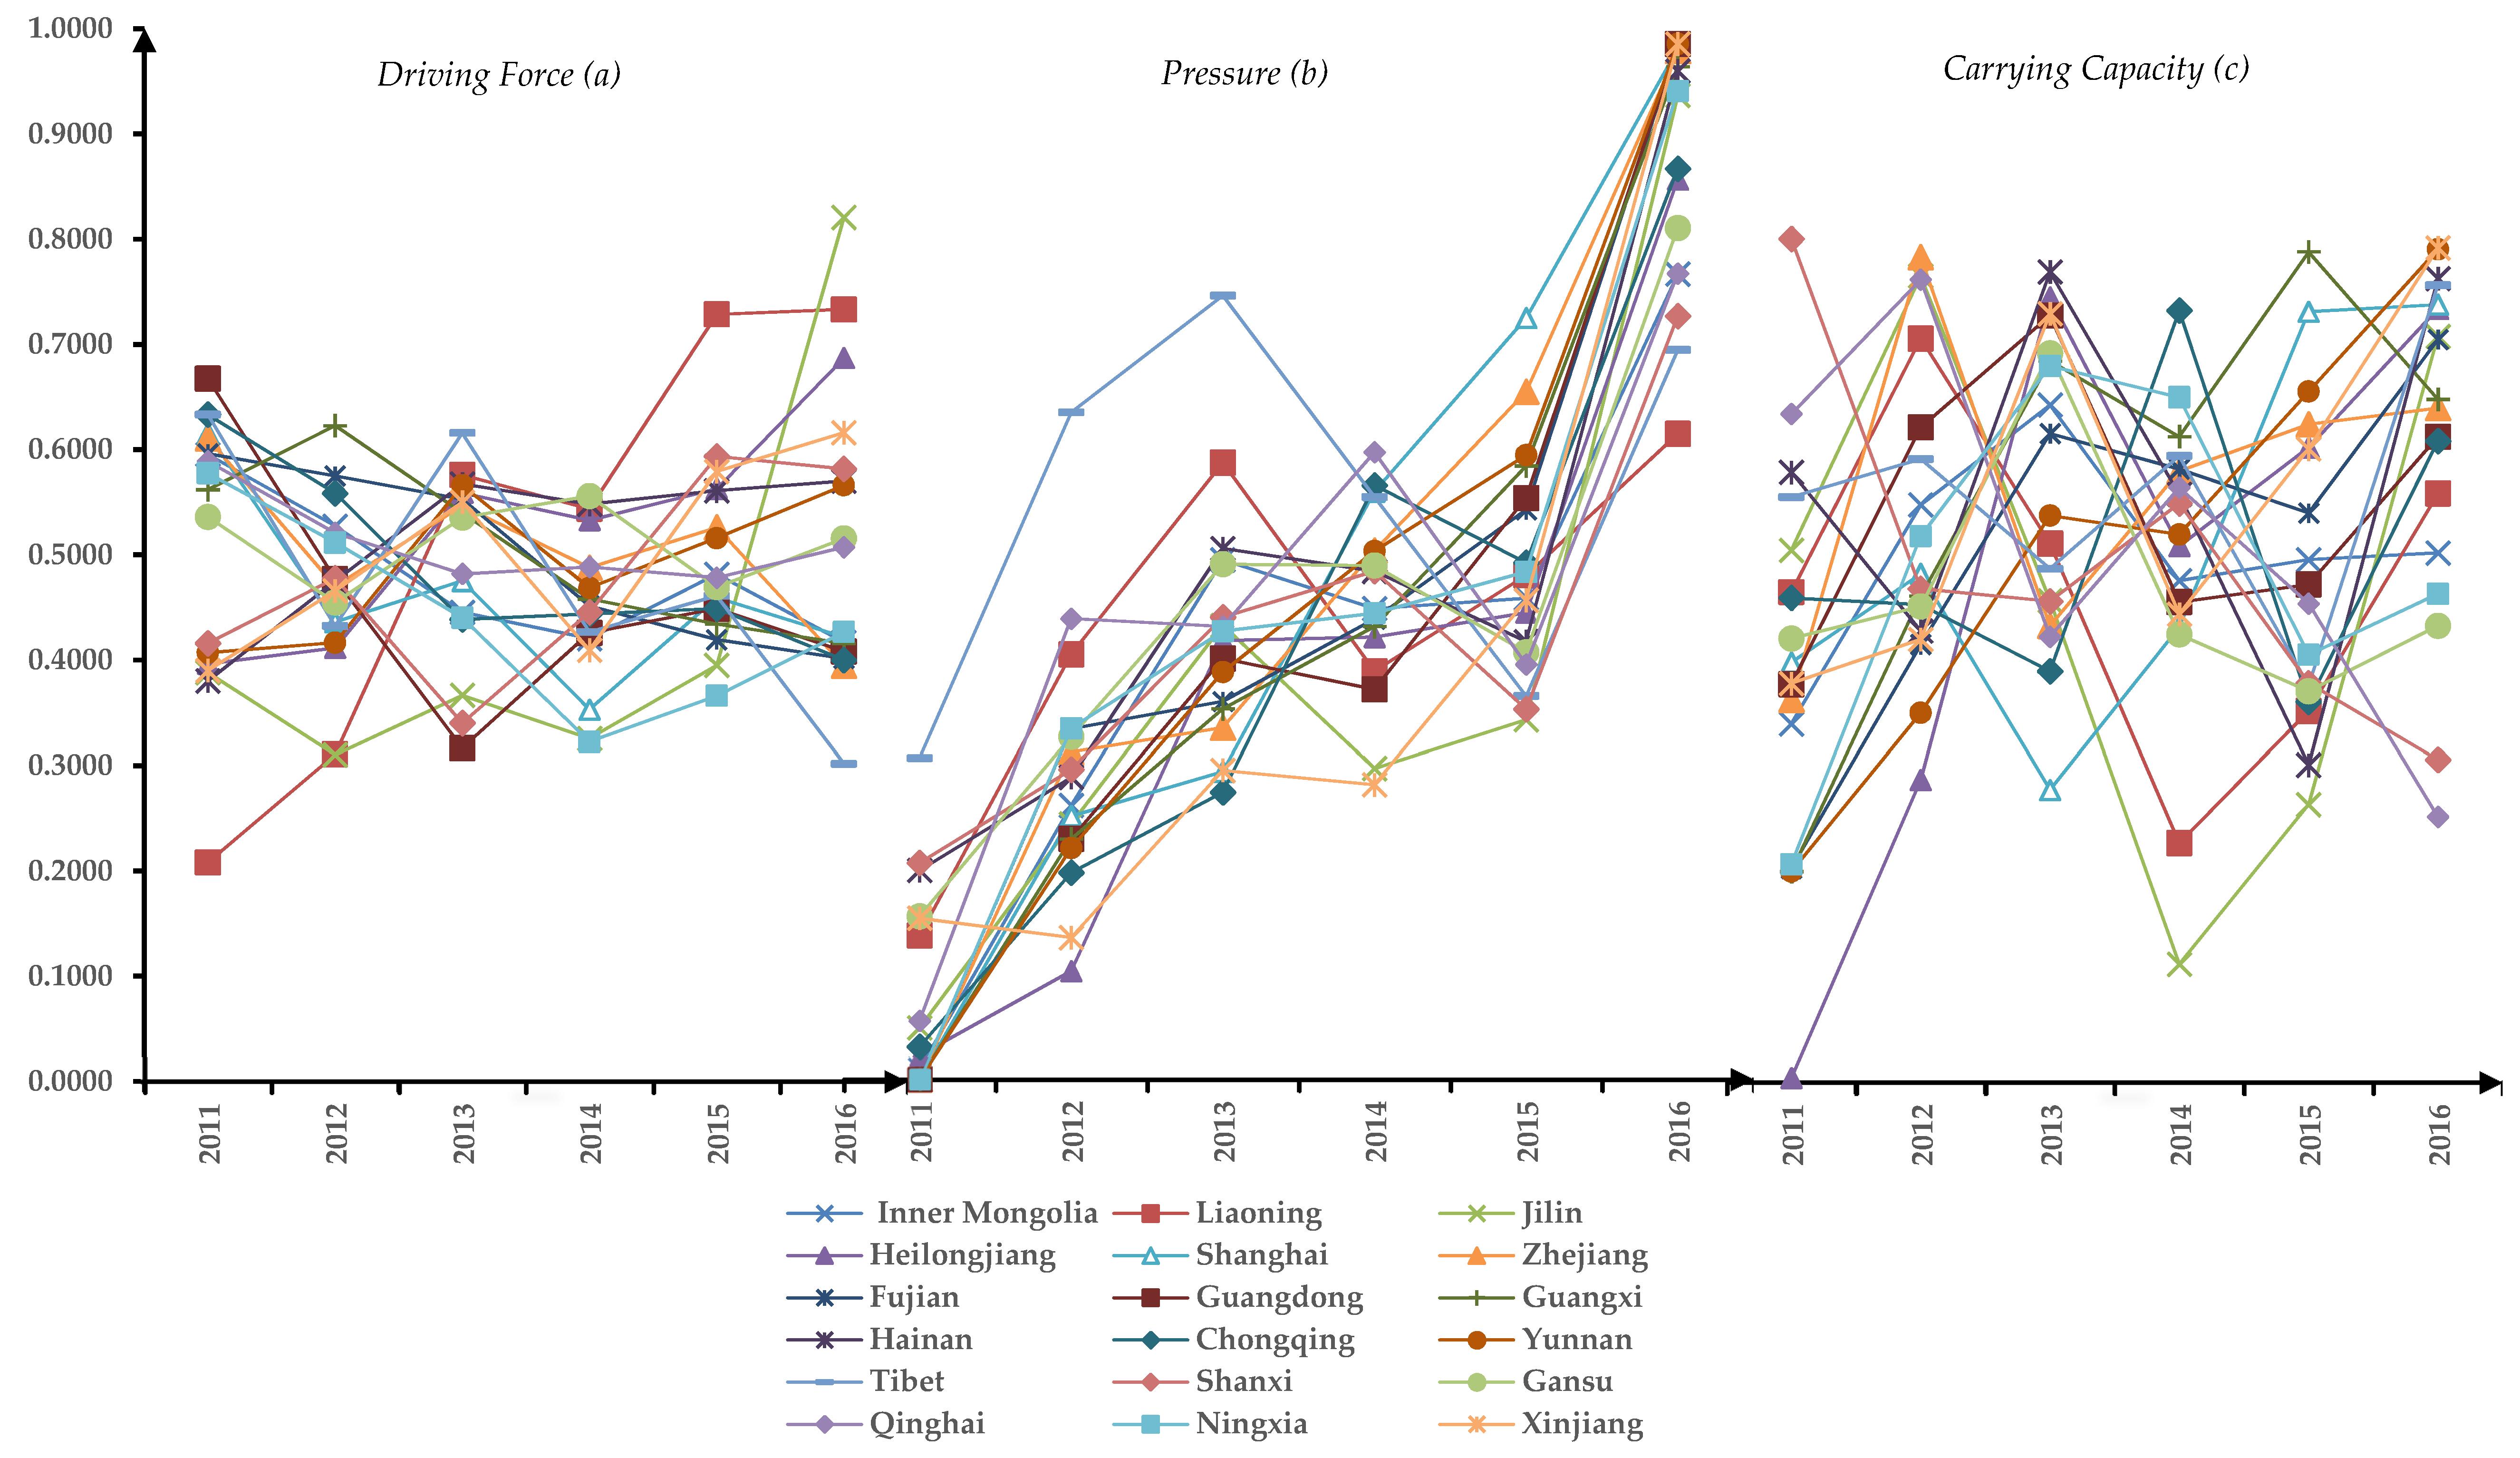
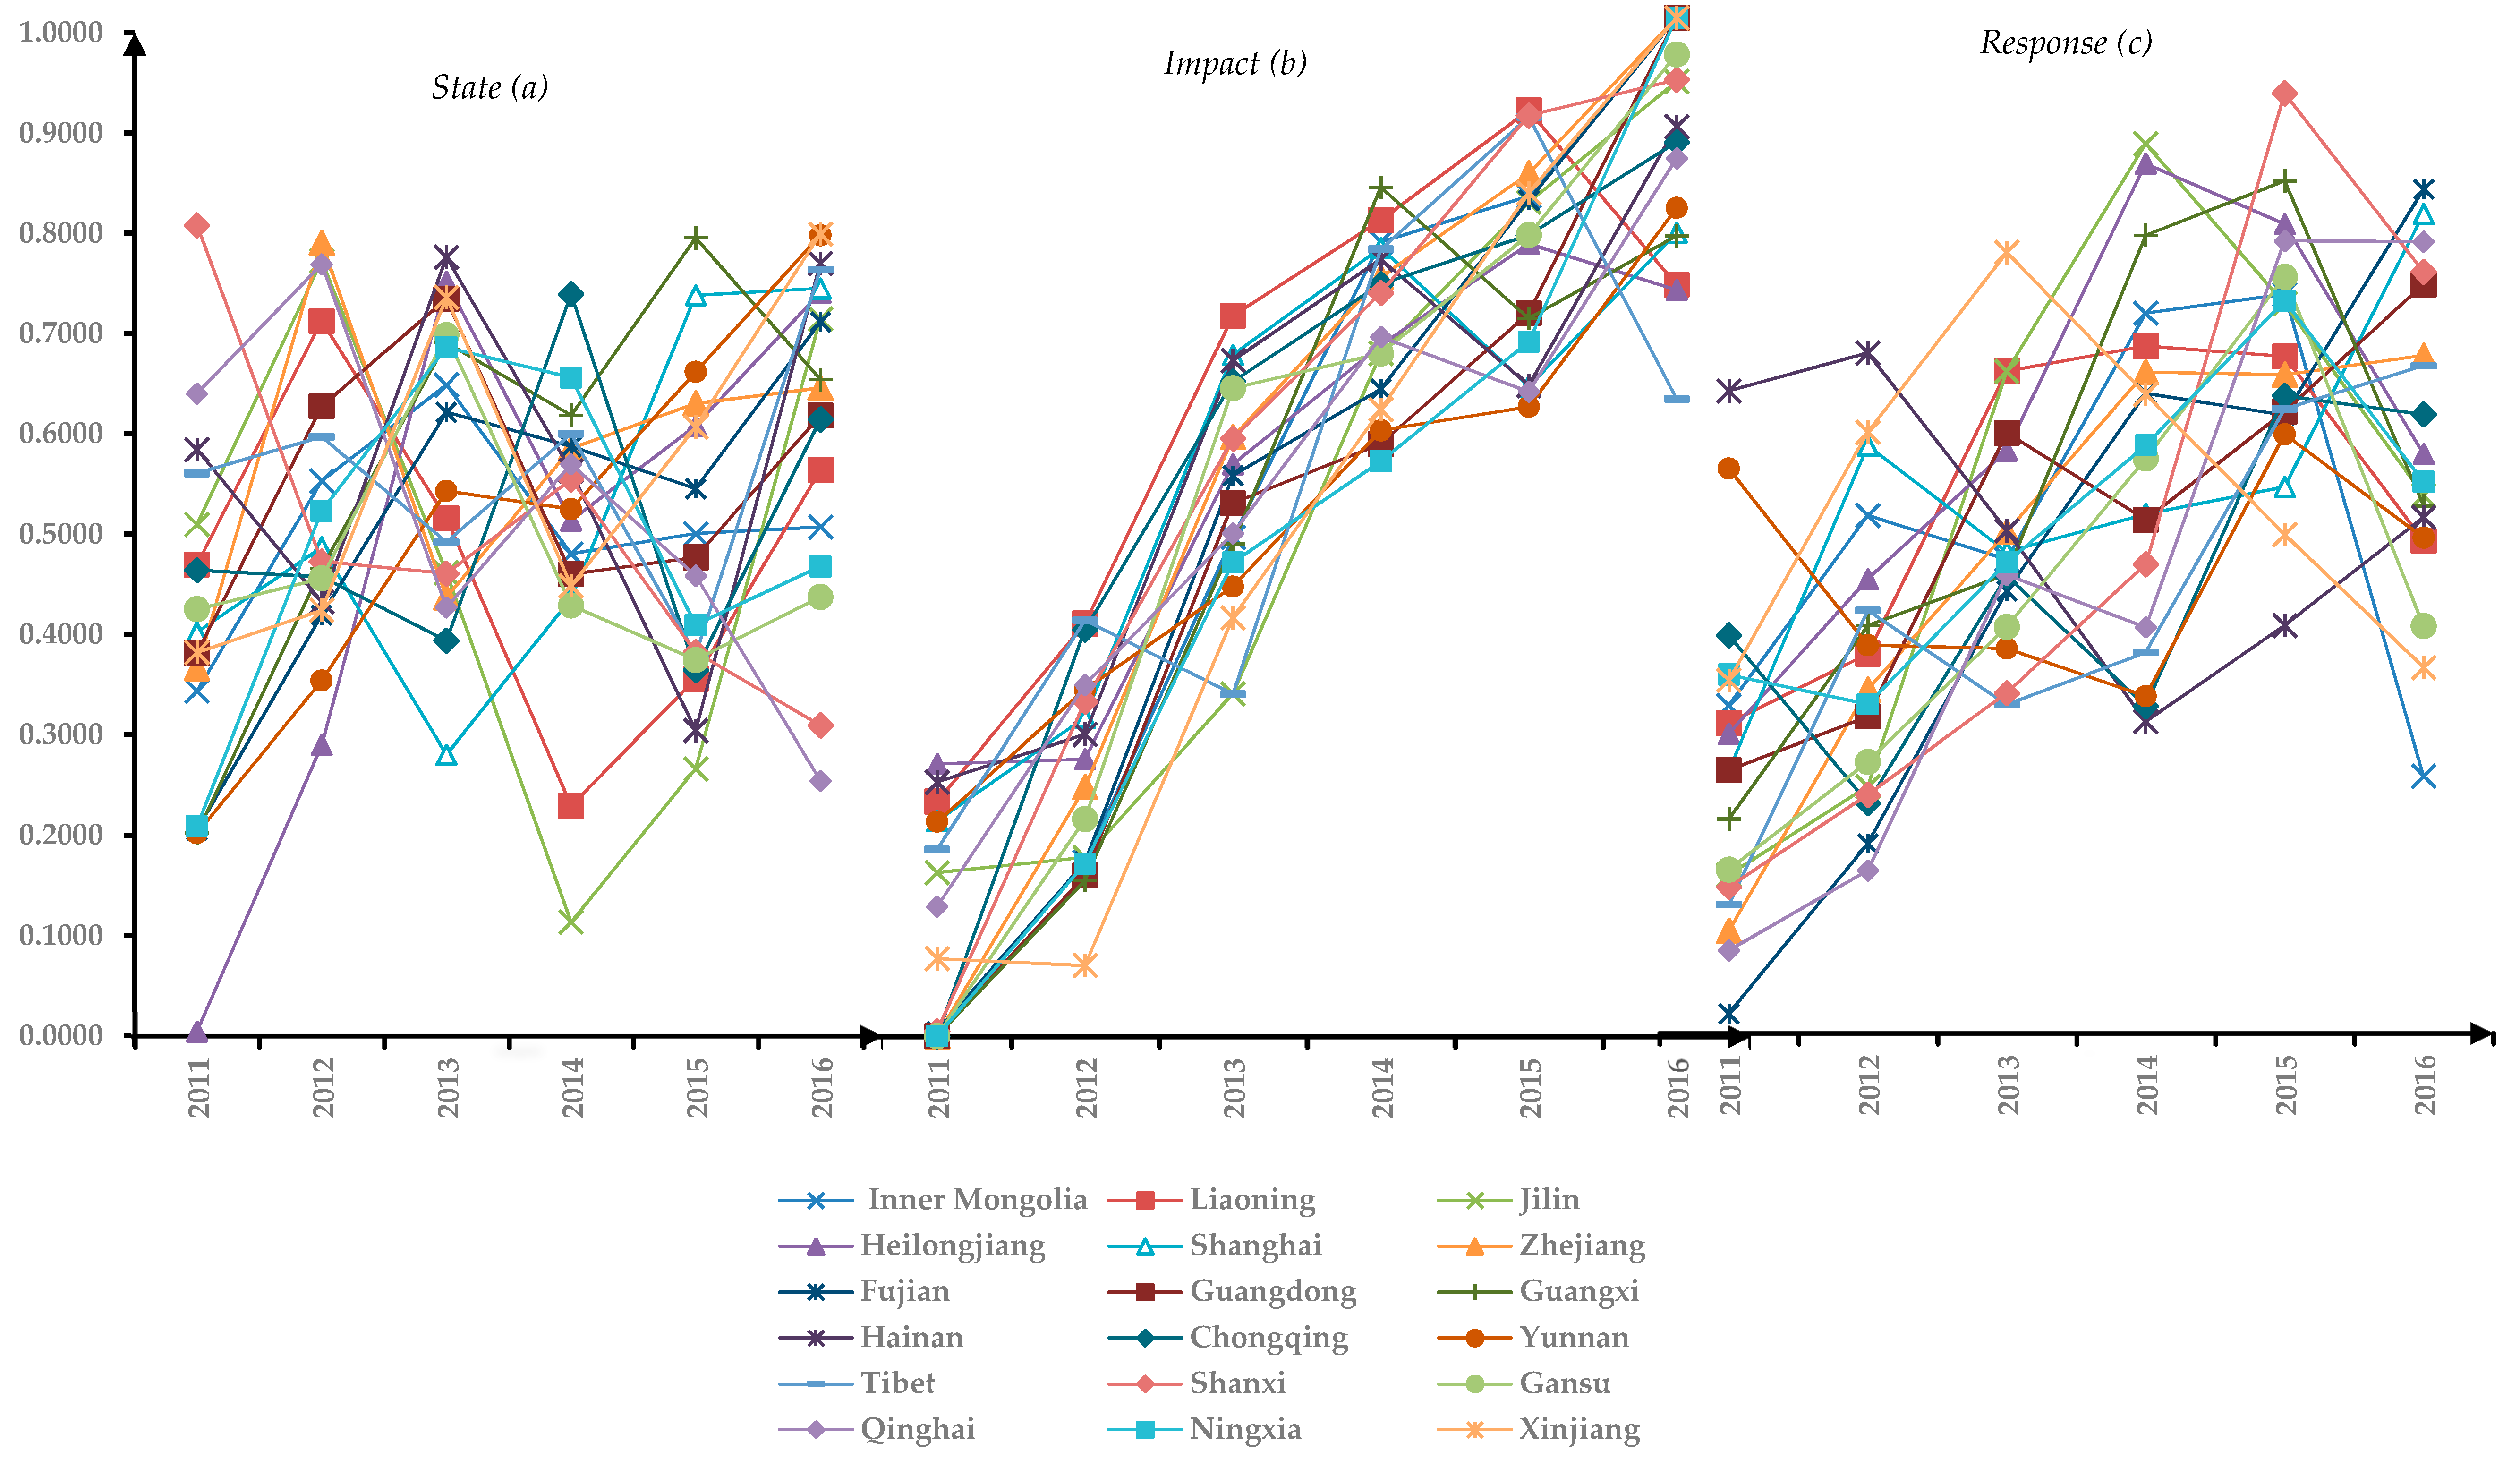
The evaluation values for Driving Forces, Carrying Capacity, State, and Responses in the B&R of China region show a fluctuating trend from 2011 to 2016 (see Figure 5, Figure 6, and Appendix Table A4). The assessment values of Pressures and Impacts subsystems depict an upward trend during this period. The value of each subsystem shows an upward trend and reflects the following three main points: (1) China has paid more attention to sustainable water resource management in recent years. (2) The various investments in water resources’ protection made by the Chinese provincial government have yielded encouraging results. For example, with the support of government subsidies, progressive drip irrigation technology for agricultural water use is continuously improving the efficiency of water use. (3) The government is increasingly aware that water insecurity is a risk that limits sustainable economic development. Therefore, within the time period from 2011 to 2016, China’s government successively issued stringent policies for sustainable water resource management. Ecological civilization construction and river (lake) chiefs are typical examples of these series of strict water resources protection policies put in place during this time period. These policies contribute to the improvement of water security. However, there is still room for improvement.
In the Driving Forces subsystem, the indicators of per capita income, the urbanization rate, and the green coverage rate show a rising trend, while Engel’s coefficient shows a decreasing pattern. These increase the subsystem’s value. Due to the slowing growth rate of GDP, the value of the Driving Forces subsystem shows a fluctuating trend.
By observing the assessment values of Carrying Capacity and State, it’s not difficult to see that the continuous increase in population and fluctuation of annual precipitation aggravate the problem of water insecurity. The increase of per capita water use and the decrease of per capita land use result in the fluctuation in these two subsystems’ assessment values. This confirms the fact that environmental protection should be balanced with socio-economic development [77,78]. That’s why the weights of Carrying Capacity and State subsystem are greater in the water resource security assessment index (See Appendix Table A1).
The Pressures and Responses subsystems achieved relatively high values in the assessment framework due to the increase of government inputs, such as the reduction of waste-water discharge, the increase of water consumption efficiency and the increase of sewage treatment efficiency.
Further, it is worth noting that the high efficiency of water resources development and utilization limited the growth of the assessment values of Pressures subsystem. In order to improve its value, environmental protection expenditure and improvement and popularization of efficient water resources utilization technologies need to be researched. At the same time, environmental protection expenditures and investments in science and technology need to be increased in order to support the upgrading and promotion of water resources utilization technologies. Vulnerable areas are more exposed and less capable of adapting to various stress factors due to limited infrastructure and inputs [79]. As a result, acceptable investment in environmental protection and science and technology are much needed to enhance water availability and protect these areas from the negative consequences of water insecurity.
For the SSPG area, the values of Driving Forces and State are slightly higher than the One Road and One Belt regions. This is because the provincial governments in this region have better water resources use and protection systems as well as faster economic growth. In areas where the population number is small, the geographical location is relatively closed, and the economic status is comparatively weaker, water pollution and use inefficiency are not significant. These factors have positive effects on the value of Carrying Capacity and State subsystems, but negative effects on the value of Response and Pressure subsystems. That means the government prioritizes economic development in these regions. For this reason, investment in environmental protection is minimal. Hence, provinces like Tibet, Chongqing, and Yunnan require more investment in ecological and water resources protection initiatives to boost the values of the State and Pressures subsystems. At the same time, they need to take advantage of the B&R initiative to seek industrial cooperation with foreign countries, upgrade domestic industries, and realize positive interactions between economic development and water resources protection.
The assessment of Pressures, Impacts, and Carrying Capacity subsystems show higher values for One Road region than the SSPG and One Belt areas. This might be due to better water resources endowment, advanced water resources utilization technology, and better economic development. Many previous studies have stated that social and economic systems were the most influential factors in the water resource system [80,81]. Therefore, it is necessary to balance the investment in water resources management with the urbanization rate.
Compared to the other two regions, the One Belt area achieved a higher assessment value for the Responses subsystem. Although most provinces in the One Belt region have poor water resource endowment, relatively dry climate and undeveloped economies, they are willing to adopt active policies to solve water security problems. Therefore, their Responses subsystem evaluation value is relatively high. However, the values of State and Carrying Capacity subsystems for the One Belt region is relatively lower. The region needs to take measures to complement its weak spots. Provinces like Ningxia, Xinjiang, and Shanxi, which have lower scores for the subsystem of State, need to use various means to conduct water trading while actively improving water resource utilization efficiency. Except for Heilongjiang, which has strong Carrying Capacity, other provinces’ assessment values are relatively low. Gansu, Ningxia, Liaoning, and Inner Mongolia occupy the last four positions on the rank. Hence, strengthening ecological governance, conserving water sources, and implementing a water trading market are the main courses of action that need to be strengthened in those five provinces.
3.4. Water Security Prediction for the One Belt and One Road Region in China
Using the data for the factors listed in the water security assessment index for the time period from 2011 to 2016, the Grey Model is used to predict the water security level of the B&R region for the next six years. In order to verify the accuracy of the prediction results, we test its stability by calculating the average relative error, variance ratio, and small error probability of each province and municipality (See Table 5). According to the result, the simulation results are reliable and acceptable.
The Grey Prediction results show that the water security of the B&R area will keep rising steadily from 2017 to 2022 (See Table 6). The average water security index value in 2022 will be 1.3269, nearly double the value in 2017, which is 0.7318. This shows that as long as the relationship between socioeconomic development and environmental protection is well balanced, water security will continue to improve. It is also worth noting that the prediction of results is based on data from 2011–2016. With China’s economic growth slowing down in the future and with an increasing population, the availability of water will be limited. Thus, the B&R initiative might meet more water-related challenges and the predictions might be overestimated. The One Belt area and the SSPG area need further restructuring of the industrial sector in order to save water and promote water trading. For the One Road area, the popularization of water-saving and sewage treatment technologies (e.g., closed-loop cycles in industrial processes and efficient removal of pharmaceuticals from wastewater) are needed in the future [82].
4. Conclusions and Recommendations
From the assessment of water security in provinces and municipalities of the B&R in China for the time period from 2011 to 2016, the following conclusions are drawn: (1) Water security level is dynamic. It is highly influenced by the subsystem of Responses, State, Pressures, and Carrying Capacity. (2) The spatial water security variation within the study area depicts the following trend: the One Road area is doing slightly better than the other two regions. While the water security improvement rate depicts the following pattern: the One Belt area is better than the Strategy Support and Pivotal Gateway of the B&R area (SSPG area), and the SSPG area is better than the One Road area. (3) From the perspective of each subsystem, the evaluation values for Driving Forces, Carrying Capacity, State, and Responses in the B&R of China region show a fluctuating trend from 2011 to 2016. The assessment values of the Pressures and Impacts subsystems depict an upward trend during this period. (4) The results from the Grey Model show that the water security of the B&R region in China will portray a rising trend from 2017 to 2022.
The One Belt and One Road Initiative is both an opportunity and a challenge to the water resources protection and socio-economic development of all the provinces and municipalities in China. There is no doubt that the B&R initiative’s opportunities outweigh its challenges. Compared with the traditional water resources management, a wide area management scheme like the B&R initiative has broad advantages and addresses more challenges.
The subsystems of State, Pressures, Carrying Capacity, and Responses are the most important factors which have great influence on water security. The government cannot entirely solve the water security problems only by working on the subsystem of Responses. The government needs to innovate water resource management mechanisms and design stricter enforcing measures for efficient use and allocation of water.
Therefore, it’s better to consider the following aspects. Firstly, the central government needs to introduce more incentive policies to promote cross-regional and provincial water trading cases, leading to the improvement of water resources utilization rate and optimal allocation of water resources. Secondly, the policymakers need to carry out stricter water pollution control measures, and control the discharge of waste-water and improve the sewage treatment rate. Thirdly, the provincial government needs to consider appropriately increasing investment of infrastructure construction and innovative water-saving technology, and perfect the relevant new and existing laws and regulations so as to ensure the sustainable utilization of water resources. Lastly, all regions need to formulate mutually complementary water consumption strategic plans according to the water resource endowment of each region in order to balance socio-economic development and ecological conservation. These measures will fundamentally improve the water security level of China’s B&R region.
In summary, the main contributions of this paper are the following: First of all, it presents a water security assessment index system using the Driving Forces-Pressures-Carrying Capacity-State-Impacts-Responses model. Then, it identifies the limitations of methodological approaches used for water security assessment and the evolution of the DPCSIR model. Finally, it puts forward specific suggestions for water resource management policies in the B&R region of China, which might be beneficial to improve the water security status of this region.
Author Contributions
Z.Z. and M.A. proposed the research ideas and methods. W.H., J.S., D.M.D., Z.L. and L.Y. revised the paper. M.A. and X.W. were responsible for data collection and creating the figures.
Acknowledgments
This research was funded by the project from the National Natural Science Foundation of China (No.71874101). The authors appreciate the support.
Conflicts of Interest
The authors declare no conflict of interest.
Abbreviations
The following abbreviations are used in this manuscript:
| DPCSIR | Driving Forces-Pressures-Carrying Capacity-State-Impacts-Responses |
| B&R | One Belt and One Road Initiative |
| SSPG | The Strategy Support and Pivotal Gateway of One Belt and One Road Initiative |
Appendix A

Table A1.
The impact coefficient of DPCSIR subsystems on water security in the One Belt and One Road region of China from 2011 to 2016.
Table A1.
The impact coefficient of DPCSIR subsystems on water security in the One Belt and One Road region of China from 2011 to 2016.
| Regional Division | Provinces and Municipalities | D | P | C | S | I | R |
|---|---|---|---|---|---|---|---|
| One Belt Area | Inner Mongolia | 0.1630 | 0.1692 | 0.1669 | 0.1690 | 0.1316 | 0.2003 |
| Liaoning | 0.1680 | 0.1664 | 0.1667 | 0.1710 | 0.1328 | 0.1951 | |
| Jilin | 0.1640 | 0.1706 | 0.1619 | 0.1690 | 0.1335 | 0.2010 | |
| Heilongjiang | 0.1632 | 0.1669 | 0.1657 | 0.1688 | 0.1330 | 0.2024 | |
| Shanxi | 0.1606 | 0.1702 | 0.1666 | 0.1707 | 0.1324 | 0.1994 | |
| Gansu | 0.1628 | 0.1668 | 0.1637 | 0.1716 | 0.1322 | 0.2030 | |
| Qinghai | 0.1642 | 0.1678 | 0.1632 | 0.1701 | 0.1328 | 0.2018 | |
| Ningxia | 0.1608 | 0.1693 | 0.1653 | 0.1707 | 0.1320 | 0.2019 | |
| Xinjiang | 0.1608 | 0.1658 | 0.1697 | 0.1695 | 0.1323 | 0.2019 | |
| One Road Area | Shanghai | 0.1658 | 0.1709 | 0.1636 | 0.1645 | 0.1322 | 0.2031 |
| Zhejiang | 0.1635 | 0.1691 | 0.1670 | 0.1678 | 0.1325 | 0.2001 | |
| Fujian | 0.1625 | 0.1709 | 0.1657 | 0.1717 | 0.1305 | 0.1988 | |
| Guangdong | 0.1669 | 0.1694 | 0.1607 | 0.1673 | 0.1327 | 0.2030 | |
| Hainan | 0.1619 | 0.1671 | 0.1692 | 0.1661 | 0.1328 | 0.2028 | |
| SSPG Area | Guangxi | 0.1605 | 0.1682 | 0.1701 | 0.1690 | 0.1318 | 0.2005 |
| Chongqing | 0.1641 | 0.1665 | 0.1637 | 0.1711 | 0.1340 | 0.2007 | |
| Yunnan | 0.1582 | 0.1680 | 0.1676 | 0.1723 | 0.1317 | 0.2022 | |
| Tibet | 0.1660 | 0.1690 | 0.1694 | 0.1650 | 0.1313 | 0.1994 | |
| Average Value | 0.1632 | 0.1684 | 0.1659 | 0.1692 | 0.1692 | 0.2010 | |
Note: SSPG area is short for the strategy support and pivotal gateway of B&R areas.
Table A2.
The marginal growth rate of the One Belt and One Road region in China from 2012 to 2016.
| Regional Division | Provinces and Municipalities | 2012 | 2013 | 2014 | 2015 | 2016 |
|---|---|---|---|---|---|---|
| One Belt Area | Inner Mongolia | 0.7049 | 0.1987 | 0.0708 | 0.0718 | 0.0275 |
| Liaoning | 0.6848 | 0.3313 | −0.1343 | 0.1720 | 0.0059 | |
| Jilin | 0.5577 | 0.1953 | −0.0065 | 0.1841 | 0.3848 | |
| Heilongjiang | 0.8490 | 0.5160 | 0.0009 | 0.1103 | 0.1257 | |
| Shanxi | 0.0359 | 0.1496 | 0.1946 | 0.1609 | 0.0464 | |
| Gansu | 0.2510 | 0.3790 | −0.0071 | 0.0842 | 0.1063 | |
| Qinghai | 0.4827 | 0.0007 | 0.2140 | 0.0034 | 0.1889 | |
| Ningxia | 0.3594 | 0.3020 | 0.0412 | 0.0537 | 0.1203 | |
| Xinjiang | 0.1089 | 0.4850 | −0.1704 | 0.2071 | 0.2049 | |
| One Road Area | Shanghai | 0.1396 | 0.0202 | 0.2940 | 0.1685 | 0.1523 |
| Zhejiang | 0.4692 | 0.0922 | 0.2136 | 0.1125 | 0.0995 | |
| Fujian | 0.8840 | 0.3338 | 0.0715 | 0.0604 | 0.2954 | |
| Guangdong | 0.1765 | 0.3919 | −0.1008 | 0.1138 | 0.3437 | |
| Hainan | 0.0691 | 0.2771 | −0.1226 | −0.0654 | 0.5367 | |
| SSPG Area | Guangxi | 0.5612 | 0.2061 | 0.1881 | 0.0842 | 0.0030 |
| Chongqing | 0.1295 | 0.1652 | 0.1843 | −0.0273 | 0.1995 | |
| Yunnan | 0.1329 | 0.2449 | 0.0659 | 0.2283 | 0.1877 | |
| Tibet | 0.3292 | 0.0052 | 0.0509 | 0.0446 | 0.1317 |
Table A3.
The key indicators affecting the marginal growth rate of four provinces.
| Liaoning | Guangdong | Hainan | Xinjiang | |
|---|---|---|---|---|
| Responses | R1; R2; R6 | R3; R4 | R3; R4 | R3; R4 |
| State | S2; S3 | S1; S3; S4 | S1; S3; S4 | S1; S3; S4 |
| Pressures | P3; P2 | P3; P5 | P3; P5 | P3; P5 |
| Carrying Capacity | C3; C5; C2 | C1; C3; C5 | C1; C3; C5 | C1; C3; C5 |
| Driving Forces | D1; D3; D5 | D3; D4 | D3; D4; D5 | D3; D4; D5 |
| Impacts | —— | I3; I4 | I3; I4 | —— |
Note: Saving water consumption is short for R1; Urban sewage treatment rate is for R2; Treatment capacity of urban sewage treatment plants is short for R3; Length of water supply pipe is short for R4; The proportion of science and Technology expenditure is Short for R6; Daily water supply capacity is short for S1; Daily water consumption per capita is short for S2; Agricultural water consumption is short for S3; Industrial water consumption is short for S4; Utilization rate of water resource development is short for P2; Discharge of industrial waste-water from ten thousand Yuan output value is short for P3; Ammonia Nitrogen discharge is short for P5; Effective irrigation area is short for C1; Per capita cultivated land area is short for C2; Per capita water resources is short for C3; Annual precipitation is short for C5; GDP growth rate is short for D1; Population density is short for D2; Per capita net income (Yuan) of urban residents is short for D3; Engel coefficient is short for D4; Population growth rate is short for D5; Proportion of added value of Tertiary industry is short for I3; Green coverage rate of built-up Areas is short for I4.
Table A4.
The evaluation values of subsystems in the One Belt and One Road region of China from 2011 to 2016.
Table A4.
The evaluation values of subsystems in the One Belt and One Road region of China from 2011 to 2016.
| Regional Division | Provinces and Municipalities | Driving Force Index | Mean Value | Ranking | |||||
| 2011 | 2012 | 2013 | 2014 | 2015 | 2016 | ||||
| One Belt area | Inner Mongolia Liaoning | 0.5954 | 0.5273 | 0.4454 | 0.4205 | 0.4816 | 0.4170 | 0.4812 | 12 |
| 0.2080 | 0.3107 | 0.5760 | 0.5437 | 0.7286 | 0.7333 | 0.5167 | 3 | ||
| Jilin | 0.3882 | 0.3102 | 0.3665 | 0.3257 | 0.3950 | 0.8208 | 0.4344 | 18 | |
| Heilongjiang | 0.3964 | 0.4115 | 0.5588 | 0.5329 | 0.5628 | 0.6870 | 0.5249 | 1 | |
| Shanxi | 0.4159 | 0.4777 | 0.3401 | 0.4456 | 0.5936 | 0.5817 | 0.4758 | 14 | |
| Gansu | 0.5361 | 0.4546 | 0.5355 | 0.5559 | 0.4694 | 0.5156 | 0.5112 | 4 | |
| Qinghai | 0.5890 | 0.5208 | 0.4819 | 0.4885 | 0.4783 | 0.5073 | 0.5110 | 5 | |
| Ningxia | 0.5776 | 0.5118 | 0.4402 | 0.3224 | 0.3661 | 0.4268 | 0.4408 | 17 | |
| Xinjiang | 0.3900 | 0.4657 | 0.5500 | 0.4094 | 0.5792 | 0.6161 | 0.5017 | 8 | |
| One Road area | Shanghai | 0.6153 | 0.4361 | 0.4752 | 0.3530 | 0.4591 | 0.4219 | 0.4601 | 15 |
| Zhejiang | 0.6107 | 0.4699 | 0.5468 | 0.4877 | 0.5261 | 0.3947 | 0.5060 | 6 | |
| Fujian | 0.5961 | 0.5750 | 0.5530 | 0.4512 | 0.4194 | 0.4015 | 0.4994 | 9 | |
| Guangdong | 0.6676 | 0.4772 | 0.3166 | 0.4259 | 0.4489 | 0.4081 | 0.4574 | 16 | |
| Hainan | 0.3801 | 0.4751 | 0.5674 | 0.5482 | 0.5610 | 0.5701 | 0.5170 | 2 | |
| SSPG area | Guangxi | 0.5619 | 0.6227 | 0.5400 | 0.4580 | 0.4342 | 0.4159 | 0.5054 | 7 |
| Chongqing | 0.6333 | 0.5585 | 0.4386 | 0.4438 | 0.4489 | 0.4000 | 0.4872 | 11 | |
| Yunnan | 0.4070 | 0.4165 | 0.5661 | 0.4686 | 0.5159 | 0.5661 | 0.4900 | 10 | |
| Tibet | 0.6335 | 0.4325 | 0.6158 | 0.4268 | 0.4610 | 0.3018 | 0.4786 | 13 | |
| Regional Division | Provinces and Municipalities | Pressure Index | Mean Value | Ranking | |||||
| 2011 | 2012 | 2013 | 2014 | 2015 | 2016 | ||||
| One Road area | Inner Mongolia | 0.0095 | 0.2647 | 0.5015 | 0.4544 | 0.4645 | 0.7777 | 0.3697 | 7 |
| Liaoning | 0.1390 | 0.4102 | 0.5954 | 0.3939 | 0.4866 | 0.6232 | 0.2943 | 18 | |
| Jilin | 0.0496 | 0.2468 | 0.4381 | 0.3002 | 0.3471 | 0.9503 | 0.3480 | 12 | |
| Heilongjiang | 0.0231 | 0.1044 | 0.4235 | 0.4268 | 0.4503 | 0.8691 | 0.3227 | 14 | |
| Shanxi | 0.2089 | 0.2991 | 0.4460 | 0.4906 | 0.3571 | 0.7369 | 0.4352 | 2 | |
| Gansu | 0.1573 | 0.3307 | 0.4972 | 0.4960 | 0.4122 | 0.8222 | 0.4048 | 4 | |
| Qinghai | 0.0564 | 0.4447 | 0.4370 | 0.6055 | 0.4004 | 0.7780 | 0.4242 | 3 | |
| Ningxia | 0.0000 | 0.3387 | 0.4326 | 0.4499 | 0.4898 | 0.9545 | 0.3644 | 8 | |
| Xinjiang | 0.1555 | 0.1369 | 0.2984 | 0.2845 | 0.4624 | 1.0000 | 0.3057 | 17 | |
| One Belt area | Shanghai | 0.0000 | 0.2543 | 0.2971 | 0.5674 | 0.7351 | 0.9955 | 0.3579 | 10 |
| Zhejiang | 0.0000 | 0.3159 | 0.3394 | 0.5103 | 0.6640 | 0.9933 | 0.3302 | 13 | |
| Fujian | 0.0000 | 0.3382 | 0.3647 | 0.4441 | 0.5499 | 1.0000 | 0.3774 | 6 | |
| Guangdong | 0.0000 | 0.2322 | 0.4061 | 0.3763 | 0.5613 | 1.0000 | 0.3501 | 11 | |
| Hainan | 0.2018 | 0.2917 | 0.5124 | 0.4905 | 0.4225 | 0.9738 | 0.3137 | 15 | |
| SSPG area | Guangxi | 0.0000 | 0.2322 | 0.3576 | 0.4372 | 0.5923 | 0.9782 | 0.3073 | 16 |
| Chongqing | 0.0313 | 0.1995 | 0.2773 | 0.5734 | 0.4987 | 0.8794 | 0.3591 | 9 | |
| Yunnan | 0.0000 | 0.2233 | 0.3930 | 0.5099 | 0.6027 | 1.0000 | 0.3810 | 5 | |
| Tibet | 0.3102 | 0.6439 | 0.7567 | 0.5621 | 0.3699 | 0.7043 | 0.4422 | 1 | |
| Regional Division | Provinces and Municipalities | Carrying Capacity Index | Mean Value | Ranking | |||||
| 2011 | 2012 | 2013 | 2014 | 2015 | 2016 | ||||
| One Belt area | Inner Mongolia | 0.3432 | 0.5530 | 0.6487 | 0.4804 | 0.5006 | 0.5070 | 0.2818 | 14 |
| Liaoning | 0.4694 | 0.7125 | 0.5160 | 0.2294 | 0.3556 | 0.5639 | 0.2708 | 15 | |
| Jilin | 0.5097 | 0.7723 | 0.4613 | 0.1134 | 0.2663 | 0.7145 | 0.2921 | 11 | |
| Heilongjiang | 0.0042 | 0.2898 | 0.7518 | 0.5136 | 0.6081 | 0.7408 | 0.3605 | 2 | |
| Shanxi | 0.8079 | 0.4726 | 0.4606 | 0.5545 | 0.3822 | 0.3091 | 0.2685 | 16 | |
| Gansu | 0.4250 | 0.4557 | 0.6983 | 0.4288 | 0.3745 | 0.4372 | 0.2389 | 18 | |
| Qinghai | 0.6401 | 0.7690 | 0.4268 | 0.5697 | 0.4585 | 0.2545 | 0.2864 | 13 | |
| Ningxia | 0.2092 | 0.5232 | 0.6860 | 0.6561 | 0.4093 | 0.4678 | 0.2656 | 17 | |
| Xinjiang | 0.3820 | 0.4241 | 0.7362 | 0.4484 | 0.6068 | 0.7992 | 0.3417 | 7 | |
| One Road area | Shanghai | 0.4021 | 0.4869 | 0.2803 | 0.4360 | 0.7382 | 0.7449 | 0.3469 | 4 |
| Zhejiang | 0.3662 | 0.7905 | 0.4370 | 0.5853 | 0.6302 | 0.6458 | 0.3543 | 3 | |
| Fujian | 0.2052 | 0.4192 | 0.6214 | 0.5874 | 0.5453 | 0.7115 | 0.2876 | 12 | |
| Guangdong | 0.3812 | 0.6274 | 0.7344 | 0.4600 | 0.4767 | 0.6183 | 0.3020 | 9 | |
| Hainan | 0.5843 | 0.4323 | 0.7762 | 0.5632 | 0.3040 | 0.7699 | 0.3912 | 1 | |
| SSPG area | Guangxi | 0.2021 | 0.4657 | 0.6910 | 0.6183 | 0.7955 | 0.6542 | 0.3420 | 6 |
| Chongqing | 0.4639 | 0.4573 | 0.3937 | 0.7392 | 0.3643 | 0.6143 | 0.2975 | 10 | |
| Yunnan | 0.2021 | 0.3537 | 0.5429 | 0.5248 | 0.6616 | 0.7979 | 0.3196 | 8 | |
| Tibet | 0.5606 | 0.5970 | 0.4919 | 0.5999 | 0.3798 | 0.7637 | 0.3456 | 5 | |
| Regional Division | Provinces and Municipalities | State Index | Mean Value | Ranking | |||||
| 2011 | 2012 | 2013 | 2014 | 2015 | 2016 | ||||
| One Belt area | Inner Mongolia | 0.1777 | 0.4702 | 0.5249 | 0.4610 | 0.5480 | 0.8171 | 0.4998 | 5 |
| Liaoning | 0.2578 | 0.5269 | 0.6070 | 0.5355 | 0.5980 | 0.6209 | 0.5243 | 3 | |
| Jilin | 0.2323 | 0.5561 | 0.4340 | 0.3950 | 0.7033 | 0.6165 | 0.4895 | 8 | |
| Heilongjiang | 0.2242 | 0.6620 | 0.4864 | 0.3648 | 0.5562 | 0.6064 | 0.4833 | 10 | |
| Shanxi | 0.5714 | 0.4693 | 0.4765 | 0.4750 | 0.4429 | 0.4905 | 0.4876 | 9 | |
| Gansu | 0.5367 | 0.5760 | 0.4732 | 0.4660 | 0.6371 | 0.7635 | 0.5754 | 1 | |
| Qinghai | 0.3262 | 0.4712 | 0.3822 | 0.5429 | 0.4587 | 0.6771 | 0.4764 | 12 | |
| Ningxia | 0.5236 | 0.4570 | 0.5732 | 0.6048 | 0.6694 | 0.4571 | 0.5475 | 2 | |
| Xinjiang | 0.6020 | 0.4335 | 0.4702 | 0.3575 | 0.4248 | 0.3645 | 0.4421 | 16 | |
| One Road area | Shanghai | 0.6350 | 0.2872 | 0.3027 | 0.5932 | 0.6313 | 0.5104 | 0.4933 | 7 |
| Zhejiang | 0.6222 | 0.3389 | 0.3647 | 0.3724 | 0.4311 | 0.4352 | 0.4274 | 17 | |
| Fujian | 0.3561 | 0.5508 | 0.5367 | 0.5369 | 0.5679 | 0.5845 | 0.5221 | 4 | |
| Guangdong | 0.5236 | 0.3832 | 0.4963 | 0.4304 | 0.2853 | 0.4180 | 0.4228 | 18 | |
| Hainan | 0.3678 | 0.4302 | 0.4348 | 0.4239 | 0.5290 | 0.6673 | 0.4755 | 14 | |
| SSPG area | Guangxi | 0.5739 | 0.5501 | 0.4622 | 0.4147 | 0.4351 | 0.5424 | 0.4964 | 6 |
| Chongqing | 0.4649 | 0.5222 | 0.5424 | 0.4831 | 0.4242 | 0.4194 | 0.4760 | 13 | |
| Yunnan | 0.4584 | 0.4373 | 0.3898 | 0.4934 | 0.5371 | 0.5827 | 0.4831 | 11 | |
| Tibet | 0.3910 | 0.4136 | 0.4078 | 0.4271 | 0.5585 | 0.5791 | 0.4628 | 15 | |
| Regional Division | Provinces and Municipalities | Impact Index | Mean Value | Ranking | |||||
| 2011 | 2012 | 2013 | 2014 | 2015 | 2016 | ||||
| One Belt area | Inner Mongolia | 0.0000 | 0.1713 | 0.4894 | 0.7797 | 0.8246 | 1.0000 | 0.1604 | 16 |
| Liaoning | 0.2303 | 0.4049 | 0.7071 | 0.8010 | 0.9088 | 0.7375 | 0.2643 | 1 | |
| Jilin | 0.1607 | 0.1756 | 0.3358 | 0.6702 | 0.8187 | 0.9375 | 0.2068 | 11 | |
| Heilongjiang | 0.2674 | 0.2721 | 0.5613 | 0.6780 | 0.7779 | 0.7326 | 0.2244 | 6 | |
| Shanxi | 0.0047 | 0.3281 | 0.5865 | 0.7297 | 0.9039 | 0.9390 | 0.2190 | 8 | |
| Gansu | 0.0000 | 0.2133 | 0.6360 | 0.6702 | 0.7864 | 0.9639 | 0.1677 | 15 | |
| Qinghai | 0.1272 | 0.3446 | 0.4933 | 0.6863 | 0.6326 | 0.8618 | 0.2092 | 9 | |
| Ningxia | 0.0000 | 0.1695 | 0.4649 | 0.5642 | 0.6817 | 1.0000 | 0.1403 | 18 | |
| Xinjiang | 0.0762 | 0.0694 | 0.4107 | 0.6152 | 0.8280 | 1.0000 | 0.1429 | 17 | |
| One Road area | Shanghai | 0.2115 | 0.3125 | 0.6688 | 0.7737 | 0.6378 | 0.7885 | 0.2251 | 4 |
| Zhejiang | 0.0000 | 0.2448 | 0.5882 | 0.7451 | 0.8470 | 1.0000 | 0.2249 | 5 | |
| Fujian | 0.0046 | 0.1710 | 0.5502 | 0.6352 | 0.8205 | 1.0000 | 0.2226 | 7 | |
| Guangdong | 0.0000 | 0.1579 | 0.5230 | 0.5814 | 0.7098 | 1.0000 | 0.1848 | 14 | |
| Hainan | 0.2497 | 0.2961 | 0.6633 | 0.7626 | 0.6388 | 0.8931 | 0.2466 | 2 | |
| SSPG area | Guangxi | 0.0000 | 0.1529 | 0.4833 | 0.8333 | 0.7046 | 0.7857 | 0.1899 | 13 |
| Chongqing | 0.0000 | 0.3989 | 0.6426 | 0.7383 | 0.7864 | 0.8778 | 0.1956 | 12 | |
| Yunnan | 0.2107 | 0.3401 | 0.4411 | 0.5945 | 0.6177 | 0.8132 | 0.2258 | 3 | |
| Tibet | 0.1834 | 0.4080 | 0.3355 | 0.7725 | 0.9026 | 0.6255 | 0.2083 | 10 | |
| Regional Division | Provinces and Municipalities | Response Index | Mean Value | Ranking | |||||
| 2011 | 2012 | 2013 | 2014 | 2015 | 2016 | ||||
| One Belt area | Inner Mongolia | 0.3250 | 0.5141 | 0.4704 | 0.7152 | 0.7341 | 0.2551 | 0.3881 | 6 |
| Liaoning | 0.3074 | 0.3765 | 0.6575 | 0.6824 | 0.6721 | 0.4888 | 0.3937 | 4 | |
| Jilin | 0.1572 | 0.2450 | 0.6573 | 0.8837 | 0.7246 | 0.5339 | 0.3948 | 3 | |
| Heilongjiang | 0.2971 | 0.4509 | 0.5785 | 0.8639 | 0.8037 | 0.5753 | 0.3685 | 7 | |
| Shanxi | 0.1450 | 0.2368 | 0.3376 | 0.4655 | 0.9338 | 0.7563 | 0.3493 | 11 | |
| Gansu | 0.1623 | 0.2694 | 0.4034 | 0.5707 | 0.7514 | 0.4041 | 0.2972 | 16 | |
| Qinghai | 0.0819 | 0.1615 | 0.4550 | 0.4029 | 0.7871 | 0.7862 | 0.3029 | 15 | |
| Ningxia | 0.3557 | 0.3265 | 0.4673 | 0.5837 | 0.7276 | 0.5474 | 0.3631 | 9 | |
| Xinjiang | 0.3499 | 0.5968 | 0.7755 | 0.6344 | 0.4951 | 0.3629 | 0.4011 | 2 | |
| One Road area | Shanghai | 0.2608 | 0.5834 | 0.4778 | 0.5153 | 0.5426 | 0.8140 | 0.4043 | 1 |
| Zhejiang | 0.1014 | 0.3409 | 0.4975 | 0.6566 | 0.6540 | 0.6731 | 0.3566 | 10 | |
| Fujian | 0.0191 | 0.1881 | 0.4389 | 0.6356 | 0.6137 | 0.8385 | 0.2858 | 18 | |
| Guangdong | 0.2612 | 0.3141 | 0.5961 | 0.5098 | 0.6175 | 0.7440 | 0.3640 | 8 | |
| Hainan | 0.6380 | 0.6756 | 0.4990 | 0.3091 | 0.4047 | 0.5123 | 0.3473 | 12 | |
| SSPG area | Guangxi | 0.2127 | 0.4046 | 0.4554 | 0.7926 | 0.8469 | 0.5235 | 0.3888 | 5 |
| Chongqing | 0.3949 | 0.2287 | 0.4540 | 0.3244 | 0.6330 | 0.6145 | 0.3029 | 14 | |
| Yunnan | 0.5607 | 0.3850 | 0.3818 | 0.3342 | 0.5947 | 0.4920 | 0.3158 | 13 | |
| Tibet | 0.1275 | 0.4196 | 0.3259 | 0.3778 | 0.6199 | 0.6631 | 0.2920 | 17 | |
References
- Jensen, O.; Wu, H. Urban water security indicators: Development and pilot. Environ. Sci. Policy 2018, 83, 33–45. [Google Scholar] [CrossRef]
- Degefu, D.M.; Weijun, H.; Zaiyi, L.; Liang, Y.; Zhengwei, H.; Min, A. Mapping Monthly Water Scarcity in Global Transboundary Basins at Country-Basin Mesh Based Spatial Resolution. Sci. Rep. 2018, 8, 1–10. [Google Scholar] [CrossRef] [PubMed]
- The World Bank. Renewable Internal Freshwater Resources per Capital. Available online: https://data.worldbank.org/indicator/ER.H2O.INTR.PC (accessed on 14 February 2017).
- Flörke, M.; Schneider, C.; Mcdonald, R.I. Water competition between cities and agriculture driven by climate change and urban growth. Nat. Sustain. 2018, 1, 51–58. [Google Scholar] [CrossRef]
- Nazemi, A.; Madani, K. Urban water security: Emerging discussion and remaining challenges. Sustain. Cities Soc. 2018, 41, 925–928. [Google Scholar] [CrossRef]
- Global Water Partnership (GWP). China’s Water Resources Management Challenge; Global Water Partnership (GWP): Stockholm, Sweden, 2015. [Google Scholar]
- Falkenmark, M. Adapting to climate change: Towards societal water security in dry-climate countries. Int. J. Water Resour. Dev. 2013, 29, 123–136. [Google Scholar] [CrossRef]
- Mehta, L. The manufacture of popular perceptions of scarcity: Dams and water-related narratives in Gujarat, India. World Dev. 2001, 29, 2025–2041. [Google Scholar] [CrossRef]
- Falkenmark, M.; Lundqvist, J.; Widstrand, C. Macro-scale water scarcity requires micro-scale approaches. Nat. Resour. Forum 2009, 13, 258–267. [Google Scholar] [CrossRef]
- Hussein, H. Lifting the veil: Unpacking the discourse of water scarcity in Jordan. Environ. Sci. Policy 2018, 89, 385–392. [Google Scholar] [CrossRef]
- Edwards, G.A.S. Shifting constructions of scarcity and the neoliberalization of Australian water governance. Environ. Plan. A 2013, 45, 1873–1890. [Google Scholar] [CrossRef]
- Hussein, H. Whose ‘reality’? Discourses and hydropolitics along the Yarmouk River. Contemp. Levant 2017, 2, 103–115. [Google Scholar] [CrossRef]
- Nicol, A.; Mehta, L.; Allouche, J. Is there ‘some for all rather than all for some’? Perspectives and Pathways since the 1990 New Delhi Statement on Water and Sanitation 1 Introduction. IDS Bull. 2012, 2, 1–9. [Google Scholar] [CrossRef]
- Hussein, H. Tomatoes, tribes, bananas, and businessmen: An analysis of the shadow state and of the politics of water in Jordan. Environ. Sci. Policy 2018, 84, 170–176. [Google Scholar] [CrossRef]
- Hussein, H. Politics of the Dead Sea Canal: A historical review of the evolving discourses, interests, and plans. Water Int. 2017, 42, 527–542. [Google Scholar] [CrossRef]
- Thomas Bolognesi, S.K. Water Security as a Normative Goal or as a Structural Principle for Water Governance; Palgrave MacMillan: London, UK, 2016; ISBN 9781137600868. [Google Scholar]
- Lankford, B.; Bakker, K.; Zeitoun, M.; Conway, D. Water Security: Principles, Perspectives, and Practices; Routledge Taylor & Francis Group: New York, NY, USA; London, UK, 2013; ISBN 9780415534703. [Google Scholar]
- Cook, C.; Bakker, K. Water security: Debating an emerging paradigm. Glob. Environ. Chang. 2012, 22, 94–102. [Google Scholar] [CrossRef]
- Grey, D.; Sadoff, C.W. Sink or Swim? Water security for growth and development. Water Policy 2007, 9, 545–571. [Google Scholar] [CrossRef]
- Global Water Partnership (GWP). Integrated Water Resources Management; Global Water Partnership (GWP): Stockholm, Sweden, 2000. [Google Scholar]
- Bakker, K. Water Security: Research Challenges and Opportunities. Science 2012, 337, 914–915. [Google Scholar] [CrossRef] [PubMed]
- UN-Water. Water Security and the Global Water Agenda: A UN-Water Analytical Brief; UN University: Hamilton, ON, USA, 2013. [Google Scholar]
- Scott, C.A.; Meza, F.J.; Varady, R.G.; Tiessen, H.; Garfin, G.M.; Wilder, M.; Farfán, L.M.; Pablos, N.P.; Scott, C.A.; Meza, F.J.; et al. Americas Water Security and Adaptive Management in the Arid Americas. Ann. Assoc. Am. Geogr. 2013, 103, 37–41. [Google Scholar] [CrossRef]
- Sun, F.; Staddon, C.; Chen, M. Developing and applying water security metrics in China: Experience and challenges. Curr. Opin. Environ. Sustain. 2016, 21, 29–36. [Google Scholar] [CrossRef]
- Wu, X.; Degefu, D.; Yuan, L.; Liao, Z.; He, W.; An, M.; Zhang, Z. Assessment of Water Footprints of Consumption and Production in Transboundary River Basins at Country-Basin Mesh-Based Spatial Resolution. Int. J. Environ. Res. Public Health 2019, 16, 703. [Google Scholar] [CrossRef] [PubMed]
- Gerlak, A.K.; House-peters, L.; Varady, R.G.; Albrecht, T.; Zúñiga-terán, A.; Routson, R.; Grenade, D.; Cook, C.; Scott, C.A. Water security: A review of place-based research. Environ. Sci. Policy 2018, 82, 79–89. [Google Scholar] [CrossRef]
- Aldaya, M.M.; Chapagain, A.K.; Hoekstra, A.Y.; Mekonnen, M.M. The Water Footprint Assessment Manual; Earthscan: London, UK, 2011; ISBN 9781849712798. [Google Scholar]
- Hjorth, P.; Madani, K. Sustainability Monitoring and Assessment: New Challenges Require New Thinking. J. Water Resour. Plan. Manag. 2014, 140, 133–135. [Google Scholar] [CrossRef]
- Garrick, D.; Hall, J.W. Water Security and Society: Risks, Metrics, and Pathways. Annu. Rev. Environ. Resour. 2014, 39, 611–639. [Google Scholar] [CrossRef]
- Sullivan, C. Calculating a Water Poverty Index. World Dev. 2002, 30, 1195–1210. [Google Scholar] [CrossRef]
- Bolognesi, T. The water vulnerability of metro and megacities: An investigation of structural determinants. Nat. Resour. Forum 2015, 39, 123–133. [Google Scholar] [CrossRef]
- Aleksandrova, M.; Gain, A.K. Assessing agricultural systems vulnerability to climate change to inform adaptation planning: An application in Khorezm, Uzbekistan. Mitig. Adapt. Strateg. Glob. Chang. 2016, 1263–1287. [Google Scholar] [CrossRef]
- Global Water Patnership (GWP). Assessing Water Security with Appropriate Indicators; Global Water Patnership (GWP): Stockholm, Sweden, 2014. [Google Scholar]
- Gain, A.; Carlo, K.; Giupponi, Y.W. Measuring global water security towards sustainable development goals. Environ. Res. Lett. 2016, 11, 124015. [Google Scholar] [CrossRef] [Green Version]
- Mcintyre, P.B.; Gessner, M.O.; Dudgeon, D.; Prusevich, A.; Green, P.; Glidden, S.; Bunn, S.E.; Vo, C.J.; Sullivan, C.A.; Liermann, C.R.; et al. Global threats to human water security and river biodiversity. Nature 2010, 467, 555–561. [Google Scholar] [CrossRef] [Green Version]
- Lautze, J.; Mathrithilake, H. Water security: Old concepts, new package, what value? Nat. Resour. Forum 2012, 36. [Google Scholar] [CrossRef]
- United Nation. Transforming Our World: The 2030 Agenda for Sustainable Development; United Nation: New York, NY, USA, 2015. [Google Scholar]
- Hussein, H.; Menga, F.; Greco, F. Monitoring transboundary water cooperation in SDG 6.5.2: How a critical hydropolitics approach can spot inequitable outcomes. Sustainability 2018, 10, 3640. [Google Scholar] [CrossRef]
- Guppy, L.; Mehta, P.; Qadir, M. Sustainable development goal 6: Two gaps in the race for indicators. Sustain. Sci. 2019, 14, 501–513. [Google Scholar] [CrossRef]
- Bolognesi, T.; Gerlak, A.K.; Giuliani, G. Explaining and Measuring Social-Ecological Pathways: The Case of Global Changes and Water Security. Sustainability 2018, 10, 4378. [Google Scholar] [CrossRef]
- Dou, M.; Zhang, H.; Wang, C.; Jin, M. Research on water security regulation modelling driven by development mode. Syst. Eng. Pract. 2015, 35, 2442–2448. [Google Scholar]
- Borji, M.; Nia, A.; Malekian, A.; Salajegheh, A.; Khalighi, S. Comprehensive evaluation of groundwater resources based on DPSIR conceptual framework. Arab. J. Geosci. 2018, 11. [Google Scholar] [CrossRef]
- Chen, X.; Xu, M. Study on water resources carrying capacity of industrial park based on DPCSIR Model. Environ. Sci. Manag. 2012, 37, 144–147. [Google Scholar] [CrossRef]
- Jing, Y.; Ren-duo, Z.; Shi-chuang, W.; Yun-jun, Y.U. The Assessment Method of Coastal Environmental Carrying Capacity. China Environ. Sci. 2013, 33, 178–185. [Google Scholar]
- Wang, C.; Liu, R.; Ge, C. Theoretical Research and Practice of Environmental Carrying Capacity; China Environmental Science Press: Beijing, China, 2011. [Google Scholar]
- Liu, H. The Security Challenges to the ”One Belt and One Road” Strategy and China’s Choices. Pac. J. 2015, 23, 72–79. [Google Scholar] [CrossRef]
- National Bureau of Statistics of China. China Water Resources Bulletin (2011–2016); China Water & Power Press: Beijing, China, 2016. [Google Scholar]
- National Development and Reform Commission; Ministry of Foreign Affairs; Ministry of Commerce of the People’s Republic of China, with State Council authorization. Vision and Proposed Actions Outlined on Jointly Building Silk Road Economic Belt and 21 st-Century Maritime Silk Road; National Development and Reform Commission: Beijing, China, 2015.
- Cheng, L.K. Three questions on China’s Belt and Road Initiative. China Econ. Rev. 2016, 40, 309–313. [Google Scholar] [CrossRef]
- Djankov, S.; Miner, S. China’s Belt and Road Initiative: Motives, Scope and Challenges. Peterson Institute for International Economics. Available online: https://www.tralac.org/news/article/9537-china-s-belt-and-road-initiative-motives-scope-and-challenges.html (accessed on 11 November 2018).
- Huang, Y. Understanding China’s Belt & Road Initiative: Motivation, framework and assessment. China Econ. Rev. 2016, 40, 314–321. [Google Scholar] [CrossRef]
- Nazarko, J.; Kuźmicz, K.A. Introduction to the STEEPVL Analysis of the New Silk Road Initiative. Procedia Eng. 2017, 182, 497–503. [Google Scholar] [CrossRef]
- Schinas, O.; von Westarp, A.G. Assessing the impact of the maritime silk road. J. Ocean Eng. Sci. 2017, 2, 186–195. [Google Scholar] [CrossRef]
- Li, P.; Qian, H.; Howard, K.W.F.; Wu, J. Building a new and sustainable ‘“Silk Road economic belt”’. Environ. Earth Sci. 2015, 74, 7267–7270. [Google Scholar] [CrossRef]
- OECD Environmental Directorate Monographs. OECD Core Set of Indicators for Environmental Performance Reviews; OECD: Pairs, France, 1993. [Google Scholar]
- European Environmental Agency. Europe’s Environment: The Dobris Assessment; European Environment Agency: Copenhagen, Denmark, 1995. [Google Scholar]
- Shannon, C.E. A mathematical theory of communication. Bell Labs Tech. J. 1948, 27, 379–423. [Google Scholar] [CrossRef]
- Xie, T.; Wang, M.; Su, C.; Chen, W. Evaluation of the natural attenuation capacity of urban residential soils with ecosystem-service performance index (EPX) and entropy-weight methods. Environ. Pollut. 2018, 238, 222–229. [Google Scholar] [CrossRef] [PubMed]
- Delgado, A.; Romero, I. Environmental conflict analysis using an integrated grey clustering and entropy-weight method:A case study of a mining project in Peru. Environ. Model. Softw. 2016, 77, 108–121. [Google Scholar] [CrossRef]
- Deng, J.L. Basis on Grey System Theory; Huazhong University of Science and Technology Press: Wuhan, China, 2002. [Google Scholar]
- Yuan, C.; Liu, S.; Fang, Z. Comparison of China’s primary energy consumption forecasting by using ARIMA (the autoregressive integrated moving average) model. Energy 2016, 100, 384–390. [Google Scholar] [CrossRef]
- Meskini-vishkaee, F.; Davatgar, N. Evaluation of Different Predictor Models for Detailed Soil Particle-Size Distribution. Pedosphere 2018, 28, 157–164. [Google Scholar] [CrossRef]
- Han, M.; Du, H.; Zhang, C.; Li, G.; Shi, L. Water Resources Sustainable Utilization Evaluation Based on the DPSIR in Yellow River Delta. China Polulation Resour. Environ. 2015, 25, 154–160. [Google Scholar]
- DeVellis, R.F. Scale Development Theory and Application; Sage: London, UK, 1991. [Google Scholar]
- Sun, C.; Wu, Y.; Zou, W.; Zhao, L.; Liu, W. A Rural Water Poverty Analysis in China Using the DPSIR-PLS Model. Water Resour. Manag. 2018, 32, 1933–1951. [Google Scholar] [CrossRef]
- Jia, Y.; Shen, J.; Wang, H.; Dong, G.; Sun, F. Evaluation of the Spatiotemporal Variation of Sustainable Utilization of Water Resources: Case Study from Henan Province (China). Water 2018, 10, 554. [Google Scholar] [CrossRef]
- Shi, A.; Lu, T.; Feng, C. Research into Socioeconomic Development and Water Resource Protection Level of the Yangtze River Economic Zone. J. Hohai Univ. Philos. Soc. Sci. 2017, 19, 24–28. [Google Scholar]
- National Bureau of Statistics of China. China Statistics Yearbook (2011–2016); China Statistica Press: Beijing, China, 2016.
- National Bureau of Statistics of China. China City Statistical Yearbook (2011–2016); China Statistica Press: Beijing, China, 2016.
- Ministry of Housing and Urban-Rural Development of China. China Urban-Rural Construction Statistical Yearbook (2011–2016); China Statistica Press: Beijing, China, 2016.
- National Bureau of Statistics of China; Ministry of Environmental Protection of China. China Statistic Yearbook on Environment (2011–2016); China Statistica Press: Beijing, China, 2016.
- Xia, J.; Zuo, Q. The Utilization and Protection of Water Resource in China (1978–2018). Urban Environ. Stud. 2018, 2, 18–32. [Google Scholar]
- Xue, T.; Lei, S.; Xuejun, W.; Ke, X.; Zhong, M.; Zhang, X. Regional water efficiency evaluztion and deconstruction analysis of the New Silk Road Economic Belt. J. Arid L. Resour. Environ. 2016, 30, 1–6. [Google Scholar]
- Zuo, Q.; Han, C.; Ma, J.; Liu, J. Water resources characteristics and supporting capacity for “the Belt and Road”in China mainland. J. Hydraul. Eng. 2017, 48, 631–639. [Google Scholar]
- Govindan, K.; Madan Shankar, K.; Kannan, D. Sustainable material selection for construction industry—A hybrid multi criteria decision making approach. Renew. Sustain. Energy Rev. 2016, 55, 1274–1288. [Google Scholar] [CrossRef]
- An, M.; Butsic, V.; He, W.; Zhang, Z.; Qin, T.; Huang, Z.; Yuan, L. Drag effect of water consumption on urbanization-A case study of the Yangtze River economic belt from 2000 to 2015. Water (Switzerland) 2018, 10, 1115. [Google Scholar] [CrossRef]
- Mourmouris, J.C.; Potolias, C. A multi-criteria methodology for energy planning and developing renewable energy sources at a regional level: A case study Thassos, Greece. Energy Policy 2013, 52, 522–530. [Google Scholar] [CrossRef]
- Nie, R.X.; Tian, Z.P.; Wang, J.Q.; Zhang, H.Y.; Wang, T.L. Water security sustainability evaluation: Applying a multistage decision support framework in industrial region. J. Clean. Prod. 2018, 196, 1681–1704. [Google Scholar] [CrossRef]
- McDowell, J.Z.; Hess, J.J. Accessing adaptation: Multiple stressors on livelihoods in the Bolivian highlands under a changing climate. Glob. Environ. Chang. 2012, 22, 342–352. [Google Scholar] [CrossRef]
- Fitzhugh, T.W.; Richter, B.D. Quenching Urban Thirst: Growing Cities and Their Impacts on Freshwater Ecosystems. Bioscience 2004, 54, 741–754. [Google Scholar] [CrossRef]
- Wang, S.; Li, R. Toward the coordinated sustainable development of urban water resource use and economic growth: An empirical analysis of Tianjin City, China. Sustainability 2018, 10, 1323. [Google Scholar] [CrossRef]
- Henriques, C.; Garnett, K.; Weatherhead, E.K.; Lickorish, F.A.; Forrow, D.; Delgado, J. The future water environment—Using scenarios to explore the significant water management challenges in England and Wales to 2050. Sci. Total Environ. 2015, 512–513, 381–396. [Google Scholar] [CrossRef] [PubMed]
Figure 1.
One Belt and One Road region’s 18 provinces and municipalities in China.

Figure 2.
Driving Forces-Pressures-State-Carrying Capacity-Impacts–Responses (DPCSIR) model.

Figure 3.
Water security level of the One Belt and One Road region in China.

Figure 4.
The influence coefficient of the DPCSIR framework on water security in the One Belt And One Road Region of China from 2011 to 2016.
Figure 4.
The influence coefficient of the DPCSIR framework on water security in the One Belt And One Road Region of China from 2011 to 2016.

Figure 5.
Driving Force (a), Pressure (b), and Carrying Capacity (c) subsystems in the One Belt and One Road Area of China.
Figure 5.
Driving Force (a), Pressure (b), and Carrying Capacity (c) subsystems in the One Belt and One Road Area of China.

Figure 6.
State (a), Impact (b), and Response (c) subsystems in the One Belt and One Road Area of China.
Figure 6.
State (a), Impact (b), and Response (c) subsystems in the One Belt and One Road Area of China.

Table 1.
Grey Prediction Model’s precision standard.
| Grade | Relative Error | Variance Ratio | Small Error Probability |
|---|---|---|---|
| Good *** | <0.01 | <0.35 | >0.95 |
| Qualified ** | <0.05 | <0.5 | >0.80 |
| Inadequate * | <0.20 | <0.65 | >0.70 |
| Unqualified | ≥0.2 | ≥0.65 | ≥0.70 |
Note: ***, **, and * denote the level of grade about good, qualified, and inadequate.
Table 2.
The sources of the indicators.
| China Statistics Yearbook (2011–2016) [68] | GDP growth rate, Engel coefficient, population growth rate, per capita cultivated land area, per capita water resources, proportion of the added value of tertiary industry |
| China City Statistical Yearbook (2011–2016) [69] | Population density, urbanization rate, the proportion of science and technology expenditure, the proportion of environmental protection expenditure, per capita net income (Yuan) of urban residents |
| China Urban-Rural Construction Statistical Yearbook (2011–2016) [70] | Length of water supply pipe, treatment capacity of urban sewage treatment plants, urban sewage treatment rate |
| China Statistic Yearbook on Environment (2011–2016) [71] | The utilization rate of water resource development, wetland area, annual precipitation, forest coverage rate, green coverage rate of built-up areas, effective irrigation area, chemical oxygen demand, ammonia nitrogen discharge |
| China Water Resources Bulletin (2011–2016) [47] | Water consumption of ten thousand Yuan output value, discharge of industrial waste-water from ten thousand Yuan output value, daily water supply capacity, daily water consumption per capita, agricultural water consumption, industrial water consumption, ecological environment water consumption, saving water consumption |
Table 3.
The weights of indicators for the water assessment framework.
| Target Layer | Factor Layer | Criterion Layer | IdentIfier | Index Layer | Character | Entropy Weights |
|---|---|---|---|---|---|---|
| “One Belt and One Road” of China regional DPCSIR model water resource security index system | Driving Forces (0.1632) | Economic drive | D1 | GDP growth rate (%) | Positive | 0.0329 |
| D2 | Population density (person /km2) | Negative | 0.0339 | |||
| D3 | Per capita net income (Yuan) of urban residents | Positive | 0.0343 | |||
| D4 | Engel coefficient (%) | Negative | 0.0321 | |||
| D5 | Population growth rate (%). | Negative | 0.0299 | |||
| Pressures (0.1684) | Resource consumption | P1 | Water consumption of ten thousand Yuan output value (104 t) | Negative | 0.0345 | |
| P2 | The utilization rate of water resource development (%) | Negative | 0.0341 | |||
| Environmental pollution | P3 | Discharge of industrial waste-water from ten thousand Yuan output value (t) | Negative | 0.0343 | ||
| P4 | Chemical oxygen demand (104 t) | Negative | 0.0326 | |||
| P5 | Ammonia nitrogen discharge (104 t) | Negative | 0.0329 | |||
| Carrying Capacity (0.1659) | Environmental quality | C1 | Effective irrigation area (hm2), | Positive | 0.0335 | |
| C2 | Per capita cultivated land area (hm2) | Positive | 0.0342 | |||
| C3 | Per capita water resources (t) | Positive | 0.0340 | |||
| C4 | Wetland area (hm2) | Positive | 0.0302 | |||
| C5 | Annual precipitation (mm) | Positive | 0.0341 | |||
| State (0.1692) | Resources reserve | S1 | Daily water supply capacity (t) | Positive | 0.0345 | |
| S2 | Daily water consumption per capita (t) | Negative | 0.0340 | |||
| S3 | Agricultural water consumption (t) | Negative | 0.0335 | |||
| S4 | Industrial water consumption (t) | Negative | 0.0336 | |||
| S5 | Ecological environment water consumption (t) | Positive | 0.0336 | |||
| Impacts (0.1323) | Social life | I1 | Urbanization rate (%) | Positive | 0.0341 | |
| I2 | Forest coverage rate (%) | Positive | 0.0304 | |||
| I3 | The proportion of the added value of tertiary industry (%) | Positive | 0.0330 | |||
| I4 | The green coverage rate of built-up areas (%) | Positive | 0.0348 | |||
| Responses (0.2010) | Governance and consolidation | R1 | Saving water consumption (%) | Positive | 0.0325 | |
| R2 | Urban sewage treatment rate (%) | Positive | 0.0334 | |||
| R3 | Treatment capacity of urban sewage treatment plants (104 t/d) | Positive | 0.0339 | |||
| R4 | Length of water supply pipe (km) | Positive | 0.0335 | |||
| Economic input | R5 | The proportion of environmental protection expenditure (%) | Negative | 0.0337 | ||
| R6 | The proportion of science and technology expenditure (%) | Negative | 0.0335 |
Table 4.
The evaluation of water resource security index of China’s "One Belt and One Road" region from 2011 to 2016.
Table 4.
The evaluation of water resource security index of China’s "One Belt and One Road" region from 2011 to 2016.
| Regional Division | Provinces and Municipalities | 2011 | 2012 | 2013 | 2014 | 2015 | 2016 | Average Annual Growth Rate (AAGR) | Ranking (AAGR) | Mean Value (MV) | Ranking (MV) |
|---|---|---|---|---|---|---|---|---|---|---|---|
| One Belt Area | Inner Mongolia | 0.2510 | 0.4280 | 0.5131 | 0.5494 | 0.5888 | 0.6050 | 19.23% | 5 | 0.4892 | 9 |
| Liaoning | 0.2710 | 0.4566 | 0.6078 | 0.5262 | 0.6167 | 0.6204 | 18.02% | 7 | 0.5165 | 2 | |
| Jilin | 0.2470 | 0.3847 | 0.4598 | 0.4568 | 0.5409 | 0.7491 | 24.85% | 3 | 0.4730 | 18 | |
| Heilongjiang | 0.1933 | 0.3574 | 0.5418 | 0.5422 | 0.6020 | 0.6777 | 28.52% | 2 | 0.4857 | 11 | |
| Shanxi | 0.3641 | 0.3772 | 0.4336 | 0.5180 | 0.6013 | 0.6292 | 11.56% | 16 | 0.4872 | 10 | |
| Gansu | 0.3081 | 0.3855 | 0.5315 | 0.5278 | 0.5722 | 0.6331 | 15.49% | 12 | 0.4930 | 7 | |
| Qinghai | 0.2996 | 0.4442 | 0.4445 | 0.5396 | 0.5415 | 0.6438 | 16.53% | 11 | 0.4855 | 12 | |
| Ningxia | 0.2887 | 0.3924 | 0.5110 | 0.5320 | 0.5606 | 0.6280 | 16.82% | 10 | 0.4855 | 13 | |
| Xinjiang | 0.3361 | 0.3727 | 0.5535 | 0.4592 | 0.5543 | 0.6678 | 14.72% | 14 | 0.4906 | 8 | |
| One Road Area | Shanghai | 0.3532 | 0.4025 | 0.4106 | 0.5313 | 0.6208 | 0.7154 | 15.16% | 13 | 0.5056 | 4 |
| Zhejiang | 0.2857 | 0.4198 | 0.4585 | 0.5564 | 0.6190 | 0.6806 | 18.96% | 6 | 0.5033 | 5 | |
| Fujian | 0.1957 | 0.3687 | 0.4918 | 0.5270 | 0.5588 | 0.7238 | 29.90% | 1 | 0.4776 | 16 | |
| Guangdong | 0.3133 | 0.3686 | 0.5131 | 0.4614 | 0.5139 | 0.6905 | 17.12% | 8 | 0.4768 | 17 | |
| Hainan | 0.4178 | 0.4466 | 0.5704 | 0.5004 | 0.4677 | 0.7187 | 11.46% | 17 | 0.5203 | 1 | |
| SSPG Area | Guangxi | 0.2642 | 0.4124 | 0.4974 | 0.5910 | 0.6408 | 0.6427 | 19.46% | 4 | 0.5081 | 3 |
| Chongqing | 0.3439 | 0.3884 | 0.4525 | 0.5359 | 0.5213 | 0.6253 | 12.70% | 15 | 0.4779 | 15 | |
| Yunnan | 0.3184 | 0.3607 | 0.4490 | 0.4786 | 0.5879 | 0.6983 | 17.01% | 9 | 0.4821 | 14 | |
| Tibet | 0.3665 | 0.4872 | 0.4897 | 0.5146 | 0.5376 | 0.6083 | 10.66% | 18 | 0.5007 | 6 |
Table 5.
Average relative error, variance ratio, and small error probability of the Grey Prediction Model.
Table 5.
Average relative error, variance ratio, and small error probability of the Grey Prediction Model.
| Provinces & MuniciPalities | Inner Mongolia | Liaoning | Jilin | Heilongjiang | Shanxi | Gansu | Qinghai | Ningxia | Xinjiang |
| Relative Error | 0.0369 ** | 0.0694 * | 0.0804 * | 0.0660 * | 0.0325 ** | 0.0501 * | 0.0431 ** | 0.0435 ** | 0.0921 * |
| Variance ratio | 0.0356 *** | 0.0759 *** | 0.0776 *** | 0.0735 *** | 0.0343 *** | 0.0588 *** | 0.0411 *** | 0.0458 *** | 0.0969 *** |
| Small error probability | 1 *** | 1 *** | 1 *** | 1 *** | 1 *** | 1 *** | 1 *** | 1 *** | 1 *** |
| Provinces & Municipalities | Shanghai | Zhejiang | Fujian | Guangdong | Hainan | Guangxi | Chongqing | Yunnan | Tibet |
| Relative Error | 0.0352 ** | 0.0199 ** | 0.0528 * | 0.1164 * | 0.0881 * | 0.0512 * | 0.0387 ** | 0.0231 ** | 0.0278 ** |
| Variance ratio | 0.0340 *** | 0.0221 *** | 0.0559 *** | 0.1283 *** | 0.0913 *** | 0.0547 *** | 0.0444 *** | 0.0267 *** | 0.0282 *** |
| Small error probability | 1 *** | 1 *** | 1 *** | 1 *** | 1 *** | 1 *** | 1 *** | 1 *** | 1 *** |
Note: ***, **, and * denote the grades good, qualified, and inadequate.
Table 6.
Water security values in the B&R area of China from 2017–2022.
| Regional Division | Provinces and Municipalities | 2017 | 2018 | 2019 | 2020 | 2021 | 2022 |
|---|---|---|---|---|---|---|---|
| One Belt Area | Inner Mongolia | 0.6740 | 0.7286 | 0.7876 | 0.8514 | 0.9204 | 0.9950 |
| Liaoning | 0.6711 | 0.7113 | 0.7539 | 0.7991 | 0.8469 | 0.8977 | |
| Jilin | 0.8239 | 0.9729 | 1.1489 | 1.3567 | 1.6021 | 1.8919 | |
| Heilongjiang | 0.7788 | 0.8821 | 0.9992 | 1.1319 | 1.2821 | 1.4523 | |
| Shanxi | 0.7406 | 0.8424 | 0.9583 | 1.0901 | 1.2401 | 1.4107 | |
| Gansu | 0.7053 | 0.7784 | 0.8590 | 0.9480 | 1.0462 | 1.1546 | |
| Qinghai | 0.6911 | 0.7612 | 0.8385 | 0.9236 | 1.0173 | 1.1205 | |
| Ningxia | 0.6312 | 0.7667 | 0.8450 | 0.9313 | 1.0264 | 1.1312 | |
| Xinjiang | 0.7241 | 0.8117 | 0.9100 | 1.0201 | 1.1436 | 1.2820 | |
| One Road Area | Shanghai | 0.8383 | 0.9823 | 1.1511 | 1.3489 | 1.5806 | 1.8522 |
| Zhejiang | 0.7806 | 0.8839 | 1.0008 | 1.1332 | 1.2831 | 1.4528 | |
| Fujian | 0.8101 | 0.9383 | 1.0869 | 1.2590 | 1.4583 | 1.6892 | |
| Guangdong | 0.6939 | 0.8412 | 0.9584 | 1.0918 | 1.2438 | 1.4170 | |
| Hainan | 0.7384 | 0.7563 | 0.8244 | 0.8986 | 0.9794 | 1.0675 | |
| SSPG Area | Guangxi | 0.7527 | 0.8352 | 0.9267 | 1.0283 | 1.1409 | 1.2660 |
| Chongqing | 0.6867 | 0.7641 | 0.8502 | 0.9460 | 1.0526 | 1.1712 | |
| Yunnan | 0.8096 | 0.9506 | 1.1163 | 1.3108 | 1.5392 | 1.8074 | |
| Tibet | 0.6224 | 0.6585 | 0.6967 | 0.7371 | 0.7799 | 0.8251 |
© 2019 by the authors. Licensee MDPI, Basel, Switzerland. This article is an open access article distributed under the terms and conditions of the Creative Commons Attribution (CC BY) license (http://creativecommons.org/licenses/by/4.0/).
Share and Cite
MDPI and ACS Style
Zhang, Z.; He, W.; An, M.; Degefu, D.M.; Yuan, L.; Shen, J.; Liao, Z.; Wu, X. Water Security Assessment of China’s One Belt and One Road Region. Water 2019, 11, 607. https://doi.org/10.3390/w11030607
AMA Style
Zhang Z, He W, An M, Degefu DM, Yuan L, Shen J, Liao Z, Wu X. Water Security Assessment of China’s One Belt and One Road Region. Water. 2019; 11(3):607. https://doi.org/10.3390/w11030607
Chicago/Turabian StyleZhang, Zhaofang, Weijun He, Min An, Dagmawi Mulugeta Degefu, Liang Yuan, Juqin Shen, Zaiyi Liao, and Xia Wu. 2019. "Water Security Assessment of China’s One Belt and One Road Region" Water 11, no. 3: 607. https://doi.org/10.3390/w11030607
Note that from the first issue of 2016, this journal uses article numbers instead of page numbers. See further details here.