Autonomous In Situ Measurements of Noncontaminant Water Quality Indicators and Sample Collection with a UAV


Department of Agricultural Sciences, Clemson University, Clemson, SC 29634, USA
*
Author to whom correspondence should be addressed.
Water 2019, 11(3), 604; https://doi.org/10.3390/w11030604
Submission received: 21 February 2019
/
Revised: 20 March 2019
/
Accepted: 21 March 2019
/
Published: 23 March 2019
(This article belongs to the Section Water Quality and Contamination)
Abstract
:The objective of this research was to conduct in situ measurements of electrical conductivity (EC), pH, dissolved oxygen (DO), and temperature, and collect water samples simultaneously at different depths using an unmanned aerial vehicle (UAV). The UAV system consists of a hexacopter, water sampling cartridges (WSC), and a sensor node. Payload capacity and endurance of the UAV were determined using an indoor test station. The UAV was able to produce 106 N of thrust for 10 min with 6.3 kg of total takeoff weight. The thrust-to-weight ratio of the UAV was 2.5 at 50% throttle. The decision for activating the water sampling cartridges and sensor node was made autonomously from an onboard microcontroller. System functions were verified at 0.5 m and 3.0 m depths in 6 locations over a 1.1 ha agricultural pond. Average measurements of EC, pH, DO, and temperature at 0.5 m depth were 42 µS/cm, 5.6, 8.2 mg/L, and 31 °C, while the measurements at 3 m depth were 80 µS/cm, 5.3, 5.34 mg/L, and 24 °C, respectively. The UAV-assisted autonomous water sampling system (UASS) successfully activated the WSC at each sampling location. The UASS would reduce the duration of water quality assessment and help practitioners and researchers to conduct observations with lower operational costs. The developed system would be useful for sampling and monitoring of water reservoirs, lakes, rivers, and ponds periodically or after natural disasters.
1. Introduction
Effective water quality monitoring is critical for water resource programs due to increased human population growth and industry pressure that can degrade water quality in coastal and inland waters [1,2]. Increased risks of water degradation and human interaction with inland waters such as capture fisheries and other activities bring additional need for periodic water sampling methods to ensure public health [3,4,5]. Periodic sampling and analysis are necessary to characterize water and identify changes or trends in water quality over time.
Water quality detection in waterbodies can be performed by monitoring contaminant and noncontaminant indicators. Contaminant indicators reflect the status of water pollution while noncontaminant indicators reflect the comprehensive conditions of water quality [6]. Contaminant indicators include chemical oxygen demand, total phosphorus, total nitrogen, chlorophyll-a, and turbidity [7]. Some contaminant indicators can be measured in situ, but the most accurate results are obtained with laboratory analyses [8,9]. Regular monitoring of dispersed suspended solids such as silt, clay, algae, organic matter, and other particles also play important roles in water quality monitoring [10]. Bacterial analyses require laboratory evaluation of samples, and the number of grab samples needed can reach large numbers [11]. Dissolved oxygen (DO), electrical conductivity (EC), pH, and temperature are some of the noncontaminant water quality indicators that can be measured and evaluated in situ [12]. However, other noncontaminant water quality indicators such as clay, phytoplankton, and organic matter can be determined with laboratory analyses. Measured changes in these indicators can be used to address the presence of contamination [13]. However, subsequent evaluations may be necessary to make management decisions about sampling events and to determine the level of contamination.
Water quality indicators measured at different locations may vary [14,15,16]. Water sample collection and in situ measurements at a precise depth is a challenging task using existing methods [17,18]. Current water quality monitoring methods are manual grab sampling from the shore or with a boat off-shore, fixed sensor stations, and autonomous vehicles that operate underwater, on or above water surface [19,20,21,22,23,24]. Manual water sampling poses limitations due to the high spatial and temporal variability of the physiochemical and/or microbial parameters of water [25]. Manual samples collected from the shore do not provide depth-specific water quality data. Fixed water quality monitoring stations, on the other hand, collect continuous water quality data from the same location and depth [26]. Because these types of monitoring stations are fixed, they cannot be moved in the waterbody to another location to collect water data, unless additional mechanisms were integrated for repositioning or to adjust the depth. Some sensor stations are manually lowered at vertical direction in the water column at fixed intervals with a tether to measure water properties that vary with depth [27,28]. Underwater, surface, and aerial autonomous vehicles can collect water samples at various depths, but these systems pose operational and technical difficulties [22,24,29,30]. Such difficulties may be due to the operation of these vehicles in varying weather conditions or due to the fluctuations in water levels. Water sampling from lowered water reservoirs with a kayak, canoe, or boat could create difficulties in accessing sampling points [31]. In such situations, the water level might be receded and watercraft may become stuck or impeded by vegetation [29]. In addition, the watercraft may disturb the water, agitating properties under investigation.
In situ measurements and sample collection with a UAV may help overcome such challenges by reducing the sample collection duration and cost and would increase the spatial resolution of water quality measurements. UAV-assisted water quality measurement and sample collection would also reduce safety risks to field personnel. In addition, UAV-assisted sampling would help water profiling and allow the field personnel to take measurements from difficult to access waterbodies such as abandoned mines.
Sensors that are at fixed locations have other limitations that include operational temperature and fouled measurements. When these sensors are used outside of manufacturers’ specified operational temperature range, measurements may result in error [32]. Sensors may require removal when temperature levels exceed the manufacturer’s allowable limits, and re-deployment when temperature levels are within the manufacturer’s permissible limits [33]. Sediments that accumulate around stationary sensors may cause erratic measurements. In these situations, data may not be reliable, time would be wasted, and costs of water sampling operations would be increased due to replacement of the sensor array and repeated sampling. These limitations require regular maintenance of statically deployed water quality monitoring stations to collect reliable data.
To address several of the above challenges, a sensor array that can measure EC, pH, DO, and temperature was integrated with a UAV and field tests were conducted to evaluate system performance [34]. In situ water quality measurement experiments were conducted in a 1.1 ha agricultural pond in Clemson, SC. Accuracy assessment was made for the sensor array and measurements were compared with commercially available reference sensors. The UAV and sensor node were autonomously controlled, and interventions were made with a remote controller when the stability of flight was disturbed due to a sudden wind gust or equipment malfunction. The UAV was equipped with floatation attachments to facilitate water landing and to increase flight time, thus reducing battery usage. In situ measurement depth was fixed at 0.6 m for all sampling locations after landing on the water surface. Spatially interpolated data from the sensor node mounted UAV were represented in water quality maps to visualize the distribution of the noncontaminant water quality indicators. The resulting system can be used to collect field data for the development of algorithms for water quality assessment with satellite remote sensing and conduct water quality assessments after a storm event or natural disaster. The final autonomous configuration can also be used for conducting field measurements at inaccessible or dangerous waterbodies safely. As water quality indicators of EC, pH, DO, and temperature would potentially indicate impairment, collecting water samples based on in situ measurements may eliminate unnecessary sampling, increase UAV flight duration, and reduce operational costs.
A water sampler with a single cartridge was designed and integrated with a UAV for autonomous water sampling [35]. System operation and field experiments were conducted to evaluate its performance. Water collection was made while the UAV was hovering during field experiments. Hovering altitude and sampling depth analyses were conducted to determine water collection depths. The single cartridge water sampler was designed to be consistently able to collect a volume of 130 mL. The average water sampling depth was in the range of 0.56–0.79 m because the UAV was hovering during collection. Wind speeds of less than 24 km/h were recommended for safe autonomous flight. The evaluated system proved water sampling with a UAV-assisted mechanism was possible. However, the single cartridge water sample collection mechanism that was designed previously posed challenges during field experiments [35]. The mechanism used a metal weight of 200 g as a triggering apparatus. The metal weight was released from the UAV and sent through a tether while the sampler dangled at the bottom end. The sampler was triggered once the metal weight contacted the sampler in the water. This design concept was not 100% functional because the velocity and water entry angle of the metal weight affected the impact force on the sampler’s triggering mechanism. In addition, sampling depth could not be adjusted precisely. Outdoor experimentation resulted in an unacceptable triggering success rate. In addition, more samples were needed for replicate sampling purposes that required more than one cartridge [35].
The UAV-assisted in situ water quality assessment system reported in [34] and the UAV-assisted water sampling mechanisms reported in [35] can be combined to extend the functionality of the UAV-assisted water quality assessments. Measurements made by the sensor node can be used to make decisions to collect water samples, thus increasing the flight range of the UAV. Using a multiple cartridge sampling mechanism would increase the number of sampling points over a waterbody and this would increase the spatial resolution of resulting water quality data. In addition, increasing the number of cartridges would also help when collecting replicate sampling from the same location. In cases where water profiling is needed, multiple cartridges would also allow sample collections from the same location at varying depths. UAV-assisted in situ measurements and sampling would help field personnel collect water samples from specific locations rapidly and safely after a storm event or natural disasters.
The objective of this research was to conduct in situ measurements of EC, pH, DO, and temperature and design and manufacture a triple cartridge sampling mechanism to collect water samples at different depths using UAV flight missions.
2. Materials and Methods
2.1. Water Sampler Design
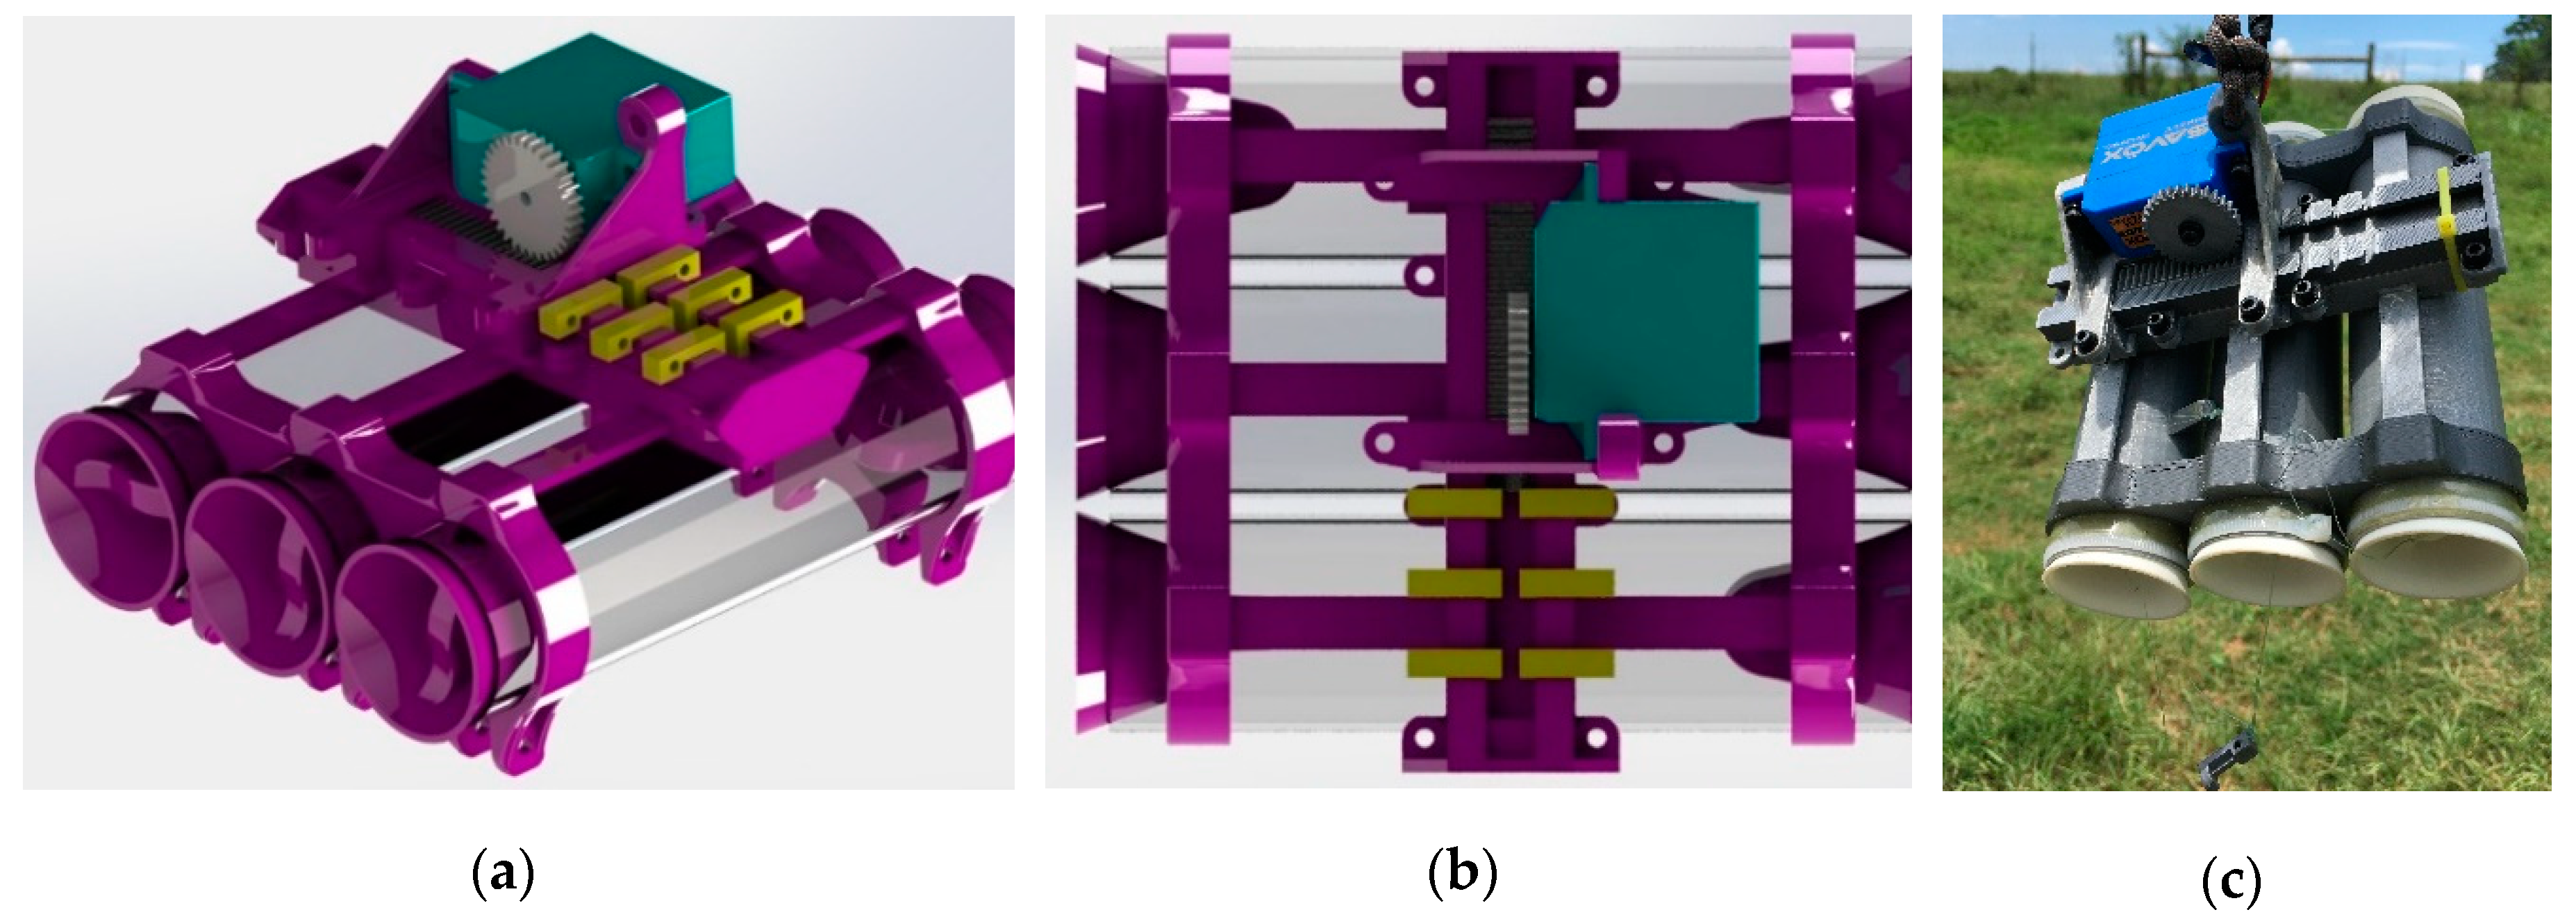
A triple-cartridge water sampling mechanism that was triggered by a waterproofed servo actuator was devised and fabricated for this study. The water sampling cartridge (WSC) consists of a servo actuator (Savox SW-0230MG, Salt Lake City, UT, USA), triple cartridges, caps, frame, gear rack and pinon gear, and hooks (Figure 1). Cartridge caps were 3D printed with selective laser sintering (SLS) technique from polymer plastic. Cartridges, frame, and hooks were 3D printed with fused deposition modeling (FDM) technique from polylactic acid material (PLA). Parts that were printed with PLA material were less flexible than the parts fabricated with polymer plastic material. The empty weight of the triple cartridge with servo mechanism was 0.4 kg.
The servo actuator was used to pull or push the gear rack by rotating the pinon gear. The degree of servo rotation was controlled by the UAV flight controller depending on the distance between the hooks. At each rotation, a single hook was pushed away by the gear rack, activating one cartridge at a time. The two caps at both ends of the cartridges were connected with latex tubing under tension. This component allowed the caps to pull the open ends of the cartridges towards each other when the hooks were released.
2.2. Sensor Node Integration and System Configuration
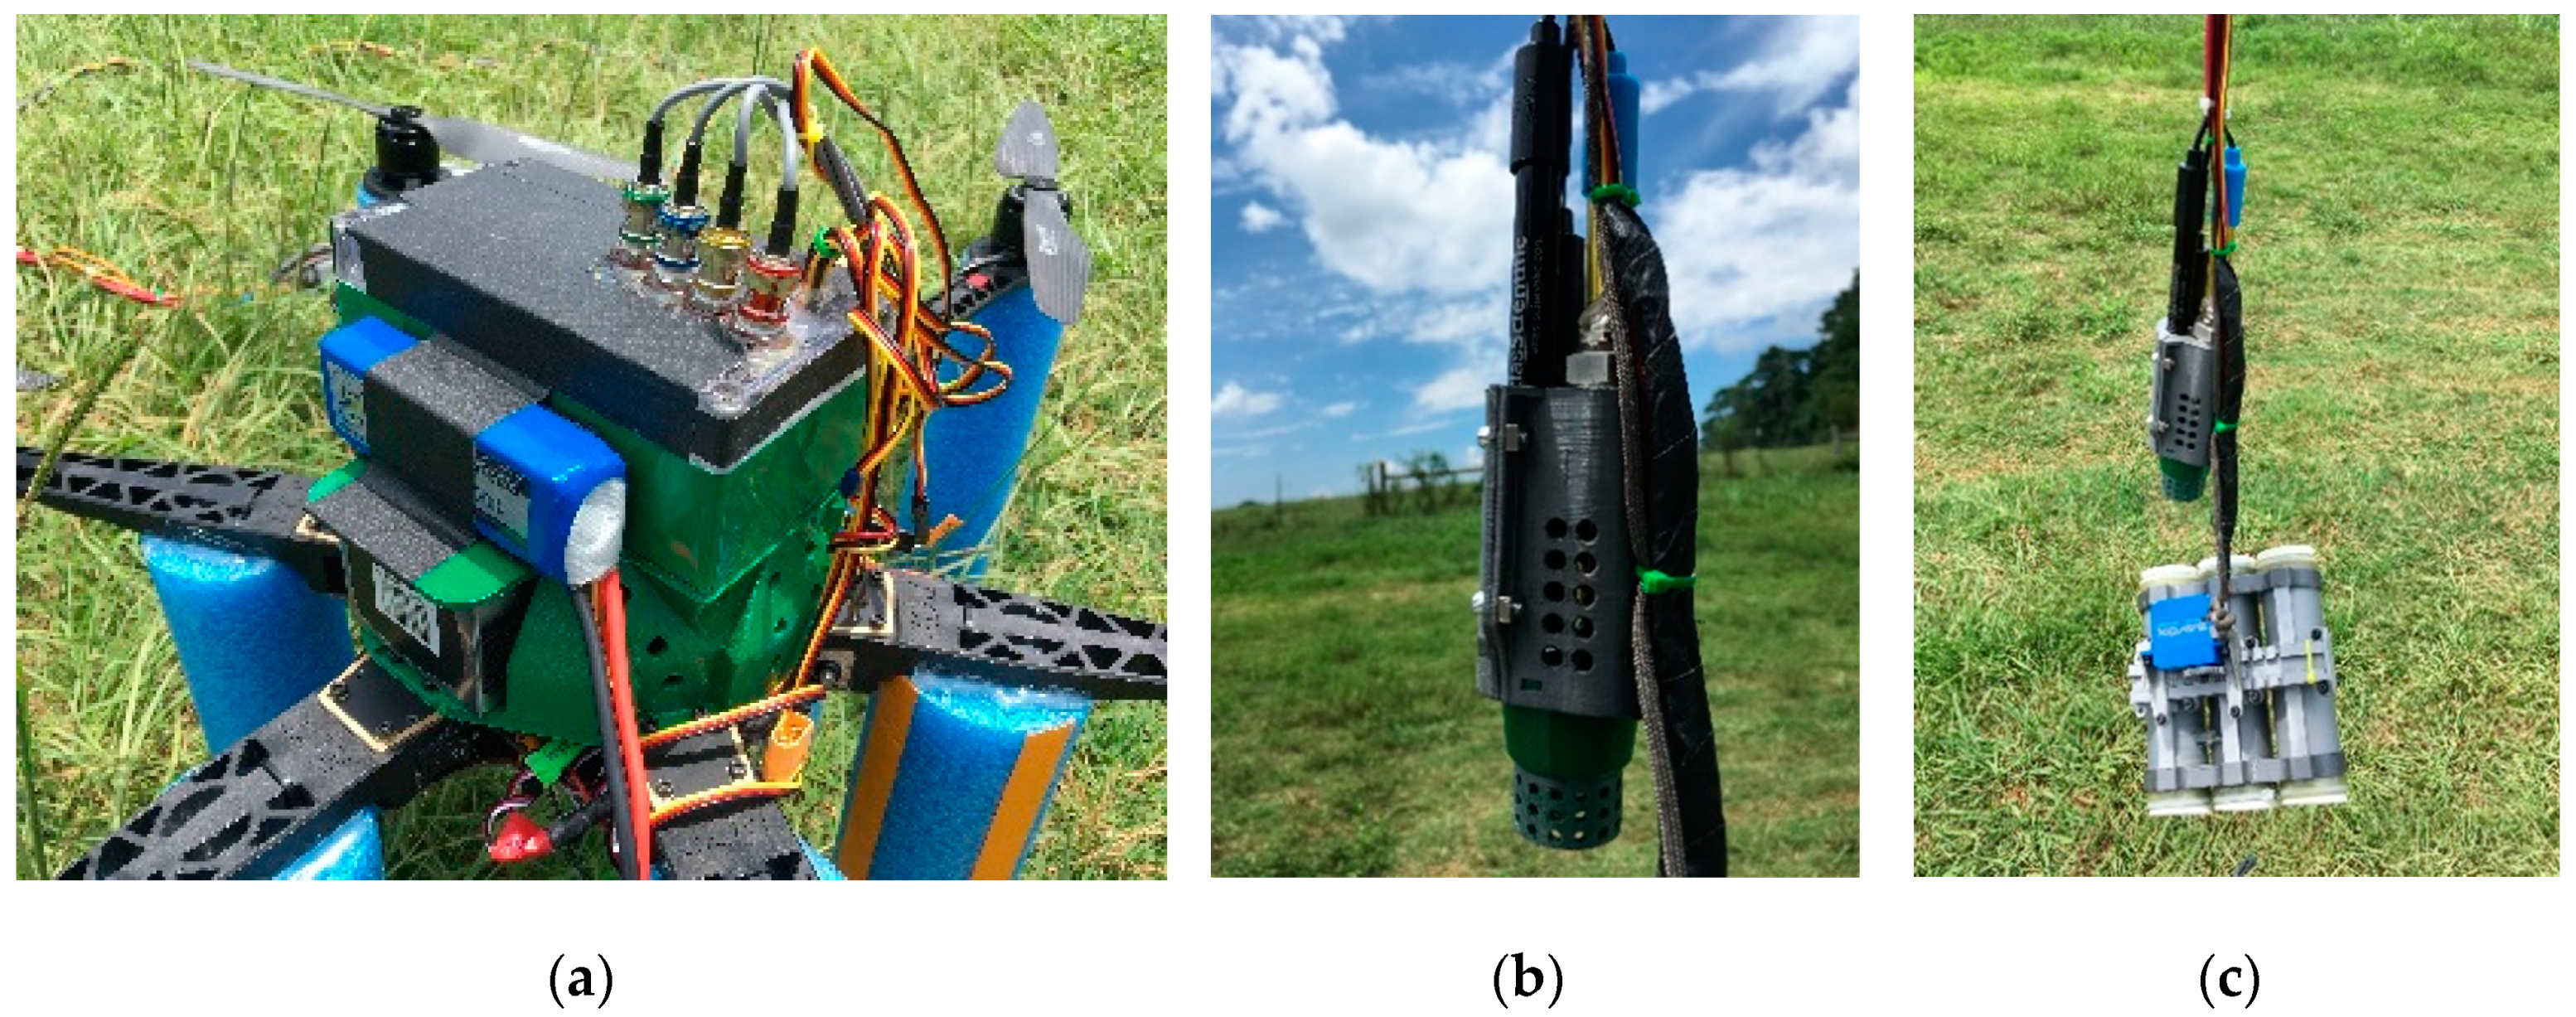
The sensor node consisted of probes and a microcontroller platform (Figure 2) and was capable of obtaining measurements for DO, pH, EC, and temperature [34]. The microcontroller platform was placed in a sealed waterproof box on top of the UAV to isolate it from exposure to moisture during water landings. Probes were placed in a 3D printed case and connected to the tentacle shield with a 3 m long cable. The cable connection was made at the top of the box using BNC (Bayonet Neill–Concelman) quick connectors. The probes were dangled through the bottom center of the UAV. Total weight of the sensor node including extension cables, 3D printed probe case, and the sealed waterproof box was 1.0 kg.
The sensor node consisted of EC, DO, pH, and temperature circuits (Atlas Scientific, New York, NY, USA) and was integrated with a microcontroller (Atmel ATmega2560, San Jose, CA, USA). Circuits were integrated with a tentacle shield (Atlas Scientific, NY, USA). Sensor readings were taken with an inter-integrated circuit (I2C) protocol, and data were recorded on a secure digital (SD) card inserted in the shield (SunFounder, Shenzhen City, Guangdong Province, China). The sensor node was calibrated in the laboratory following the manufacturer’s specifications.
Calibration of the sensor node was made with Arduino integrated development environment (IDE) interface. The IDE was used to debug and upload the program, enter the calibration commands, and retrieve the measurements during calibration. Calibration buffer values for each sensor were entered using the serial monitor in the IDE while the probes were in buffer solutions. Each sensor was identified and recalled with specific I2C addresses for calibration and data retrieval. The I2C addresses for DO, pH, EC, and temperature were 97, 99, 100, and 102, respectively.
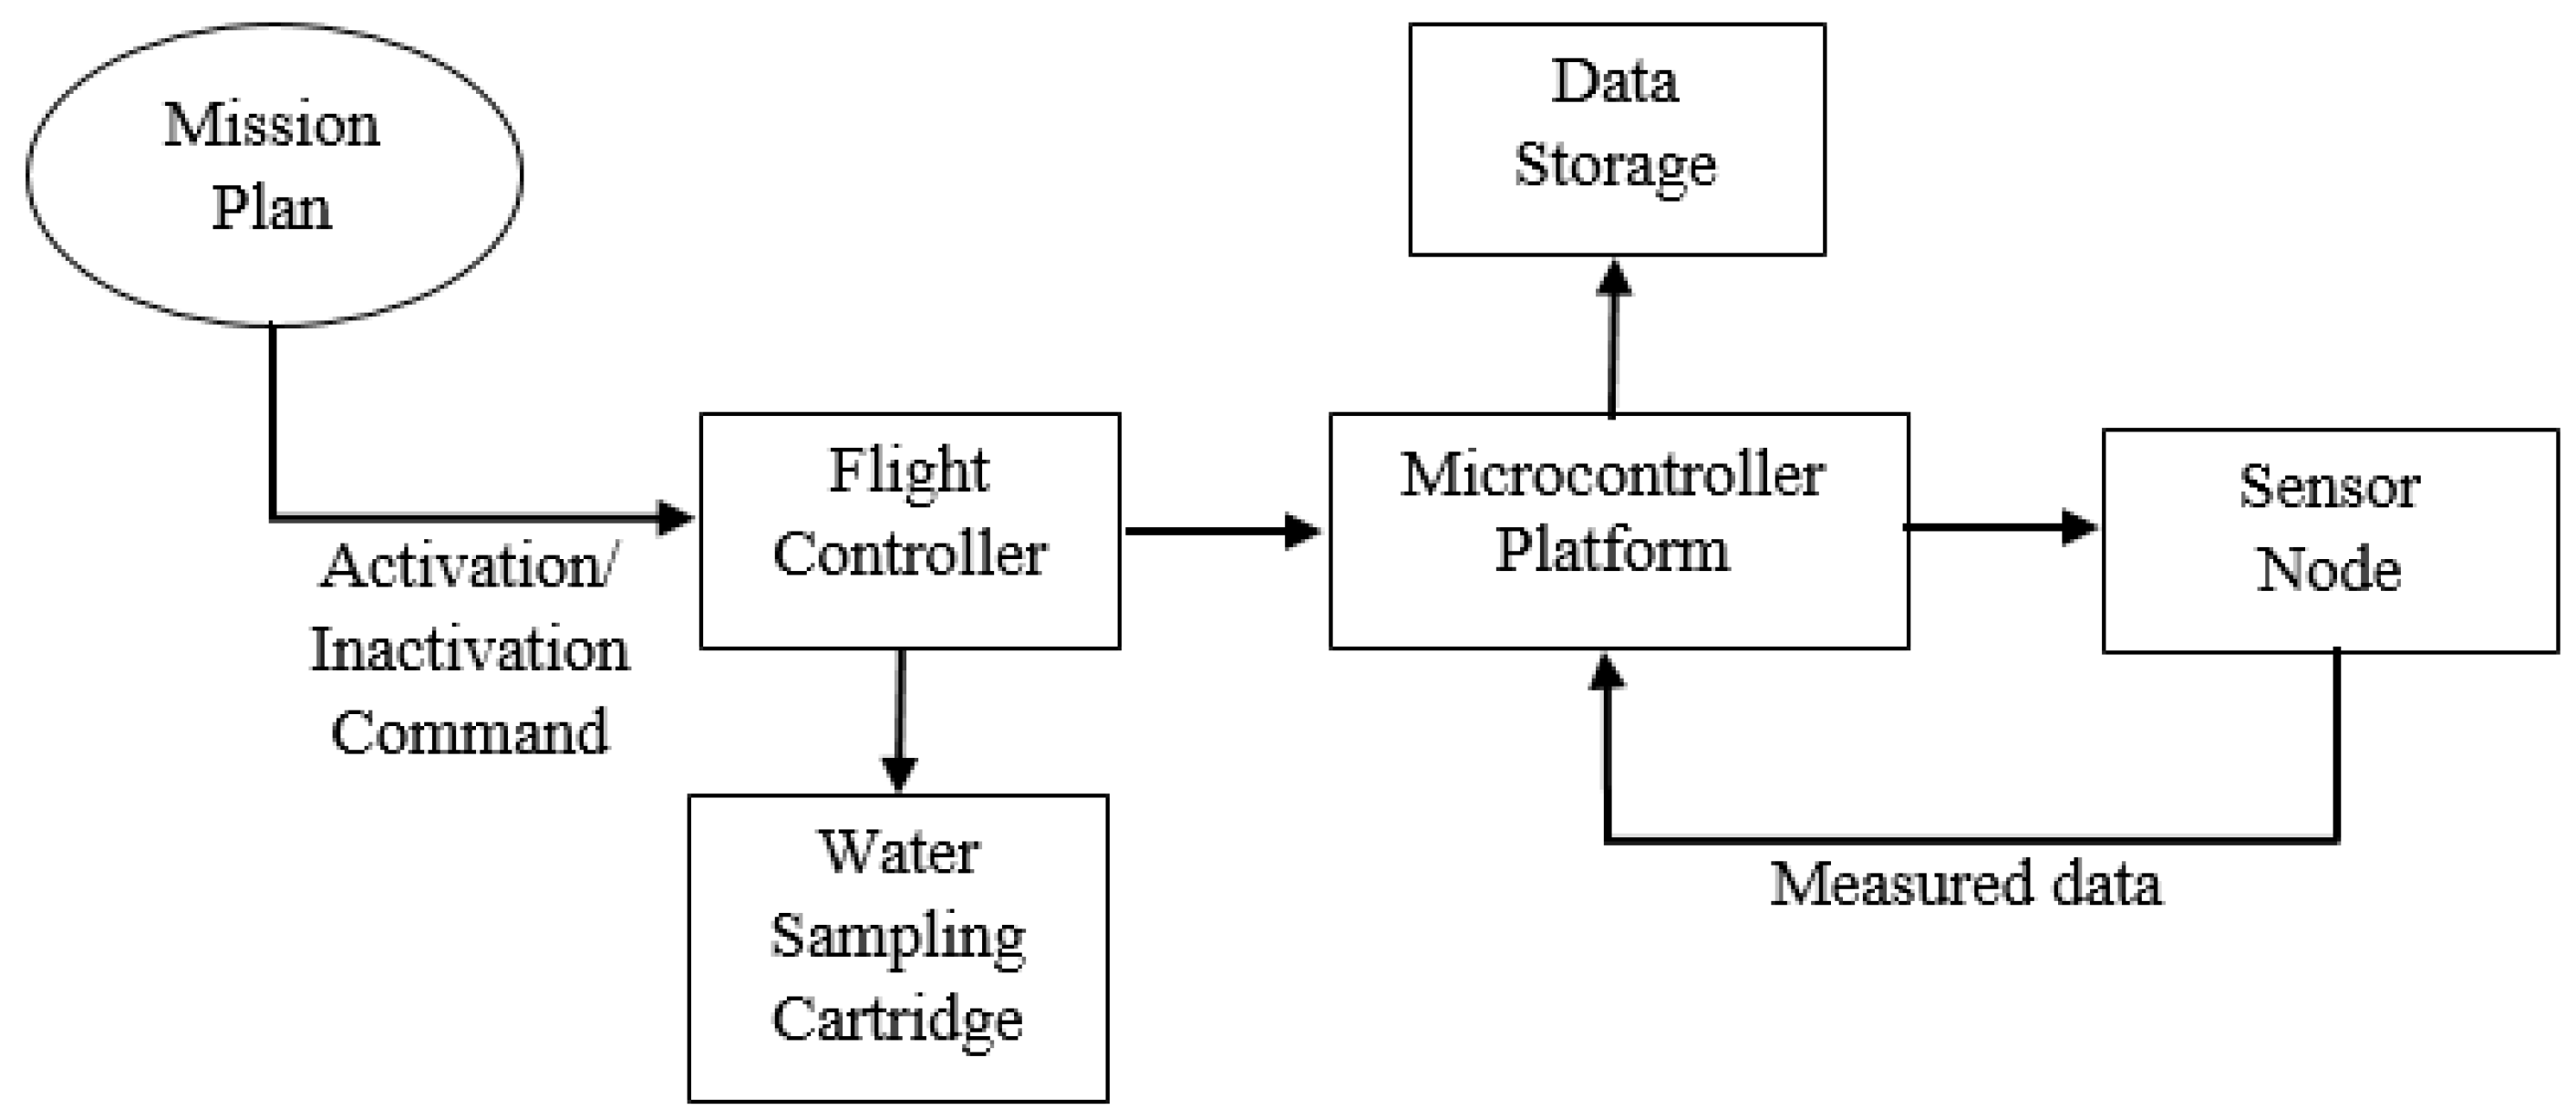
The sensor node activation for in situ measurement of water quality parameters was made by the flight controller after autonomous UAV navigation to the sampling points. Sensor node activation was programmed to be made without operator input at each sampling location during field experiments. The activation signal source was the auxiliary signal output port on the flight controller. The sensor node and WSC system configuration is shown in Figure 3.
2.3. UAV Characteristics and Weight Distribution
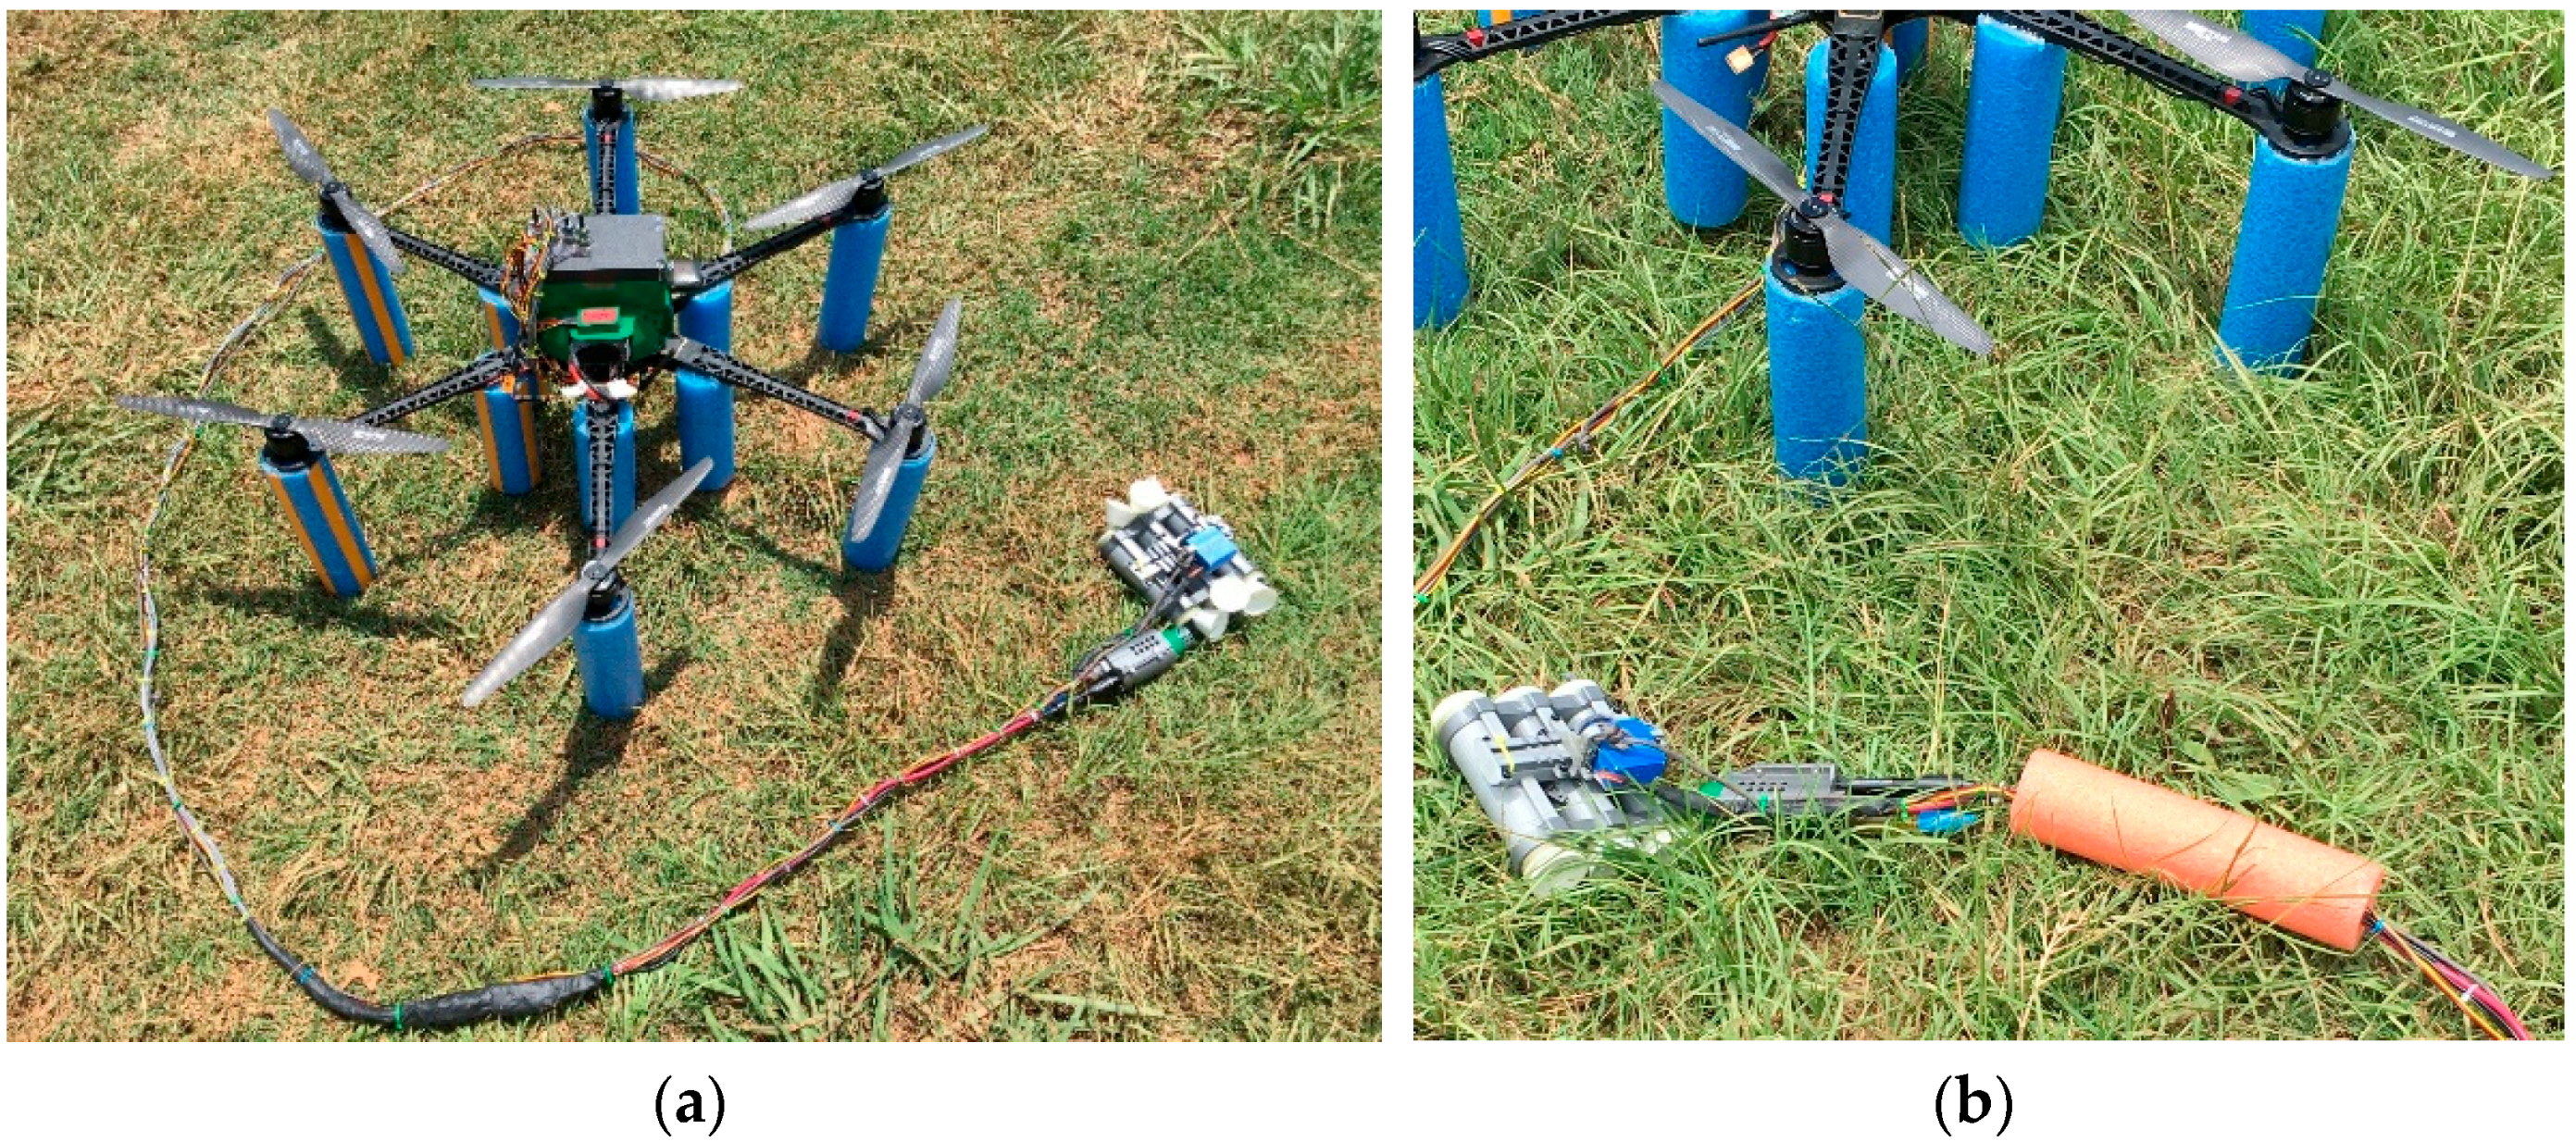
To carry the sensor node and triple cartridge mechanism, a multirotor UAV was built and tested (Figure 4). The UAV was used as a platform to transport the sensor node and WSC payload to a pre-defined water sampling location. The flight controller was used to initiate water sampling and in situ measurement events. The UAV can carry the WSC, sensor nodes, and water samples long enough to accomplish an autonomous mission flight. Therefore, the UAV produces enough thrust to carry the payload to a desired predefined location and accomplish an autonomous water sampling mission.
Primary components of the UAV included a frame, motors, propellers, electronic speed controllers, a flight controller (Pixhawk, 3DR, Robotics, Berkeley, CA, USA), a GPS receiver (Ublox, 3DR, Berkeley, CA, USA), a telemetry radio transmitter (3DR radio, 3DR, 3DR, Berkeley, CA, USA), and a power supply. Six 400 KV motors were selected because of their capacity to resist water and dust with high performance rates (T-Motors U5, Nanchang, Jiangxi, China). Carbon fiber propellers with 40 cm length were chosen based on the manufacturer’s specifications for selected motors (T-Motors, Nanchang, Jiangxi, China). A custom made hexacopter frame with 800 mm hull length was chosen (RCT800, Powerhobby, Mahwah, NJ, US). The hull length of the frame was wide enough to provide enough space for each propeller and center base where electronic components and payload were integrated. The battery size was large enough to provide the greatest power output possible and light enough to provide better thrust-to-weight ratio. A 22.2 V battery was selected based on the motors’ manufacturer recommendation. The maximum continuous current that a single motor requires from the battery is 30 A. The total continuous current that was required from the battery by six motors was 180 A. The total theoretical power requirement of the motors was calculated as 3996 W. Therefore, the battery with 8000 mAh current capacity and 25C discharge rate at 22.2 V can produce 4440 W of electrical power (Tattu, Dublin, CA, US). A battery with 10,000 mAh current capacity with 25C discharge at 22.2 V was also tested to determine which battery provides the best thrust-to-weight ratio. An electronic speed controller (ESC) with 40 A continuous current capacity was chosen according to the manufacturer’s recommendation for safe power distribution (Air 40 A, T-Motor, Nanchang, Jiangxi, China).
One essential flight characteristic is thrust-to-weight ratio. Thrust-to-weight ratio determines how long a UAV can fly and how much payload it can carry [36]. For a UAV to safely hover at 50% throttle settings, it must produce thrust that is at least twice the downward force due to weight. A UAV performance test station was designed and built to measure thrust and endurance. Test results indicated the newly configured UAV met required minimum thrust-to-weight ratio for hovering [37] under prescribed conditions. The weight of the UAV and payload were measured prior to thrust and endurance tests (Table 1). The measurements were made in the test station with and without payload mounted on the UAV. Takeoff weight was 4.3 kg without the payload and 6.4 kg with the payload when the battery with 8000 mAh capacity was used. Takeoff weight was 4.8 kg without the payload when the battery with 10,000 mAh capacity was used. Working principles, data acquisition system, test procedure, and construction details of the UAV test station were explained in detail in a previously published study [35].
Thrust and endurance data were measured at 50% throttle setting with batteries that have 8000 mAh and 10,000 mAh capacities. Two repeated measurements were made for each battery and results were compared to find which battery provided better thrust-to-weight ratio. Subsequently, thrust and endurance measurements were made at 50%, 60%, and 70% throttle settings with the battery that provided the highest thrust-to-weight ratio. The tests with higher throttle levels were conducted to evaluate how endurance and thrust changes, since windy conditions may affect these performance parameters.
2.4. Floatation Attachment
A floatation attachment was required to facilitate water landing to make in situ measurements and collect water samples. The floatation attachment had to be placed under the UAV frame to ensure UASS stability and position above the water surface. The floatation attachments had to be durable enough to be used as landing gear as well as absorb impact during potentially rough or crash landings. Cylindrical foam swimming aids were chosen as floatation attachments because of their light weight, flexibility, ease of replacement, low cost, and ability to absorb impact. The volume of the floatation attachment, which was required to keep the UASS above water surface, was determined by calculating the buoyancy force [38] using Equation (1);
where Fb = buoyancy force (N); Vs = submerged volume (m3); ρw = density of water (kg/m3); g = acceleration due to gravity (m/s2).
For an object to float, the buoyancy force must be greater than the gravitational force created by the object due to its weight [39]. When the weight of the UAV, density of water, and the acceleration due to gravity was determined, the minimum volume of floatation attachment required to keep the UAV above water could be estimated. The total takeoff weight of the UAV was 6.4 kg, which created 63 N of downward force. Therefore, using Equation (1), the minimum total submerged volume of the floatation attachment was calculated as 0.0064 m3. The floatation attachments were cut out of 7 cm diameter and 30 cm long foam sections and placed under each motor vertically away from the center of the base of the UAV. Remaining floatation attachments were cut out of 7 cm diameter and 20 cm long foams and placed under each arm where they are connected to the center base of the UAV. Placement of the floatation attachment had to be far enough away from the center to keep the UAV horizontally stable on water surface. Vertical placement of the floatation attachment was intended to minimize drag, provide free downward airflow to maximize the lifting force created by the propellers, and provide an open space under the UAV to position the WSC and sensor node at the bottom center.
2.5. Study Site and Data Collection Procedure
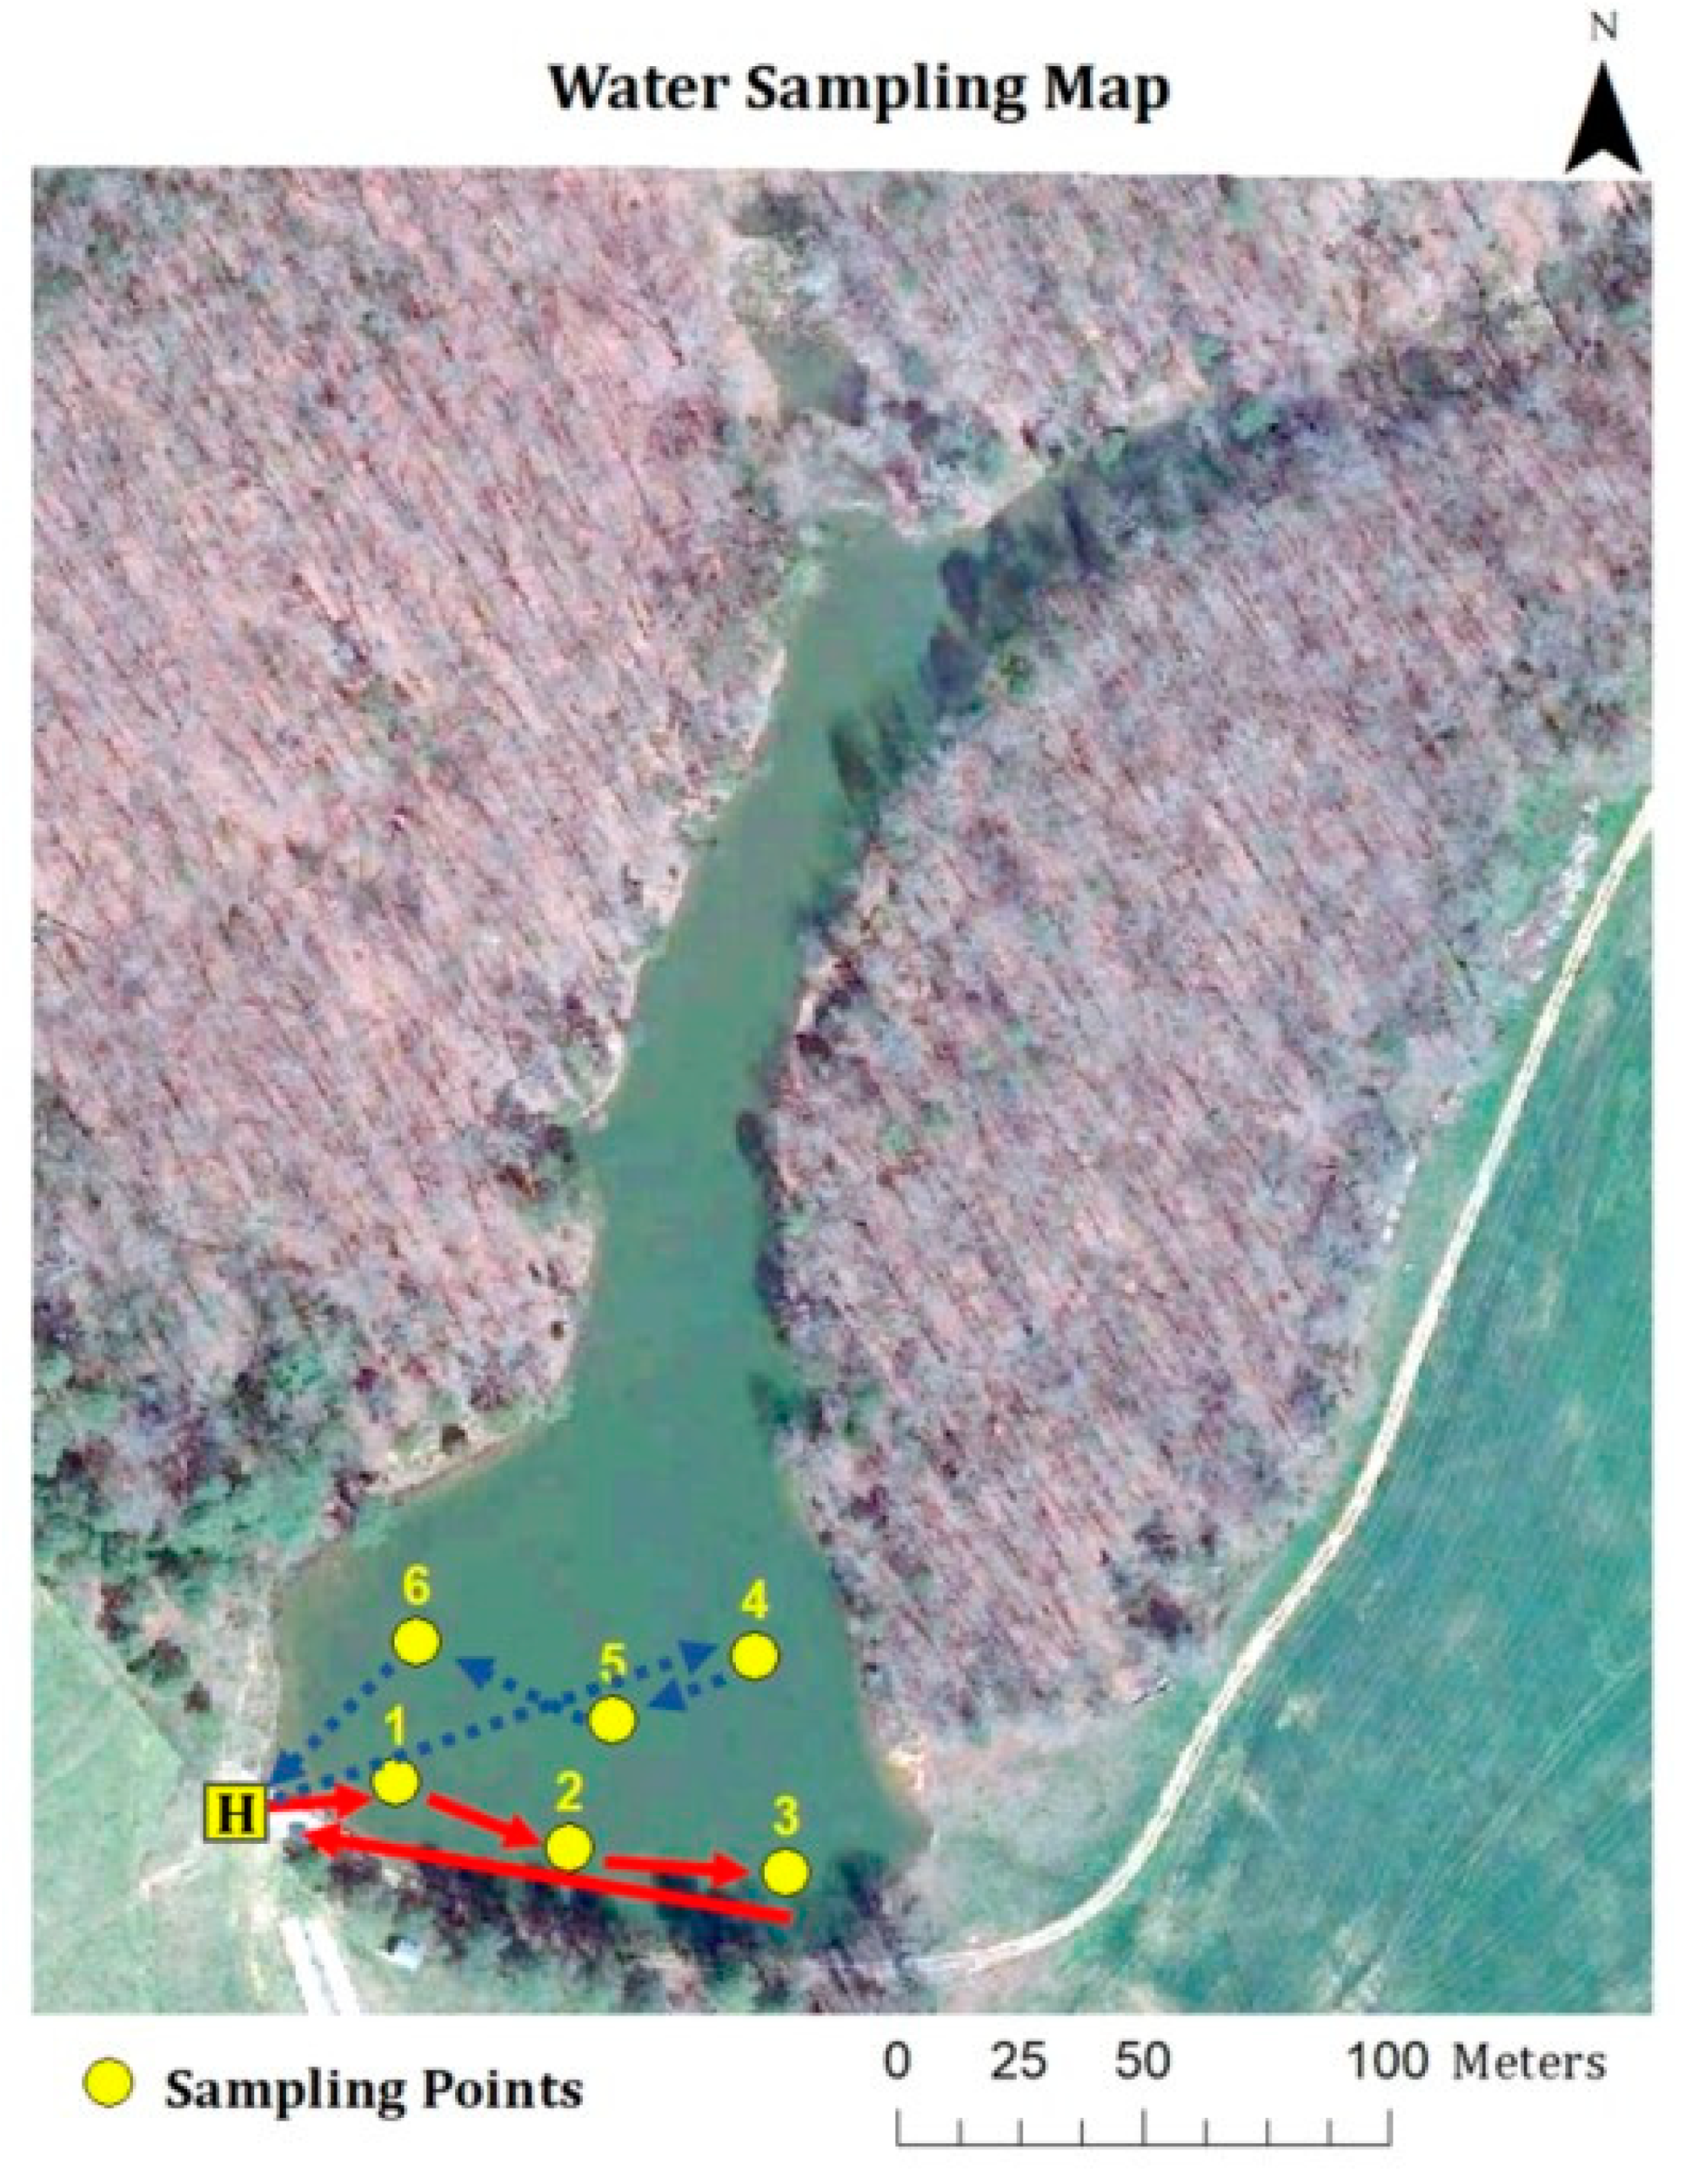
Field tests were conducted at the LaMaster agricultural pond at Clemson University, Clemson SC on the afternoon of 18 July 2018. The total surface area of the pond was 1.1 ha. The pond is wider near the experiment site and narrower from the center towards the far end. Because the UAV system did not have enough endurance capacity and for safety precautions, the narrow area of the pond was avoided during sample and data collection. The launch location marked with “H”, the sampling locations marked with yellow dots, and the autonomous flight trajectory of the UAV marked with dotted and straight lines are shown in Figure 5.
There were six sampling locations chosen for field experiments. A single autonomous flight mission was limited to collecting water samples and making in situ measurements from three locations at a time. This limitation on number of locations was due to the number of cartridges on the mechanism. The solid red lines and the dotted blue lines represent individual autonomous flight trajectories. Water sample collections and in situ measurements were made from 0.5 m and 3.0 m depths at each location using the same flight trajectory. Four autonomous mission flights were conducted to accomplish designated sampling tasks from these locations. Two of the autonomous flights were made for water sampling at the depth of 0.5 m and the other two were made at the depth of 3 m. Sampling depth adjustment was made by changing the position of a float section mounted on the extension cables. The float section stayed at the water surface while the sensor node and WSC submerged to desired depths. Twelve continuous measurements were made and recorded at each sampling location. Data were stored on the SD card for analysis. Quantitative analyses of measurements were made with paired t-test in R (R: The R Foundation) to evaluate statistical differences in DO, EC, pH, and temperature.
3. Results and Discussion
UAV flight characteristics of endurance and thrust were evaluated to confirm the capability of carrying the payload for a given time to accomplish an autonomous water sampling and measurement mission. Battery capacity was the limiting factor for available flight time, therefore lab tests were conducted prior to field experiments. Lab test results confirmed the UAV was capable of carrying the necessary experimental payload. In situ measurement and water collection trials were accomplished with field experiments. Autonomous activation of sensor node and WSC for in situ measurements and water collection was successful. Autonomous water sampling experiments required auto landing and takeoff from the water surface. The floatation attachment had to keep the UAV above water surface while allowing easy landing and takeoff. The number of successful water collection attempts were recorded to provide information about WSC.
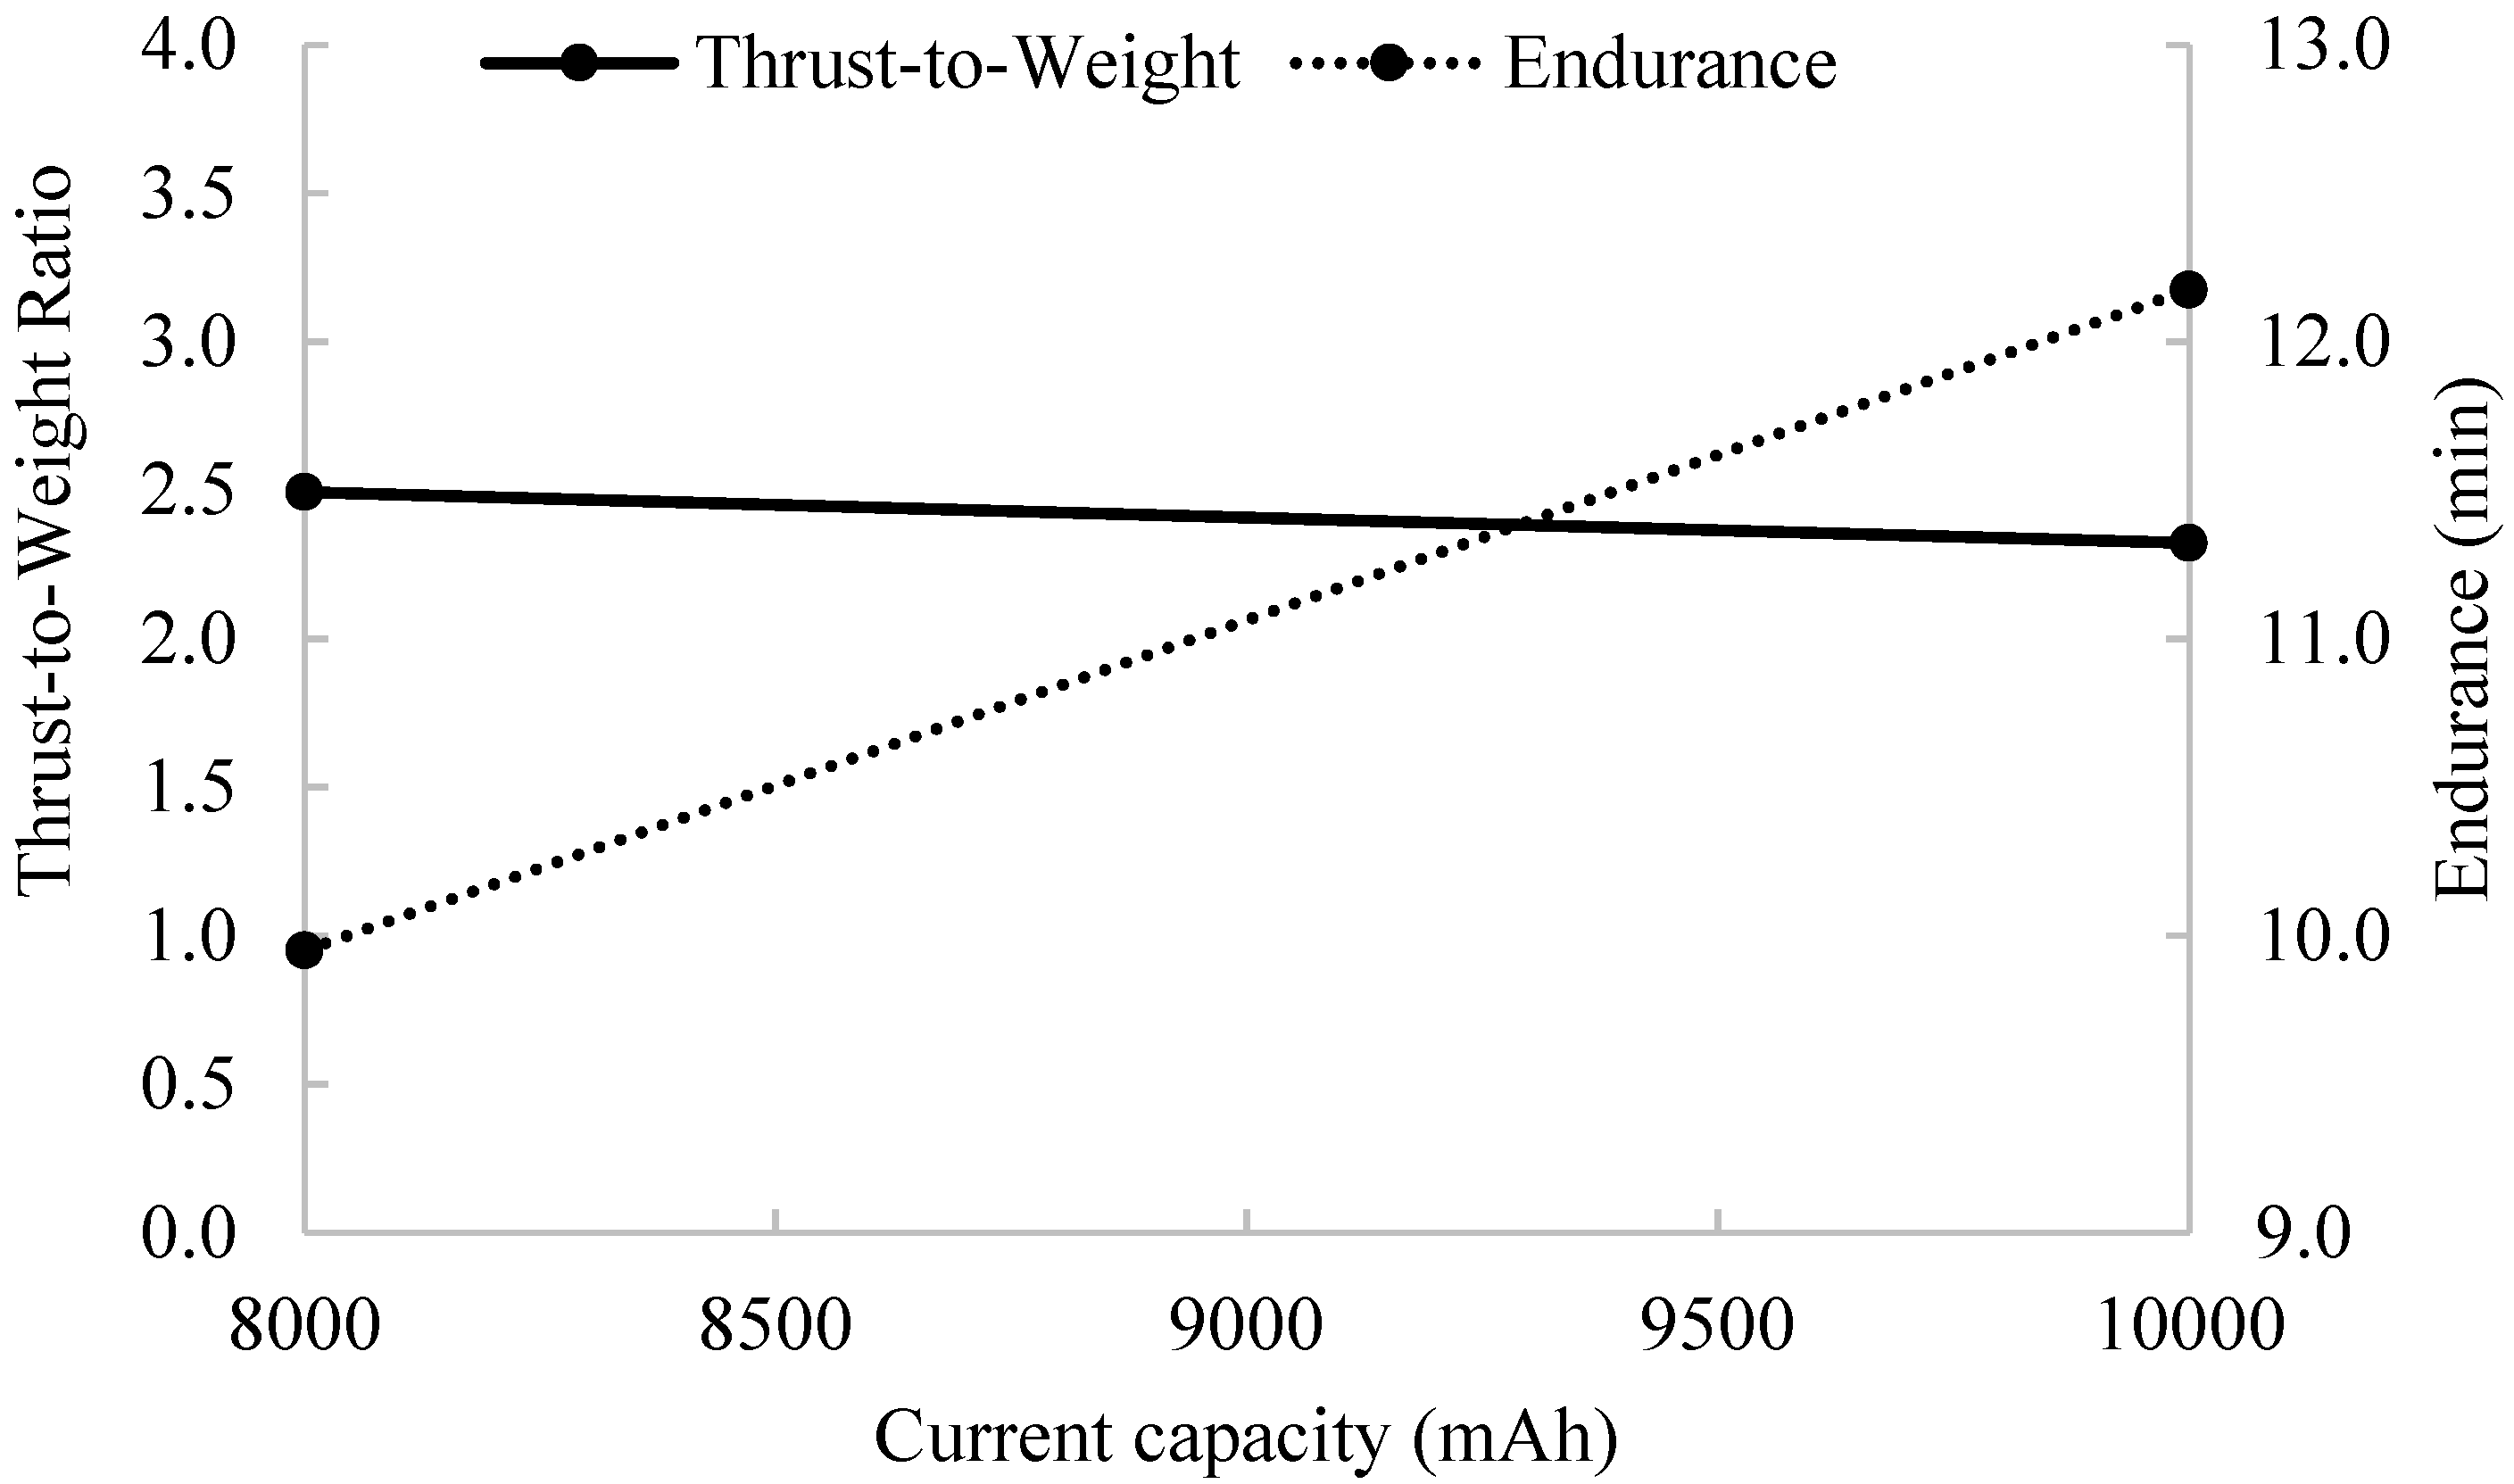
Thrust measurements indicated the UAV could produce 64 N of upward force with 4.3 kg of operating empty weight, which does not include anticipated payload. This result was achieved when a 8000 mAh battery was used. The downward force acting on the UAV due to weight was 42 N. The UAV produced 106 N of thrust for takeoff and for pulling up the sensor node and sampling cartridges at the sampling locations. The thrust-to-weight ratio of the UAV was 2.5 (Figure 6). Because the power output of the motors and available thrust are not linear, a 20% safety factor for thrust-to-weight ratio was considered. The thrust-to-weight ratio was greater than the minimum thrust-to-weight requirement of 2.2 that included the safety factor. Lab tests for endurance and thrust measurements showed that the UAV was capable of carrying the payload and had 10 min of endurance. The endurance of the UAV was 12 min and the thrust-to-weight ratio was 2.3 when the 10,000 mAh battery was used. The battery with higher capacity provided longer endurance but the thrust-to-weight ratio was correspondingly lower. The difference in thrust-to-weight ratio was due to the additional weight of 0.5 kg that the larger battery added on the UAV. In order to provide safe flights for water sampling experiments, a battery with 8000 mAh capacity was chosen.
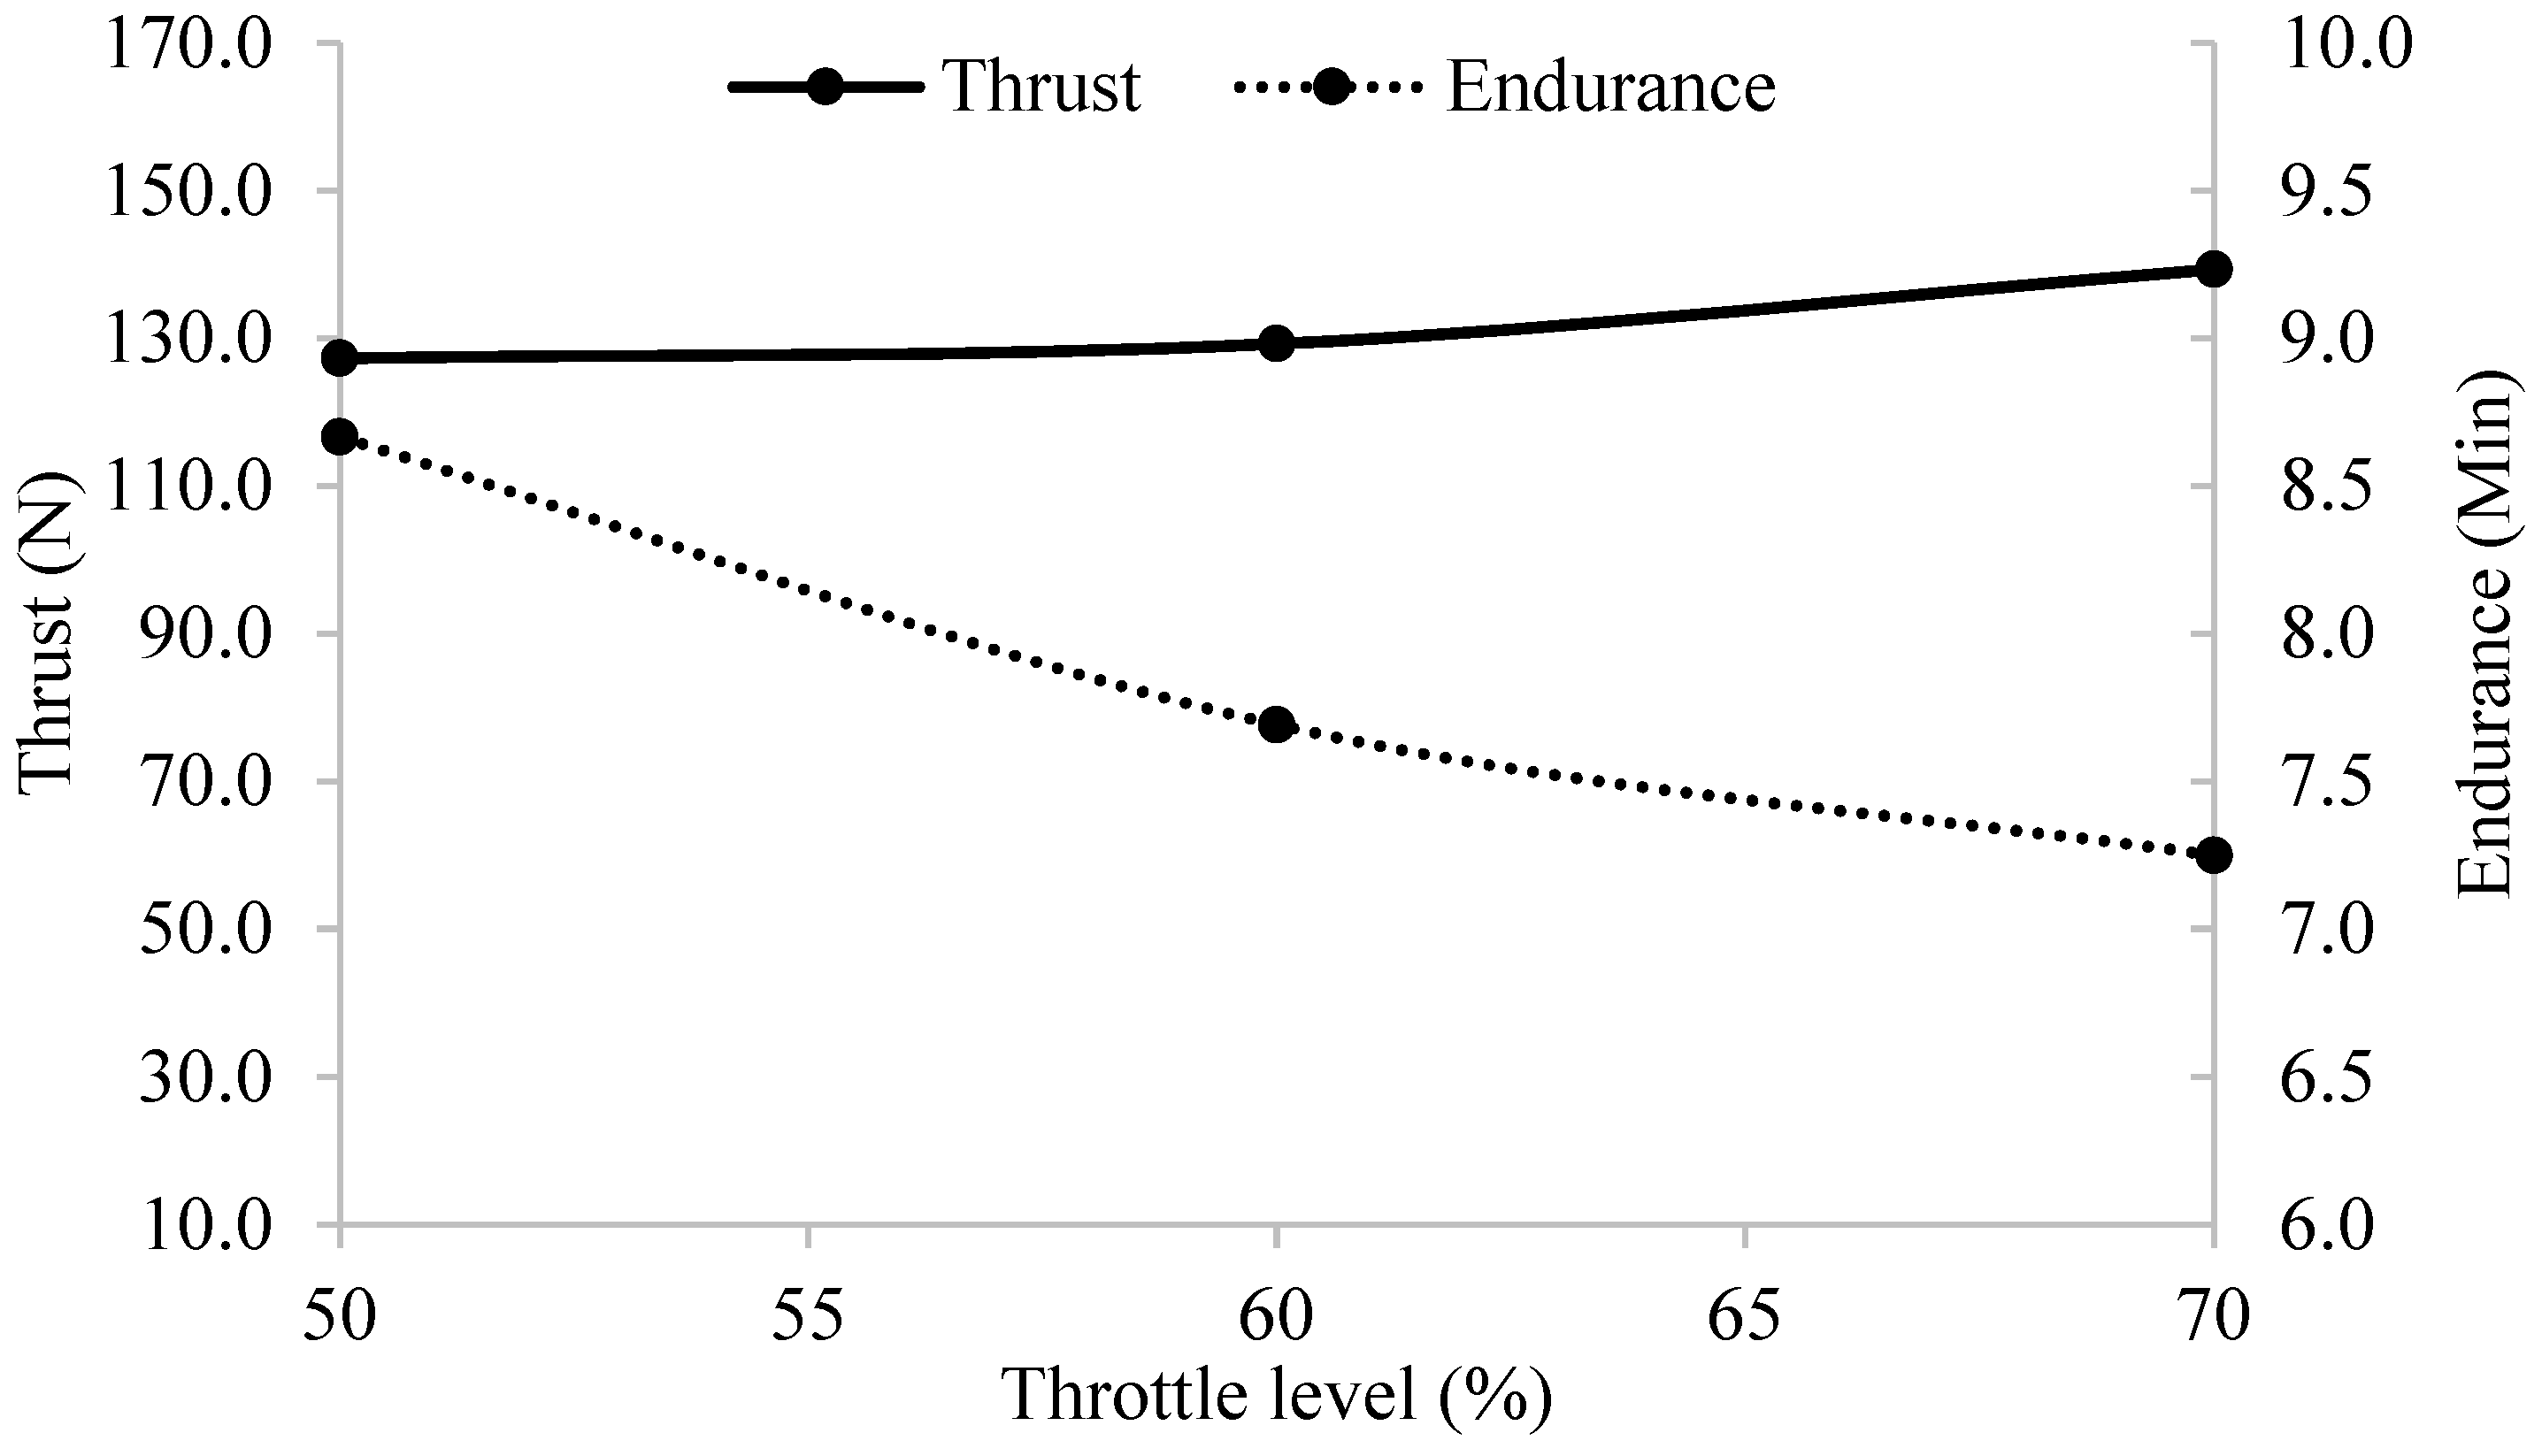
Tests with the payload and the 8000 mAh battery showed that endurance was shorter than the tests conducted without the payload (Figure 7). The UAV produced more thrust by pulling greater current from the battery to compensate for the 2.1 kg payload. This compensation was the reason for shorter endurance. The UAV produced 127 N of thrust and the endurance was 8.7 min. When the throttle setting was increased to 60%, the thrust and endurance were measured as 129 N and 7.7 min. The thrust and endurance measurements at 70% throttle were 139 N and 7.3 min. The thrust was highest at 70% throttle that provided the lowest endurance. These results indicate that if the flight conditions change due to wind speed fluctuation or gusts, endurance will be reduced, because the UAV consumes more battery power to increase the thrust to overcome the wind. The endurance in field experiments would be lower than the indoor tests. Therefore, the water sampling missions should be planned to ensure that the UAV system can travel to the sampling locations and return to the launch location safely.
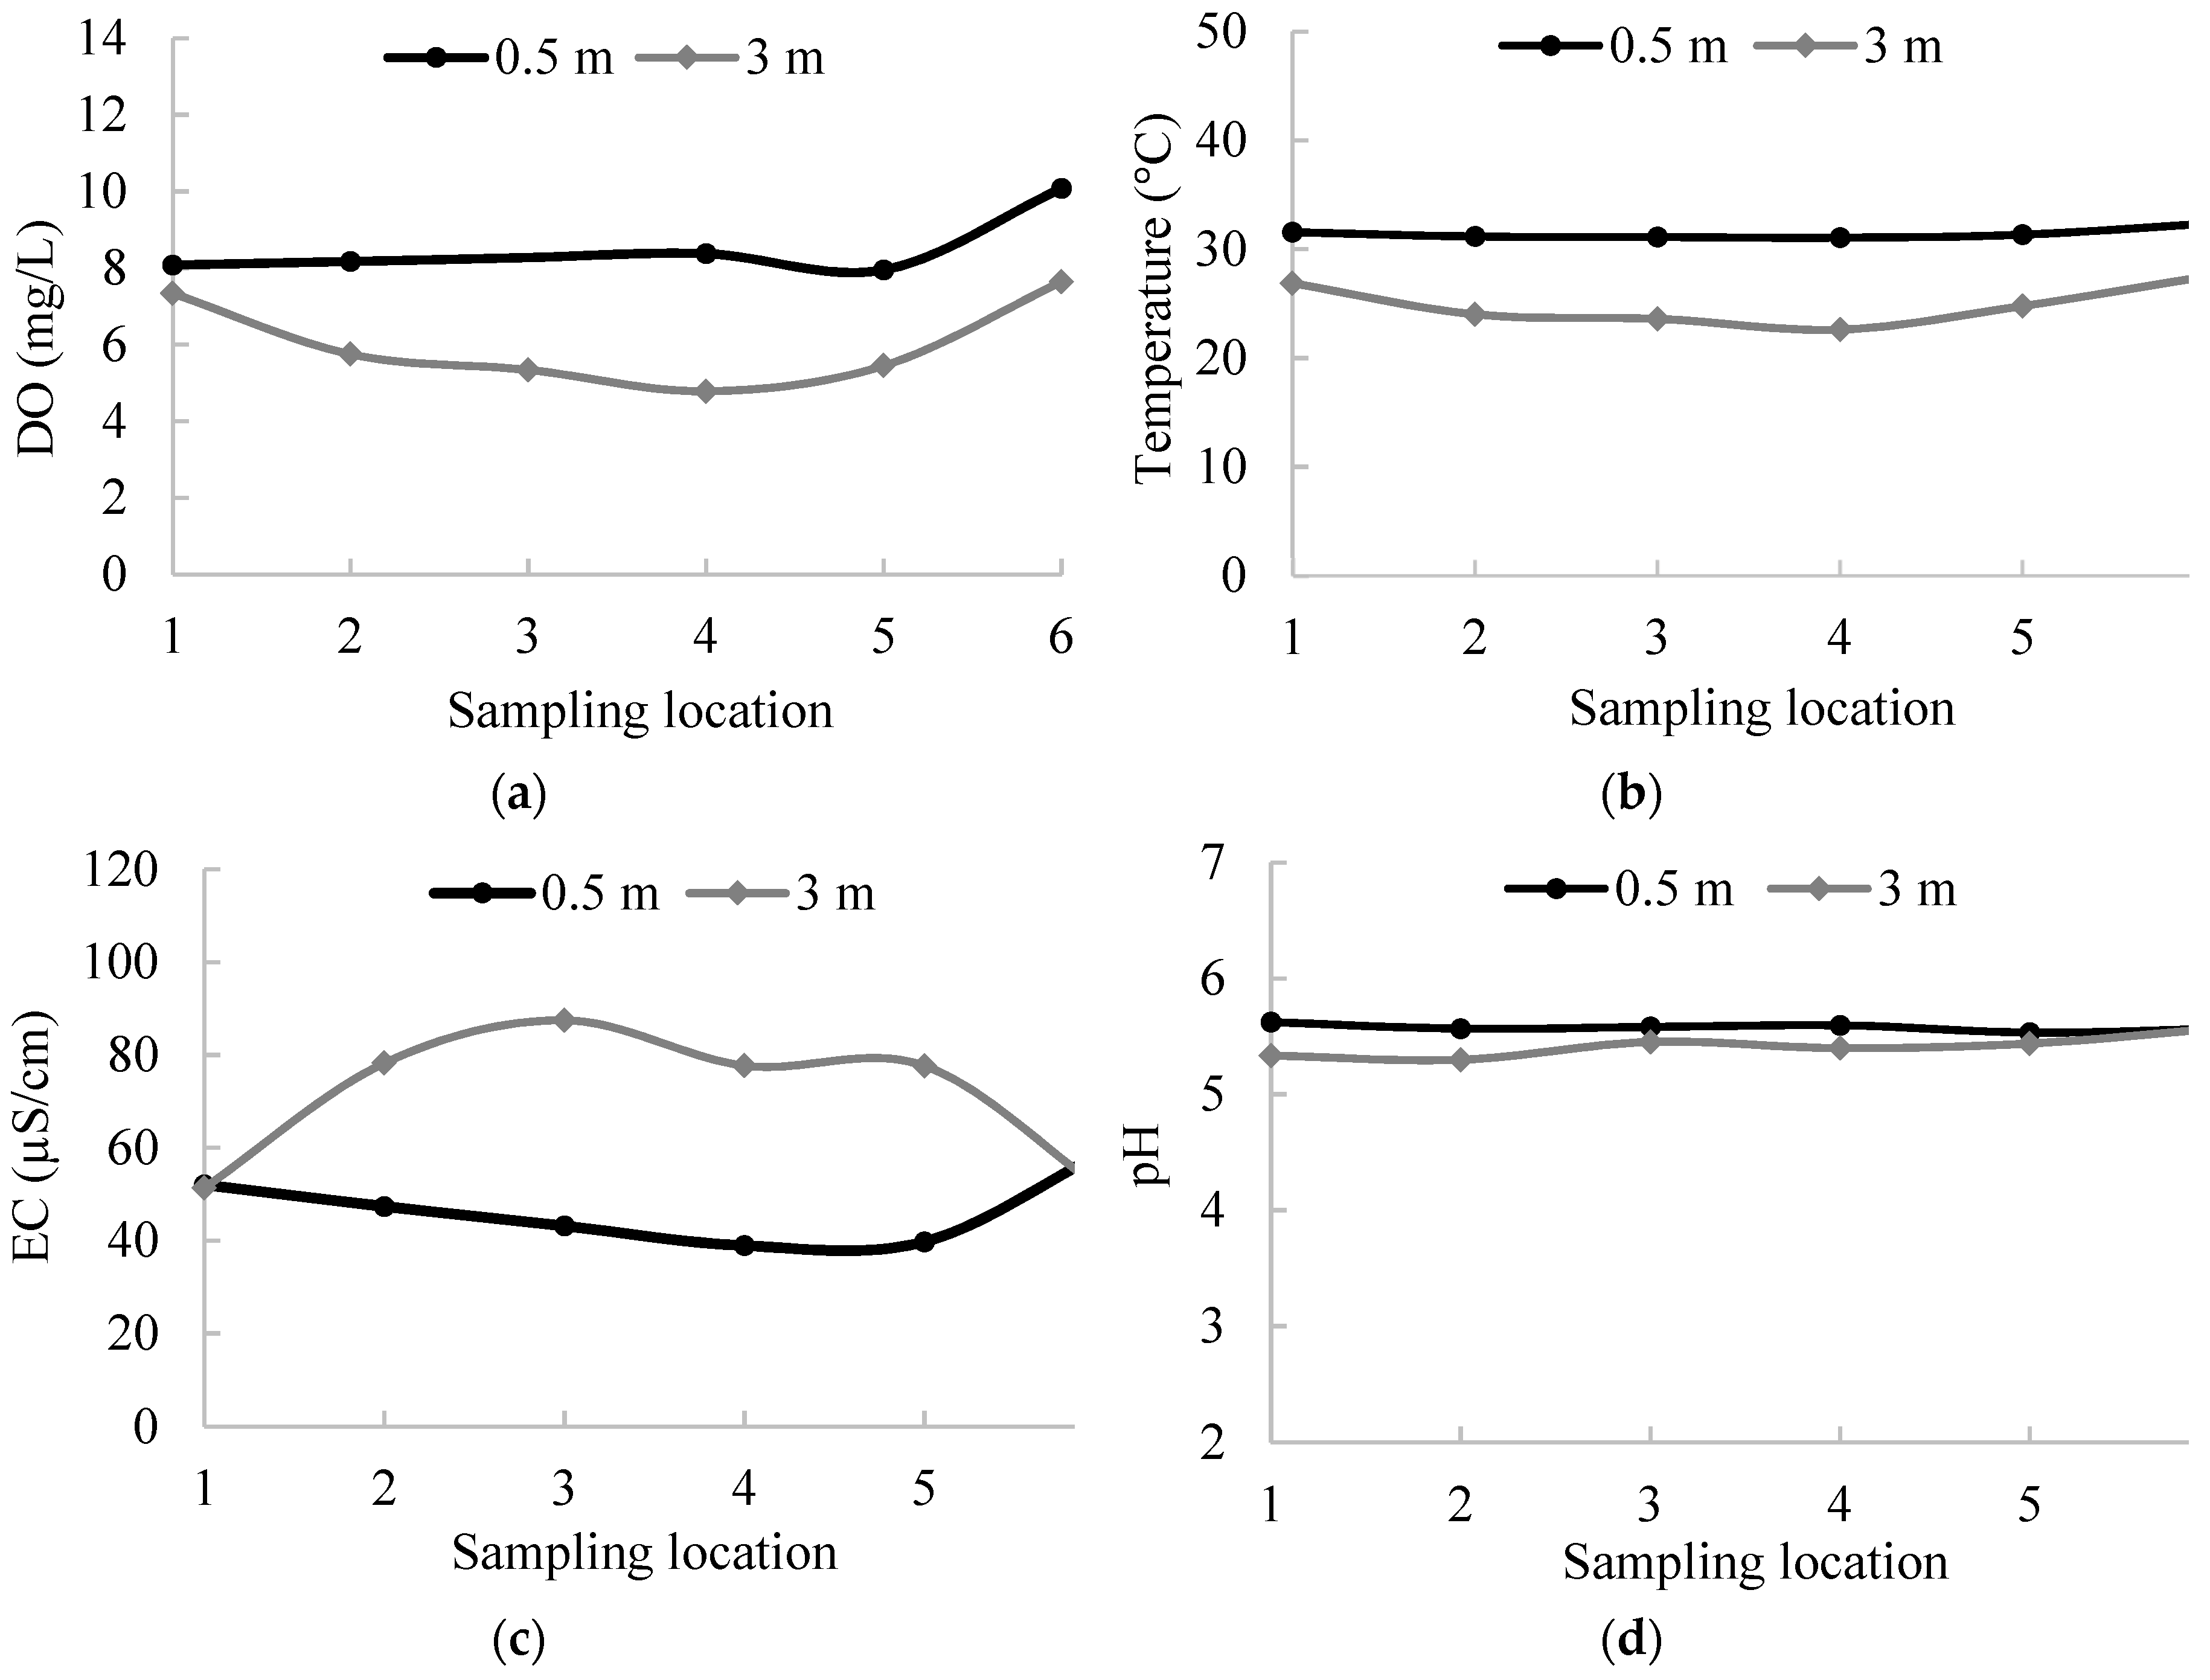
Autonomous in situ measurements and water sampling flights were successfully achieved without remote pilot intervention. Mission flight commands such as takeoff, navigate, land, activate the sensor node, and activate the WSC were performed without error. At each sampling point, the UAV landed on water, waited for 60 s, conducted the in situ measurements, collected 130 mL of water sample, and lifted off to navigate autonomously to the next waypoint on the flight path. In situ water quality measurements made at the same depths in different locations showed a similar trend (Figure 8). At 0.5 m depth, measured values ranged between 8 mg/L and 10 mg/L for DO, 31 °C and 33 °C for temperature, 39 µS/cm and 60 µS/cm for EC, and 5.5 and 5.6 for pH. At 3 m depth, measured values ranged between 5 mg/L and 8 mg/L for DO, 23 °C and 28 °C for temperature, 51 µS/cm and 88 µS/cm for EC, and 5.3 and 5.6 for pH.
The measurements of DO, temperature, and pH were higher at the depth of 0.5 m than the depth of 3 m. EC measurements were higher at the depth of 3 m than the depth of 0.5 m, while the measurements at the sampling locations 1 and 6 showed an opposite trend. The reason for variations at the sampling locations 1 and 6 was due to the actual depth of the sensor node in the water. The water depth at sampling location 1 was measured as 2.1 m. This indicates that the sensor node did not reach the sampling depth of 3 m and submerged all the way to the bottom of the water at sampling location 1. At sampling location 6, the sensor node did not fully deploy due to the presence of submerged aquatic vegetation. Therefore, the measurements at sampling locations 1 and 6 do not represent depth-specific conditions. The average depths of sampling locations 2, 3, 4, and 5 were calculated and represent depth-specific conditions. Average measurements of EC, pH, DO, and temperature at the depth of 0.5 m were 42 µS/cm, 5.6, 8.2 mg/L, and 31 °C, while the measurements at the depth of 3 m were 80 µS/cm, 5.3, 5.34 mg/L, and 24 °C, respectively.
Data collected from locations 1 and 6 were not depth specific, while data from location 3 at 0.5 m was not acquired due to operator error. As a result, only data from locations 2, 4, and 5 were used in paired t-test analysis. At these locations, 12 continuous measurements for each water quality indicator were made with the sensor node, providing 36 data points at the depth of 0.5 m, and 36 data points at the depth of 3 m. In the paired t-test, it was hypothesized that the differences in the DO, EC, pH, and temperature measurements made at the depths of 0.5 m and 3 m would be statistically different at an alpha level of 0.05.
Paired t-test analysis indicated that there was no significant difference between the pH measurements that were made at the depths of 0.5 m and 3 m (t (2) = −3.56, p = 0.0705). The pH in the water column did not change with depth. However, results indicated that there were significant differences between the DO, EC, and temperature measurements made at the depths of 0.5 m and 3 m. DO measurements at 3 m depth were 21% lower than DO measurements at 0.5 m (t (2) = −7.46, p = 0.0175). The mean difference between EC measurements at 0.5 m and 3 m were the highest at 29.9% (t (2) = 14.33, p = 0.0048). EC values at 3 m were higher than EC values measured at 0.5 m despite the temperature at 3 m being lower. This indicates that organic matter, dissolved solids, or other factors increased the EC values [40]. Temperature measurements were significantly lower at 3 m than those at 0.5 m (t (2) = −13.30, p = 0.0056) (Table 2). As expected, water temperature decreased with increasing depth. DO values increased with increasing depth and decreasing temperature because cold water can hold more dissolved oxygen than warm water.
The WSC was activated during mission flights and 130 mL of water samples in each cartridge were successfully stored in each cartridge until the UAV was returned to the launch location. The number of successful activation and collection trials were recorded as successful sampling, and the number of failed attempts were recorded as unsuccessful sampling. Sampling events with WSC at each trial were recorded as successful. Therefore, the success rate of the WSC was 100%. Landing and takeoff from the water surface with the mounted floatation attachments was successful. Autonomous navigation of the UAV during landing and takeoff from the water surface was swift and did not pose any challenges. Anecdotally, autonomous control of the system appeared to be more stable than manual control with a radio controller for both navigating to the sampling points and take off/landing from the water surface.
Field tests demonstrated that the system was able to navigate autonomously to predefined locations and perform in situ measurements and water collection tasks simultaneously. While the developed system measured only the DO, pH, EC, and temperature, other water quality indicators such as clay content, organic matter, total dissolved solids, total suspended solids, total hardness, pesticides, coliform bacteria, Escherichia coli (E-coli), and other indicators would require laboratory analyses. The triple cartridge sampling presented in this study can be used for obtaining necessary water samples at varying depths to conduct laboratory analyses of physical, chemical, and biological water quality indicators.
The depth of sensor node and sampling cartridge were adjusted with flotation equipment attached to the sensor cords. The UAV system reported in this study conducted in situ measurements at 0.5 m and 3.0 m depths. These depths were selected to test the ability of the system to conduct in situ measurements and sample collections at varying depths. Vertical water quality profiling would require multiple measurements in a water column. Integrating a pressure sensor would measure the depth of sensor node and sampling location more precisely while making measurements at varying depths. The length of the cords for sensor nodes limited the maximum depth at which measurements and sample collections were made. In addition, increasing the length of the cords increases the payload. The thrust-to-weight ratio of the UAV used in this study was 2.5 at 50% throttle and was within safe operation limits. A larger UAV with a higher thrust-to-weight ratio may be needed to increase the depth for in situ measurements and sample collection.
The sensor node in this study was placed 30 cm above the sampling cartridges. This distance was selected to minimize the effects of the sampling cartridges on sensor node measurements. In addition, the sampling cartridges entered the water vertically, as shown in Figure 2c. Preliminary experiments showed that if the sampling cartridges approached parallel to the water surface, the buoyancy of the water reduced the entry speed of the cartridges in the water.
The water sampling mechanism consisted of three cartridges, which enabled triple sample collection at the same point or one sample collection at three different points. Using a waterproof servo proved to be a more reliable design for water sampling than the one presented in previous research [35]. Integration of a sensor node and WSC with the flight controller enabled fully autonomous UAV-assisted water quality evaluation.
The system was proved to be an effective tool for periodic water sampling and analysis from waterbodies. The periodic sampling and in situ analysis that the system provides can be utilized to characterize waterbodies and identify changes or trends in water quality [41,42]. Periodic sampling from waterbodies that are not included in monitoring programs will be possible without installing remote sensor stations [43]. When the developed system is used, the number of sampling locations and depths will vary depending on the battery capacity of the UAV available on the field [34]. In situ water quality measurements with the system showed differences in selected water quality indicators by depth and location in the experiment pond. The differences in water quality indicators were within the permissible levels and did not show any abnormal condition of the waterbody [44,45,46]. Different sampling intervals, number of locations, and depths can be investigated by making necessary adjustments to the system. The UAV assisted in situ measurement method allowed regular sensor maintenance and calibration to keep the sensors clean, which would minimize measurement errors due to fouling. Regular cleaning and calibration of the sensors provided reliable data, hence fixed sensor stations might provide faulty data due to sediment or organic material build up around the sensors [42].
4. Conclusions
A UAV-assisted autonomous water sampling system (UASS) integrated with a sensor node for in situ measurements of dissolved oxygen (DO), electrical conductivity (EC), pH, and temperature were developed with this research. The system can land on water surfaces for in situ measurements and collect up to three water samples with a triple cartridge. Each cartridge can hold 130 mL of water. Having multiple cartridges would help field personnel to collect replicate samples with one mission flight. This would eliminate the UAV from returning to the launch location after each sample collection and reduce sample collection durations. Based on the in situ measurement values, the UASS system can make a decision to collect a water sample for further analyses or navigate to the next sampling location over a waterbody.
The developed system is a practical and reliable water quality assessment tool for researchers and practitioners. For example, researchers using satellite remote sensing to develop water quality assessment models can use the developed system to collect ground verification data from waterbodies. Field personnel conducting periodic water quality assessments can use the system for rapid water sampling from difficult to access waterbodies with relatively low costs. The system can perform rapid water quality assessment and sampling either separately or simultaneously without requiring intense training for the practitioners. Future work will include upgrading the sampling cartridge design with more cartridges, integrating turbidity and pressure sensors, and developing fully adaptive water sampling based on in situ measurements.
Author Contributions
Conceptualization, C.K. and A.B.K.; Methodology, C.K., A.B.K., C.V.P. and C.B.S.; Software, C.K.; Validation, C.K., A.B.K. and C.B.S.; Formal Analysis, C.K.; Resources, A.B.K. and C.V.P.; Data Curation, C.K.; Writing—Original Draft Preparation, C.K.; Writing—Review & Editing, A.B.K. and C.B.S.; Visualization, C.K.; Supervision, A.B.K.; Project Administration, A.B.K.; Funding Acquisition, A.B.K.
Funding
This research received no external funding.
Conflicts of Interest
The authors declare no conflict of interest.
References
- Lewitus, A.J.; Schmidt, L.B.; Mason, L.J.; Kempton, J.W.; Wilde, S.B.; Wolny, J.L.; Williams, B.J.; Hayes, K.C.; Hymel, S.N.; Keppler, C.J.; et al. Harmful Algal Blooms in South Carolina Residential and Golf Course Ponds. Popul. Environ. 2003, 24, 387–413. [Google Scholar] [CrossRef]
- Tyler, A.N.; Hunter, P.D.; Carvalho, L.; Codd, G.A.; Elliott, J.A.; Ferguson, C.A.; Hanley, N.D.; Hopkins, D.W.; Maberly, S.C.; Mearns, K.J.; et al. Strategies for monitoring and managing mass populations of toxic cyanobacteria in recreational waters: A multi-interdisciplinary approach. Environ. Health 2009, 8, S11. [Google Scholar] [CrossRef]
- Shoda, M.E.; Sprague, L.A.; Murphy, J.C.; Riskin, M.L. Water-quality trends in U.S. rivers, 2002 to 2012: Relations to levels of concern. Sci. Total Environ. 2019, 650, 2314–2324. [Google Scholar] [CrossRef] [PubMed]
- Garg, V.; Senthil Kumar, A.; Aggarwal, S.P.; Kumar, V.; Dhote, P.R.; Thakur, P.K.; Nikam, B.R.; Sambare, R.S.; Siddiqui, A.; Muduli, P.R.; et al. Spectral similarity approach for mapping turbidity of an inland waterbody. J. Hydrol. 2017, 550, 527–537. [Google Scholar] [CrossRef]
- Null, S.E.; Mouzon, N.R.; Elmore, L.R. Dissolved oxygen, stream temperature, and fish habitat response to environmental water purchases. J. Environ. Manag. 2017, 197, 559–570. [Google Scholar] [CrossRef] [PubMed]
- Li, D.; Liu, S. Water Quality Detection for Lakes. In Water Quality Monitoring and Management; Li, D., Liu, S., Eds.; Academic Press: Cambridge, MA, USA, 2019; Chapter 8; pp. 221–231. [Google Scholar]
- Pearse, J. Phytoplankton-nutrient relationships in South Carolina reservoirs: Implications for management strategies. Lake Reserv. Manag. 1984, 1, 193–197. [Google Scholar] [CrossRef]
- Xu, Z.; Boyd, C.E. Reducing the monitoring parameters of fish pond water quality. Aquaculture 2016, 465, 359–366. [Google Scholar] [CrossRef]
- Schaeffer, B.A.; Schaeffer, K.G.; Keith, D.; Lunetta, R.S.; Conmy, R.; Gould, R.W. Barriers to adopting satellite remote sensing for water quality management. Int. J. Remote Sens. 2013, 34, 7534–7544. [Google Scholar] [CrossRef]
- Anderson, C.W. Techniques of Water-Resources Investigations in National Field Manual for the collection of Water-Quality Data, 09-A6.7; United States Geological Survey (USGS): Reston, VA, USA, 2005. [CrossRef]
- Stauber, C.; Miller, C.; Cantrell, B.; Kroell, K. Evaluation of the compartment bag test for the detection of Escherichia coli in water. J. Microbiol. Methods 2014, 99, 66–70. [Google Scholar] [CrossRef] [PubMed]
- Chung, W.-Y.; Yoo, J.-H. Remote water quality monitoring in wide area. Sens. Actuators B Chem. 2015, 217, 51–57. [Google Scholar] [CrossRef]
- Li, D.; Liu, S. Detection of River Water Quality. In Water Quality Monitoring and Management; Li, D., Liu, S., Eds.; Academic Press: Cambridge, MA, USA, 2019; Chapter 7; pp. 211–220. [Google Scholar]
- Kim, S.E.; Seo, I.W.; Choi, S.Y. Assessment of water quality variation of a monitoring network using exploratory factor analysis and empirical orthogonal function. Environ. Model. Softw. 2017, 94, 21–35. [Google Scholar] [CrossRef]
- Khalid, S.D.R.; Hamzah, Z.; Saat, A. In-Situ Measurement of Selected Water Quality Parameters in Ringlet’s Lake, Cameron Highlands. Malays. J. Chem. 2009, 11, 122–128. [Google Scholar]
- Yang, K.; Yu, Z.; Luo, Y.; Yang, Y.; Zhao, L.; Zhou, X. Spatial and temporal variations in the relationship between lake water surface temperatures and water quality—A case study of Dianchi Lake. Sci. Total Environ. 2018, 624, 859–871. [Google Scholar] [CrossRef] [PubMed]
- Berg, P.; McGlathery, K.J. A high-resolution pore water sampler for sandy sediments. Limnol. Oceanogr. 2001, 46, 203–210. [Google Scholar] [CrossRef] [Green Version]
- Saiki, K.; Kaneko, K.; Ohba, T.; Ntchantcho, R.; Fouepe, A.; Kusakabe, M.; Tanyileke, G.; Hell, J.V. Vertical change in transparency of water at Lake Nyos, a possible indicator for the depth of chemocline. J. Afr. Earth Sci. 2019, 152, 122–127. [Google Scholar] [CrossRef]
- Glasgow, H.B.; Burkholder, J.M.; Reed, R.E.; Lewitus, A.J.; Kleinman, J.E. Real-time remote monitoring of water quality: A review of current applications, and advancements in sensor, telemetry, and computing technologies. J. Exp. Mar. Biol. Ecol. 2004, 300, 409–448. [Google Scholar] [CrossRef]
- Ore, J.-P.; Detweiler, C. Sensing water properties at precise depths from the air. In Field and Service Robotics; Springer: Cham, Switzerland, 2018; pp. 205–220. [Google Scholar]
- Mayer, C.C.; Ali, K.A. Field Spectroscopy as a Tool for Enhancing Water Quality Monitoring in the ACE Basin, SC. J. South Carol. Water Resour. 2017, 4, 5. [Google Scholar]
- Kaizu, Y.; Iio, M.; Yamada, H.; Noguchi, N. Development of unmanned airboat for water-quality mapping. Biosyst. Eng. 2011, 109, 338–347. [Google Scholar] [CrossRef] [Green Version]
- Esakki, B.; Ganesan, S.; Mathiyazhagan, S.; Ramasubramanian, K.; Gnanasekaran, B.; Son, B.; Park, S.W.; Choi, J.S. Design of Amphibious Vehicle for Unmanned Mission in Water Quality Monitoring Using Internet of Things. Sensors 2018, 18, 3318. [Google Scholar] [CrossRef] [PubMed]
- Eichhorn, M.; Ament, C.; Jacobi, M.; Pfuetzenreuter, T.; Karimanzira, D.; Bley, K.; Boer, M.; Wehde, H. Modular AUV System with Integrated Real-Time Water Quality Analysis. Sensors 2018, 18, 1837. [Google Scholar] [CrossRef]
- McGowan, S. Algal Blooms A2—Shroder, John F. In Biological and Environmental Hazards, Risks, and Disasters; Sivanpillai, R., Ed.; Academic Press: Boston, MA, USA, 2016; Chapter 2; pp. 5–43. [Google Scholar]
- Winkelbauer, A.; Fuiko, R.; Krampe, J.; Winkler, S. Crucial elements and technical implementation of intelligent monitoring networks. Water Sci. Technol. 2014, 70, 1926–1933. [Google Scholar] [CrossRef] [PubMed]
- Chung, M.; Detweiler, C.; Hamilton, M.; Higgins, J.; Ore, J.-P.; Thompson, S. Obtaining the Thermal Structure of Lakes from the Air. Water 2015, 7, 6467–6482. [Google Scholar] [CrossRef] [Green Version]
- MacIntyre, S.; Romero, J.R.; Kling, G.W. Spatial-temporal variability in surface layer deepening and lateral advection in an embayment of Lake Victoria, East Africa. Limnol. Oceanogr. 2002, 47, 656–671. [Google Scholar] [CrossRef] [Green Version]
- Liu, Y.; Noguchi, N.; Yusa, T. Development of an Unmanned Surface Vehicle Platform for Autonomous Navigation in Paddy Field. Ifac Proc. Vol. 2014, 47, 11553–11558. [Google Scholar] [CrossRef]
- Ore, J.-P.; Elbaum, S.; Burgin, A.; Detweiler, C. Autonomous Aerial Water Sampling. J. Field Robot. 2015, 32, 1095–1113. [Google Scholar] [CrossRef] [Green Version]
- Rodrigues, P.; Marques, F.; Pinto, E.; Pombeiro, R.; Lourenço, A.; Mendonça, R.; Santana, P.; Barata, J. An open-source watertight unmanned aerial vehicle for water quality monitoring. In Proceedings of the OCEANS’15 MTS/IEEE Washington, Washington, DC, USA, 19–22 October 2015; pp. 1–6. [Google Scholar]
- Tai, H.; Li, D.; Wei, Y.; Ma, D.; Ding, Q. A Simple Temperature Compensation Method for Turbidity Sensor. In Proceedings of the International Conference on Computer and Computing Technologies in Agriculture, Nanchang, China, 22–25 October 2010; Springer: Berlin/Heidelberg, Germany, 2010; pp. 650–658. [Google Scholar]
- Zhang, L.; Thomas, S.; Mitsch, W.J. Design of real-time and long-term hydrologic and water quality wetland monitoring stations in South Florida, USA. Ecol. Eng. 2017, 108, 446–455. [Google Scholar] [CrossRef]
- Koparan, C.; Koc, A.B.; Privette, C.; Sawyer, C. In Situ Water Quality Measurements Using an Unmanned Aerial Vehicle (UAV) System. Water 2018, 10, 264. [Google Scholar] [CrossRef]
- Koparan, C.; Koc, A.B.; Privette, C.; Sawyer, C.; Sharp, J. Evaluation of a UAV-Assisted Autonomous Water Sampling. Water 2018, 10, 655. [Google Scholar] [CrossRef]
- Panagiotou, P.; Fotiadis-Karras, S.; Yakinthos, K. Conceptual design of a Blended Wing Body MALE UAV. Aerosp. Sci. Technol. 2018, 73, 32–47. [Google Scholar] [CrossRef]
- Bravo-Mosquera, P.D.; Botero-Bolivar, L.; Acevedo-Giraldo, D.; Cerón-Muñoz, H.D. Aerodynamic design analysis of a UAV for superficial research of volcanic environments. Aerosp. Sci. Technol. 2017, 70, 600–614. [Google Scholar] [CrossRef]
- Higgins, J.; Detweiler, C. The waterbug sub-surface sampler: Design, control and analysis. In Proceedings of the 2016 IEEE/RSJ International Conference on Intelligent Robots and Systems (IROS), Daejeon, Korea, 9–14 October 2016; pp. 330–337. [Google Scholar]
- Bormashenko, E. Surface tension supported floating of heavy objects: Why elongated bodies float better? J. Colloid Interface Sci. 2016, 463, 8–12. [Google Scholar] [CrossRef] [PubMed] [Green Version]
- Cerón, J.C.; Grande, J.A.; de la Torre, M.L.; Borrego, J.; Santisteban, M.; Valente, T. Hydrochemical characterization of an acid mine drainage-affected reservoir: The Sancho Reservoir, Huelva, southwest Spain. Hydrol. Sci. J. 2014, 59, 1213–1224. [Google Scholar] [CrossRef]
- Kovács, J.; Tanos, P.; Várbíró, G.; Anda, A.; Molnár, S.; Hatvani, I.G. The role of annual periodic behavior of water quality parameters in primary production—Chlorophyll-a estimation. Ecol. Indic. 2017, 78, 311–321. [Google Scholar] [CrossRef]
- Carstens, D.; Amer, R. Spatio-temporal analysis of urban changes and surface water quality. J. Hydrol. 2019, 569, 720–734. [Google Scholar] [CrossRef]
- Keller, A.A.; Cavallaro, L. Assessing the US Clean Water Act 303(d) listing process for determining impairment of a waterbody. J. Environ. Manag. 2008, 86, 699–711. [Google Scholar] [CrossRef] [PubMed]
- Kumar, M.; Puri, A. A review of permissible limits of drinking water. Indian J. Occup. Environ. Med. 2012, 16, 40–44. [Google Scholar] [CrossRef] [Green Version]
- Stone, N.M.; Thomforde, H.K. Understanding Your Fish Pond Water Analysis Report; University of Arkansas: Pine Bluff, AR, USA, 2004. [Google Scholar]
- Bhatnagar, A.; Devi, P. Water quality guidelines for the management of pond fish culture. Int. J. Environ. Sci. 2013, 3, 1980. [Google Scholar]
Figure 1.
Water sampling cartridge and its components. (a) The green component is the servo, the yellow components are hooks, transparent components are cartridges, and purple components are the frame and caps, (b) the gray components are pinon gear and gear rack, (c) fabricated sampler.
Figure 1.
Water sampling cartridge and its components. (a) The green component is the servo, the yellow components are hooks, transparent components are cartridges, and purple components are the frame and caps, (b) the gray components are pinon gear and gear rack, (c) fabricated sampler.

Figure 2.
Sensor node; (a) microcontroller platform mounted on top of the unmanned aerial vehicle (UAV), (b) probes dangled from the UAV, and (c) probes located above the water sampling cartridges (WSC).
Figure 2.
Sensor node; (a) microcontroller platform mounted on top of the unmanned aerial vehicle (UAV), (b) probes dangled from the UAV, and (c) probes located above the water sampling cartridges (WSC).

Figure 3.
System configuration with flight controller, microcontroller, sensor node, and water sampling cartridge (WSC).
Figure 3.
System configuration with flight controller, microcontroller, sensor node, and water sampling cartridge (WSC).

Figure 4.
(a) The multirotor UAV that was built as a carrier platform for the (b) sensor node and the water sampling cartridge (WSC) with a closed cell floatation section for depth adjustment.
Figure 4.
(a) The multirotor UAV that was built as a carrier platform for the (b) sensor node and the water sampling cartridge (WSC) with a closed cell floatation section for depth adjustment.

Figure 5.
Water sampling locations and autonomous flight trajectory at LaMaster Pond.

Figure 6.
Thrust-to-weight ratio and endurance of the UAV with 8000 mAh and 10,000 mAh batteries.

Figure 7.
Thrust and endurance measurements of the UAV with 8000 mAh battery at 50%, 60%, and 70% throttle settings.
Figure 7.
Thrust and endurance measurements of the UAV with 8000 mAh battery at 50%, 60%, and 70% throttle settings.

Figure 8.
UAV-assisted in situ measurements of noncontaminant water quality indicators at 0.5 m and 3 m depths in six sampling locations; (a) dissolved oxygen, (b) temperature, (c) electrical conductivity, and (d) pH.
Figure 8.
UAV-assisted in situ measurements of noncontaminant water quality indicators at 0.5 m and 3 m depths in six sampling locations; (a) dissolved oxygen, (b) temperature, (c) electrical conductivity, and (d) pH.


Table 1.
Weight distribution of UAV and payload.
| Component | Weight (kg) |
|---|---|
| Sensor Node | 0.75 |
| Extension Cord | 0.25 |
| Water Sampling Cartridge | 0.4 |
| Water Samples | 0.4 |
| Floatation Attachment | 0.3 |
| UAV | 4.3 |
| Takeoff Weight | 6.4 |
Table 2.
Descriptive statistics for water quality parameters obtained by UASS at 0.5 m and 3 m.
| Quality Parameters | Depth at 0.5 m | Depth at 3 m | Difference (%) | t Value (DF) | p Value | ||||
|---|---|---|---|---|---|---|---|---|---|
| N | Mean | SD | N | Mean | SD | ||||
| DO (mg/L) | 36 | 8.17 | 0.21 | 36 | 5.33 | 0.50 | 21 | −7.46 (2) | 0.0175 *** |
| pH | 36 | 5.57 | 0.03 | 36 | 5.38 | 0.07 | 1.7 | −3.56 (2) | 0.0705 |
| EC (µS/cm) | 36 | 42.01 | 4.66 | 36 | 77.87 | 0.33 | 29.9 | 14.33 (2) | 0.0048 *** |
| Temp. (°C) | 36 | 31.18 | 0.14 | 36 | 23.80 | 1.1 | 13.4 | −13.30 (2) | 0.0056 *** |
Notes: N: number, SD: standard deviation, DF: degrees of freedom, significance level *** = p < 0.001
© 2019 by the authors. Licensee MDPI, Basel, Switzerland. This article is an open access article distributed under the terms and conditions of the Creative Commons Attribution (CC BY) license (http://creativecommons.org/licenses/by/4.0/).
Share and Cite
MDPI and ACS Style
Koparan, C.; Koc, A.B.; Privette, C.V.; Sawyer, C.B. Autonomous In Situ Measurements of Noncontaminant Water Quality Indicators and Sample Collection with a UAV. Water 2019, 11, 604. https://doi.org/10.3390/w11030604
AMA Style
Koparan C, Koc AB, Privette CV, Sawyer CB. Autonomous In Situ Measurements of Noncontaminant Water Quality Indicators and Sample Collection with a UAV. Water. 2019; 11(3):604. https://doi.org/10.3390/w11030604
Chicago/Turabian StyleKoparan, Cengiz, Ali Bulent Koc, Charles V. Privette, and Calvin B. Sawyer. 2019. "Autonomous In Situ Measurements of Noncontaminant Water Quality Indicators and Sample Collection with a UAV" Water 11, no. 3: 604. https://doi.org/10.3390/w11030604
Note that from the first issue of 2016, this journal uses article numbers instead of page numbers. See further details here.