1. Introduction
In developing countries, heavy metal contamination of farmland is occurring, which is a severe environmental problem due to the toxicity of heavy metals [
1]. In recent decades, the concentrations of heavy metals and metalloids in irrigation water, soil, and vegetables have been greatly increasing on farmland due to anthropogenic activities including the expansion of industrialization and urbanization [
2]. Irrigation water contaminated with industrial wastewater has caused significant heavy metal contamination in soils and crops. If soil is irrigated with wastewater, heavy metal concentration will be high in the edible parts of growing plants [
3].
In Bangladesh, food safety is a major health concern. In the country, most foodstuffs are thought to be contaminated with heavy metals and not safe for human ingestion [
4]. Due to unplanned industrialization and urbanization in the country, wastewater contaminated with heavy metals is continuously released into irrigation canals, thus soil and crops are contaminated with heavy metals, and many people consume the contaminated crops after they have been transported and sold in retail markets [
5], and thus face the risk of health problems.
Crops grown in contaminated soil accumulate considerable amounts of heavy metals, causing adverse health effects when the crops are consumed. Heavy metals can be found in the tissues of crops including vegetables and fruits. Although certain heavy metals are essential plant nutrients, plants grown in contaminated soil accumulate high levels of heavy metals, causing a high prevalence of upper gastrointestinal cancer [
6]. Heavy metals are highly toxic because of their nonbiodegradable nature and their potential accumulation in the human body [
7]. Vegetables grown in contaminated soil absorb heavy metals and store them in their tissues, causing adverse clinical problems, including physiological disorders, in people who eat the vegetables, because the body has no mechanism to eliminate the heavy metals [
3]. Previous studies have shown that helencha (
Enhydra fluctuans) highly contaminated with Cd causes a higher risk of cancer [
4]. Helencha is often planted in Bangladesh.
In the Gazipur District of Bangladesh, multiple industries (textile, dyeing, garment, pharmaceutical, ceramic, paint, packaging, etc.) discharge untreated wastewater into nearby canals, which causes heavy metal contamination in the irrigation water. Ahmed et al. [
8] and Zakir et al. [
9] reported that the surface water and soil of the industrial area in Dhaka and Gazipur District are highly contaminated with Zn, Cr, Cu, Pb, and Cd due to wastewater discharge from industries. Farmers use the contaminated water to irrigate vegetables, causing heavy metal contamination in vegetables in the district. In the industrial area of the Dhaka Export Processing Zone (DEPZ), vegetables are contaminated with high levels of Cr, Zn, Cu, Fe, Pb, Ni, and Cd [
7]. Most of these vegetables are sold to the wholesale market in Dhaka, the capital, and are consumed by many people. In the multiple-industry zone of the district, three areas were selected to represent the situation of industrial locations.
Among the species of heavy metals, Cr, Cu, Zn, As, Cd, and Pb were targeted, considering the kinds of industries located in the area whose wastewater contains one or more of these, together with their high toxicity and persistence in polluted wastewater usually sourced from industries. According to Barakat [
10], As, Cd, Pb, Ni, Cu, Cr, and Zn are the most common heavy metals found in industrial processes, waste, and wastewater, all of which pose risks to human health and the environment. In the analysis, irrigation water, soil, and vegetables were targeted.
The authors previously analyzed heavy metal concentrations in the same areas in the wet season [
11], and high contamination was observed in irrigation water, soil, and vegetables. Therefore, in the present study, the dry season was targeted for analysis. This study intended to clarify the following questions: (1) How high are the concentrations of heavy metals (Cr, Cu, Zn, As, Cd, and Pb) in irrigation water, soil, and vegetables in the dry season in respective areas? (2) How does the concentration of heavy metals differ between the dry and wet seasons and between areas (effect of multiple industries) in irrigation water, soil, and vegetables? (3) How does the irrigation water and/or soil affect vegetables in terms of heavy metal contamination in the two seasons?
2. Materials and Methods
2.1. Study Area
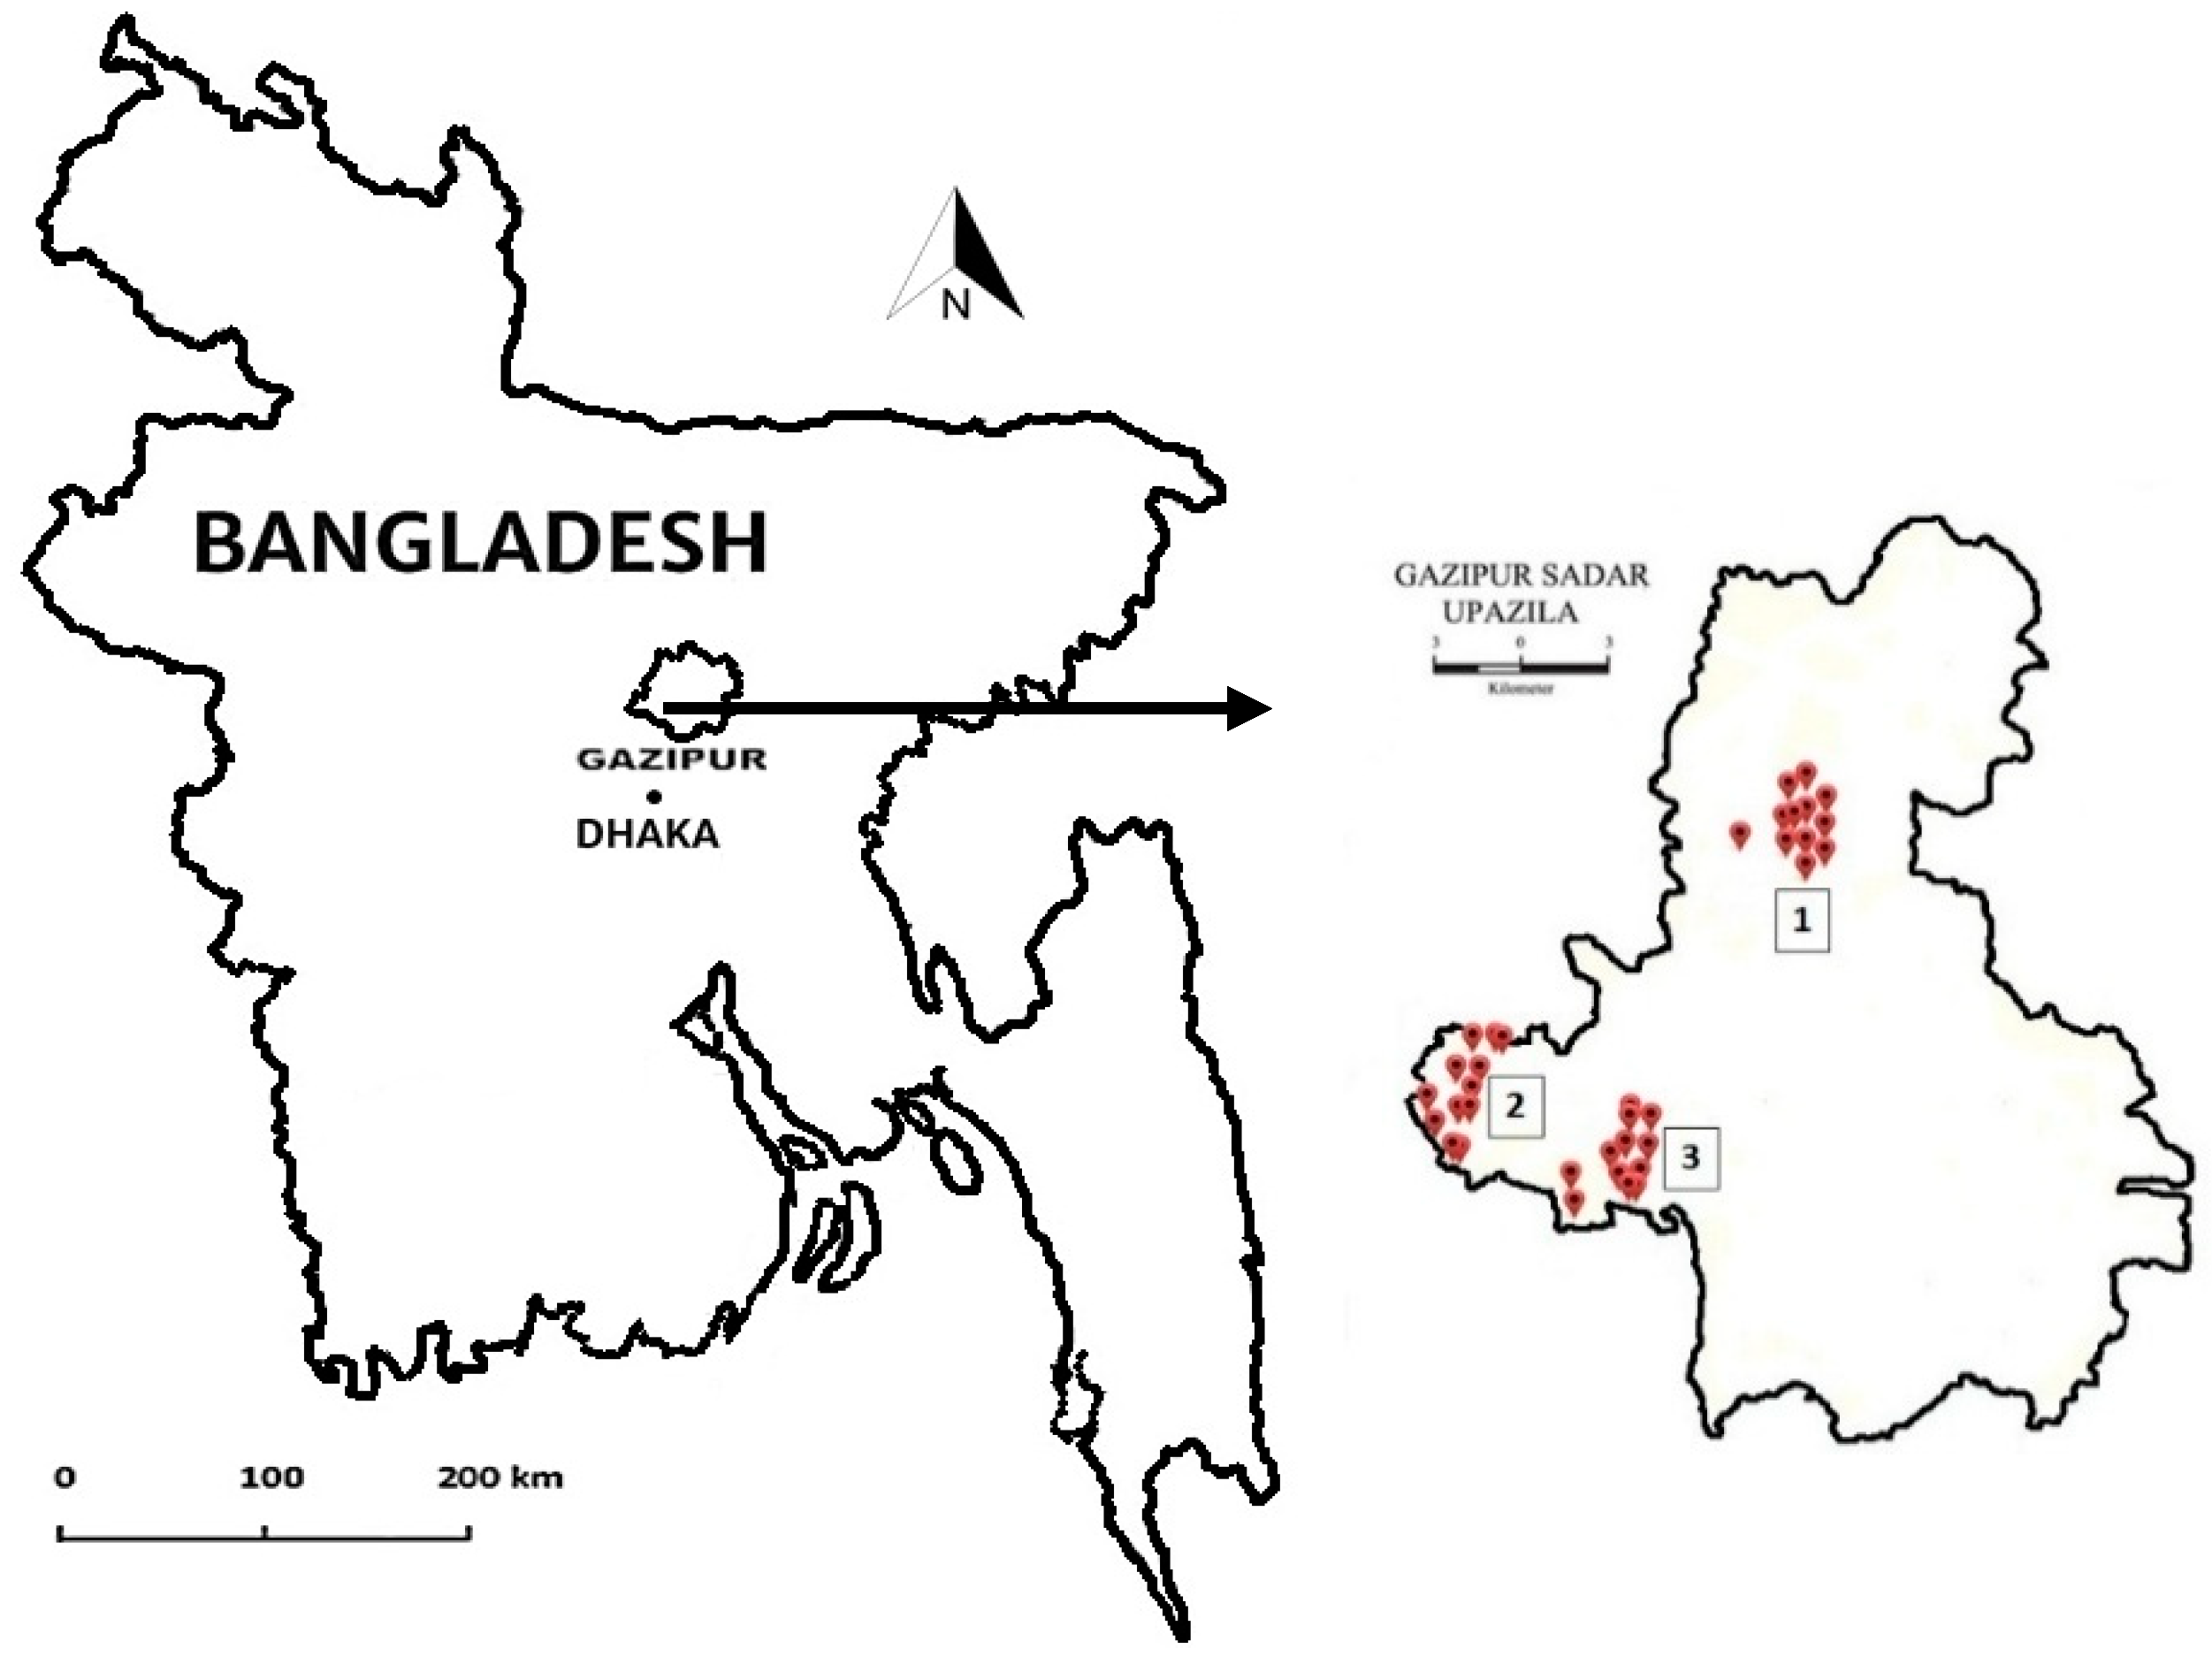
Gazipur District is a suburban industrial area located 50 km north of the capital, Dhaka. The area covers 1806 km
2, with a population of 3,403,912 [
12]. A multi-industrial zone has recently been developed in the district. Rice and vegetables are planted on farmland adjacent to the zone. Recently, vegetable planting appears to be on the rise, particularly in the dry season.
The district has a flat lowland topography with an elevation of 4–24 m [
13]. The annual average rainfall is 2036 mm [
14], the wet season is from April to October, and the dry season from November to March. The annual average air temperature is 25.8 °C, with the lowest in January (18.8 °C) and the highest in August (28.8 °C) on average [
14]. The district is situated in the Madhupur Tract agro-ecological region, with dominant soils of deep to shallow red-brown terrace soils (entisols in US soil taxonomy), which have the characteristics of poor nutrients and acid basin clays [
15].
The target areas in the district are Banglabazar, Kashimpur, and Chandra, where various small-scale factories exist. The main industries are different in each area: textiles, dyes, batteries, metallurgy, and ceramics in Banglabazar; plastics, garments, and agrochemicals in Kashimpur; and pharmaceuticals, agrochemicals, fabric printing, poultry feed, and fish feed in Chandra. In all areas, industrial wastewater is discharged from factories into nearby irrigation canals throughout the year.
2.2. Sampling of Irrigation Water, Soil, and Vegetables
Irrigation water, soil, and vegetables were sampled from the 3 targeted areas (
Figure 1) in November and December 2017 during the dry season. During the wet season, the sampling was done in June and July 2015. In the study area, yearly expansion of the industrial area was not observed from 2015 to 2017, because the numbers of factories and wastewater discharging points were the same in that time. Samples of 500 mL of water were collected from irrigation canals at 12 points selected randomly to represent the situation of contamination in each area. The samples were filtered through a paper filter and then a drop of HNO
3 (65%) was added to make their pH < 2 for preservation. The samples were stored in acid-washed 20 mL plastic bottles and stored in a refrigerator at 4 °C until analysis. At each point, 5 soil samples were collected from topsoil (0–15 cm depth) to produce a single composite sample. Then, soil samples (12 samples in each area) were air dried, ground, and sieved with 2 mm mesh sieve. The sampling depth of 0–15 cm was chosen based on the most active zone of maximum root concentration and the most sensitive zone of erosion and atmospheric deposition [
16,
17].
Vegetables were sampled at each point where soil sampling was done. In the dry season, radish (Raphanus raphanistrum subsp. sativus), amaranth (Amaranthus lividus), red amaranth (Amaranthus gangeticus), spinach (Spinacia oleracea), Indian spinach (Basella alba), taro (Colocasia esculenta), bottle gourd (Lagenaria siceraria), yard long bean (Vigna sesquipedalis), and pumpkin (Cucurbita moschata), all winter vegetables, were sampled. In the wet season, taro (Colocasia esculenta), kangkong (Ipomoea reptans), helencha (Enhydra fluctuans), brinjal (Solanum melongena), and sponge gourd (Luffa acutangula), all summer vegetables, were sampled. Then the samples were cleaned with tap water followed by deionized water. The samples were then divided into root (taro and kangkong), stem (taro, kangkong, and amaranth), fruit (brinjal, sponge gourd, and yard long bean), and leaf (taro, kangkong, helencha, radish, amaranth, red amaranth, spinach, Indian spinach, bottle gourd, and pumpkin), and these parts were first air-dried and then oven-dried at 60 °C for 48 h and were milled uniformly with a grinder.
2.3. Sample Analysis
In sample preparation, soils were digested using a wet digestion method (US EPA 3050B method) [
18], and vegetables were digested at 120–130 °C for 14–16 h using concentrated HNO
3 and 30% H
2O
2 [
19]. After that, the digested solutions of soil and vegetables were filtered through a 4 µm paper filter (No. 5B; Advantec, Toyo Roshi Kaisha Ltd., Tokyo, Japan) and diluted to a fixed volume. Heavy metal (Cr, Cu, Zn, As, Cd, and Pb) concentrations of irrigation water and the digested solutions of soil and vegetables were determined by using inductively coupled plasma–mass spectrometry (ICP-MS; 7500 ce, Agilent Technologies, USA) at the Center of Advanced Instrumental Analysis, Kyushu University, Japan.
2.4. Data Analysis
Descriptive statistics and analysis of variance (ANOVA) for the heavy metal concentrations of irrigation water, soil, and vegetables were performed by Excel software (version 2016). The graphical presentation of data was made by Origin Pro 8 software. The t-test and hierarchical cluster analysis (HCA) were implemented by SPSS statistics software (version 21.0).
3. Results
3.1. Heavy Metal Concentrations of Irrigation Water and Seasonal Differences
The mean heavy metal concentrations (mg/L) of the irrigation water are given in
Table 1, together with the coefficient of variation (CV) of the concentration (shown in parentheses). In this table, the values of both dry and wet seasons (shown in our previous study) are listed. Both dry and wet season values are also shown later for soil and vegetables.
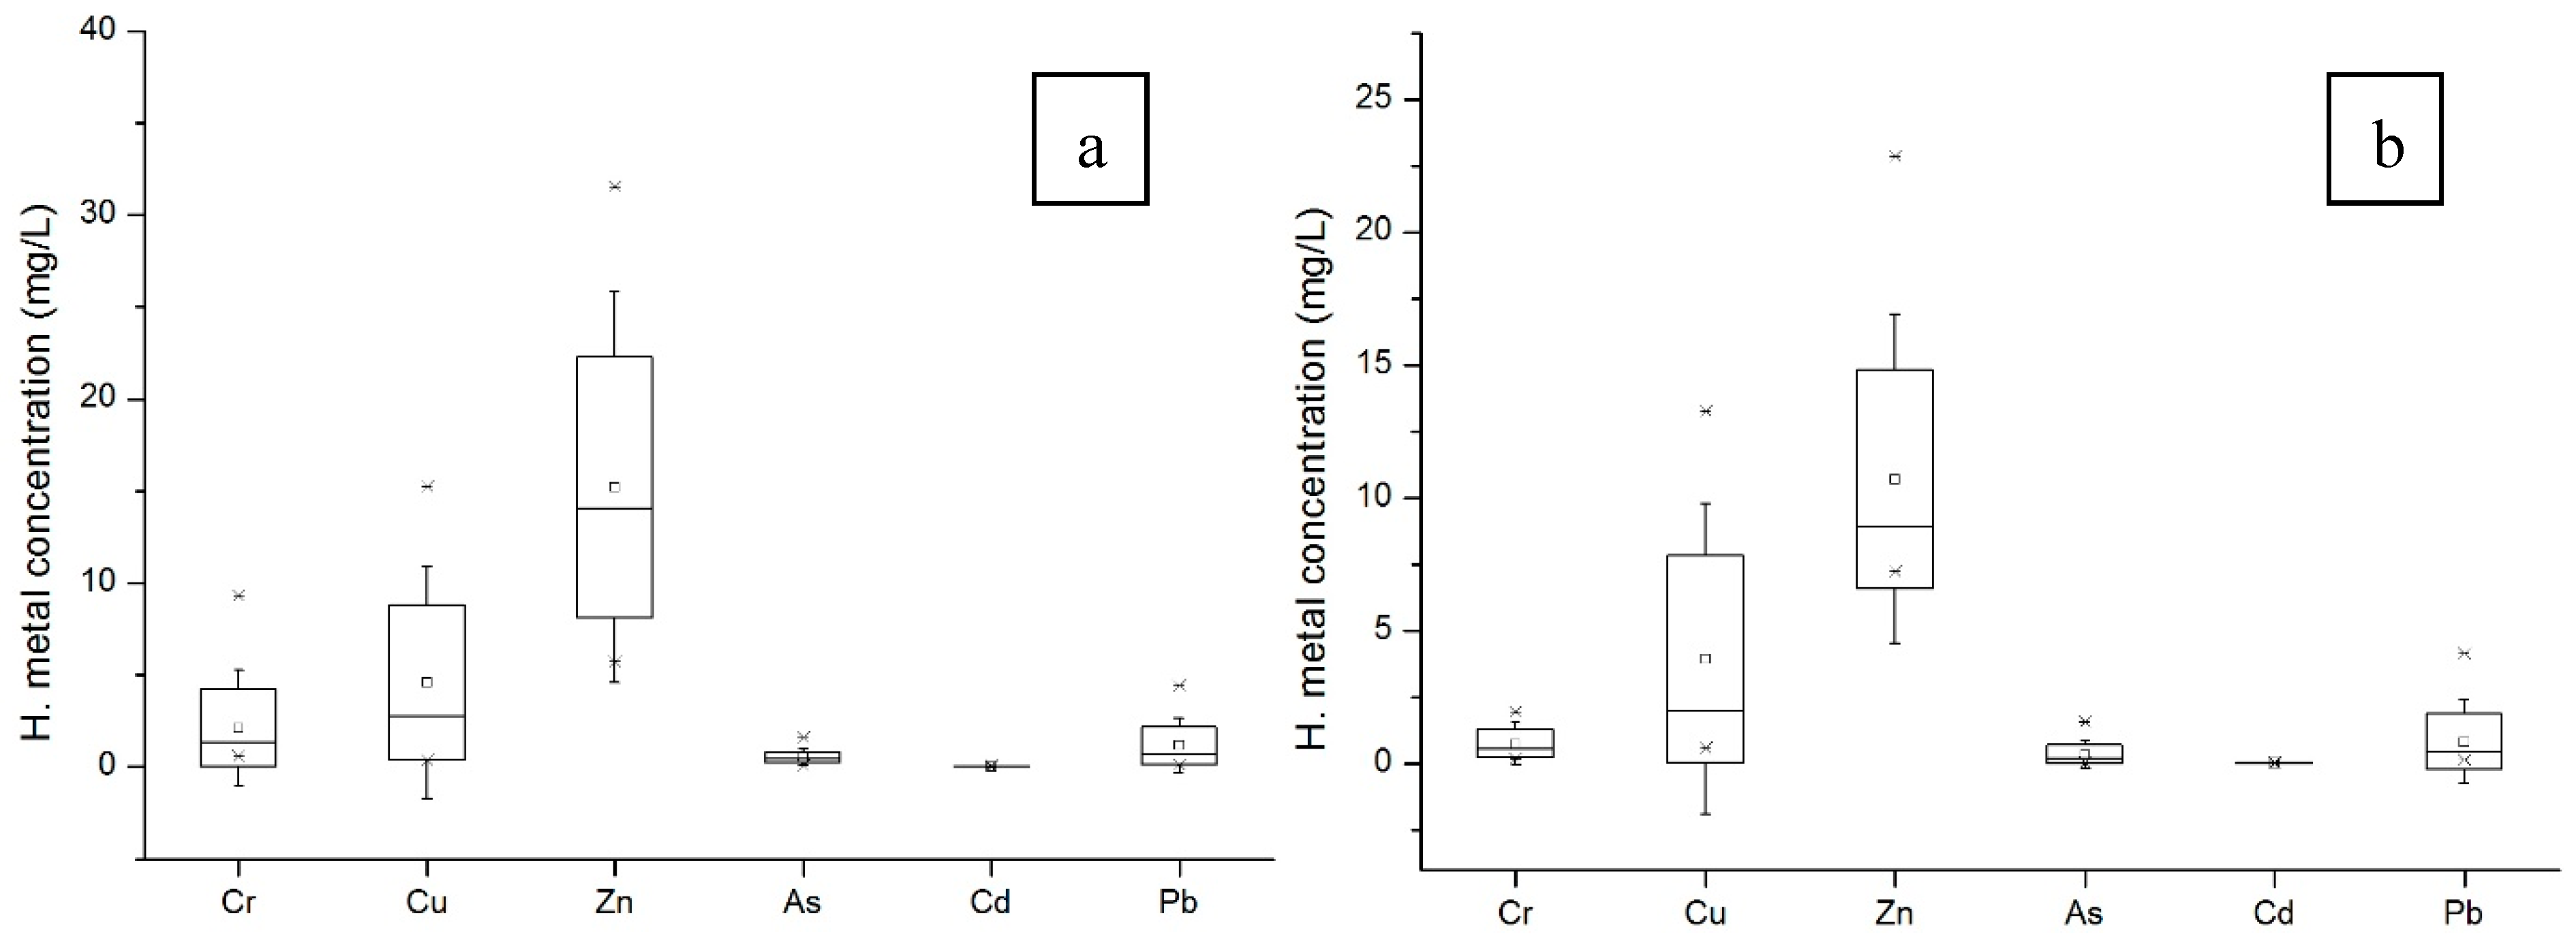
Here, Zn (8.6–17.5 mg/L) had the highest and Cd (0.007–0.023 mg/L) the lowest concentration. The order of concentration (according to mean values of all areas) was Zn > Cu > Cr > Pb > As > Cd in the dry season and Zn > Cu > Pb > Cr > As > Cd in the wet season. In both seasons, the heavy metal concentrations were significantly different according to one-way ANOVA (F = 97.6–110.1, df = 5, p < 0.05).
Regarding the difference between dry and wet seasons, the concentrations in the wet season were observed to be significantly lower than in the dry season according to paired t-test (t = 2.4–5.0, df = 35, p < 0.05).
From the results of
Figure 2a, the standard deviation of heavy metal concentration was the highest for Zn and Cu, followed by Cr and Pb in the dry season, whereas the highest standard deviation was observed for Zn and Cu, followed by Pb and Cr in the wet season (
Figure 2b).
The CV of heavy metal concentrations mostly ranged from 0.35 to 0.97 (mean 0.65) in the dry season, and from 0.12 to 1.19 (mean 0.60) in the wet season, which shows no significant difference according to paired
t-test. The heavy metal concentrations exceeded permissible Food and Agricultural Organization (FAO) levels in the respective areas, except Cd (which met permissible levels in wet season) and Pb (which met the levels in all cases) (
Table 1). Therefore, the water has been identified to be inappropriate to use for irrigation purposes.
3.2. Heavy Metal Concentrations of Soil and Seasonal Differences
The mean heavy metal concentration in the soil (mg/kg) and the coefficient of variation (shown in parentheses) and the seasonal differences are summarized in
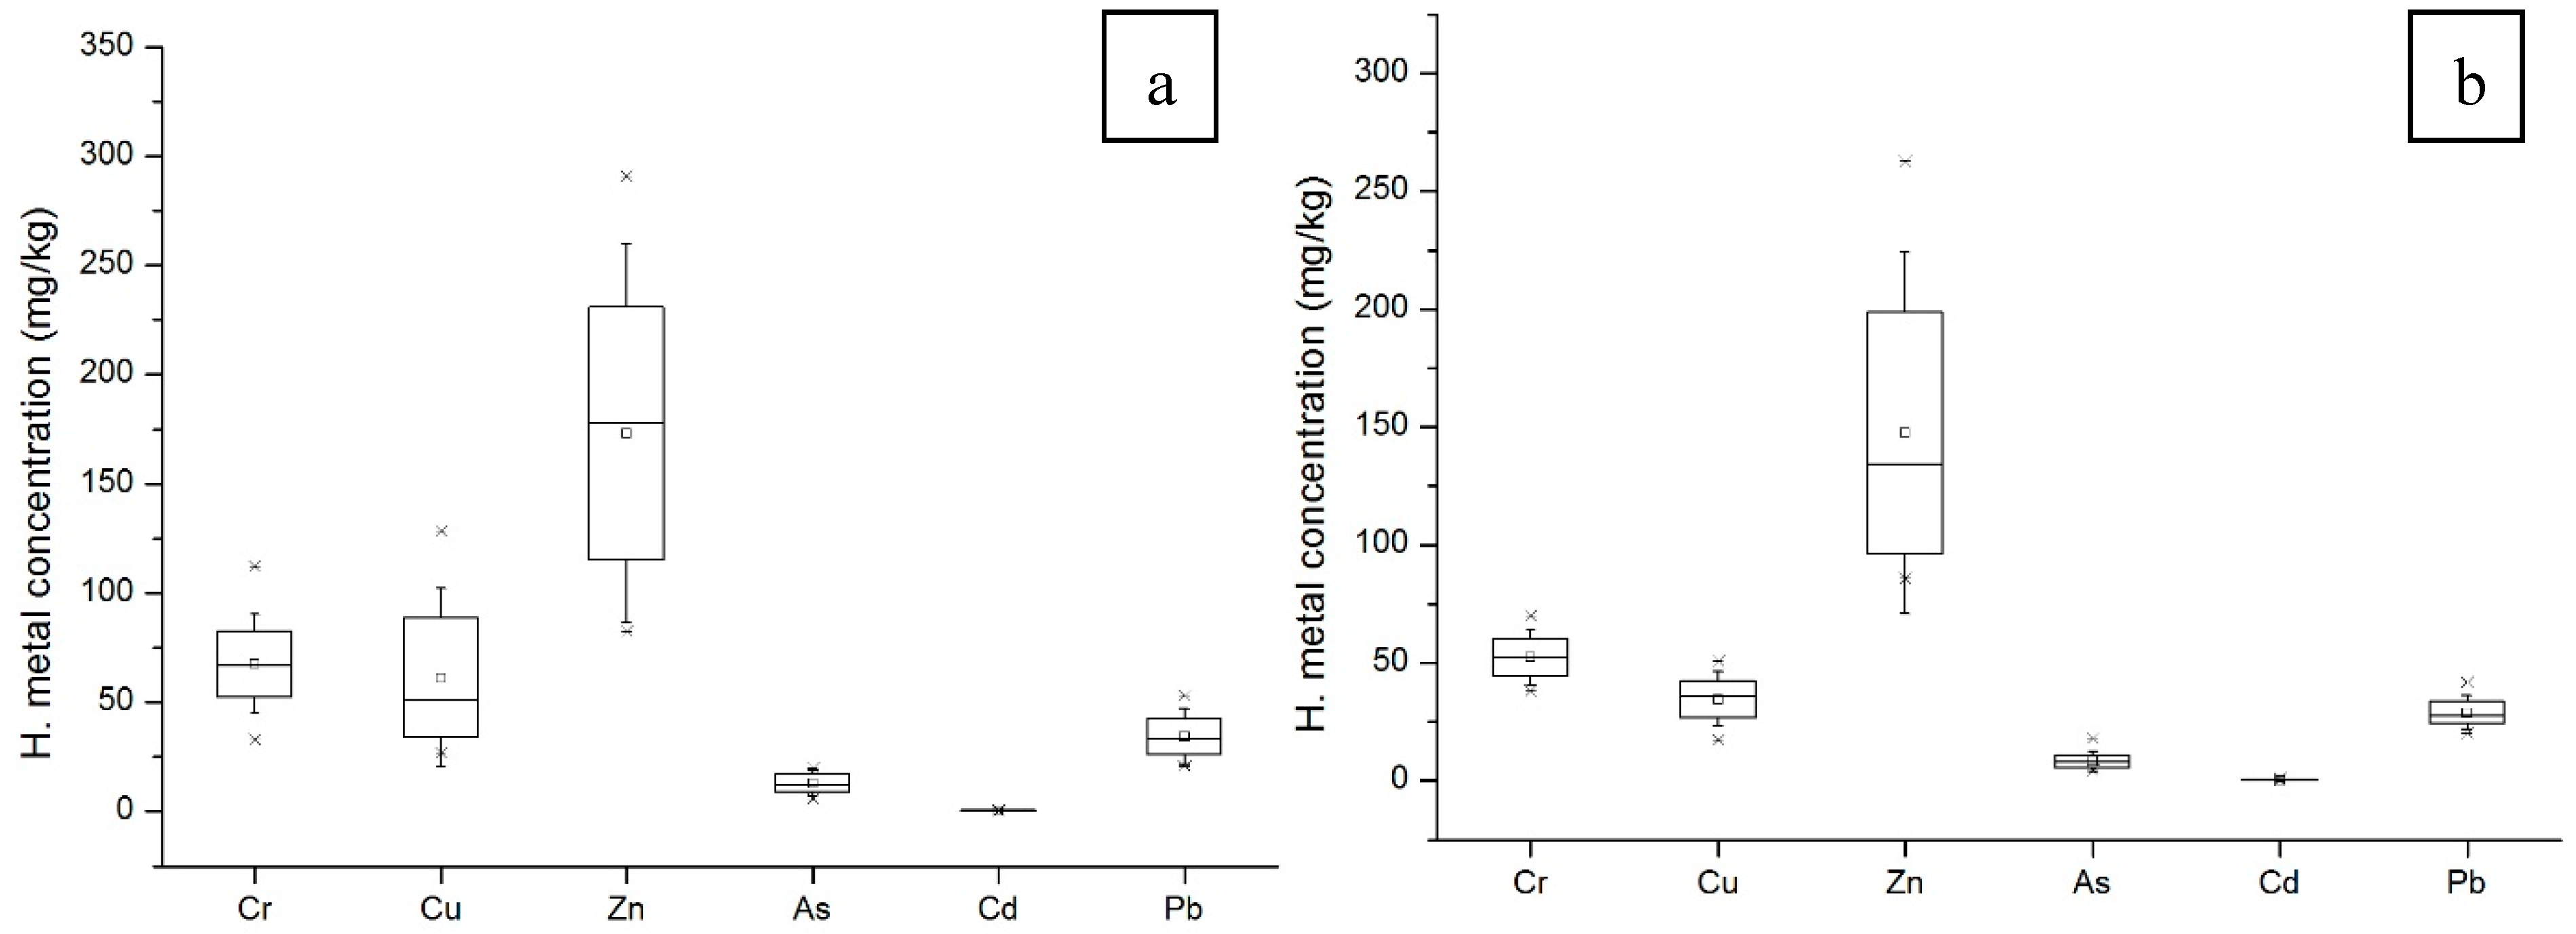
Table 2. Here, Zn (145.2–186.9) had the highest and Cd (0.17–0.34) the lowest concentration, which is the same as the irrigation water. The order of concentration (according to mean values of all areas) was Zn > Cr > Cu > Pb > As > Cd in both dry and wet seasons. The heavy metal concentrations were significantly different in the respective seasons based on one-way ANOVA (F = 189.5–222.6, df = 5,
p < 0.05).
When the order of concentration in soil is compared with that in irrigation water, heavy metals Pb, Cr, and Cu were different between the seasons, which may be because the absorption ability of heavy metals in soil is somewhat different among species and affected the concentration. For the difference between seasons, the concentrations in the wet season were found to be significantly lower than in the dry season in the respective areas according to paired t-test (t = 3.2–6.3, df = 35, p < 0.05). In both seasons, the extent of pollution (in terms of concentration) between the three industrial areas (Banglabazar, Kashimpur, and Chandra) was found to be insignificant (according to two-way ANOVA), which may be because the heavy metal concentration in irrigation water was rather equalized between the areas in the process of absorption from irrigation water to soil.
According to the results of
Figure 3a, Zn showed the highest standard deviation of heavy metal concentration in the dry season, followed by Cu and Cr. In the wet season, the highest standard deviation was also observed for Zn, followed by Cr and Cu (
Figure 3b).
The CV of heavy metal concentration ranged from 0.16 to 0.62 (mean 0.32) in the dry season and from 0.08 to 1.44 (mean 0.33) in the wet season for all areas. The CV in the wet season was not significantly different from the CV in the dry season (paired
t-test). The heavy metal concentrations were below permissible EU levels [
21] in both seasons, except As concentration. Therefore, the soil has been considered to be appropriate for planting purposes.
3.3. Heavy Metal Concentrations of Vegetables and Seasonal Differences
The mean heavy metal concentrations of vegetables in the wet and dry seasons are shown in
Table 3, with CV values shown in parentheses. In
Table 3, Zn (44.8–66.8 mg/kg) had the highest concentration and Cd (0.097–0.392 mg/kg) had the lowest concentration. The order of concentrations was Zn > Cr > Cu > Pb > As > Cd in the dry season and Zn > Cu > Pb > Cr > As > Cd in the wet season based on the mean values for all areas. According to one-way ANOVA, the difference in heavy metal concentrations was significant in both seasons (F = 90.6–202.2, df = 5,
p < 0.05).
The heavy metal concentrations in vegetables were significantly lower in the wet season than in the dry season (by paired t-test; t = 0.18–5.15, df = 26, p < 0.05). Banglabazar, Kashimpur, and Chandra showed no significant differences in heavy metal concentration in vegetables in both seasons (two-way ANOVA), which may be due to the insignificant variation of heavy metal concentration in the soil between these industrial areas.
The CV of heavy metal concentrations in vegetables ranged from 0.35 to 1.30 (mean 0.71) in the dry season, and from 0.10 to 1.58 (mean 0.72) in the wet season, showing no significant difference between seasons (paired t-test).
The concentration of heavy metals in vegetables (in each area) exceeded the permissible FAO levels [
4,
22,
23] of Cr, Zn, As, and Pb in both seasons and Cd in the dry season. Therefore, vegetables grown in these areas have been identified as unsuitable for human consumption.
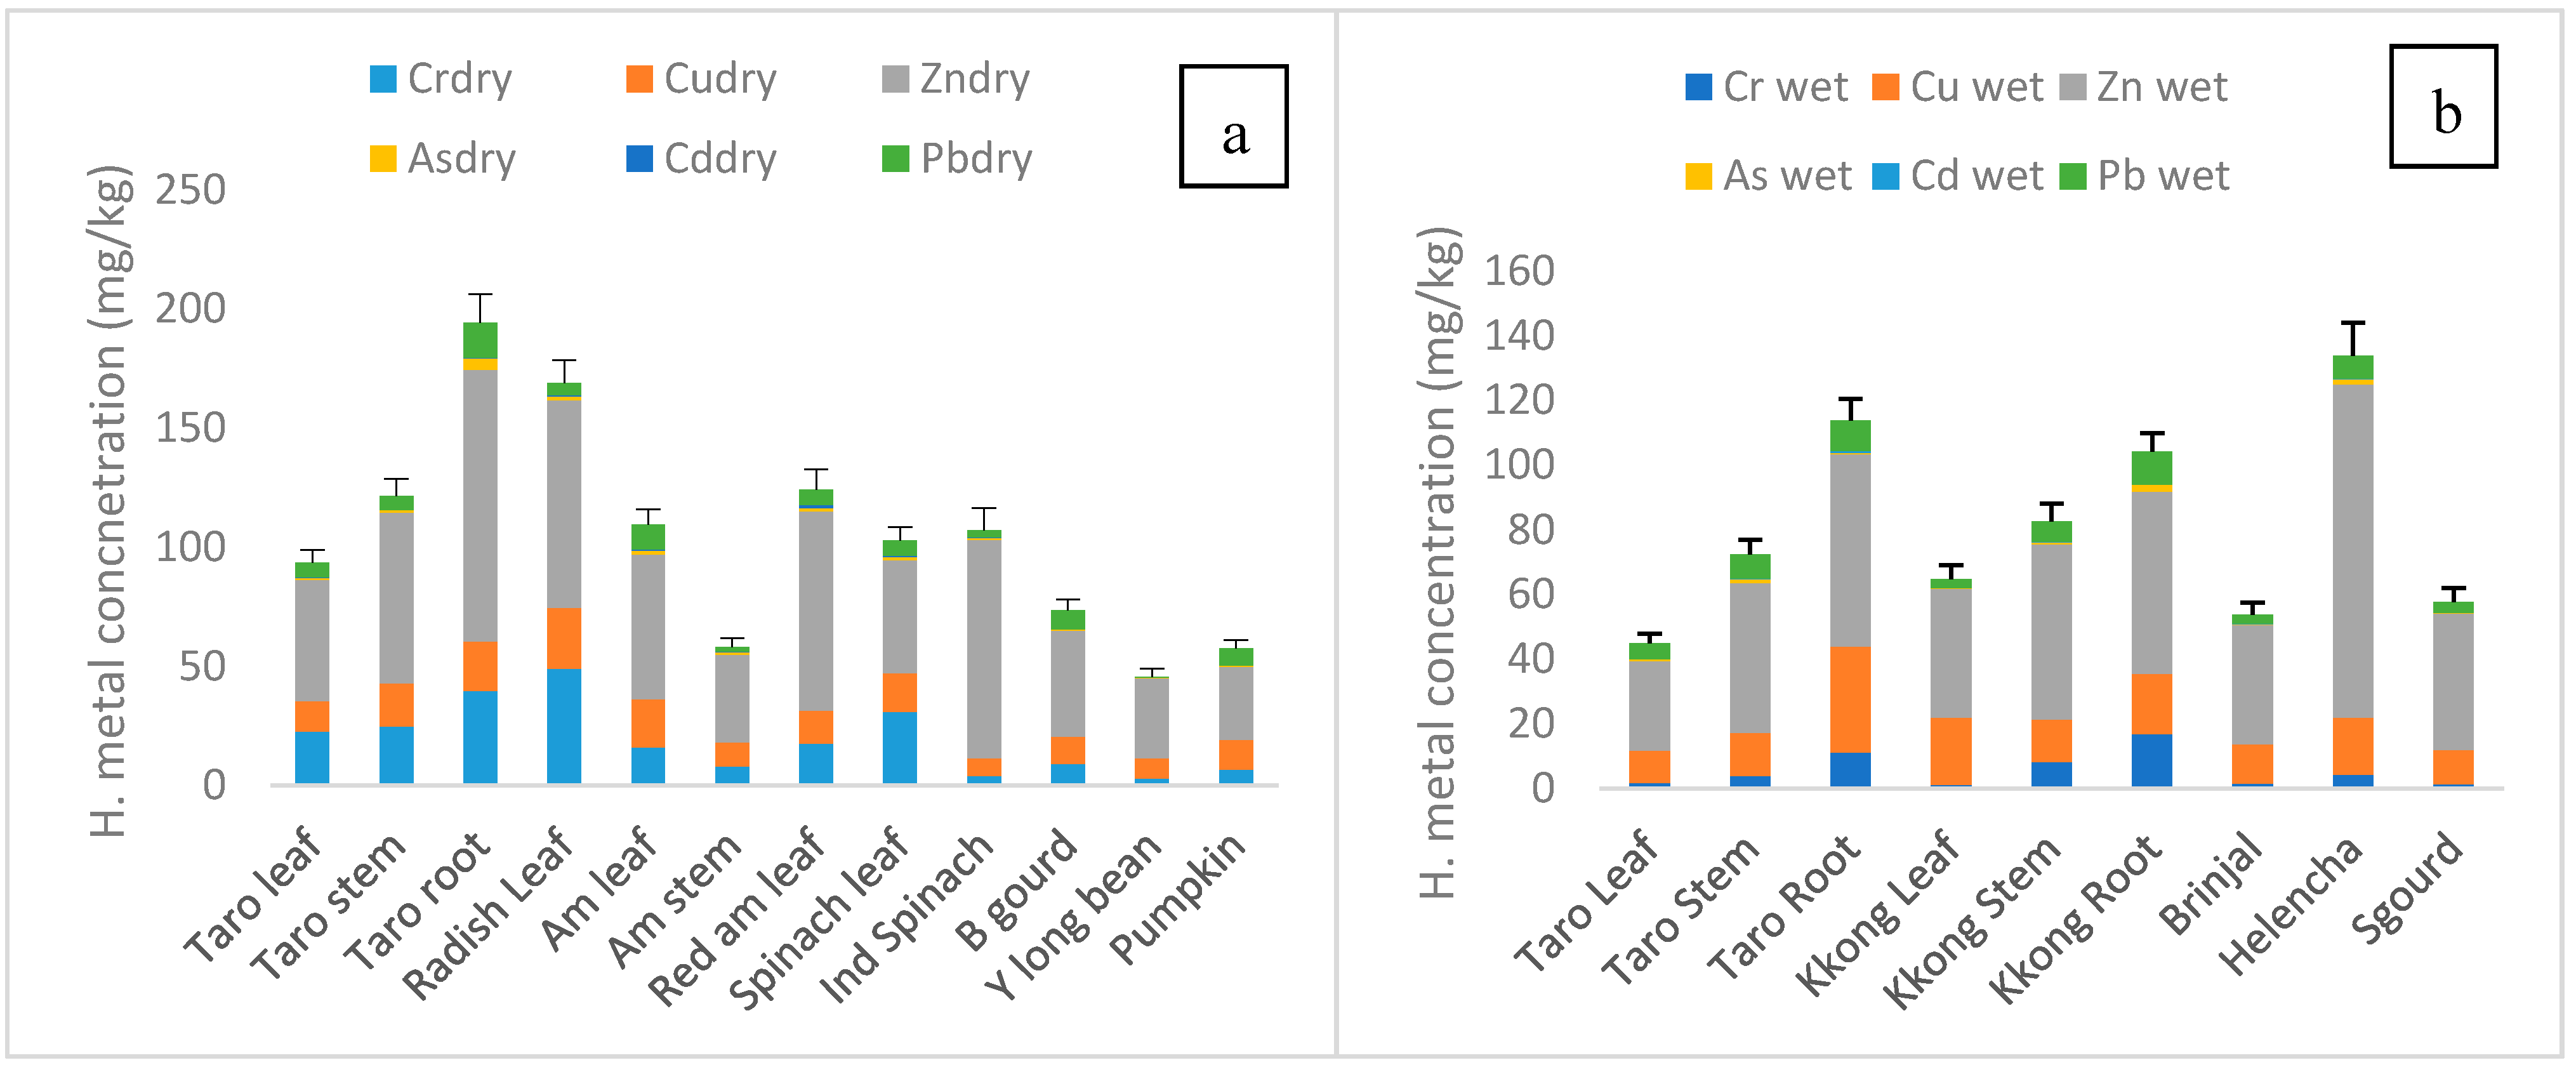
Heavy metal concentrations in vegetables varied widely according to the kind of vegetable, as shown in
Figure 4. According to
Figure 4a, taro root had the highest heavy metal concentration, with high standard error (SE) values, followed by radish leaf, red amaranth leaf, taro stem, and then Indian spinach, whereas yard long bean and pumpkin had the lowest concentration in the dry season. Mean Zn concentration was high in taro root (113.89 mg/kg). Taro root also had high Cr (39.84 mg/kg), Cu (20.81 mg/kg), Pb (14.72 mg/kg), As (4.61 mg/kg), and Cd (0.31 mg/kg) concentrations. However, Cr (48.98 mg/kg) and Cu (25.77 mg/kg) concentrations were the highest in radish leaf among the leafy vegetables. For the wet season (
Figure 4b), helencha had the highest heavy metal concentration, with high SE values, followed by taro root and kangkong root. Lower concentrations were observed in taro leaf, brinjal, and sponge gourd. Out of the six heavy metals, Zn was the highest in helencha (102.97 mg/kg), followed by Cu in taro root (32.83 mg/kg), and Cr in kangkong root (16.87 mg/kg). Cd was the highest in taro root (0.51 mg/kg). Fruit vegetables (brinjal and sponge gourd) contained a smaller amount of heavy metals, indicating lower toxicity.
3.4. Effect of Irrigation Water and Soil on Heavy Metal Concentration in Vegetables
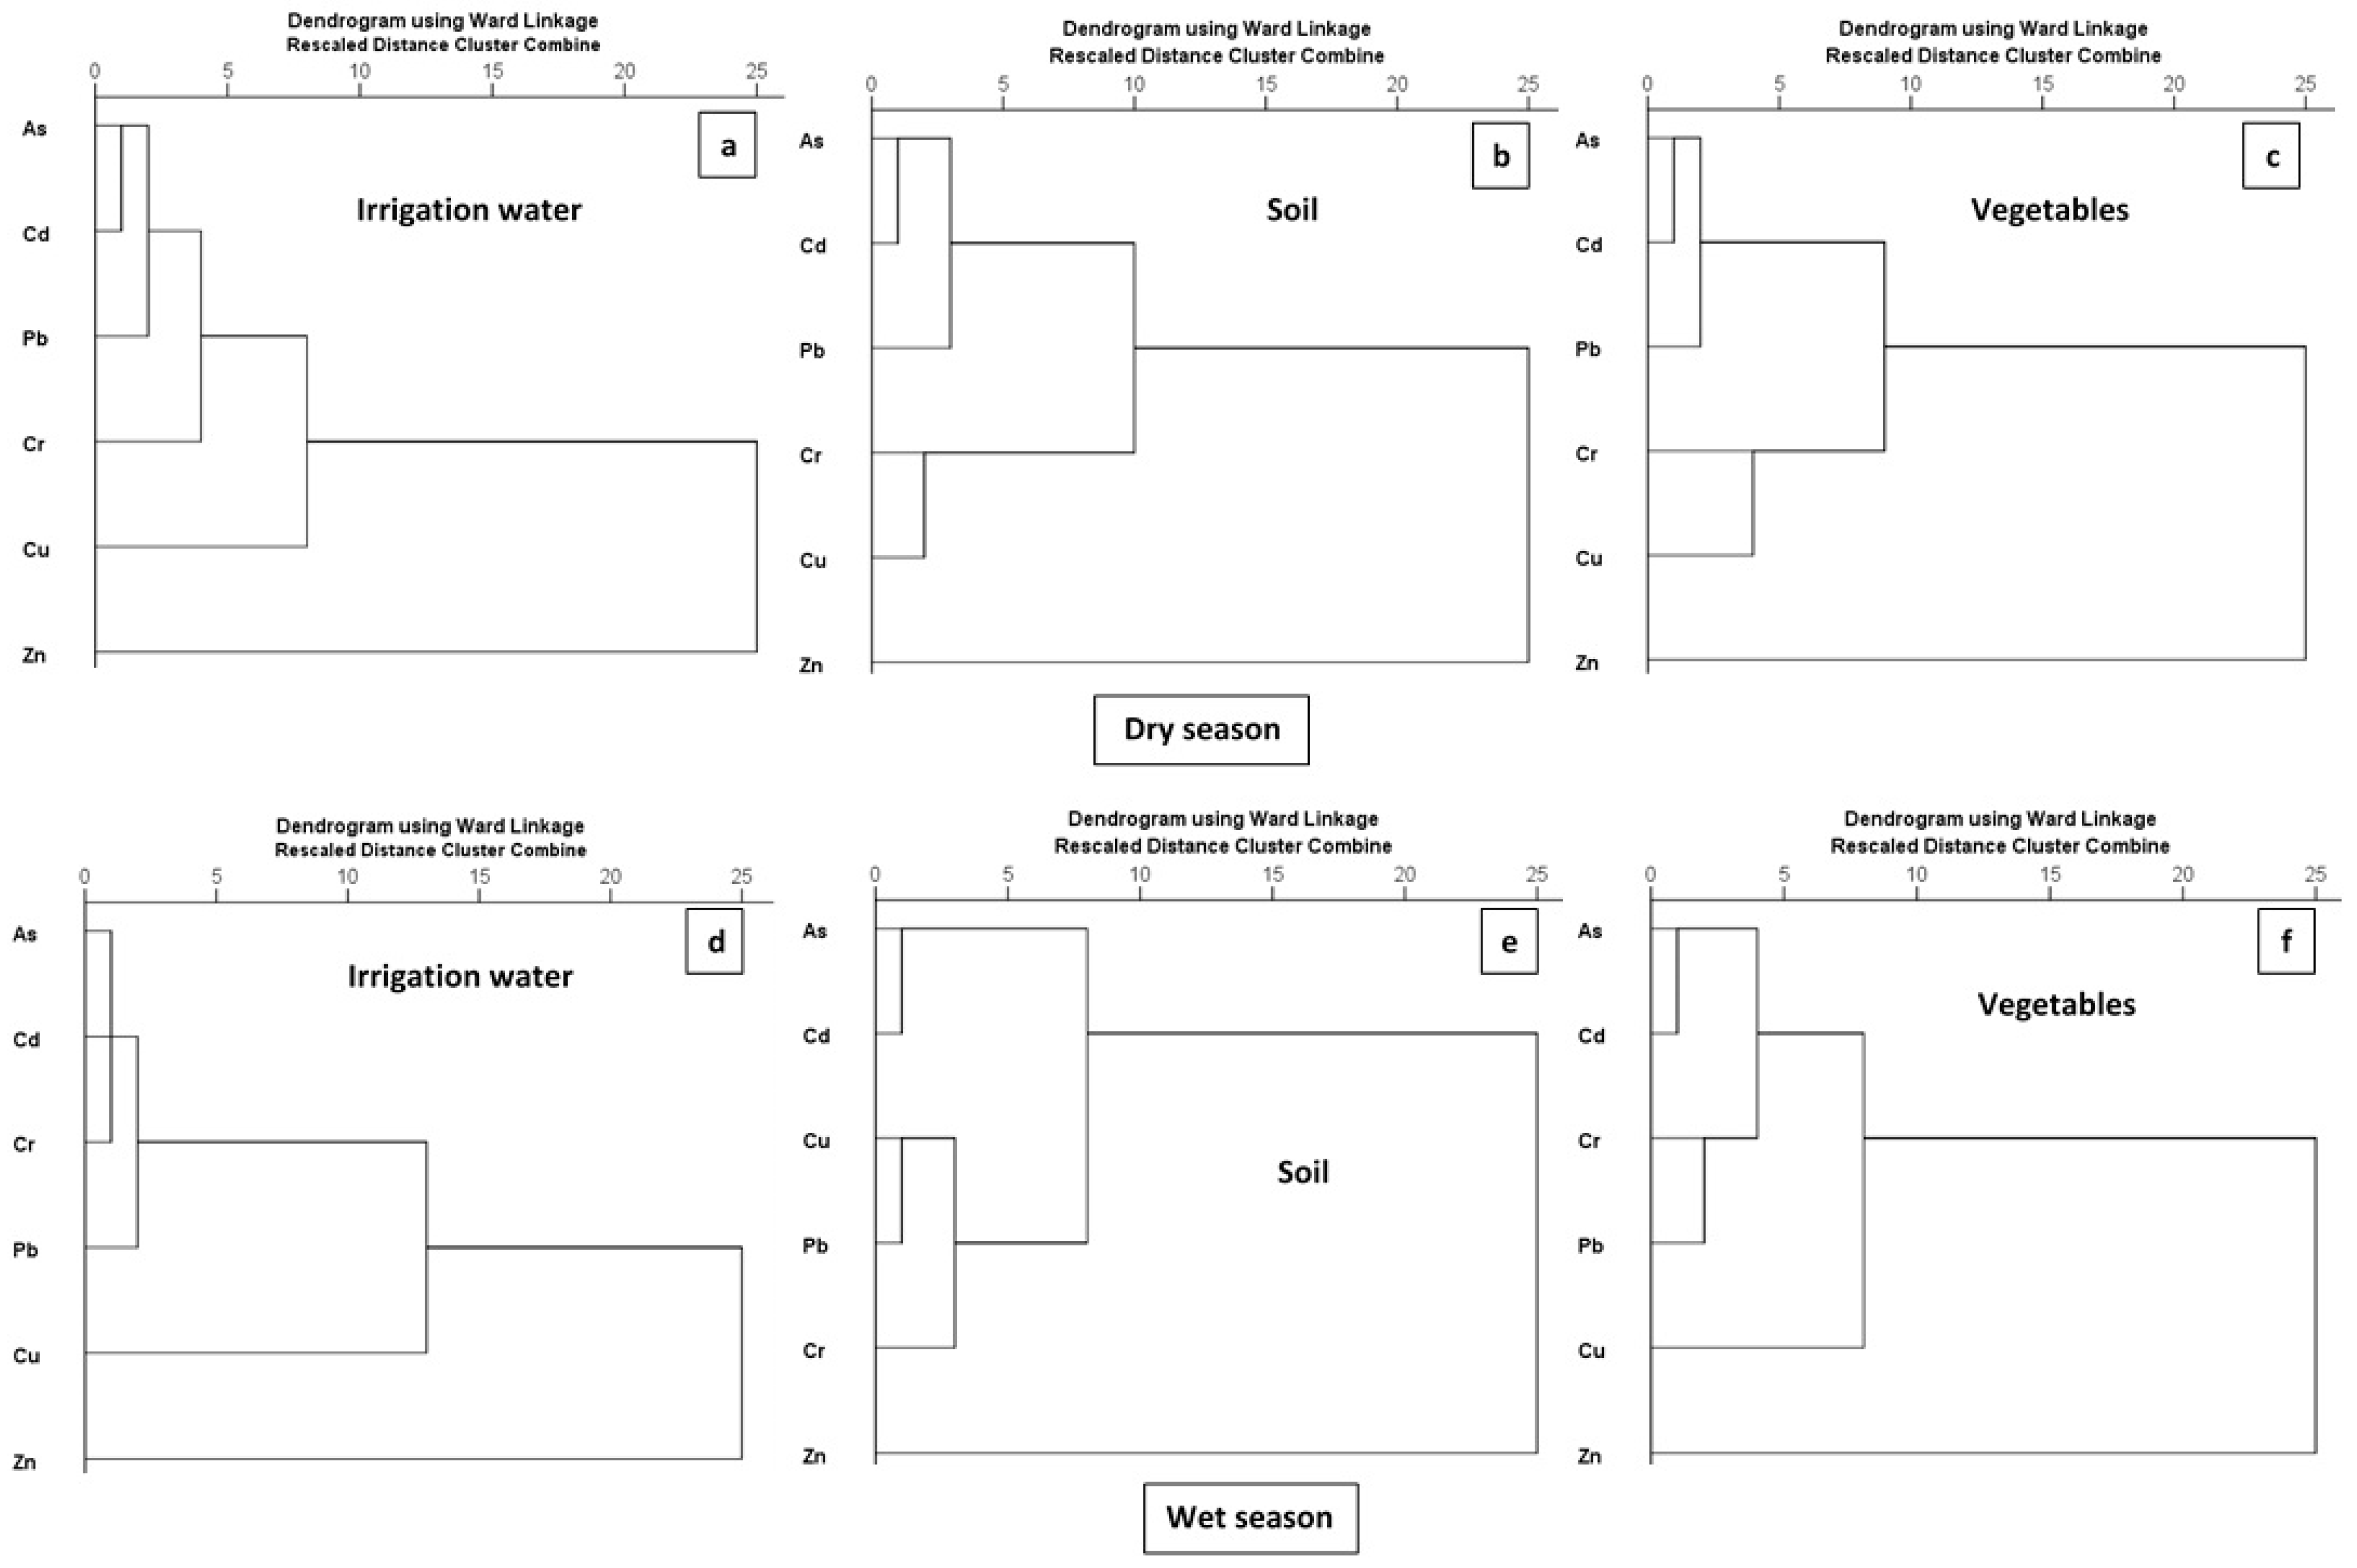
Hierarchical cluster analysis (HCA) was applied to clarify the effect of irrigation water and soil on heavy metal concentrations in vegetables in the respective seasons, and the results (dendrograms) are shown in
Figure 5.
For irrigation water in the dry season (
Figure 5a), As and Cd formed a cluster with the shortest cluster distance (<5) along with Pb, showing a close relationship between them. Cr and Cu linked with the cluster of As, Cd, and Pb with small cluster distance (<10), indicating their moderate relatedness. In the wet season (
Figure 5d), As, Cd, and Cr formed a cluster along with Pb and Cu, showing a similarity with clusters of the dry season. Zn concentration had a weak relationship with the other heavy metals because it showed a large cluster distance (25) from the other concentrations in both seasons.
For the soil, As and Cd formed a cluster with the shortest cluster distance (<5), showing a close relationship between them in both dry and wet seasons (
Figure 5b,e). A cluster was formed between Cr and Cu with small cluster distance (<5), and another cluster was formed between Pb, Cd, and As in the dry season (cluster distance < 5) (
Figure 5b). In the wet season, Cu and Pb formed a cluster with Cr (
Figure 5e). In both seasons, Zn, which had a long cluster distance (25), was isolated from the other heavy metals, showing a weak relationship with them.
For the vegetables, As and Cd showed a close relationship and formed a cluster (cluster distance < 5) in both dry and wet seasons (
Figure 5c,f). Another cluster was formed between Cr and Cu in the dry season and between Cr and Pb in the wet season, with a cluster distance < 5. In the dry season, the cluster between As and Cd was associated with Pb, forming another small cluster (distance < 5), which formed a large cluster consisting of Cr–Cu (distance < 10) (
Figure 5c). In the wet season, the dendrogram is quite different from that of the dry season, i.e., the cluster of As–Cd was connected with a cluster of Cr–Pb and formed a large cluster in association with Cu (distance < 10) (
Figure 5f). The distance (25) of Zn from the cluster of other heavy metals in the dendrogram was long, indicating its weak relationship with them in both seasons.
3.5. Transfer of Heavy Metals from Soil to Vegetables
In the dry season, the effect of soil on the heavy metal contamination of vegetables is thought to be strong. Despite the heavy metal concentration of soil being under the permissible level, the concentration in vegetables exceeded the permissible level. For this reason, the bioconcentration factor (BCF) of heavy metals may be a contributing factor. BCF shows the transferability of heavy metals from soil to vegetables, and is calculated as the ratio of heavy metal concentration in vegetables to that in soil (based on dry weight) [
24]. BCF (shown in
Table 4) may be important in the dry season, because soil appears to be responsible for heavy metal accumulation in vegetables. The average BCF values for heavy metals and vegetables are also shown in
Table 4.
BCF was the highest in Cd (1.18), followed by Zn (0.37), and then Cu (0.29), while the lowest was As (0.09), according to the averages. Except for As and Pb, BCF was >0.20, indicating high heavy metal absorption from the soil. According to the FAO/World Health Organization (WHO) [
23], vegetables with BCF higher than 0.20 are thought to be highly contaminated by anthropogenic activities and have a high health risk. For the respective vegetables, radish, and red amaranth were the highest (both 0.61), followed by amaranth and spinach (both 0.47), according to their averages. These leafy vegetables showed very high absorption. Taro (root and leafy vegetable) also showed high absorption (0.44). These characteristics might have contributed to the high heavy metal concentration that exceeded the permissible level.
4. Discussion
In the study area, irrigation water, soil, and vegetables in both seasons were highly contaminated with Zn, Cr, Cu, and Pb, and the lowest concentrations were found for Cd, followed by As (
Table 1,
Table 2 and
Table 3). The heavy metal concentrations and the order of magnitude depend on the factories located in each area. The largest Zn concentration is due to garment-related factories (textile and dye) located in every area, which discharge wastewater containing a lot of Zn. However, the large concentrations of Pb and As in Banglabazar are from battery and metallurgy factories located in the area that discharge wastewater containing a lot of Pb. The Banglabazar, Kashimpur, and Chandra areas are heavily polluted with wastewater [
11] and the extent of pollution varies significantly according to two-way ANOVA in both seasons (F = 4.06–8.74, df = 2,
p < 0.05). Industrial wastes are directly discharged into nearby open water bodies, and these waters are continuously used for irrigation. The Kashimpur area is highly contaminated with Cr and Cd, which are used to add color and pigment to garments, plastics, and agrochemicals. The Chandra area receives wastewater from fabric printing, agrochemical, pharmaceutical, poultry feed, and fish feed factories, which creates high Zn and Cu concentrations in the area.
Lower concentrations of heavy metals were found in the wet season for irrigation water, soil, and vegetables than in the dry season. In the wet season, heavy rainfall dilutes the irrigation water, which lowers the heavy metal concentrations. Similarly, the same characteristic observed in cultivated soil indicates the strong effect of diluted irrigation water on the low concentration of heavy metals in soil during the wet season. However, the order of heavy metal concentration in soil was different from that of irrigation water. Therefore, some factors might be responsible for the contamination. Dudal et al. [
25] stated that the mobility of heavy metals along with soluble organic matter might be affected by heavy rainfall events. On the other hand, chemical and physical properties of soil influence the bioavailability and movement of heavy metals, which depend not only on the heavy metal concentration but also on environmental factors, adsorption–desorption characteristics of soils, precipitation reactions, and toxic metal properties [
26,
27]. Furthermore, significantly lower concentrations of heavy metals in vegetables during the wet season (according to paired
t-test) showed the effect of rainfall diluting and lowering the heavy metal concentration in irrigation water on the concentration of heavy metals in vegetables.
The sources of heavy metals in vegetables in the two seasons were identified by comparing the dendrograms of vegetables, irrigation water, and soil. In the dry season, the dendrogram of vegetables very much resembles that of soil, which formed two clusters (As–Cd–Pb and Cr–Cu) with the shortest cluster distance (<5), whereas Zn showed the longest cluster distance (nearly 25) (
Figure 5b,c). This similarity between soil and vegetables suggests that heavy metals in vegetables were absorbed from the soil in the dry season. In the wet season, the dendrogram of vegetables very much resembles that of irrigation water, because the cluster of As–Cd in vegetables was similar to the cluster of As–Cd–Cr in irrigation water, with the shortest cluster distance (<5) (
Figure 5d,f). At a later stage, As, Cd, Cr, and Pb in vegetables were linked together and showed a similarity to irrigation water (cluster distance <5), whereas moderate and weak relatedness were found in Cu and Zn in vegetables and irrigation water. Therefore, the heavy metals of vegetables in the wet season are thought to be sourced from irrigation water.
In the wet season, the upper soil layers contribute significant soil moisture (more than 60% of plant water requirement), whereas contributed moisture is less than 50% in the dry season [
28]. So, the vegetables in the wet season are thought to absorb more moisture content than vegetables in the dry season, which may indicate that heavy metals in wet season vegetables accumulate with the application of irrigation water. The lack of moisture in the dry season triggers vegetables to take up heavy metals from the soil. The possible dilution effect of rainfall in the wet season indicates the low heavy metal concentration in irrigation water, soil, and vegetables as compared to the dry season.
5. Conclusions
In irrigation water and vegetables, heavy metal concentrations exceeded their permissible levels, while in soil, nearly all concentrations were below permissible levels. The significant effect of different factories on the concentrations was observed in each area in irrigation water, but not in soil and vegetables. The order of heavy metal concentrations and hierarchical cluster analysis results revealed that heavy metals in vegetables were sourced from the soil in the dry season and from irrigation water in the wet season. In the wet season, heavy metal concentrations in irrigation water, soil, and vegetables were lower than in the dry season. For this reason, the following were considered: rainfall occurs in the wet season, which dilutes the irrigation water, making the heavy metal concentrations lower; the lower amount of heavy metals is absorbed in soil particles due to the diluted irrigation water; and the diluted irrigation water contributes to the lower heavy metal concentrations in vegetables in the wet season.
The heavy metal concentrations in vegetables exceeded permissible levels, despite the heavy metal concentrations in the soil being under permissible levels, for which a high bioconcentration factor of vegetables was responsible.


