The Oxygen Transfer Capacity of Submerged Plant Elodea densa in Wastewater Constructed Wetlands


1
Faculty of Life Sciences and Technology, Wroclaw University of Environmental and Life Sciences, 37a Chełmońskiego Str., 51-630 Wrocław, Poland
2
Best-Eko Sp. z o.o., 1 Gwarków Str., 44-240 Żory, Poland
3
Department of Environmental Engineering, Hydro and Environmental Engineering, Faculty of Building Services, Warsaw University of Technology, 00-661 Warszawa, Poland
*
Author to whom correspondence should be addressed.
Water 2019, 11(3), 575; https://doi.org/10.3390/w11030575
Submission received: 23 January 2019
/
Revised: 15 March 2019
/
Accepted: 18 March 2019
/
Published: 20 March 2019
(This article belongs to the Section Wastewater Treatment and Reuse)
Abstract
:There are insufficient data for the development of process design criteria for constructed wetlands systems based on submerged plants as a major treatment agent. The aim of the study was to evaluate the oxygen transfer capacity (OTC) of E. densa, in relation to wet plants’ mass (w.m.), and the influence of E. densa on the oxygen concentration and contaminants’ removal efficiency from municipal wastewater. The obtained oxygen concentration and temperature data allowed to calculate the OTC values (mg O2·L−1·h−1), which had been related to wet plants’ mass unit (mg O2·L−1·h−1·g w.m.−1). The efficiency of wastewater treatment was determined in relation to initial wastewater content in the mixture of wastewater and tap water (0%, 25%, 50%, and 100%) during 3 days of the experiment duration. The simulation of day and night conditions was done by artificial lighting. Before and after finishing the second experiment, the COD, Ntotal, and P-PO4 concentration were analyzed in wastewater solutions. The OTC ranged from 3.19 to 8.34 (mgO2·L−1·h−1·g w.m.−1), and the increase of OTC value was related to the increase of wet plant’s mass. The research showed that E. densa affected positively on the wastewater treatment efficiency, and the highest efficiency was achieved in 25% wastewater solution: 43.6% for COD, 52.9% for Ntotal, 14.9% for P-PO4.
1. Introduction
Aquatic plants due to their properties are a key element of the constructed wetlands (CW). Proper design of these systems is largely dependent on plants choice. This aspect should be the subject of continuous research, especially since only a few species are widely used [1]. Plants in CW are used to remove nitrogen, phosphorus, other nutrients, heavy metals, and antibiotics [2]. According to various authors, their contribution in removing nitrogen and phosphorus varies from 14.29% to even 80.0% and in the range of 10.76–80.0%, respectively [3,4,5]. While floating plants accumulate pollutants through roots, those that are submerged accumulate them throughout the body [6]. The efficiency of removing contaminants depends on the species, plant growth rate as well as the physical and chemical properties of the environment [7]. The vegetation of water areas shows adaptations to environmental features, such as access to sunlight, pH, redox potential, hydraulic retention time, the presence of dissolved oxygen, organic carbon, salinity, and water depth [8,9].
Submerged plants in constructed wetlands have the potential to secondary treatment of wastewater, and the main area of their application is the last step in multistage systems [10]. Their activity leads to the reduction of the content of soluble carbon in water [11] and the stimulation of growth of nitrifying bacteria [12]. In the period of high photosynthetic activity, they increase the amount of dissolved oxygen. The use of submerged plants in constructed wetlands is limited to the experimental scale. The most promising species were Elodea canadensis M., Elodea nuttallii J., Egeria densa P., Hydrilla verticillata L., and Ceratophyllum demersum L. [13,14,15]. The plants Potamogeton and Myriophyllum were also tested [11,16,17], including Myriophyllum verticillatum L., Myriophyllum exalbescens F., and Potamogeton crispus L. [3]. Myriophyllum spicatum L. has been successfully used for the removal of Co, Cu, Ni, and Zn [18], while Potamogeton epihydrus R. and Myriophyllum exalbescens F. for the treatment of aluminum wastewater [19]. The research was also carried out on Cabomba piauhyensis, which was recognized as a plant showing high accumulation of As, Zn and Al [20], while Ceratophyllum demersum L. shows accumulates of Cu, Cr, Fe, Mn, and Pb [15]. Hydrilla verticillata L., Ceratophyllum demersum L., and Vallisneria natans were also used as submerged species in CWs [3]. E. densa was defined as a plant that effectively removes nitrogen from sewage [21].
E. densa is a submerged, freshwater perennial dioecious plant of the family Hydrocharitaceae. It originates from South America (especially from Brazil, Uruguay, and Argentina) [22]. Large stands are also found in the USA, Canada, New Zealand, Europe, and Japan [23]. It usually growths in lakes, ponds and slow-moving waters at a depth of 0.1 to 8 m, usually between 0.1 and 1.5 m [24], and less frequently in shallower and flowing water [25]. In addition, it effectively uses higher levels of light in clean water [26]. This species is adapted to the cold climate and can survive to freeze in the winter months and live periodically under the ice, storing the starch in the leaves and stems. These stocks are then used for growth when the temperature rises above 10 °C [27]. The optimal temperatures for E. densa range from 10 to 25 °C. It also has a wide tolerance for pH levels ranging from 6.5 to 10 [26]. Plant growth is not affected by the availability of CO2, as demonstrated by experimental studies [28]. It is also resistant to drying [29]. Given E. densa properties show that due to the wide range of potential habitats and conditions to grow it is considered to be used for CW design [3]. High biomass production, rapid vegetative reproduction, and effective fragmentation make E. densa the most common “water weed” [22,30]. This fact, combined with the E. densa tolerance for a wide range of water quality conditions [31], makes it an unrivaled plant for wastewater treatment in constructed wetlands. The potential of this species is also confirmed by the fact that it exhibits a high reproductive rate even in water reservoirs contaminated with trace elements [32].
One of the main obstacles that stand in the way of wider use of submerged plants in CWs is the uneconomical nature associated with the slow growth and prolonged period of obtaining biomass for the use of a by-product. However, their use could help to improve existing systems, which would increase their efficiency. A thorough understanding of the mechanisms of wastewater treatment through submerged plants is an opportunity to design even more effective systems. Their success depends on the ability of these plants to transport oxygen to the subsurface environment, and then on the use of excess oxygen during microbial respiration [33]. For this reason, research allowing for collecting detailed knowledge on the possibilities of using the natural predispositions of various species is justified. The final treatment process itself would not be then considered as the "black box", and the obtained characteristics of submerged plants would be able to be used to model processes occurring in wetlands to maximize the removal of pollutants.
On that base, we hypothesized that
- E. densa increases the oxygen saturation in an aqueous environment;
- the degree of oxygen recovery and pollutants removal efficiency depends on the initial wastewater pollution level.
The oxygen transfer capacity (OTC) depends on the mass of E. densa content in an aqueous environment. Therefore, the aim of the study was to evaluate the OTC of E. densa, in relation to wet plants’ mass (w.m.). Additionally, the influence of E. densa on the oxygen concentration and contaminants removal efficiency from municipal wastewater was tested.
2. Materials and Methods
2.1. General Comments
Research on the species E. densa was carried out in three stages.
Stage I was focused on observations of oxygen concentration development in the tank with water (control), and water with E. densa during four days of exposition on the simulated day/night light conditions. The purpose of this stage of the experiment was the proof of the concept that the E. densa has the ability to release oxygen and increase of oxygen saturation in water. The outcome of this stage has qualitative character—verification the hypothesis that E. densa increases the oxygen saturation in an aqueous environment.
Stage II determines the impact of the use of submerged aquatic plants on the transformation of biogenic compounds in the treated wastewater depending pollutants concentration, and on the degree of light intensity (day/night). Optimal technological parameters of wastewater treatment processes, such as their time and load of contaminants, were also determined. Natural atmospheric conditions were simulated in the study. The purpose of this stage of the experiment was the proof of the concept that the E. densa has the ability to release of oxygen and increase of oxygen saturation in wastewater, and that the oxygen content development depends on initial wastewater pollution degree. Additionally, the pollutants removal efficiency from wastewater, in systems with E.densa, in relation to initial wastewater pollution degree was demonstrated. The outcome of this stage has qualitative character—verification the hypothesis that the degree of oxygen recovery and pollutants removal efficiency depends on the initial wastewater pollution level.
In the third stage, the ability to introduce oxygen into the water was determined and the coefficients of this process were determined depending on the degree of plant mass density in the reactor. The rate of the process was also determined. The test system was placed in the experimental chamber, which made it possible to determine and set up constant conditions of light intensity, day and night length, temperature, and humidity. The research was carried out at various content of plant mass in the reactor. The purpose of this stage of the experiment was the determination of OTC of the E. densa in relation to mass content in the aqueous environment. The outcome of this stage has quantitative character—verification the hypothesis that that OTC depends on the mass of E. densa content in an aqueous environment.
2.2. Materials
For the study covering all of the stages, 20 plants E. densa were used. Plants were placed in 20 glass bottles with a volume of approx. 1000 cm3, each filled with 850 cm3 of tap water. The initial wet mass (g w.m.) and length (cm) of each used plant were measured (Table 1). For normalization of plants’ dimension, the ratio of wet mass and length (g w.m. cm−1) was calculated.
Wastewater used in the second stage the research was collected from the municipal sewage system in the amount of approx. 15 dm3. Before the experiment, the sewage was subjected to 24-h sedimentation to remove suspended solids. Out of wastewater prepared in this way, 4 dilutions of wastewater with tap water (100%, 50%, 25%, 0%) were prepared for each of them for two samples with E. densa plants placed in bottles and one with tap water (control sample). Each plant was assigned a number according to the numbering in the first stage of the experiment (Table 2).
2.3. Experimental Design
2.3.1. Stage 1—The Oxygen Concentration Development in Microcosm with E. densa
The wet plant’s mass (w.m.) of 108 (g w.m.) (Table 1) was placed in 25 L aquarium with a magnetic stirrer at the bottom. The oxygen meter OxyGuard Handy Mk II was used for oxygen concentration and temperature measurements. The duration of the experiment was 4 days. The simulation of the day (12 h) and night conditions (12 h) was done by artificial lighting. The light intensity was 100 (W·m−2). Before plants installing inside the aquarium, water was chemically deoxygenated by Na2SO3 in the presence of ‘Co2+’ ions as a catalyst. As a reference, the aquarium without plants was used. After plants installing inside the aquarium, the oxygen concentration measurements were started at 2-h intervals—during lighting periods.
2.3.2. Stage 2—The Efficiency of Wastewater Treatment by Submerged Plant E. densa
The efficiency of wastewater treatment by E. densa was determined in relation to initial wastewater content in a mixture of wastewater and tap water (0%, 25%, 50%, and 100%). The experiment was conducted in 1 L glass bottles filled with prepared mixtures of wastewater and tap water. The wet plant’s mass was used in each bottle (bottles marked by 1’–8’) with a mass of each plant specified in Table 1 and Table 2. As a reference, the bottles without plants were used (bottles marked by 9’–12’) (Table 2). The duration of the experiment was 3 days. The simulation of the day (12 h) and night conditions (12 h) was done by artificial lighting. The light intensity was 100 (W·m−2). Before starting and after finishing the experiment, the COD, Ntotal and P-PO4 concentration were analyzed in wastewater solutions, according to [34]. After plants installing inside the bottles, the oxygen concentration measurements were started at 2-h intervals. The oxygen meter OxyGuard Handy Mk II was used for oxygen concentration and temperature measurements. After plants installing inside the bottles, the oxygen concentration measurements were started at 2-h intervals-during lighting periods.
2.3.3. Stage 3—The E. densa OTC Determination
The wet plants mass (w.m.) ranged from 10 to 100 (g w.m.). Plants were placed in 25 L aquarium with a magnetic stirrer at the bottom. The oxygen meter OxyGuard Handy Mk II was used for oxygen concentration and temperature measurements. The light intensity was 100 (W·m−2). Before plants installing inside the aquarium, water was chemically deoxygenated by Na2SO3 in the presence of ‘Co2+’ ions as a catalyst. After plants installing inside the aquarium, the oxygen concentration and temperature measurements were started at 5-min intervals. The measurements were stopped after the oxygen concentration had reached 70%. Each experiment variant was replicated 5 times. The obtained oxygen concentration and temperature data let to calculate the OTC value, according to the procedure presented by [35].
2.4. Results Analysis
In stage 1 and 2 of the experiment on the base of oxygen concentration (C) (mg O2 dm−3) measurements and known working volume (V) (dm3) of the reactors the amount of oxygen (Aw) by weight (mg O2) in the reactor was calculated both in a variant with plants, and controls (water—stage 1, wastewater—stage 2):
The net amount of oxygen introduced by plants (dAw) was calculated by subtracting the amount of oxygen in the control reactors from the amount of oxygen in the reactors with plants.
The determined values of dAw were used for calculation of the cumulative net amount of oxygen released by plants during the experiments (Stages 1 and 2).
In stage 3 of the experiment, the OTC was calculated according to the following equation [35]:
where: 11.33—oxygen saturation (max) in water at 10 °C and normal pressure, ΔT—duration of observation (h), D0—Cs−C0 (g·m−3), Dt—Cs−Ct (g·m−3), C0-initial oxygen concentration (g·m−3), Cs—oxygen concentration (max) in water 10 °C (g·m−3), Ct—oxygen concentration after time t (g·m−3), k10/kt—coefficient for temperature compensation—for temperature 20 °C, value of coefficient was 0.83.
OTC shows the rate of oxygen supply to water with initial oxygen concentration, at temperature 10 °C, and under atmospheric pressure 1013 hPa.
The calculated OTC values (mg O2·L−1·h−1) and OTC values per wet plants mass unit (mg O2·L−1·h−1·g w.m.−1) were correlated with wet plants mass, at the significance level (p < 0.05). The linear and non-linear regression analyses were performed. The determination coefficient (R2) and calculated probability (p-value) were estimated to indicate the degree of function match to experimental data. The function parameters standard errors were also estimated. Statistical evaluation of the observed influence of wet plants masses on OTC and OTC values per wet plants mass unit was done with application of Statistica 13 software (TIBCO Software Inc., Palo Alto, CA, USA).
3. Results and Discussion
3.1. Stage 1—The Oxygen Concentration Development in Microcosm with E. densa
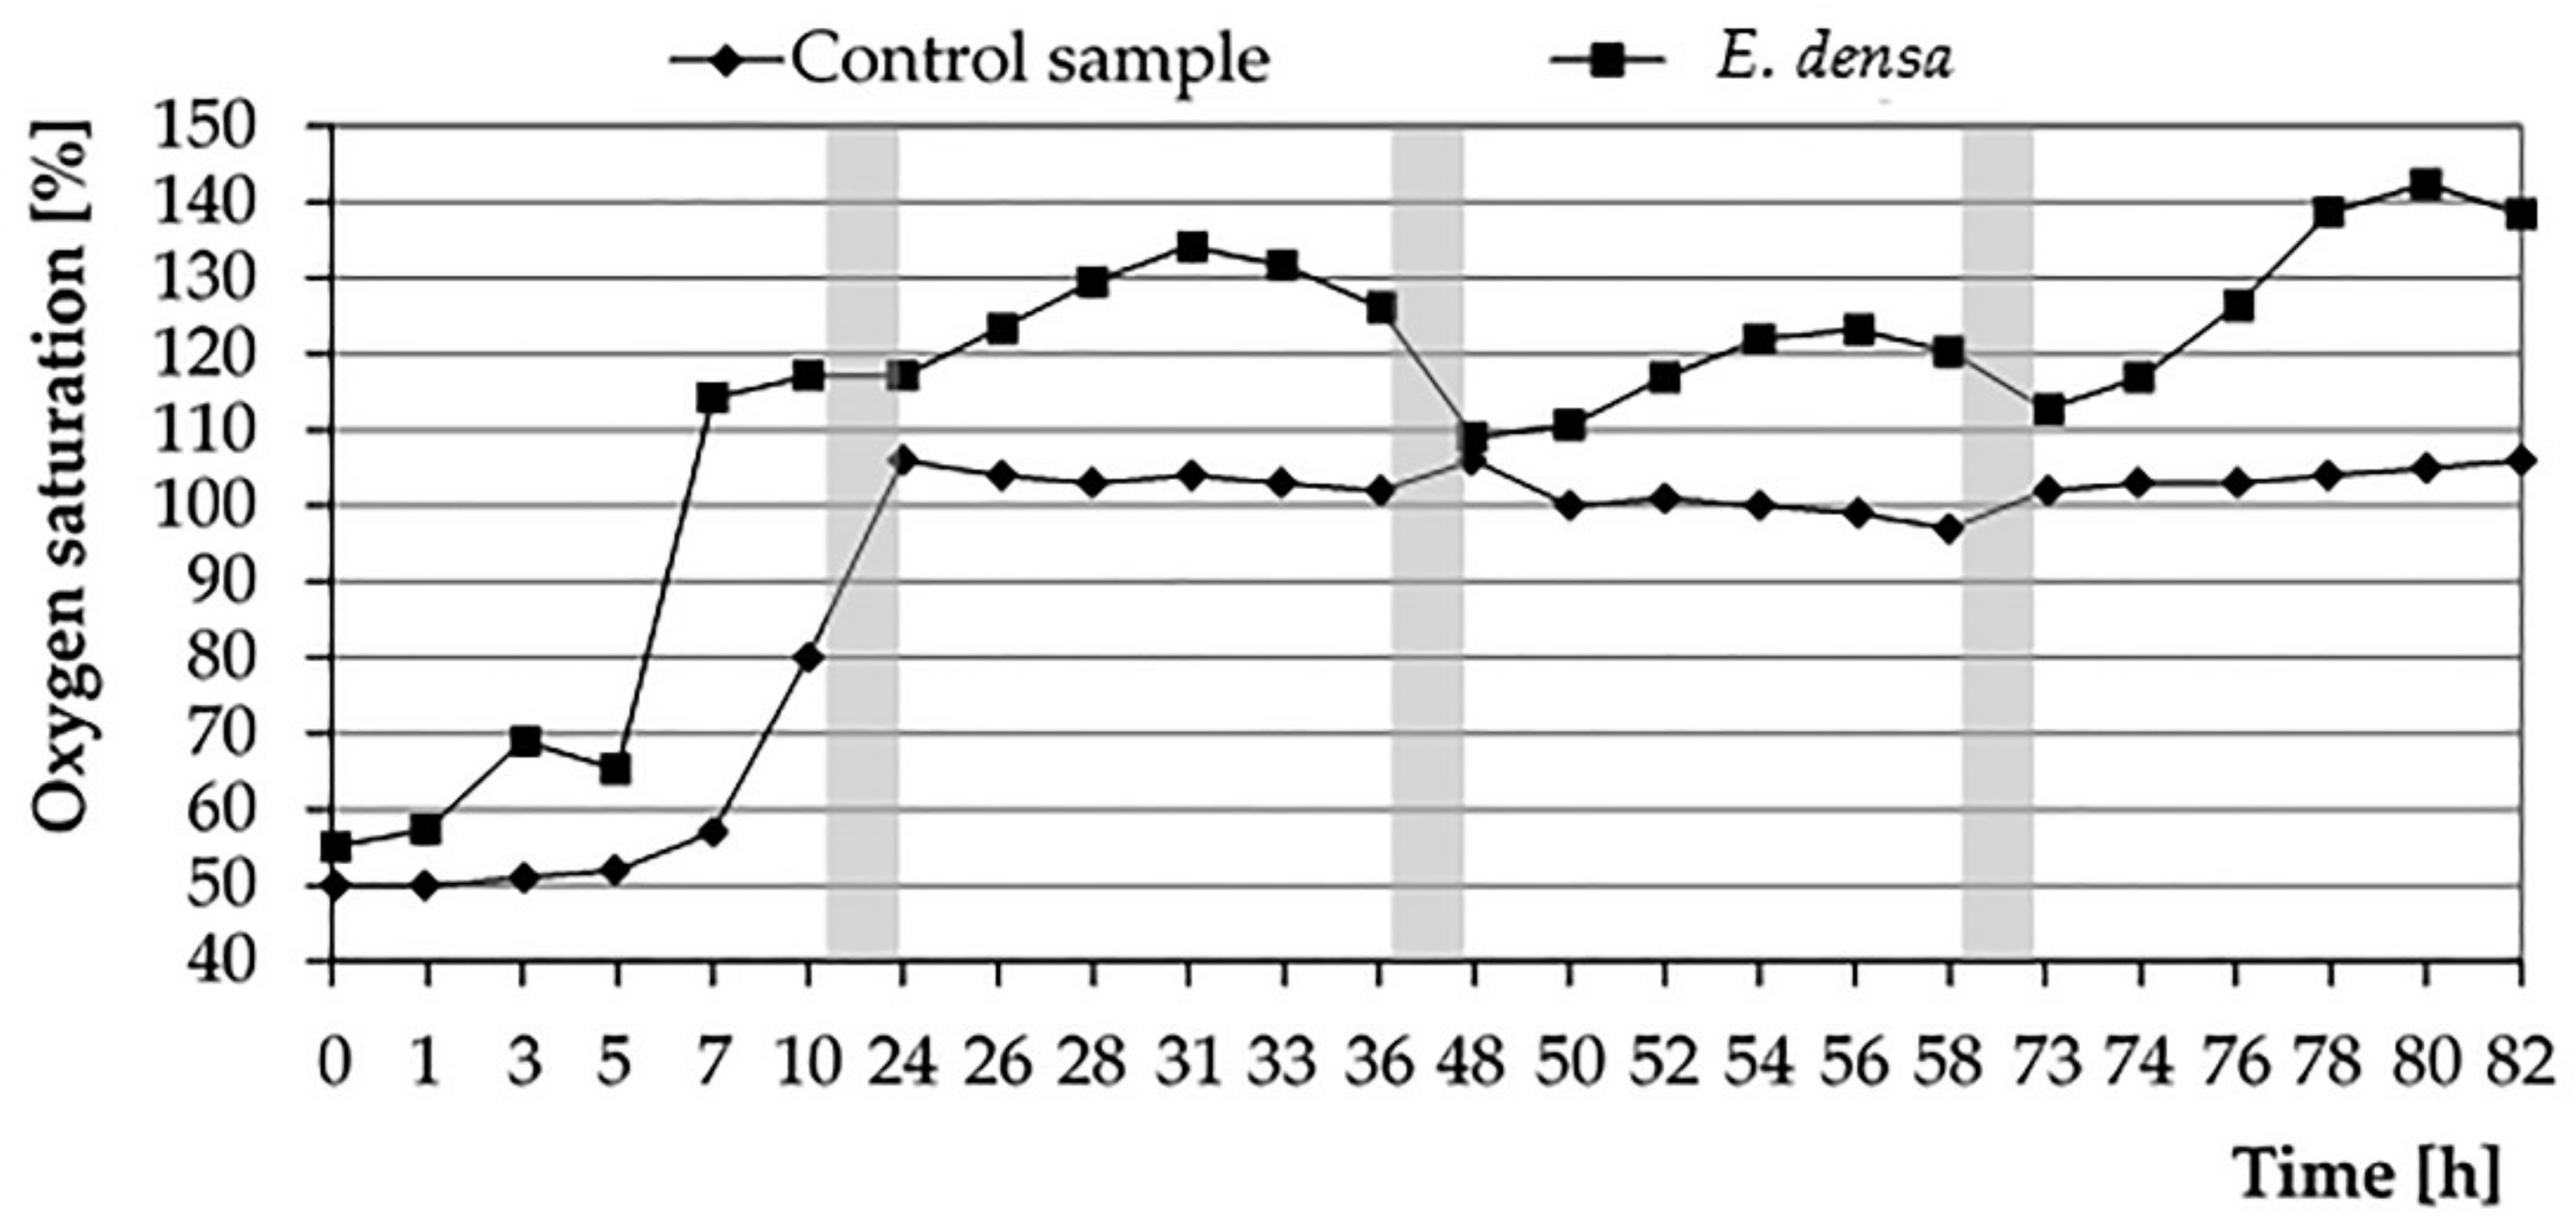
On the first day of analysis, stabilization of oxygen conditions was maintained for about 5 h (from 7 am to 12 pm). Then there was increasing in the O2 content in the test with plants. In the variant with plants, the point of full saturation with water oxygen was faster than in the control sample, where it was observed on the next day. This is in line with the observations made by Sorrell and Dromgoole [36], investigating the OTC of the Egeria densa. In their experiment both in a static medium and in an open flow medium, the partial pressure of oxygen in the roots and shoots of this immersed plant showed initial stagnation lasting from 1 to 3 h and subsequent growth. During the following days of the experiment, stabilization of processes and gas relations in the vessel with E. densa became visible. There was also a clear supersaturation of water with oxygen, which could be associated with a low BOD index. The amount of O2 remaining in the tissues of E. densa and in the surrounding water allowed not only to satisfy the plant’s demand for this element but also to release it outside. On the fourth day of the experiment, the amount of oxygen introduced was again increased (Figure 1).
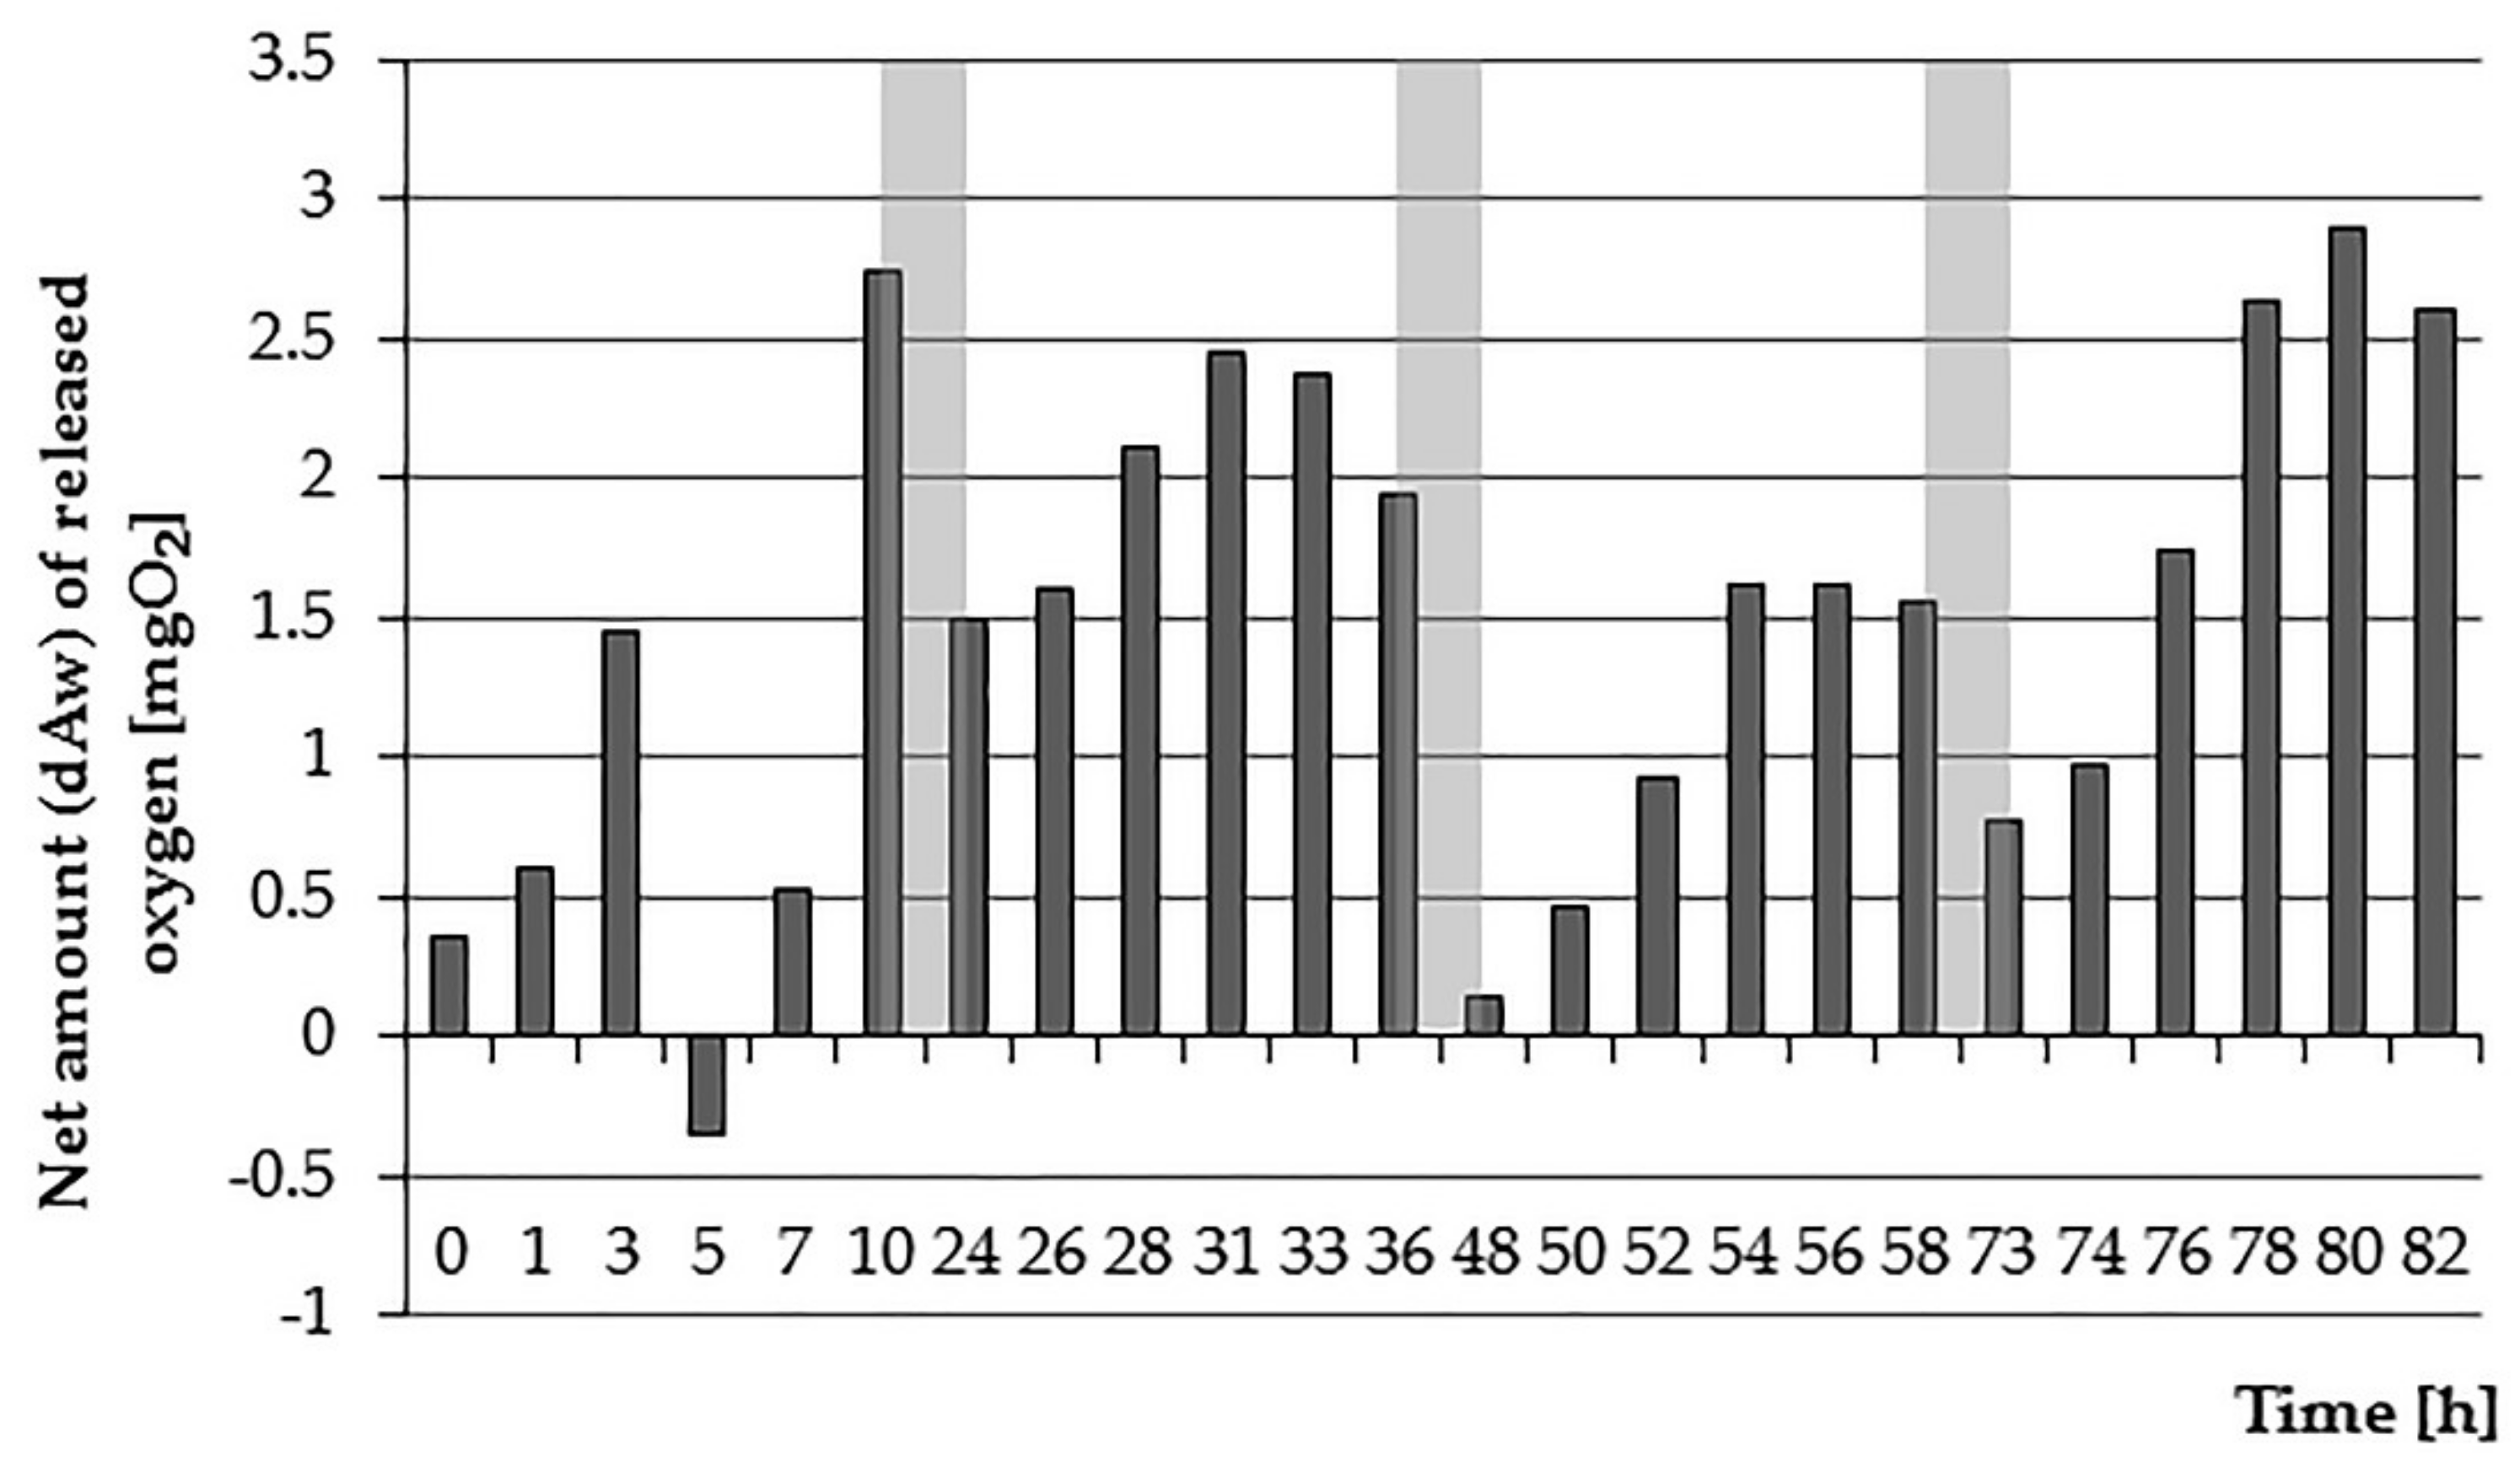
The amount of oxygen introduced by E. densa into the water was analyzed every day from 7 am to 7 am the next day. In all four cases (4 days), the initial increase in O2 content is visible until reaching the daily maximum for the afternoon hours; then, its fall was observed in the night period, which was caused by the respiratory activity of plants (Figure 2). The dependence of the amount of oxygen released on light conditions suggests its origin from photosynthesis [37]. In contrast to emerged plants in which oxygen transported to water comes from the atmosphere, the photosynthetic source of O2 is a characteristic of submerged plants such as E. densa [38]. However, levels of oxygen release several times higher in the illuminated environment were observed by researchers in plants of various types, both freshwater, and marine, including partially emerged species and overgrown wetlands [39]. Sorrell and Dromgoole [36] explain this with different mechanisms of oxygen transport and storage in plant tissues at daytime and at night. Based on the mentioned studies on Egeria densa species, they came to the conclusion that oxygen produced in chloroplasts stays in the lacunae during the day or overcomes the boundary layer and passes to the surrounding medium (water). The resulting pressure gradient controls the diffusion of oxygen towards the roots. It is also similar to the Dacey [40] study, which proved that in the presence of light plants are able to produce convective gas flow, which is the result of an increase in pressure induced by changes in temperature and humidity. According to this researcher, gases are transported by diffusion only at night, which results in their slower movement and, consequently, stagnation of internal conditions in the tissues of plants in the dark. The reduced supply of oxygen, therefore, causes “night regime” [36].
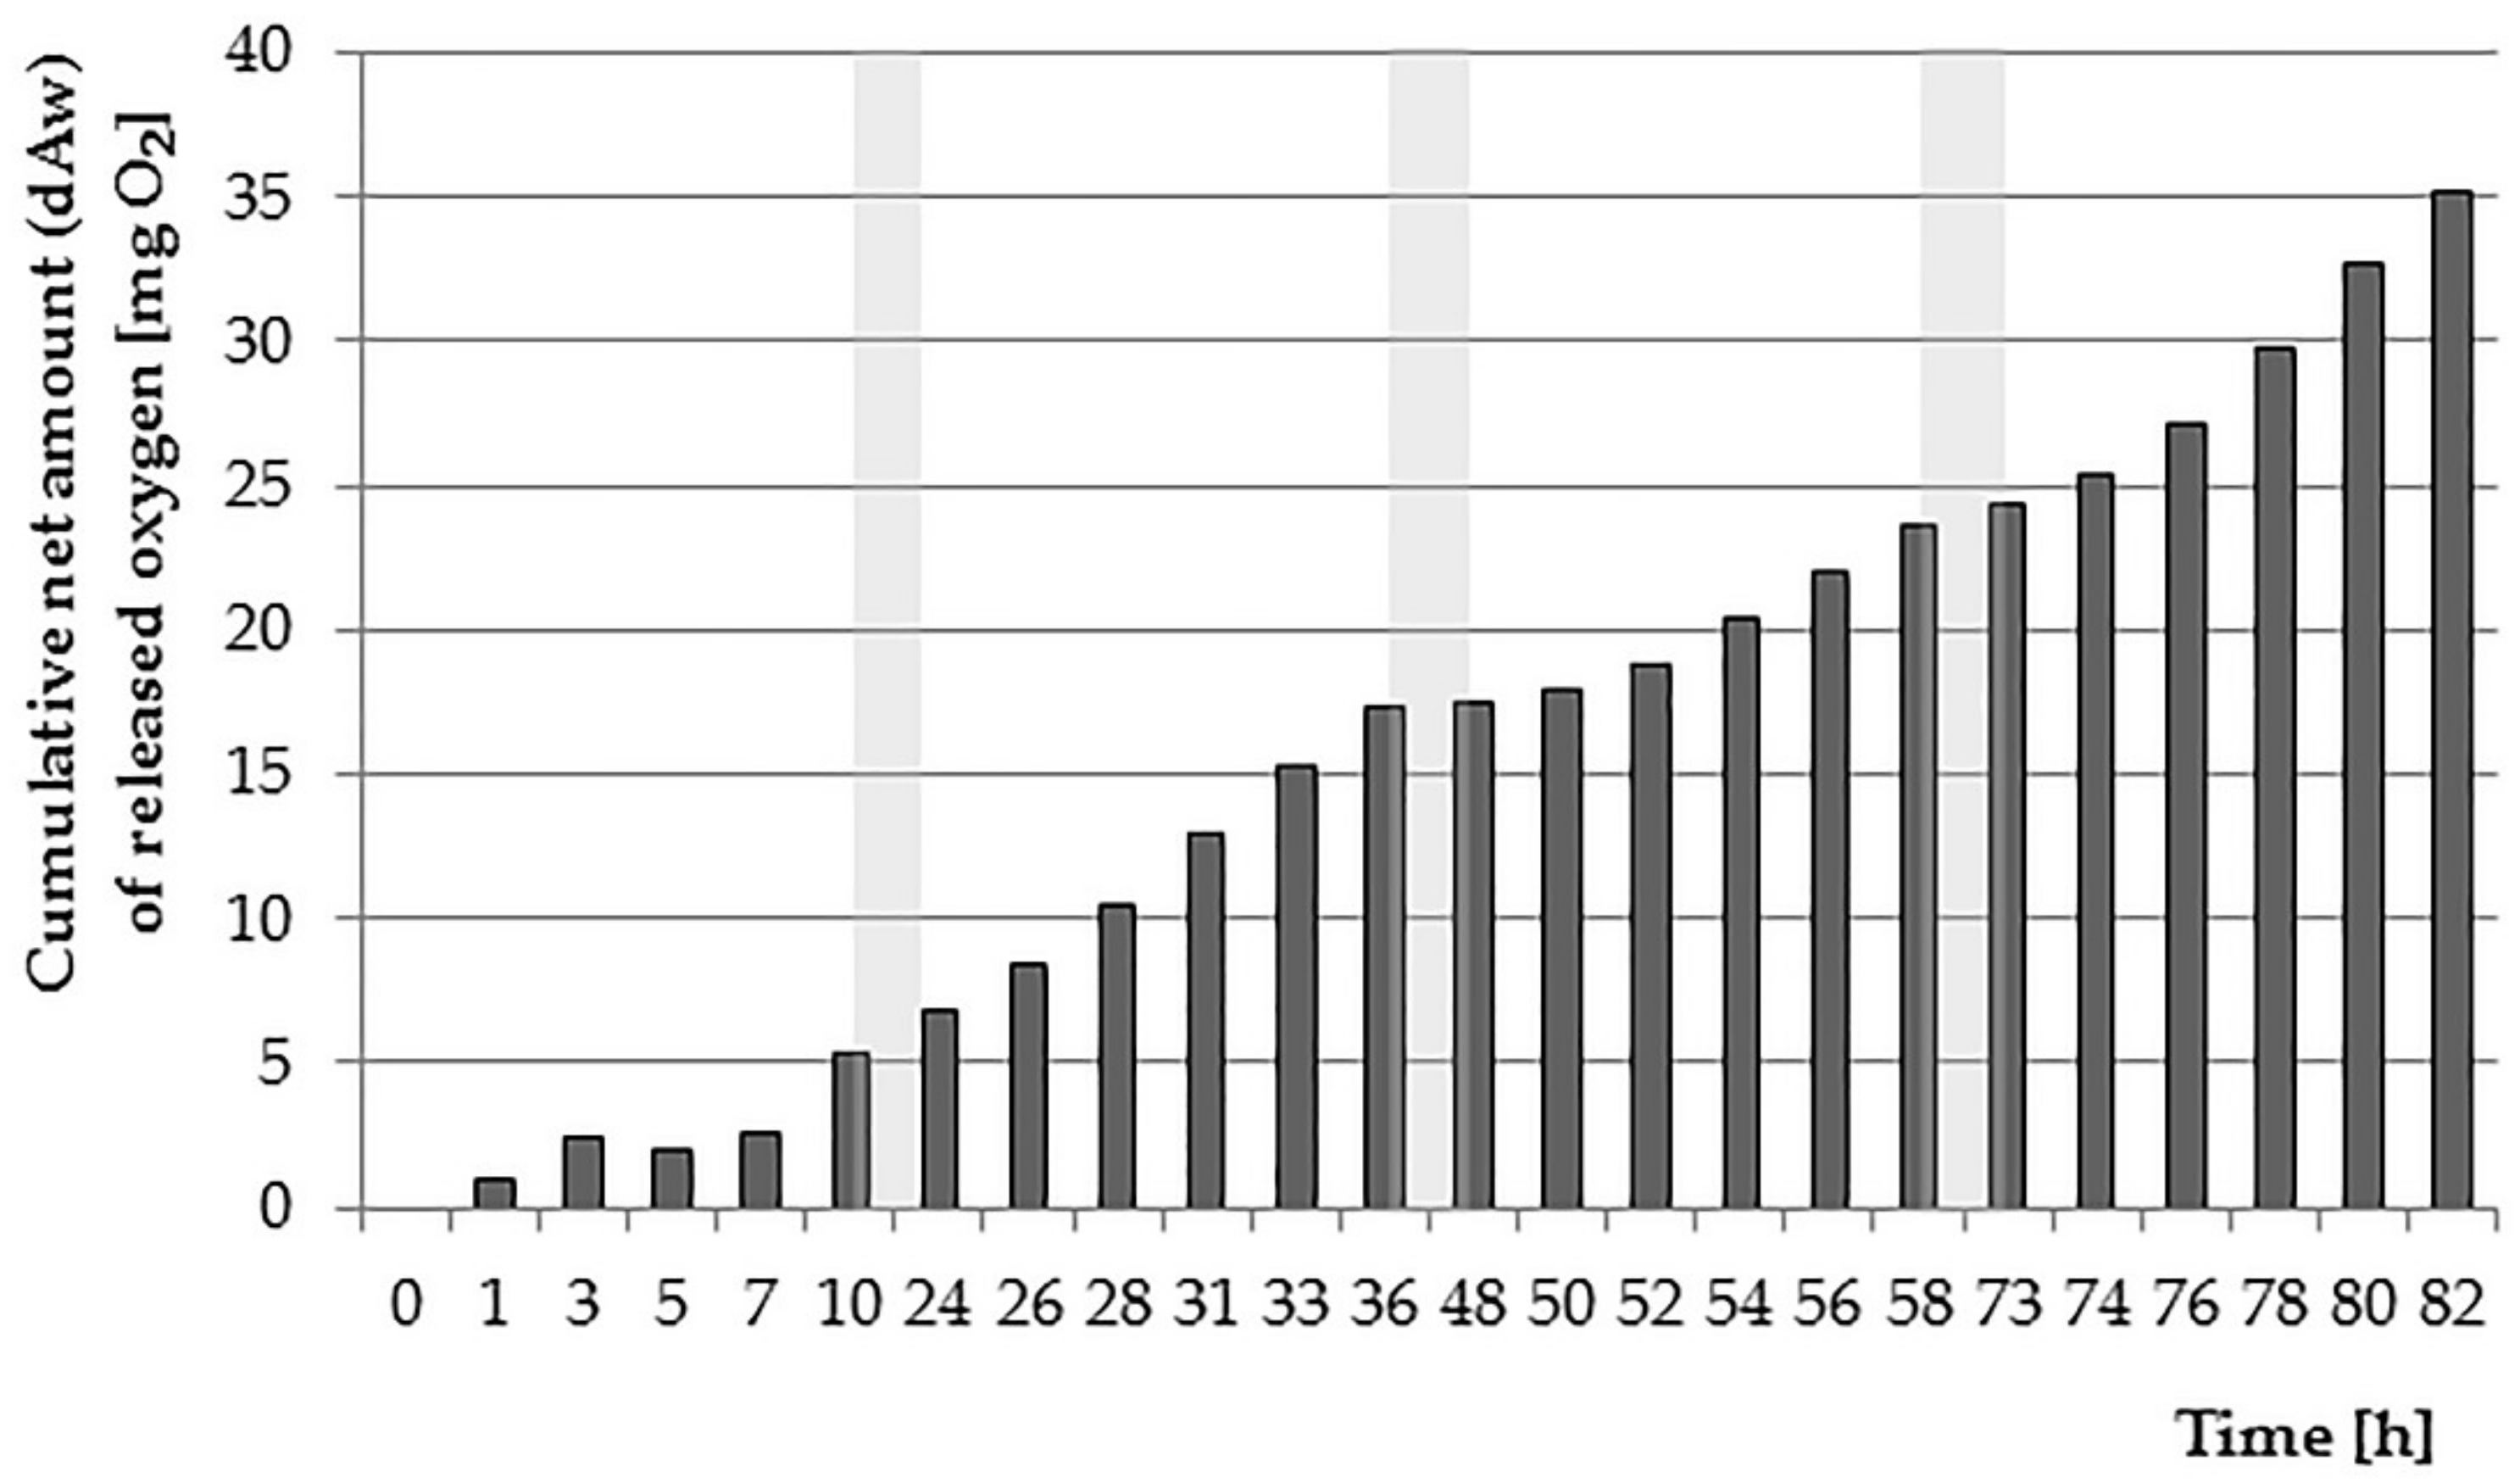
The largest net amount of oxygen equal to 14.23 mg·L−1 plants were introduced on the second day of testing; a similar result was recorded on the last day (13.64 mg·L−1). Lower values were achieved on the first and third day of testing (6.83 mg·L−1 and 8.37 mg·L−1 respectively). Worth noting is also the fact that in the examined vessels, despite the clear influence of the lighting regime, the environment has always been aerobic. This can be explained by the fact that plants release oxygen also in the dark (in the case of an experiment-at night). According to Sand-Jensen et al. [38], the rate of transfer of O2 to water in such conditions is about 10 times slower, but it allows for permanent maintenance of the root surface and rhizosphere in aerobic conditions [41]. The net cumulative amount of oxygen introduced by plants is shown in Figure 3.
3.2. The Efficiency of Wastewater Treatment by Submerged Plant E. densa
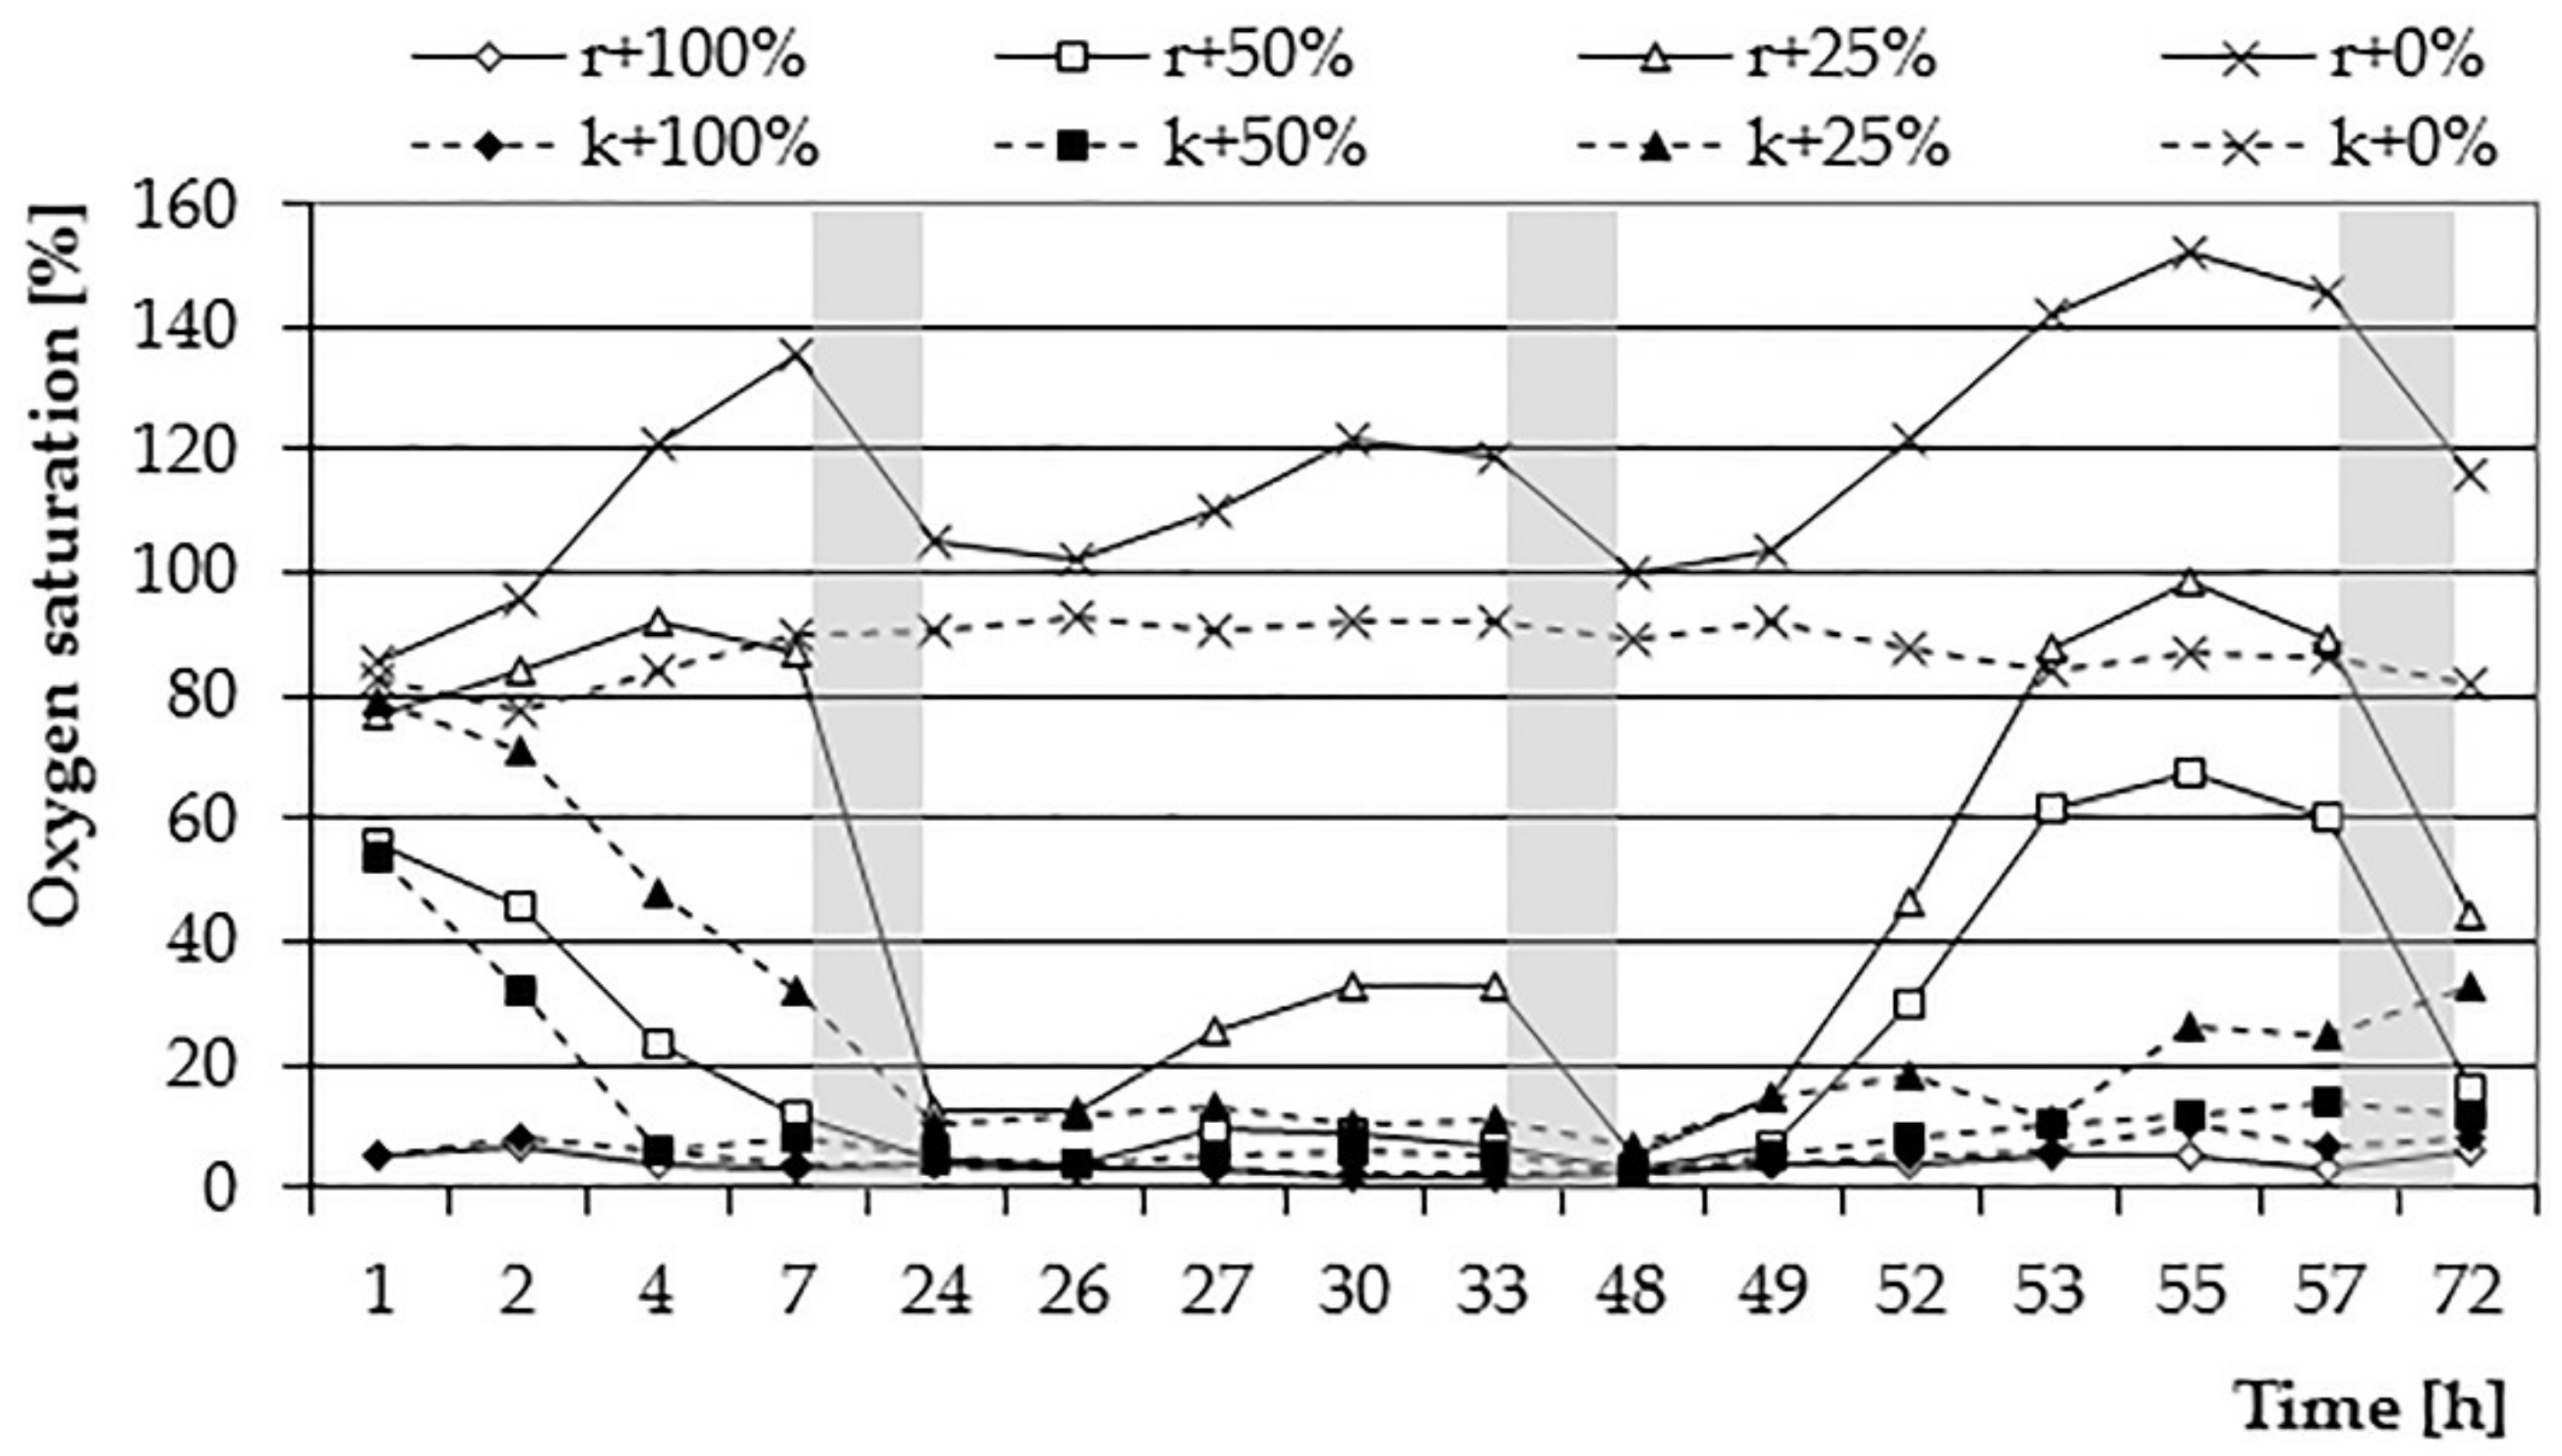
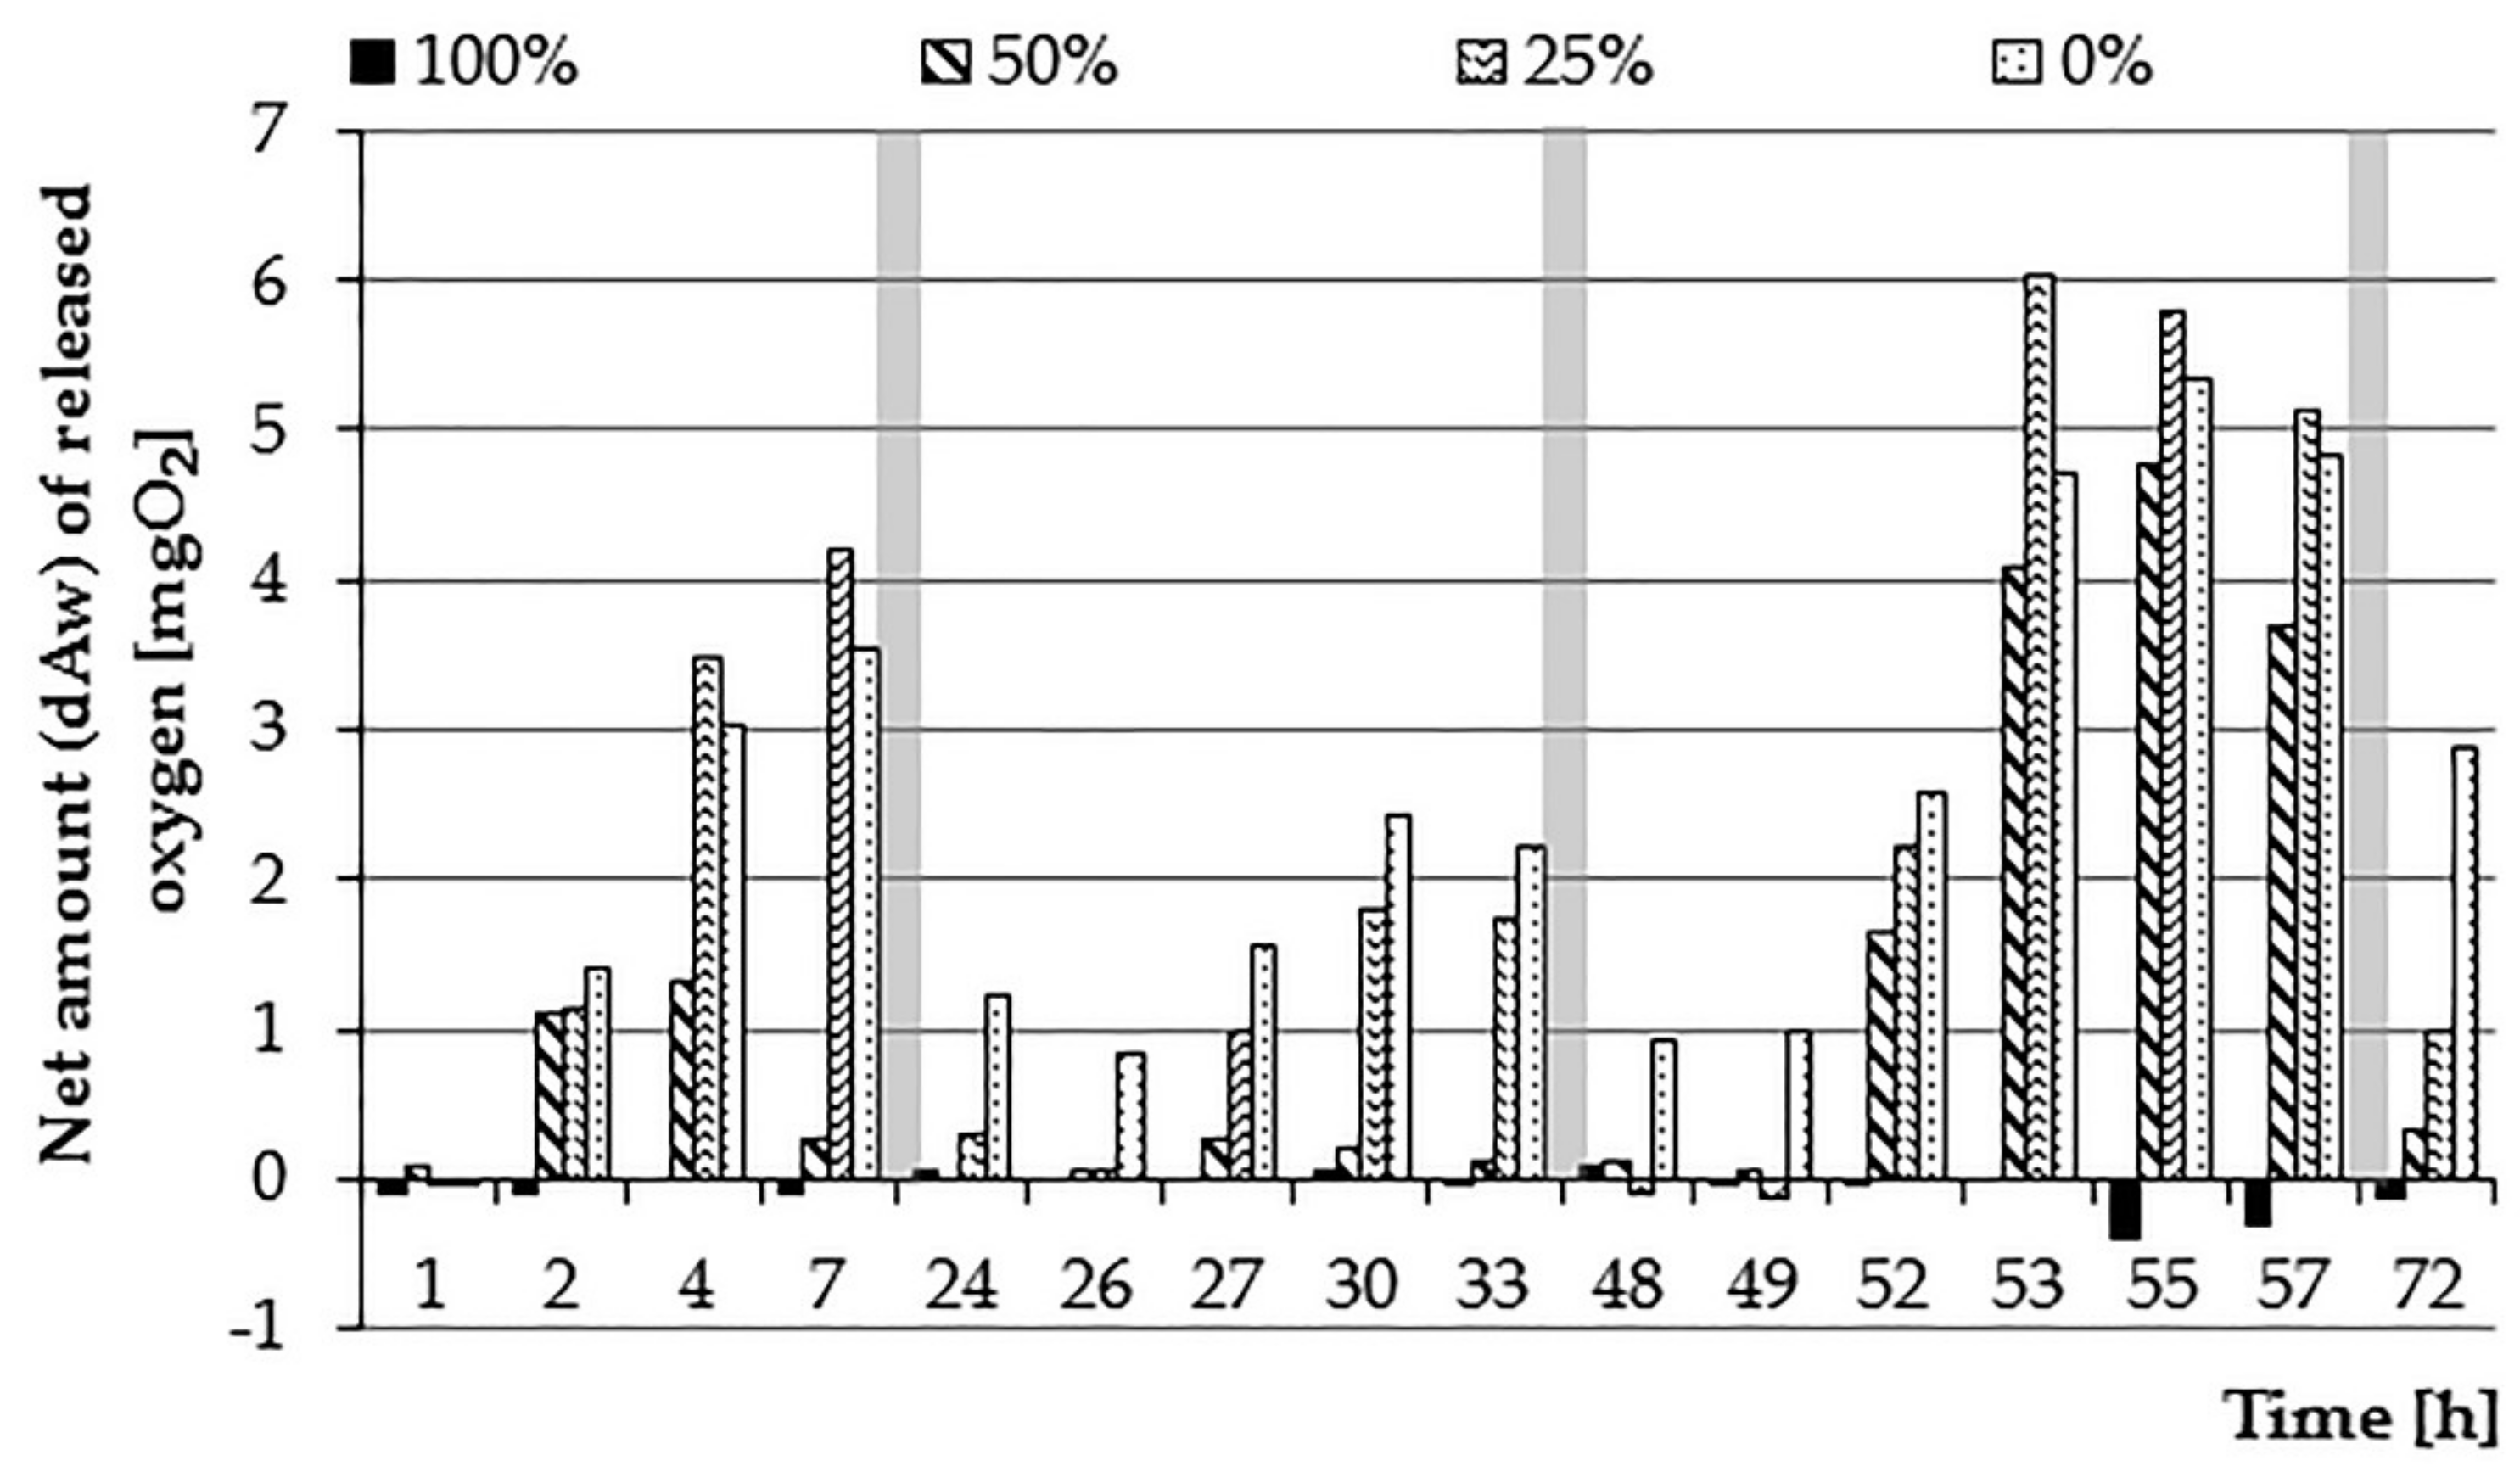
The first day of the experiment was characterized by a gradual decrease in the oxygen content in samples with sewage at 50% and 25% concentration. The rate of decrease in the content of O2 increased with the increase of the sewage concentration (Figure 4 and Figure 5). For the same concentration, the decrease in oxygen content was slower for samples with plants compared to control samples, which may indicate the effect of the E. densa species on such a course of the process. For the 100% concentration, no changes in the O2 content were observed, while in the case of the 0% test, a similar course of changes in the oxygen content was noted as in the first stage of the experiment. The introduced net amounts of oxygen increased with the concentration of wastewater, whereby for 0% and 25% concentration, they eventually assumed similar values (Figure 6). On the other hand, the course of changes was different: at a 25% concentration, the amount of oxygen in the control sample dropped quickly, while in the variant with plants slower.
On the second day of the experiment, a clear predominance of oxygen demand for bacterial decomposition and respiration processes over photosynthesis and oxygen production has become evident. The wastewater concentration of 100% and 50% showed O2 content at a very low level (near zero). For the sample with a 25% wastewater concentration, an increase in the oxygen content to approx. 38% saturation was visible, which indicates that the turbidity of the sewage was not sufficient to inhibit the photosynthesis process. The content of organic substances could also be so small that the rate of photosynthesis was greater than the rate of respiration processes and the amount of oxygen produced could increase. The O2 content was decreasing in all concentrations during the night. The changes in the oxygen content for a 0% concentration showed a similar character as on the previous day; the amount of oxygen introduced was also similar, which may be indicative of similar light conditions in both days. On the third day of the experiment, a significant increase in the oxygen content in 0%, 25%, and 50% concentrations was visible. The net amount of oxygen introduced during the day in a 0% concentration was 22.31 mg (26.25 mg O2·L−1), reaching the highest value obtained in the studies. Also, the amount of oxygen introduced during the 3rd day for a concentration of 25% was high (19.93 mg, corresponding to 23.45 mg O2·L−1). At 50% wastewater concentration, an increase in the amount of oxygen introduced compared to the previous day was observed. This could be due to a decrease in turbidity resulting from wastewater treatment processes occurring in the bottle or a reduction in the amount of organic matter in the solution. The rate of photosynthesis processes was higher than the respiration. On this day, the course of changes in the oxygen content for the three lowest concentrations of sewage showed a similar character as in the first stage of the research. This can be explained by the adaptation of the plants to the prevailing conditions, adaptation of conditions prevailing in the solution or the level of water treatment enabling their efficient functioning. The inhibitory effect of higher sewage concentrations on plant activities in the field of oxygen release has been confirmed in studies by Tanner et al. [42]. They made observations of the level of soluble oxygen in sewage depending on a load of organic matter. The highest level of O2 was present at its lowest charges. In the same experiment, however, they noted the maximum removal of carbon biochemical oxygen demand (CBOD5) during the period of the highest load. In addition, the average annual reduction of this index was significantly higher in systems using plants than in the control sample. According to Chazarenc et al. [43], higher loads of organic matter can be treated effectively without decreasing the COD removal efficiency. However, they noticed that the increased load of plants with organic matter may cause hydraulic problems of plant tissues; treatment efficiency would have to be adapted to the right amount of plants and the depth of their roots. The increase of treatment efficiency at the increased input level of municipal sewage was also confirmed by Mæhlum and Stålnacke [44]; in their experiment, it also influenced the removal of organic compounds and nitrogen.
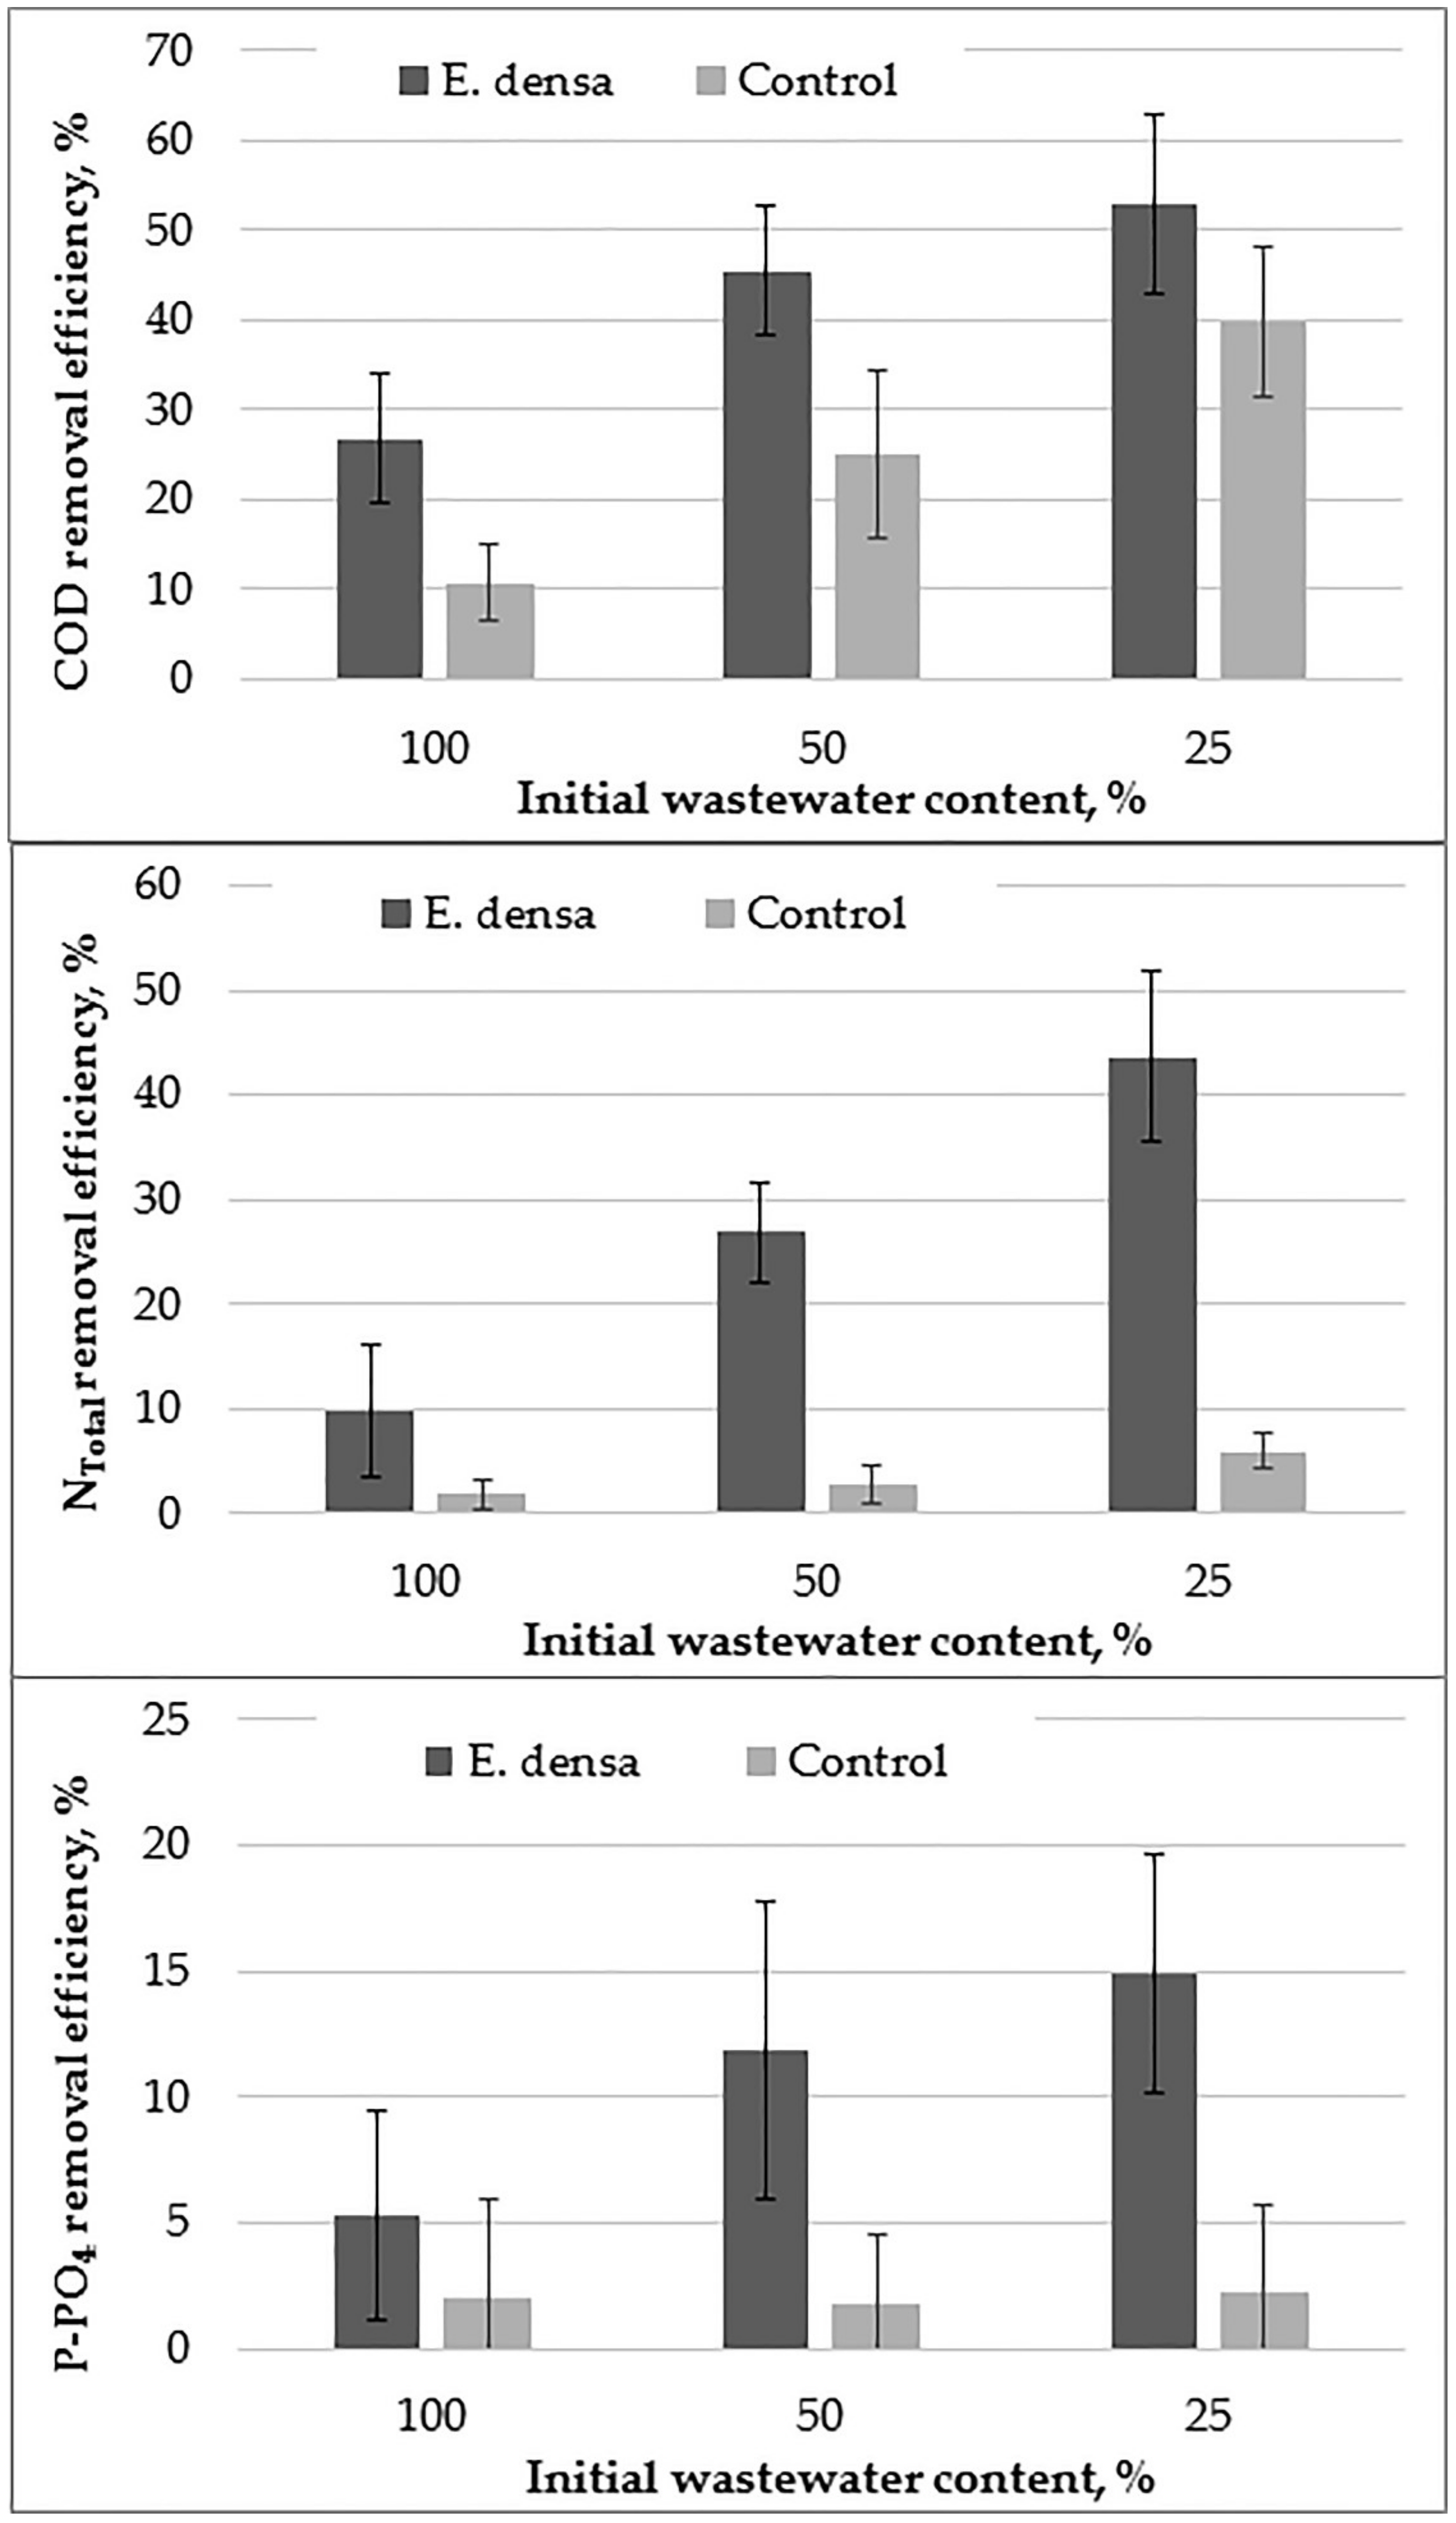
Figure 7 shows the effectiveness of the E. densa plant in wastewater treatment. For the 100% wastewater dilution test, a small decrease (5%) in phosphate content in water due to anaerobic conditions, in which organically bound phosphorus was released into the environment, became evident. Similar observations were made by Ng et al. [21], which was also attributed to the anaerobic digestion of swine slurry, which was a component of the substrate for the plants analyzed. A smaller decrease in phosphate was observed in the control test than in the samples with plants, as indicated by E. densa use of some of the released phosphates or the resulting oxygen on the conversion of phosphorus compounds. The same phosphates removal efficiency between 2–3% determined for all wastewater dilution control variants may indicate the influence of plants on phosphates removal. The increase in the wastewater dilution rate increased P-PO4 removal efficiency. It could be the synergistic effect of plant’s uptake of P-PO4 and inducing anoxic and aerobic conditions by oxygen release, and therefore bounding P-PO4 by microbial biomass. In other concentrations, removal of phosphates in samples with plants was observed (for 25% concentration higher than for 50%). This is consistent with Brix and Shierup [14], demonstrating the suitability of submerged plants including E. densa to remove significant amounts of phosphorus.
There was a visible removal of COD and Ntotal for all wastewater dilutions in variants with plants compared to the control, with its degree increasing with decreasing wastewater concentration. It is worth noting that even in a sample of 100% wastewater concentration, the sample with plants showed a greater efficiency of removing COD and Ntotal than a control sample. This may indicate that there was available oxygen in the systems, which was immediately consumed on the transformation of organic compounds and nitrogen compounds. The increase in COD removal with decreasing concentration was about two-fold in subsequent concentrations, while in the case of Ntotal decrease, it was slightly slower, especially between 50% and 25% wastewater concentrations. In the case of control wastewater dilutions, the removal efficiency of COD and Ntotal was different. In case of COD, the systems with more diluted wastewater (25%), where a slight increase of oxygen saturation was observed during the 3rd day of the experiment (Figure 4), the removal of organic matter was more efficient than 50% and 100%. It could be related to some availability of oxygen diffused by the water surface from the air. Preferably, available oxygen was used by heterotrophic bacteria to oxidize organic matter than nitrifies to oxidize the ammonia, causing the increase of COD removal in relation to 50 and 100% wastewater dilutions. It could be confirmed that the efficiency of NTotal was at a relatively small level between 1 to 6% (Figure 7). It shows that in control systems there were not suitable conditions for nitrification and further reduction of NO3 due to the denitrification. Probably nitrogen compounds were transformed due to ammonification or were released due to volatilization. In the case of organic matter, anaerobic processes dominated, with some organic decomposition under anoxic or aerobic conditions in a system with 25% of wastewater dilution. The higher rate of COD removal efficiency in systems with plants than in controls could be an effect of higher oxygen availability due to the photosynthetic activity of plants (Figure 4). The increase of wastewater dilution rate increased the oxygen saturation, what stimulated aerobic microorganisms for growth and organic matter consumption. However, the tendency to reduce the chemical oxygen demand observed in the conducted studies is in opposition to the observations made by the mentioned Ng et al. [21], investigating the effect of E. densa species on water quality. The plants analyzed by the authors did not cause a decrease in COD. Moreover, the COD increase during morning hours was observed. The removal of water turbidity in the reservoirs studied by Ng et al. [21] by 28% contributed to a decrease in COD by < 5%. They attributed the removal of turbidity mainly to the processes of sedimentation and filtration. The low efficiency of COD removal was also observed by Tanner [45], dealing with the analysis of horizontal subsurface-flow CW.
Such contradictory results show that CWs are still unexplored and complex environment. It is known that the oxygen released from submerged plants creates local aerobic conditions and changes the redox status in the otherwise anoxic or anaerobic environment, which induces growth of aerobic heterotrophic and autotrophic bacteria (nitrifiers), and the aerobic breakdown of organic material [33]. The release of oxygen is related to some extent to photosynthesis, light intensity, and temperature, as well as to the plant species concerned [46]. Additionally, organic compounds, such as sugars, alcohols, and acids that are in the wastewater or released by plants into the rhizosphere can help in nitrate removal by acting as a carbon source for denitrifying bacteria [47]. The majority of microbial processing that occurs in wetlands is attributed to biofilms made up of communities of algae, bacteria, protozoa, and invertebrates. It has been shown that up to 90% of organic and inorganic N can be removed from wastewater by biofilm supported by plants activity [48].
As the organic matter removal in CW with the submerged plant is determined by oxygen availability, further research on identification of quantitative influence of turbidity on OTC of submerged plants should be done. Similar recommendations may be derived for nitrogen transformations.
In the present experiment, the influence of E. densa on nitrogen compounds transformations due to the release of oxygen and modification of redox potential could be seen. The species of E. densa has already been described in the literature as effective in removal of the nitrogen [49]. Its 25% removal from water in the form of NO3−-N, NO2−-N and NH3-N have been reported [21]. This is related to the ability of submerged plants to release O2. This allows nitrification processes around the roots, which helps absorb nitrates or nitrates together with NH4+, and consequently has an effect on the regulation of the internal pH of the plant [41]. Kuschk et al. [50] considered the temperature and oxygen availability as the main parameters influencing microbiological nitrification. High level of oxidation of the root zone stimulates the growth of nitrifying bacteria, among others in biofilms related to the roots of plants growing on wetlands [51]. The NO3−-N produced as a result of their activity then diffuses into anaerobic regions, it is transformed into nitrogen gas and is lost from the system [12]. In the analyzed systems with plants, the NTotal removal efficiency increase with the increase of wastewater dilution ratio was observed. It could be related to the increase of oxygen availability increase with a system with lower wastewater content, what could raise the organic matter decomposition rate and parallelly promote the nitrification/denitrification processes.
Nitrogen has a complex biogeochemical cycle with multiple biotic/abiotic transformations involving seven valence states (+5 to −3). The compounds include a variety of inorganic and organic nitrogen forms that are essential for all biological life [52]. The most important inorganic forms of nitrogen in wetlands are ammonium (NH4+), nitrite (NO2−) and nitrate (NO3−). Gaseous nitrogen may exist as dinitrogen (N2), nitrous oxide (N2O), nitric oxide (NO2 and N2O4), and ammonia (NH3). N losses in the CWs are manly related to removal mechanisms such as ammonification (mineralization), ammonia volatilization, autotrophic nitrification, and heterotrophic denitrification, anaerobic ammonium oxidation (anammox), dissimilatory reduction, plant and microbial assimilation and remineralization during decomposition, filtration, sedimentation, adsorption, and microbial assimilation [53]. Microbial processes are the main mechanisms of nitrogen removal from wastewater in constructed wetlands [54]. Sorption and microbial and algal assimilation of N are rapid, however, the assimilation in the higher plant is usually slower. Some N cycle processes strictly related to microbes include N fixation, the process by which molecular N in the atmosphere is reduced by bacteria and cyanobacteria to NH4+. The main pathway of nitrogen transformation is nitrification/denitrification where NH4+ is oxidized first to NO2− and is then further oxidized to NO3−, and denitrification, the process used by facultative anaerobic bacteria to oxidize organic matter using NO3− as a terminal electron acceptor with a byproduct of N2 or N2O. Thus, a considerable amount of N2O may be produced and emitted to the atmosphere [55]. However, the nitrogen removal mechanisms in CW systems still remain poorly understood, as reported in several studies [56,57] where the nitrogen loss and dissolved oxygen paradox were observed. Therefore, alternative pathways other than nitrification/denitrification are involved in the N transformations (e.g., ammonia removal via nitrite (nitritation), anaerobic ammonia oxidation, autotrophic denitrification, and heterotrophic nitrification) as also observed and reported by Paredes et al. [58], Tao and Wang [59]. Shipin et al. [60] reported the presence of anammox bacteria in a surface flow constructed wetlands. It is expected that the anammox reaction may play a role in nitrogen removal in a constructed wetland where ammonium and nitrite coexist.
Obtained results were achieved as a proof of the concept experiment (Stage 2) and were preliminary before execution OTC tests in relation to the plant’s biomass content. Besides that, most of COD and NTotal removal processes are considered as microbiological processes, part of nitrogen load could be up-taken by plants due to biomass growth. Plant uptake also plays an important role in increasing N removal [61]. In this aspect, the relationship between wastewater concentration and biomass increment has become apparent (Table 3). The highest level was achieved with a 25% concentration sample, and then 50% and 100%, the lowest one was observed with a 0% concentration. Therefore, not only the amount of available light (turbidity) but also the amount of bio-available nutrients may affect biomass growth.
After analyzing the total amount of oxygen introduced into water, no trend was observed as described by Kemp and Murray [62], according to which the production of O2 is inversely proportional to the length of the stem of the submerged plant. The largest biomass increase at the 25% dilution was simultaneous with the introduction of 38.5 mg O2 into the water, which could stimulate the microbial COD and NTotal removal processes.
To conclude, the plants in a CWs bring following benefits: plants may create aerobic conditions in an otherwise anaerobic environment, which increase heterotrophic and autotrophic aerobic bacteria biodiversity; plants can provide carbon compounds that may be utilized for microbiological processes; plants may uptake pollutants (N, P, heavy metals) from treated wastewater; plants also may increase the available surface for biofilm growth. The lack of data showing the quantitative dependence of plants oxygen transfer capacity on several environmental factors, such as temperature, redox potential, light intensity, the presence of organics and ammonia nitrogen in the solution, attachment of biofilms to plant surfaces or pH, shows the need of execution of complex research on that phenomenon.
3.3. The E. densa OTC Determination
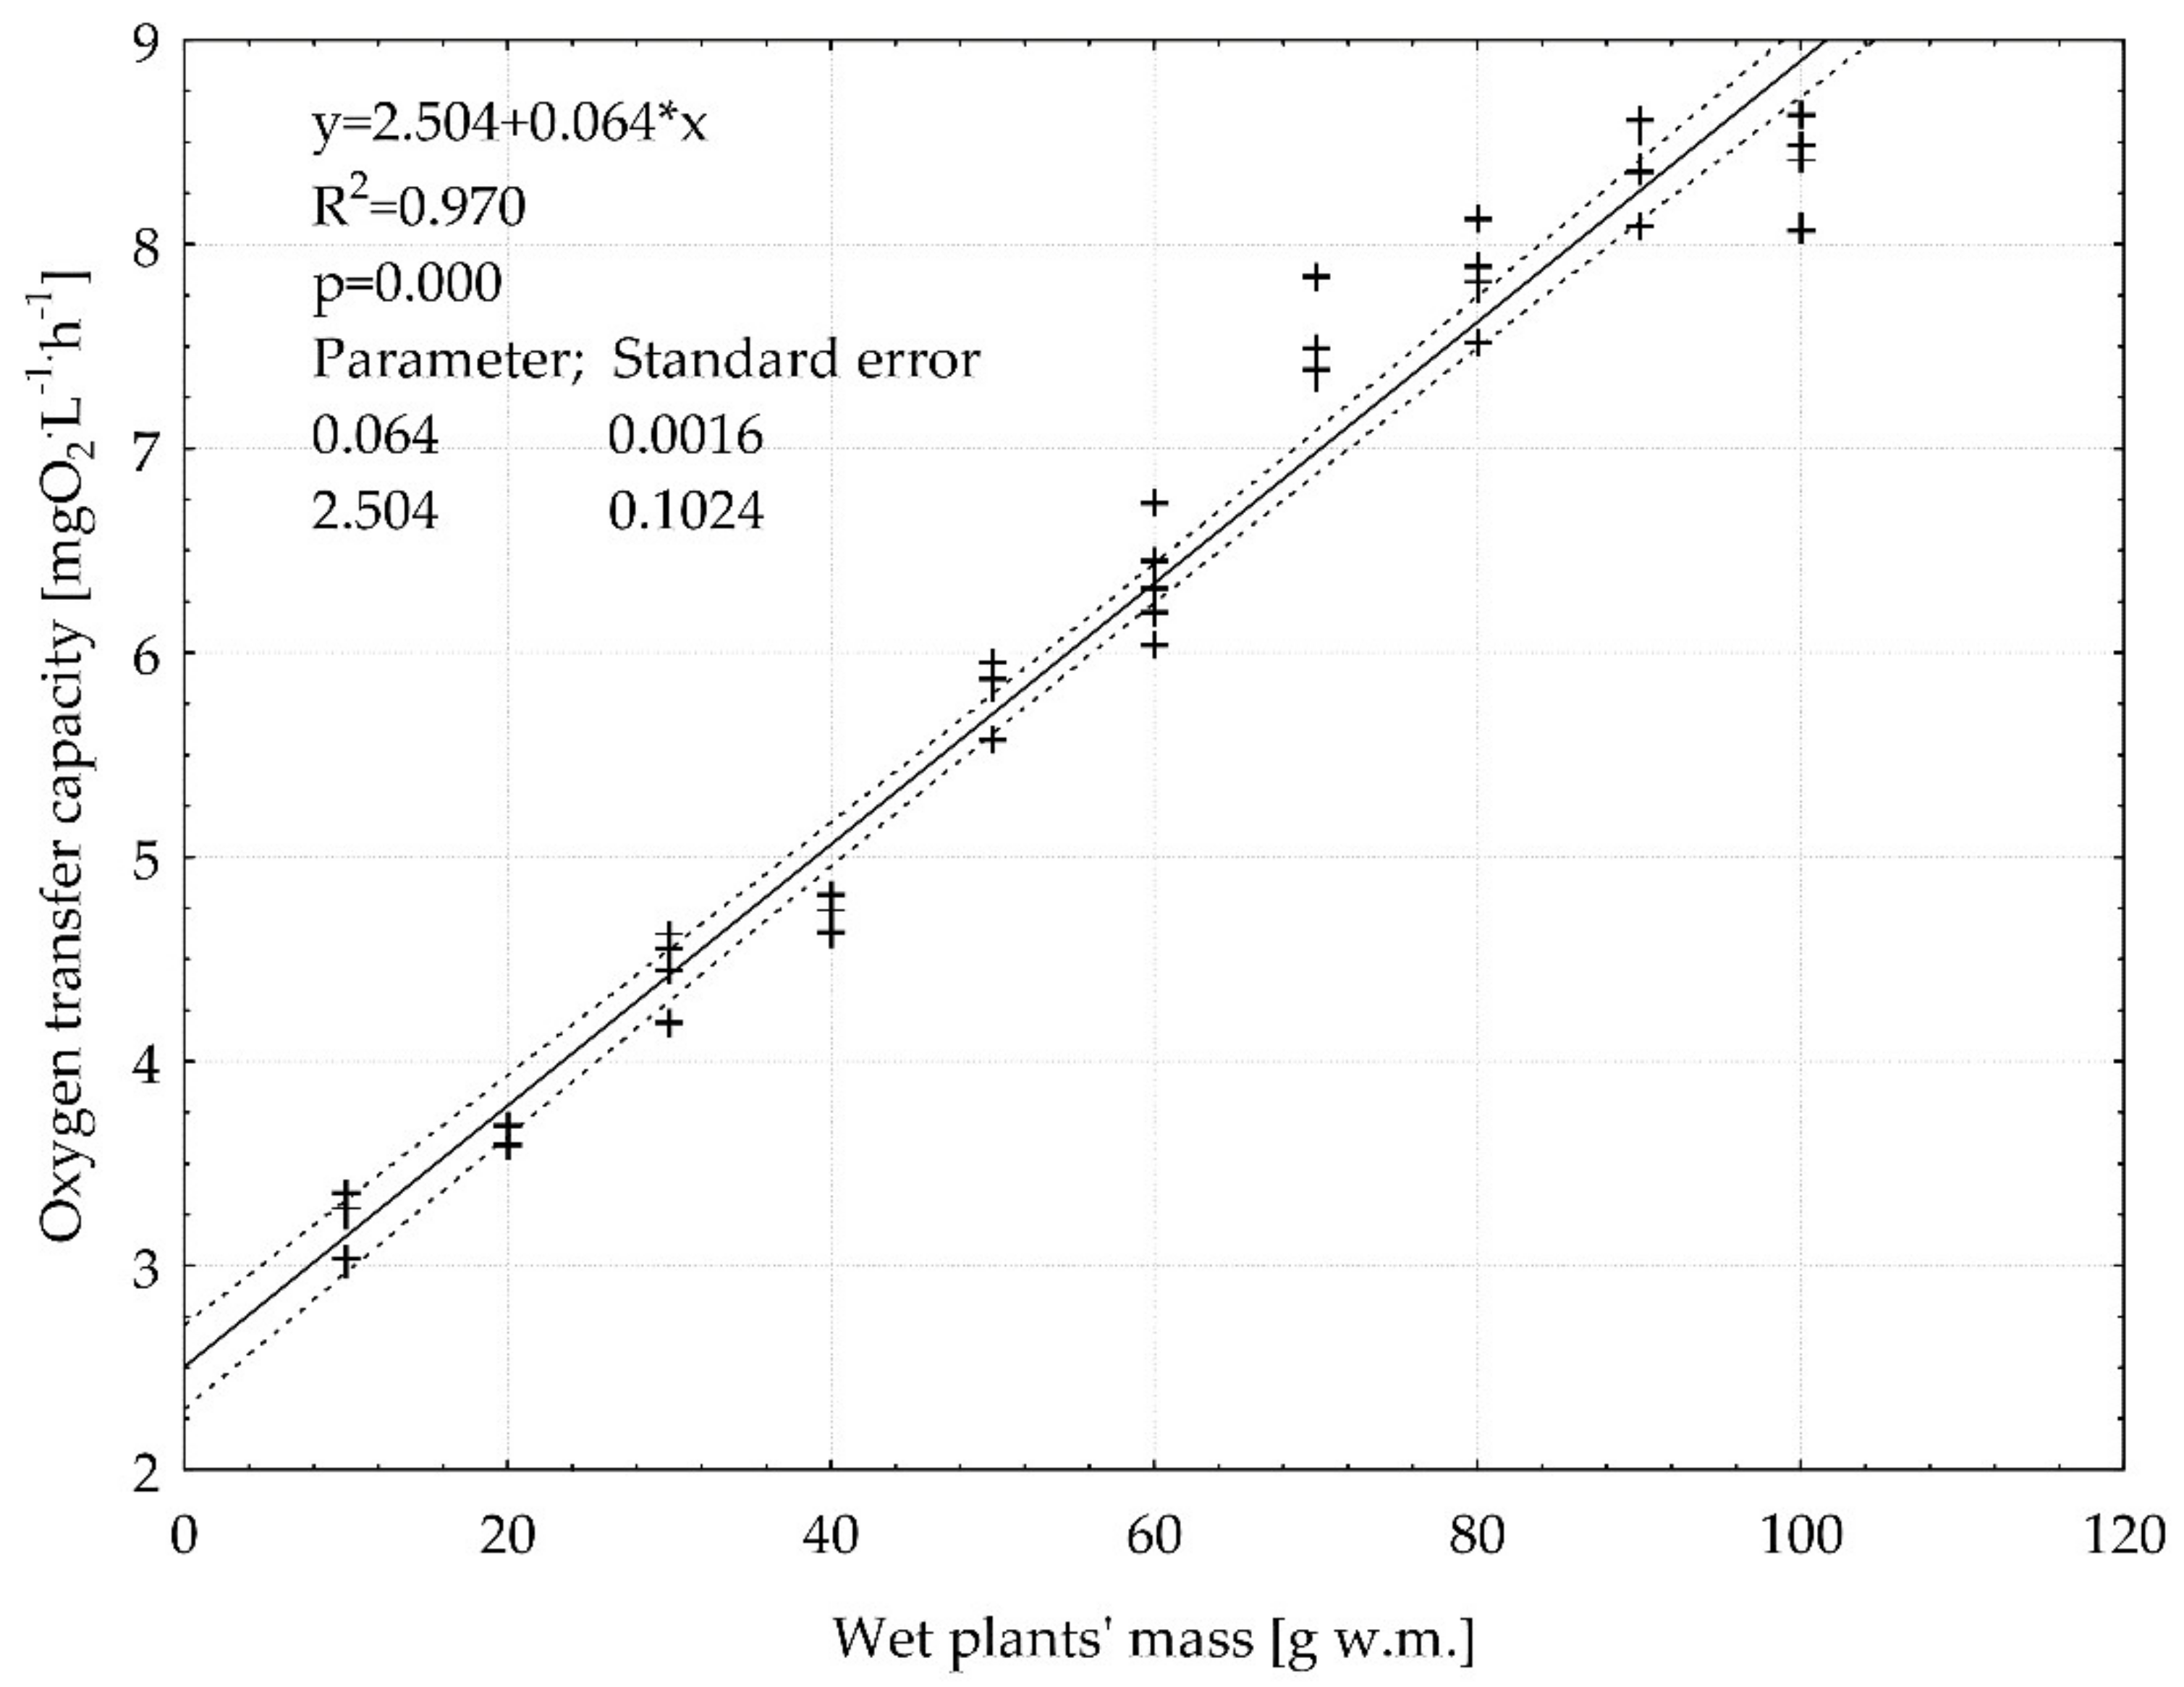
The first and second stage of the research observations of the release of oxygen by E. densa to the water made the implementation of the third stage of the research aimed at determining the OTC value and statistical evaluation of the dependence of the OTC index on the mass content of the plant in the water system. The significant linear correlation between wet plants mass of E. densa and the OTC has been determined. It has been shown that along with the increase in the plant mass content, the OTC index increases. The linear regression equation parameters describing the observed relationship were estimated (p < 0.05). The OTC raised from 3.19 to 8.34 (mg O2 L−1 h−1 g w.m.−1) (Figure 8).
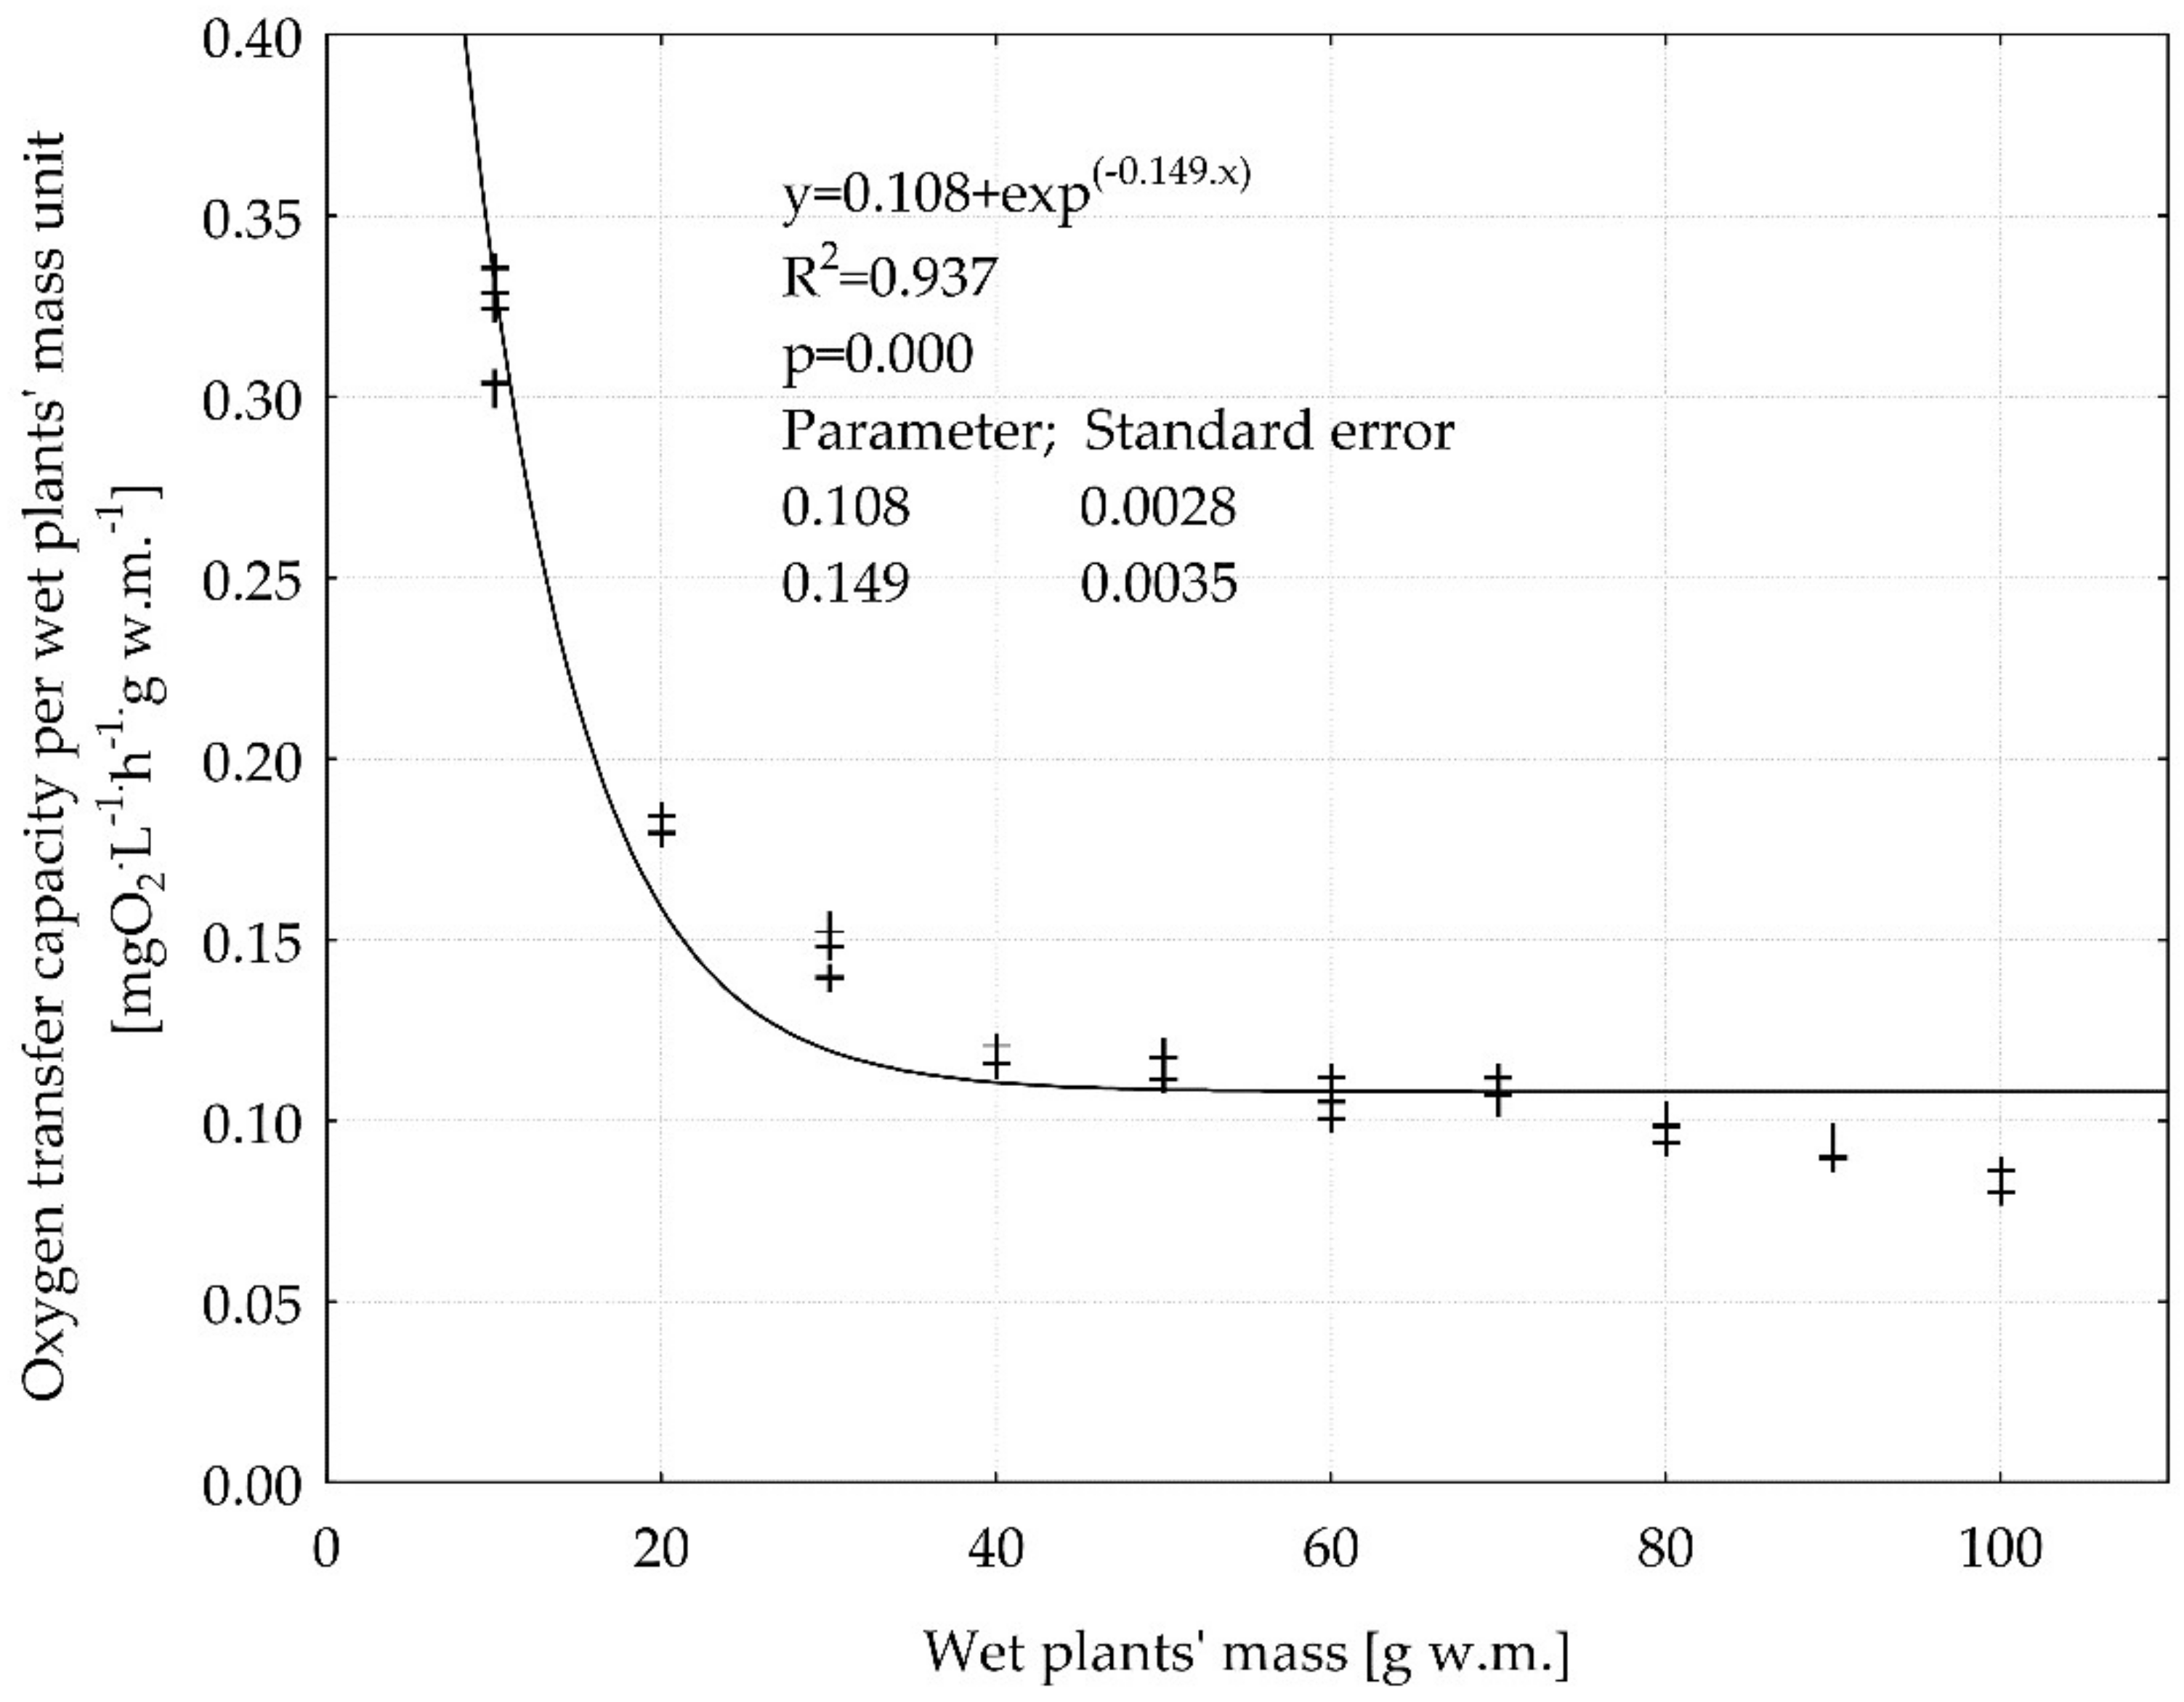
However, the non-linear dependence between the OTC per wet plants’ mass unit and wet plants’ mass (Figure 9) showed that in the range of wet plants’ mass from 30 to 100 (g w.m.) the OTC per w.m. unit was constant and was on the level 0.1 (mg O2 L−1 h−1 g w.m.−1) (Figure 9). This indicates a limit value of 30 (g w.m.), above which the increase in plant content in water does not increase the efficiency of oxygen input per unit weight of plants. This is an important observation that can be used in modeling and controlling the degree of oxygenation of water, wastewater in CW systems. Further research in this field, on a semi-technical and technical scale, should be continued. Particular importance should be paid to the influence of the depth of the reservoir on light distribution and photosynthetic activity of submerged plants, and hence their impact on the degree of oxygen saturation and the effectiveness of removing pollutants from wastewater.
4. Conclusions
Obtained preliminary results indicate that E. densa may be suitable for use in CW as a tool for treating wastewater in the final phase of multistage systems.
The conducted research showed that the E. densa influences on the O2 concentration in the water leading to oversaturation.
E. densa has the ability to recovery O2 content in wastewater through the ongoing photosynthesis process. The recovery degree and rate depend on the initial wastewater degree of dilution.
Released of O2 by E. densa to wastewater had a positive effect on the microbial wastewater treatment efficiency which depended on the initial wastewater dilution degree. The highest treatment efficiency was obtained in a system with a 25% wastewater concentration (43.6% for COD, 52.9% for Ntotal and 14.9% for P-PO4).
The determined OTC of E. densa varied between 3.19 and 8.34 (mg O2 L−1 h−1.g w.m.−1), and was significantly related to wet plants’ mass in the aquatic system.
The wet E. densa mass 30 (g w.m.) has been identified as a limiting value above which the increase in plant content in water does not increase the efficiency of oxygen input per unit weight of plants.
The determined linear and non-linear dependences may be used for modeling and controlling the functioning of CW with submerged plants.
Further research on building the holistic model of CW with submerged plants performance, including the influence of wastewater temperature, pH, turbidity, the concentration of particular pollutants, development of microorganisms’ populations, should be continued.
Author Contributions
Conceptualization, A.B. and P.M.; methodology, A.B.; validation, G.P., P.M.; investigation, A.B.; resources, A.B., K.S.; data curation, K.S.; A.B.; writing—original draft preparation, A.B., K.S.; writing—review and editing, A.B.; K.S.; G.P.; P.M.; visualization, A.B., K.S., supervision, P.M., G.P.
Funding
The publication is financed under the program of the Minister of Science and Higher Education “Strategy of Excellence—University of Research” in 2018–2019, project number 0019/SDU/2018/18, in the amount of PLN 700000.
Conflicts of Interest
The authors declare no conflict of interest.
References
- Vymazal, J. The use of hybrid constructed wetlands for wastewater treatment with special attention to nitrogen removal: A review of a recent development. Water Res. 2013, 47, 4795–4811. [Google Scholar] [CrossRef] [PubMed]
- Vymazal, J. Plants used in constructed wetlands with horizontal subsurface flow: A review. Hydrobiologia 2011, 674, 133–156. [Google Scholar] [CrossRef]
- Wu, H.; Zhang, J.; Ngo, H.H.; Guo, W.; Hu, Z.; Liang, S.; Fan, J.; Liu, H. A review on the sustainability of constructed wetlands for wastewater treatment: Design and operation. Bioresour. Technol. 2015, 175, 594–601. [Google Scholar] [CrossRef] [PubMed]
- Wu, H.; Zhang, J.; Li, C.; Fan, J.; Zou, Y. Mass balance study on phosphorus removal in constructed wetland microcosms treating polluted river water. Clean-Soil Air Water 2013, 41, 844–850. [Google Scholar] [CrossRef]
- Wu, H.; Zhang, J.; Wei, R.; Liang, S.; Li, C.; Xie, H. Nitrogen transformations and balance in constructed wetlands for slightly polluted river water treatment using different macrophytes. Environ. Sci. Pollut. Res. 2013, 20, 443–451. [Google Scholar] [CrossRef]
- Zhang, X.; Hu, Y.; Liu, Y.; Chen, B. Arsenic uptake, accumulation and phytofiltration by duckweed (Spirodela polyrhiza L.). J. Environ. Sci. 2011, 23, 601–606. [Google Scholar] [CrossRef]
- Reddy, K.R. Fate of nitrogen and phosphorus in a waste-water retention reservoir containing aquatic macrophytes. J. Environ. Qual. 2003, 12, 137–141. [Google Scholar] [CrossRef]
- Meng, P.; Pei, H.; Hu, W.; Shao, Y.; Li, Z. How to increase microbial degradation in constructed wetlands: Influencing factors and improvement measures. Bioresour. Technol. 2014, 157, 316–326. [Google Scholar] [CrossRef]
- Wu, S.; Kuschk, P.; Brix, H.; Vymazal, J.; Dong, R. Development of constructed wetlands in performance intensifications for wastewater treatment: A nitrogen and organic matter targeted review. Water Res. 2014, 57, 40–55. [Google Scholar] [CrossRef] [PubMed]
- Reed, S.C.; Middlebrooks, E.J.; Crites, R.W. Natural Systems for Waste Management and Treatment; McGraw-Hill Book Company: New York, NY, USA, 1988. [Google Scholar]
- Keskinkan, O. Investigation of heavy metal removal by a submerged aquatic plant (Myriophyllum spicatum) in a batch system. Asian J. Chem. 2005, 17, 1507–1517. [Google Scholar]
- Reddy, K.R.; D’Angelo, E.M.; DeBusk, T.A. Oxygen transport through aquatic macrophytes: the role in wastewater treatment. J. Environ. Qual. 1989, 19, 261–267. [Google Scholar] [CrossRef]
- Moshiri, G.A. Constructed Wetlands for Water Quality Improvement. In Constructed Wetlands for Water Quality Improvement; Lewis Publishers: Bocca Raton, FL, USA, 1993; ISBN 9780873715508. [Google Scholar]
- Brix, H.; Schierup, H. The use of aquatic macrophytes in water-pollution control. Ambio 1989, 18, 100–107. [Google Scholar]
- Rai, U.N.; Sinha, S.; Tripathi, R.D.; Chandra, P. Wastewater treatability potential of some aquatic macrophytes: Removal of heavy metals. Ecol. Eng. 1995, 5, 5–12. [Google Scholar] [CrossRef]
- Goulet, R.R.; Lalonde, J.D.; Munger, C.; Dupuis, S.; Dumont-Frenette, G.; Prémont, S.; Campbell, P.G.C. Phytoremediation of effluents from aluminum smelters: A study of Al retention in mesocosms containing aquatic plants. Water Res. 2005, 39, 2291–2300. [Google Scholar] [CrossRef] [PubMed]
- Fritioff, Å.; Greger, M. Uptake and distribution of Zn, Cu, Cd, and Pb in an aquatic plant Potamogeton natans. Chemosphere 2006, 63, 220–227. [Google Scholar] [CrossRef]
- Lesage, E.; Mundia, C.; Rousseau, D.P.L.; Van de Moortel, A.M.K.; Du Laing, G.; Meers, E.; Tack, F.M.G.; De Pauw, N.; Verloo, M.G. Sorption of Co, Cu, Ni and Zn from industrial effluents by the submerged aquatic macrophyte Myriophyllum spicatum L. Ecol. Eng. 2007, 30, 320–325. [Google Scholar] [CrossRef]
- Gallon, C.; Munger, C.; Prémont, S.; Campbell, P.G.C. Hydroponic study of aluminum accumulation by aquatic plants: Effects of fluoride and pH. Water. Air. Soil Pollut. 2004, 153, 135–155. [Google Scholar] [CrossRef]
- Abu Bakar, A.F.; Yusoff, I.; Fatt, N.T.; Othman, F.; Ashraf, M.A. Arsenic, zinc, and aluminium removal from gold mine wastewater effluents and accumulation by submerged aquatic plants (Cabomba piauhyensis, Egeria densa, and Hydrilla verticillata). Biomed. Res. Int. 2013, 1–7. [Google Scholar] [CrossRef] [PubMed]
- Ng, W.J.; Sim, T.S.; Ong, S.L.; Kho, K.; Ho, L.M.; Tay, S.H.; Goh, C.C. The effect of Elodea densa on aquaculture water quality. Aquaculture 1990, 84, 267–276. [Google Scholar] [CrossRef]
- Yarrow, M.; Marin, V.H.; Finlayson, C.; Tironi, A.; Delgado, L.E.; Fisher, F. The ecology of Egeria densa Planchon (Liliopsida: Alismatales): A wetland ecosystem engineer? Rev. Chil. Hist. Nat. 2009, 82, 299–313. [Google Scholar] [CrossRef]
- Darrin, H. Invasive species of the Pacific Northwest: Brazilian Elodea, Egeria densa, Anacharis, Philotria densa, Giant Elodea, Brazilian waterweed. 2009. Available online: http://depts.washington.edu/oldenlab/wordpress/wp-content/uploads/2013/03/Egeria-densa_Darrin.pdf (accessed on 12 March 2019).
- Mjelde, M.; Lombardo, P.; Berge, D.; Johansen, S.W. Mass invasion of non-native Elodea canadensis Michx. in a large, clear-water, species-rich Norwegian lake – impact on macrophyte biodiversity. Ann. Limnol.-Int. J. Limnol. 2012, 48, 225–240. [Google Scholar] [CrossRef]
- Rimac, A.; Stanković, I.; Alegro, A.; Gottstein, S.; Koletić, N.; Vuković, N.; Šegota, V.; Žižić-Nakić, A. The Brazilian elodea (Egeria densa Planch.) invasion reaches Southeast Europe. Bioinvasions Rec. 2018, 7, 381–389. [Google Scholar] [CrossRef]
- Heikkinen, R.; Leikola, N.; Fronzek, S.; Lampinen, R.; Toivonen, H. Predicting distribution patterns and recent northward range shift of an invasive aquatic plant: Elodea canadensis in Europe. BioRisk 2009, 2, 1–32. [Google Scholar] [CrossRef]
- Thiébaut, G.; Gillard, M.; Deleu, C. Growth, regeneration and colonisation of Egeria densa fragments: The effect of autumn temperature increases. Aquat. Ecol. 2016, 50, 175–185. [Google Scholar] [CrossRef]
- Hussner, A.; van Dam, H.; Vermaat, J.E.; Hilt, S. Comparison of native and neophytic aquatic macrophyte developments in a geothermally warmed river and thermally normal channels. Fundam. Appl. Limnol. 2014, 185, 155–165. [Google Scholar] [CrossRef]
- Barnes, M.A.; Jerde, C.L.; Keller, D.; Chadderton, W.L.; Howeth, J.G.; Lodge, D.M. Viability of aquatic plant fragments following desiccation. Invasive Plant Sci. Manag. 2013, 6, 320–325. [Google Scholar] [CrossRef]
- Maleva, M.; Borisova, G.; Chukina, N.; Nekrasova, G.; Prasad, M.N.V. Influence of exogenous urea on photosynthetic pigments, 14 CO2 uptake, and urease activity in Elodea densa—environmental implications. Environ. Sci. Pollut. Res. 2013, 20, 6172–6177. [Google Scholar] [CrossRef]
- Grudnik, Z.; Germ, M. Spatial pattern of native species Myriophyllum spicatum and invasive alien species Elodea nuttallii after introduction of the latter one into the Drava River (Slovenia). Biologia (Bratisl). 2013, 68, 202–209. [Google Scholar] [CrossRef]
- Malec, P.; Maleva, M.G.; Prasad, M.N.V.; Strzałka, K. Identification and characterization of Cd-induced peptides in Egeria densa (water weed): Putative role in Cd detoxification. Aquat. Toxicol. 2009, 95, 213–221. [Google Scholar] [CrossRef]
- Bialowiec, A.; Davies, L.; Albuquerque, A.; Randerson, P. Nitrogen removal from landfill leachate in constructed wetlands with reed and willow: Redox potential in the root zone. J. of Env. Manag. 2012, 97, 22–27. [Google Scholar] [CrossRef]
- Rice, E.W.; Baird, R.B.; Eaton, A.D. Standard Methods for the Examination of Water and Wastewater, 23rd ed.; American Public Health Association; American Water Works Association; Water Environment Federation: Washington, DC, USA, 2017; ISBN 9780875532875. [Google Scholar]
- Randerson, P.F.; Moran, C.; Bialowiec, A. Oxygen transfer capacity of willow (Salix viminalis L.). Biomass Bioenerg. 2011, 35, 2306–2309. [Google Scholar] [CrossRef]
- Sorrell, B.K.; Dromgoole, F.I. Oxygen transport in the submerged freshwater macrophyte Egeria densa planch. I. Oxygen production, storage and release. Aquat. Bot 1987, 28, 63–80. [Google Scholar] [CrossRef]
- Carpenter, S.R.; Elser, J.J.; Olson, K.M. Effects of roots of Myriophyllum verticillatum L. on sediment redox conditions. Aquat. Bot. 1983, 17, 243–249. [Google Scholar] [CrossRef]
- Sand-Jensen, K.; Prahl, C.; Stokholm, H. Oxygen release from roots of submerged aquatic macrophytes. Oikos 1982, 38, 349. [Google Scholar] [CrossRef]
- Waters, I.; Armstrong, W.; Thompson, C.; Setter, T.L.; Adkinis, S.; Gibbs, J.G.H. Diurnal changes in radial oxygen loss and ethanol metabolism in roots of submerged and non-submerged rice seedlings. New Phytol. 1989, 113, 439–451. [Google Scholar] [CrossRef]
- Dacey, J.; Klug, M. Tracer studies of gas circulation in Nuphar: 1802 and 14 CO2 transport. Physiol. Plant. 1982, 56, 361–366. [Google Scholar] [CrossRef]
- Christensen, P.B.; Revsbech, N.P.; Sand-Jensen, K. Microsensor analysis of oxygen in the rhizosphere of the aquatic macrophyte Littorella uniflora (L.) Ascherson. Plant Physiol. 1994, 105, 847–852. [Google Scholar] [CrossRef]
- Tanner, C.C.; Clayton, J.S.; Upsdell, M.P. Effect of loading rate and planting on treatment of dairy farm wastewaters in constructed wetlands—I. Removal of oxygen demand, suspended solids and faecal coliforms. Water Res. 1995, 29, 17–26. [Google Scholar] [CrossRef]
- Chazarenc, F.; Maltais-Landry, G.; Troesch, S.; Comeau, Y.; Brisson, J. Effect of loading rate on performance of constructed wetlands treating an anaerobic supernatant. Water Sci. Technol. 2007, 56, 23–29. [Google Scholar] [CrossRef] [PubMed]
- Mæhlum, T.; Stålnacke, P. Removal efficiency of three cold-climate constructed wetlands treating domestic wastewater: Effects of temperature, seasons, loading rates and input concentrations. Water Sci. Technol. 1999, 40, 273–281. [Google Scholar] [CrossRef]
- Tanner, C.C. Plants as ecosystem engineers in subsurface-flow treatment wetlands. Water Sci. Technol. 2001, 44, 9–17. [Google Scholar] [CrossRef] [PubMed]
- Stein, O.R.; Hook, P.B. Temperature, plants and oxygen: How does season affect constructed wetland performance? J. Environ. Sci. Health 2005, 40, 1331–1342. [Google Scholar] [CrossRef]
- Brix, H. Do macrophytes play a role in constructed treatment wetlands? Water Sci. Technol. 1997, 35, 11–17. [Google Scholar] [CrossRef]
- Albuquerque, A.; Makinia, J.; Pagilla, K. Impact of aeration conditions on the removal of low concentrations of nitrogen in a tertiary partially aerated biological filter. Ecol. Eng. 2012, 44, 44–52. [Google Scholar] [CrossRef]
- Rakocy, J.E.; Allison, R. Evaluation of a closed recirculating system for the culture of Tilapia and aquatic macrophytes. Bio-Eng. Symp. Fish Cult 1981, 296–307. [Google Scholar]
- Kuschk, P.; Wießner, A.; Kappelmeyer, U.; Weißbrodt, E.; Kästner, M.; Stottmeister, U. Annual cycle of nitrogen removal by a pilot-scale subsurface horizontal flow in a constructed wetland under moderate climate. Water Res. 2003, 37, 4236–4242. [Google Scholar] [CrossRef]
- Williams, J.B.; May, E.; Ford, M.G.; Butler, J.E. Nitrogen transformations in gravel bed hydroponic beds used as a tertiary treatment stage for sewage effluents. Water Sci. Technol. 1994, 29, 29–36. [Google Scholar] [CrossRef]
- Vymazal, J. Removal of nutrients in various types of constructed wetlands. Sci. Total Environ. 2007, 380, 1–3. [Google Scholar] [CrossRef]
- Vymazal, J.; Kropfelova, L. Wastewater Treatment in Constructed Wetlands with Horizontal Sub-surface Flow; Springer: Berlin, Germany, 2008; p. 566. [Google Scholar]
- Stottmeister, U.; Wieβner, A.; Kuschk, P.; Kappelmeyer, U.; Kästner, M.; Bederski, O. Effects of plants and microorganisms in constructed wetlands for wastewater treatment. Biotechnol. Adv. 2003, 22, 93–117. [Google Scholar] [CrossRef]
- Knowles, R. Denitrifiers associated with methanotrophs and their potential impact on the nitrogen cycle. Ecol. Eng. 2005, 24, 441–446. [Google Scholar] [CrossRef]
- Yu, X.; Qi, Z.; Zhang, X.; Yu, P.; Liu, B.; Zhang, L.; Fu, L. Nitrogen loss and oxygen paradox in full-scale biofiltration for drinking water treatment. Water Res. 2007, 41, 1455–1464. [Google Scholar] [CrossRef] [PubMed]
- Albuquerque, A.; Oliveira, J.; Semitela, S.; Amaral, L. Influence of bed media characteristics on ammonia and nitrate removal in shallow horizontal subsurface flow constructed wetlands. Bioresour. Technol. 2009, 100, 6269–6277. [Google Scholar] [CrossRef] [PubMed]
- Paredes, D.; Kuschk, P.; Mbwette, T.; Stange, F.; Müller, R.; Köser, H. New aspects of microbial nitrogen transformations in the context of wastewater treatment – A review. Eng. Life Sci. 2007, 7, 13–25. [Google Scholar] [CrossRef]
- Tao, W.; Wang, J. Effects of vegetation, limestone and aeration on nitratation, anammox and denitrification in wetland treatment systems. Ecol. Eng. 2009, 35, 836–842. [Google Scholar] [CrossRef]
- Shipin, O.; Koottatep, T.; Khanh, N.T.T.T.; Polprasert, C. Integrated natural treatment systems for developing communities: Low tech N-removal through the fluctuacting microbial pathways. Water Sci. Technol. 2005, 51, 299–306. [Google Scholar] [CrossRef] [PubMed]
- Randerson, P.F. Constructed wetlands and vegetation filters: An ecological approach to wastewater treatment. Environ. Biotechnol. 2006, 2, 78–79. [Google Scholar]
- Kemp, W.M.; Murray, L. Oxygen release from roots of the submersed macrophyte Potamogeton perfoliatus L.: Regulating factors and ecological implications. Aquat. Bot. 1986, 26, 271–283. [Google Scholar] [CrossRef]
Figure 1.
The changes in water oxygen saturation in a system with and without (control) E. densa in water during 4 days of the experiment (periods of nighttime—without measurement—marked as grey zones).
Figure 1.
The changes in water oxygen saturation in a system with and without (control) E. densa in water during 4 days of the experiment (periods of nighttime—without measurement—marked as grey zones).

Figure 2.
Net oxygen amount dAw introduced into the water by E. densa in 4 days of analysis (periods of nighttime—without measurements—marked as grey zones).
Figure 2.
Net oxygen amount dAw introduced into the water by E. densa in 4 days of analysis (periods of nighttime—without measurements—marked as grey zones).

Figure 3.
The cumulative net amount of oxygen dAw released into the water by E. densa (periods of nighttime—without measurements—marked as grey zones).
Figure 3.
The cumulative net amount of oxygen dAw released into the water by E. densa (periods of nighttime—without measurements—marked as grey zones).

Figure 4.
The average percentage of oxygen saturation of wastewater solutions (0, 25, 50, and 100%) with and without (control) E. densa within 3 days of analyzes (periods of nighttime—without measurements—marked as grey zones.
Figure 4.
The average percentage of oxygen saturation of wastewater solutions (0, 25, 50, and 100%) with and without (control) E. densa within 3 days of analyzes (periods of nighttime—without measurements—marked as grey zones.

Figure 5.
The net amount of oxygen dAw introduced into wastewater solutions (0, 25, 50, and 100%) by E. densa (periods of nighttime—without measurements—marked as grey zones).
Figure 5.
The net amount of oxygen dAw introduced into wastewater solutions (0, 25, 50, and 100%) by E. densa (periods of nighttime—without measurements—marked as grey zones).

Figure 6.
The net cumulative amount of oxygen dAw introduced into wastewater solutions (0, 25, 50, and 100%) by E. densa (periods of nighttime—without measurements—marked as grey zones).
Figure 6.
The net cumulative amount of oxygen dAw introduced into wastewater solutions (0, 25, 50, and 100%) by E. densa (periods of nighttime—without measurements—marked as grey zones).

Figure 7.
The mean values (with standard deviation) of the chemical oxygen demand (COD), NTotal, and P-PO4 removal efficiency in relation to wastewater concentration (25, 50, 100%) in systems with and without (control) E. densa.
Figure 7.
The mean values (with standard deviation) of the chemical oxygen demand (COD), NTotal, and P-PO4 removal efficiency in relation to wastewater concentration (25, 50, 100%) in systems with and without (control) E. densa.

Figure 8.
The correlation between oxygen transfer capacity (OTC) and wet plants mass. The parameters of linear regression analysis (regression coefficient, intercept, R2—determination coefficient, p—calculated probability, standard errors of regression coefficient and intercept) were given.
Figure 8.
The correlation between oxygen transfer capacity (OTC) and wet plants mass. The parameters of linear regression analysis (regression coefficient, intercept, R2—determination coefficient, p—calculated probability, standard errors of regression coefficient and intercept) were given.

Figure 9.
The correlation between oxygen transfer capacity per wet plants mass unit and wet plants mass. The statistical parameters of non-linear regression analysis (regression coefficient, intercept, R2-determination coefficient, p—calculated probability, standard errors of regression coefficient and intercept) were given.


Table 1.
The dimensional characteristic of used plants of E. densa: wet mass (g w.m.), length (cm), plants wet mass to length ratio (g w.m. cm−1).
Table 1.
The dimensional characteristic of used plants of E. densa: wet mass (g w.m.), length (cm), plants wet mass to length ratio (g w.m. cm−1).
| Bottle Number | Plant Wet Mass | Plant Length | Plants Wet Mass to Length Ratio |
|---|---|---|---|
| g w.m. | cm | g w.m. cm−1 | |
| 1 | 6.0 | 36.0 | 0.167 |
| 2 | 5.5 | 34.0 | 0.162 |
| 3 | 5.5 | 29.2 | 0.188 |
| 4 | 5.5 | 38.0 | 0.145 |
| 5 | 6.0 | 36.0 | 0.167 |
| 6 | 6.0 | 37.0 | 0.162 |
| 7 | 5.5 | 33.8 | 0.163 |
| 8 | 6.5 | 38.0 | 0.171 |
| 9 | 5.0 | 36.2 | 0.138 |
| 10 | 5.0 | 36.0 | 0.139 |
| 11 | 4.5 | 35.0 | 0.129 |
| 12 | 3.5 | 30.5 | 0.115 |
| 13 | 6.0 | 36.2 | 0.166 |
| 14 | 6.5 | 33.5 | 0.194 |
| 15 | 5.0 | 33.0 | 0.152 |
| 16 | 3.5 | 34.0 | 0.103 |
| 17 | 6.0 | 37.0 | 0.162 |
| 18 | 5.0 | 38.7 | 0.129 |
| 19 | 4.5 | 36.5 | 0.123 |
| 20 | 7.0 | 36.0 | 0.194 |
| Sum | 108.0 | 704.6 | - |
| Average | 5.4 ± 0.93 | 35.2 ± 2.42 | 0.153 ± 0.026 |
| Coefficient of variation | 0.17 | 0.07 | 0.166 |
Table 2.
The configuration of stage II of research.
| Bottle Number | Plant Number (Table 1) | Wastewater Concentration |
|---|---|---|
| 1′ | 1; 2 | 100% |
| 2′ | 3; 4 | 50% |
| 3′ | 6; 11 | 25% |
| 4′ | 7; 8 | 0% |
| 5′ | 9; 10 | 100% |
| 6′ | 12; 19 | 50% |
| 7′ | 13; 14 | 25% |
| 8′ | 16; 17 | 0% |
| 9′ | - | 100% |
| 10′ | - | 50% |
| 11′ | - | 25% |
| 12′ | - | 0% |
Table 3.
Biomass growth of E. densa in systems with different wastewater concentration (0, 25, 50, 100%).
Table 3.
Biomass growth of E. densa in systems with different wastewater concentration (0, 25, 50, 100%).
| Concentration | Biomass Growth (mg w.m) |
|---|---|
| 100% | 2.6 |
| 50% | 3.75 |
| 25% | 5.25 |
| 0% | 2.2 |
| Average | 3.45 |
| Standard deviation | ±1.37 |
| Coefficient of variation | 0.40 |
© 2019 by the authors. Licensee MDPI, Basel, Switzerland. This article is an open access article distributed under the terms and conditions of the Creative Commons Attribution (CC BY) license (http://creativecommons.org/licenses/by/4.0/).
Share and Cite
MDPI and ACS Style
Białowiec, A.; Sobieraj, K.; Pilarski, G.; Manczarski, P. The Oxygen Transfer Capacity of Submerged Plant Elodea densa in Wastewater Constructed Wetlands. Water 2019, 11, 575. https://doi.org/10.3390/w11030575
AMA Style
Białowiec A, Sobieraj K, Pilarski G, Manczarski P. The Oxygen Transfer Capacity of Submerged Plant Elodea densa in Wastewater Constructed Wetlands. Water. 2019; 11(3):575. https://doi.org/10.3390/w11030575
Chicago/Turabian StyleBiałowiec, Andrzej, Karolina Sobieraj, Grzegorz Pilarski, and Piotr Manczarski. 2019. "The Oxygen Transfer Capacity of Submerged Plant Elodea densa in Wastewater Constructed Wetlands" Water 11, no. 3: 575. https://doi.org/10.3390/w11030575
Note that from the first issue of 2016, this journal uses article numbers instead of page numbers. See further details here.