Development of Multi-Objective Optimal Redundant Design Approach for Multiple Pipe Failure in Water Distribution System


1
Research Center for Disaster Prevention Science and Technology, Korea University, Anamdong, Seongbukgu, Seoul 136-713, Korea
2
School of Civil, Environmental and Architectural Engineering, Korea University, Anamdong, Seongbukgu, Seoul 136-713, Korea
*
Author to whom correspondence should be addressed.
Water 2019, 11(3), 553; https://doi.org/10.3390/w11030553
Submission received: 17 January 2019
/
Revised: 10 March 2019
/
Accepted: 13 March 2019
/
Published: 17 March 2019
(This article belongs to the Special Issue Resilient and Robust Water Distribution Systems: State-of-the-Art and Research Challenges)
Abstract
:This study proposes a multi-objective optimal design approach for water distribution systems, considering mechanical system redundancy under multiple pipe failure. Mechanical redundancy is applied to the system’s hydraulic ability, based on the pressure deficit between the pressure requirements under abnormal conditions. The developed design approach shows the relationships between multiple pipe failure states and system redundancy, for different numbers of pipe-failure conditions (e.g., first, second, third, …, tenth). Furthermore, to consider extreme demand modeling, the threshold of the demand quantity is investigated simultaneously with multiple pipe failure modeling. The design performance is evaluated using the mechanical redundancy deficit under extreme demand conditions. To verify the proposed design approach, an expanded version of the well-known benchmark network is used, configured as an ideal grid-shape, and the multi-objective harmony search algorithm is used as the optimal design approach, considering construction cost and system mechanical redundancy. This optimal design technique could be used to propose a standard for pipe failure, based on factors such as the number of broken pipes, during failure condition analysis for redundancy-based designs of water distribution systems.
1. Introduction
Recently, the paradigm of water distribution systems (WDSs) design has changed from a minimum cost design, which satisfies standard hydraulic conditions such as minimum node pressure and maximum pipe velocity, to a design concept that considers system resilience to cope with uncertain future system conditions. Conventionally, trial-and-error approaches from an engineering perspective have been used for the design of WDSs. However, such approaches do not guarantee that the derived design solutions will be optimal or near-optimal. Alternatively, mathematical approaches have been used for the optimal design of WDSs [1,2,3,4,5,6,7,8,9,10]. However, most of these (e.g., linear programming, non-linear programming, and dynamic programming) have some limitations in terms of the domain of feasible solutions, flow direction of pipes, and non-linear relation energy Equation [11,12,13]. The aforementioned problems reduce the quality of optimal solutions, with an impact on the real-world applications of WDSs.
To overcome the problems of traditional and mathematical approaches, simulation-based meta-heuristic algorithms have been developed and applied to the design of WDSs [13,14,15,16,17,18].
Early designs of WDSs using metaheuristic algorithms optimized only a single design factor, such as the system construction cost (CC) [14,19]. However, such designs make the resulting WDSs very vulnerable to uncertain future conditions, and cannot guarantee system resilience. Recently, owing to urbanization and growing populations, WDSs have become larger, network complexity has increased, and water supply regulations have been strengthened. The expansion of WDSs has led to changes in demand, with consequent damage to system components due to overloading of existing systems. Moreover, there have been changes in water users’ awareness regarding WDSs; this has shifted the focus from supplying adequate amounts of water to ensuring resilient WDSs that can supply the appropriate amount of water reliably. For this reason, aspects of system performance such as resilience, redundancy, and robustness have been emphasized in recent work on the design and operation of WDSs.
As stated above, system resilience is essential for modern WDSs; however, it is necessary to distinguish appropriately the various types of resilience that are used in engineering fields. System resilience can be characterized into the following three essential types: attribute-based, performance-based, and technology-based resilience [20,21,22,23,24]. Attribute-based resilience, also called general resilience, refers to a state of the system that enables it to limit the duration and magnitude of a failure caused by any threat (i.e., all hazards). This resilience concerns the total system, is generally descriptive in nature, and can be considered as a set of design principles (e.g., the degree of interconnectedness or duplication). Performance-based resilience refers to the total system performance under a failure condition based on a particular threat. Typically, performance-based resilience describes the quantitative standard with reference to an operational goal. Technology-based resilience refers to equipment that can improve the preparedness of the user for extreme events, and the ability of the equipment to cope with system failure. It is important to determine the degree to which the various system resilience types are required; therefore, a detailed understanding of the total system resilience is necessary.
Among these resilience categories, attribute-based resilience in WDSs can be classified into four subcategories (i.e., redundancy, robustness, rapidity, and resourcefulness) according to the specific event conditions [24]. Redundancy can be described as the ability to provide an alternative to prevent extreme damage in response to interference factors. To improve redundancy, WDSs comprise a double pipeline or looped system. In particular, in the WDSs design process, the determination of the pipe diameter and network configuration is the most efficient way to improve system redundancy. In addition, it is necessary to determine an efficient pipe layout in order to improve system redundancy, in order to maintain user serviceability in the event of system failures caused by various factors (e.g., pipe breakage or leakage).
System failure analysis (i.e., risk analysis) is a traditional approach to the relationships between system failure events and their impact but cannot be used to defend against unknown threats [25]. In the case of WDSs, the system failure might result from various physical (e.g., damage to pipes by underground construction or earthquakes) or non-physical (e.g., the water hammer effect or pumping system failure) threats. An efficient way to overcome this problem is to focus on the system and to consider all possible failure modes, rather than speculating on all possible threats [26]. A system failure simulation includes various failure scenarios such as single-pipe failure, multiple-pipe failure, and potential failure, which can be generated from every combination of pipe failure that could occur in the network. Each event can be varied in magnitude from 0% to 100% pipe failure; depending on the failure level, the system damage will be very different. For example, threats with low probability (e.g., the Canadian snowstorm in 1998, the North American blackout in 2003, and the earthquake followed by a tsunami in Japan 2011) [27] occur occasionally but might cause serious damage. Therefore, to design WDSs considering system failure, multiple/potential failure events should be considered, including low-probability threats.
Several studies have considered the single pipe-failure condition in which WDSs are most vulnerable from the system operation and maintenance perspectives. Berardi et al. [28] applied an evolutionary algorithm to identify scenarios that involve a minimum fraction of failed pipes and yet result in maximum shortage of WDSs (e.g., isolation of connections to all water sources). For the same purpose, Kanta [29], Bristow et al. [30], and Kanta and Brumbelow [31] studied pipe failure modes during firefighting and identified the maximum strain. In addition, in the WDSs design field, several studies have addressed the concepts of resilience or reliability by considering an abnormal situation, in order to prepare for uncertain future conditions. The representative approach applied in these studies is the minimum cut-set method, which simulates an abnormal condition such as pipe failure. This method, which uses a model developed for reliability estimation, provides more accurate estimates of efficient reliability than other reliability estimation models (e.g., the reliability of a steady-state condition). The minimum cut-set method can be used to determine the mechanical system redundancy under at least one pipe-failure condition. Based on this pipe-failure condition, the redundancy is determined according to specific problems (i.e., water cut-off or pressure drop) at each node. Billinton and Allan [32], Ross [33], and Su et al. [5] introduced a failure-mode approach to estimate the reliability of WDSs. With this approach, the generated failure combinations might require significant computational time. However, the reliability error increases when the probability of simultaneous fracture is ignored in order to reduce the computational complexity of several minimum cut-set combinations.
To overcome these disadvantages, Mays [34] reduced the error in reliability calculations by estimating the system reliability with the minimum cut-set method, termed the success-mode approach. Su et al. [5] defined a cut-set as a set of components that cause an anomalous state in several nodes in WDSs. Therefore, if at least one of the defined cut-sets is in a failure state, then at least one node in the WDSs is in an abnormal condition.
In recent work, system redundancy indices (i.e., topological, mechanical, and hydraulic redundancy) were applied under abnormal conditions, and the relationships between the network configuration and each redundancy factor were identified using statistical models (e.g., the Pearson and Spearman rank techniques) [35,36]. Cimorelli et al. [37] demonstrated the resilience-based design of WDSs with limited CC, and showed that resilience was correlated to system reliability by post-verification accounting of the obtained solutions under pipe-failure conditions. Jung and Kim [38] considered two redundancy measures (i.e., topological and mechanical redundancies) and system CC in the design of WDSs, proposed a multivariate linear reliability model of the Pareto front, and analyzed the correlation between two Pareto-optimal solutions. According to the results, topological redundancy should not be considered in isolation, because it fails to account for system hydraulics or guarantee system performance under condition of uncertain demand or roughness.
Moreover, in previous studies on mechanical redundancy, simulations of abnormal conditions only considered the single-pipe failure state to decrease the computational burden. However, this approach has limitations in simulating large-scale failure events such as earthquakes; hence, there was no attempt made to determine the appropriate failure scale (i.e., the number of broken pipes during failure condition analysis) when considering multiple failure conditions.
Therefore, this study develops a WDSs design approach considering system redundancy under multiple-pipe-failure conditions in a multi-objective framework. The proposed technique shows the relationship between the pipe failure state and system redundancy. In addition, the multi-objective optimal design of WDSs is achieved by considering different pipe failure orders (e.g., first, second, third, …, tenth) and the mechanical redundancy is evaluated by applying fire-flow conditions. To validate the proposed design approach, the design is evaluated using the expanded Grid-1 network which is configured with an ideal grid-shape. This network emphasizes the looped configuration, which is a different layout from that of a real-world network (i.e., branch and looped network), but it is appropriate for verifying the optimal design technique in the case of multiple pipe failure in this study. Moreover, to consider the CC and system mechanical redundancy simultaneously, the multi-objective harmony search (MOHS) algorithm is used for optimization. This optimal design technique suggests a standard scale for pipe failure, such as the number of broken pipes during the failure condition analysis, which can be used for redundancy-based WDSs design.
2. Development of Multi-Objective Optimal Redundant Design Approach
To determine the optimal redundant WDSs design in multiple pipe failure events, system mechanical redundancy was considered as a design factor together with the CC in the multi-objective optimization framework. This design technique was proposed to overcome the limitations of previous studies, which considered only single pipe failure, while minimizing CC and maximizing system redundancy simultaneously provided an appropriate failure scale. The mechanical redundancy deficit under fire-flow conditions was used to evaluate the design’s performance. Moreover, this study aimed to determine the level of extreme demand that should be applied for the performance evaluation of a design, based on sensitivity analysis of various fire-flow volumes. The following subsections describe the design factors and performance measures in detail.
2.1. System Redundancy Considering Multiple Pipe Failures
The system redundancy-based WDSs design approach considers mechanical aspects. Mechanical redundancy refers to the system hydraulic ability (SHA) to provide an acceptable supply of water to customers under various abnormal system conditions. In other words, if the system pressure is greater than or equal to the allowable minimum pressure, then the mechanical redundancy is satisfied across the entire network. However, if it does not meet the system pressure limit, then a pressure deficit is required to calculate the mechanical redundancy. The mechanical redundancy is determined based on the desired quantity of water and is affected by the nodal pressure. If the nodal pressure does not satisfy the required minimum pressure for system failure, then partial demand (not the fixed desired demand) is delivered to customers, and this partial demand caused by the abnormal condition affects the nodal pressure deficit in WDSs. For example, if WDSs experience an abnormal situation, such as pipe breakage or extreme fire-flow conditions, the mechanical redundancy decreases according to the ratio of the pressure deficit.
In this study, SHA [39] was used as a measure of mechanical redundancy. However, the previous SHA only considered single-pipe failures to reflect future conditions. Therefore, this study modified the SHA to consider multiple pipe-failure conditions. To calculate the SHA under such conditions, the number of failure pipes was determined depending on the network size, and multiple pipes were sequentially destroyed. The values of SHAα were calculated as follows:
where SHAα is the SHA of the given optimal design, for the α pipe-failure condition; SHUAk is the system hydraulic unavailability during a pipe break event k; k is the number of multiple pipe break events (k = 1, 2, …, NLCα) (e.g., if k = 1, pipes 1 and 2 are broken simultaneously; if k is 2, pipes 1 and 3 are broken); and α is a failed state such as the first, second, or third.
The system hydraulic unavailability under a pipe failure event was computed using a demand-weighted average of nodal unavailability, as follows:
where HAi,k is the total SHA for node i (i = 1, 2, …, NN) in pipe break event k, qi is the nodal demand for node i, NN is the number of nodes, and NL is the number of pipes. The total SHA (HA) was measured by considering the pressure of each node as well as whether it satisfied the required pressure. If the nodal pressure cannot meet the required pressure, HA decreases depending on the pressure deficit. It can be calculated using a fuzzy function that describes the correlation between HA and the residual pressure [40]. The parameters of this function determine the shape and position of the resulting parameter sensitivity analysis function (μ = 19.9, σ = 5.69).
To consider multiple pipe failures, all pipe failure combinations were simulated by opening and closing sequentially according to the total number of broken pipes, and then repeating this process with the next pipe. This process continues until all possible pipe break events have been evaluated.
2.2. Multi-Objective Optimal Design in Water Distribution System
In this study, the MOHS algorithm was applied as a multi-objective optimization technique, and the mechanical redundancy (SHAα) and CC were considered as design objectives with a tradeoff relationship. Generally, the stability of a system when subjected to disturbances (i.e., pipe breakage or system failure) can be improved by investment, such as installing bigger pipes and pumps or constructing additional tanks. On the other hand, considering only the design costs cannot satisfy uncertain future conditions. Therefore, the Pareto relation between these two objectives was identified and used for marginal cost analysis, final design selection, and investment decisions. In addition, the min/max pressure was used a hydraulic constraint and the fire-flow situation was considered as an extreme demand condition to evaluate the design performance. The following subsections detail the objective functions, constraints, penalty approach, algorithm formulation, and design performance evaluation.
2.2.1. Objective Functions and Hydraulic Constraints
For the multi-objective optimal design of WDSs, the following two objective functions were used: minimize CC and maximize SHAα in Equation (1).
As a first objective, the system CC is the most important and common objective for the design of WDSs. In general, a WDSs design involves determining the most effective set of network configurations, including pipe diameter and layout, satisfying hydraulic constraints. This study used the CC function [41] accounting. The cost function is calculated from the sum of the costs of pipe materials and installations such as base installation, trenching and excavation, embedment, backfill, and compaction costs, as well as the cost of valves, fittings, and hydrants. The objective function can be expressed as follows:
where y is the unit pipe cost ($/ft; 1 ft = 0.3048 m), x is the pipe diameter in inches (1 in. = 2.54 cm), u is the indicator variable, and a, b, c, d, e, and f are component-specific parameter values estimated using regression analyses; Table 1 shows the representative parameters.
In this study, the pressure constraint was considered to be a hydraulic constraint. If the nodal pressure did not satisfy the requirements, a penalty point was applied to each objective function value (e.g., the penalty point was added to the system CC). The penalty point P is given as follows:
where hi is the pressure of node i (m), hmin and hmax are the pressure boundary conditions (m), and P is the penalty point using β and γ. P has a nonzero value only when the maximum and minimum pressure constraints are violated.
2.2.2. Design Performance Evaluation
Applying an extreme demand condition to a normal WDSs is a reasonable way to evaluate the system’s resilience in an abnormal situation. One of the extreme demand conditions, fire flow, frequently occurs in real-world WDSs. Therefore, in the case of fire, the fire-flow demand determines the maximum water quantity per day and the fire water volume per day in Korean WDSs [42]. However, this regulation is considered as a design demand.
In this study, the fire-flow demand was applied as an extreme demand condition for verification of the design performance in an abnormal situation, as follows:
where is the average SHAα deficit on the α-th order failure order.
The fire-flow demand was applied to all demand nodes and the average SHAα deficit was considered to reflect the system performance. If the SHAα deficit of the system was relatively low, it was considered to indicate high mechanical redundancy.
2.2.3. Multi-Objective Harmony Search
This study uses MOHS [43,44], which was developed to consider the characteristics of multi-objective frameworks, such as diversity and convergence, and is a constraint-handling technique suitable for addressing constrained problems efficiently and supporting real coding representations. The search operators of MOHS are the same as those of the harmony search (HS) [15], including random search, memory consideration, and pitch adjustment; and the same parameters are used to find optimal solutions, such as the harmony memory size (HMS), harmony memory considering rate (HMCR), pitch adjusting rate (PAR), and bandwidth (BW). These parameters determine the type of the search operator and adjust the range in the process of generating a new solution. HMCR and PAR are generated between 0 to 1, and, if a uniformly generated value between 0 to 1 is greater than the HMCR, then the MOHS randomly chooses a new decision variable within the possible range. By the same process, the PAR is compared with a uniformly generated random value. If the PAR is smaller, each variable is adjusted to the Bw value within a range of possible values. While HS for single-objective optimization ranks individual solutions with respect to their values for the single-objective function or fitness only (e.g., the total cost of the least costly WDSs design), MOHS considers their non-dominated rank for evaluating solution performance. MOHS uses non-dominated sorting and the crowding distance concept [45] to improve the Pareto-optimal solution’s diversity and convergence. Table 2 presents the pseudo-code for MOHS.
3. Results and Discussion
This study developed a WDSs design approach, considering system redundancy under multiple-pipe-failure conditions in a multi-objective framework. The proposed technique was used to investigate the relationship between the number of pipe failures and mechanical redundancy values under abnormal conditions in WDSs. The technique was also used for the multi-objective optimal design of WDSs considering different orders of pipe failure (e.g., first, second, third, …, tenth), and mechanical redundancy was evaluated by applying fire-flow conditions. To compare the redundancy-based optimal designs of WDSs using mechanical redundancies, the expanded Grid-1 network was used, with MOHS as an optimization technique. For the hydraulic simulation, EPANET [46] was used as a hydraulic solver to check the design constraints and calculate the mechanical redundancy.
3.1. Expanded Grid-1 Network
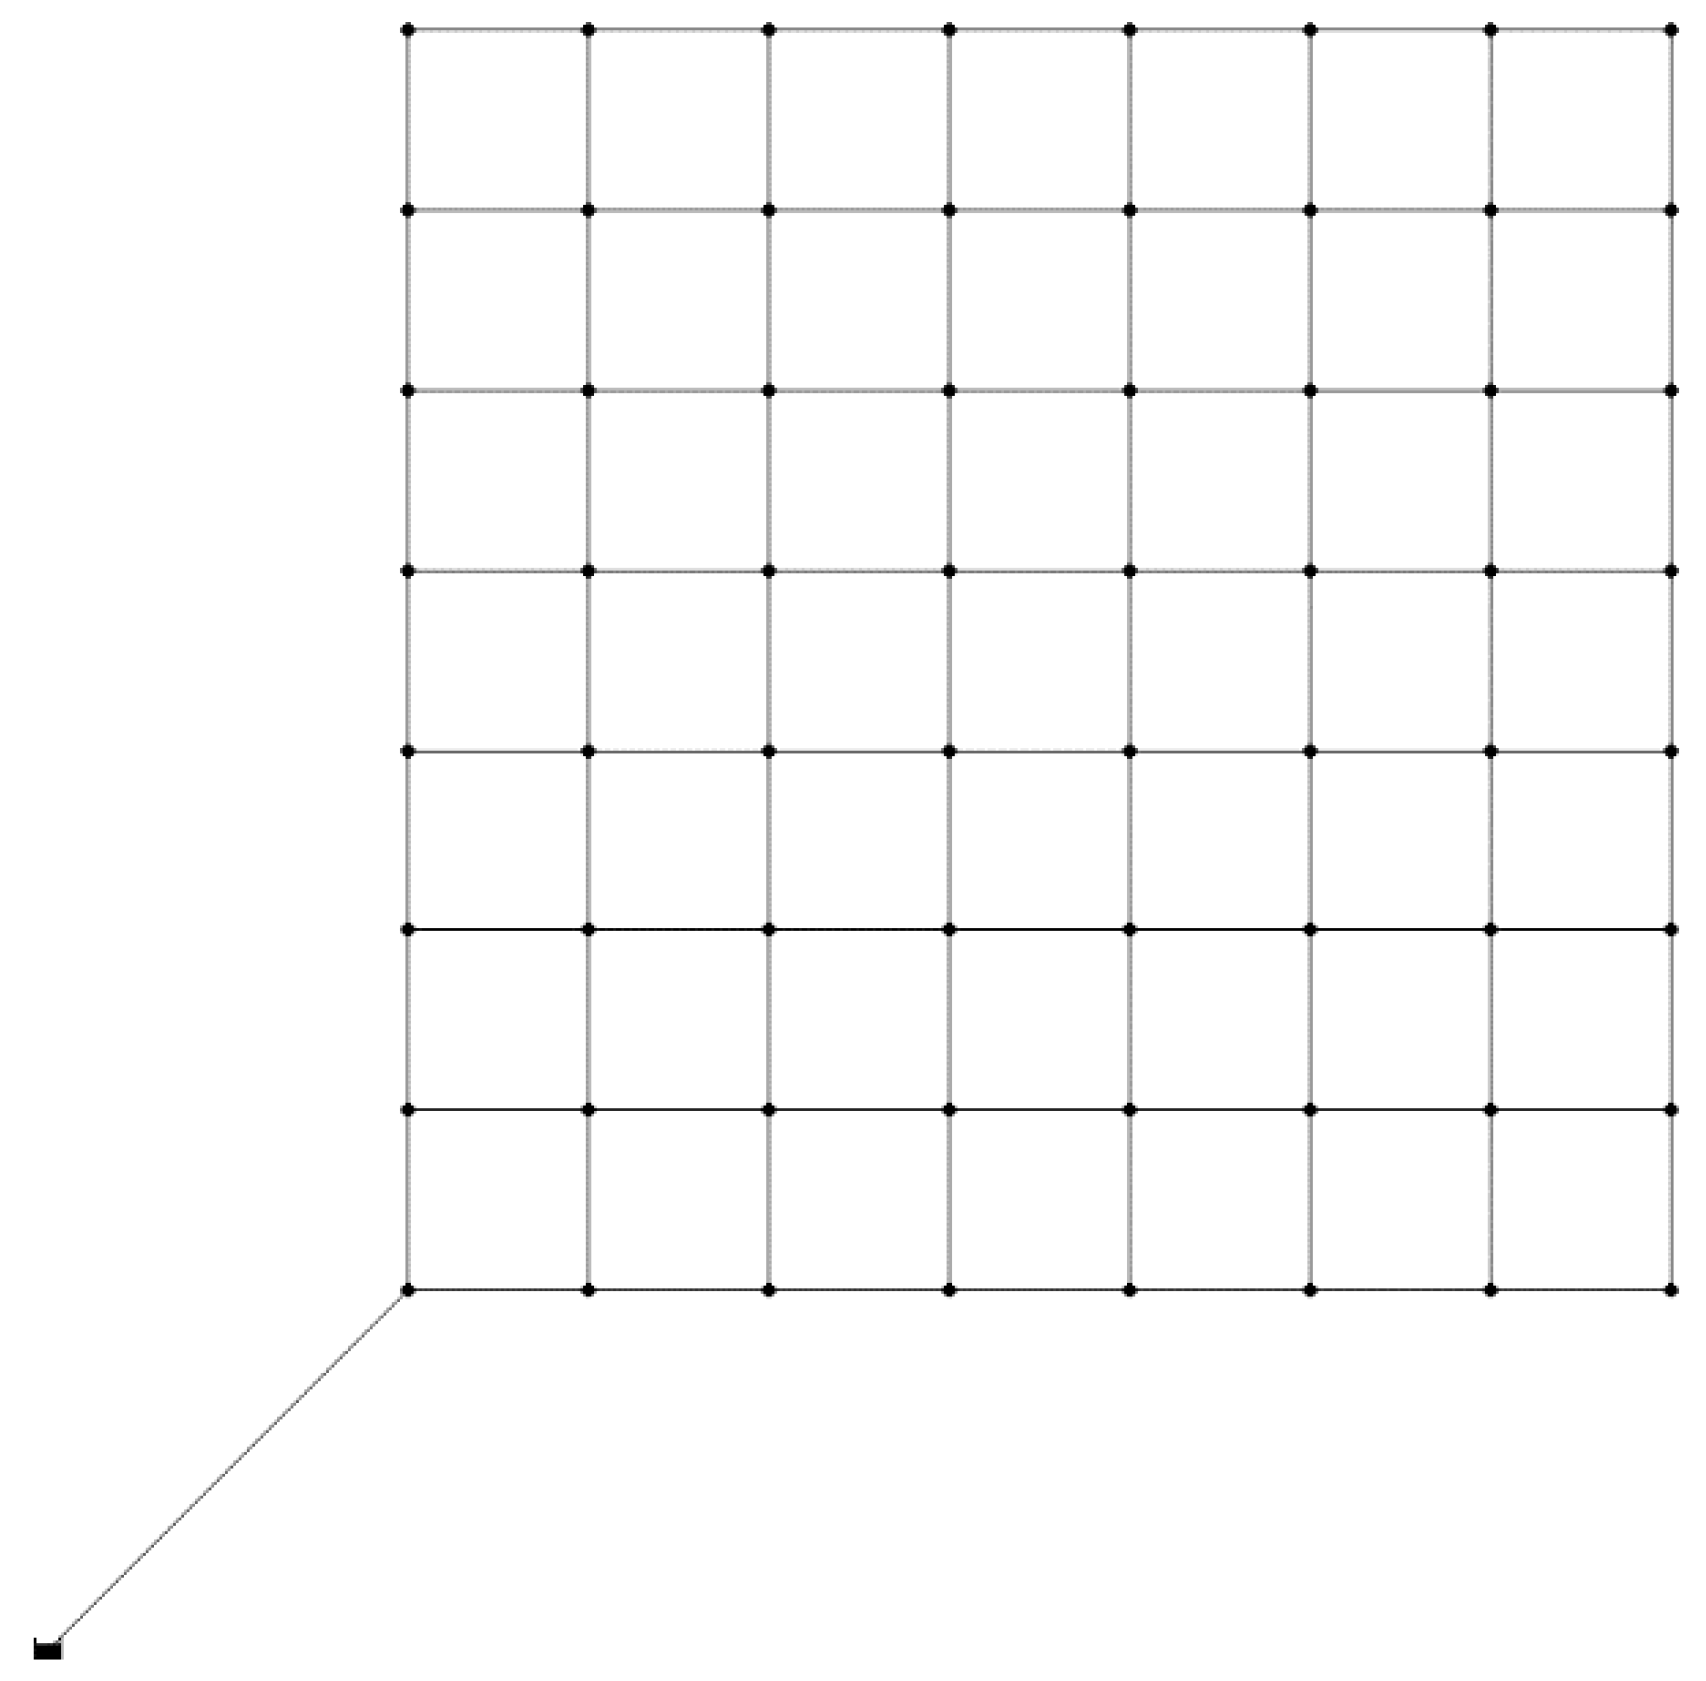
The Grid-1 network was first proposed by Jung et al. [35], and comprised a 5 × 5 network; however, in this study, the network size was increased to 7 × 7 for multiple pipe failure modeling. The network contained 49 closed loops, one reservoir, 64 demand nodes, and 113 pipes. The Hazen–Williams roughness coefficient was 120 for all pipes, and the minimum required pressure was 28.1 m (40 psi) under peak demand conditions. The network layout is shown in Figure 1; the diameter of each pipe was one of the 16 available commercial pipe sizes (50, 100, 200, 300, 400, 500, 600, 700, 800, 900, 1000, 1200, 1400, 1600, 1800, and 2000 mm), or no pipe was determined. Table 1 lists the pipe CC parameters used in Equation (3), which were determined based on the pipe materials and buried soil conditions described by Clark et al. [41].
3.2. Parameter Sensitivity Analysis
This study applied MOHS to the design of WDSs. The general optimization algorithms have their respective parameters, and the appropriate parameter settings increase the optimization performance. In the case of comparison problems, in particular, finding the optimal parameter set is very important to obtain a fair comparison. Therefore, parameter sensitivity analysis was performed before the optimization process. In this study, to ensure higher reliability of the parameter setting run, the sensitivity analysis was performed 50 times independently; the initial solution used was the same as that generated randomly in each independent run. MOHS has three parameters (HMS, HMCR, and PAR). These parameters were varied from 30 to 200, HMCR was varied from 0.7 to 0.95, and PAR was varied from 0.05 to 0.3 at 0.05 intervals. The performance for each result was compared using multi-objective optimization performance indices (i.e., diversity [47], coverage set [48], and hypervolume [49]). Table 3 shows the optimal parameter set according to the sensitivity analysis results.
3.3. Relationship between Mechanical Redundancy and Pipe Failure State
Pipe failure analysis was used to categorize single- and multiple-pipe failures resulting from various causes. Single-pipe failures are caused by incorrect construction by workers during the installation of WDSs and underground structures. However, when considering uncertain future situations such as earthquakes and terrorism, multiple-pipe failures must be taken into account to obtain reliable WDSs designs.
Therefore, in this study, a multi-objective optimal design under multiple pipe-failure conditions was derived, and fire flow was used to verify the SHAα deficit for the performance evaluation of the optimized design in the expanded Grid-1 network. The number of pipe failures was increased from 1 to 10, and the mechanical redundancy was analyzed according to the order of failure. For equitable comparison of different SHAα values based on the failure order, designs considering multiple failures were converted into SHA2 (where the number of pipe failure is two) by considering single failures with Equations (1) and (2).
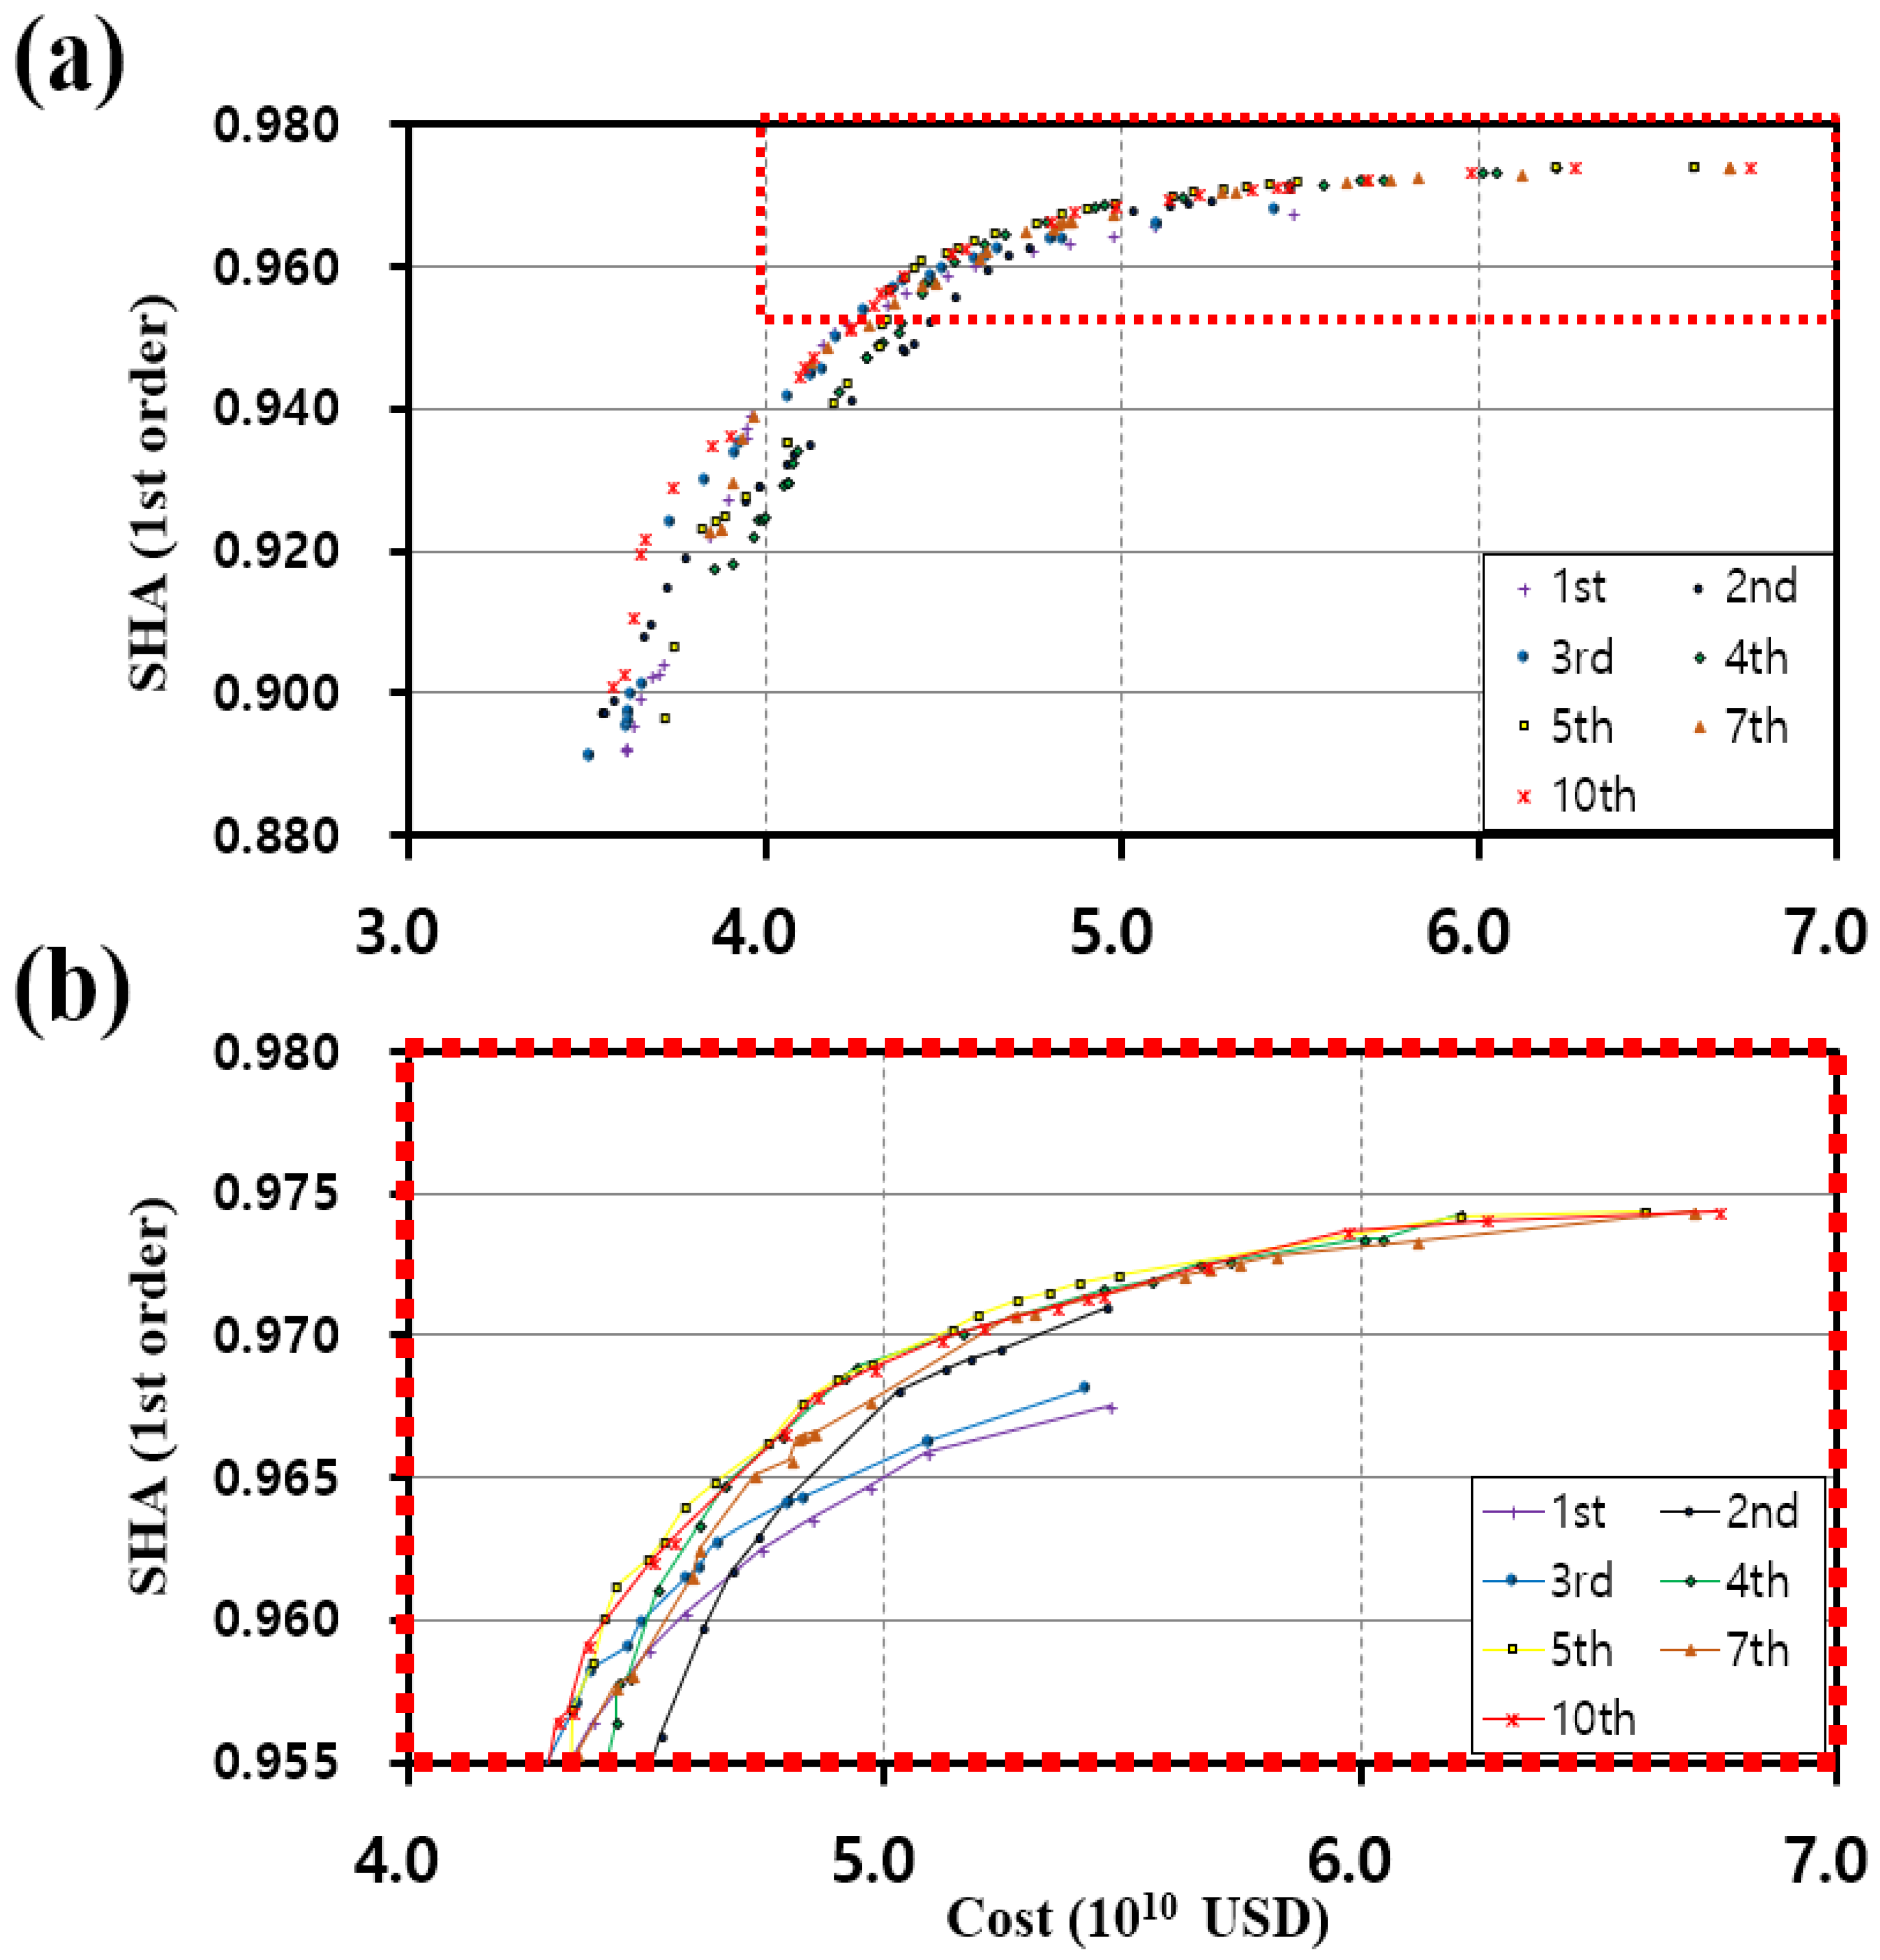
Figure 2a shows the multi-objective optimal design for multiple failures. First, the Pareto-optimal solutions indicated that the SHA of the bulk of the designs increased with CC from 3.5 × 10⁴ to 4.5 × 10⁴ million USD. The increased SHA value of 5.0 × 10⁴ million USD was determined to be the marginal cost. Figure 2b shows an enlarged view of the distribution of solutions around the marginal cost. In this Pareto solution, designs including the fourth-order failure greater could yield a SHA of approximately 0.970–0.975; however, for failures below the fourth order, the SHA was 0.970. These results show that optimal designs up to the third-order failure have limitations when deriving a hydraulically stable design, even if the CC is greater than the marginal cost.
Table 4 presents the results when the design was selected based on marginal costs in the multi-objective optimal design with the Grid-1 network, applying 0.063 cms (1000 gpm) of fire flow to all nodes of each design. The results show that the SHA deficit rate decreased with increasing number of pipe failures, indicating that high failure order designs were more stable, even under abnormal situations such as fire flow. However, as the fire flow considered in this simulation was assumed to represent approximately 15% of the total demand, there was a limit to the quantitative evaluation of the performance when considering multiple failures, because the demand volume required under the actual extreme demand conditions could not be determined. Therefore, the following simulation was used to quantify the performance of the design based on the SHA deficit ratio according to various extreme demand volumes.
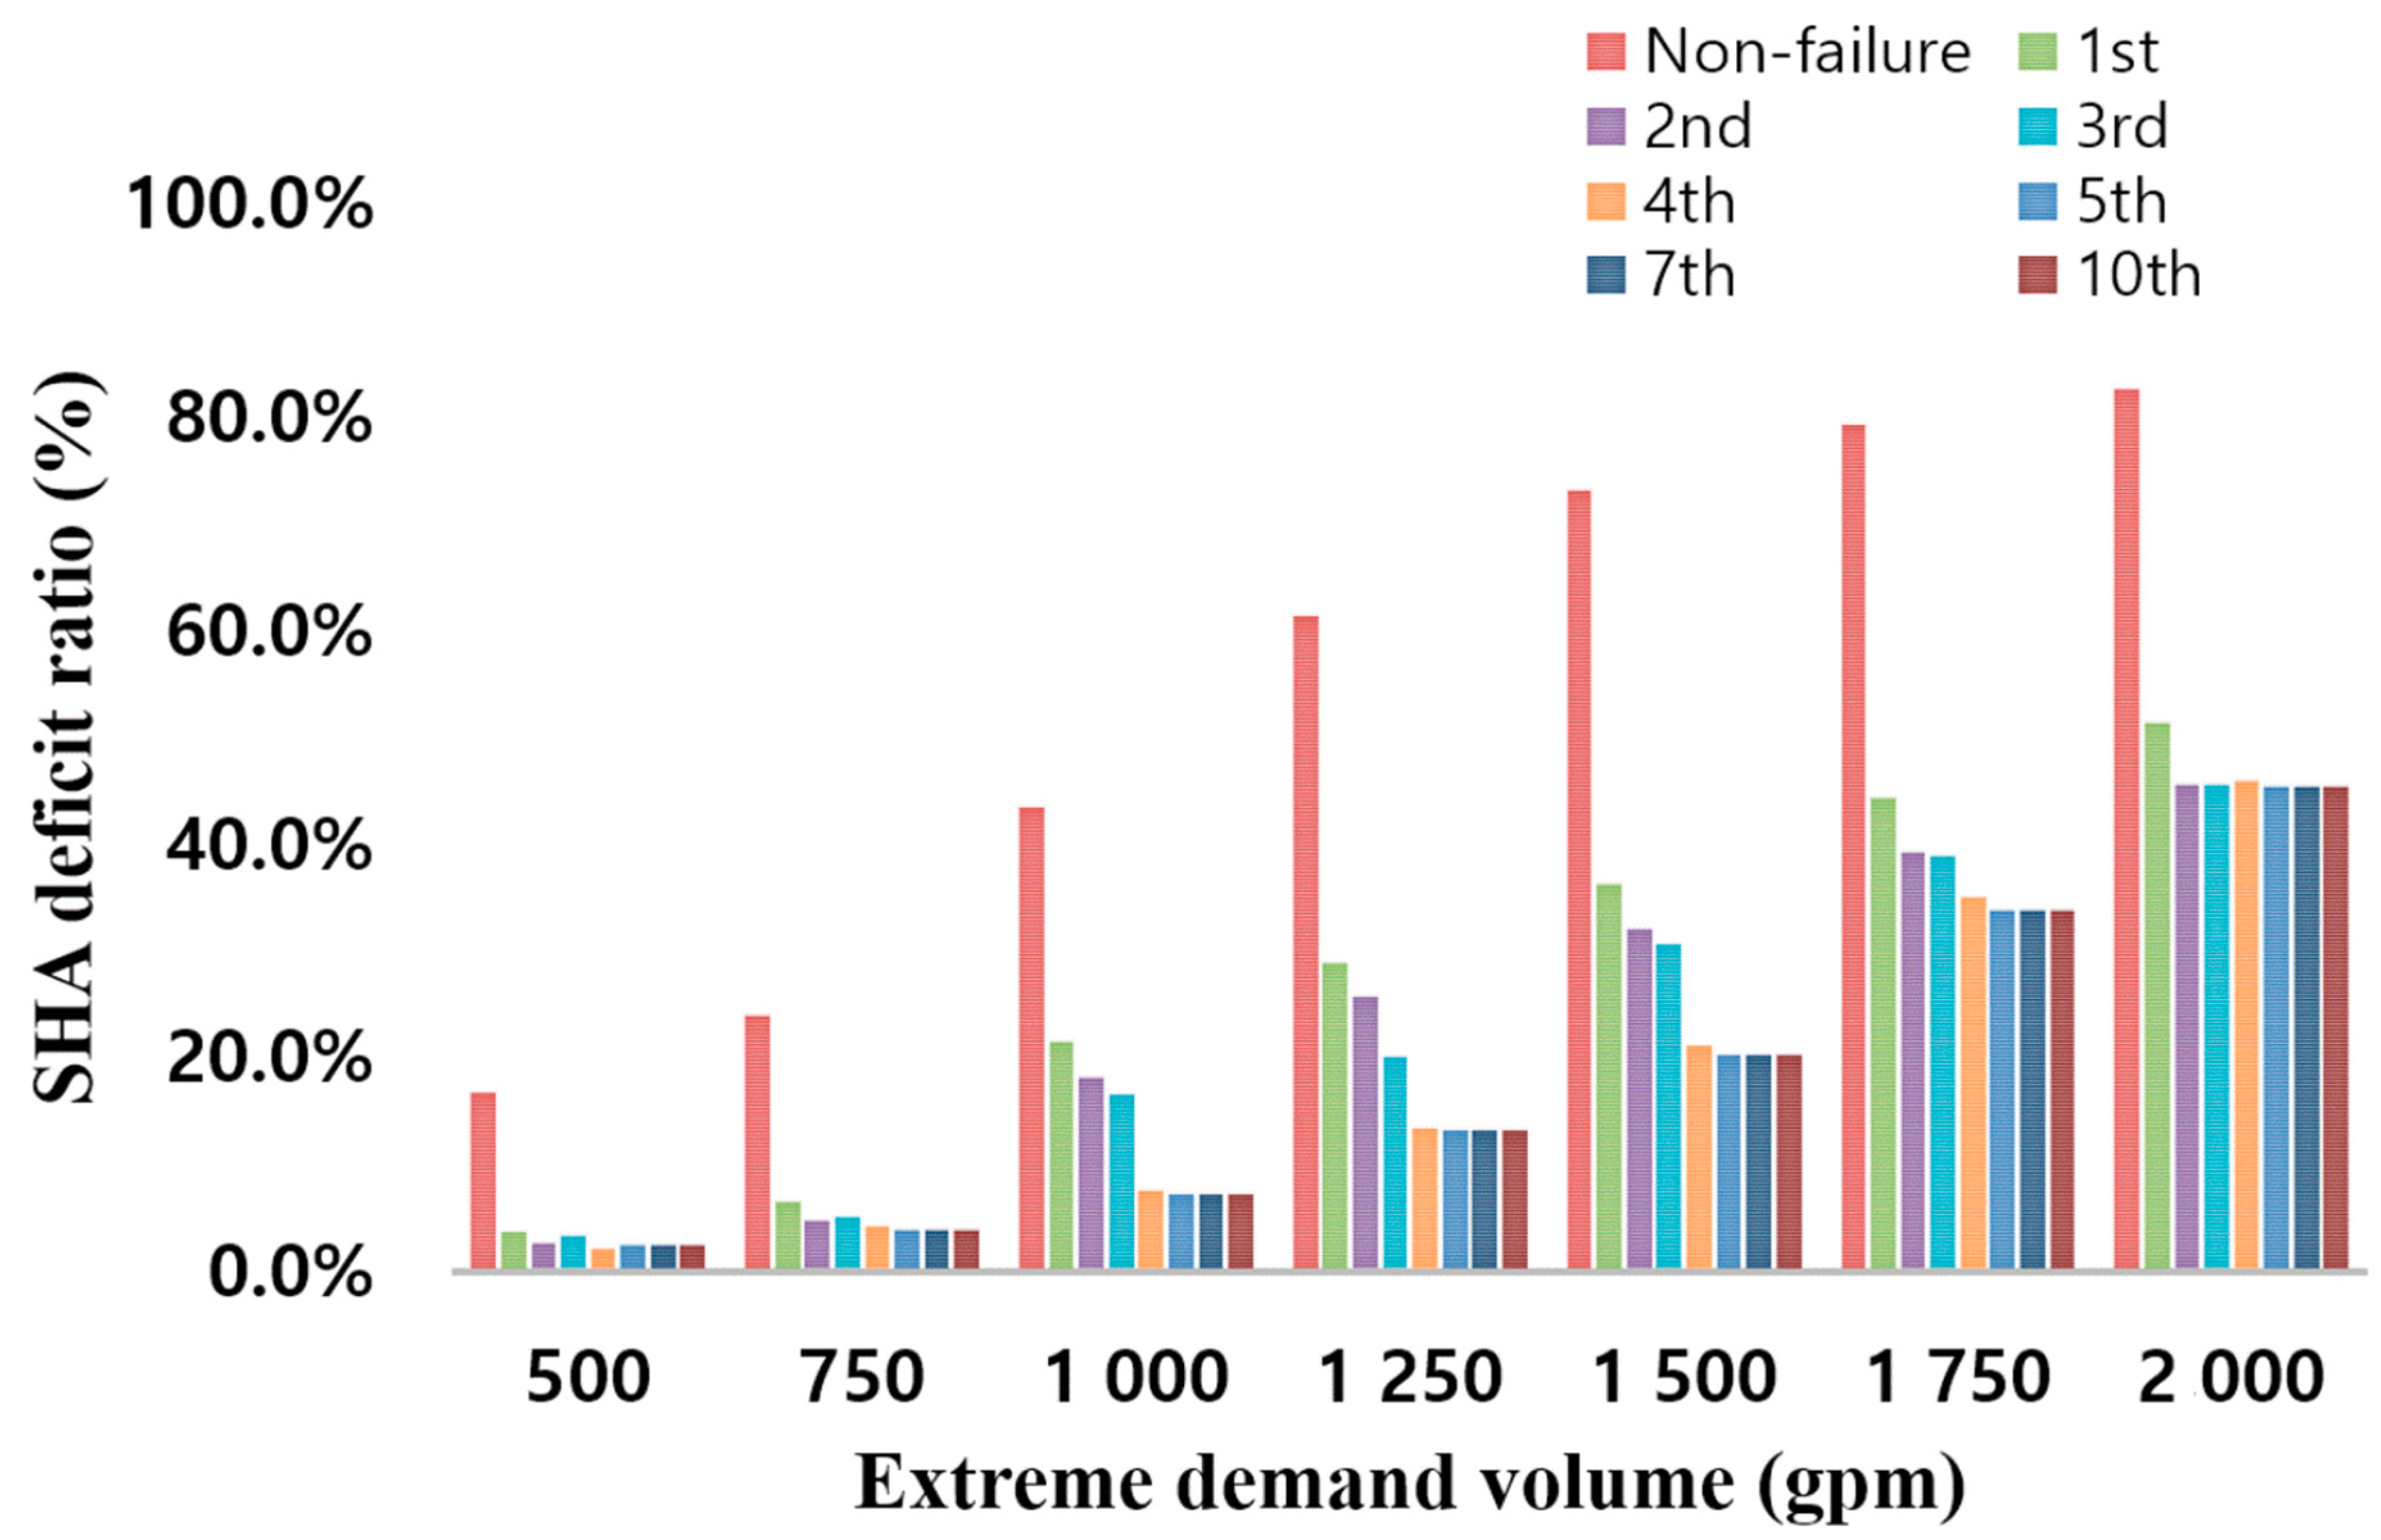
Figure 3 and Table 5 show the hydraulic ability deficit of the mechanical reliability-based design for various extreme demand volumes when simulating an abnormal condition in the WDSs. The applied demand volume was 0.0315–0.126 cms (500–2000 gpm) with 0.0157 cms (250 gpm) intervals.
The gray shading in Table 5 shows the relatively small SHA deficit ratios when various demand volumes were applied to the selected design. When the demand volumes applied to the Grid-1 network were 0.032–0.047 (7.5–11.3%) and 0.111–0.126 (26.3–30.0%) cms, the SHA deficit ratios were approximately the same for respective failure orders. This result demonstrates the importance of selecting appropriate demand volumes, because the application of a demand volume that is too small or too large hinders accurate evaluation of design performance under extreme demand conditions. Therefore, volumes of 0.063–0.079 cms (15.0–22.5%) should be used to achieve effective simulation.
Figure 3 shows that when a demand volume of less than 0.047 cms (11.3% of the total demand in the Grid-1 network) was applied, the SHA deficit ratio was approximately identical for all pipe failure orders. However, the SHA deficit ratio decreased significantly when the failure order was less than three at 0.063–0.079 cms (15.0–22.5%); a design considering the fourth-order failure or greater would have similar deficits. Therefore, a mechanical redundancy-based design considering fourth-order pipe failure should be performed in the Grid-1 network to obtain a hydraulically stable design even under abnormal situations.
4. Conclusions
This study proposed a multi-objective optimal design approach considering mechanical redundancy under conditions of multiple pipe failure. The mechanical redundancy was calculated based on the SHA under abnormal system conditions, such as pipe failure, and extreme demand conditions. The developed design approach reflected the relationships between the pipe failure order and network layout, and SHA under abnormal conditions was used to evaluate the mechanical redundancy deficit resulting from fire-flow conditions. To verify the relation, Pareto-optimal designs based on mechanical redundancy and CC were compared using the expanded Grid-1 network, which is a widely used looped benchmark network from the MOHS framework. This paper presented two simulations: (1) derivation of the relationships between pipe failure states and mechanical redundancy in the multi-objective optimization (i.e., SHA vs. CC) design approaches; and, subsequently, (2) analysis of the demand that needs to be considered in simulations of an abnormal situation based on extreme demand.
In the first analysis, to determine the relationships between pipe failure states and the network configuration, a multi-objective optimal design under multiple pipe-failure conditions was developed, and fire flow was applied to determine the SHA deficit by performance evaluation of the optimized design in the Grid-1 network. The number of pipe failures was increased from 1 to 10, and mechanical redundancy was analyzed in terms of failure order. All Pareto optimal solutions depending on the number of pipe failures had convex shapes, and the design comparison was performed under critical conditions such as marginal cost (5.0 × 10⁴ million USD). The results of the comparison showed that the SHA deficit rate decreased with increasing pipe failures, indicating that a design with a high failure order is more stable than other designs, even under abnormal situations such as fire flow.
Moreover, this study considered the fire-flow condition as an extreme demand situation and analyzed the demand in combination with the pipe failure state. The applied demand volume was changed from 0.0315 cms (500 gpm) to 0.126 cms (2000 gpm) at 0.0157 cms (250 gpm) intervals, which is equivalent to 7.5−30% of the total system demand. In addition, this analysis was performed simultaneously with various numbers of pipe failure orders, similar to the first simulation. The results showed that extreme demand volumes of about 20% of the total demand volume need to be applied in such a simulation. In the case of expanded Grid-1, 15.0–22.5% was appropriate for an effective extreme demand simulation. This is because the application of a demand volume that is too small or too large hinders accurate evaluation of the design’s performance under extreme demand conditions.
Consequently, the developed multi-objective design approach considering mechanical redundancy (SHAα) confirmed the efficiency of system redundancy under multiple pipe-failure conditions. Moreover, the simulation to determine the threshold of the fire-flow volume could help in determining how much demand needs to be considered in extreme demand modeling. However, this study had several limitations that future research needs to address. As the objective of this study was to determine the optimal redundant design approach, it did not apply various configurations and sizes of networks (e.g., looped network, branched network, and loop-branched network) and used only an ideal looped network (i.e., Expanded Grid-1 network) to verify the proposed approach. In future studies, networks of various layouts and sizes should be applied to determine their effects. In addition, for practical applications, another system redundancy measure with topological characteristics and a system entropy measure should be considered together with mechanical redundancy to determine the relationship between the two redundancy measures.
Author Contributions
Conceptualization, Y.H.C. and J.H.K.; Investigation, Y.H.C.; Writing—Original Draft Preparation, Y.H.C.
Acknowledgments
This study was supported by the Korea Ministry of Environment through “The Eco-Innovation Project” (GT-11-G-02-001-2).
Conflicts of Interest
The authors declare no conflict of interest.
References
- Schaake, J.C.; Lai, F.H. Linear Programming and Dynamic Programming Application to Water Distribution Network Design; Hydrodynamics Laboratory, Department of Civil Engineering, Massachusetts Institute of Technology: Cambridge, MA, USA, 1969. [Google Scholar]
- Alperovits, E.; Shamir, U. Design of optimal water distribution systems. Water Resour. Res. 1977, 13, 885–900. [Google Scholar] [CrossRef]
- Quindry, G.E.; Liebman, J.C.; Brill, E.D. Optimization of looped water distribution systems. J. Environ. Eng. Div. 1981, 107, 665–679. [Google Scholar]
- Goulter, I.C.; Coals, A.V. Quantitative approaches to reliability assessment in pipe networks. J. Transp. Eng. 1986, 112, 287–301. [Google Scholar] [CrossRef]
- Su, Y.C.; Mays, L.W.; Duan, N.; Lansey, K.E. Reliability-based optimization model for water distribution systems. J. Hydraul. Eng. 1987, 113, 1539–1556. [Google Scholar] [CrossRef]
- Kessler, A.; Shamir, U. Analysis of the linear programming gradient method for optimal design of water supply networks. Water Resour. Res. 1989, 25, 1469–1480. [Google Scholar] [CrossRef]
- Lansey, K.E.; Mays, L.W. Optimization model for water distribution system design. J. Hydraul. Eng. 1989, 115, 1401–1418. [Google Scholar] [CrossRef]
- Fujiwara, O.; Khang, D.B. A two-phase decomposition method for optimal design of looped water distribution networks. Water Resour. Res. 1990, 26, 539–549. [Google Scholar] [CrossRef]
- Wood, D. KYPipe Reference Manual; Civil Engineering Software Center, University of Kentucky: Lexington, KY, USA, 1995. [Google Scholar]
- Sherali, H.D. Global optimization of nonconvex polynomial programming problems having rational exponents. J. Glob. Opt. 1998, 12, 267–283. [Google Scholar] [CrossRef]
- Savic, D.A.; Walters, G.A. Genetic algorithms for least-cost design of water distribution networks. J. Water Res. Plan. Manag. 1997, 123, 67–77. [Google Scholar] [CrossRef]
- Cunha, M.D.C.; Sousa, J. Water distribution network design optimization: Simulated annealing approach. J. Water Res. Plan. Manag. 1999, 125, 215–221. [Google Scholar] [CrossRef]
- Vasan, A.; Simonovic, S.P. Optimization of water distribution network design using differential evolution. J. Water Res. Plan. Manag. 2010, 136, 279–287. [Google Scholar] [CrossRef]
- Simpson, A.R.; Dandy, G.C.; Murphy, L.J. Genetic algorithms compared to other techniques for pipe optimization. J. Water Res. Plan. Manag. 1994, 120, 423–443. [Google Scholar] [CrossRef]
- Geem, Z.W.; Kim, J.H.; Loganathan, G.V. A new heuristic optimization algorithm: Harmony search. Simulation 2001, 76, 60–68. [Google Scholar] [CrossRef]
- Maier, H.R.; Simpson, A.R.; Zecchin, A.C.; Foong, W.K.; Phang, K.Y.; Seah, H.Y.; Tan, C.L. Ant colony optimization for design of water distribution systems. J. Water Res. Plan. Manag. 2003, 129, 200–209. [Google Scholar] [CrossRef]
- Eusuff, M.M.; Lansey, K.E. Optimization of water distribution network design using the shuffled frog leaping algorithm. J. Water Res. Plan. Manag. 2003, 129, 210–225. [Google Scholar] [CrossRef]
- Bolognesi, A.; Bragalli, C.; Marchi, A.; Artina, S. Genetic heritage evolution by stochastic transmission in the optimal design of water distribution networks. Adv. Eng. Softw. 2010, 41, 792–801. [Google Scholar] [CrossRef]
- Lippai, I.; Heaney, J.P.; Laguna, M. Robust water system design with commercial intelligent search optimizers. J. Comput. Civ. Eng. 1999, 13, 135–143. [Google Scholar] [CrossRef]
- Watt, K.E.; Craig, P.P. System Stability Principles; Systems Research; John Wiley & Sons: New York, NY, USA, 1986; pp. 191–201. [Google Scholar]
- Wildavsky, A. Search for Safety; Transaction Publishers: New Brunswick, NJ, USA, 1988. [Google Scholar]
- McBain, W.; Wilkes, D.; Retter, M. Flood Resilience and Resistance for Critical Infrastructure; Report C688; CIRIA: London, UK, 2010. [Google Scholar]
- Butler, D.; Farmani, R.; Fu, G.; Ward, S.; Diao, K.; Astaraie-Imani, M. A new approach to urban water management: Safe and sure. Proc. Eng. 2014, 89, 347–354. [Google Scholar] [CrossRef]
- Lansey, K. Sustainable, Robust, Resilient, Water Distribution Systems. In Proceedings of the WDSsA 2012 14th Water Distribution Systems Analysis Conference, Adelaide, South Australia, 24–27 September 2012; p. 1. [Google Scholar]
- Hassler, U.; Kohler, N. Resilience in the built environment. Build. Res. Inf. 2014, 42, 119–129. [Google Scholar] [CrossRef] [Green Version]
- Hughes, J.F.; Healy, K. Measuring the Resilience of Transport Infrastructure (No. 546); AECOM New Zealand Ltd.: Los Angeles, CA, USA, 2014. [Google Scholar]
- Diao, K.; Zhou, Y.; Rauch, W. Automated creation of district metered area boundaries in water distribution systems. J. Water Res. Plan. Manag. 2012, 139, 184–190. [Google Scholar] [CrossRef]
- Johansson, J.; Hassel, H.; Zio, E. Reliability and vulnerability analyses of critical infrastructures: Comparing two approaches in the context of power systems. Reliab. Eng. Syst. Saf. 2013, 120, 27–38. [Google Scholar] [CrossRef]
- Berardi, L.; Ugarelli, R.; Røstum, J.; Giustolisi, O. Assessing mechanical vulnerability in water distribution networks under multiple failures. Water Resour. Res. 2014, 50, 2586–2599. [Google Scholar] [CrossRef] [Green Version]
- Kanta, L.R. Vulnerability Assessment of Water Supply Systems for Insufficient Fire Flows. Doctoral Dissertation, Texas A & M University, Canyon, TX, USA, 2010. [Google Scholar]
- Bristow, E.; Brumbelow, K.; Kanta, L. Vulnerability assessment and mitigation methods for interdependent water distribution and urban fire response systems. In Proceedings of the World Environmental and Water Resources Congress 2007: Restoring Our Natural Habitat, Tampa, FL, USA, 15–19 May 2007; pp. 1–10. [Google Scholar]
- Kanta, L.; Brumbelow, K. Vulnerability, risk, and mitigation assessment of water distribution systems for insufficient fire flows. J. Water Res. Plan. Manag. 2012, 139, 593–603. [Google Scholar] [CrossRef]
- Billinton, R.; Allan, R.N. Reliability Evaluation of Engineering Systems; Pitman: Marshfield, MA, USA, 1983. [Google Scholar]
- Ross, S.M. Introduction to Probability Models; Academic Press: New York, NY, USA, 1985. [Google Scholar]
- Mays, L.W. Water Supply Systems Security; McGraw-Hill: New York, NY, USA, 2004. [Google Scholar]
- Jung, D.; Yoo, D.G.; Kang, D.; Kim, J.H. Linear model for estimating water distribution system reliability. J. Water Res. Plan. Manag. 2016, 142, 04016022. [Google Scholar] [CrossRef]
- Cimorelli, L.; Morlando, F.; Cozzolino, L.; D’Aniello, A.; Pianese, D. Comparison among resilience and entropy index in the optimal rehabilitation of water distribution networks under limited-budgets. Water Res. Manag. 2018, 32, 3997–4011. [Google Scholar] [CrossRef]
- Jung, D.; Kim, J.H. Water distribution system design to minimize costs and maximize topological and hydraulic reliability. J. Water Res. Plan. Manag. 2018, 144, 06018005. [Google Scholar] [CrossRef]
- Jung, D.; Kang, D.; Kim, J.H.; Lansey, K. Robustness-based design of water distribution systems. J. Water Res. Plan. Manag. 2013, 140, 04014033. [Google Scholar] [CrossRef]
- Cullinane, M.J.; Lansey, K.E.; Mays, L.W. Optimization-availability-based design of water-distribution networks. J. Hydraul. Eng. 1992, 118, 420–441. [Google Scholar] [CrossRef]
- Clark, R.M.; Sivaganesan, M.; Selvakumar, A.; Sethi, V. Cost models for water supply distribution systems. J. Water Res. Plan. Manag. 2002, 128, 312–321. [Google Scholar] [CrossRef]
- Ministry of Environment. Waterworks Standards; Korea Water and Wastewater Works Association: Seoul, Korea, 2010. [Google Scholar]
- Choi, Y.H.; Lee, H.M.; Yoo, D.G.; Kim, J.H. Self-adaptive multi-objective harmony search for optimal design of water distribution networks. Eng. Opt. 2017, 49, 1957–1977. [Google Scholar] [CrossRef]
- Choi, Y.H.; Jung, D.; Lee, H.M.; Yoo, D.G.; Kim, J.H. Improving the quality of pareto optimal solutions in water distribution network design. J. Water Res. Plan. Manag. 2017, 143, 04017036. [Google Scholar] [CrossRef]
- Deb, K.; Pratap, A.; Agarwal, S.; Meyarivan, T. A fast and elitist multiobjective genetic algorithm: NSGA-II. IEEE Trans. Evol. Comput. 2002, 6, 182–197. [Google Scholar] [CrossRef] [Green Version]
- Rossman, L.A. EPANET 2: User’s Manual. Ph.D. Thesis, Swiss Federal Institute of Technology, Zurich, Switzerland, 1999. [Google Scholar]
- Zitzler, E. Evolutionary Algorithms for Multi Objective Optimization: Methods and Applications. Ph.D. Thesis, Swiss Federal Institute of Technology, Zurich, Switzerland, 1999. [Google Scholar]
- Zitzler, E.; Deb, K.; Thiele, L. Comparison of multi-objective evolutionary algorithms: Empirical results. Evol. Comput. 2000, 8, 173–195. [Google Scholar] [CrossRef] [PubMed]
- Azevedo, C.R.; Araújo, A.F. Correlation between Diversity and Hypervolume in Evolutionary Multiobjective Optimization. In Proceedings of the 2011 IEEE Congress on Evolutionary Computation (CEC), New Orleans, LA, USA, 5–8 June 2011; pp. 2743–2750. [Google Scholar]
Figure 1.
Layout of expanded Grid-1 network.

Figure 2.
(a) Pareto-optimal solutions in mechanical redundancy-based design considering different pipe failure orders, (b) Enlarged view of the distribution of solutions around the marginal cost.
Figure 2.
(a) Pareto-optimal solutions in mechanical redundancy-based design considering different pipe failure orders, (b) Enlarged view of the distribution of solutions around the marginal cost.

Figure 3.
Mechanical redundancy (SHA) deficit ratio for different orders of pipe failure.


Table 1.
Pipe CC parameters based on Clark et al. [41].
Table 1.
Pipe CC parameters based on Clark et al. [41].
| Description | Type | Parameters | ||||||
|---|---|---|---|---|---|---|---|---|
| a | b | c | d | e | f | u | ||
| Base installation | PVC pipe | −1.0 | 0.0008 | 3.59 | 0.011 | 1 | 0.0067 | 150 |
| Trenching and excavation | Sandy gravel soil with 1:1 side slope (≤200 mm) | −24 | 0.32 | 0.67 | 16.7 | 0.38 | 0 | 4 |
| Sandy gravel soil with 1:1 side slope (>200 mm) | 2.9 | 0.0018 | 1.9 | 0.13 | 1.77 | 0 | 4 | |
| Embedment | Ordinary | 1.6 | 0.0062 | 1.83 | −0.2 | 1 | 0.07 | 0 |
| Backfill and compaction | Sandy gravel soil with 1:1 side slope | −0.094 | −0.062 | 0.73 | 0.18 | 2.03 | 0.02 | 4 |
| Valve fitting and hydrant | Medium spacing | 9.8 | 0.02 | 1.8 | 0 | 0 | 0 | No |
Table 2.
Pseudo-code for the proposed MOHS.
| Input: Objective functions (i.e., Minimum CC, Maximum SHAα), Algorithm parameters (i.e., HMCR, PAR, HMS, BW) Generate initial HM randomly while stopping criterion is not satisfied do if (rand < HMCR) choose an existing harmony randomly if (rand < PAR) adjust the pitch randomly within the limits end if else generate new harmony via randomization end if Calculate the Pareto ranking of HM considering the non-dominated sorting method [24] Apply the crowding-distance method [24] if the ranking of new harmony is better than the worst solution in HM Update HM end if end while Output: Pareto optimal solutions from HM |
Table 3.
Optimal parameter set of the MOHS.
| Network | HMS | HMCR | PAR | NI | NFEs |
|---|---|---|---|---|---|
| Expanded Grid-1 network | 50 | 0.9 | 0.3 | 50,000 | 50,000 |
Note: NI is the number of iterations.
Table 4.
Mechanical redundancy (SHAα) values for different orders of pipe failure.
| No. Pipe Failure Order (= α) | CC (1010 USD) | SHAα | Min Nodal Pressure (m) | SHA1 Under Fire Flow |
|---|---|---|---|---|
| 1st | 4.9362 | 0.9601 | 28.41 | 0.7586 |
| 2nd | 4.9586 | 0.9647 | 29.03 | 0.7933 |
| 3rd | 5.0167 | 0.9688 | 29.05 | 0.8838 |
| 4th | 5.0959 | 0.9673 | 30.15 | 0.8966 |
| 5th | 4.9159 | 0.9694 | 30.18 | 0.9059 |
| 7th | 4.9493 | 0.9696 | 31.20 | 0.9060 |
| 10th | 4.9498 | 0.9686 | 30.81 | 0.9061 |
Table 5.
Mechanical redundancy (SHA) deficit ratio for different orders of pipe failure.
| No. Pipe Failure Order (= α) | Volume of Extreme Demand (cms) (The Ratio of Total Demand (%)) | ||||||
|---|---|---|---|---|---|---|---|
| 0.032 (7.5%) | 0.047 (11.3%) | 0.063 (15.0%) | 0.079 (17.5%) | 0.095 (22.5%) | 0.111 (26.3%) | 0.126 (30.0%) | |
| SHA Deficit Ratio (%) | |||||||
| Non-failure | 16.6% | 24.0% | 43.4% | 61.3% | 73.1% | 79.3% | 82.7% |
| 1st | 3.6% | 6.5% | 21.5% | 28.9% | 36.1% | 44.2% | 51.4% |
| 2nd | 2.6% | 4.8% | 18.0% | 25.7% | 32.0% | 37.2% | 45.5% |
| 3rd | 3.3% | 5.0% | 16.5% | 19.9% | 30.5% | 36.9% | 45.5% |
| 4th | 2.1% | 4.1% | 7.5% | 13.3% | 21.1% | 35.0% | 45.8% |
| 5th | 2.4% | 3.9% | 7.2% | 13.2% | 20.2% | 33.7% | 45.3% |
| 7th | 2.4% | 3.9% | 7.2% | 13.2% | 20.2% | 33.7% | 45.3% |
| 10th | 2.4% | 3.9% | 7.2% | 13.2% | 20.2% | 33.7% | 45.3% |
© 2019 by the authors. Licensee MDPI, Basel, Switzerland. This article is an open access article distributed under the terms and conditions of the Creative Commons Attribution (CC BY) license (http://creativecommons.org/licenses/by/4.0/).
Share and Cite
MDPI and ACS Style
Choi, Y.H.; Kim, J.H. Development of Multi-Objective Optimal Redundant Design Approach for Multiple Pipe Failure in Water Distribution System. Water 2019, 11, 553. https://doi.org/10.3390/w11030553
AMA Style
Choi YH, Kim JH. Development of Multi-Objective Optimal Redundant Design Approach for Multiple Pipe Failure in Water Distribution System. Water. 2019; 11(3):553. https://doi.org/10.3390/w11030553
Chicago/Turabian StyleChoi, Young Hwan, and Joong Hoon Kim. 2019. "Development of Multi-Objective Optimal Redundant Design Approach for Multiple Pipe Failure in Water Distribution System" Water 11, no. 3: 553. https://doi.org/10.3390/w11030553
Note that from the first issue of 2016, this journal uses article numbers instead of page numbers. See further details here.