Economic Evaluation of Adaptation Pathways for an Urban Drainage System Experiencing Deep Uncertainty


1
Department of Civil and Environmental Engineering, Imperial College London; South Kensington, London SW7 2AZ, UK
2
Centre for Doctoral Training in Sustainable Civil Engineering, Imperial College London; South Kensington, London SW7 2AZ, UK
*
Author to whom correspondence should be addressed.
Water 2019, 11(3), 531; https://doi.org/10.3390/w11030531
Submission received: 15 January 2019
/
Revised: 5 March 2019
/
Accepted: 8 March 2019
/
Published: 14 March 2019
(This article belongs to the Special Issue Urban Water Policy and Planning Strategies for an Uncertain Water Future)
Abstract
:As Decision Making under Deep Uncertainty methodologies are becoming more widely utilised, there has been a growth in the use and generation of Adaptation Pathways. These are meant to convey to policy makers how short-term adaptations can act as elements of longer-term adaptation strategies. However, sets of Adaptation Pathways do not convey the individual pathway’s relative costs and benefits. To address this problem in relation to urban pluvial flooding, an economic analysis of a set of Adaptation Pathways was conducted. Initially, a methodology to conduct an economic assessment for deterministic climate change scenarios is developed. This methodology is then modified, using methods that underpin real options to assess how a pathway performs across a bundle of possible futures. This delivered information on how the performance of adaptations can vary across different climate change scenarios. By comparing the deterministic analysis to the new method, it was found that the order in which options are implemented greatly affects the financial performance of an Adaptation Pathway, even if the final combination of options is identical. The presented methodology has the potential to greatly improve decision making by informing policy makers on the potential performance of adaptation strategies being considered.
1. Introduction
Across the globe, cities are implementing climate change adaptation strategies. These strategies aim to defend communities from the potential risks of climate change in relation to multiple factors including increased heat stress [1], sea-level rise [2], and flood risk [3]. The development of these adaptation strategies is hampered by the presence of multiple interacting uncertainties; these obfuscate future conditions and the degree to which infrastructure systems need to be adapted.
The aforementioned situation in which multiple poorly characterized uncertainties are present has been defined as “deep uncertainty”. Under conditions of deep uncertainty, traditional decision-making paradigms are inappropriate, and Decision Making under Deep Uncertainty (DMDU) techniques should be utilised [4]. These techniques utilise exploratory modeling to define the space of future possibilities and examine how potential strategies will perform within these hypothetical futures.
The presence of deep uncertainty is felt across many sectors such as energy generation [5], water supply [6], coastal flood risk [7], and transport planning [8]. Deep Uncertainty is also present within the problem of urban pluvial flooding [9]. However, the deep uncertainties present within urban pluvial flooding have not been widely explored. These deep uncertainties are hindering the development of urban drainage adaptation strategies by obfuscating the future conditions to which these systems will be exposed.
The result of many DMDU analyses has been the generation of a set of Adaptation Pathways. These Adaptation Pathways are intended to structure policy makers’ decision-making in a technically realistic and logical manner. The Adaptation Pathways show how a range of potential adaptations fare under different scenarios and the path dependencies that exist between solutions. The intent is to deliver sufficient information to decision makers such that they are then free to debate the relative advantages and disadvantages of the presented solutions. However, the pathways alone generally contain limited information with regard to the different pathway’s costs and benefits.
The presented analysis undertook a cost-benefit analysis on a set of Adaptation Pathways generated by Babovic and Mijc [10] for an urban drainage system. The presented work builds upon the literature of assessing flood defence Adaptation Pathways by using a physically based assessment of flood damages in addition to exploring a range of ecosystem services and a wider range of flood defense solutions across a range of futures [11,12]. To achieve this, the Discounted Cash Flow (DCF) methodology was modified to be applicable to Adaptation Pathways. Once a deterministic estimate of DCF was estimated, methods by which to economically evaluate projects under uncertainty were used to generate a more robust financial analysis of the Adaptation Pathways. The use of such methods allows for the identification of how a drainage adaptation will financially perform across a range of futures.
2. Materials and Methods
2.1. Adaptation Pathways
The Adaptation Pathways upon which the economic analysis was conducted were generated in response to a need to develop a strategy to adapt the urban drainage system of the Cranbrook Catchment in the North East of London. The catchment has a 9 km2 drainage area. The primary land use in the catchment is urban housing; as such, the land surface is mostly impervious with the exception of a large park. The purpose of the study was to investigate how the catchment’s pluvial flood risk would change in response to potential changes in the 30-year return period design storm. This was achieved by modifying the total depth of the design storm using climate change factors. Eleven potential changes in depth were considered at 5% intervals ranging from a 0% to 50% increase.
The current drainage system and catchment were modeled within Infoworks Integrated Catchment Modeling (ICM) as a fully distributed 1D–2D model [10]. The potential futures storms were then simulated against the current drainage system; this allowed us to determine which increase in depth resulted in the exhibited failure of the unadapted drainage system. The increase in total storm depth that resulted in system failure is known as an Adaptation Tipping Point (ATP).
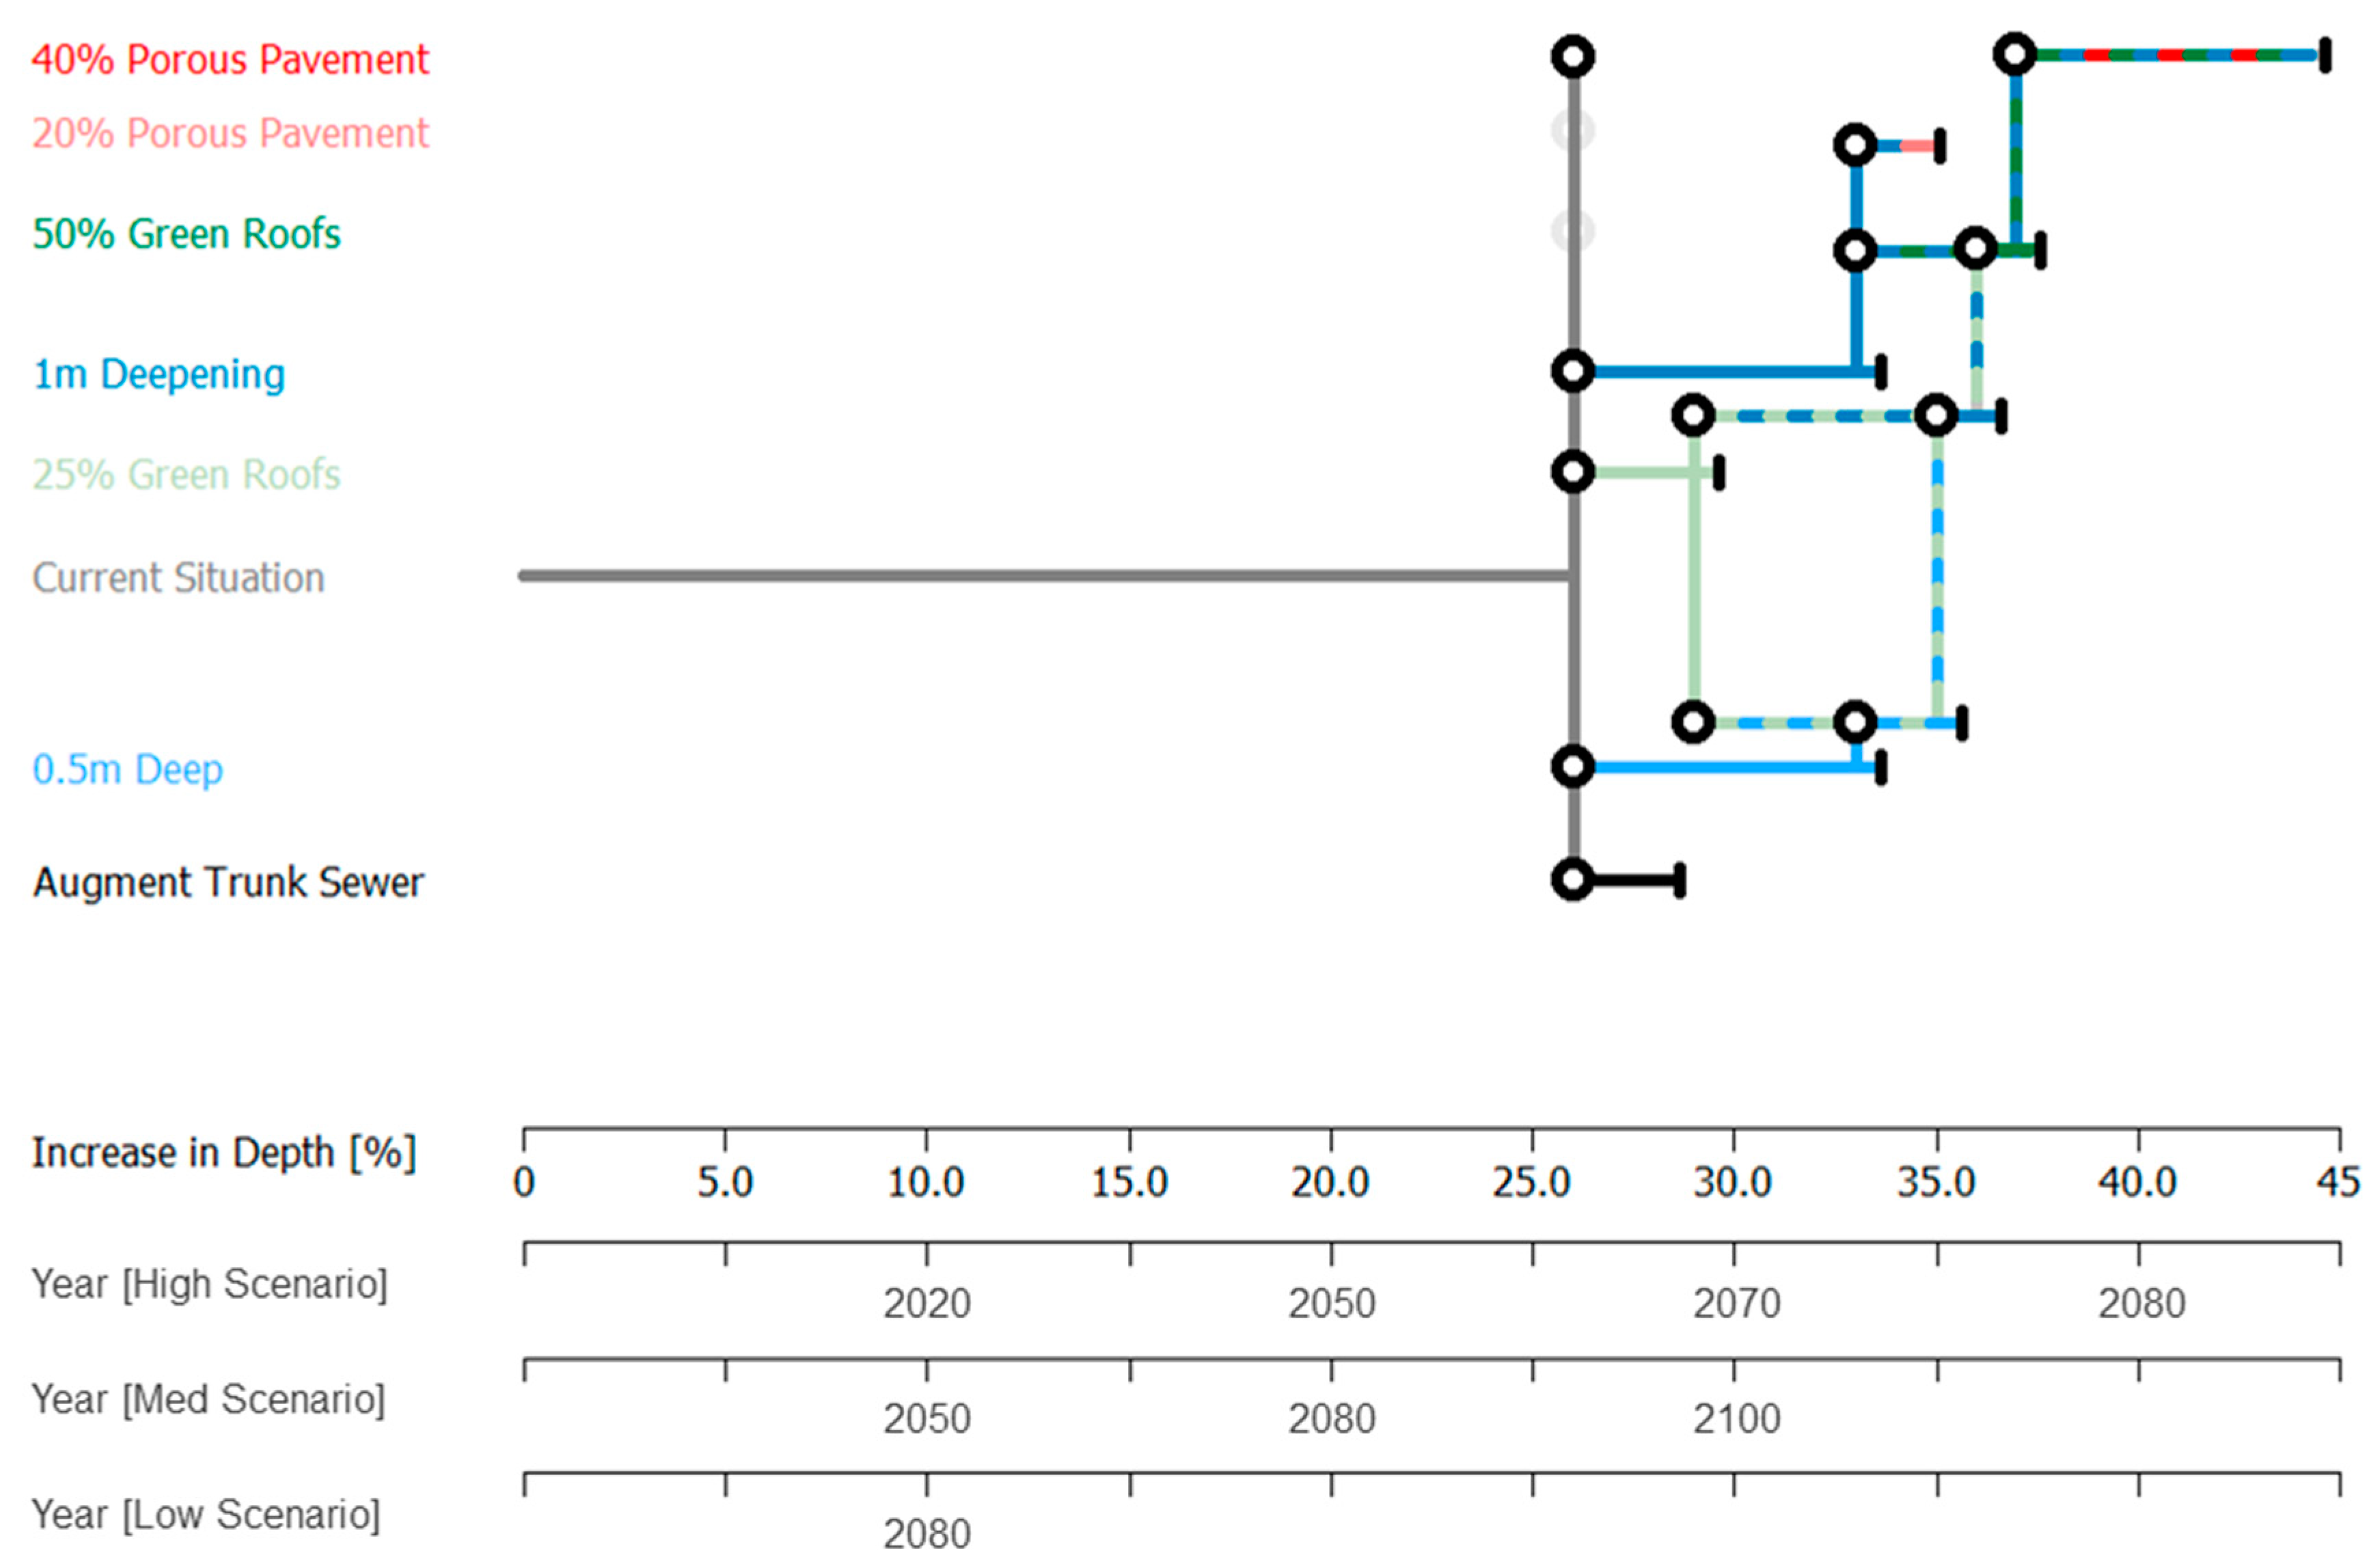
Upon reaching an ATP, a potential adaptation was modeled within the flood simulation environment. Various possible adaptations were considered in order to increase the drainage system’s capacity. The options were identified after consulting a dozen sets of national, metropolitan, and local guidance on adapting drainage systems. After consulting these documents, seven potential adaptations were identified. Once combinations of potential adaptations were considered, the number of strategies increased from seven to 53. Each of these 53 strategies was stress-tested against potential storms in order to identify their behavior in the face of potential changes to the design storm event. This resulted in a dataset of the number of manholes flooded for a given adaptation strategy, for a given increase in precipitation depth. Figure 1 displays the Adaptation Pathways for increases in design storm depth. A more thorough exploration of how the pathways were developed can be found in Babovic and Mijic. [10].
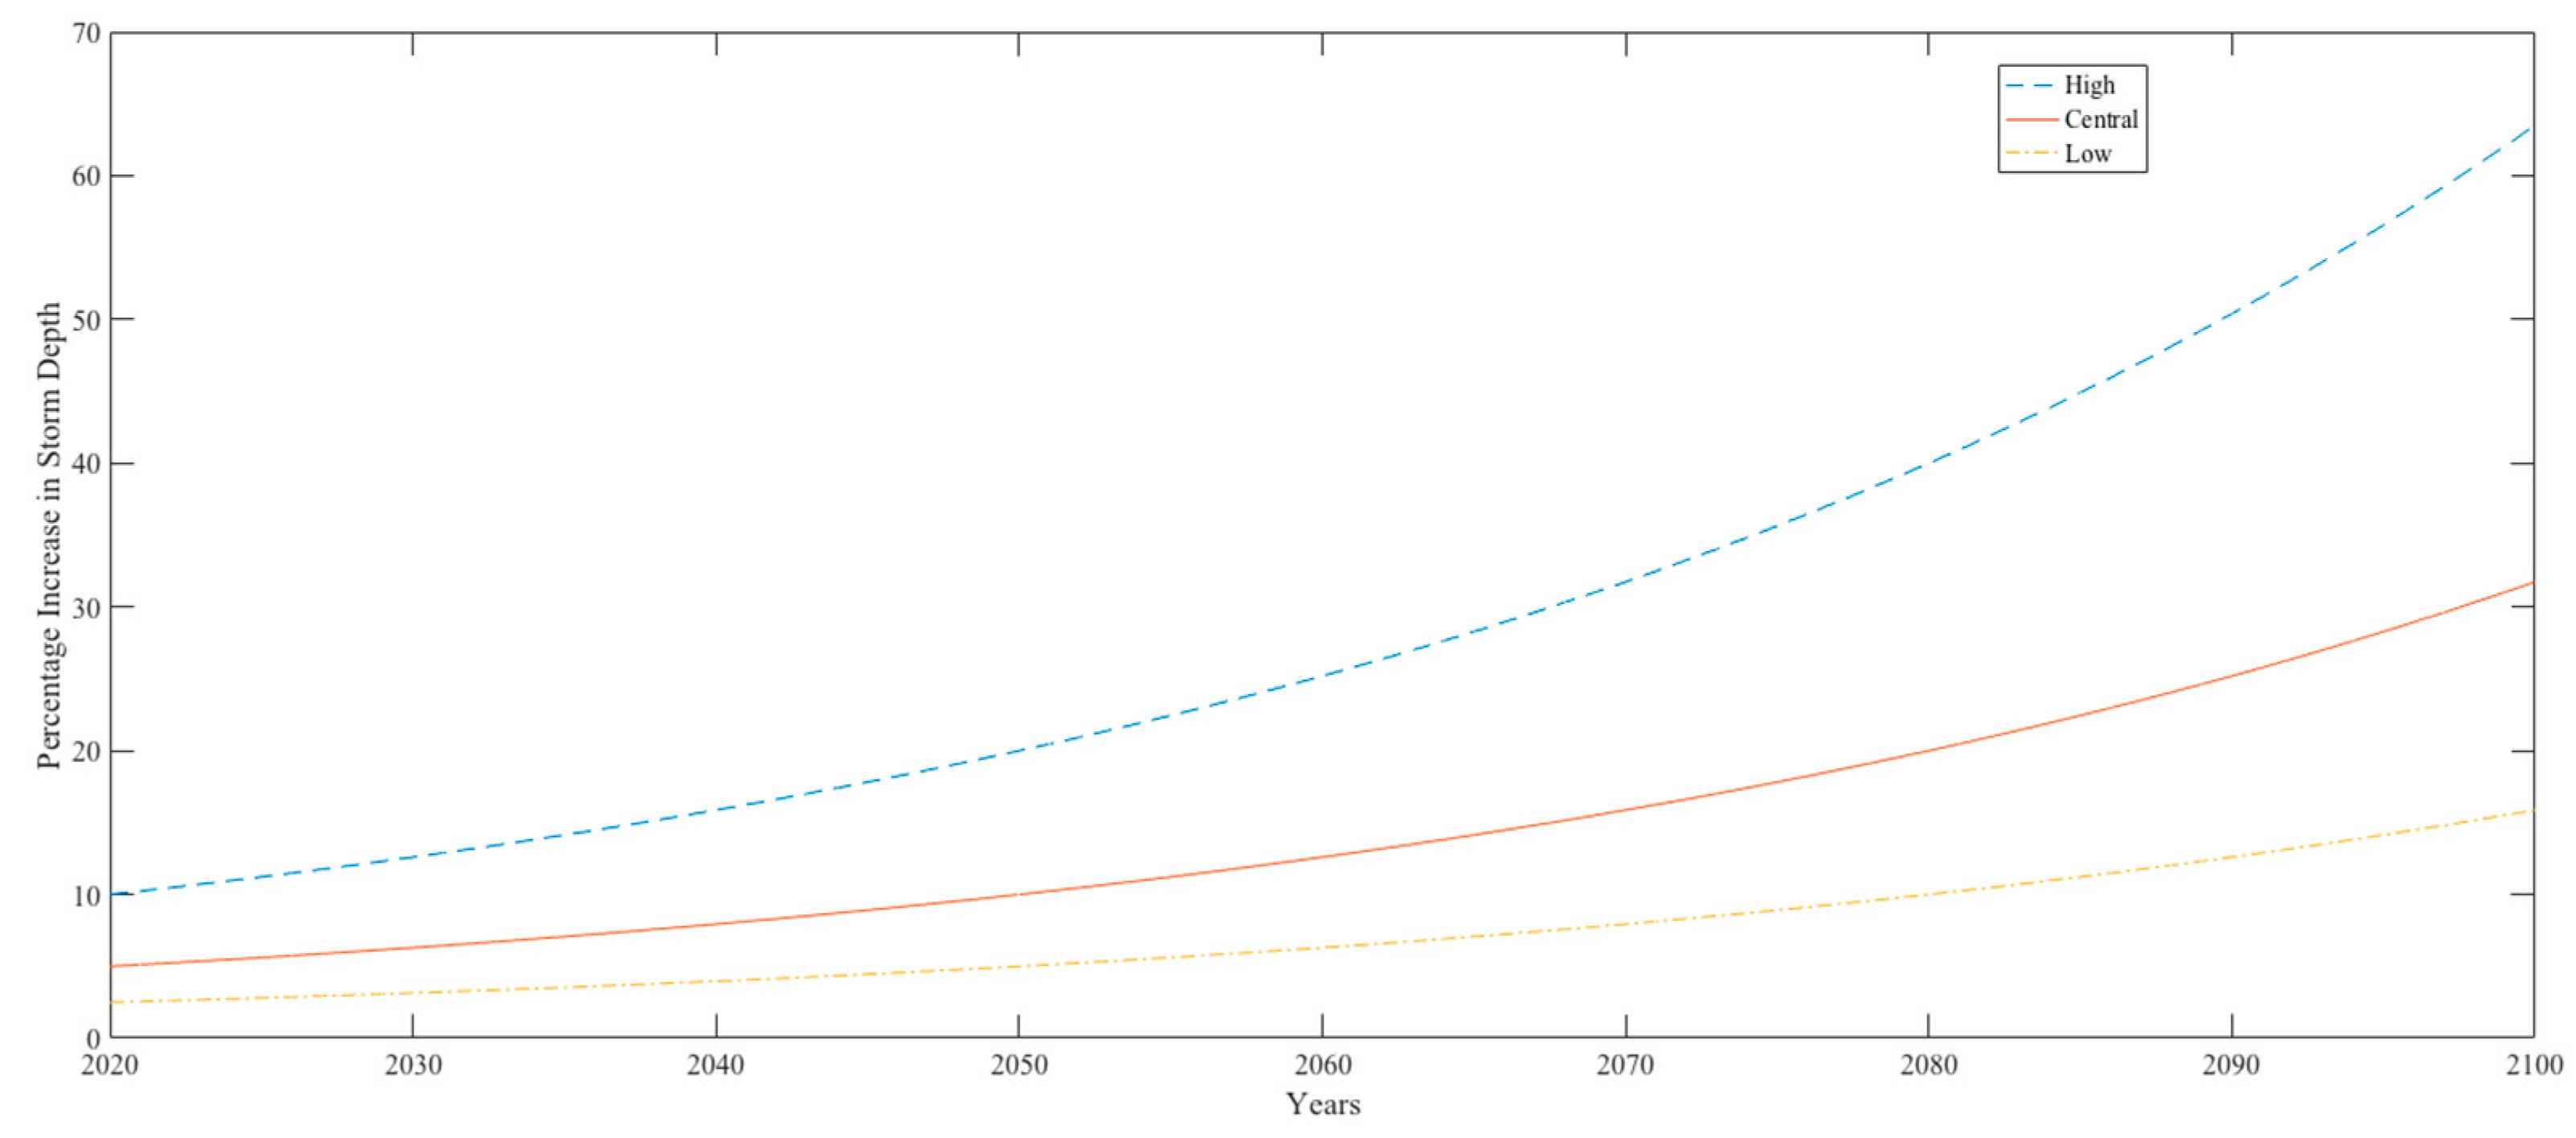
Potential increases in rainfall depth were converted to estimates of when they may occur based upon projections from the Environment Agency [13], shown in Figure 2. This resulted in three vastly different timelines of when ATPs may be reached; these timelines can be seen in the lower part of Figure 1.
The ambiguity surrounding the timing of when ATPs may occur raises serious questions regarding the estimation of payback periods and the rate of return on investments. In turn, these questions have significant knock-on effects on the Net Present Value of the adaptation strategies.
2.2. Framework for the Economic Assessment of Pathways
Adaptation Pathways are intended to inform decision makers on which adaptations should be implemented, and the order in which they should be implemented, in order to meet a given objective. However, on their own, Adaptation Pathways generally do not contain any information regarding the relative cost and benefits of potential strategies. To address this, the total lifetime costs and benefits of the various paths through Figure 1 were evaluated. The benefits were assumed to be equal to the sum of the flood risk reduction and ecosystem benefits. The costs of the proposed adaptation strategies encompassed both the capital and operational expenditures of the options.
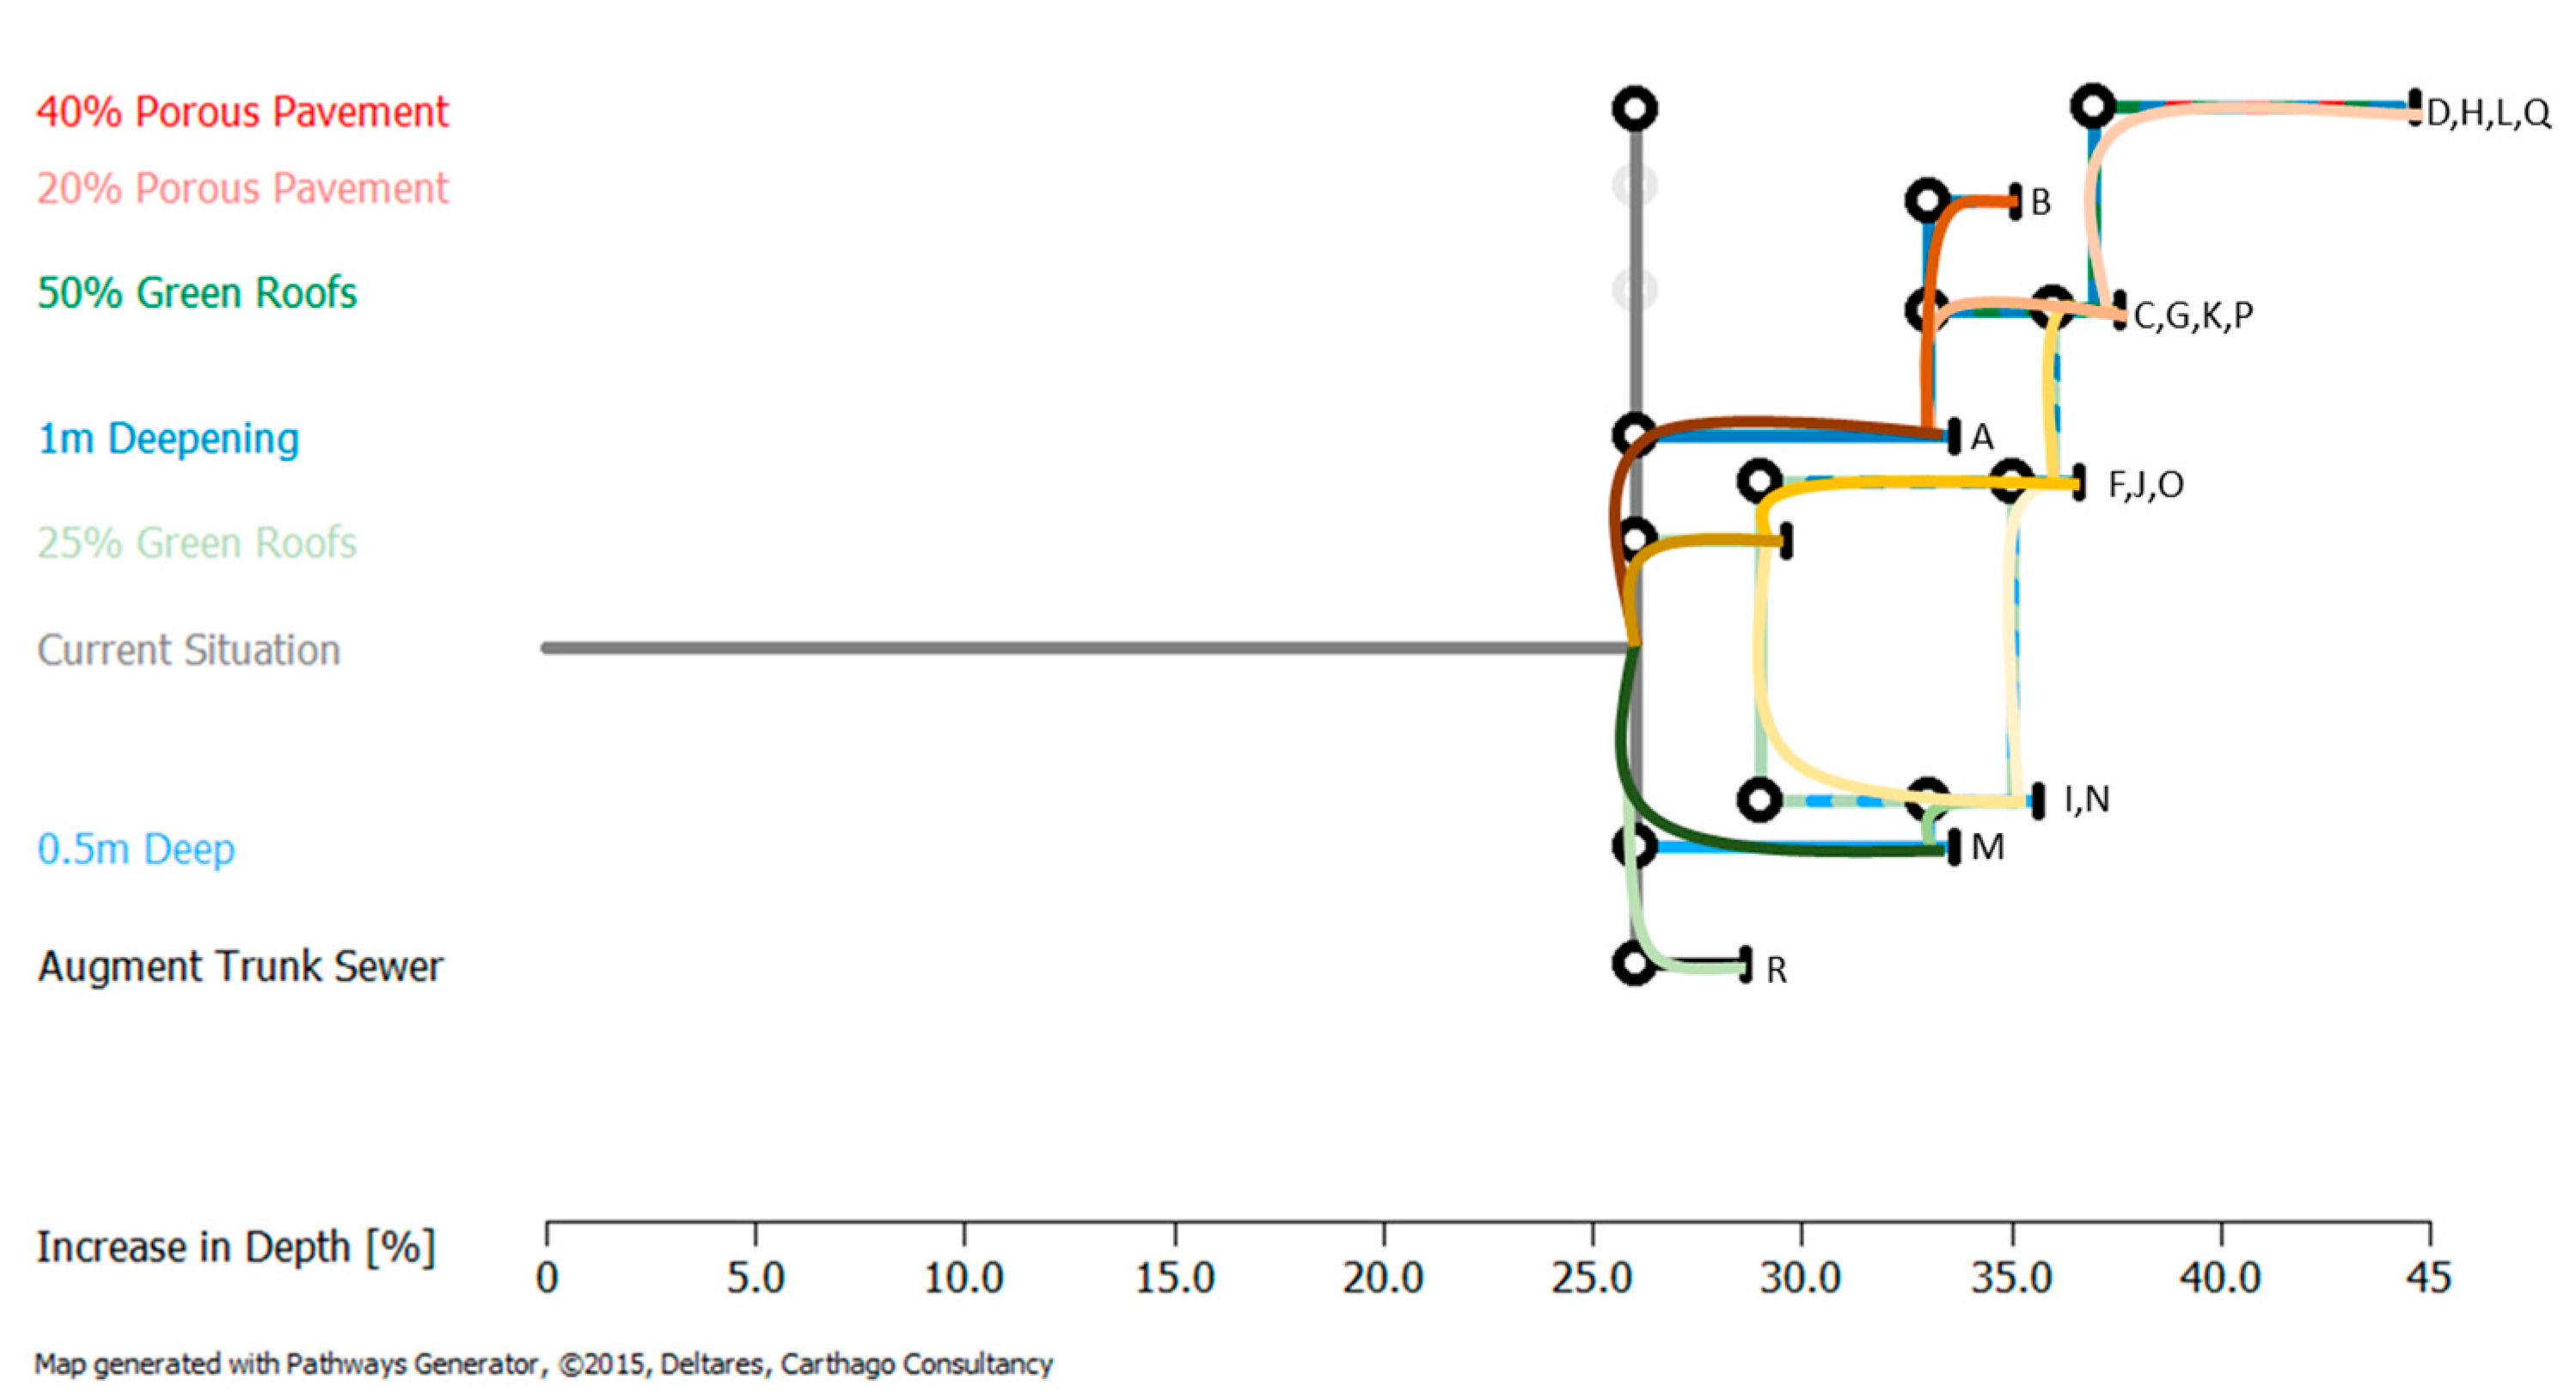
One of the great advantages of Adaptation Pathways is that decision makers have an element of choice of how to travel through the pathways, all of which can achieve the same objective. Due to this element of choice, all potential paths had to be economically assessed. Paths are defined as the potential ways to travel through the Adaptation Pathways. The potential paths within Figure 1 were identified, resulting in the 18 potential paths that are displayed in Figure 3 and further elaborated on in Table 1.
Paths are defined by the combination of options and the order in which they are implemented. Multiple paths for the same final combination of adaptations are due to the same options being implemented in differing sequences. These paths were the unit of analysis upon which the economic assessment was performed. The paths and the order in which their component solutions were implemented are shown in Table 1.
Flood Protection Benefits
The economic benefit of a flood risk reduction measure is defined as the value of the damage that was avoided by implementing the measure [14]. Several methodologies exist to calculate the economic damage of a simulated flood, these include market prices, inferential methods, expressed preference, and benefit transfer methods [14].
In order to assess the economic damage from flooding, the data and methodology of the Multi Coloured Manual (MCM) [14] was used. The MCM uses a benefit-transfer method of flood damage estimation where historic flood information is used to identify the relationship between flood depth, flood extent, and economic flood damage. This study assessed the direct property damage incurred by potential changes to the 30-year return period design storm. The Cranbrook catchment is made up of 4468 buildings; each of these buildings was assigned a MCM land use category, such as commercial property or a detached dwelling. Each MCM land use category has a depth-damage curve associated with it. For every simulated flood, the maximum flood extent was extracted. Based upon this, the maximum surface water extent and depth were established along with the degree to which the properties in the catchment were flooded. Each property’s flood depth, flood extent, and MCM land use category was then used to estimate the damage incurred. The total flood damage across the catchment was found by summing all the damages incurred to individual properties.
The economic impact of flooding on the road network was assessed in a similar way. The areal extent of surface water flooding on the road network was determined, and a cost per unit area applied, following guidance from Penning-Rowsell, Priest, Parker, et al. [14].
As noted earlier, flood risk reduction benefits are defined as the economic damage avoided by implementing a flood risk reduction strategy. More formally, this is equal to the difference between the damage that is incurred by a flood under the current drainage system and the damage incurred under the adapted system by the same flood event. The flood damage incurred under the current drainage system was found and used as a baseline against which the flood damages incurred on adapted systems were compared. Standard methods of planning utilise a single storm event to assess a flood defence strategy. However, under an Adaptation Pathways approach a range of storms must be explored. This is due to the fact that paths are chosen based on an unknown increase in the design storm’s depth. Potential increases in design storm depth were explored at 5% intervals; flood damage assessments were conducted at these increments. The flood risk reduction benefits for increases in storm depth between these known points were found by means of linear interpolation.
The economic flood benefits of a solution were evaluated for increases in design storm precipitation depths, ranging from the depth at which it was implemented to the increase in depth at which the strategy is no longer effective, i.e., its ATP.
2.3. Conversion to Time
Financial performance analyses such as Discounted Cash Flow and Benefit-Cost Ratio require the use of annualized costs and benefits. As discussed earlier, projections of how the precipitation depth of rare storms may increase were developed by the Environment Agency [13]. Increases in design storm depth were converted to estimates of when they may occur using these projections. This was conducted for all explored paths.
The economic benefits of flood risk reduction were based upon the damage incurred by a single 30-year return period storm event. This lump sum was converted to an annualized cash flow by dividing the total damage incurred for a single storm by its return period. By converting the flood risk reduction benefits into a cash flow tied to time, as opposed to increases in the design storm, it was possible to combine this economic benefit with other annualized financial flows.
2.4. Cost Estimation
All of the strategies explored were a combination of seven individual options. If a strategy is composed of multiple adaptations, the total cost was taken to be the sum of the individual elements. The individual costs of the first six options in Table 2 were determined by identifying the unit costs of the options considered. The capital expenditure (CAPEX), the cost of building the adaptations, and operational expenditure (OPEX), the cost of maintaining these adaptations, were identified through a search of the literature. The costs per unit identified as well as the total CAPEX and OPEX of the options can be found within Table 2.
The CAPEX of increasing the trunk sewer’s diameter was found through the use of standard guidance on the pricing civil engineering works [15]. The cost of augmenting each sewer section was a function of the sewer’s sub-surface depth, its increased diameter, and its length. The total cost of the sewer augmentation was then found by summing the cost of the individual sections. Thames Water provided the lengths, sizes and geometries of the sewer sections.
From the Adaptation Pathways, the increase in design storm depth at which in adaptations needed to be implemented was determined. Through the use of the projections in Figure 2, it was possible to identify the year within which the CAPEX is forecast to be spent. It was assumed that OPEX is incurred from the year that the CAPEX is implemented to the year the ATP is reached.
2.5. Ecosystem Benefits
The Benefits of SuDS Tool (BeST), developed by the Construction Industry Research and Information Association (CIRIA), was utilised to determine the ecosystem services provided by the SuDs solutions [18]. Ecosystem services can be defined as “the benefits provided by ecosystems that contribute to making human life both possible and worth living” [18]. The BeST is the culmination of a review of 553 documents on the valuation of fourteen different ecosystem services which range from amenity to groundwater recharge [18].
Similar to the MCM, the BeST utilises a benefit-transfer method where ecosystem benefits are estimated based on similar schemes conducted in the past. The ecosystem benefits of SuDS solutions are highly context specific and are influenced by site characteristics [19]; due to this, the estimated benefits contain a large degree of uncertainty.
Of the solutions explored, the porous pavement and green roof adaptations were the only adaptations that provided ecosystem services. The ecosystem services that were monetized for each of these solutions and their values are displayed in Table 3. There were several ecosystem services such as impacts on education, health, and the treatment of wastewater that were not assessed due to a lack of data.
The benefits delivered by converting 50% of roofs to green roofs and converting 40% of pavements to porous pavements are simply double the amounts displayed in Table 3, as they are double the size of the solutions within the table. It was assumed that these values are delivered immediately and remain constant over time. This assumption ignores the effects of a changing climate and annual changes in temperature on ecosystems services.
Similar to the estimates of flood risk reduction, the annualized ecosystem services provided by the above SuDS solutions are incurred from the year that the solution is implemented until its ATP is reached.
2.6. Financial Analyses
2.6.1. Discounted Cash Flow
The use of discounted cash flows to calculate the Net Present Value (NPV) of a potential project is standard engineering economics practice. The NPV is utilised to determine whether a project will deliver sufficient benefits to justify its costs. The majority of the benefits delivered by an element of infrastructure are delivered after it has been constructed; discounting is used to reflect the time value of cash flows and the perception that the costs and benefits incurred in the future are of less value than those delivered in the near term. The costs and benefits delivered in the future are discounted utilising Equation (1) to determine their “present value”. The summation of the present values of a project’s costs and benefits determines the project’s NPV.
where T represents the duration of the project’s lifetime in years, Xt is a cost or benefit incurred over a year by the project and r is the discount rate. Following the UK Treasury’s Green Book, economic appraisals of public infrastructure projects utilise a standard discount rate of 3.5%, while projects over 30 years in length utilise a discount rate that declines as the project’s duration is increased [20].
2.6.2. Benefit Cost Ratio
The Benefit–Cost Ratio (BCR) of a project is the ratio of its total discounted benefits to its total discounted costs. It has been noted that given the limited resources for urban drainage interventions, the BCR may be a more useful metric than NPV for judging the cost-effectiveness of a potential project [21].
2.6.3. Jensen’s Inequality
Within this analysis the central climate change scenario as predicted by Figure 2 was used to conduct the deterministic economic evaluation of Adaption Pathways. The central scenario, even though it represents the mean projection of future conditions, does not necessarily reflect the average financial performance of a drainage adaptation. This is due to what has been termed the “flaw of averages” [22] more formally known as Jensen’s law [23].
The flaw of average refers to the common but mistaken assumption that evaluating a project around average conditions delivers an indication of the average financial performance [24]. This assumption only holds true if all the relevant relationships explored in the economic analysis are linear. Mathematically, this can be expressed as shown in Equation (2).
where f(x) is a non-linear function that defines the value delivered by a project over a space of parameters x. The economic assessment of urban drainage adaptation strategies contains numerous non-linearities. The flood risk reduction benefits are non-linear due to the non-trivial relationship between incident precipitation and urban surface water extent. Additionally, there are discontinuities in cash flows; multiple costs and benefits are linked to when and if solutions are implemented. For example, the ecosystem benefits and maintenance cost of SuDs are only incurred after the construction of this infrastructure has occurred. Lastly, different climate change scenarios affect the length of time that a piece of infrastructure delivers reliable service, thereby affecting the total benefits and costs incurred by an adaptation strategy.
Furthermore, by focusing on average conditions, one neglects the impact of events with remote probabilities. A cost-benefit analysis geared to average conditions ignores the effects of negative events and the ability to take advantage of opportunities [25].
2.6.4. Economic Evaluation of Pathways Under Uncertainty
Real Options is a method of planning under conditions of uncertainty. The concept of real options was originally developed by Trigeorgis [26] as a method of utilising flexibilities present in an engineering system to minimise exposure to risks while allowing for the ability to take advantage of opportunities. The Real Options methodology has, in the past, been applied to the design of numerous urban drainage adaptations [6,27,28].
Under real options, potential projects are assessed by how they financially perform across a range of futures. Similar to Decision Making under Deep Uncertainty methods, numerous simulations of the future are generated and applied to a potential adaptation. For each of these simulations, the financial performance of the project is assessed. This results in a financial performance metric for every future explored. A meta-analysis is then performed on this set of financial metrics. This bottom-up method of assessing financial performance delivers a robust assessment of how a project will financially perform across a range of possible futures [24]. This method also addresses the problem of Jenesen’s inequality.
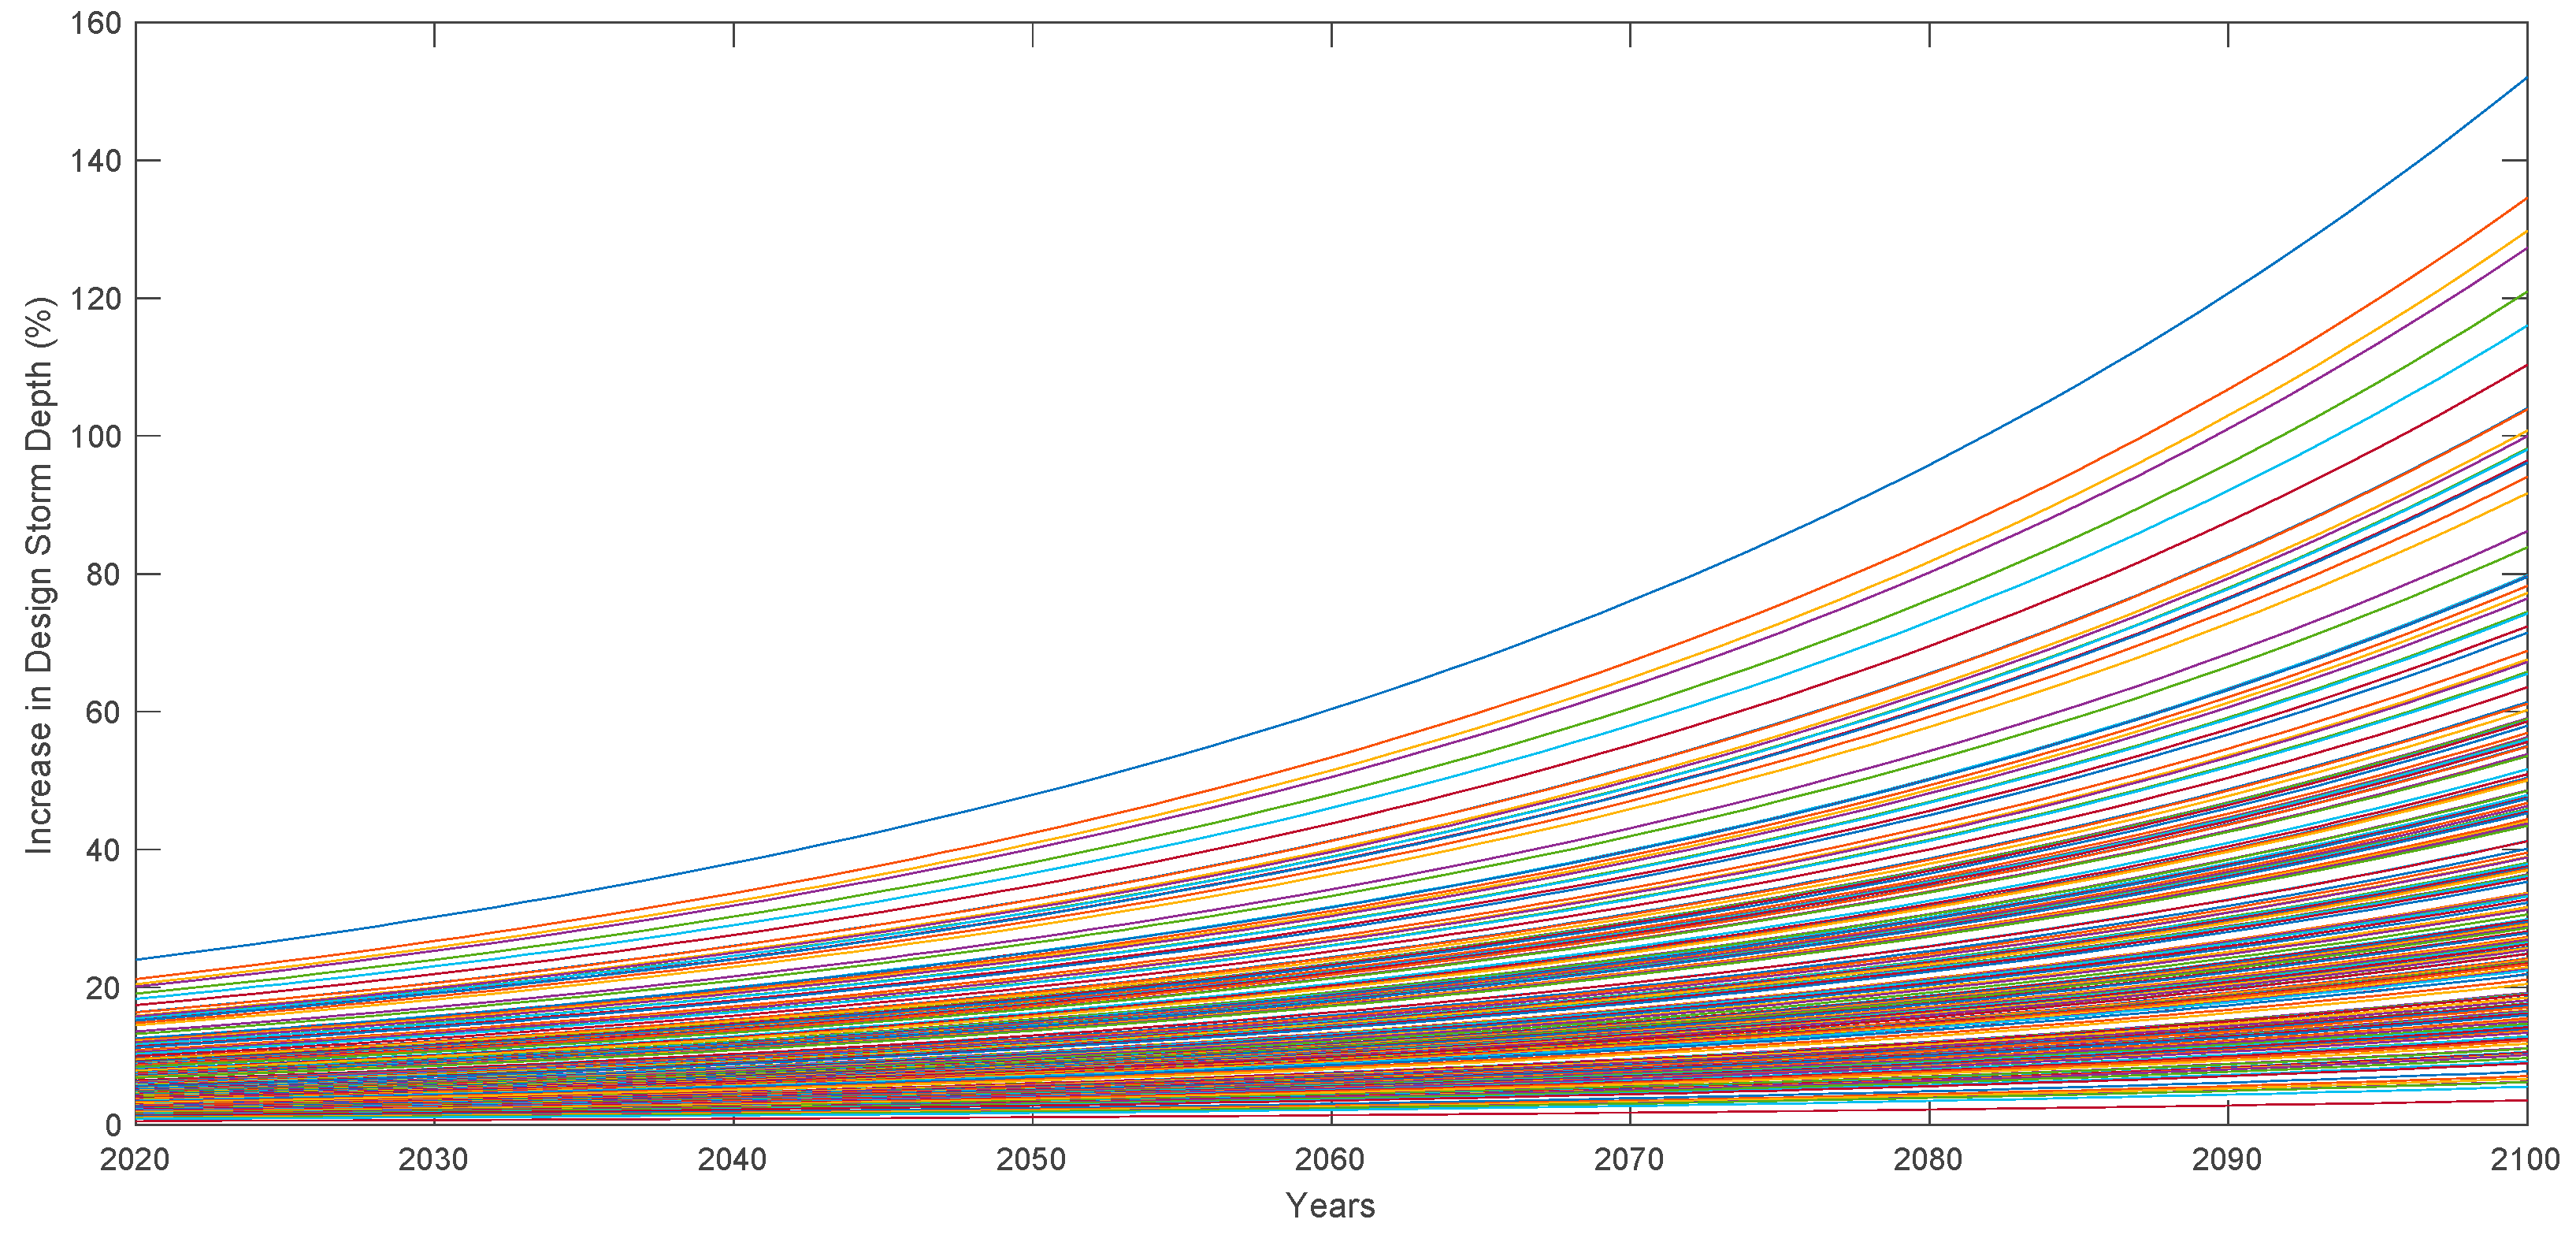
To conduct the evaluation under uncertainty of the Adaptation Pathways shown in Figure 1, 200 projections of how the depth of rare storms may increase were developed based upon data provided by the Environment Agency [13]. These 200 projections are displayed in Figure 4.
The 200 futures were applied to the same methodology used to calculate the deterministic BCRs and NPVs outlined earlier. This resulted in a set of 200 NPVs and BCRs for all 18 paths identified in Figure 2. The financial performances for each future were then used to determine the average financial performance of each path. Finding the means of the performances resulted in the Expected Net Present Values (ENPV) and Expected Benefit Cost-Ratios (EBCR) being calculated. Additionally, the standard deviation of the NPVs and BCRs were determined, quantifying the range of financial performances present across the futures explored.
3. Results and Discussion
The BCRs and NPVs for all paths under the deterministic central climate change scenario are displayed in Table 4. This scenario provides a baseline against which the evaluations under uncertainty can be compared.
3.1. Deterministic Evaluation
The results displayed in Table 4 show that the vast majority of the paths result in a negative Net Present Value. Under a changing climate, the ability for a drainage adaptation to deliver benefits expires before it has had sufficient time to offset its costs.
Climatic stationarity allowed for extended periods during which the benefits provided by a flood alleviation scheme could accumulate and deliver a return on the capital investment. However, due to climate change, the design life of infrastructure is shortened. Over these shortened life times, it is difficult for sufficient benefits to be accrued for the capital expenditure to be offset. It may therefore be necessary to rethink infrastructure design in order to maintain historic levels of return on investment. Alternatively, the new reality of climate change may be that flood defence assets will deliver a lower return on investment than in the past. The lack of return on investment is further reflected in the poor benefit to cost ratios. In recent years, a BCR of 8:1 has been applied to flood defense related decision-making in England [29]. The maximum BCR for the paths considered within this work is equal to only 2.33. This raises questions surrounding how high the expected returns from environmental infrastructure should be under conditions of climate change.
The order in which options are implemented can have a profound impact on the Net Present Value of a path. There were four paths leading to the implementation of the strategy with the highest ATP, these were D, H, L and Q. The BCRs for these paths were 0.53, 0.64,1.18, and 0.48 respectively. The NPVs for these paths were −£2,660,000, −£2,300,000, £1,130,000, and −£2,770,000 respectively. This strategy consists of 50% green roof coverage, deepening the lake by one-meter, and a conversion of 40% of road areas to porous pavements. Even though all four pathways were found to be technically sound, the order in which adaptation options were implemented resulted in radically different NPVs. Of these four paths, only path L consisted of the combination of solutions that resulted in the maximum ATP being reached while also resulting in a favorable BCR and NPV. This path consisted of converting 25% of roofs to green roofs, followed by a 0.5 m deepening of the lake, followed by another 0.5m deepening of the lake, converting 25% of roofs to green roofs, and finally, converting 40% of roads to porous pavements.
Even though all the paths used the same adaptations, there were very large variations in financial performance. This highlights the need to keep path dependence in mind when making decisions under conditions of deep uncertainty. The presented analysis suggests that the choice of paths through a set of Adaptation Pathways could be highly constrained once the financial viability of different strategies is considered.
3.2. Evaluation Under Uncertainty
The financial performance of the potential paths across the 200 futures are displayed in Table 5.
The Expected Net Present Value and Expected Benefit Cost Ratio are the average financial performance across the 200 futures explored. The respective standard deviations of these performance metrics are also displayed.
Table 6 shows the results from Table 5 compared to the deterministic assessment developed earlier. The difference columns present the absolute difference between the financial metric derived by deterministic methods and the same metric calculated under uncertainty. Negative values indicate that the metric calculated by deterministic methods over-estimated the metric when compared to the financial metric calculated under uncertainty. To provide further context, the difference between the calculated metrics were normalized by dividing by the standard deviation of the NPV or BCR of that path, giving an indication of the relative distance between the two values.
With regards to the ENPV, 10 out of 18 paths were over-predicted. Once the over and under predictions of NPVs were normalized in relation to their absolute values, it was found that the over and under predictions were of similar magnitudes to one another. The average under prediction was equal to 3.11% of the ENPV, in comparison to 3.12% for over-predictions.
The EBCR resulted in a lower BCR than the one estimated via deterministic methods for nine out of the 18 paths considered. The normalized average over prediction was 2.47%, while the average under prediction was 3.21%.
The standard deviations of both financial performance metrics were small relative to their mean values. As such, for all of the pathways considered, there were no ‘borderline’ cases that could experience failure or success depending upon which scenario was experienced. The relatively small standard deviations of performance would also indicate that the financial performances of the paths are fairly insensitive to the effects of potential futures.
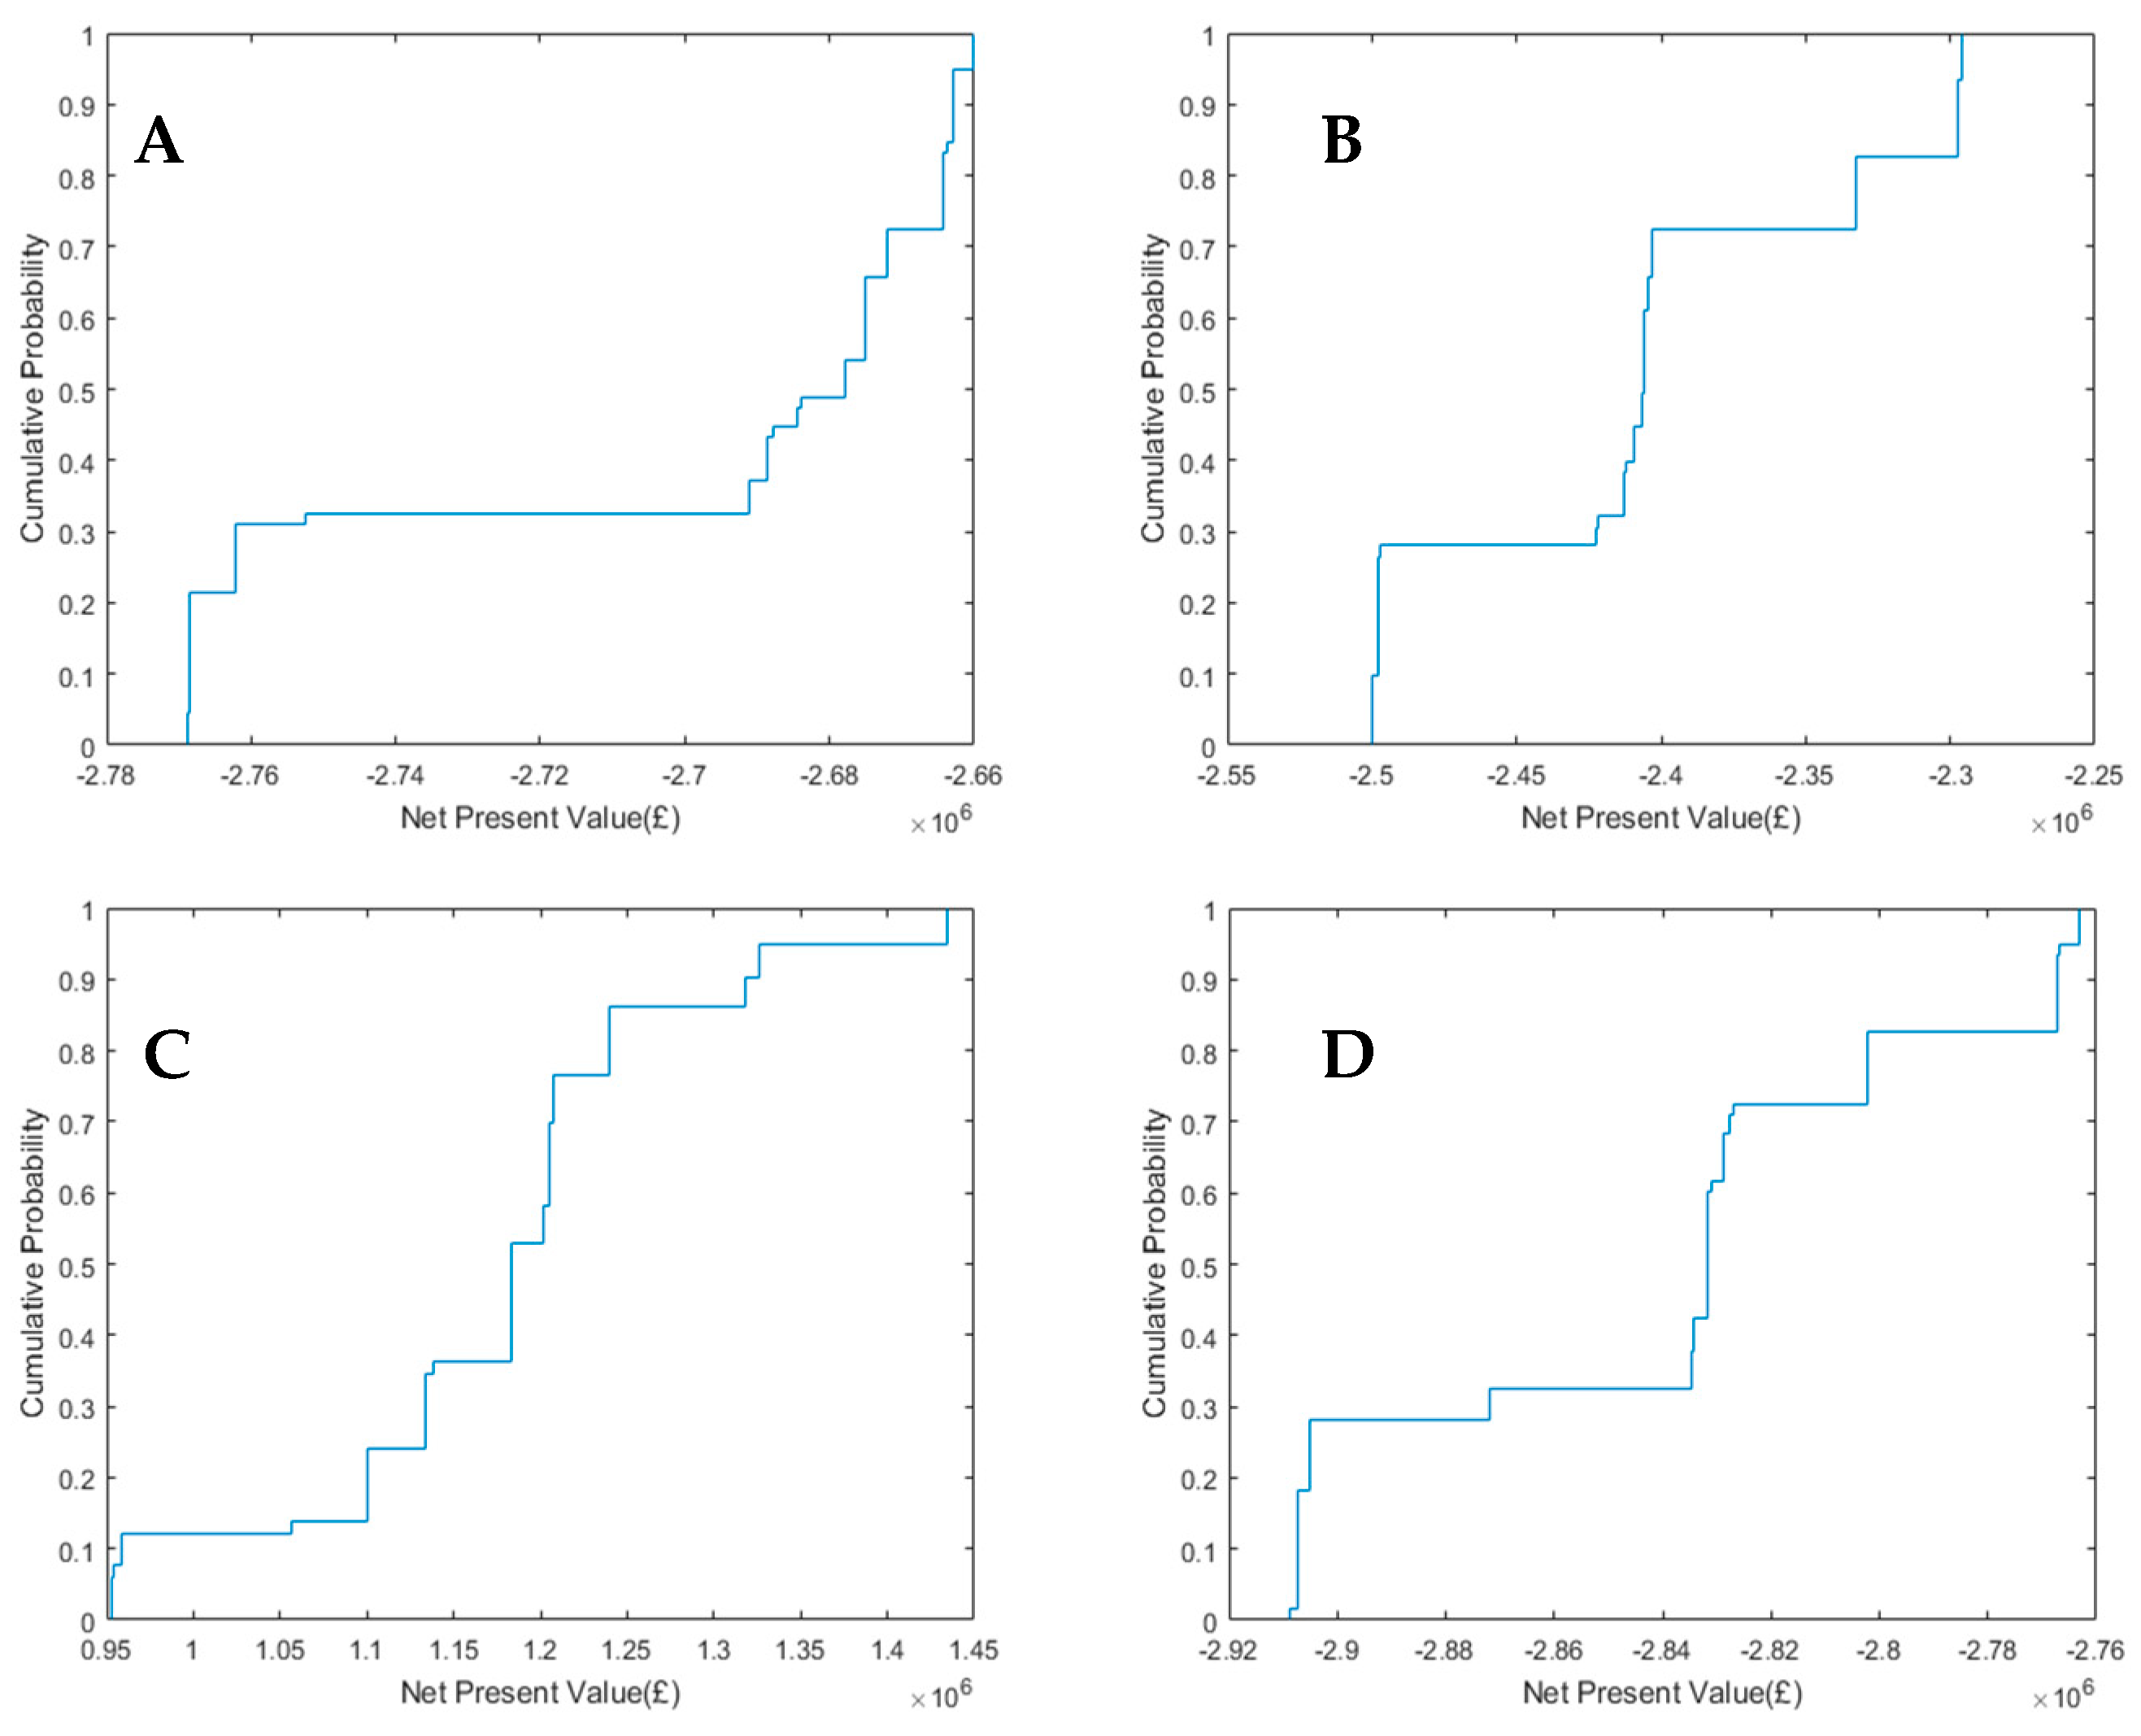
As in the deterministic analysis, the order in which options are implemented can have a profound impact on the Net Present Value of a pathway. There were four pathways that lead to the implementation of the strategy with the highest ATP, these were D, H, L and Q. Even though all four paths were found to be technically sound, the order in which adaptation options were implemented resulted in radically different NPVs. Figure 5 and Figure 6 show the empirical cumulative distribution functions for the financial performance of these four paths under uncertainty.
All four of these paths resulted in financial performances that were clearly positive or negative. This would suggest that the effects of uncertainty could not counteract the effect of path dependence, indicating that, for this case study, the order in which adaptations are implemented is paramount, and the effect of precipitation uncertainty is a secondary consideration.
Two hundred simulations of the future were generated and used to assess the financial performance of the pathways. These simulations were developed by sampling from a probability density function estimated by the UK Environment Agency [13] using a Monte Carlo method. While these 200 storms captured the majority of potential behaviors, several extreme cases exist which were not explored in this analysis. While further exploration of potential futures would allow for better characterization of tail events and a more robust exploration of a project’s ENPV, it is unlikely that these tail risks will impact decision-making. Furthermore, from the low standard deviation of financial performances, it can be observed that the financial performances of the paths exist in a narrow range. This would suggest that the further exploration of potential futures would not notably shift the distribution of the financial performances.
The process of evaluating projects under uncertainty requires the use of probability density functions. However, deep uncertainty denotes an inability to accurately assess the probability of future events occurring. To address this, a broad exploration of futures was utilised. The most extreme increases in storm depth explored are unlikely to occur without large stepwise changes in precipitation patterns occurring. Furthermore, the low standard deviation of the financial metrics calculated would indicate that performance is insensitive to future conditions. While this method does not fully address the issue of quantifying deep uncertainties, the resulting analysis is sufficiently robust to be of value for such conditions
The use of evaluation under uncertainty techniques resulted in more robust economic analysis than the use of deterministic methods. It was shown that the financial performance of paths determined by the deterministic method is not equal to the financial performance of the paths assessed under uncertainty. The average deviation of the deterministic method from the ENPV was equal to 0.96 standard deviations. For the BCR, the average deviation from the EBCR was equal to a distance of 0.8 standard deviations. This implies that Jensen’s inequality is in effect for the problem of urban drainage adaptation. Due to this, it can be assumed that the Expected Net Present Value and Expected Benefit-Cost Ratios estimated from the ensemble of futures deliver a more reliable assessment of financial performance than the assessment of pathways developed with the use of the deterministic projections.
4. Conclusions
Within this work, it is shown that it is possible to adapt a drainage system for up to a 44% increase in its design event rainfall depth while delivering a positive NPV and BCR. However, the return on investment delivered by the majority of potential adaptation strategies explored is negative. By evaluating the performance of potential strategies under uncertainty, it is shown that there are no edge cases where the success of a project is dependent upon which future scenario is explored. In turn, this gives decision makers a better appreciation for the range of potential outcomes that they may face, thus allowing for improved decision-making. The order in which solutions are implemented is critical in determining whether or not a positive NPV is generated. The paths that deliver a positive return on investment do so due to the advantageous order in which adaptations are introduced.
The solutions that show positive returns have BCR lower than what is mandated by the UK’s Environment Agency. This would indicate that adapting urban drainage systems to the risks of increased storm depth will prove to be costly, and that the minimum BCR required for a flood protection scheme to go forward may need to be adjusted to reflect the new reality of climatic non-stationarity.
Author Contributions
Conceptualization, F.B.; Methodology, F.B.; Formal Analysis, F.B.; Resources, A.M.; Data Curation, F.B.; Writing—Original Draft Preparation, F.B.; Writing—Review and Editing, A.M.; Visualization, F.B.; Supervision, A.M.
Funding
This research was funded by Engineering and Physical Sciences Research Council gant number [EP/L016826/1].
Acknowledgments
This work would not have been possible without funding from the Engineering and Physical Sciences Research Council (EPSRC) Centre for Doctoral Training (CDT) in Sustainable Civil Engineering.
Conflicts of Interest
The authors declare no conflict of interest.
References
- Intergovernmental Panel on Climate Change. IPCC, 2007: Summary for Policymakers; IPCC: Geneva, Switzerland, 2007. [Google Scholar]
- Intergovernmental Panel on Climate Change. Climate Change and Water: IPCC Technical Paper VI; IPCC: New York, NY, USA, 2008. [Google Scholar]
- Jenkins, G.; Murphy, J.M.; Sexton, D.M.H.; Lowe, J.A.; Jones, P.; Kilsby, C.G. UK Climate Projections Briefing Report; Met Office Hadley Centre: Exeter, UK, 2009. [Google Scholar]
- Walker, W.E.; Haasnoot, M.; Kwakkel, J.H. Adapt or perish: A review of planning approaches for adaptation under deep uncertainty. Sustainbility 2013, 5, 955–979. [Google Scholar] [CrossRef]
- Bryant, B.P.; Lempert, R.J. Thinking inside the box: A participatory, computer-assisted approach to scenario discovery. Technol. Forecast. Soc. Chang. 2010, 77, 34–49. [Google Scholar] [CrossRef]
- Zhang, S.; Babovic, V. A Real Options Approach to Design and Architect Water Supply Systems Using Innovative Water Technologies Under Uncertainty. J. Hydroinform. 2012, 14, 13–29. [Google Scholar] [CrossRef]
- Reeder, T.; Ranger, N. How do you adapt in an uncertain world? Lessons from the Thames Estuary 2100 project. In World Resources Report Uncertainty Series; World Resources Institute: Washington, DC, USA, 2011. [Google Scholar]
- Kwakkel, J.H.; Walker, W.E.; Marchau, V.A.W.J. Adaptive Airport Strategic Planning. Eur. J. Transp. Infrastruct. Res. 2010, 10, 249–273. [Google Scholar]
- Babovic, F.; Mijic, A.; Madani, K. Decision making under deep uncertainty for adapting urban drainage systems to change. Urban Water J. 2018. [Google Scholar] [CrossRef]
- Babovic, F.; Mijic, A. The Development of Adaptation Pathways for the Long Term Planning of Urban Drainage Systems. J. Flood Man. 2019, in press. [Google Scholar]
- Lawrence, J.; Haasnoot, M. Environmental Science & Policy What it took to catalyse uptake of dynamic adaptive pathways planning to address climate change uncertainty. Environ. Sci. Policy 2017, 68, 47–57. [Google Scholar]
- Lawrence, J.; Bell, R. A Hybrid Process to Address Uncertainty and Changing Climate Risk in Coastal Areas Using Dynamic Adaptive Pathways Planning, Multi-Criteria Decision Analysis & Real Options Analysis: A New Zealand Application. Sustainbility 2019, 11, 46. [Google Scholar]
- Environment Agency. Adapting to Climate Change: Advice for Flood and Coastal Erosion Risk Management Authorities; Environment Agency: Bristol, UK, 2016.
- Penning-Rowsell, E.; Priest, S.; Parker, D.; Morris, J.; Tunstall, S.; Viavattene, C.; Chatterton, J.; Owen, D. Flood and Coastal Erosion Risk Management: A Manual for Economic Appraisal; Routledge: Oxon, UK, 2013. [Google Scholar]
- AECOM. Spon’s Civil Engineering and Highway Works Price Book 2012, 26th ed.; Spon Press: London, UK, 2012. [Google Scholar]
- H.R Wallingford. Whole Life Costing for Sustainable Drainage; HR Wallingford: Wallingford, UK, 2004. [Google Scholar]
- Royal Haskoning DHV. Costs and Benefits of Sustainable Drainage Systems; Royal Haskoning: Peterborough, UK, 2012. [Google Scholar]
- Digman, C.J.; Horton, B.; Ashley, R.M.; Gill, E. BeST (Benefits of SuDS Tool) W045d BeST—User Manual; Ciria: London, UK, 2016. [Google Scholar]
- MWH. Demonstrating the Multiple Benefits of SuDS—A Business Case; Ciria: London, UK, 2013. [Google Scholar]
- Lowe, J. Intergenerational Wealth Transfers and Social Discounting: Supplementary Green Book Guidance; HM Treasury: London, UK, 2008.
- Defra. Surface Water Management Plan Technical Guidance; Defra: London, UK, 2010.
- Savage, S. The Flaw of Averages: Why We Underestimate Risk in the Face of Uncertainty; Wiley: Hoboken, NJ, USA, 2009. [Google Scholar]
- Jensen, J.L.W.V. Sur les fonctions convexes et les inegalites entre les valeurs moyennes. Acta Math. 1906, 30, 175–193. [Google Scholar] [CrossRef]
- De Neufville, R.; Scholtes, S. Flexibility in Engineering Design; MIT Press: Boston, MA, USA, 2011. [Google Scholar]
- Taleb, N.N.; Canetti, E.; Kinda, T.; Loukoianova, E.; Schmieder, C. A New Heuristic Measure of Fragility and Tail Risks: Application to Stress Testing; International Monetary Fund: Washington, DC, USA, 2012. [Google Scholar]
- Trigeorgis, L. Real Options: Managerial Flexibility and Strategy in Resource Allocation; MIT Press: Cambridge, UK, 1996. [Google Scholar]
- Buurman, J.; Babovic, V. Adaptation Pathways and Real Options Analysis: An approach to deep uncertainty in climate change adaptation policies. Policy Soc. 2016. [Google Scholar] [CrossRef]
- Wong, M.K. Flexible Design: An Innovative Approach for Planning Water Infrastructure Systems Under Uncertainty; Massachusetts Institute of Technology: Cambridge, MA, USA, 2013. [Google Scholar]
- Environment Agency. Flooding in England: A National Assessment of Flood Risk; Environment Agency: Bristol, UK, 2009.
Figure 1.
Adaptation Pathways for increases in depth. Adaptation Pathways are read from left to right. Adaptations are listed on the left. The current situation represents system performance without any adaptations. When a strategy reaches its ATP, potential suitable adaptations are suggested. Multi-coloured lines indicate that multiple adaptations are present.

Figure 2.
Potential increase in the precipitation depth of rare storm events over time, based upon Environment Agency [13]. The high, medium and low scenarios represent the projections at the ninetieth, fiftieth, and tenth percentiles.
Figure 2.
Potential increase in the precipitation depth of rare storm events over time, based upon Environment Agency [13]. The high, medium and low scenarios represent the projections at the ninetieth, fiftieth, and tenth percentiles.

Figure 3.
Potential paths through the adaptation tube map.

Figure 4.
Two hundred projections of increases in the precipitation depths of rare storm events.

Figure 5.
Empirical Cumulative Distribution Function of the Benefit-Cost Ratios for paths D (subfigure (A)), H (subfigure (B)), L (subfigure (C)), and Q (subfigure (D)).
Figure 5.
Empirical Cumulative Distribution Function of the Benefit-Cost Ratios for paths D (subfigure (A)), H (subfigure (B)), L (subfigure (C)), and Q (subfigure (D)).

Figure 6.
Empirical Cumulative Distribution Function of the Net Present Values for paths D (subfigure (A)), H (subfigure (B)), L (subfigure (C)), and Q (subfigure (D)).
Figure 6.
Empirical Cumulative Distribution Function of the Net Present Values for paths D (subfigure (A)), H (subfigure (B)), L (subfigure (C)), and Q (subfigure (D)).


Table 1.
Order of adaptations for each path.
| Path | Order of Adaptations |
|---|---|
| A | 1 m Lake Deepening |
| B | 1 m Lake Deepening & 20% Porous Pavements |
| C | 1 m Lake Deepening & 50% Green Roofs |
| D | 1 m Lake Deepening & 50% Green Roofs & 40% Porous Pavements |
| E | 25% Green Roofs |
| F | 25% Green Roofs & 1 m Lake Deepening |
| G | 5% Green Roofs & 1 m Lake Deepening & 25% Green Roofs |
| H | 25% Green Roofs & 1 m Lake Deepening & 25% Green Roofs & 40% Porous Pavement |
| I | 25% Green Roofs & 0.5 m Lake Deepening |
| J | 25% Green Roofs & 0.5 m Lake Deepening & 0.5 m Lake Deepening |
| K | 25% Green Roofs & 0.5 m Lake Deepening & 0.5 m Lake Deepening & 25% Green Roofs |
| L | 25% Green Roofs & 0.5 m Lake Deepening & 0.5 m Lake Deepening & 25% Green Roofs & 40% Porous Pavements |
| M | 0.5 m Lake Deepening |
| N | 0.5 m Lake Deepening & 25% Green Roofs |
| O | 0.5 m Lake Deepening & 25% Green Roofs & 0.5 m Lake Deepening |
| P | 0.5 m Lake Deepening & 25% Green Roofs & 0.5 m Lake Deepening & 25% Green Roofs |
| Q | 0.5 m Lake Deepening & 25% Green Roofs & 0.5 m Lake Deepening & 25% Green Roofs & 40% Porous Pavement |
| R | 10% Increase in Sewer Diameter |
Table 2.
CAPEX and OPEX of adaptation options.
| Path | CAPEX/Unit | OPEX/Unit | Total CAPEX | Total OPEX |
|---|---|---|---|---|
| Deepen Lake by 0.5 m | £5.41/m3 [14] | £0.5/m3 [16] | £66,000 | £6100 |
| Deepen Lake by 1 m | £5.41/m3 [14] | £0.5/m3 [16] | £132,000 | £12,200 |
| Convert 25% of roofs to green roofs | £47/m2 [16] | £0.15/m2 [17] | £1,770,000 | £48,750 |
| Convert 50% of roofs to green roofs | £47 /m2 [16] | £0.15/m2 [17] | £3,540,00 | £97,500 |
| Convert 20% of pavement to porous pavements | £54 /m2 [17] | £0.16/m2 [16] | £1,700,000 | £5000 |
| Convert 40% of pavement to porous pavements | £54/m2 [17] | £0.16/m2 [16] | £3,400,000 | £100,000 |
| Increase diameter of trunk sewer by 10% | - | - | £2,340,000 | £1800 |
Table 3.
The value delivered by potential ecosystem services.
| Adaptation Option | Ecosystem Service Delivered | Annual Value of Individual Service | Total Value of Annual Services |
|---|---|---|---|
| Convert 25% of roofs to green roofs | Air Quality | £10,000 | £160,000 |
| Reduction in Building Energy Demand | £150,000 | ||
| Convert 20% of pavement to porous pavements | Ground Water Recharge | £17,000 | £17,000 |
Table 4.
Net Present Values and Benefit-Cost Ratios of the paths explored.
| Path | Net Present Value | Benefit-Cost Ratio |
|---|---|---|
| A | £15,300 | 1.06 |
| B | −£1,140,000 | 0.21 |
| C | −£1,330,000 | 0.55 |
| D | −£2,660,000 | 0.53 |
| E | −£987,000 | 0.50 |
| F | −£268,000 | 0.89 |
| G | −£965,000 | 0.74 |
| H | −£2,300,000 | 0.64 |
| I | £3,120,000 | 2.33 |
| J | £3,170,000 | 2.31 |
| K | £2,470,000 | 1.68 |
| L | £1,130,000 | 1.18 |
| M | £138,000 | 2.12 |
| N | −£777,000 | 0.44 |
| O | −£737,000 | 0.50 |
| P | −£1,720,000 | 0.36 |
| Q | −£2,770,000 | 0.48 |
| R | −£2,230,000 | 0.02 |
Table 5.
Aggregate financial performance of potential paths under uncertainty.
| Path | Expected Net Present Value | Standard Deviation of NPV | Expected Benefit-Cost Ratio | Standard Deviation of BCR |
|---|---|---|---|---|
| A | £13,000 | £3500 | 1.05 | 0.014 |
| B | −£1,170,000 | £22,000 | 0.21 | 0.006 |
| C | −£1,370,000 | £32,000 | 0.55 | 0.012 |
| D | −£2,700,000 | £44,000 | 0.53 | 0.010 |
| E | −£1,000,000 | £52,000 | 0.48 | 0.032 |
| F | −£260,000 | £26,000 | 0.89 | 0.011 |
| G | −£1,000,000 | £61,000 | 0.70 | 0.018 |
| H | £2,400,000 | £71,000 | 0.63 | 0.010 |
| I | £3,250,000 | £127,000 | 2.39 | 0.054 |
| J | £3,320,000 | £125,000 | 2.37 | 0.052 |
| K | £2,510,000 | £122,000 | 1.70 | 0.033 |
| L | £1,170,000 | £114,000 | 1.18 | 0.018 |
| M | £130,000 | £5000 | 2.11 | 0.028 |
| N | −£760,000 | £33,000 | 0.47 | 0.032 |
| O | −£690,000 | £24,000 | 0.54 | 0.023 |
| P | −£1,720,000 | £23,000 | 0.36 | 0.008 |
| Q | −£2,840,000 | £49,000 | 0.48 | 0.010 |
| R | −£2,240,000 | £5300 | 0.01 | 0.003 |
Table 6.
Comparison of financial performance evaluated under uncertainty to the financial performance evaluated under the central deterministic scenario.
Table 6.
Comparison of financial performance evaluated under uncertainty to the financial performance evaluated under the central deterministic scenario.
| Path | Difference in NPV | Normalised Deviation from ENPV | Difference in BCR | Normalised Deviation from EBCR |
|---|---|---|---|---|
| A | £2400 | 0.70 | −0.009 | 0.64 |
| B | −£29,000 | 1.34 | −0.005 | 0.73 |
| C | −£40,000 | 1.24 | −0.006 | 0.51 |
| D | −£39,000 | 0.88 | 0.006 | 0.59 |
| E | −£39,000 | 0.75 | −0.024 | 0.74 |
| F | £6200 | 0.24 | 0.003 | 0.27 |
| G | −£100,000 | 1.80 | −0.034 | 1.87 |
| H | −£110,000 | 1.53 | −0.013 | 1.31 |
| I | £130,000 | 1.03 | 0.058 | 1.07 |
| J | £150,000 | 1.24 | 0.060 | 1.16 |
| K | £40,000 | 0.33 | 0.020 | 0.61 |
| L | £40,380 | 0.36 | 0.005 | 0.26 |
| M | −£5200 | 1.03 | −0.018 | 0.64 |
| N | £19,000 | 0.57 | 0.028 | 0.88 |
| O | £43,000 | 1.81 | 0.044 | 1.92 |
| P | £3600 | 0.16 | 0.000 | 0.05 |
| Q | −£73,000 | 1.47 | −0.003 | 0.34 |
| R | −£4300 | 0.81 | −0.002 | 0.81 |
© 2019 by the authors. Licensee MDPI, Basel, Switzerland. This article is an open access article distributed under the terms and conditions of the Creative Commons Attribution (CC BY) license (http://creativecommons.org/licenses/by/4.0/).
Share and Cite
MDPI and ACS Style
Babovic, F.; Mijic, A. Economic Evaluation of Adaptation Pathways for an Urban Drainage System Experiencing Deep Uncertainty. Water 2019, 11, 531. https://doi.org/10.3390/w11030531
AMA Style
Babovic F, Mijic A. Economic Evaluation of Adaptation Pathways for an Urban Drainage System Experiencing Deep Uncertainty. Water. 2019; 11(3):531. https://doi.org/10.3390/w11030531
Chicago/Turabian StyleBabovic, Filip, and Ana Mijic. 2019. "Economic Evaluation of Adaptation Pathways for an Urban Drainage System Experiencing Deep Uncertainty" Water 11, no. 3: 531. https://doi.org/10.3390/w11030531
Note that from the first issue of 2016, this journal uses article numbers instead of page numbers. See further details here.