An Experimental Study on Mechanisms for Sediment Transformation Due to Riverbank Collapse


1
School of Environment, Key Laboratory of Water and Sediment Sciences of MOE, Beijing Normal University, Beijing 100875, China
2
Department of Civil and Structural Engineering, The University of Sheffield, Sir Frederick Mappin Building, Mappin Street, Sheffield S1 3JD, UK
*
Author to whom correspondence should be addressed.
Water 2019, 11(3), 529; https://doi.org/10.3390/w11030529
Submission received: 16 December 2018
/
Revised: 1 March 2019
/
Accepted: 4 March 2019
/
Published: 14 March 2019
(This article belongs to the Special Issue Advances in Hydraulics and Hydroinformatics)
Abstract
:Riverbank erosion is a natural process in rivers that can become exacerbated by direct and indirect human impacts. Unfortunately, riverbank degradation can cause societal impacts such as property loss and sedimentation of in-stream structures, as well as environmental impacts such as water quality impact. The frequency, magnitude, and impact of riverbank collapse events in China and worldwide are forecasted to increase under climate change. To understand and mitigate the risk of riverbank collapse, experimental/field data in real conditions are required to provide robust calibration and validation of hydraulic and mathematical models. This paper presents an experimental set of tests conducted to characterize riverbank erosion and sediment transport for banks with slopes of 45°, 60°, 75°, and 90° and quantify the amount of sediments transported by the river, deposited within the bank toe or settled in the riverbed after having been removed due to erosion. The results showed interesting comprehension about the characterization of riverbank erosion and sediment transport along the river. These insights can be used for calibration and validation of new and existing numerical models.
1. Introduction
Rivers and streams are dynamic systems and are continuously changing their structure due to different flow conditions. Riverbank erosion [1] commonly refers to the removal of bank material by flowing water or carried sediment. This is a phenomenon that derives from two categories of factors [2]: natural (e.g., climate parameters such as precipitation type, intensity, and variability, or soil properties like water content and shear strength and type of vegetation) and human actions [3] (e.g., construction of dams, logging, and intensive grazing).
The phenomenon of riverbank collapse incorporates a variety of bank and riverbed deformations in the affected sections (e.g., the longitudinal erosion and deposition of material on the riverbed or the transverse deformation of riverbed channels) [4]. These deformations assume different shapes and typically alter the cross-sectional morphology of the river affected. This phenomenon plays a very important role in the evolution of rivers, and despite the fact that some stable rivers have a healthy amount of erosion from which they benefit, unstable rivers and the erosion taking place on their banks are a cause for economic, environmental, and social concern: for example, (i) people are forced to migrate due to land erosion; (ii) riverbank collapse causes the loss of large areas of farmland; (iii) riverbank collapse can change the original boundary conditions of the river as well as the water and sediment conditions when large amounts of sediments enter the river channel and siltation occurs; (iv) the sediments eroded due to riverbank collapse are one of the main sources of river sediments and make the river muddy, originating environmental and ecological problems. Therefore, this phenomenon is a great concern for the society and researchers should accurately characterize and assess the several causes that typically accelerate this phenomenon that leads to major impacts, and they should identify feasible solutions for mitigation and adaptation strategies to be implemented.
For non-cohesive riverbanks, the sediment particles on the bank slope are mainly affected by the thrust on the bank, the uplift force, and the gravity effect generated by the water flowing in the river [5]. When the slope of the riverbank is larger than the underwater angle formed by the deposition of eroded sediment, the soil within the upper layer typically collapses along a sliding surface, usually in the form of “shallow collapse” [6]. Particle entrainment can be quantified using the magnitude of the shear stress and the particle size [7,8] for each soil type. On the other hand, cohesive riverbanks, more commonly found worldwide within river streams, are not only subject to these forces but also to the inter-particle cohesion magnitude. Lohnes et al. [9] completed a study to analyze the stability of cohesive riverbanks by calculating the ratio of the driving forces to provide resistance on the collapse surface, and proposed a hypothetical collapse model to be associated with cohesive riverbanks. However, the model that Lohnes et al. [9] developed does not take into consideration the effects of tensile cracks [10], pore water pressure [11], and hydrostatic pressure, and only assumes that the collapse surface can pass through the slope foot and therefore this method can only be applied to relatively steep cohesive riverbanks [12,13]. On this basis, Osman et al. [10] established an additional collapse model for cohesive riverbanks, which takes into account the effects of tensile cracks and assumes that the collapse surface passes through the bank slope foot. The study conducted by Darby et al. [14] also considered the actual topography of the riverbank, plus the pore water pressure and the hydrostatic pressure. Few years later, Rinaldi and Casagli [15] introduced the suction component of saturated and unsaturated parts of the riverbank into the identified collapse mode. Over the last decade, the bank stability and toe erosion model (BSTEM) proposed by the US National Sediment Laboratory has been widely used to numerically quantify the erosion within riverbanks. In this model, the process of riverbank collapse is divided into two parts [16]: (a) the slope foot erosion and (b) the riverbank stability analysis. However, other studies have been completed to provide alternative numerical and mathematical solutions. Huang et al. [17] also established a mathematical model for the collapse, quantifying the factors affecting the riverbank stability. Wang and Kuang [18] derived an equation for calculating the critical height of the initial and secondary riverbank collapse while Xia et al. [19] established a secondary collapse model to be used for cohesive riverbanks that analyzes the forces applied on the bank using the soil typical of the lower Yellow River.
Furthermore, the composite riverbank of an alluvial river generally exhibits a dual structure of two single layers (with different thickness and same distribution) or a tiered structure (with different thickness and distributions). For this last configuration, cantilever collapse [20] and piping collapse [21] are more likely to occur. Xia et al. [22] studied the dual structure experienced within the lower Jingjiang River and specified the three stages of dual structure cantilever collapse, quantifying the influencing factors and analyzing the collapse process. Once the riverbank collapse has taken place, the eroded material is transported within the river and this process is composed of three steps: (i) riverbank collapse and movement of eroded particles; (ii) sediment deposition and its interaction within the riverbed; and (iii) sediment transport along the river. Nagata et al. [23] combined the riverbank collapse model with a two-dimensional mathematical model to simulate the deformation process of the river channel. Darby and Delbono [24] combined a two-dimensional model with the collapse mode of cohesive riverbanks to calculate the deformation process of curved channels. Simon et al. [25] comprehensively considered the impact of sediment accumulation from eroded banks and collapsed banks on the riverbed, using the BSTEM model to estimate the riverbank collapse and material sedimentation under different flood conditions. Darby et al. [26] predicted the evolution of river channels composed of fine sand by coupling an infiltration model and the collapse model. Jia et al. [27] combined the dual structure collapse mode with the three-dimensional model to simulate the evolution of Shishou Bay in the lower Jingjiang River. Nardi et al. [28] simulated the evolution of rivers where bed is composed by medium grained sand. Xiao et al. [29] simulated the river evolution process under the influence of vegetation by combining non-cohesive riverbank collapse models with the shallow water equation. Xia et al. [30] established a mixed model of two-dimensional riverbed deformation in the orthogonal curvilinear coordinate system, and simulated the evolution process of the wandering sections of the lower Yellow River. Jia et al. [31], based on the Osman model, built a three-dimensional water sediment model with bank deformation considered and effectively simulated the horizontal oscillations of river channels caused by cohesive riverbank collapse. These studies demonstrate that the riverbed erosion is a phenomenon clearly observed but they do not consider the characterization of the motion of the sediment eroded and the load in the riverbed. Without considering these aspects, it is very difficult to replicate the riverbed erosion phenomenon with numerical models due to the paucity of existing datasets useful for calibration and validation of numerical tools. Mathematical models developed to date can be used to obtain riverbed and riverbank deformations but are applicable only under limited boundary conditions. Furthermore, it is still very challenging to numerically replicate multiple conditions associated with various slopes and flow conditions because of the paucity of high resolution localized data for this type of phenomenon. Hence, more field or experimental studies are needed to calibrate and validate the dynamic features associated with riverbank erosion under numerous conditions.
Focusing on previous studies based on physical models, Yu et al. [32] used a flume test to qualitatively analyze the interactions between material eroded due to hydraulic effect and its deposition in the river. Yu and Guo [33] studied the coupling relationship between material eroded and its transportation and deposition in the riverbed using a curved channel flume. Wu and Yu [34] revealed new insights on this natural phenomenon for cohesive riverbank collapse, non-cohesive riverbank collapse, and riverbed deposition via experimental tests. Deng et al. [35] simulated the collapse process of the upper Jingjiang Riverbank by combining the longitudinal deposition of the riverbed surface with the secondary collapse mode of cohesive riverbanks. Yu et al. [36] studied the interactions between bank collapse and riverbed deposition for different near-shore riverbed compositions by using a curved channel flume to complete the experimental tests.
Physical experiments can qualitatively measure the amount of material eroded and the amount of material deposited within the close riverbed sections to fulfill the gaps previously described. This paper presents the results obtained with an experimental flume constructed at the Key Laboratory of Water and Sediment located within the School of Environment of Beijing Normal University, investigated the phenomenon of riverbank collapse utilizing a variety of slopes (45°, 60°, 75°, and 90°) for cohesive banks, and characterized the transport of riverbank eroded material within rivers under dissimilar flow conditions (45 and 60 L/s). The datasets provided led to new insights for riverbank erosion under novel specific physical and hydraulic conditions and can be used by numerical modelers to validate relationships between variables associated with this natural phenomenon.
2. Methodology
2.1. Experiments
The experiments were conducted in the multi-function flume (0.8 m wide, 0.8 m deep, and total length of 25 m), located at the School of Environment, Key Laboratory of Water and Sediment of Beijing Normal University, China. By using a set of rigorous procedures authors guaranteed the continuous accurate re-construction of the bank slopes tested (four configurations) within this facility, ensuring the regularity of the experiments.
2.1.1. Experimental Setup
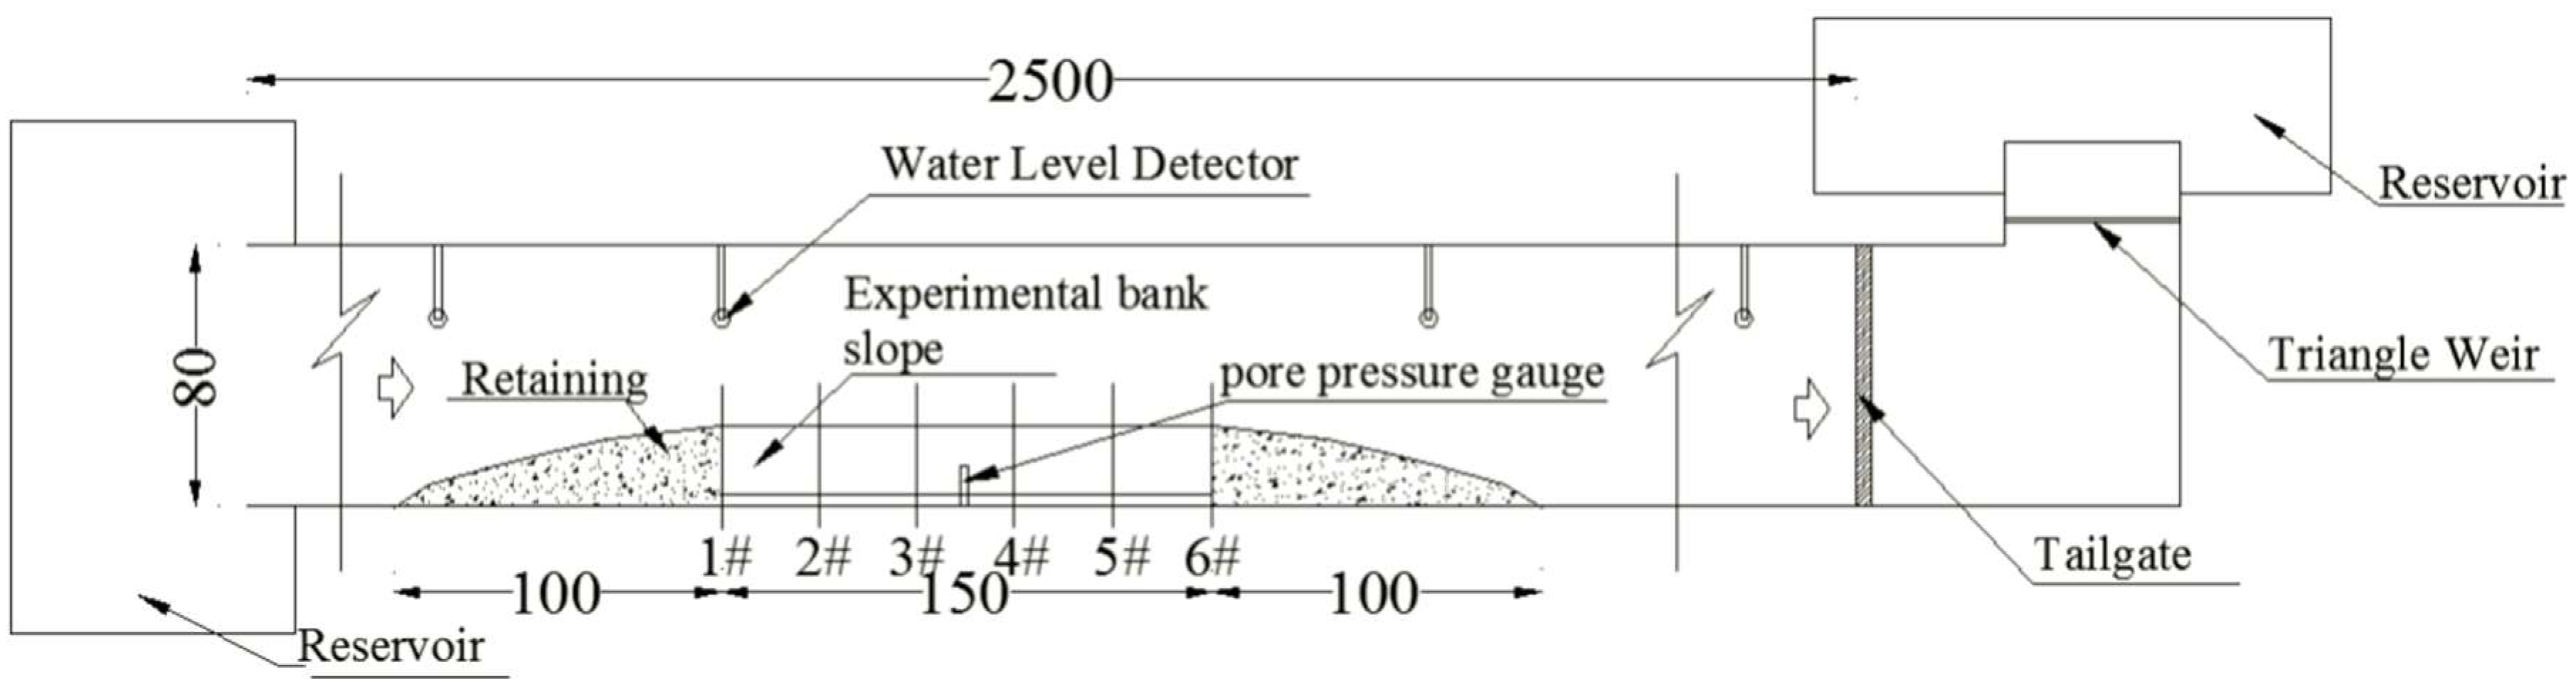
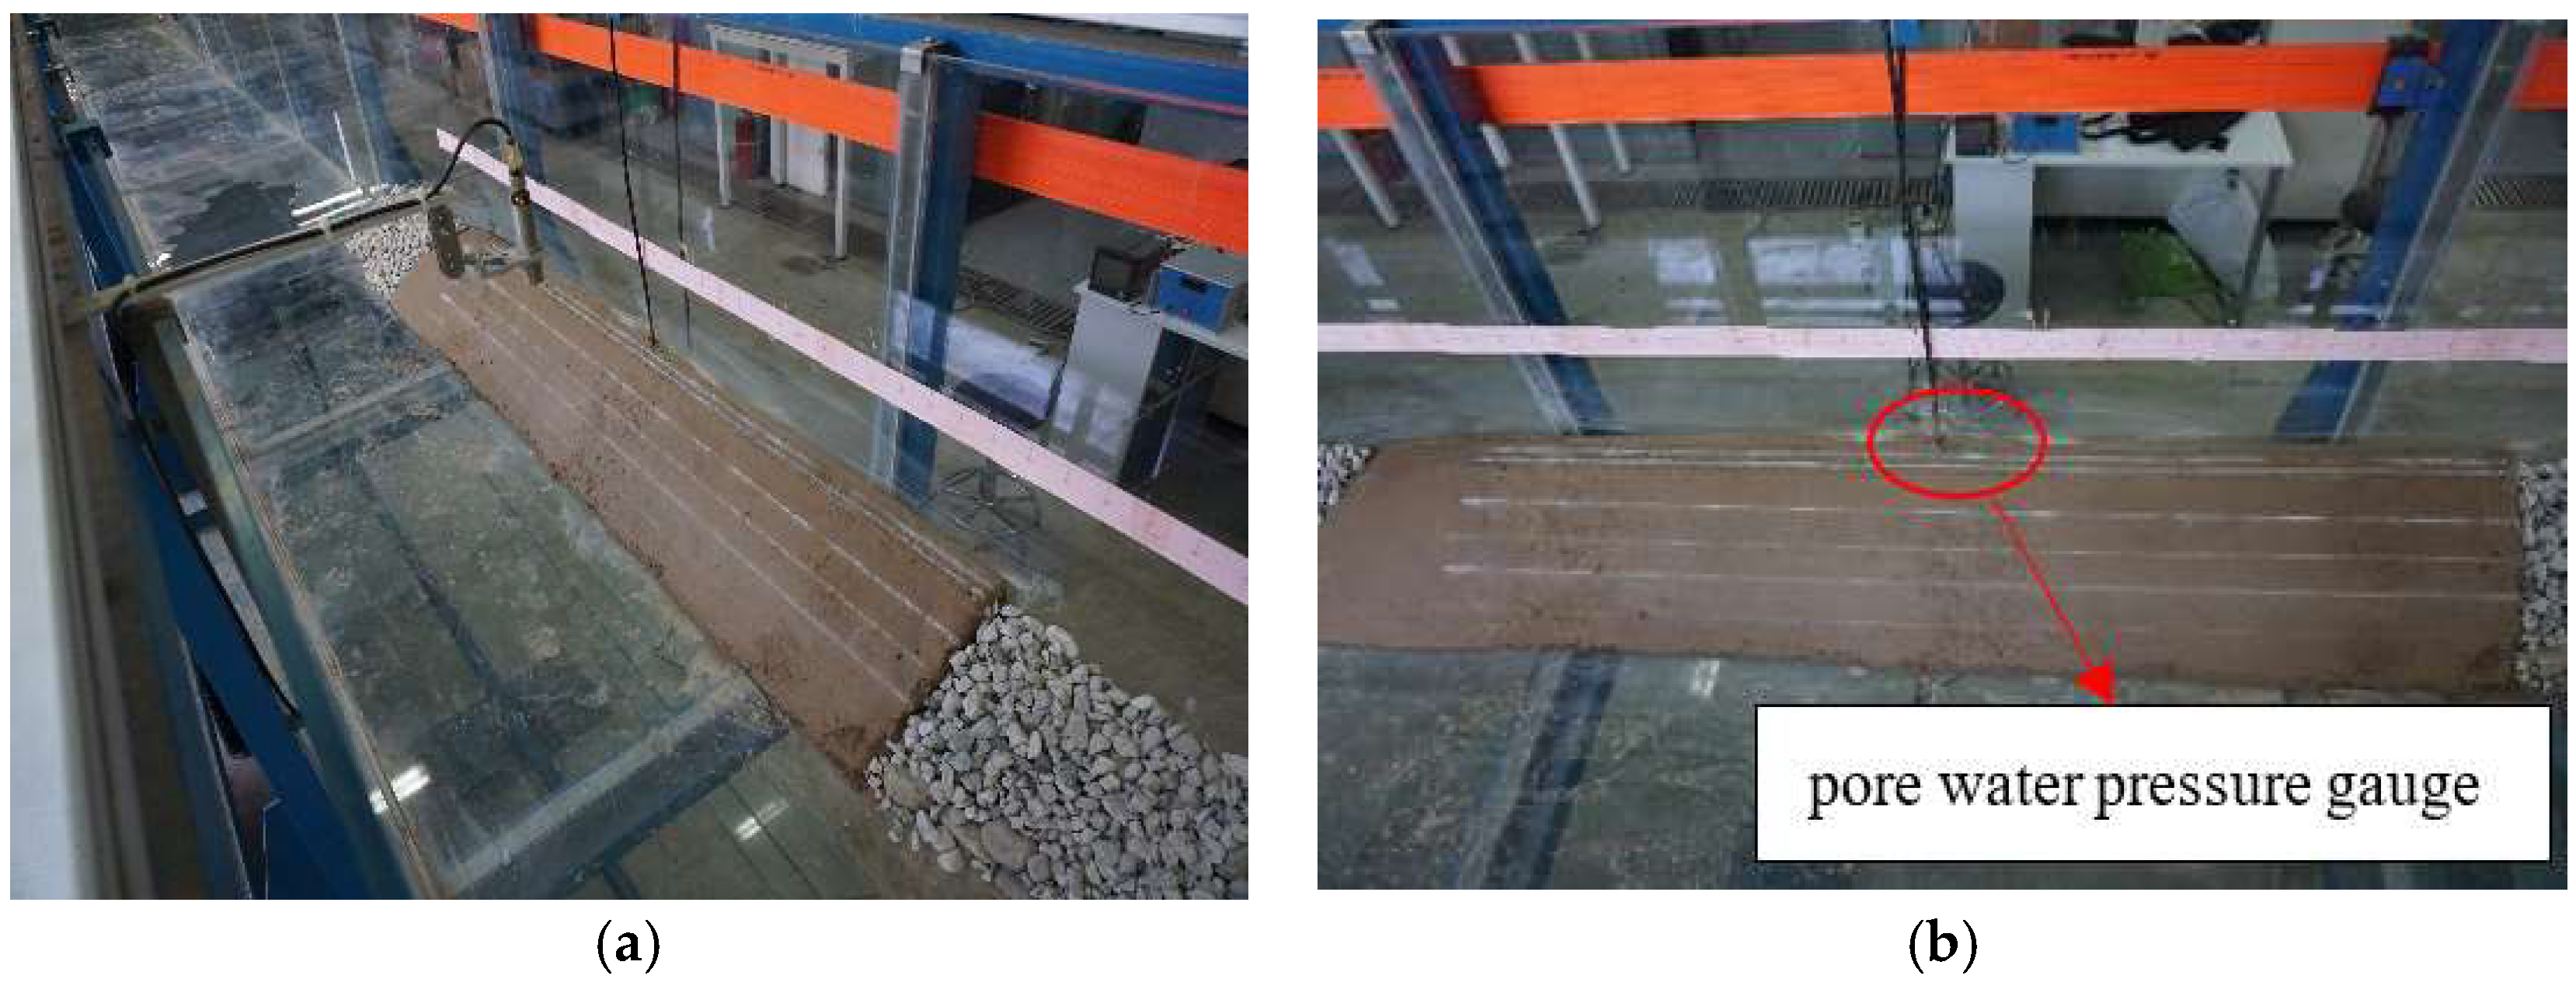
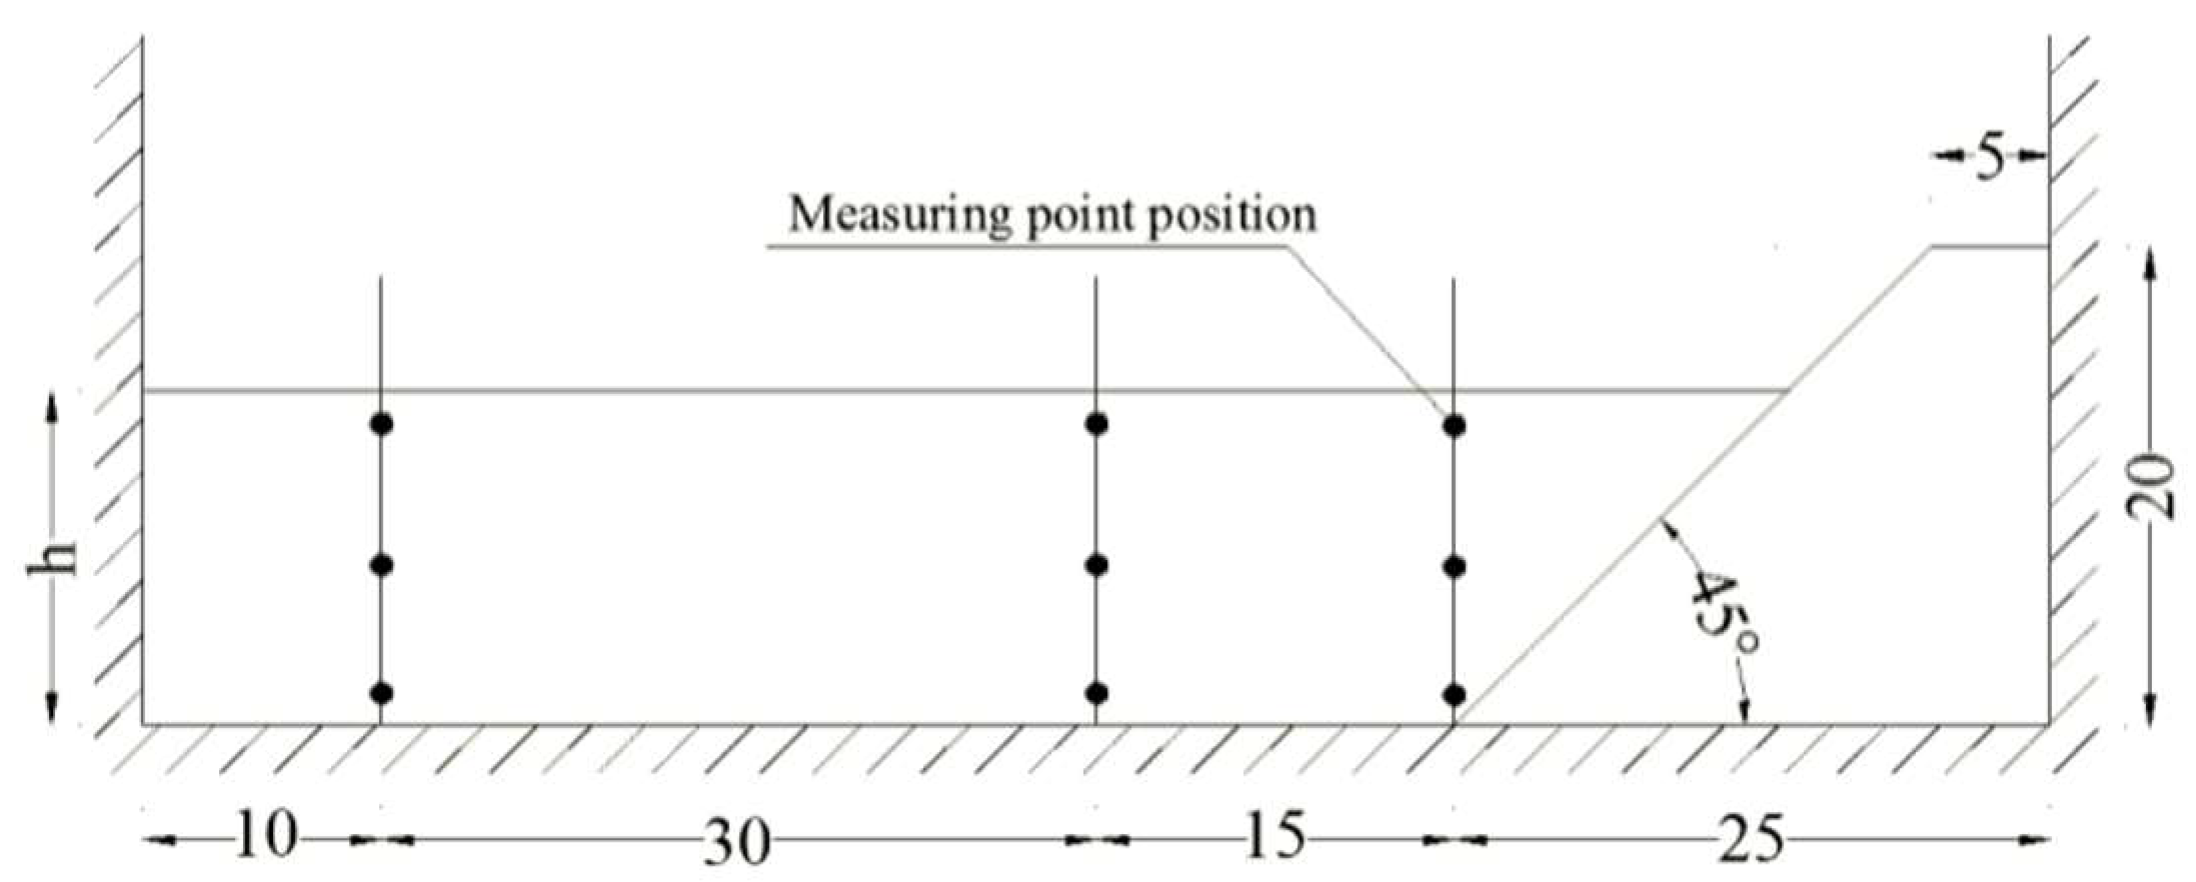
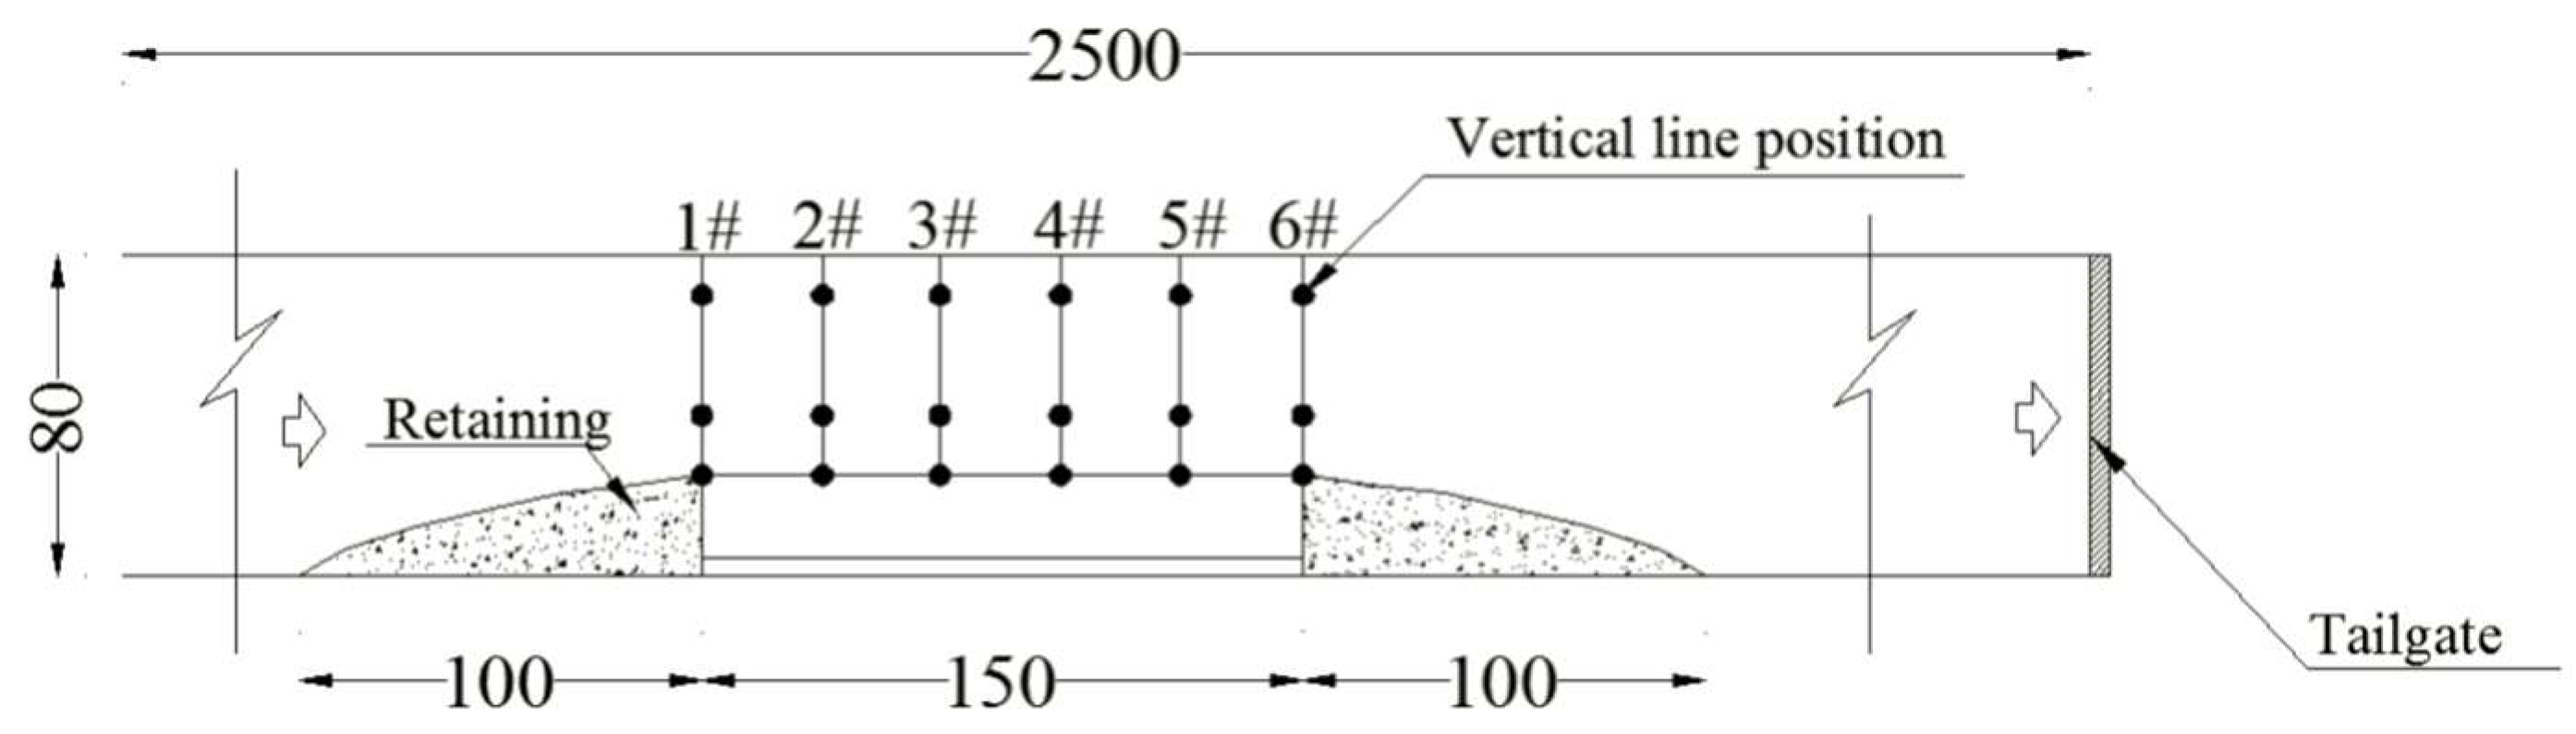
Gravel material was located upstream and downstream of the bank re-created to enable constant boundary conditions. Authors constructed in the laboratory a container with the dimensions of the banks to be replicated and fit it (once filled with material) within the flume for each experiment, guaranteeing the same position each time (±2 mm) by controlling reference points identified at the edge of the investigation area. Six sections (1#, 2#, 3#, 4#, 5#, and 6# as displayed in Figure 1) were identified within the bank to monitor the relevant parameters for this study. Four water level gauges were fitted in the flume to monitor the water level, and a pore water pressure gauge was embedded to monitor changes in the pore water pressure inside the bank as shown in Figure 2b. An example of constructed bank slope fitted within the experimental flume is shown in Figure 2a. For each experiment, velocities associated to each flow rate were measured at multiple locations within sections by using a propeller (accuracy 0.01 m/s), as represented in Figure 3, for the six sections illustrated in Figure 4. Water samples containing material were taken every three minutes at three monitoring section (1#, 3#, 5#) plus at the tailgate to measure the correspondent sediment concentration. A camera was set up on the side of the flume to record the whole process of bank slope collapse.
2.1.2. Experimental Testing Conditions
Based on field observations [37], four bank slope configurations (No.1, No.2, No.3, and No.4 as shown in Table 1) were considered and replicated with the experimental facility. Material utilized for this study was collected in the natural riverbank located in the upstream section of the Yellow River, from Dengkou County of the Ningmeng reach (Figure 5a) and the particle size distribution is shown in Figure 5b. All the physical properties of the tested materials are listed in Table 2.
2.1.3. Experimental Procedure
Each experiment was conducted following these steps:
(1) Before each group of experiments, soil samples were taken from the monitored sections on the bank slope to obtain parameters such as unit weight, water content, and size distribution associated to initial conditions and hence parameter of comparison with data collected successively.
(2) In order to avoid bank toe erosion caused by a drastic change of water level during the initial water discharge released, the tailgate was kept close and water was entering the flume very slowly. When the water reached the designed level, the release was interrupted to let the part of the bank under slope to be soaked as in the natural scenario. When the soil was saturated, water was then discharged according to the designed flow, and the tailgate was opened as designed. This moment was considered the start of the experiment.
(3) After each experiment began, the monitoring devices in the flume were turned on to monitor the water level in real time, as well as the camera to record the collapse process.
(4) Samples were taken regularly at the monitoring section (1#, 3#, 5#) plus at the tailgate to measure the sediment concentration. A ladle was used to take samples of sandy water from the flow, then the samples collected were put into a beaker. The weight of the beaker and sandy water could be obtained by using a scale. Successively, the beaker was inserted in the oven, and once it was dry, the weight of sediment remained by the evaporation of the water could be obtained by using the weight scale. Finally, the concentration could be obtained dividing the weight of sediment by the weight of sandy water. The accuracy of scale is 0.01 g.
(5) For each configuration group, 45 L/s flowed over a pre-constructed bank for 40 min and 60 L/s flowed over a water worked bank for additional 30 min.
(6) When there was no more observation of riverbank material being removed or eroded, the erosion process was considered completed, the water was stopped and the remaining terrain (and its shape) of the riverbank was measured by regularly removing 20 cm of section each time and create profiles at each removal step.
2.2. Data Processing
2.2.1. Estimation of Riverbank Collapse Volume
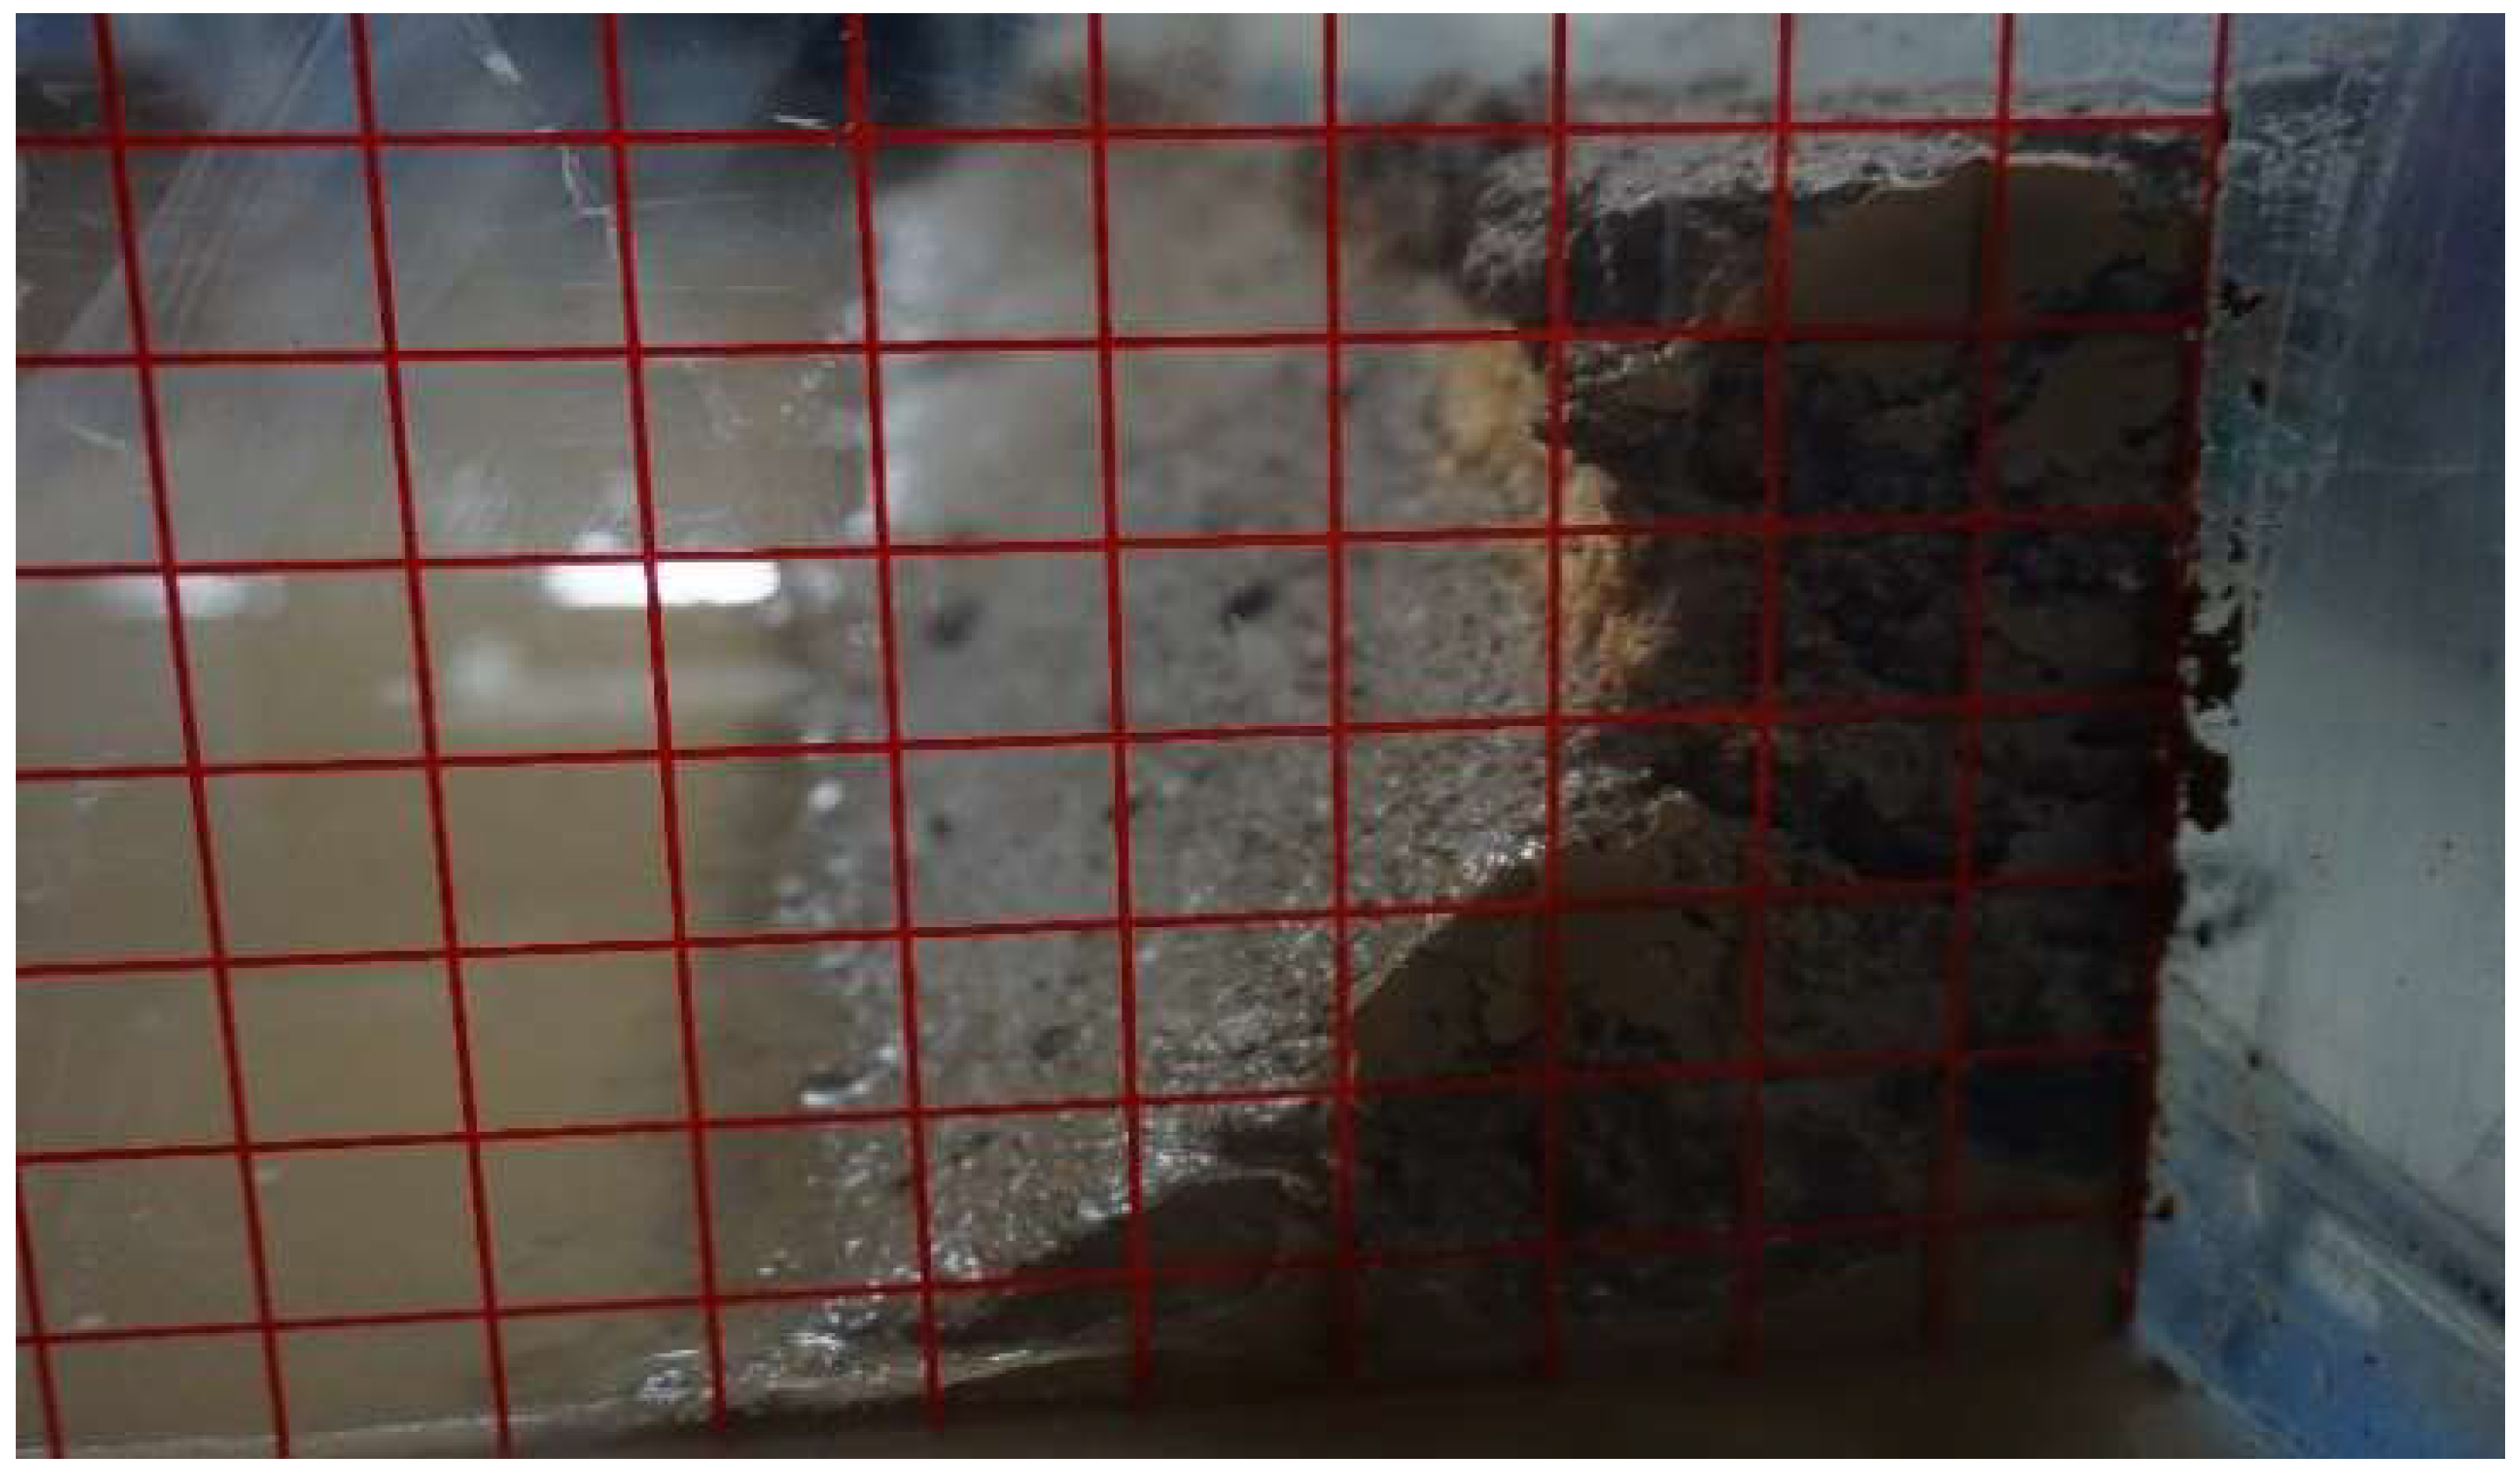
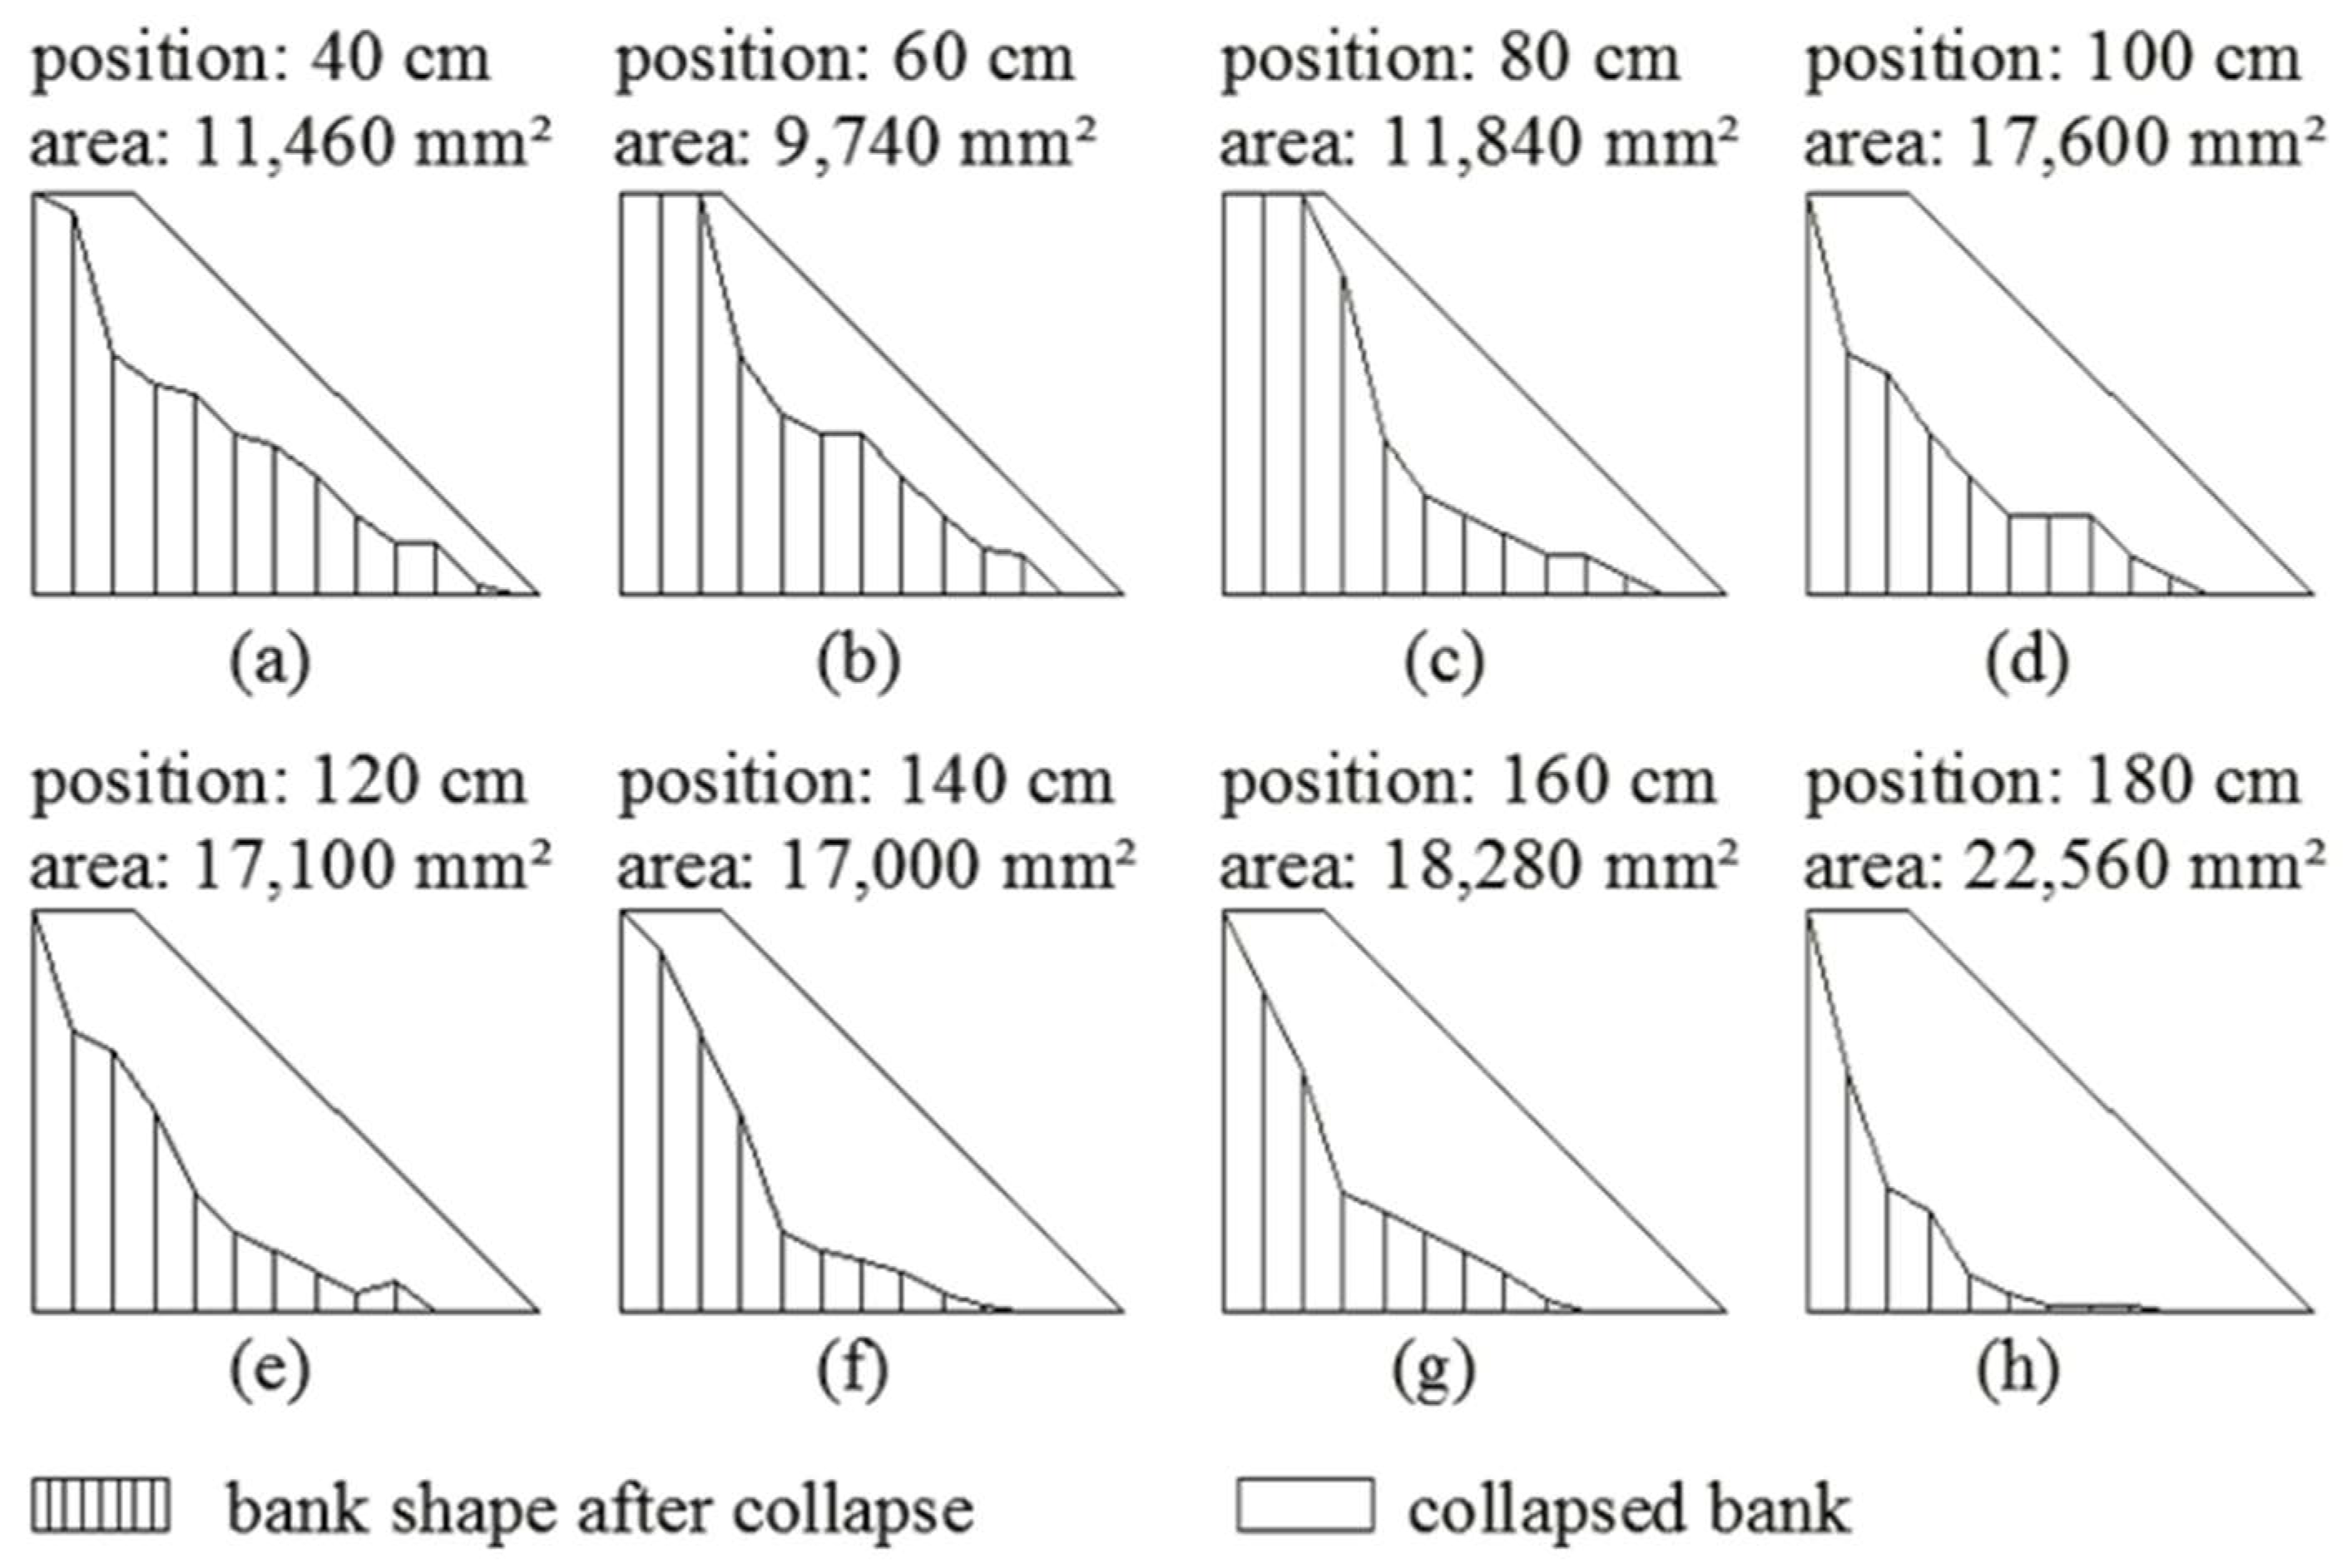
After each experiment, the amount of material collapsed was obtained by combining the volume associated with the topography of the riverbank before and after the entire process and calculating the difference. As previously stated, multiple measuring sections were selected every 20 cm in the direction of water flow to characterize the final riverbank shape, and for each step the full topography profile was measured by using a system of gridlines as shown in Figure 6. Finally, the coordinates obtained were entered into AutoCAD© [38] to recreate the profiles acquired and an example (first configuration, 45° slope) is shown in Figure 7.
2.2.2. Estimation of Velocity for Incipient Sediment Motion
When the sediments enter the channel due to riverbank collapse, part of them was carried downstream by the water flowing, and the remaining part deposited at the foot of the existing bank. The deposited sediment, under the action of water flow, was then further activated and transformed into bed load and suspended load, which was transported towards the downstream section of the channel [39]. Therefore, to study the sediment transport, it was necessary to analyze the characteristics of the sediment deposited at the bank toe. The particle size of the experimental soil tested was between 0.0016 to 0.352 mm, and these values are typical of cohesive particles. It is generally believed that the newly deposited cohesive soil is compacted sediment that deposited rapidly. It can still be treated as single-particle sediment, but there is an additional bonding force between particles applied to it. Based on this view, the particle size was calculated by using the equation provided by Qian and Wan [40]. This equation enabled to compute D (sediment particle size) under the experimental conditions as showed in Table 3.
where Ha is the atmospheric pressure expressed in terms of water column height, and Ha = 10 m; δ0 is thickness of a water molecule, and δ0 = 3.0 × 10⁻⁸ cm; γs is unit weight of sediment, and γs = 17,542 N/m3; γ is unit weight of water, and γ = 9800 N/m3; g is the gravitational acceleration, and g = 9.8 m/s2, D is sediment particle size, m; Ui is velocity for incipient sediment motion and U is the velocity, m/s (for this study Ui = U); h is water depth, m.
2.2.3. Estimation of Sediment Load Ratio
In a sediment gravity flow, the coarse sand is mainly bed load movement, and the energy is primarily provided by rapid whirlpools revolving the current in the river [41]. The fine sand is mainly suspended load movement, and its energy is provided by smooth change in water direction. In spite of the mutual transformation of the two in the process of movement, under specific water flow conditions, the amount of bed load and suspended load carried by the water flow would barely change in a certain period of time. Therefore, from the point of view of quantity, it is reasonable to divide the sediment in water into coarse particles and fine particles moving with the water flow. Then, it is particularly important to introduce a boundary particle size between the bed load and the suspended load. The following procedure was applied to estimate the amount of collapsed bank sediment converted to bed load and suspended sediment after entering the river channel.
Different from the clear water flow, the movement of sediment gravity flow needs to overcome the internal cohesive resistance of water flow carrying suspended load and the friction of the bed surface during the movement of the bed load, in addition to the boundary resistance. Therefore, in the presence of the sediment gravity flow, total energy slope loss (J) is equal to the sum of the energy slope loss of water flow carrying suspended sand (Jl) and the energy slope loss of bed load motion (Js). The automatic adjustment of alluvial riverbed is accompanied by energy loss, transformation and modification, that is, various elements (such as bed sand, section, and longitudinal slope) tend to regulate toward minimum energy consumption of the water flow. In the process of sediment transport, the adjustment tends to minimize the total energy consumption of the suspension movement and the layer movement, which can be expressed in the form of energy slope [42].
The water flow with suspended sediment is composed of water and fine particles in suspension motion and its energy slope loss can be expressed by the Darcy–Weisbach equation. After considering the unit weight correction of the suspended sediment flow, its energy slope loss can be calculated as follows:
where γf and γm are the unit weight of the suspended sediment flow and the sediment gravity flow, respectively, N/m3; R is the hydraulic radius, m. The resistance coefficient of the suspended sediment flow f is expressed as [43,44] provided:
where d0 is the boundary particle size of the suspended sediment and bed load, m; a is resistance-reducing coefficient; Re is the Reynolds number of the sediment gravity flow.
where μ is dynamic viscosity of the sediment gravity flow (water flowing with both coarse sand and fine sand), Pa∙s; Uc is the non-silting critical velocity of the suspended sediment flow (water flowing with fine sand), m/s; μr is the relative viscosity of the sediment gravity flow, it can be obtained based on Equation (7).
where μ0 is dynamic viscosity of water in the same temperature as the sediment gravity flow, Pa∙s; Sv is the sand content of the sediment gravity flow.
According to the movement characteristics of sediment gravity flows, suspended sediment and bed load are continuously exchanged in the process of moving with the water flow, and the mechanism is very complicated. Based on previous research results, it is believed that the fine particles are carried away by the water flow in the form of suspended sediment, while the coarse particles move in the form of bed load. Then, the non-silting critical flow rate of the fine particles in sediment gravity flow can be obtained.
where ω0 stands for the corresponding sedimentation rate of d0. Within the range of Stokes, ω0 can be calculated using Equation (9):
where γw is the unit weight of water, N/m3; ν is the kinematic viscosity of water, m2/s.
If the upper particle size is replaced by the boundary particle size d0, then the weight percentage of bed load in all solids is X. The suspended sediment concentration and the bed load concentration are Sνf and Sνc, which can be expressed as follows:
If the sediment concentration (Sν) in Equation (8) is expressed by the suspended sediment concentration (Sνf), the non-silting critical flow rate of the fine particles in sediment gravity flow can be obtained.
For this study, U = Uc, and by including Equation (12) into Equation (3), it is possible to calculate the energy slope loss of the water flowing with the suspended sediment.
As can be seen, the energy slope loss Jl of the suspended sediment water flow is closely related to the boundary particle size d0.
According to Bagnold’s research, the energy slope consumed by the movement of solid-phase particles in solid–liquid flow to overcome internal resistance is related to the coarse particle concentration (Sνc) and the macroscopic coefficient of friction between particle interactions (tanα). After considering the buoyancy of suspended sediment water unit weight on bed load particles, their movement resistance can be expressed in the form of energy slope.
where γf = γ + Sνf (γs − γ) is the unit weight of suspended sediment flow in the sediment gravity flow, and tan α is the macroscopic coefficient of friction between bed load particles, α is friction angle between bed load particles, °. For this study, the Begnold parameter tan α was selected to be 0.63.
Based on the principle of Equation (2), the critical particle size of different groups of simulation experiments is obtained by using the sediment gradation in the flume experiment. According to the experiment soil gradation of each group in Figure 5b and characterization of incipience motion particle size under different experimental conditions, the amount of collapsed bank sediment converted to bed load and suspended sediment after entering the river channel can be obtained.
The calculating process can be summarized as follows:
- -
- Firstly, it is essential to assume a series of d0 values (The value of d0 is from 0.050 mm to 0.070 mm, and d0 should be taken every 0.002 mm, for example, 0.050 mm, 0.052 mm, ..., 0.070 mm). For each value of d0, the corresponding X can be obtained through Figure 5b;
- -
- Consequently, because the parameters (Sv, γf, γm, γs, γw, g, R, and ν) are the basic data and can be obtained through experimental conditions, Svc and Svf can be obtained through Equations (10) and (11);
- -
- Then ω0 can be obtained by applying Equation (9);
- -
- Jl can be obtained from Equation (13), Js can be obtained from Equation (14);
- -
- J = Jl + Js can be obtained from Equation (2);
A series of J values can then be obtained: J0.050, J0.052, …, J0.070. It is important to choose the smallest value each time for each range selected, which corresponds to the critical particle size.
3. Results
3.1. Dynamic Characteristics of the Bank Collapse Process
3.1.1. Collapse Process of Cohesive Riverbanks
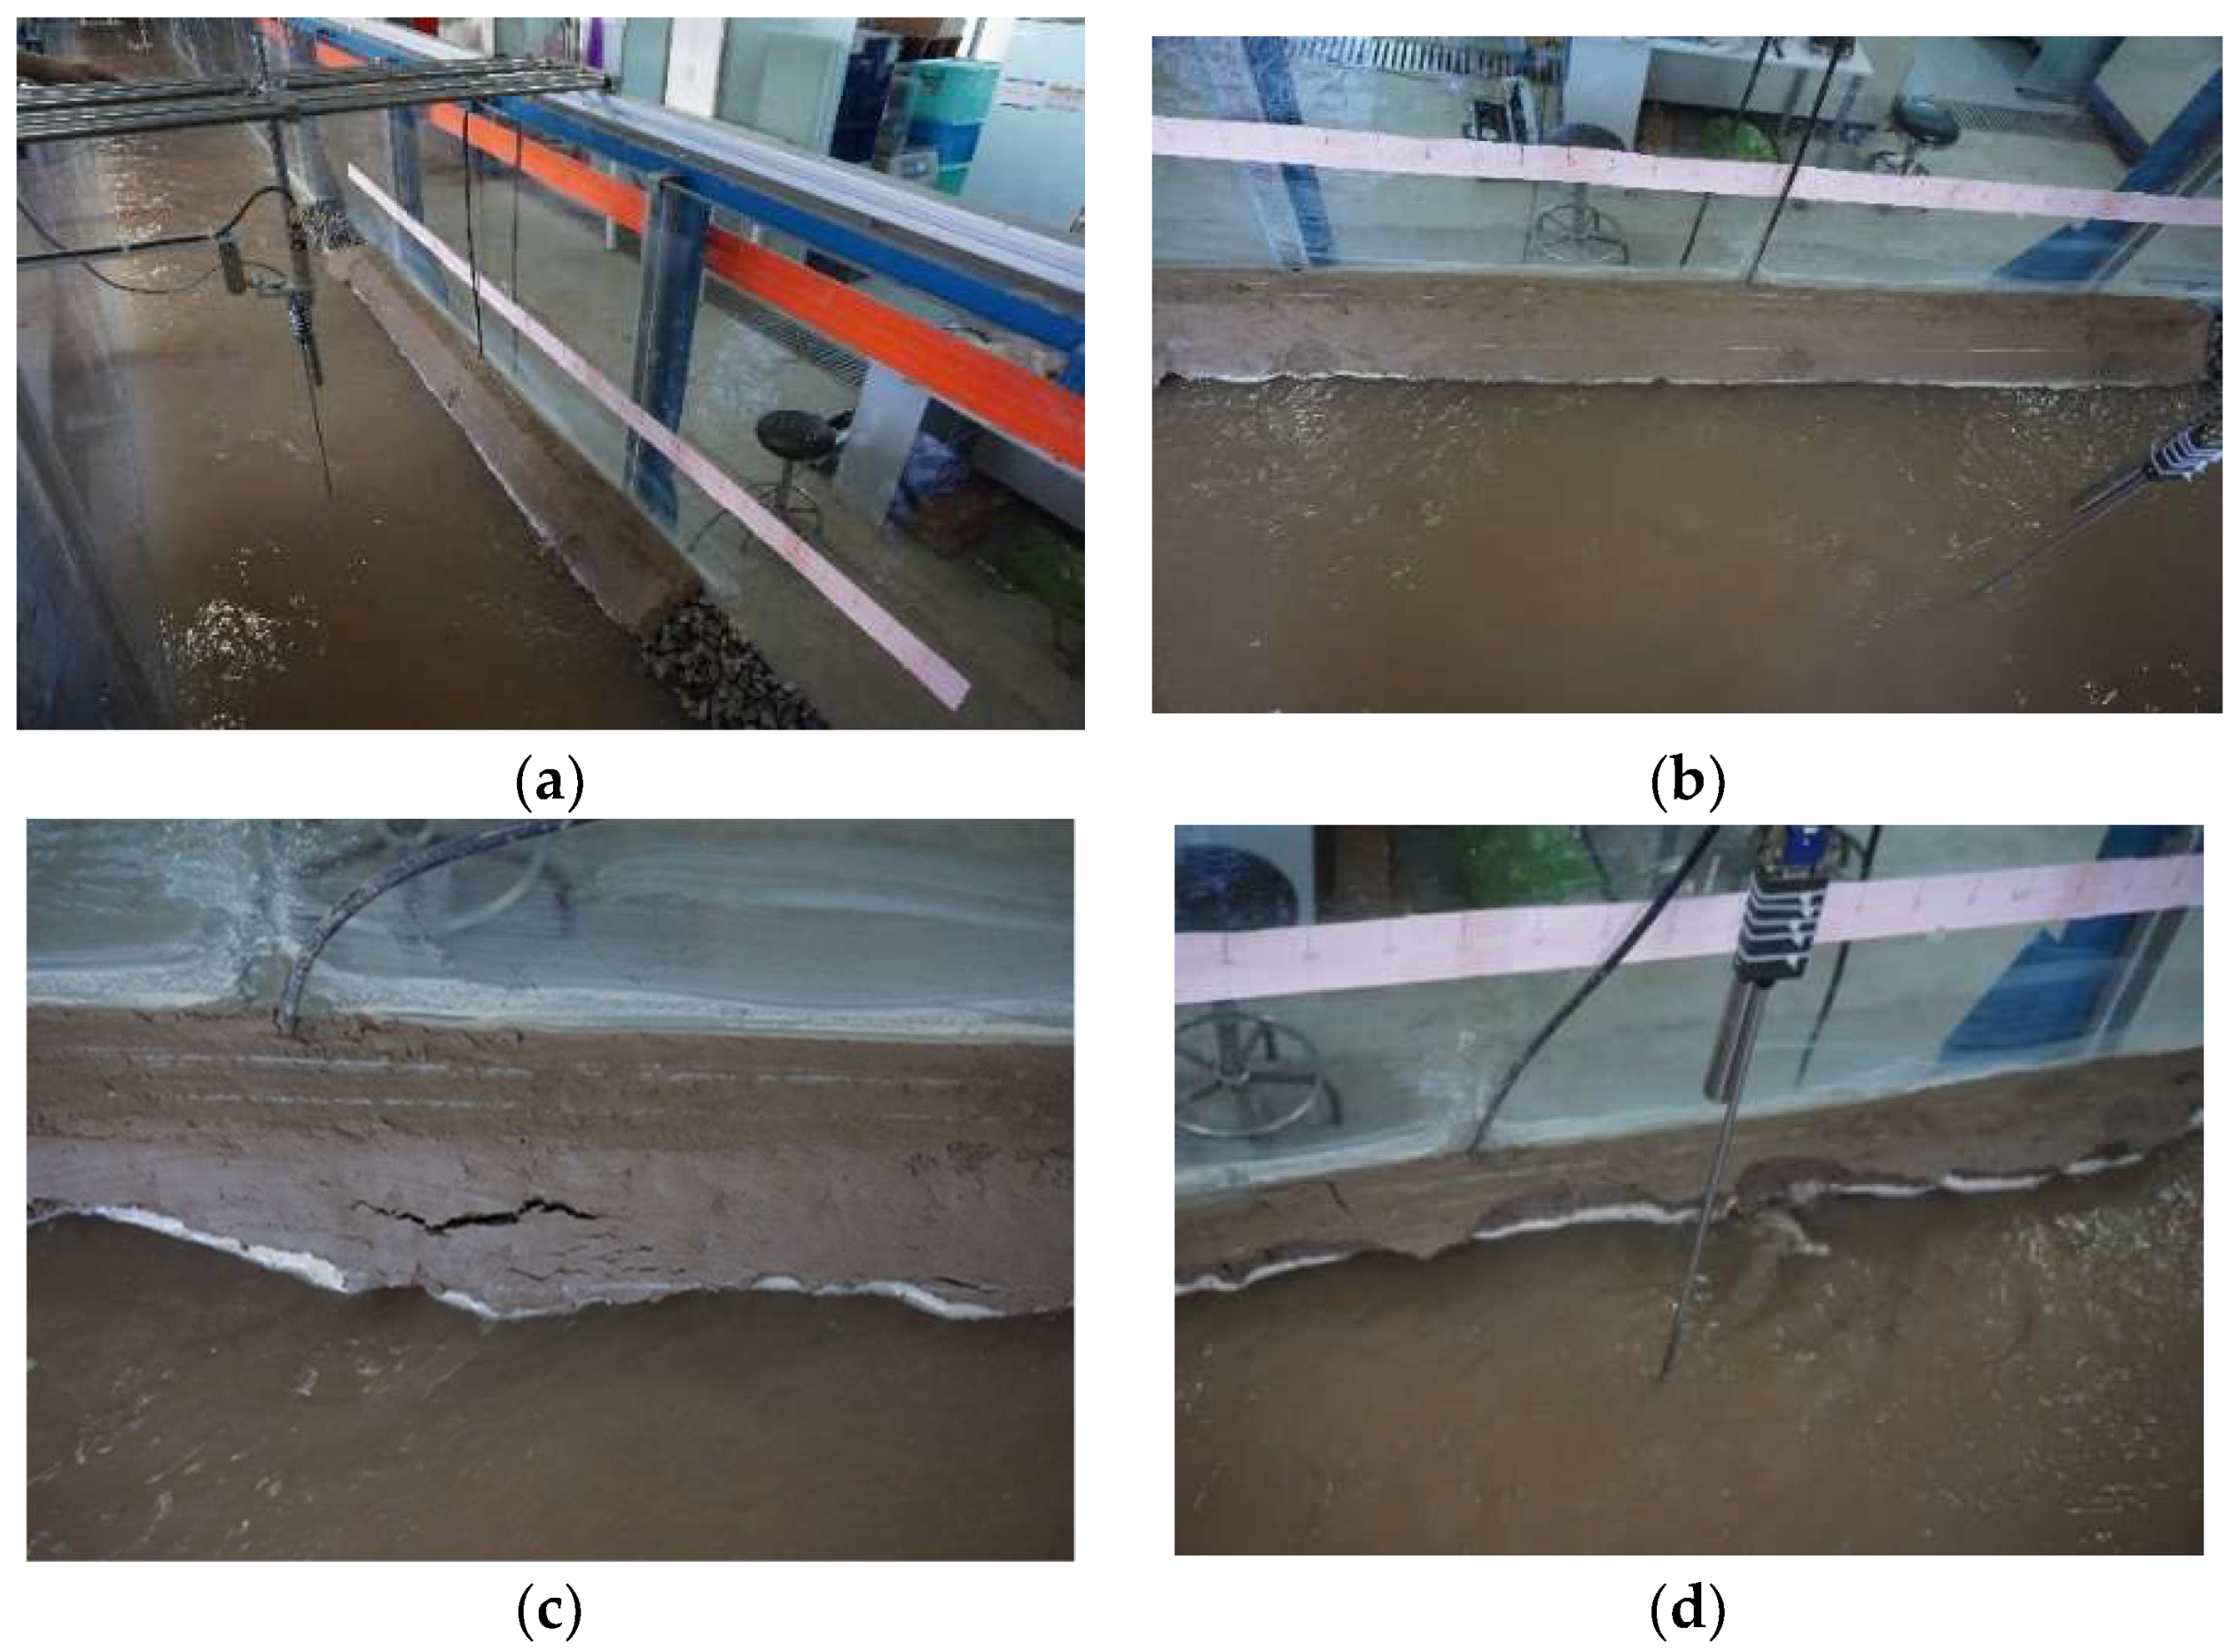
The various collapse processes of cohesive riverbank associated with different hydraulic conditions were recorded (some examples are shown in Figure 8) and we have characterized the collapse process via exhaustive and reiterated observations of the experiments completed. After releasing the water, the bank toe was initially scoured by the water flowing in the channel. Consequently, small fragments of material begun to fall down along the bank slope, occasionally, and a groove was gradually formed on the bank toe, as shown in Figure 8a.
As the water continued to flow washing the bank, the groove became deeper and deeper but due to the strong bonding effect typical of the cohesive soil, the upper part of the bank affected by the groove was maintained suspended. When the gravity of the suspended soil was then greater than its anti-sliding force and exceeded its stable slope, multiple cracks appeared on the bank, as shown in Figure 8b. The magnitude of these cracks deepened with the time and eventually the collapse occurred on the bank causing the removal of partial blocks as shown in Figure 8c. Finally, in the case in which the bank slope was steep, its collapse surface was recorded to be almost vertical, as shown in Figure 8d, which is in agreement with the natural phenomenon observed in the Dengkou river section [37].
3.1.2. Velocity Distribution
Flow velocity is a major factor influencing the phenomenon of riverbank collapse, hence it was important to obtain the localized velocity estimation for the experiments conducted under different flow conditions. Figure 9 shows an example of velocity distribution recorded for section #3 (displayed in Figure 4). These velocity measurements were taken before the bank collapse and among the collapse process. The main reason is due to the fact that the exact location and timing of the collapse were difficult to predict. The greater riverbank slope, the higher the nearshore velocity measured under the same hydraulic conditions. Typically, a larger slope of the bank corresponds to a larger obstructed area since the bottom width of the bank is imposed, and as a consequence, velocities are larger when the contraction ratio is larger.
3.1.3. Pore Water Pressure
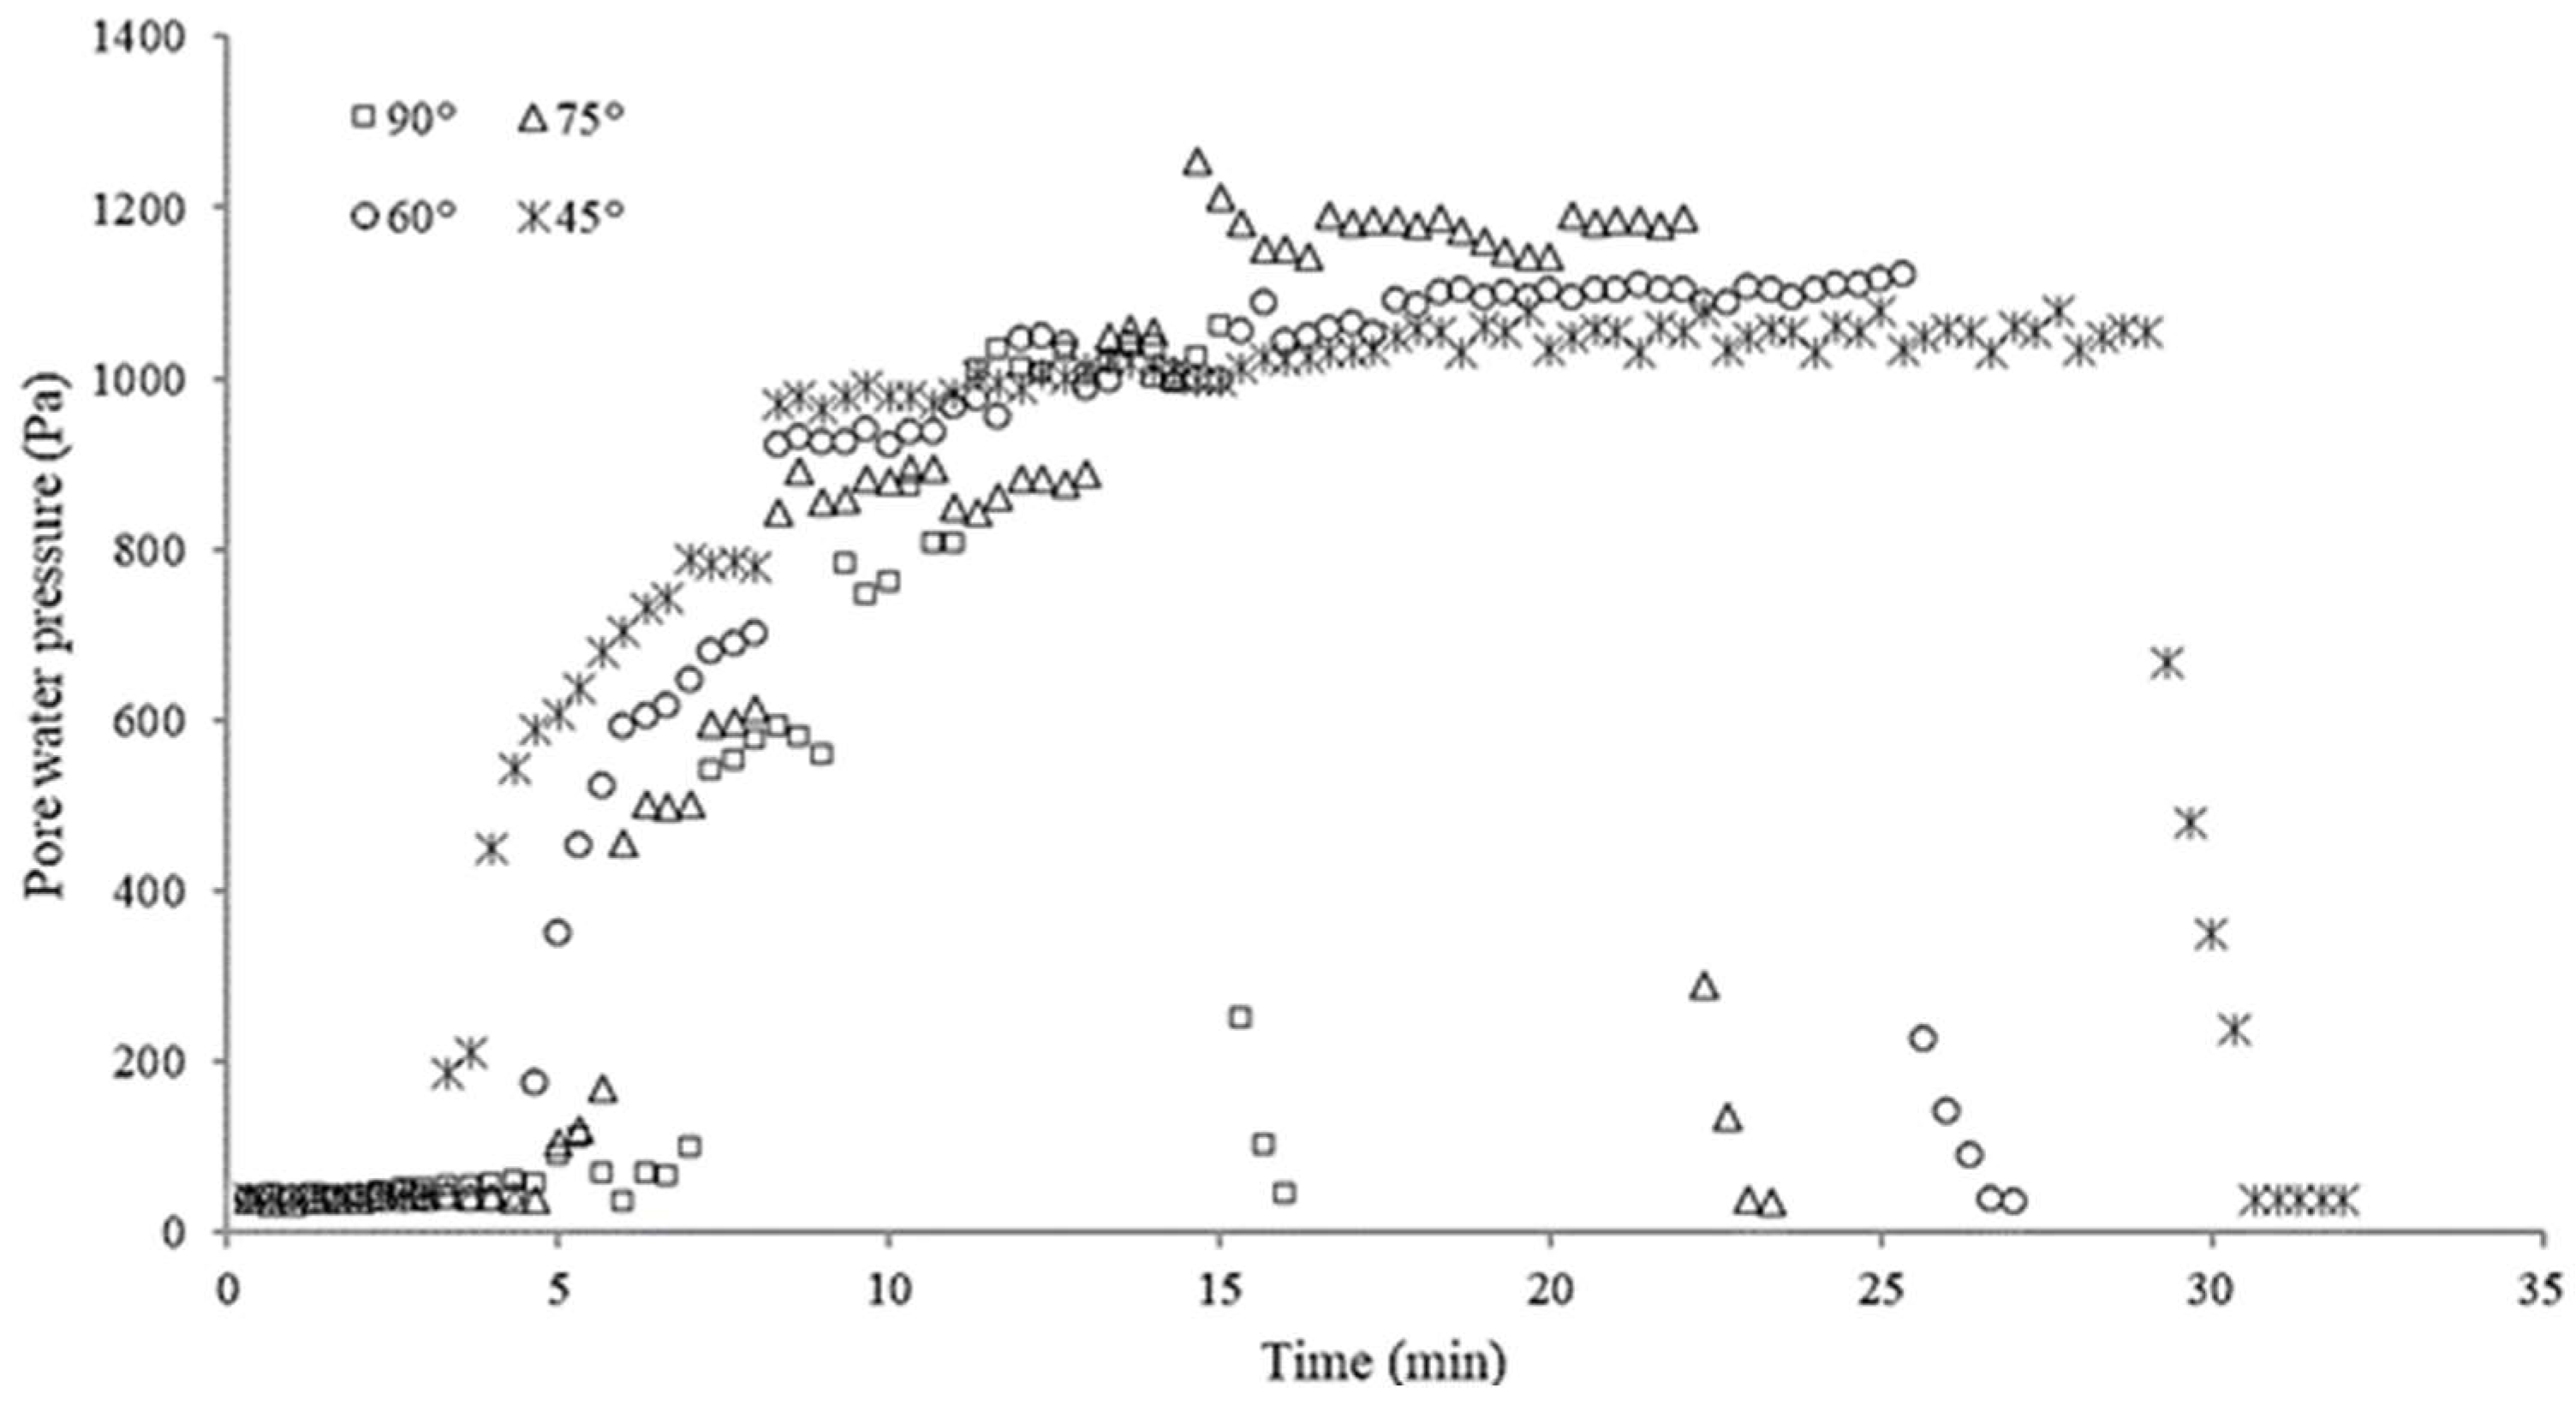
Water content within the riverbank is another important factor to consider when replicating riverbank collapse within experimental facilities. An example showing the changes of pore water pressure for each slope tested (45°, 60°, 75°, and 90°) and the flow rate 45 L/s is shown in Figure 10. By an analysis completed by the authors assessing all the tests conducted including scenarios with all the slopes tested and flow rate 60 L/s, it can be detected that the steeper is the slope of the riverbank, faster is the initial collapse. For gentle slopes, the internal pore water pressure of the soil fluctuates for a longer time, particles seem to interact more frequently, and the shear resistance is stronger than the one measured for steep slopes.
As shown in Figure 10, pore water pressure is very small at the beginning of the experiment because there is a low quantity of water in the riverbank. Gradually the pore water pressure increases as the water penetrates the bank, reaching an almost constant value prior the bank collapse and consequently drastically decreases because due to the removal of the bank material, the pore water pressure gauge used to measure this parameter is directly exposed to the water in the flume.
3.2. Quantitative Analysis of the Sediments Transformation
3.2.1. Sediment Concentration Variation
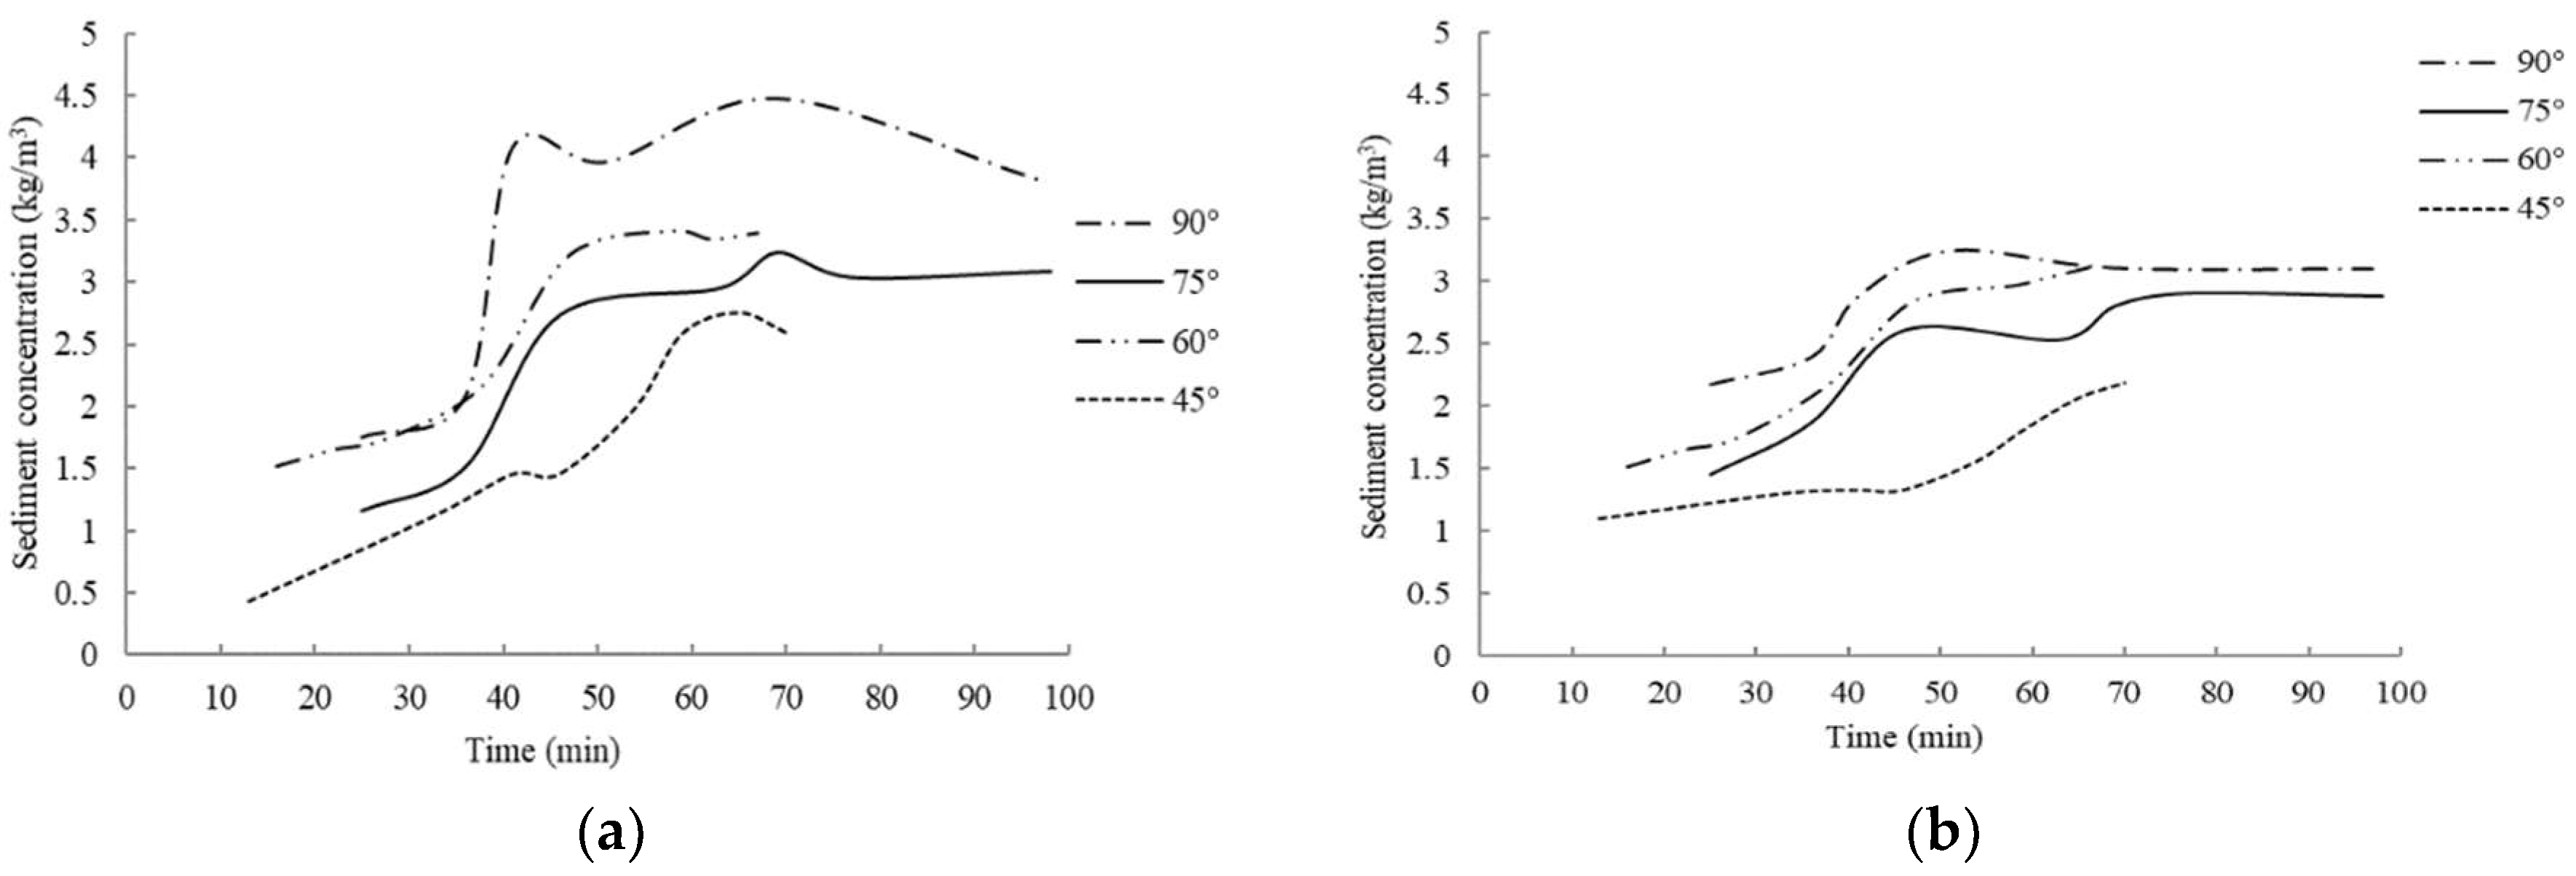
In order to analyze the variation in time of sediment concentration during the collapse process, this parameter was monitored in real time for the sections selected for this study during each experiment (see Methodology section) and an example is provided in Figure 3 where results collected at Section #3 (Figure 11a) and the tailgate (Figure 11b) are displayed.
By comparing the sediment concentration recorded in Section #3 for each slope configuration of 45°, 60°, 75°, and 90°, it is possible to notice a consistent trend regardless of the different initial slope (Figure 11a). At the beginning, for each configuration, the sediment concentration increases slowly, and then rises dramatically. The rapid increase in sediment concentration corresponds with the moment when the bank slope collapses. When this phenomenon happens, a large amount of debris enters the river, mixes with the water, increasing its sediment concentration that reaches its maximum level within the stream. When the water continues to flow towards the downstream section, the sediment concentration recorded gradually decreases and becomes stable (Figure 11b). For the tests recorded, the time measured to reach the collapse and hence the highest sediment concentration in the river is between 35 and 45 min. Furthermore, it has been noticed that highest is the slope and faster is this process.
3.2.2. Sediment Transformation from Bank Collapsed Materials to River Sediment
The duration to achieve the collapse phenomenon (min), the amount of material collapsed from the riverbank (kg) and the average collapse magnitude (g/s) for each configuration tested (45°, 60°, 75°, and 90°) is displayed in Table 4. The steeper the slope, the less time it takes the collapse to occur and higher the average collapse magnitude. The larger the near bank velocity, the larger is the bank collapse magnitude (Figure 9 and Table 4).
As displayed in Figure 5b the sediment particle sizes used in the experiment range 2 μm–0.32 mm. As shown in Table 3, all the incipience motion particle sizes have lower and upper limits and these can be calculated using Equation (1). For example, considering 45° and 45 L/s, when the sediment particle distribution is between 9.25 μm and 7.29 mm, material will start to move as observed under the experimental conditions. When the size of the sediment is smaller than 9.25 μm, the force between particles is greater than the flow shear force, hence the sediments tend to deposit at the bank toe. When the size of the sediment particle is bigger than 7.29 mm, it requires a greater flow shear force and this means that only the sediments smaller than 9.25 μm (10.15%) deposit at the bank toe, while the remaining part (89.85%) moves. For all the experimental groups, about 89.85–93.6% of the collapse amount typically moves, and 6.4–10.15% deposits at the bank toe.
3.2.3. Sediment Transformation from Bed Load to Suspended Load
The critical particle size distribution associated with different experiments was obtained by using the sediment gradation in the flume experiment, as shown in Table 5. It can be seen that the critical particle size of the bed load and suspended sediment obtained by this method is about 0.06–0.068 mm, which is close to the critical particle size (0.05 mm) between coarse and fine sands in the upper reaches of the Yellow River.
It can be seen from Table 6 that after the collapsed bank sediment enters the river, it is mainly converted into three parts. About 7–10% of the sediment typically deposits locally, and the rest continues to move downstream with the water flowing, part of which (70–77%) forms suspended sediment and another part (15–20%) forms bed load.
4. Conclusions and Discussion
The conclusions can be summarized as follows:
- (1)
- Experimental tests conducted have enabled the characterization of the riverbank collapse process within four different slopes simulated. This phenomenon can be subdivided into multiple steps: (i) the foot of the bank is frequently affected by the washing effect of the water flowing within the river; (ii) small fragments start to fall down along the bank and a groove is usually gradually formed on the bank toe. The groove becomes deeper and deeper as the water flow continues to wash the bank. Due to the strong bonding effect, the cohesive soil in the upper part of the groove is suspended. When the gravity of the suspended soil is greater than its anti-sliding force and exceeds its stable slope, cracks form along the bank slope. The cracks deepen until the collapse occurs and part of the bank falls in blocks inside the river. When the bank slope is steep, its collapse surface is almost flat, which is consistent with the collapse observed at Dengkou River section [37].
- (2)
- Topographic surveys were completed to characterize the riverbank collapse under different slope scenarios and the bank collapse magnitude is directly correlated with the water flow rate; in fact, the greater is the flow rate, the faster the collapse occurs and faster is the time for the collapse to initiate. Moreover, the pore water pressure monitored during the occurrence of the riverbank collapse, is an indicator of how quickly this phenomenon arises (e.g., for gentle slopes, the internal pore water pressure of soil fluctuates for a longer duration, particles interact more frequently, and the shear resistance seems to be stronger than the shear resistance of steep slopes).
- (3)
- The process of sediment transformation from bank collapsed materials to river sediment was analyzed through monitoring the sediment concentration at typical sections and the tailgate. It was found that the change of sediment concentration with time is basically consistent regardless of the initial bank slope. At the beginning, the sediment concentration increases slowly, and then rises dramatically. The rapid rise of the curve corresponds with the occurrence of the collapse along the riverbank. When the high amount of debris enters the river, it mixes with the water, increasing the sediment concentration along the stream and reaching the maximum value recorded. Consequently, it gradually decreases and becomes stable. The rapid increase of sediment concentration due to collapse is between 35 and 45 min after the start of the experiment, but for the tailgate section, the maximum sediment concentration is between 40 and 50 min. The maximum sediment concentration of the tailgate section arrives later than that of section #3. This is due to the fact that when collapsed soil enters into the water, the water requires time to carry it downstream. Additionally, it was observed that the maximum sediment concentration of the tailgate is smaller than that of section #3. That is due to the typical sediments transport process within river.
- (4)
- When the sediment enters the river, part of it is carried downstream by the current, and the remaining part deposits at the foot of the bank. The deposited sediment, under the action of water flowing, is further activated and then transformed into bed load and suspended load, which is transported downstream as well within the water. In terms of quantity, about 7–10% of the sediment typically deposits locally, and the rest continues to move downstream with the water flowing, part of which (70–77%) forms suspended sediment and another part (15–20%) forms bed load.
Despite the insights provided with this study, it is fundamental to state its limitations considering the complexity of the riverbank collapse phenomenon. To study the mechanisms of riverbank collapse, it is necessary to consider not only the longitudinal erosion and the siltation effect of the riverbed due to water and sand, but also the transverse deformation of the river channel (or the collapse of riverbank). In natural rivers, the longitudinal erosion and siltation of the riverbed, riverbank collapse, and sediment transportation are simultaneous, hence it has been very complex to simulate all these phases. Additionally, since the mechanism of bank collapse and the interaction between sediments and silt bed are not completely explored yet, it is difficult to accurately simulate the process of sediment transportation in the bank collapse section by using either a mathematical or a physical model. However, we were able to provide new insights regarding the longitudinal deformation and the transverse deformation of the river, involving the degree of deformation in a certain period of time under various flow conditions, furnishing details about the amount of riverbed erosion, the amount of siltation, and the amount of riverbank collapse. Hence, this study can be a considered as a preliminary phase to investigate bank erosion and sediment transportation mechanisms due bank collapse. Future research should also address other limitations. Firstly, bank shapes in natural rivers are irregular, so more bank angles should be considered. Secondly, the bank is typically eroded by sediment gravity flow in natural rivers, so the effect of sediment concentration on bank collapse should be added when simulating the water flowing, which is never completely clear. However, results obtained with this study should be used to calibrate existing and new numerical models and such recommendations can support current best practices for river management and environmentally sustainable restoration, preventing riverbank destabilization.
Author Contributions
All the authors jointly contributed to this research. A.S. was responsible for the proposition and design of experiment and the calculation method; G.D. and M.R. analyzed the experimental datasets and wrote the paper; L.T., M.W., and S.W. participated in the experiments.
Funding
This research was supported by the National Basic Research Program of China (Grant No. 2011CB403304) and National Natural Science Foundation of China (Grant No. 11372048).
Conflicts of Interest
The authors declare no conflict of interest.
References
- Yao, Z.Y.; Ta, W.Q.; Jia, X.P.; Xiao, J.H. Bank erosion and accretion along the Ningxia-Inner Mongolia reaches of the Yellow River from 1958 to 2008. Geomorphology 2011, 1–2, 99–106. [Google Scholar] [CrossRef]
- Shu, A.; Gao, J.; Duan, G.S.; Zhang, X. Cluster analysis for factor classification and riverbank collapse along the desert wide valley reach of the upper Yellow River. J. Tsinghua Univ. (Sci. Tech.) 2014, 8, 1044–1048. (In Chinese) [Google Scholar] [CrossRef]
- Ta, W.Q.; Xiao, H.L.; Dong, Z.B. Long-term morphodynamic changes of a desert reach of the Yellow River following upstream large reservoirs’ operation. Geomorphology 2008, 97, 249–259. [Google Scholar] [CrossRef]
- Yu, M.H.; Wei, H.Y.; Liang, Y.J.; Hu, C.W. Study on the stability of non-cohesive riverbank. Int. J. Sediment. Res. 2010, 4, 391–398. [Google Scholar] [CrossRef]
- Xia, J.Q.; Wang, G.Q.; Zhang, H.W.; Fang, H.W. A review of the research on lateral widenning mechanisms of alluvial rivers and their simulation approaches. J. Sediment. Res. 2001, 6, 71–78. (In Chinese) [Google Scholar] [CrossRef]
- Thorne, C.R. ASCE task committee on hydraulic, bank mechanics, and modeling of river width adjustment. River width adjustment. I: Processes and mechanisms. J. Hydraul. Eng. 1998, 9, 881–902. [Google Scholar] [CrossRef]
- Buffington, J.M.; Montgomery, D.R. A systematic analysis of eight decades of incipient motion studies, with special reference to gravel-bedded rivers. J. Water Resour. Res. 1997, 8, 1993–2029. [Google Scholar] [CrossRef]
- Hooke, J.M. An analysis of the processes of riverbank erosion. J. Hydrol. 1979, 1–2, 39–62. [Google Scholar] [CrossRef]
- Lohnes, R.A.; Handy, R.L. Slope Angles in Friable Loess. J. Geol. 1968, 3, 247–258. [Google Scholar] [CrossRef]
- Osman, A.M.; Thorne, C.R. Riverbank Stability Analysis. I: Theory. J. Hydraul. Eng. 1988, 2, 134–150. [Google Scholar] [CrossRef]
- Simon, A.; Wolfe, W.J.; Molinas, A. Mass wasting algorithms in an alluvial channel model. In Proceedings of the 5th Federal Interagency Sedimentation Conference, Las Vegas, NV, USA, 18–21 March 1991; pp. 22–29. [Google Scholar]
- Taylor, D.W. Fundamentals of Soil Mechanics. Soil Sci. 1948, 2, 161. [Google Scholar] [CrossRef]
- Millar, R.G.; Quick, M.C. Discussion: Development and Testing of Riverbank-Stability Analysis. J. Hydraul. Eng. 1997, 11, 1051–1053. [Google Scholar] [CrossRef]
- Darby, S.E.; Thorne, C.R. Development and Testing of Riverbank-Stability Analysis. J. Hydraul. Eng. 1996, 8, 443–454. [Google Scholar] [CrossRef]
- Rinaldi, M.; Casagli, N. Stability of streambanks formed in partially saturated soils and effects of negative pore water pressures: The Sieve River (Italy). Geomorphology 1999, 4, 253–277. [Google Scholar] [CrossRef]
- Simon, A.; Curini, A.; Darby, S.E.; Langendoen, E.J. Bank and near-bank processes in an incised channel. Geomorphology 2000, 3–4, 193–217. [Google Scholar] [CrossRef]
- Huang, B.S.; Bai, Y.C.; Wan, Y.C. Model for dilapidation mechanism of riverbank. J. Hydraul. Eng. 2002, 9, 49–54. (In Chinese) [Google Scholar] [CrossRef]
- Wang, Y.G.; Kuang, S.F. Critical height of bank collapse. J. Hydraul. Eng. 2007, 10, 1158–1165. (In Chinese) [Google Scholar] [CrossRef]
- Xia, J.Q.; Wu, B.S.; Wang, Y.P.; Zhao, S.G. An analysis of soil composition and mechanical properties of riverbanks in a braided reach of the Lower Yellow River. Chin. Sci. Bull. 2008, 15, 2400–2409. [Google Scholar] [CrossRef]
- Thorne, C.R.; Tovey, N.K. Stability of composite riverbanks. Earth Surf. Proc. Land. 1981, 5, 469–484. [Google Scholar] [CrossRef]
- Hagerty, D.J. Piping/Sapping Erosion. I: Basic Considerations. J. Hydraul. Eng. 1991, 8, 991–1008. [Google Scholar] [CrossRef]
- Xia, J.Q.; Zong, Q.L.; Xu, Q.X.; Deng, C.Y. Soil properties and erosion mechanisms of composite riverbanks in Lower Jingjiang Reach. Adv. Water Sci. 2013, 6, 810–820. (In Chinese) [Google Scholar] [CrossRef]
- Nagata, N.; Hosoda, T.; Muramoto, Y. Numerical Analysis of River Channel Processes with Bank Erosion. J. Hydraul. Eng. 2000, 4, 243–252. [Google Scholar] [CrossRef]
- Darby, S.E.; Delbono, I. A model of equilibrium bed topography for meander bends with erodible banks. Earth Surf. Proc. Landf. 2002, 10, 1057–1085. [Google Scholar] [CrossRef]
- Simon, A.; Pollenbankhead, N.; Mahacek, V.; Langendoen, E. Quantifying reductions of mass-failure frequency and sediment loadings from streambanks using toe protection and other means: Lake Tahoe, United States. J. Am. Water Resour. Assoc. 2009, 1, 170–186. [Google Scholar] [CrossRef]
- Darby, S.E.; Trieu, H.Q.; Carling, P.A.; Sarkkula, J.; Koponen, J.; Kummu, M.; Conlan, I.; Leyland, J. A physically based model to predict hydraulic erosion of fine-grained riverbanks: The role of form roughness in limiting erosion. J. Geophys. Res. Earth Surf. 2010, 115, F04003. [Google Scholar] [CrossRef]
- Jia, D.D.; Shao, X.J.; Wang, H.; Zhou, G. Three-dimensional modeling of bank erosion and morphological changes in the Shishou bend of the middle Yangtze River. Adv. Water Res. 2010, 3, 348–360. [Google Scholar] [CrossRef]
- Nardi, L.; Rinaldi, M.; Solari, L. An experimental investigation on mass failures occurring in a riverbank composed of sandy gravel. Geomorphology 2012, 9, 56–59. [Google Scholar] [CrossRef]
- Xiao, Y.; Shao, X.J.; Zhou, G.; Zhou, J.Y. 2D mathematical modeling of fluvial processes considering influences of vegetation and bank erosion. J. Hydraul. Eng. 2012, 6, 149–153. (In Chinese) [Google Scholar]
- Xia, J.Q.; Wang, G.Q.; Wu, B.S. Evolution of Wandering Rivers and Its Numerical Simulation; Deng, Q., Zhang, J., Li, L., Eds.; China Water Conservancy and Hydropower Press: Beijing, China, 2005; pp. 182–188. ISBN 9787508426259. [Google Scholar]
- Jia, D.D.; Shao, X.J.; Wang, H.; Zhou, G. 3D mathematical modeling for fluvial process considering bank erosion. Adv. Water Sci. 2009, 3, 311–317. (In Chinese) [Google Scholar] [CrossRef]
- Yu, M.H.; Shen, K.; Wu, S.B.; Wei, H.Y. An experimental study of interaction between bank collapse and riverbed evolution. Adv. Water Sci. 2013, 5, 675–682. (In Chinese) [Google Scholar] [CrossRef]
- Yu, M.H.; Guo, X. Experimental study on the interaction between the hydraulic transport of failed bank soil and near-bank bed evolution. Adv. Water Sci. 2014, 5, 677–683. (In Chinese) [Google Scholar] [CrossRef]
- Wu, S.B.; Yu, M.H. Experimental study on bank failure process and interaction with riverbed deformation due to fluvial hydraulic force. J. Hydraul. Eng. 2014, 6, 649–657. (In Chinese) [Google Scholar] [CrossRef]
- Deng, S.S.; Xia, J.Q.; Zhou, M.R.; Li, J. Conceptual model of bank retreat processes in the Upper Jingjiang Reach. Chin. Sci. Bull. 2016, 33, 3606–3615. (In Chinese) [Google Scholar] [CrossRef]
- Yu, M.H.; Chen, X.; Wei, H.Y.; Hu, C.W.; Wu, S.B. Experiment of the influence of different near-bank riverbed compositions on bank failure. Adv. Water Sci. 2016, 2, 176–185. (In Chinese) [Google Scholar] [CrossRef]
- Duan, G.S.; Shu, A.; Matteo, R.; Wang, S.; Zhu, F.Y. Collapsing mechanisms of the typical cohesive riverbank along the Ningxia-Inner Mongolia catchment. Water 2018, 9, 1272. [Google Scholar] [CrossRef]
- Xue, Y. Basic Course of AutoCAD 2010; Tsinghua University Press: Beijing, China, 2009; pp. 113–135. ISBN 9787302207504. (In Chinese) [Google Scholar]
- Dong, Y.H. Review on 10 groups of demarcating grain sizes of river sediment. J. Yangtze Sci. Res. Inst. 2018, 2, 1–7. (In Chinese) [Google Scholar] [CrossRef]
- Qian, N.; Wan, Z.H. Sediment Motion Mechanics; Yang, J., Ed.; Science Press: Beijing, China, 1983; pp. 265–268. ISBN 9787030112606. [Google Scholar]
- Qian, N.; Zhang, R.J.; Zhou, Z.D. Riverbed Evolution; Zhu, S., Ed.; Science Press: Beijing, China, 1987; pp. 258–269. ISBN 13031-3498. [Google Scholar]
- Shu, A.; Wang, L.; Yang, K.; Fei, X.J. Investigation on movement characteristics for non-homogeneous and solid-liquid two-phase debris flow. Chin. Sci. Bull. 2010, 31, 3006–3012. (In Chinese) [Google Scholar] [CrossRef]
- Shu, A.; Zhang, Z.D.; Wang, L.; Fei, X.J. Method for determining the critical grain size of viscous debris flow based on energy dissipation principle. J. Hydraul. Eng. 2008, 3, 257–263. (In Chinese) [Google Scholar] [CrossRef]
- Fei, X.J. A model for calculating viscosity of sediment carrying flow in the middle and lower Yellow River. J. Sediment. Res. 1991, 2, 1–13. (In Chinese) [Google Scholar] [CrossRef]
Figure 1.
Schematic diagram of test flume and its equipment (not to scale) (Unit: cm).

Figure 2.
Scheme of the experimental model. (a) Constructed bank slope fitted within the experimental flume; (b) Position of the pore water pressure gauge embedded inside the bank.
Figure 2.
Scheme of the experimental model. (a) Constructed bank slope fitted within the experimental flume; (b) Position of the pore water pressure gauge embedded inside the bank.

Figure 3.
Example of one cross section and correspondent monitoring point for the velocity (Unit: cm).
Figure 3.
Example of one cross section and correspondent monitoring point for the velocity (Unit: cm).

Figure 4.
Side-view of the experimental setup and location of the sections for data collection (Unit: cm).
Figure 4.
Side-view of the experimental setup and location of the sections for data collection (Unit: cm).

Figure 5.
Real site and characteristics of the material. (a) Collection of the material on site; (b) Particle size distribution of the material collected.
Figure 5.
Real site and characteristics of the material. (a) Collection of the material on site; (b) Particle size distribution of the material collected.

Figure 6.
Schematic diagram of a topographical measurement conducted after the collapse section using a system of gridlines.
Figure 6.
Schematic diagram of a topographical measurement conducted after the collapse section using a system of gridlines.

Figure 7.
Example of riverbank profiles reconstructed via AutoCAD for the 45° riverbank configuration. (a) Position 40 cm; (b) Position 60 cm; (c) Position 80 cm; (d) Position 100 cm; (e) Position 120 cm; (f) Position 140 cm; (g) Position 160 cm; (h) Position 180 cm.
Figure 7.
Example of riverbank profiles reconstructed via AutoCAD for the 45° riverbank configuration. (a) Position 40 cm; (b) Position 60 cm; (c) Position 80 cm; (d) Position 100 cm; (e) Position 120 cm; (f) Position 140 cm; (g) Position 160 cm; (h) Position 180 cm.

Figure 8.
Example of collapse processes recorded for cohesive riverbank. (a) Upstream bank toe erosion; (b) Lateral view of the bank; (c) Tension crack; (d) Complete bank collapse.
Figure 8.
Example of collapse processes recorded for cohesive riverbank. (a) Upstream bank toe erosion; (b) Lateral view of the bank; (c) Tension crack; (d) Complete bank collapse.

Figure 9.
Velocity distribution of section #3 under different flow conditions (45 L/s and 60 L/s) and slope angles (45°, 60°, 75°, and 90°) (Unit: m/s). (a) 45° section #3 45 L/s; (b) 45° section #3 60 L/s; (c) 60° section #3 45 L/s; (d) 60° section #3 60 L/s; (e) 75° section #3 45 L/s; (f) 75° section #3 60 L/s; (g) 90° section #3 45 L/s; (h) 90° section #3 60 L/s.

Figure 10.
Pore water pressure measured under the flow rate of 45 L/s for each slope angle (45°, 60°, 75°, and 90°).
Figure 10.
Pore water pressure measured under the flow rate of 45 L/s for each slope angle (45°, 60°, 75°, and 90°).

Figure 11.
The diagram of sediment concentration change in typical sections. (a) Sediment concentration measured in Section #3; (b) Sediment concentration measured at the tailgate section.
Figure 11.
The diagram of sediment concentration change in typical sections. (a) Sediment concentration measured in Section #3; (b) Sediment concentration measured at the tailgate section.


Table 1.
Configurations and bank morphology details.
| Group | Slope Degree (°) | Bank Morphology | Flux (L/s) | Water Discharge Time (min) | Water Level (cm) | ||
|---|---|---|---|---|---|---|---|
| Bank Top Width (cm) | Bank Height (cm) | Bank Toe Width (cm) | |||||
| No.1 | 45 | 5 | 20 | 25 | 45 | 40 | 11.2 |
| 60 | 30 | 13.2 | |||||
| No.2 | 60 | 13.45 | 20 | 25 | 45 | 40 | 11.5 |
| 60 | 30 | 12.8 | |||||
| No.3 | 75 | 19.64 | 20 | 25 | 45 | 40 | 11.8 |
| 60 | 30 | 13.9 | |||||
| No.4 | 90 | 25 | 20 | 25 | 45 | 40 | 11.25 |
| 60 | 30 | 13 | |||||
Table 2.
Physical properties of the material tested for each configuration.
| Group | Soil Position | Moisture Content (%) | Unit Weight (g/cm3) | Cohesion (kPa) | Friction Angle (°) |
|---|---|---|---|---|---|
| No.1 | Bank toe | 15.50 | 1.83 | 14.77 | 19.46 |
| Bank top | 15.33 | 1.82 | 14.45 | 19.19 | |
| No.2 | Bank toe | 15.50 | 2.01 | 14.77 | 19.46 |
| Bank top | 15.33 | 1.76 | 14.45 | 19.19 | |
| No.3 | Bank toe | 14.92 | 1.66 | 13.66 | 18.54 |
| Bank top | 14.54 | 1.58 | 12.93 | 17.92 | |
| No.4 | Bank toe | 14.98 | 1.80 | 13.77 | 18.63 |
| Bank top | 15.80 | 1.61 | 15.37 | 19.96 |
Table 3.
Characterization of percentage of transported sediment under different experimental conditions.
Table 3.
Characterization of percentage of transported sediment under different experimental conditions.
| Group | Slope Gradient (°) | Flow Rate (L/s) | Average Water Level (cm) | Average Flow Rate (m/s) | Incipience Motion Particle Size (Lower Limits) (μm) | Incipience Motion Particle Size (Upper Limits) (mm) | Incipience Motion Percentage (%) |
|---|---|---|---|---|---|---|---|
| No.1 | 45 | 45 | 12.40 | 0.62 | 9.25 | 7.29 | 89.85 |
| 60 | 13.25 | 0.70 | 7.23 | 7.84 | 91.46 | ||
| No.2 | 60 | 45 | 11.50 | 0.69 | 7.46 | 8.95 | 91.06 |
| 60 | 12.80 | 0.74 | 6.38 | 10.42 | 92.92 | ||
| No.3 | 75 | 45 | 11.80 | 0.65 | 8.48 | 8.88 | 90.56 |
| 60 | 13.90 | 0.72 | 6.88 | 10.63 | 92.06 | ||
| No.4 | 90 | 45 | 11.25 | 0.65 | 8.20 | 9.52 | 90.81 |
| 60 | 13.00 | 0.77 | 5.98 | 11.10 | 93.60 |
Table 4.
Experimental parameters measured within the experimental tests.
| Group | Slope Gradient (°) | Collapse Time (min) | Collapse Amount (kg) | Average Collapse Magnitude (g/s) |
|---|---|---|---|---|
| No.1 | 45 | 29 | 38.87 | 9.25 |
| No.2 | 60 | 27 | 41.58 | 9.90 |
| No.3 | 75 | 23 | 62.45 | 14.87 |
| No.4 | 90 | 16 | 82.43 | 19.63 |
Table 5.
The critical particle size of collapsed riverbank.
| Group | Slope Degree (°) | Flow Rate (L/s) | Critical Particle Size (mm) |
|---|---|---|---|
| No.1 | 45 | 45 | 0.06 |
| 60 | 0.062 | ||
| No.2 | 60 | 45 | 0.064 |
| 60 | 0.062 | ||
| No.3 | 75 | 45 | 0.068 |
| 60 | 0.066 | ||
| No.4 | 90 | 45 | 0.068 |
| 60 | 0.068 |
Table 6.
Mass percentage of sediment fractions.
| Group | Bank Slope | Flow Rate (L/s) | Deposited Sediment (%) | Suspended Sediment Percentage (%) | Bed Load Percentage (%) |
|---|---|---|---|---|---|
| No.1 | 45° | 45 | 10.15 | 70.35 | 19.50 |
| 60 | 8.54 | 71.61 | 19.85 | ||
| No.2 | 60° | 45 | 8.94 | 75.76 | 15.30 |
| 60 | 7.08 | 77.31 | 15.61 | ||
| No.3 | 75° | 45 | 9.44 | 70.91 | 19.65 |
| 60 | 7.94 | 72.08 | 19.98 | ||
| No.4 | 90° | 45 | 8.39 | 73.38 | 18.23 |
| 60 | 9.06 | 74.16 | 16.78 |
© 2019 by the authors. Licensee MDPI, Basel, Switzerland. This article is an open access article distributed under the terms and conditions of the Creative Commons Attribution (CC BY) license (http://creativecommons.org/licenses/by/4.0/).
Share and Cite
MDPI and ACS Style
Shu, A.; Duan, G.; Rubinato, M.; Tian, L.; Wang, M.; Wang, S. An Experimental Study on Mechanisms for Sediment Transformation Due to Riverbank Collapse. Water 2019, 11, 529. https://doi.org/10.3390/w11030529
AMA Style
Shu A, Duan G, Rubinato M, Tian L, Wang M, Wang S. An Experimental Study on Mechanisms for Sediment Transformation Due to Riverbank Collapse. Water. 2019; 11(3):529. https://doi.org/10.3390/w11030529
Chicago/Turabian StyleShu, Anping, Guosheng Duan, Matteo Rubinato, Lu Tian, Mengyao Wang, and Shu Wang. 2019. "An Experimental Study on Mechanisms for Sediment Transformation Due to Riverbank Collapse" Water 11, no. 3: 529. https://doi.org/10.3390/w11030529
Note that from the first issue of 2016, this journal uses article numbers instead of page numbers. See further details here.