Flood Resilience of Critical Infrastructure: Approach and Method Applied to Fort Lauderdale, Florida

 ,
,
Abstract
:1. Introduction
- They do not include all types of impacts: They focus on monetary impacts which are directly linked to the flooding, such as damage to buildings and possessions, loss of income, or production losses in the flooded area. They neglect intangibles such as stress, health effects, and loss of personal belongings, and they do not fully take into account indirect effects, such as damage due to nonfunctioning infrastructure, image-loss.
- They do not look at the whole process of flooding: They consider the maximum flood depth and flow velocity, but do not provide knowledge on the succession of subevents during flooding and they do not include the behavior of individuals, businesses, and governments before, during, and immediately after a flood event [5].
- They may be applied per location and neglect spatial dependencies: One may assess flood probability, flood impacts, and the effect of measures per location without due consideration of effects on other locations. However, in reality, some measures will also affect flood risks elsewhere. Raising embankments, for example, will increase flood risks across the river and downstream.
- They result in aggregated information and often do not reveal the contribution of various factors/events: In most flood risk management documents, only a single risk number is given, which is the expected annual damage, or alternatively, the fact that a property is in or out of the once-in-a-hundred-years flood zone. The effects of more extreme events are rarely described.
- They are often not linked to other developments in the area: The flood risk analysis and measure selection is often done by flood risk engineers or water authorities and not shared with other actors in the flood-prone area. Therefore, other developments may be missed and the outcomes may not be understood or agreed upon by others.
2. Approach
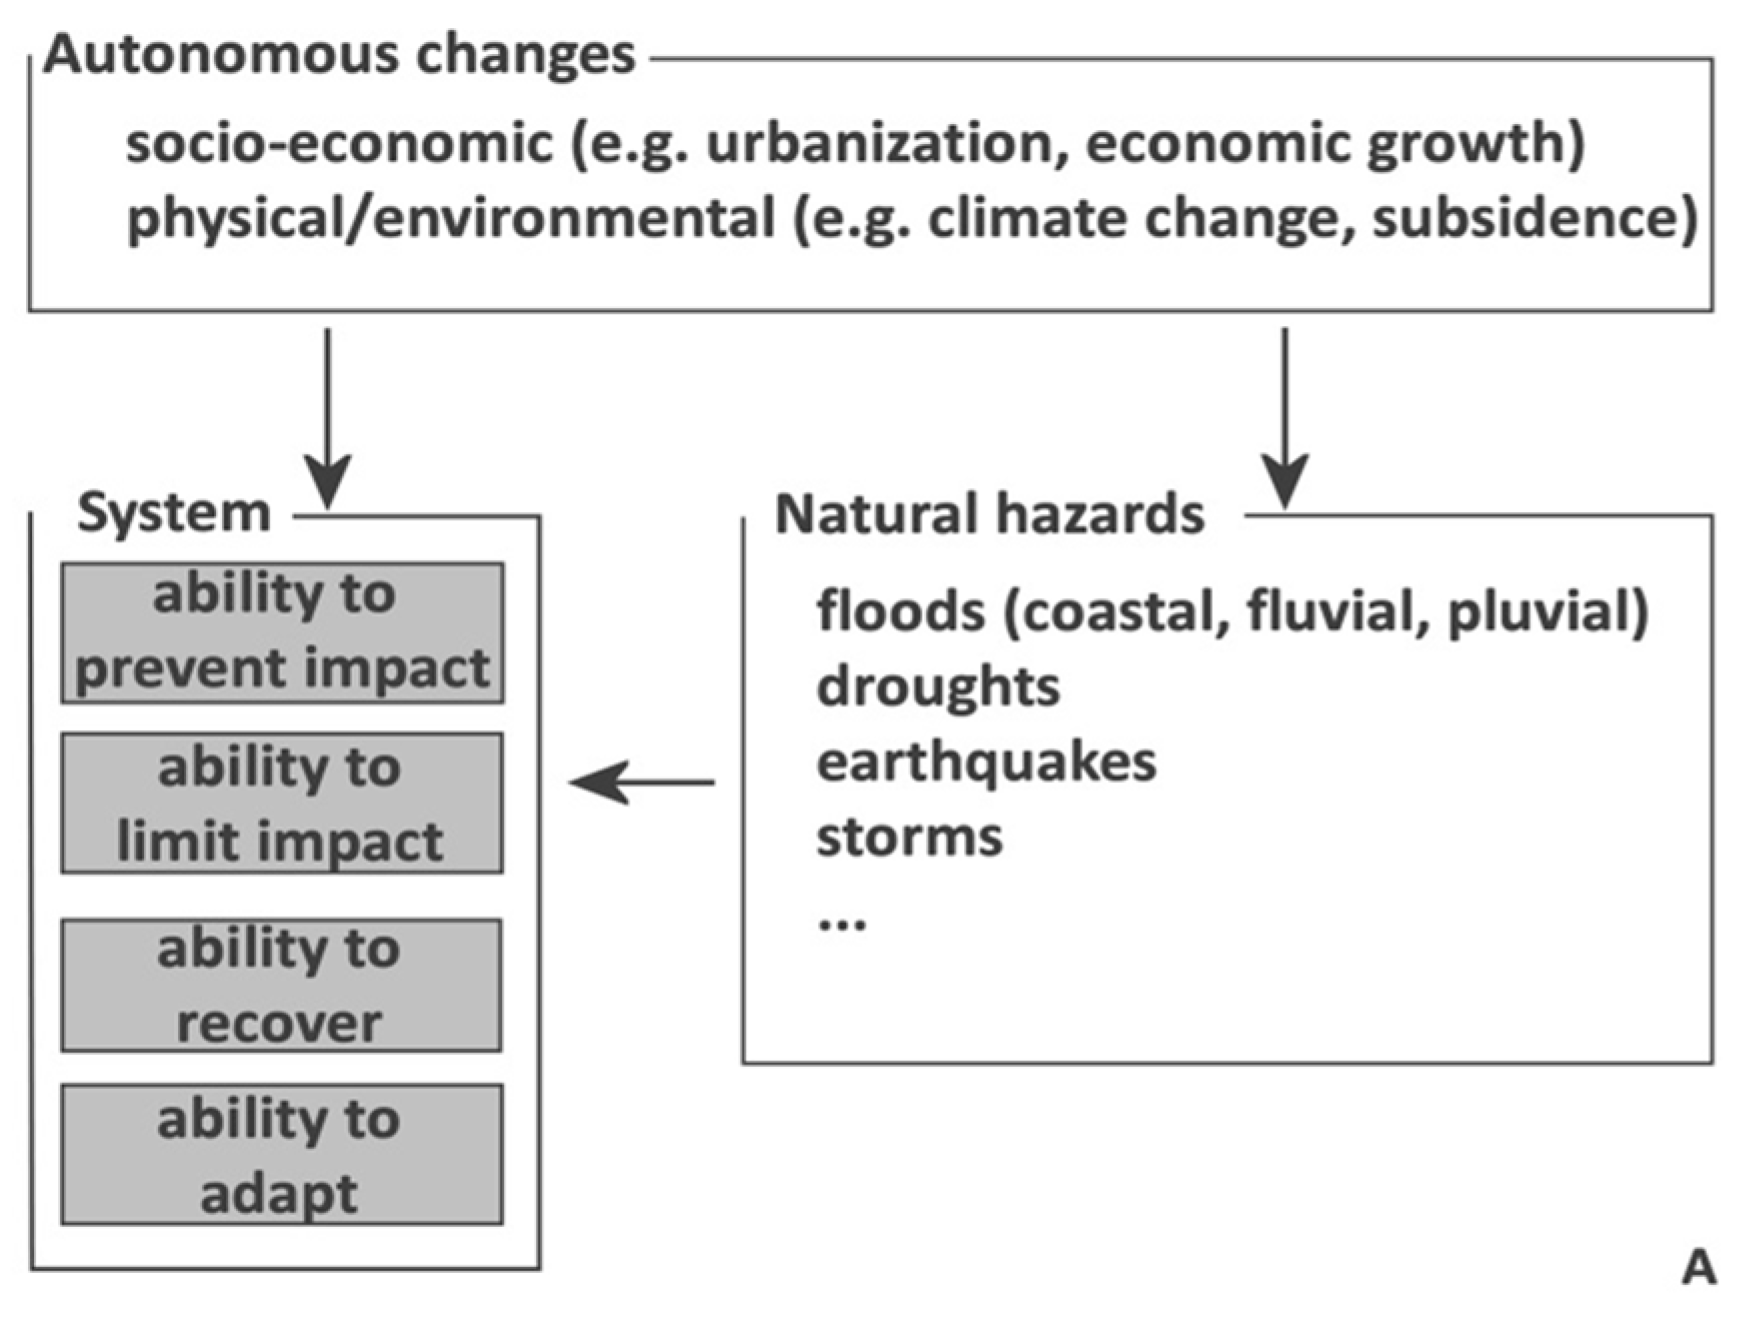
2.1. Overview of the Resilience Approach Adopted
- prevent frequent events from causing negative impacts;
- mitigate impacts of rare events so they do not become disastrous;
- easily recover from impacts;
- learn from events, adapt to changes, and maintain their ability to cope with disturbances also in the future.
2.2. Steps Taken in the Case Study
- System exploration: Collect information on the:
- flood hazard (type of hazards, frequency, resulting flood processes and patterns),
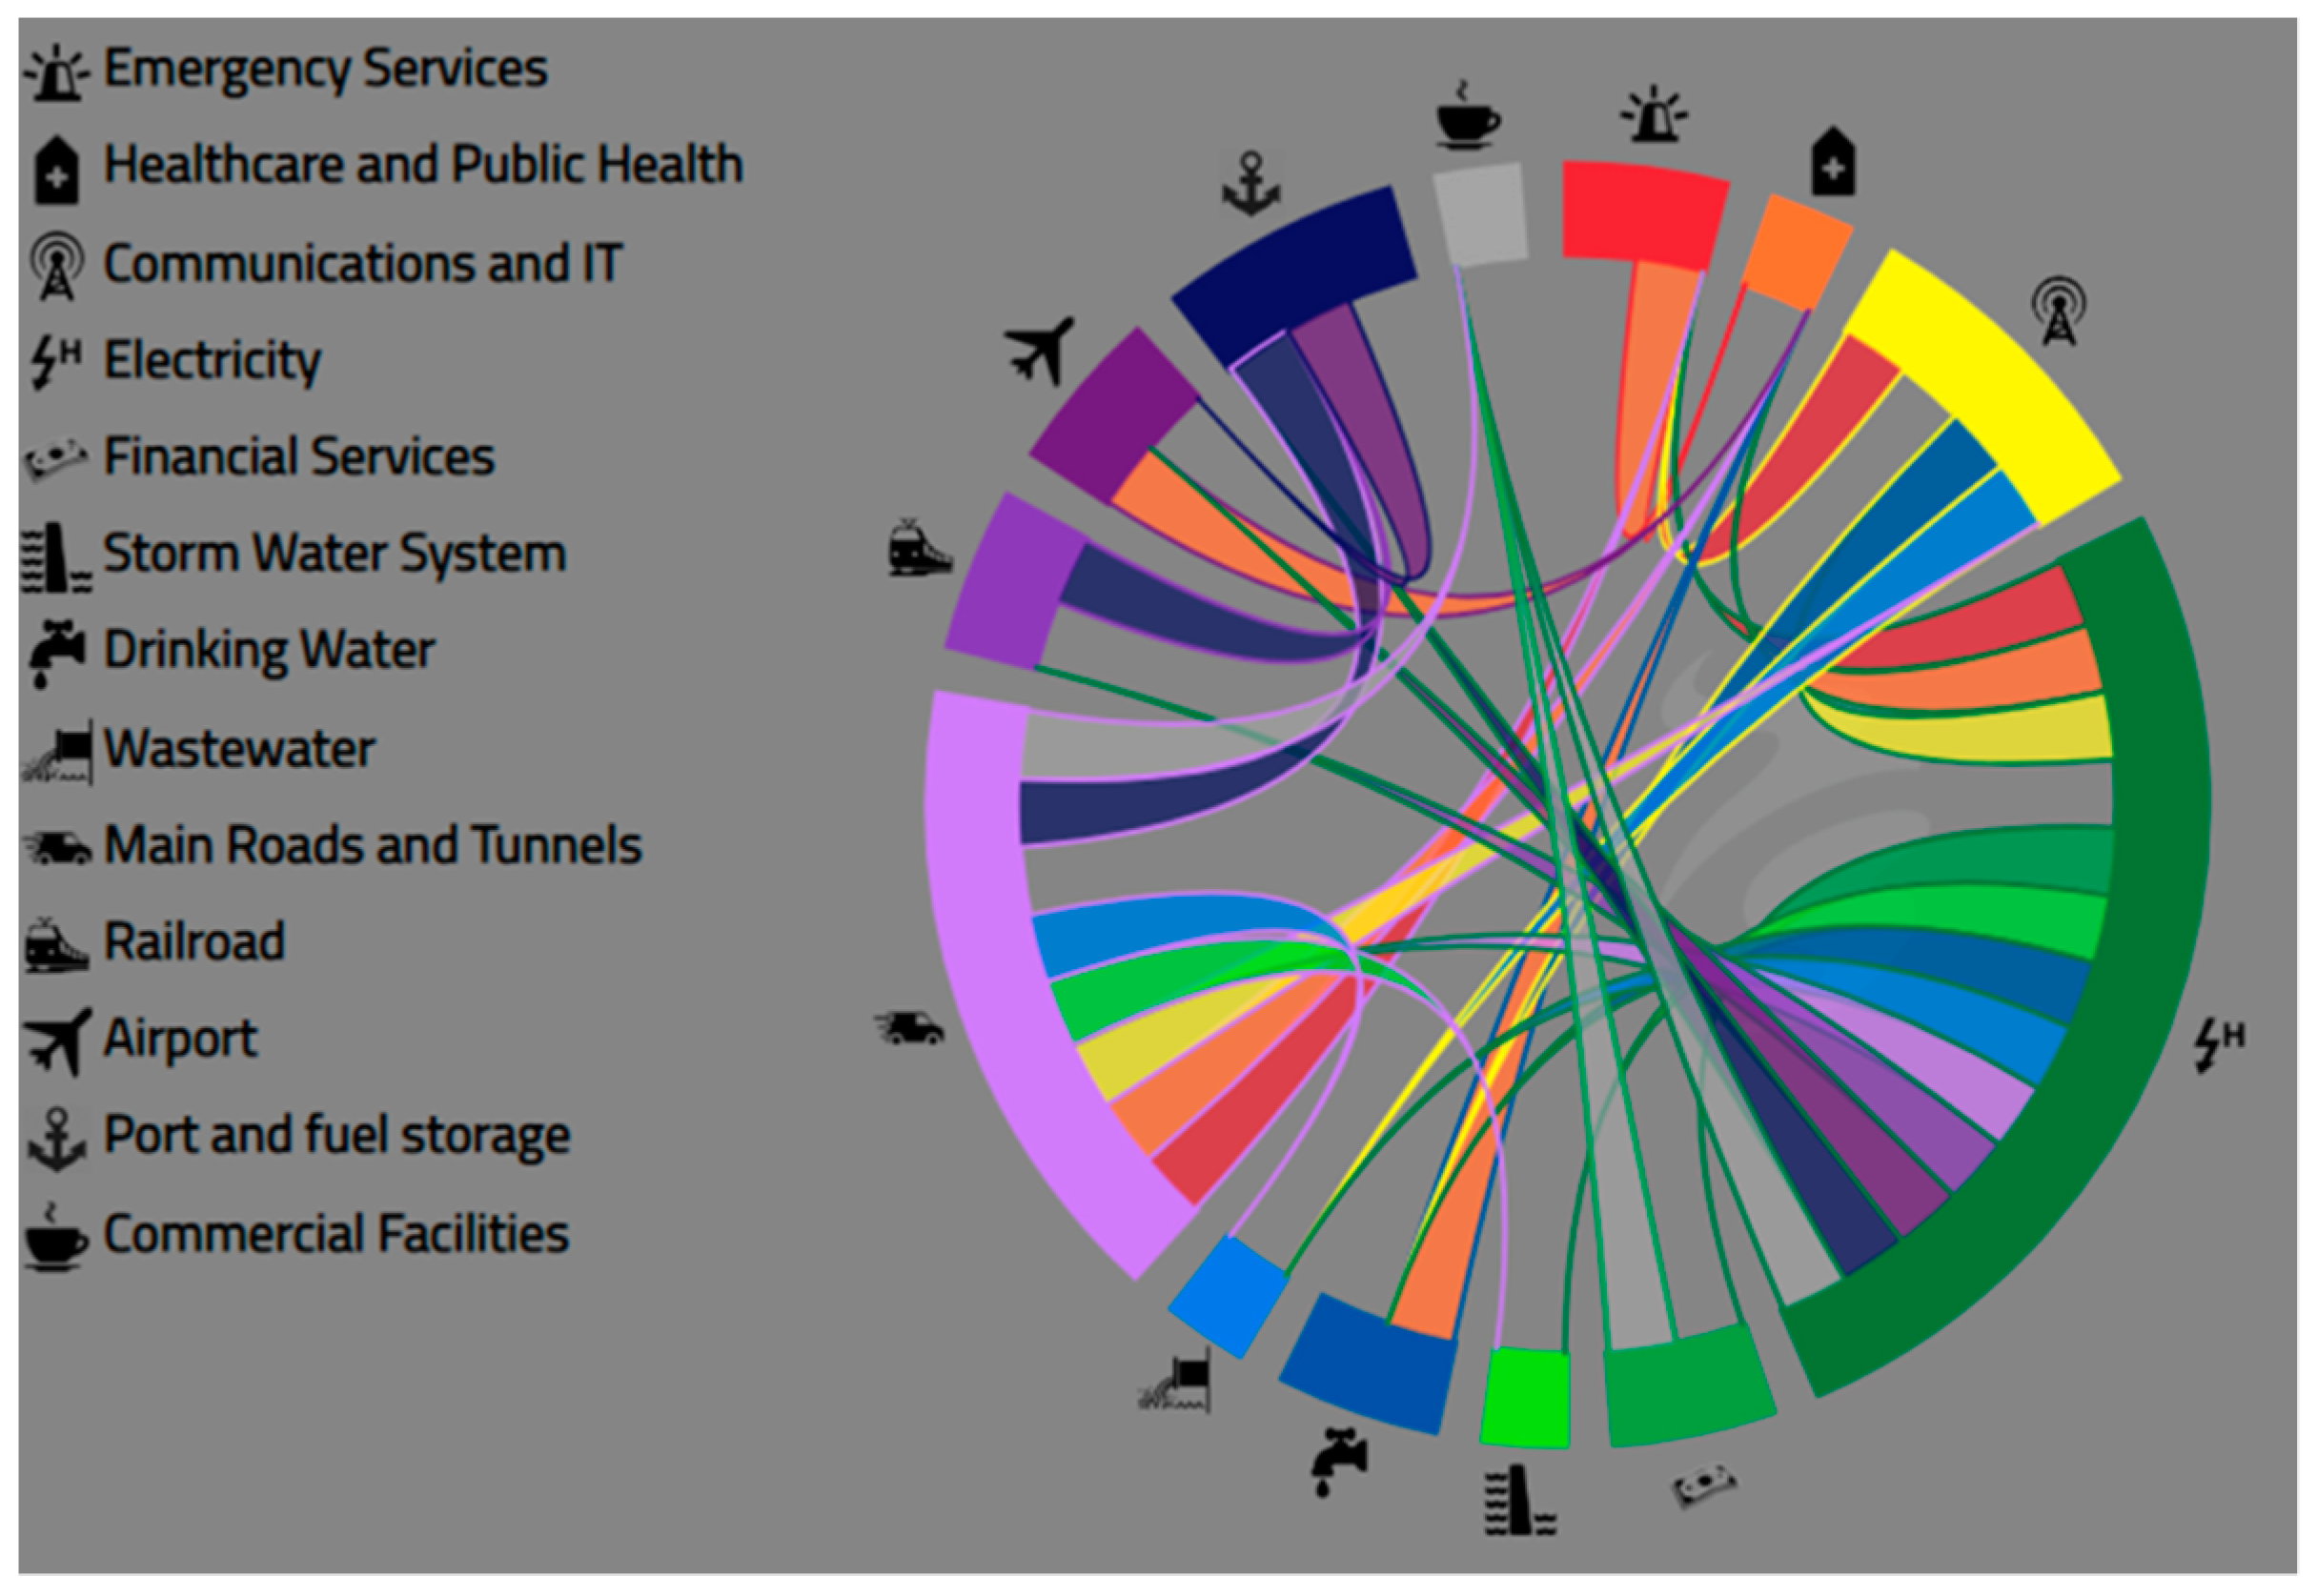
- exposure (CI networks, their characteristics and dependencies (using CIrcle)),
- flood impacts (past events, impacts of disruption of CI services on society), and
- drelevant stakeholders and actors.
- Storyline selection and elaboration: Select a storyline and walk through the chain of events in a workshop together with stakeholders. Consider actions just before, during, and after the event.
- Resilience assessment.
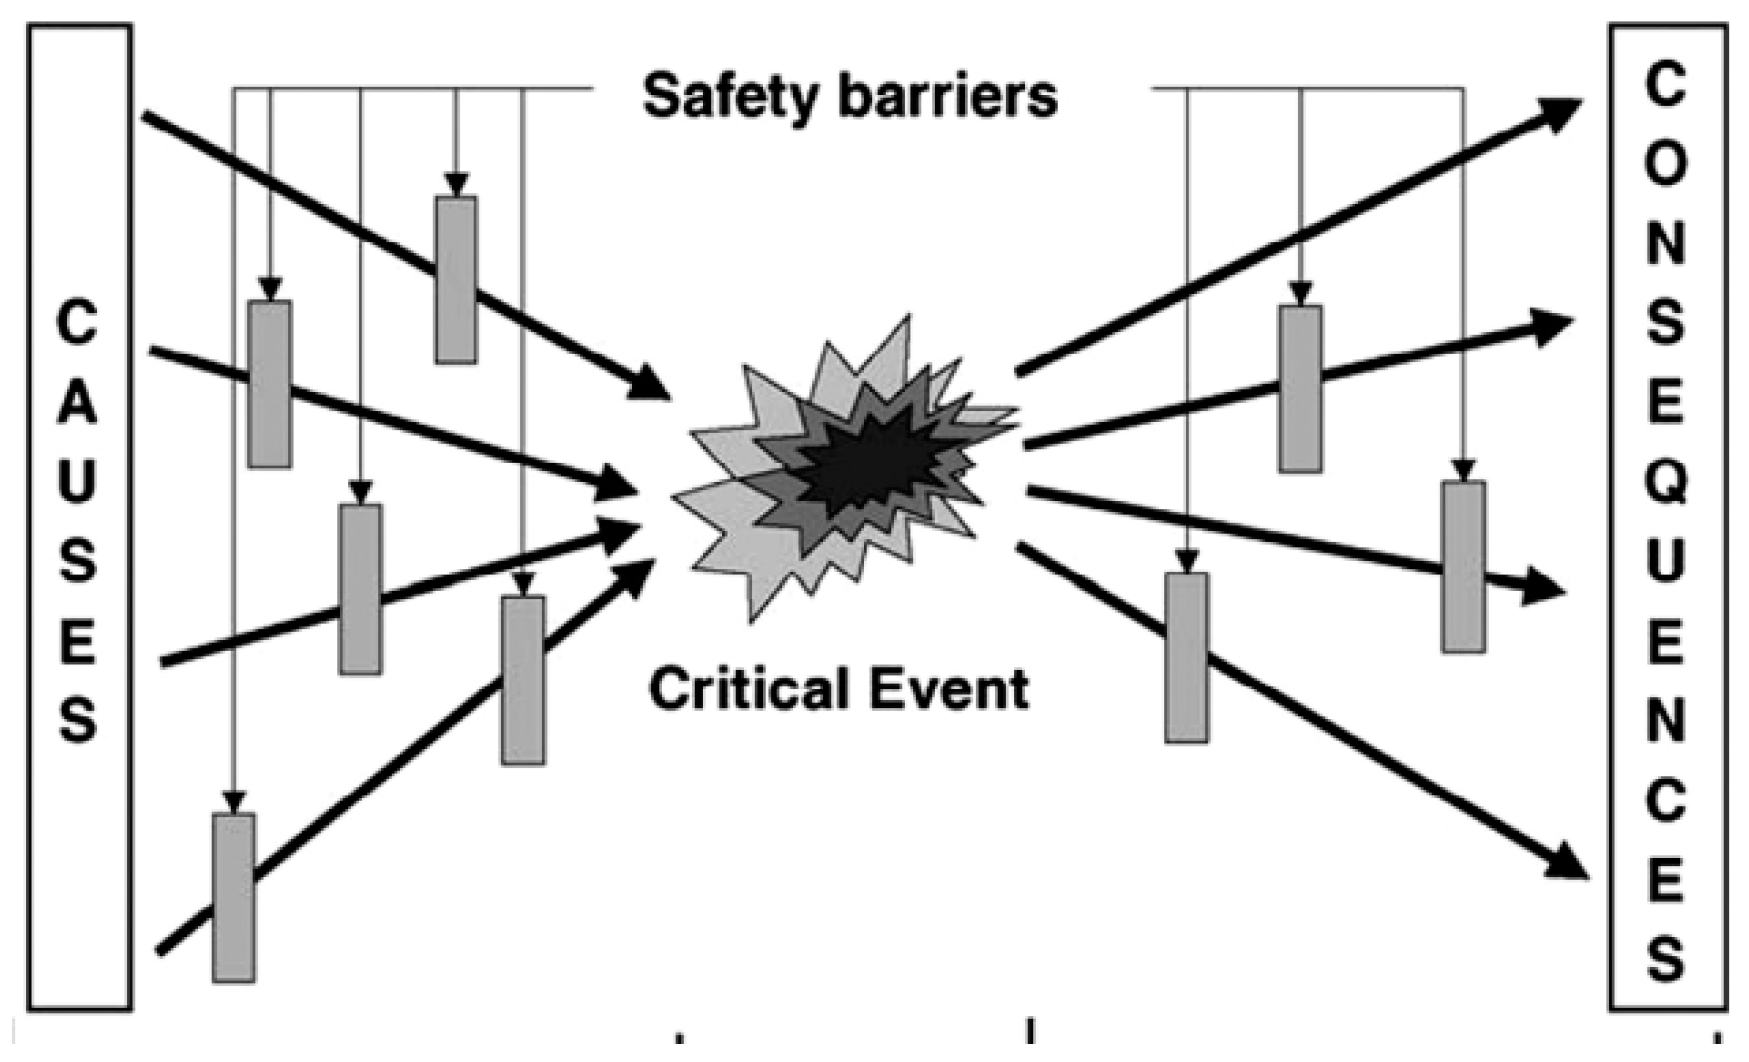
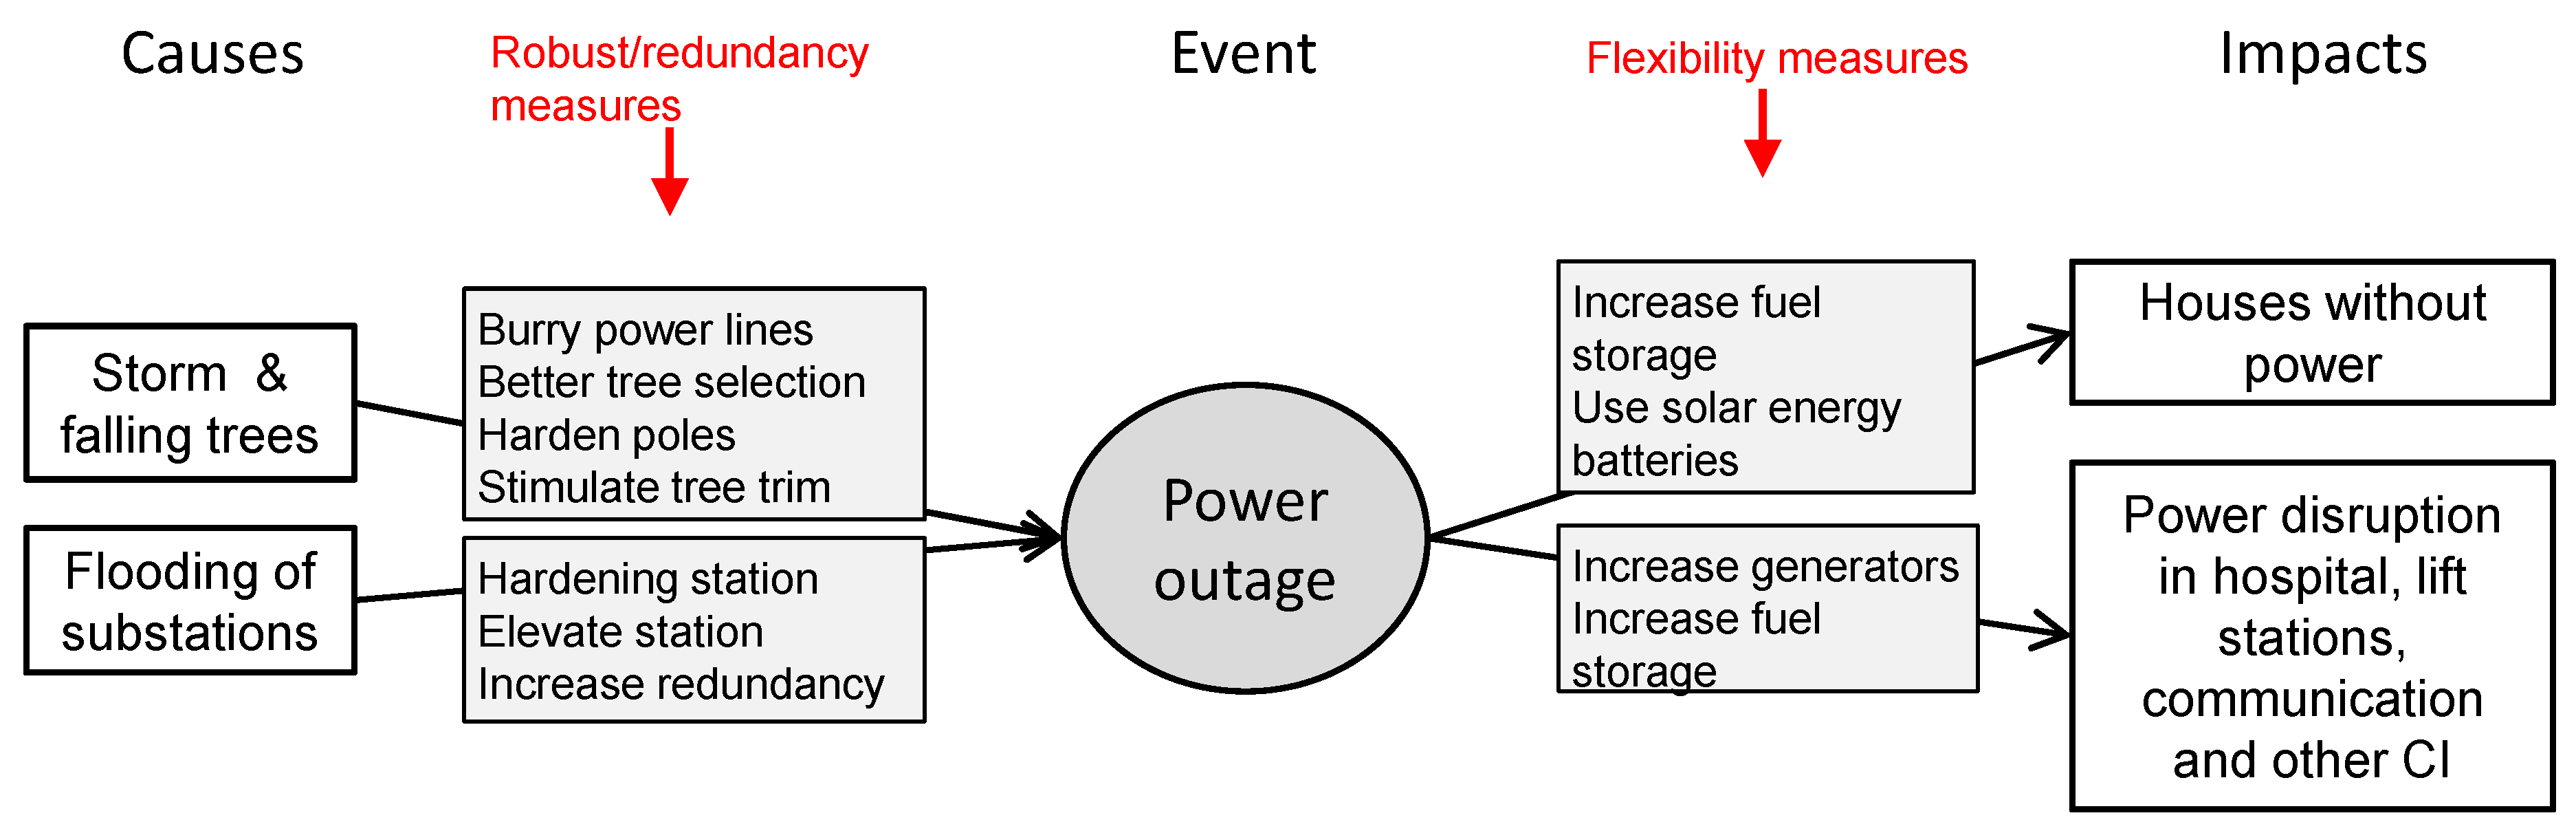
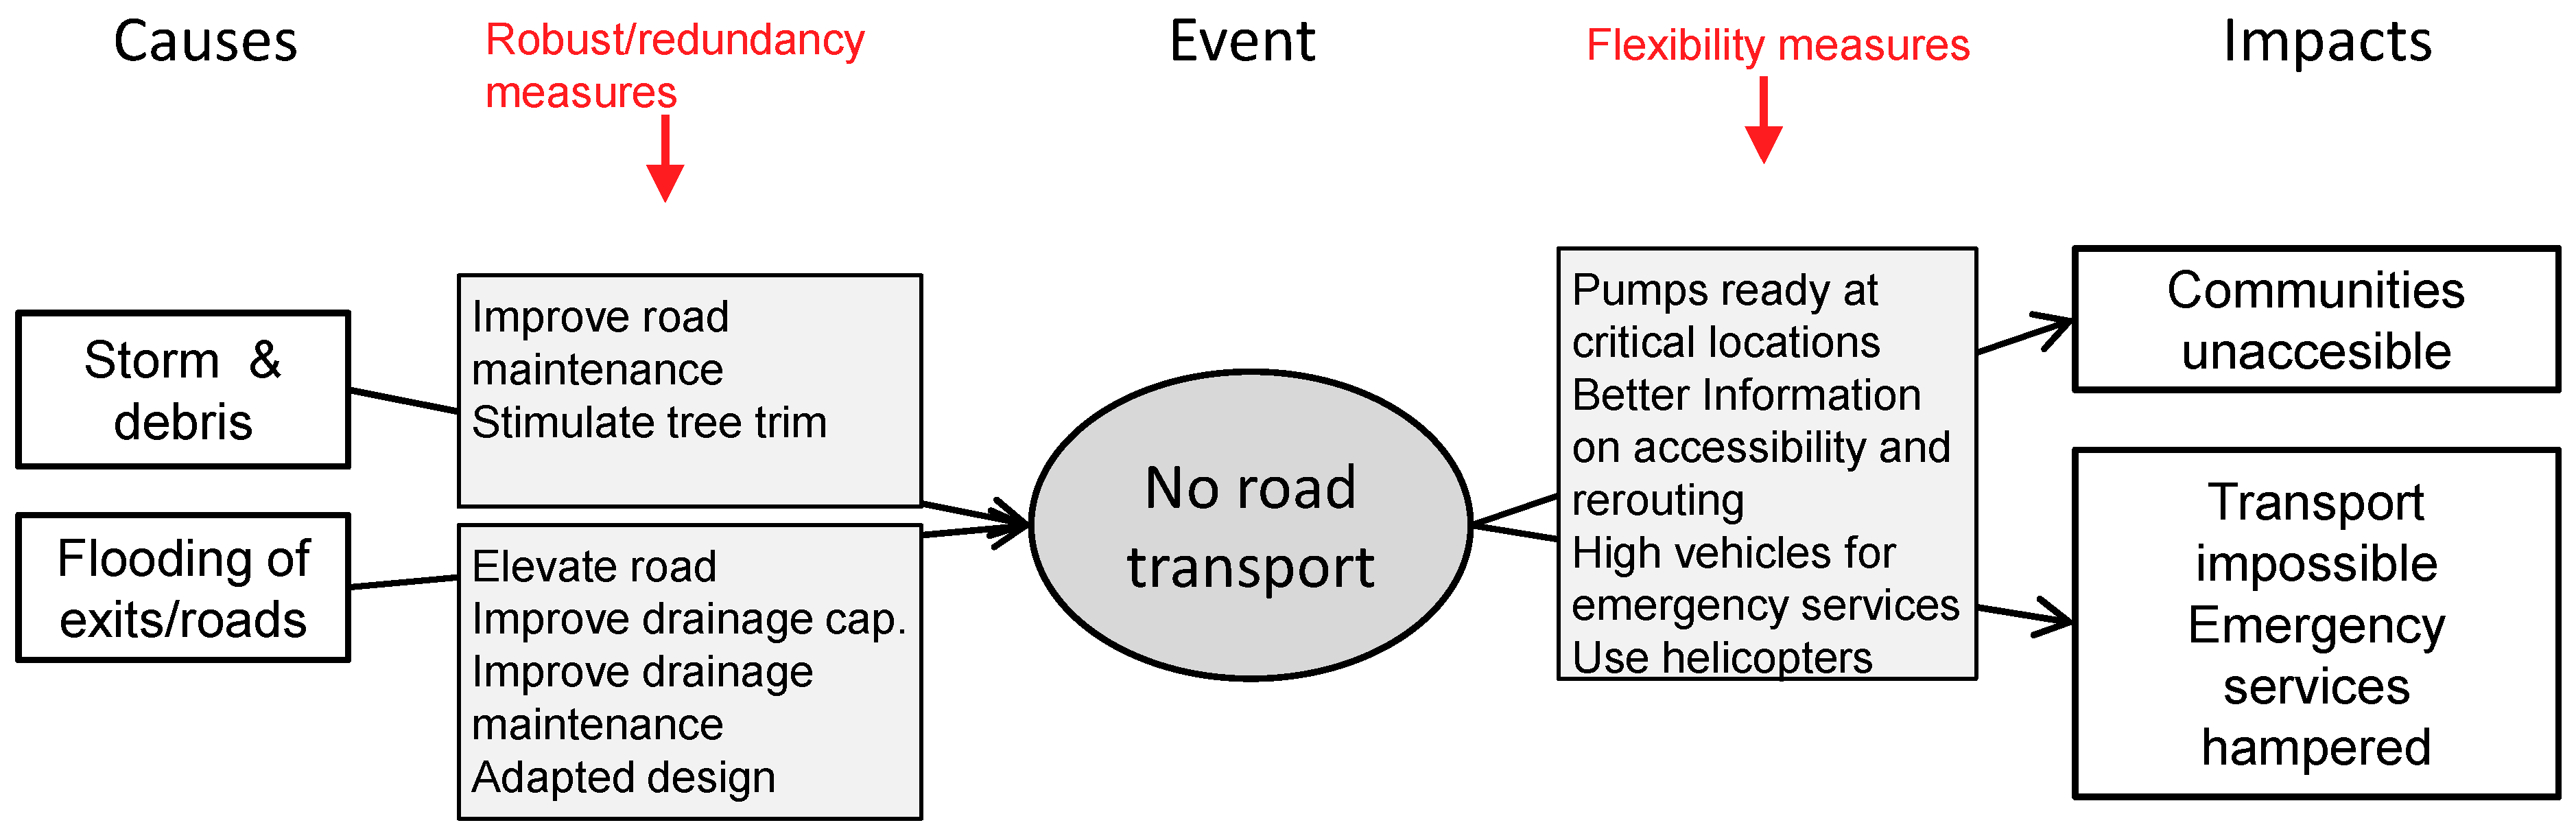
- Identifying potential adaptation measures (using the bowtie scheme).
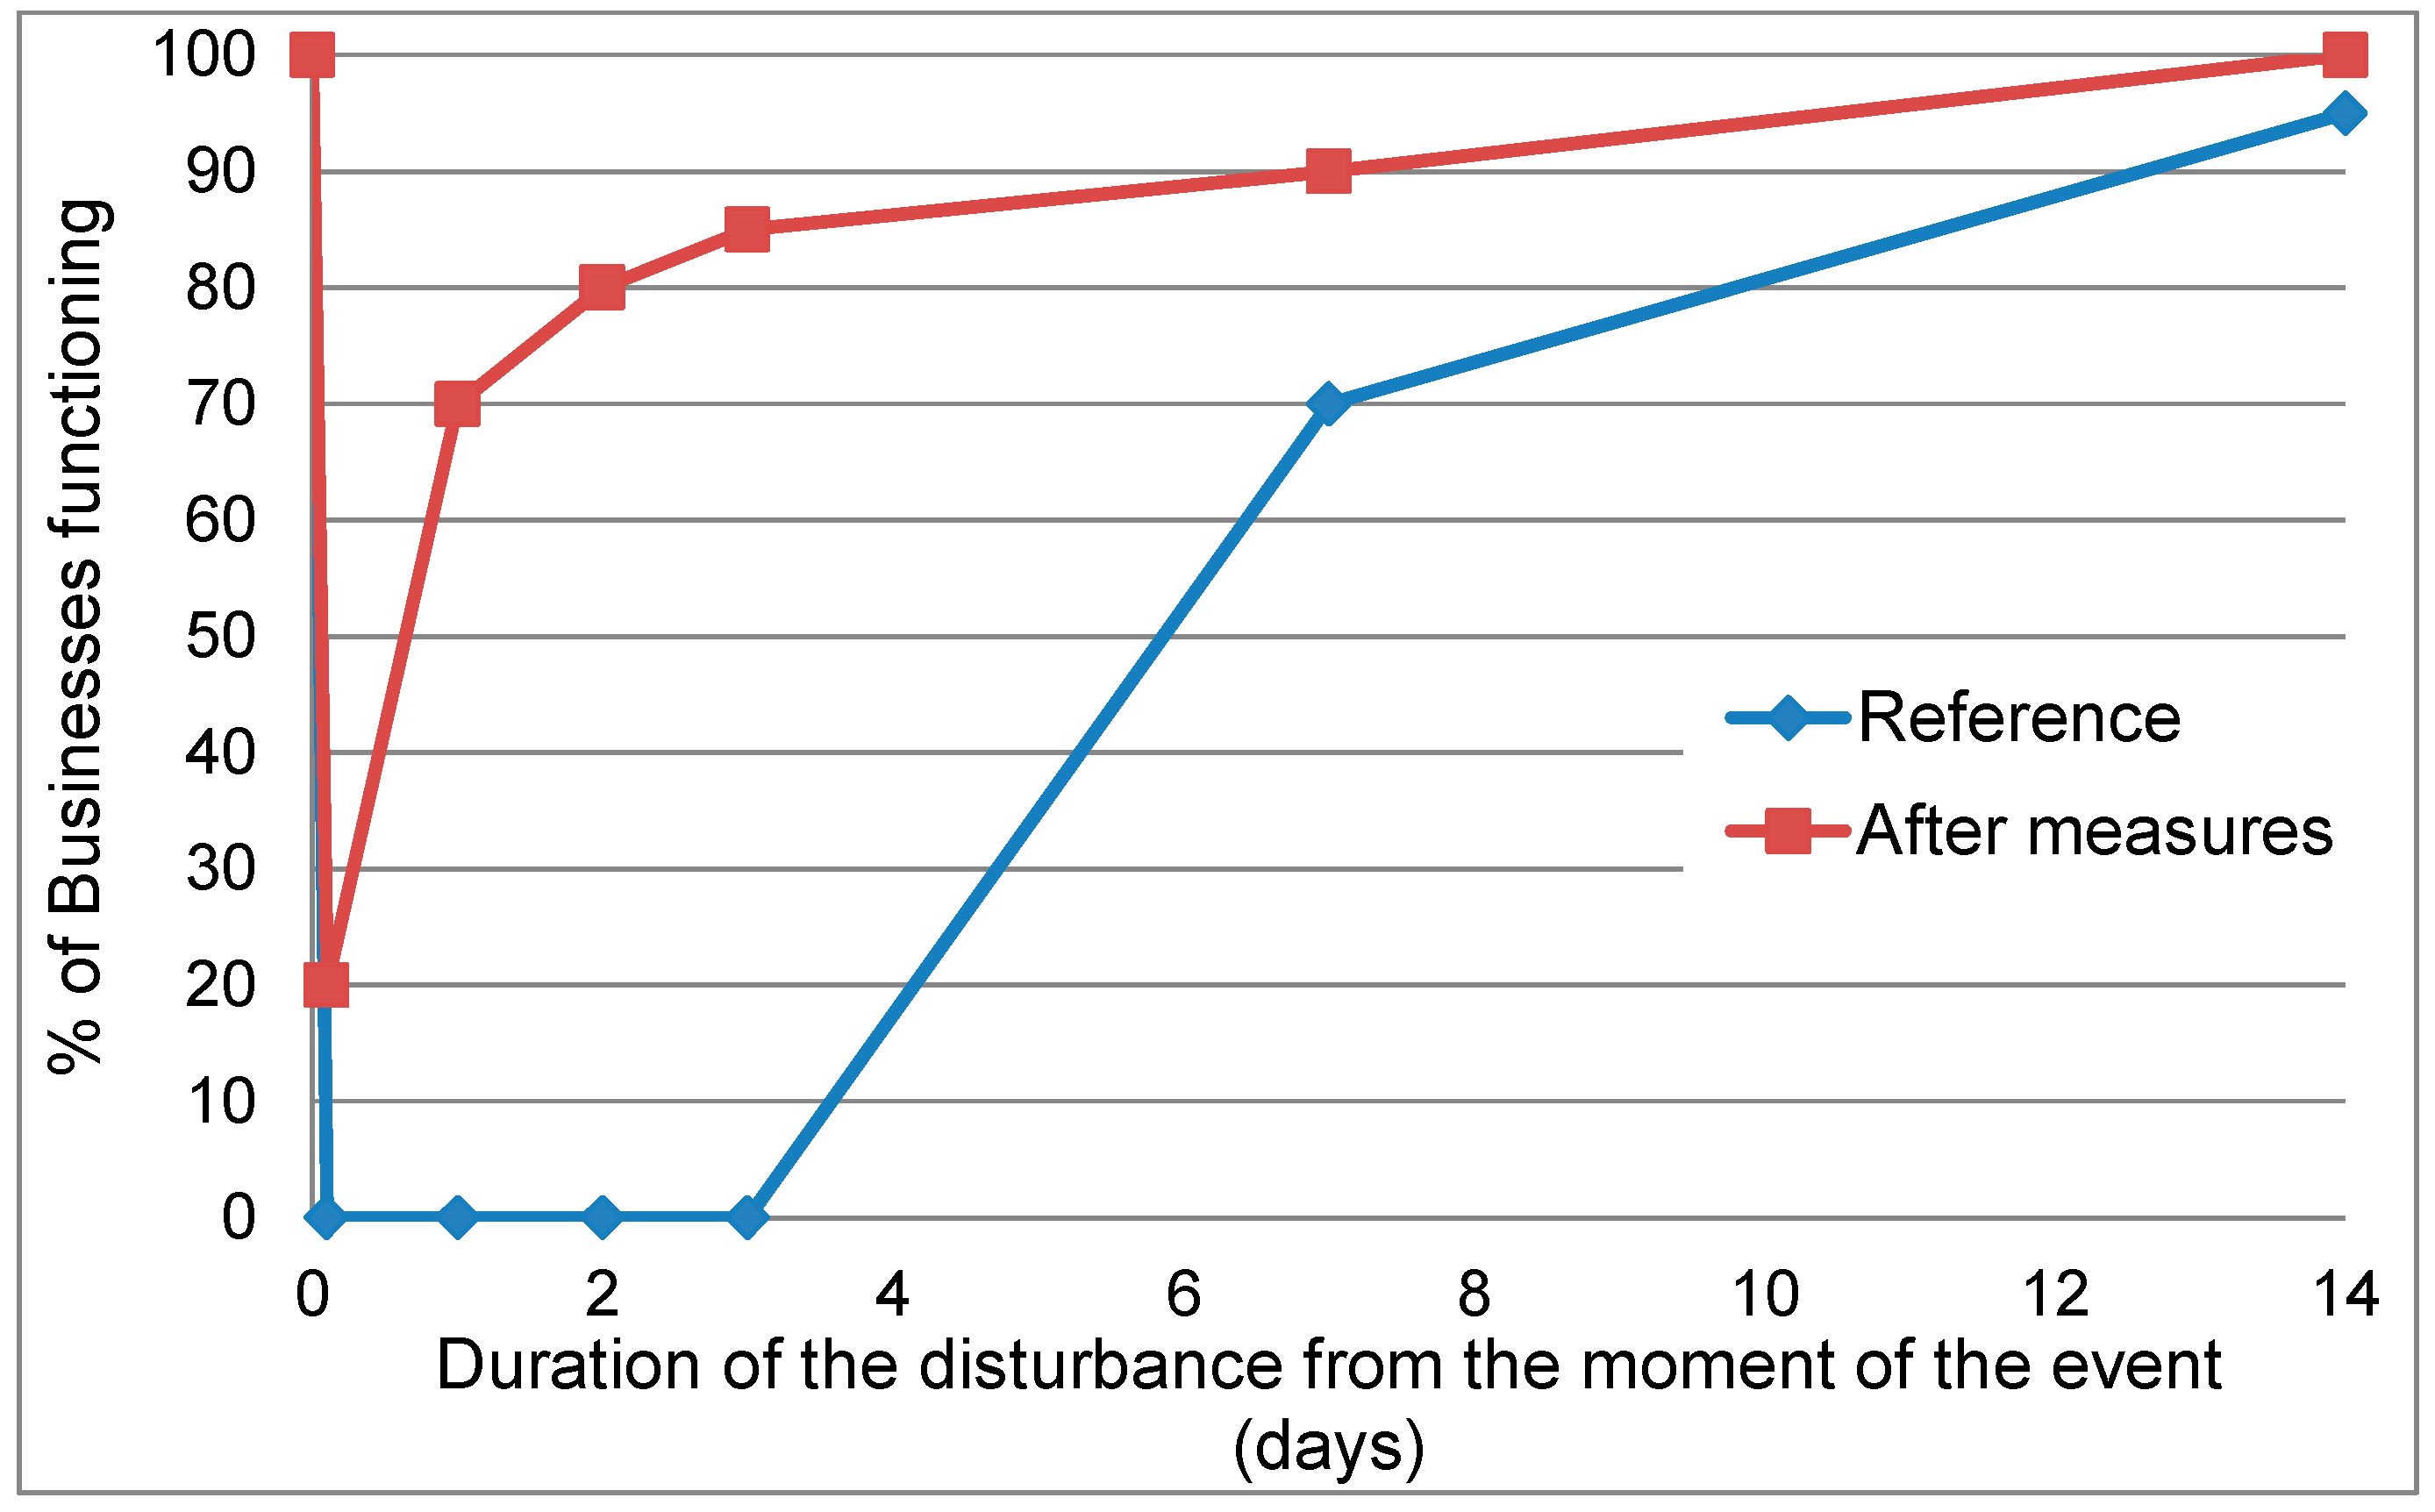
- Quantify future resilience and discuss the effect of measures.
2.3. Data Input and Tools Used to Assess the Current Situation
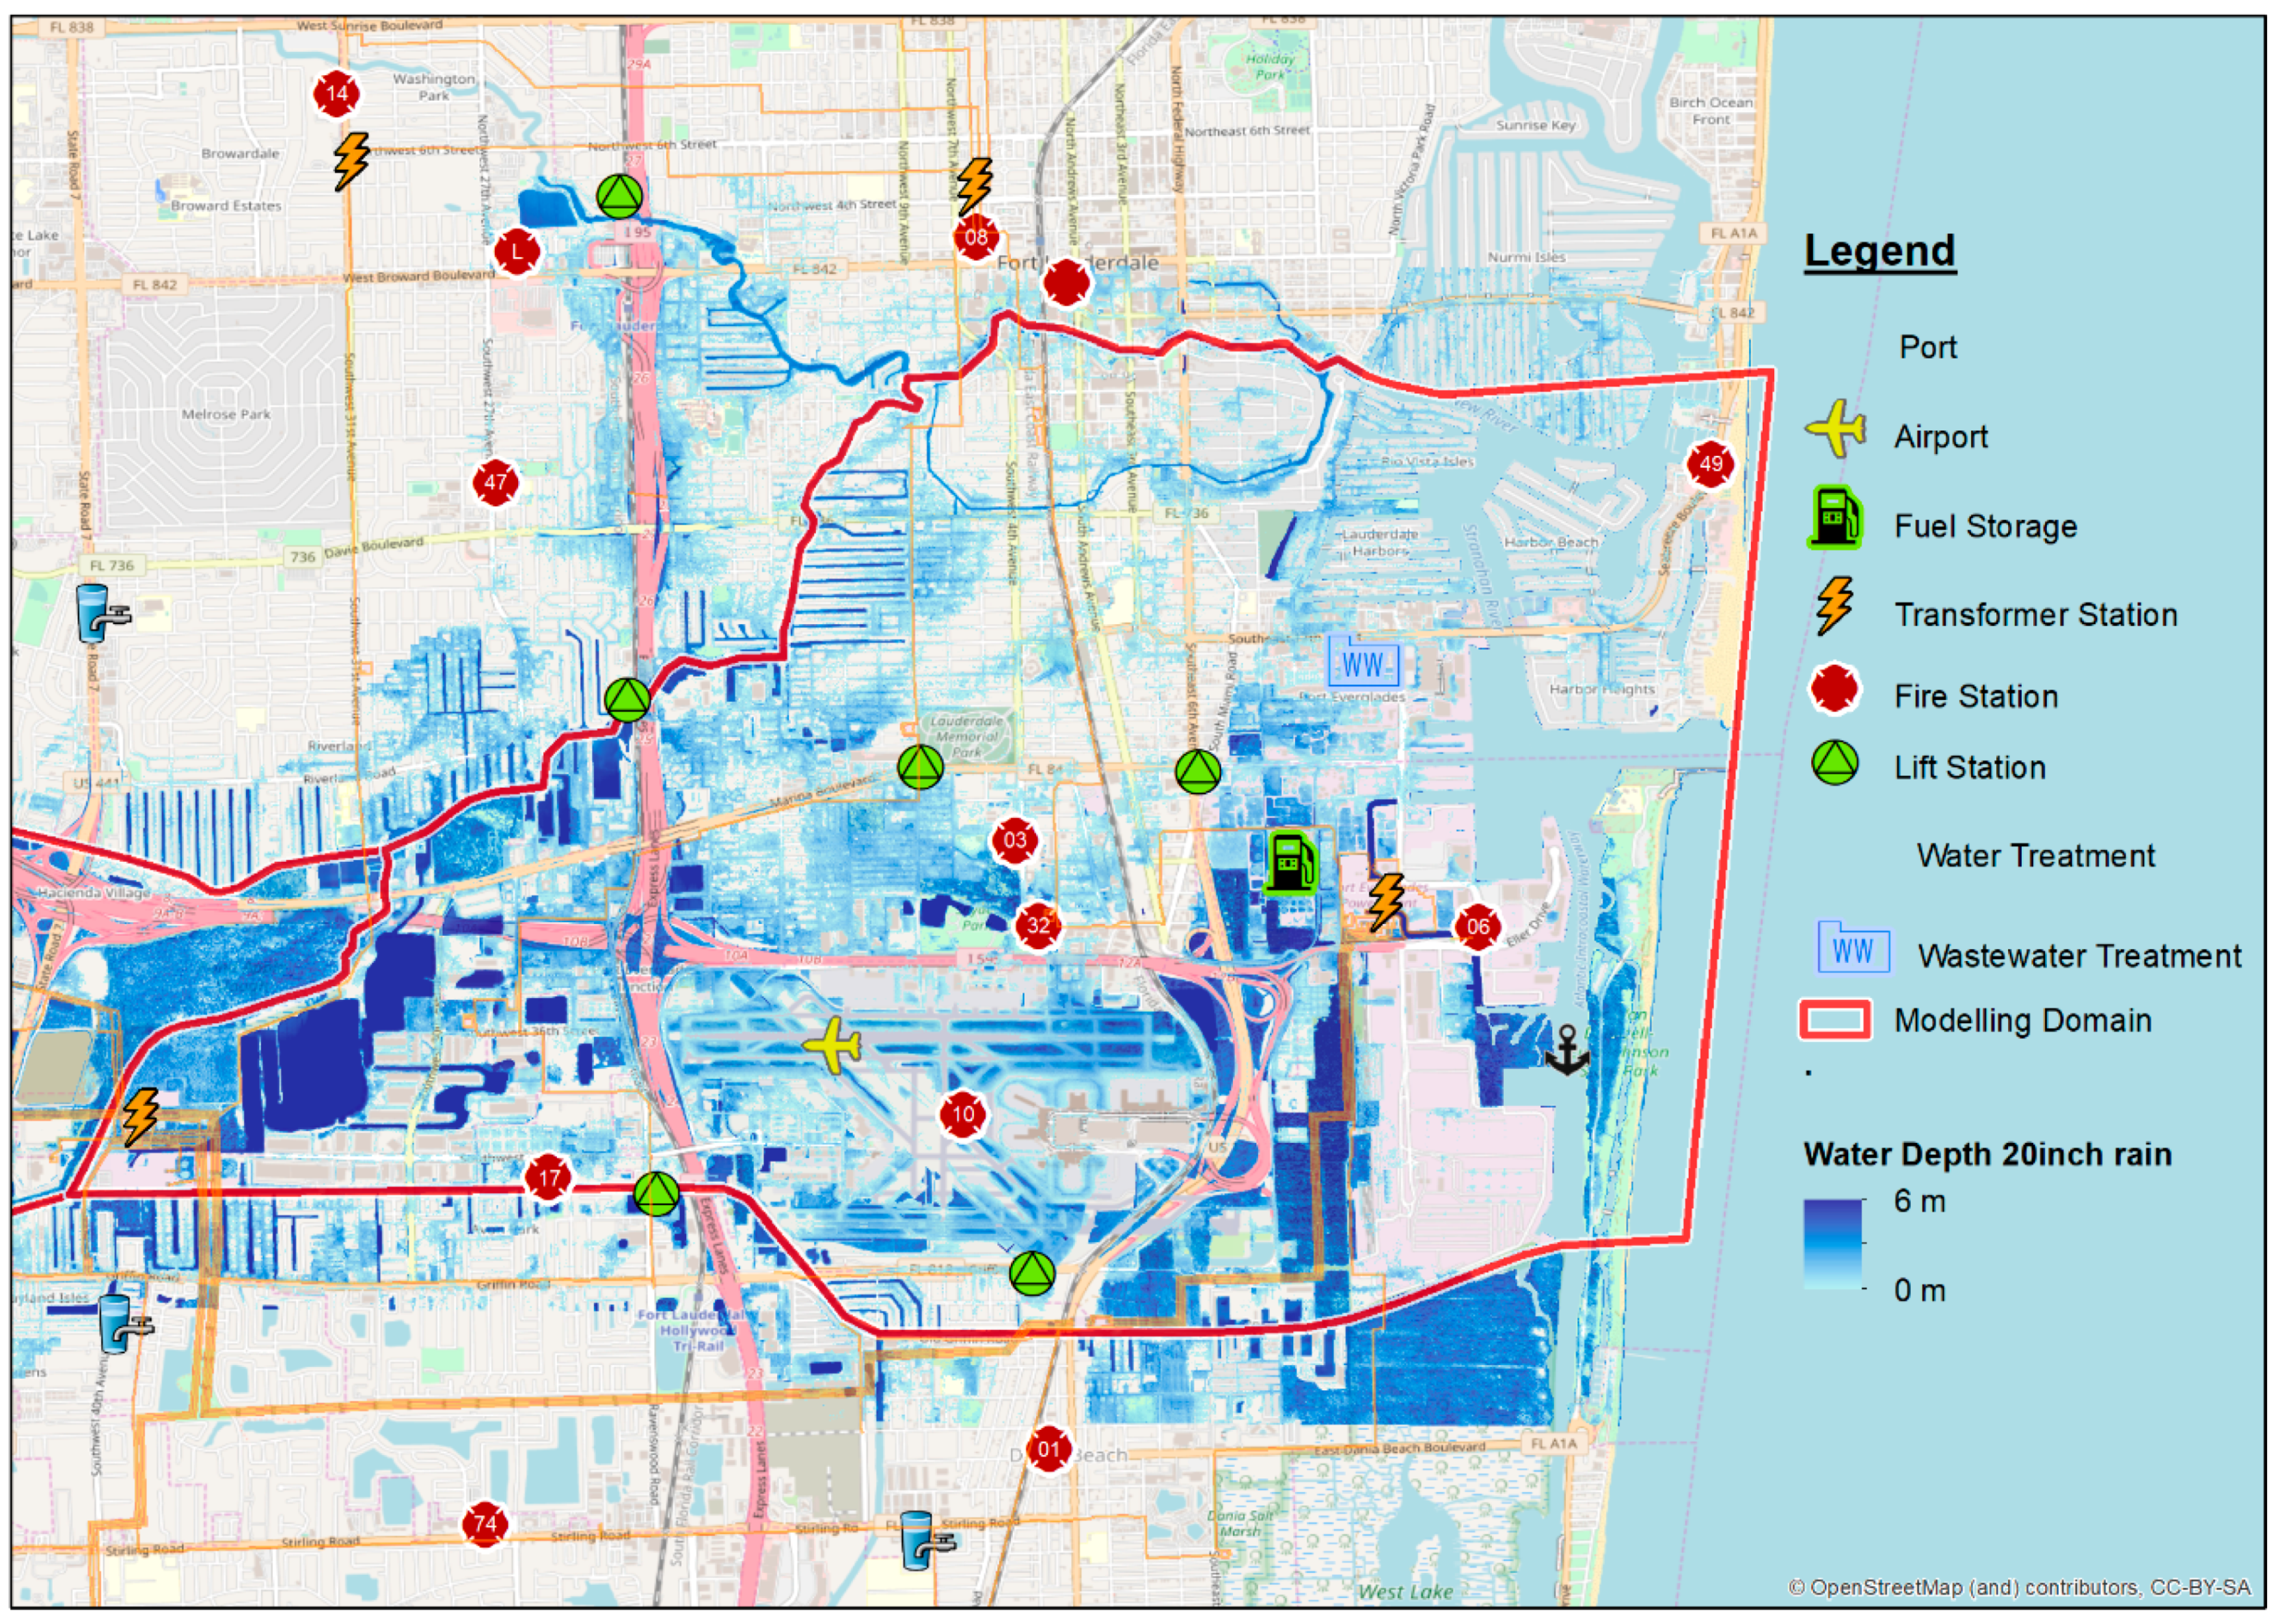
- What area may become flooded and what are potential flood characteristics?
- What CI is present in the flood-prone area?
- What are the thresholds of damage of individual CI elements?
- If a particular CI element is damaged, does that cause the CI network to fail?
- If a CI service is disrupted, does that have cascading effects to other CI networks?
- What are the impacts on society of the CI disruptions?
- What is the overall resilience of communities related to CI disruptions?
- How can the resilience be increased?
3. Results: Resilience of the CI of Fort Lauderdale
3.1. Fort Lauderdale: Area Description
3.2. CI Vulnerability and Cascading Effects
3.3. Storyline: 3 Day Extreme Rainfall Event (T100)
3.3.1. Selection of the Scenario of the Storyline
3.3.2. Before the Flooding
3.3.3. During the Event
3.3.4. After the Flood
3.4. Resilience Assessment
4. Exploring Resilience Increasing Measures
- Electricity: power transmission stations are raised (increase robustness) and power backups are made available for more days (flexibility/redundancy) to reduce the number of affected persons from 45,000 persons for 14 days to 5000 persons for 7 days;
- Roads: roads are repaired faster and the most crucial exits are made more robust. This is assumed to reduce the number of affected persons after one day from 18,000 (during two days) to 9000 during one day.
- Drinking water plants are fully protected against flooding.
- Emergency management, financial systems, commercial facilities, and waste water and storm water are less likely to become disrupted and are recovered sooner since power and transport options are reduced and do not last as long. Losses reduce from 3 to 1 million person days.
5. Discussion and Conclusions
Author Contributions
Funding
Conflicts of Interest
Appendix A. Overview of Direct and Indirect Flood Impacts Related to Critical Infrastructure

| CI Service | Direct Effect from Floods | Indirect Effects by Disruptions in Other CI Networks | Impact on Citizens | Repair Time [21] |
|---|---|---|---|---|
| Power supply | Transformation stations may be flooded, failure if depth exceeds 30 cm (1 ft) is likely | Roads: If roads are closed, repairs may take more time, and fuel for backup systems may not be obtained. After 2–4 days, this may result in problems | No light, air-conditioning, power in homes and businesses. Severe business interruption and reduced livability | Up to 4 weeks, most critical services repaired within days |
| Road transport | Roads may become blocked by debris or fallen poles/trees, exits may become flooded. Roads inaccessible if water depths > 1 ft | Power: Disruption will affect signalling systems and cause delays on roads | Difficulties getting food and supplies or assistance, and to repair damages; business interruption | Regional: first 2 days, full network |
| Financial services (cash machines) | - | Power: If power is out, then some will not function. Others have backup power supply systems. | No cash, business interruption | Days to 2 weeks |
| Railroads | Power: Disruption will affect signalling systems and cause delays on roads | No transport by rail | Days | |
| Airport | Landing lanes may become flooded | Power: Light, communication, signalling, luggage control Transport: If roads, railroads do not function, then people, goods, and personnel may not reach the airport. Harbor: People and goods may not reach the airport if the port is closed | Difficult to evacuate patients, tourists may use other airfields and ports, reputation damage, loss of business | About 3 days |
| Harbor | Parts of the port can become flooded | Power: Electric cranes, signalling and electronic controls are not functioning Transport: If roads and railroads are closed, no supplies and people cannot reach the port Airport: If people cannot arrive by plain, they will miss their cruise ship | Reputation damage, loss of business | Port closed for about 3 days, effects may last longer. |
| Drinking water supply | Drinking water production facilities may become flooded if water depths exceed 30 cm (1 ft) and are then contaminated | Communication: Drinking water has its own communication system and is not affected by communication interruptions Power: Drinking water has backups for 4–5 days | Reduced livability, health risks | Several days |
| Waste water system | Some facilities can become flooded, leading to outage and contamination of the surrounding areas | Power: Not all lift stations have backups; fuel for 2 days Transport: Without transport, fuel for the backup systems cannot be reached Communication: If wastewater overflows cannot be communicated, then no measures can be taken | Reduced livability, health risks | Weeks |
| Communication systems | No direct impacts expected | Power supply: Without power, the communication system does not work Transport: If roads are closed, then no fuel for backup systems can be brought in | Slowdown of response, impossibility of reaching out for help, lack of information causing uncertainty resulting in stress, impossibility of checking on the well-being of relatives and friends | 2 days to 4 weeks (1 week) |
| Storm water system | Some facilities can become flooded | Power: Without power, pumps do not operate; there are fuelled backups for 2–4 days Transport: Without transport, fuel cannot be reached Communication: Gates and pumps cannot be controlled | Additional flooding locally | 2 days |
| Emergency services | No direct effects expected | Power, transport, and communication: Without these, emergency service operations are hampered | Delays or no rescue of ill or wounded people; uncertainty on status, duration, and what to do, which increases stress | 1 week |
| Health care | Transport: If roads are closed, supplies, patients, and personnel cannot reach the hospital Emergency services: If they do not function well, patients may not able to arrive Drinking water: Without drinking water, the hospital cannot operate Airport: Patients and supplies cannot be transported by air when needed Power is only an issue when it is out for more than 5 days. | Dangerous situations for patients and wounded persons | Days | |
| Commercial facilities | Some supermarkets and other commercial facilities are flood-prone | Power: Without power, supermarkets will be closed Transport: People cannot reach the supermarket Financial services: If financial services do not operate, commercial services cannot function | Lack of food and supplies | Closed for 3 days, effects lasting longer |
References
- Hallegatte, S.; Green, C.; Nicholls, R.J.; Corfee-Morlot, J. Future flood losses in major coastal cities. Nat. Clim. Chang. 2013, 3, 802–806. [Google Scholar] [CrossRef]
- Hirabayashi, Y.; Mahendran, R.; Koirala, S.; Konoshima, L.; Yamazaki, D.; Watanabe, S.; Kanae, S. Global flood risk under climate change. Nat. Clim. Chang. 2013, 3, 816–821. [Google Scholar] [CrossRef]
- Winsemius, H.C.; Van Beek, L.P.H.; Jongman, B.; Ward, P.J.; Bouwman, A. A framework for global river flood risk assessments. Hydrol. Earth Syst. Sci. 2013, 17, 1871–1892. [Google Scholar] [CrossRef]
- De Bruijn, K.M.; Buurman, J.; Mens, M.; Dahm, R.; Klijn, F. Resilience in practice: Five principles to enable societies to cope with extreme weather events. Environ. Sci. Policy 2017, 70, 21–30. [Google Scholar] [CrossRef]
- Aerts, J.C.J.H.; Botzen, W.; Clarke, K.C.; Cutter, S.L.; Hall, J.W.; Merz, B.; Michel-Kerjan, E.; Mysiak, J.; Surminski, S.; Kunreuther, H. Integrating human behaviour dynamicss into flood disaster risk assessment. Nat. Clim. Chang. 2018, 8, 193–1999. [Google Scholar] [CrossRef]
- Pant, R.; Thacker, S.; Hall, J.W.; Alderson, D.; Barr, S. Critical infrastructure impact assessment due to flood exposure. J. Flood Risk Manag. 2018, 11, 22–33. [Google Scholar] [CrossRef]
- Pitt, M. The Pitt Review—Learning Lessons from the 2007 Floods; Cabinet Office: London, UK, 2008. Available online: http://archive.cabinetoffice.gov.uk/pittreview/thepittreview/final_report.html (accessed on 1 February 2019).
- McBain, W.; Wilkdes, D.; Retter, M. Flood Resilience and Resistance for Critical Infrastructure; CIRIA C688; CIRIA: London, UK, 2010. [Google Scholar]
- De Bruijn, K.M.; Cumiskey, L.; Dhubhda, R.N.; Hounjet, M.; Hynes, W. Flood vulnerability of critical infrastructure in Cork, Ireland. In E3S Web of Conferences; EDP Sciences: Les Ulis, France, 2016; Volume 7, p. 7005. [Google Scholar]
- Kalantari, Z.; Nickman, A.; Lyon, S.W.; Olofsson, B.; Folkeson, L. A method for fmapping flood hazard along roads. J. Environ. Manag. 2014, 133, 69–77. [Google Scholar] [CrossRef] [PubMed]
- De Bruijn, K.M.; van der Most, H.; Cumiskey, L.; Hounjet, M.; Mens, M. Methods and Tools Supporting Urban Resilience Planning: Experiences from Cork, Ireland. J. Geosci. Environ. Prot. 2018, 6, 290. [Google Scholar] [CrossRef]
- UNISDR (United Nations International Strategy for Disaster Reduction). Sendai Framework for Disaster Risk Reduction 2015–2030; UNISDR: Geneva, Switzerland, 2015; Available online: http://www.unisdr.org/files/43291_sendaiframeworkfordrren.pdf (accessed on 20 April 2015).
- Burzel, A.; Hounjet, M.; Becker, B.; Di Pietro, A.; Pollino, M.; Rosato, V.; Tofani, A. Towards a Decision Support System for Consequence Analysis of Flooding on Critical Infrastructure. In Proceedings of the 11th International Conference on Hydroinformatics, New York, NY, USA, 17–21 August 2014. [Google Scholar]
- De Bruijn, K.M.; Lips, N.; Gersonius, B.; Middelkoop, H. The storyline approach: a new way to analyse and improve flood event management. Nat. Hazards 2016, 81, 99–121. [Google Scholar] [CrossRef]
- De Dianous, V.; Fiévez, C.L. ARAMIS project: A more explicit demonstration of risk control through the use of bow–tie diagrams and the evaluation of safety barrier performance. J. Hazard. Mater. 2006, 130, 220–233. [Google Scholar] [CrossRef] [PubMed]
- Béné, C.; Cannon, T.; Gupte, J.; Mehta, L.; Tanner, T. Exploring the Potential and Limits of the Resilience Agenda in Rapidly Urbanising Contexts. Evidence Report 63; Policy Anticipation, Response and Evaluation; Institute of Development Studies: East Sussex, UK, 2014. [Google Scholar]
- Folke. Resilience thinking: Integrating resilience, adaptability and transformability. Ecol. Soc. 2010, 15, 20. [Google Scholar] [CrossRef]
- Sharifi, A.; Yamagata, Y. Urban Resilience Assessment: Multiple Dimensions, Criteria, and Indicators. In Urban Resilience; Springer: Cham, Switzerland, 2016; Available online: https://www.researchgate.net/publication/306016491_Urban_Resilience_Assessment_Multiple_Dimensions_Criteria_and_Indicators (accessed on 3 January 2019). [CrossRef]
- Murdock, H.J.; De Bruijn, K.M.; Gersonius, B. Assessment of Critical Infrastructure Resilience to Flooding Using a Response Curve Approach. Sustainability 2018, 10, 3470. [Google Scholar] [CrossRef]
- ARUP. City Resilience Framework; ARUP: London, UK, 2015. [Google Scholar]
- Anonymous. Critical Infrastructure Networks of Broward County. Assessing Relationships and Exploring Adaptation and Mitigation Measures in Participatory Stakeholder Workshops; CIfre Project Report; Deltares Inc.: Silver Spring, MD, USA, 2018; Available online: http://circle-cifre.nl/downloads/Overall%20workshop%20report%20CIFRe%20project.pdf (accessed on 1 February 2019).
- Weblink Circle. Available online: http://circle.deltares.org (accessed on 1 February 2019).
- CGERISK. Available online: https://www.cgerisk.com/knowledgebase/The_history_of_bowtie (accessed on 30 October 2018).
- De Ruijter, A.; Guldenmund, F. The bowtie method: A review. Saf. Sci. 2016, 88. [Google Scholar] [CrossRef]
- Weblink Intact. Available online: http://scm.ulster.ac.uk/~scmresearch/intact/index.php/Bow_tie_analysis (accessed on 3 January 2019).
- Weblink. Available online: https://www.fortlauderdale.gov/government/about-fort-lauderdale (accessed on 26 November 2018).
- Weblink. Available online: https://nl.wikipedia.org/wiki/Fort_Lauderdale (accessed on 24 September 2018).
- Federal Emergency Management Agency. Flood Insurance Study. Available online: https://fris.nc.gov/fris_hardfiles/FL/FIS/12011CV000A.pdf (accessed on 1 February 2019).
- FSU Data Weblink. Available online: https://www.coaps.fsu.edu/data (accessed on 1 November 2017).
- Anonymous. Assessment of Available Tools to Create a More Resilient Transportation System, Final Report for Resolution R-235-16; Directive 160220; Miami Dade County: Miami, FL, USA, 2016.
- SFWMD. South Florida Water Management District’s Environmental Resource Permit Applicant’s Handbook; SFWMD: West Palm Beach, FL, USA, 1 October 2013; Volume 11.
- Decker, J.D.; Hughes, J.D.; Swain, E.D. Potential for Increased Inundation in Flood Prone Regions of South Florida in Response to Climate and Sea-Level Changes in Broward County, FL, 2060–2069; United States Geological Survey Scientific Investigations Report; U.S. Geological Survey: Reston, VA, USA, 2019.
- Weblink. Available online: http://www.broward.org/Hurricane/Documents/EmergencyChecklists.pdf (accessed on 28 September 2018).


| CI | Description | Impact Type | # of Affected Persons | Duration |
|---|---|---|---|---|
| Power supply | No power, light, air-conditioning | Direct | 15,000 houses × 3 persons per house = 45,000 persons (based on Irma impacts and expert judgement) | 3–14 days |
| Communication | No access to information/assistance | Indirect due to power outage | 45,000 persons (similar to the ones without power) | 3–14 days |
| Road transport | Roads are closed | Direct | First 1 day: all inhabitants (180,000), then 10%, after 1 week, very few inhabitants. | 1 day complete, 3 days severe, 1 week serious |
| Emergency services and health care | Less access to information and responders, health risks | Indirect due to closed roads and power outages | Whole population at first, then 10% | 3 days, then 1 week. |
| Financial services | No cash | Indirect due to power outage | 30% of the cash machines affecting 30% of the population = 0.3 × 180,000 = 54,000 | 3 days |
| Drinking water supply | Reduced livability, health loss | Direct | Whole population: 180,000 | 3 days |
| Waste water system | Reduced livability, health loss | Indirect, loss of communication, power | Rough estimation: 10% of the population | 2 weeks |
| Storm water system | Additional local flooding | Indirect due to power interruptions | A few people locally | Several days |
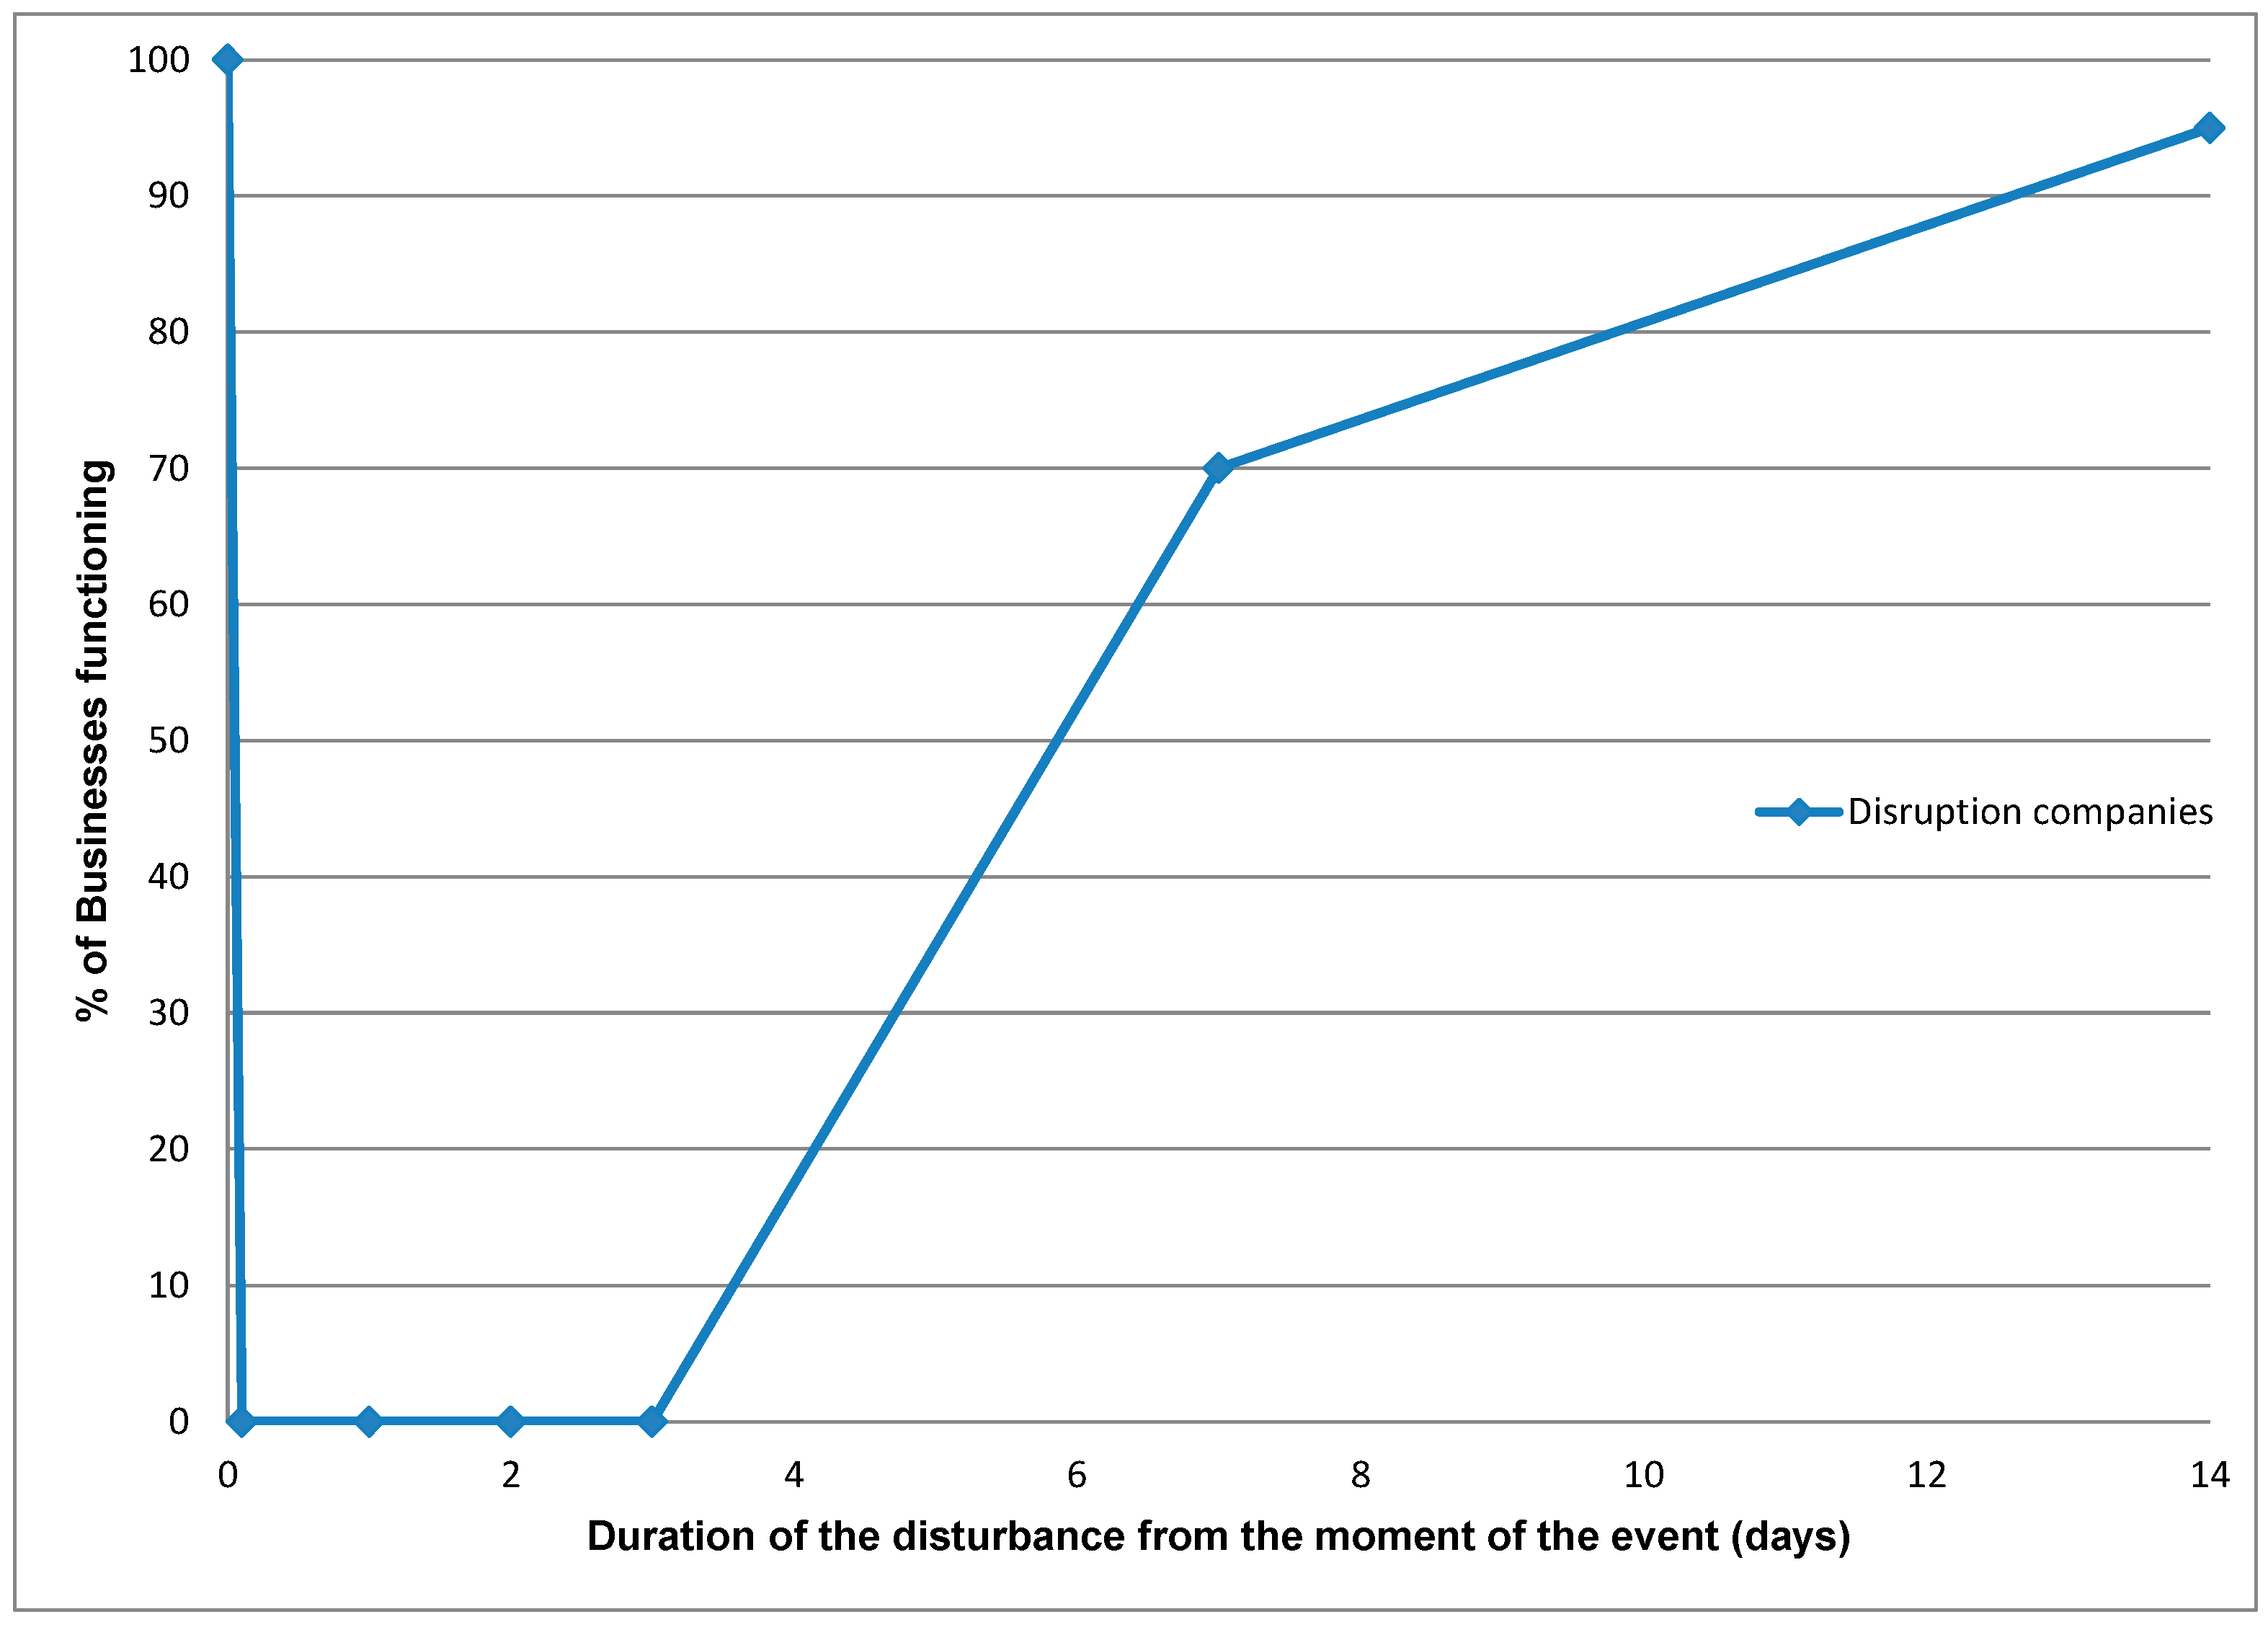
| Commercial facilities | Shortage of food and supplies | Direct and indirect due to power supply, transport, and financial services interruptions | 70% of businesses without power. Assumption: also 70% of population is affected | 3 days |
| Disruption Calculation | Affected | Duration (Days) | Disruption Days (Product) |
|---|---|---|---|
| Power and/or communication outages | 45,000 | 7 | 315,000 |
| Roads | 180,000 | 1 | 180,000 |
| 18,000 | 2 | 36,000 | |
| Financial services outages | 54,000 | 7 | 378,000 |
| Emergency and health | 180,000 | 3 | 540,000 |
| 18,000 | 7 | 126,000 | |
| Drinking water | 180,000 | 3 | 540,000 |
| Waste water | 18,000 | 14 | 252,000 |
| Commercial | 126,000 | 3 | 378,000 |
| SUM | 2,745,000 |
| CI | Description | Impact Type | # of Affected Persons (Workshop Report, Interviews) | Duration |
|---|---|---|---|---|
| Power supply | No power, light, air-conditioning | Direct | 70% of all businesses | 3–7 days |
| Communication | No access to information/assistance | Indirect due to power outage | 70% of all businesses | 3–7 days |
| Road transport | Roads are closed | Direct | First 1 day: all, then 10%, after 1 week, very few (expert judgement) | 1–7 days |
| Emergency services and health care | Less access to police | Indirect due to closed roads and power outages | 100% at first, then 10% | 3 days, then 1 week. |
| Financial services | No cash | Indirect due to power outage | 30% of population and businesses | 3 days |
| Commercial facilities | Shortage of food and supplies | Direct and indirect due to power supply, transport interruptions | 70% for the first 3 days, 30% after a week, then reducing fast. | 3 days |
| Airport, railroad, and Harbor | Closure or delays/flight/boat cancelations/impossibility of getting supplies/fuel | Direct and indirect due to transport and power interruptions | Not quantified: related to number of passengers per day and number of businesses depending on air-transport/port; also, health risks may be considered. Furthermore, image loss may have significant impact on the local economy. | 3 days, image loss may affect area for years |
| CI | Affected | Duration | Product |
|---|---|---|---|
| Power and communication | 5000 | 7 | 35,000 |
| Roads | 180,000 | 1 | 180,000 |
| 9000 | 1 | 9000 | |
| Financial | 54,000 | 7 | 378,000 |
| Emergency and health | 180,000 | 1 | 180,000 |
| 18,000 | 3 | 54,000 | |
| Drinking water | 0 | 3 | 0 |
| Waste water | 9000 | 14 | 126,000 |
| Commercial | 126,000 | 1 | 126,000 |
| SUM | 1,088,000 | ||
© 2019 by the authors. Licensee MDPI, Basel, Switzerland. This article is an open access article distributed under the terms and conditions of the Creative Commons Attribution (CC BY) license (http://creativecommons.org/licenses/by/4.0/).
Share and Cite
de Bruijn, K.M.; Maran, C.; Zygnerski, M.; Jurado, J.; Burzel, A.; Jeuken, C.; Obeysekera, J. Flood Resilience of Critical Infrastructure: Approach and Method Applied to Fort Lauderdale, Florida. Water 2019, 11, 517. https://doi.org/10.3390/w11030517
de Bruijn KM, Maran C, Zygnerski M, Jurado J, Burzel A, Jeuken C, Obeysekera J. Flood Resilience of Critical Infrastructure: Approach and Method Applied to Fort Lauderdale, Florida. Water. 2019; 11(3):517. https://doi.org/10.3390/w11030517
Chicago/Turabian Stylede Bruijn, Karin M., Carolina Maran, Mike Zygnerski, Jennifer Jurado, Andreas Burzel, Claire Jeuken, and Jayantha Obeysekera. 2019. "Flood Resilience of Critical Infrastructure: Approach and Method Applied to Fort Lauderdale, Florida" Water 11, no. 3: 517. https://doi.org/10.3390/w11030517