Communication

Optimization of Enhanced Ultrafiltration Conditions for Cd with Mixed Biosurfactants Using the Box-Behnken Response Surface Methodology

1
Key Laboratory for Environmental Biotechnology of Higher Education of Fujian Province, Xiamen University of Technology, Xiamen 361024, China
2
Faculty of Engineering, University of Regina, 3737 Wascana Parkway, Regina, SK S4S 0A2, Canada
3
Xiamen Jinque Testing Technology Co., Ltd, Xiamen 361101, China
4
Chinese Academy for Environmental Planning, Beijing 100012, China
*
Author to whom correspondence should be addressed.
Water 2019, 11(3), 442; https://doi.org/10.3390/w11030442
Submission received: 28 December 2018 / Revised: 20 February 2019 / Accepted: 23 February 2019 / Published: 28 February 2019
(This article belongs to the Section Wastewater Treatment and Reuse)

Abstract

:
A mixture of the environmentally friendly biosurfactants rhamnolipids and sophorolipids was used as a source of micelles in this study. The Box-Behnken design and response surface methodology was used to investigate the influence of factors on micellar-enhanced ultrafiltration (MEUF). Simulated Cd-containing wastewater was used for testing. Based on single-factor experiments, the initial Cd2+ concentration, biosurfactant mixing ratio (α) and pH were chosen as influential variables, and both the Cd2+ rejection coefficient and permeation flux were used as responses. A predictive model based on a quadratic polynomial regression equation was established to determine the optimized enhanced ultrafiltration conditions for Cd. The results show that the regression equation is extremely significant and fits the data accurately. The optimal enhanced ultrafiltration conditions are as follows: initial Cd2+ concentration of 10.0 mg/L, α of 0.30 and pH of 9.58. Under these conditions, the rejection coefficient and the permeation flux of Cd2+ are 99.14% and 37.36 L/m2·h, respectively. The experimental results confirm that the experimental values agree well with the values predicted by the model. Further, these results provide theoretical support for using MEUF to treat heavy metal-containing wastewater when biosurfactants are used for micelle formation.

1. Introduction

With increasing industrialization, cadmium (Cd) has become widely used in various fields, including mining, metal working, electroplating and paint manufacturing [1]. As a persistent pollutant, Cd persists for a very long time after entering water bodies [2,3]. Cd also harms human health through accumulation in food chains [4,5]. The common treatment methods for heavy metal ions in aqueous solutions include adsorption [6,7,8,9], bio-based methods [10,11,12], membrane separation techniques [13,14,15], electrolysis [16,17] and chemical precipitation [12,18]. Among these, micellar-enhanced ultrafiltration (MEUF), one of the membrane separation techniques, has received recent attention because it has the advantages of low energy consumption, easy operation, high permeation flux and high removal efficiency [1]. This technique removes heavy metal ions by adding surfactants to wastewater to form micelles that heavy metal ions in water adsorb or bind to, and thus are retained by ultrafiltration membranes. The performance of the MEUF process may be influenced by some dominant factors including surfactant concentration, pH of solution and operating pressure of the process [19]. Currently, the surfactants used in MEUF are generally chemical in nature [20,21,22]. However, chemical surfactants have the shortcomings of high critical micelle concentrations (CMCs), the need to use large amounts for functionality and a high possibility of introducing secondary pollution, which restrict the promotion and application of MEUF. Although biosurfactants feature low CMCs and no secondary pollution, there are very few studies of their application in MEUF [23,24]. Therefore, this work uses a mixture of the environmentally friendly biosurfactants rhamnolipids and sophorolipids as a source of micelles and investigates their effect on the ultrafiltration of Cd. In addition, the Box-Behnken response surface is used to optimize the ultrafiltration conditions with the aim of providing theoretical support for using MEUF to treat heavy metal-containing wastewater when rhamnolipids and sophorolipids are used for micelle formation.

2. Materials and Methods

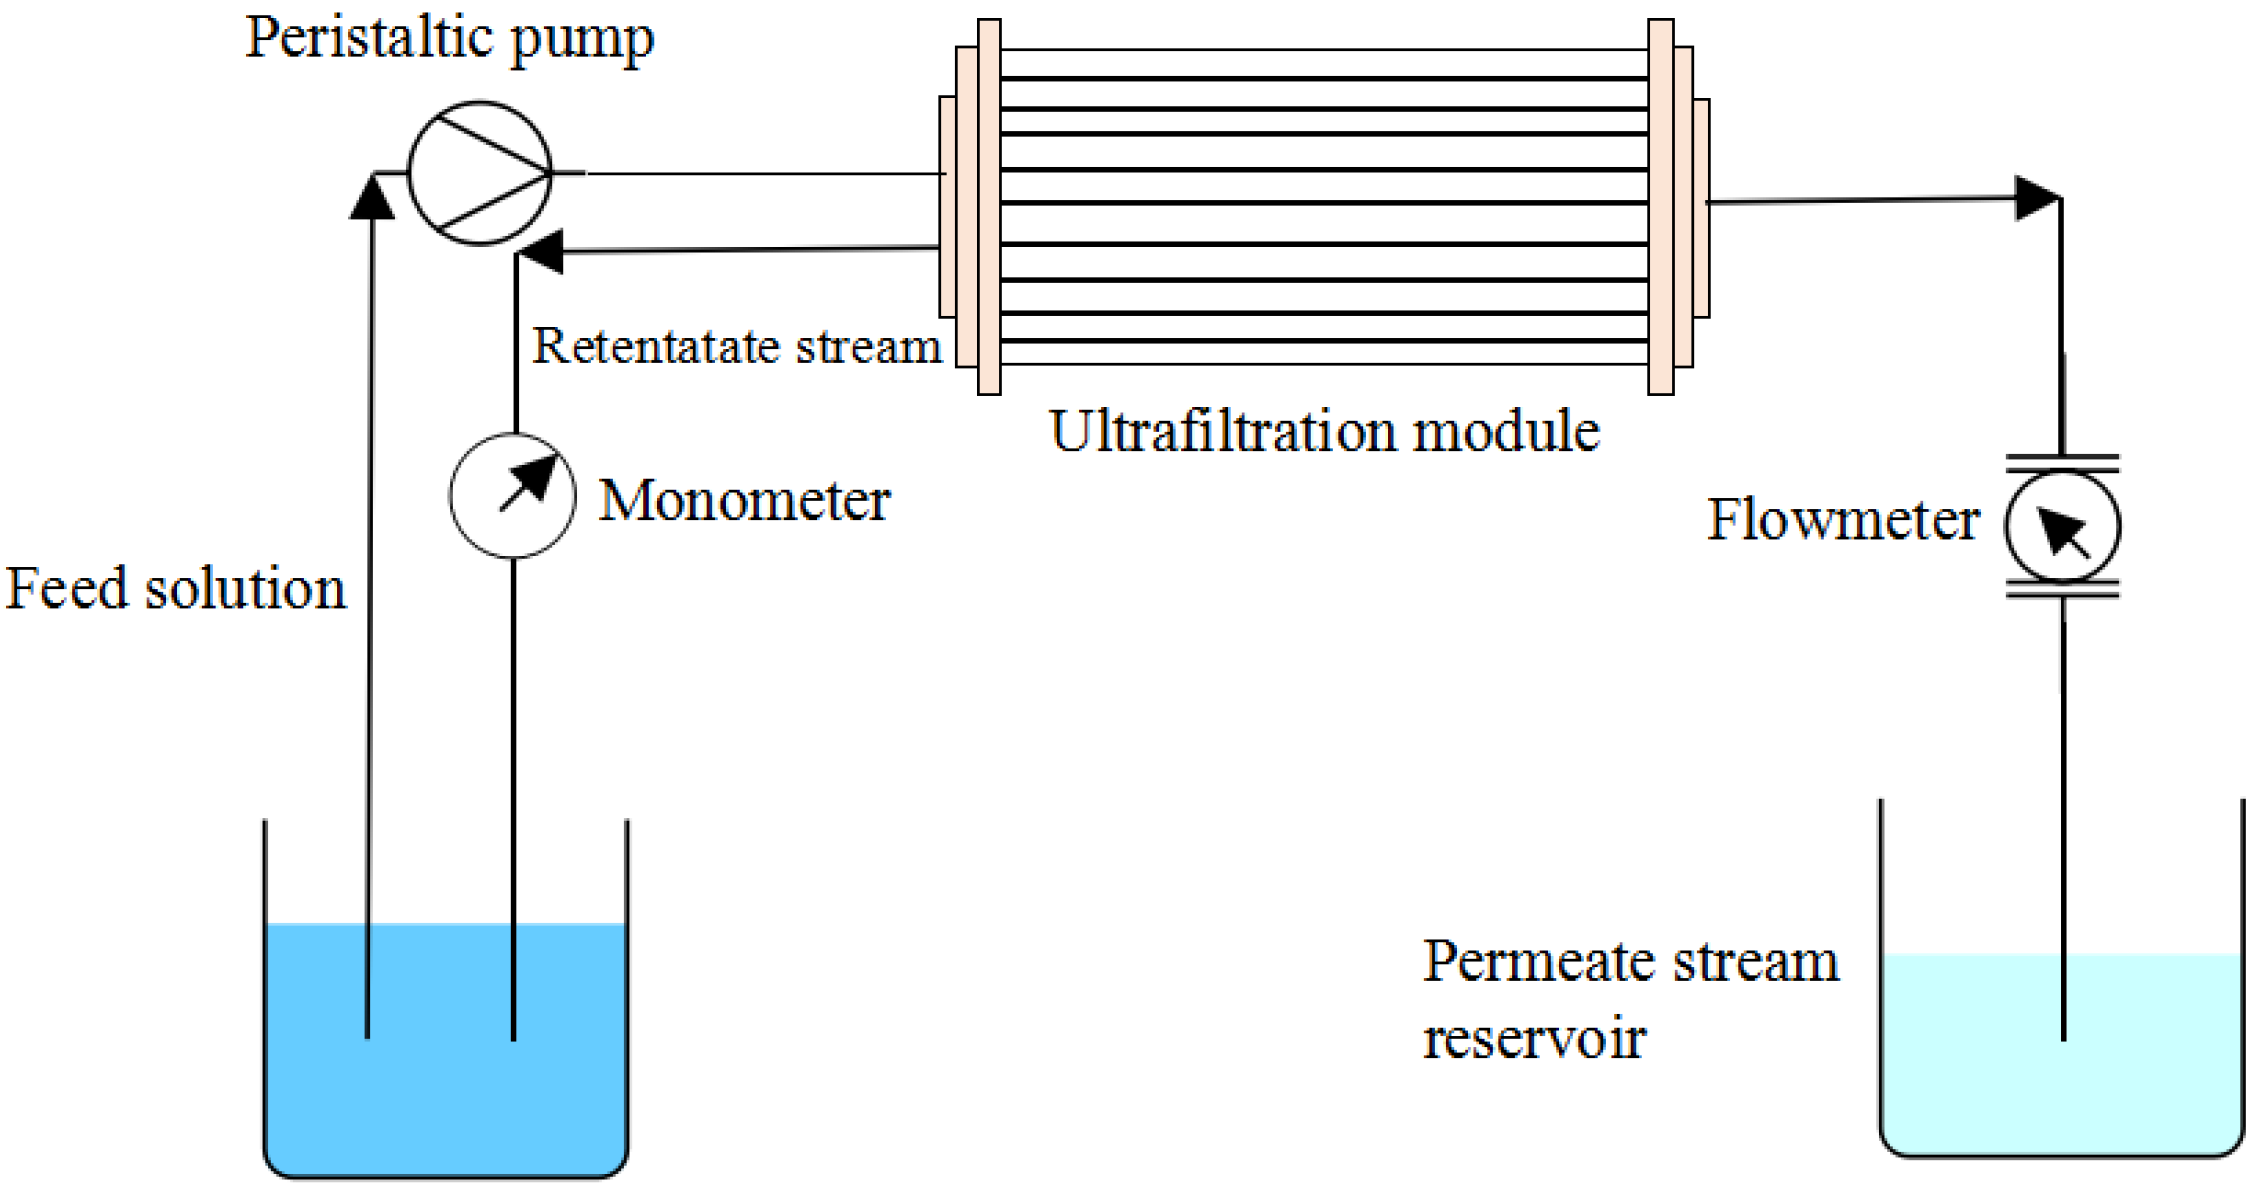
2.1. Experimental Setup

The experimental setup is shown in Figure 1. This includes a membrane pump, a pipeline, a pressure gauge and an ultrafiltration membrane. The equipment’s technical parameters and the main performance parameters of the ultrafiltration membrane are shown in Table 1 and Table 2, respectively.

2.2. Experimental Methods

Specified amounts of the biosurfactants, rhamnolipids and sophorolipids were weighed and added to simulated Cd-containing wastewater. After stirring with a magnetic stirrer on a hot plate, the solution was left standing for 20 min and then ultrafiltered. The simulated wastewater entered the membrane assembly through the membrane pump. The concentrated solution flowed back to the feed chute for ultrafiltration, and the filtrate was collected in a special container to measure the permeation flux. An appropriate amount of filtrate was collected to measure the Cd concentration.

2.3. Box-Behnken Response Curve Design

Box-Behnken designs have served as a popular choice for second-order models, and have been widely used in completely randomized experiments, split-plot experiments and within the robust parameter design setting [25]. By choosing three different levels of the initial Cd2+ concentration, the mixing ratio of biosurfactants (α: the ratio of the sophorolipid concentration to the total surfactant concentration) and pH and using the rejection coefficient and permeation flux of Cd2+ as the two indexes, Minitab 16 was used to design the Box-Behnken response curve experiments. The three different levels of influential variables are shown in Table 3.

2.4. Sample Measurements and Calculation

1. The Cd2+ concentration of the wastewater was measured using an inductively coupled plasma optical emission spectrometer (PE ICP-OES Optima 7000DV).
2. The rejection coefficient was calculated using the following equation:
R = 1 C p C f ,
where Cp is the concentration of pollutants in the filtrate (mg/L), Cf is the concentration of pollutants in the feed solution (mg/L), and R is the rejection coefficient for the pollutants.
3. The permeation flux was calculated using the following equation:
J = Q A t ,
where Q is the volume of filtrate (L), Δt is the running time (h), A is the area of the ultrafiltration membrane (m2), and J is the permeation flux (L/m2·h).

3. Results and Analysis

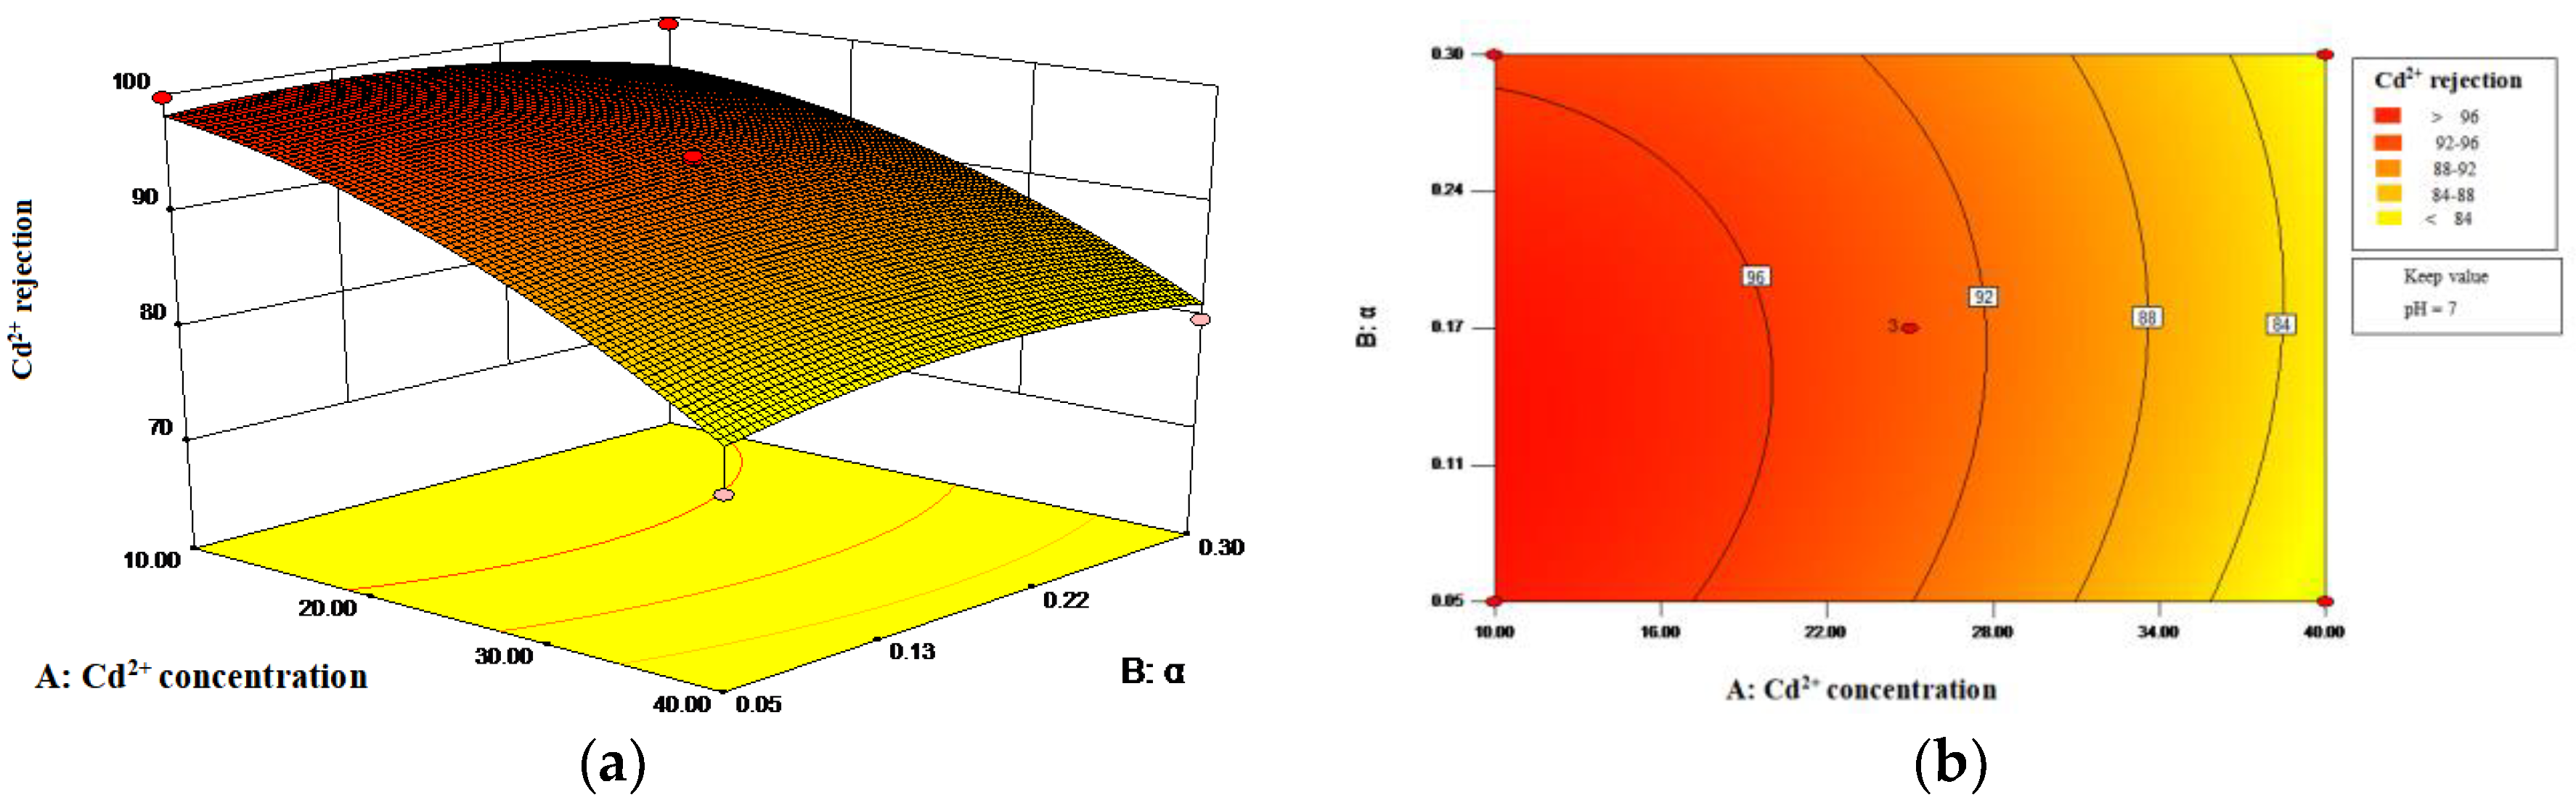
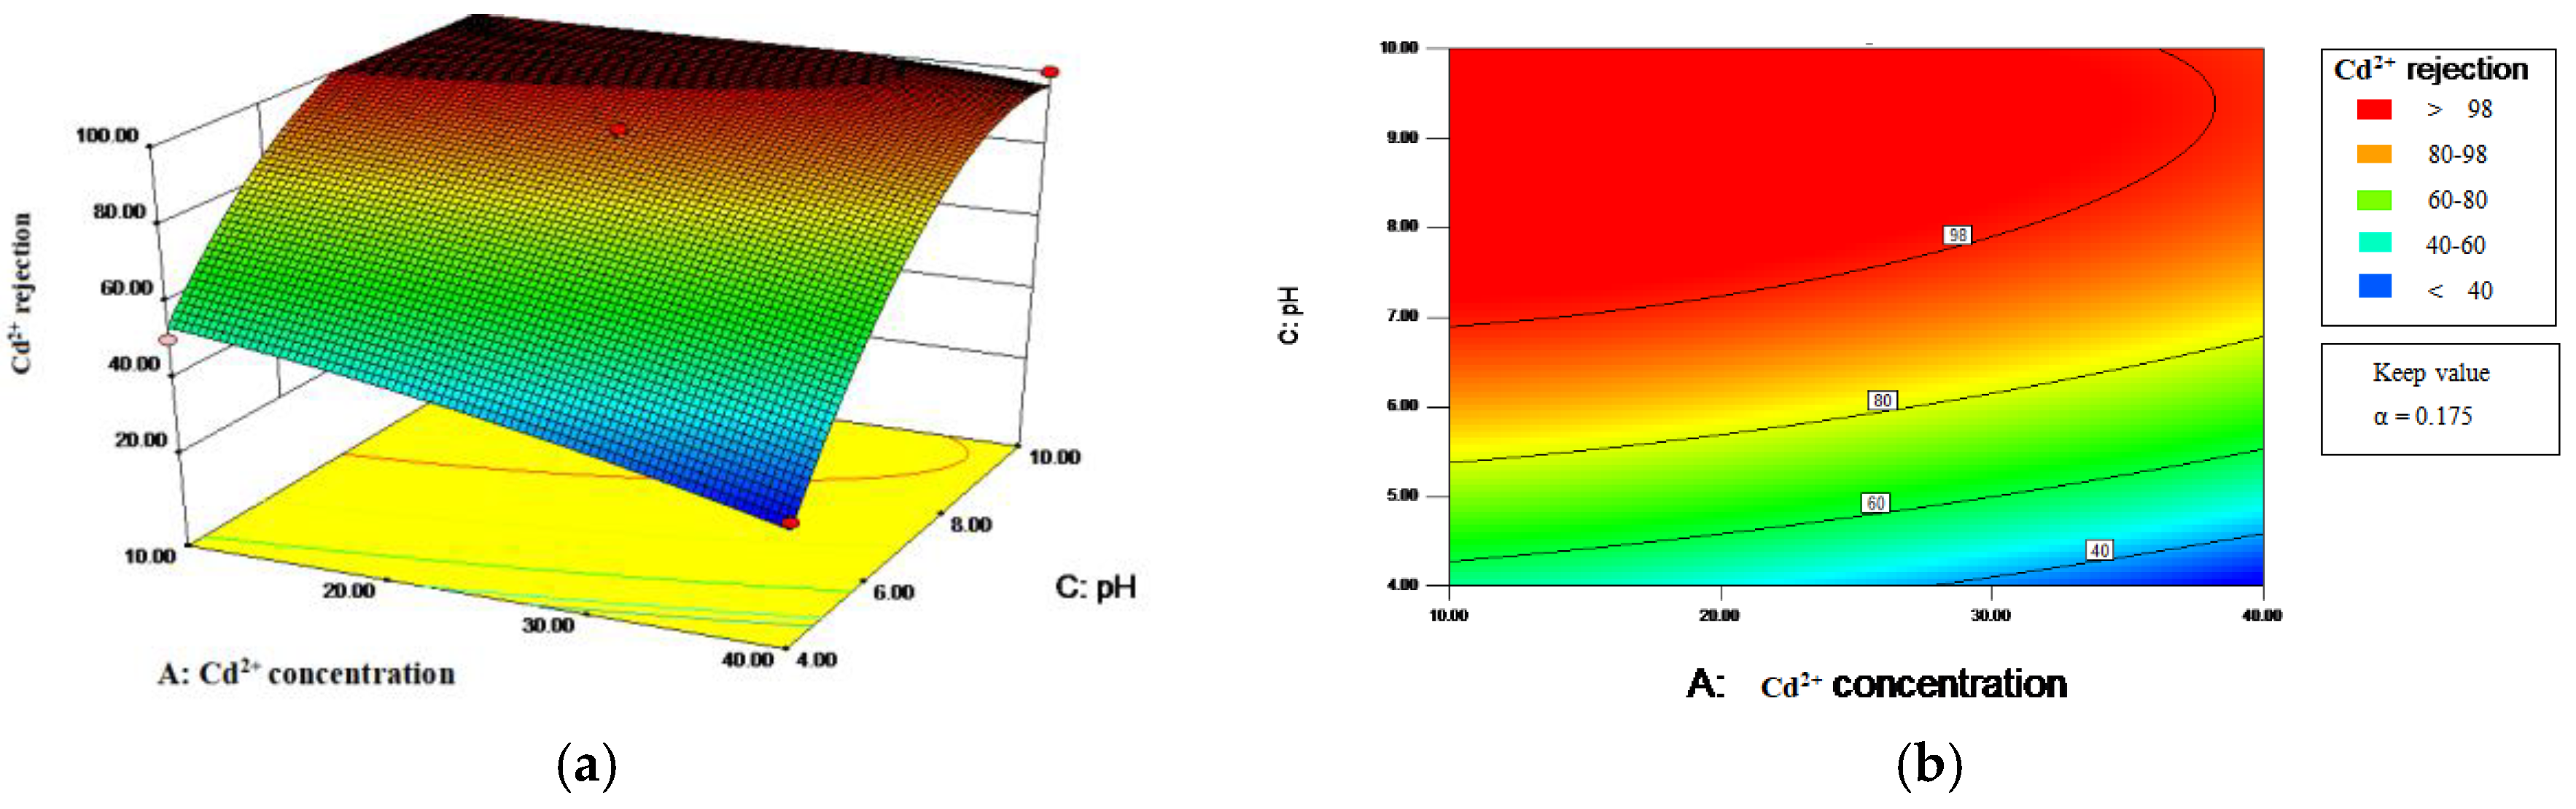
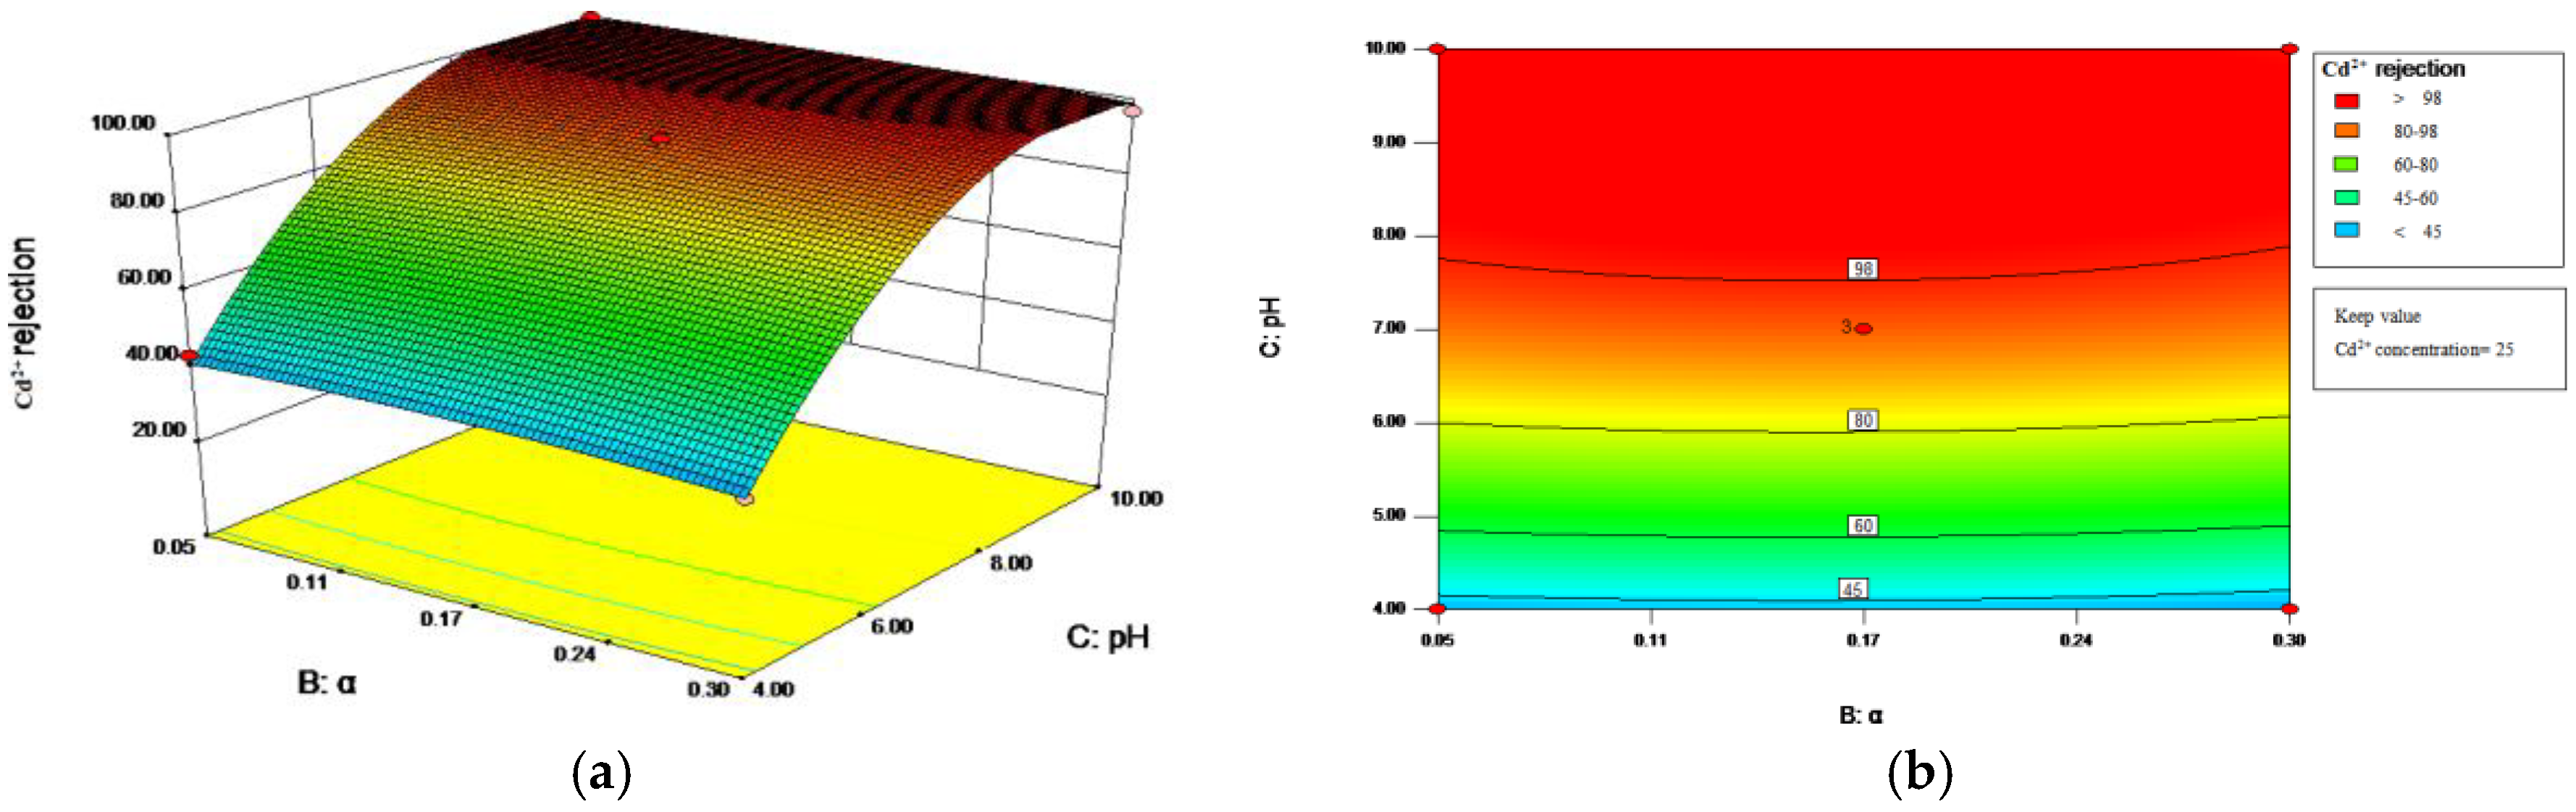
3.1. Analysis of the Cd2+ Rejection Coefficient

The experiments were conducted according to the Box-Behnken response surface design. The experimental and predicted values of the Cd2+ rejection coefficient (RCd) are shown in Table 4. Table 4 shows that the maximum experimental value of the Cd2+ rejection coefficient was 99.8%, which is close to the predicted value, indicating that the design of the Box-Behnken response surface is reasonable and scientific.
Minitab 16 was used to fit the experimental values of the Cd2+ rejection coefficient to obtain a complete quadratic regression model for the relationship among the Cd2+ rejection coefficient (RCd) and the initial Cd2+ concentration, the biosurfactant mixing ratio (α) and the pH, that is,
RCd = −63.730 − 0.962A + 23.920B + 40.062C − 0.013A2 − 124.533B2 − 2.422C2 + 0.520A × B + 0.139A × C + 0.467B × C,
The regression equation shows that the Cd2+ concentration had a negative effect on the Cd2+ rejection coefficient, while α and pH had positive effects on the Cd2+ rejection coefficient. These results indicate that the larger α and the pH are, the better the effect on the Cd2+ rejection coefficient is, and the greater the Cd2+ concentration is, the worse the effect on the Cd2+ rejection coefficient is.
Various statistical parameters are presented in Table 5 for analysis of the results related to the Cd2+ rejection coefficient. The F values in Table 5 show that the factors’ impacts on RCd are in the following order: α < Cd2+ concentration < pH. The P value is the probability value used to specify the statistically significant effects in the model. The P values of each item in Table 5 show that the effect of the pH on RCd is extremely significant, whereas the effects of the Cd2+ concentration and α on RCd are insignificant, and the effect of the interaction between the Cd2+ concentration and the pH on RCd (AC) is significant. The similar rule has been observed in previous experiments on mono-rhamnolipid micelles using MEUF [24].
Using the quadratic regression model, surface and isoline plots (Figure 2, Figure 3 and Figure 4) can be drawn to investigate the effects of the three factors (A, B and C) and their interactions (AB, AC and BC) on the Cd2+ rejection coefficient.
Figure 2 shows that the interaction of the Cd2+ concentration and α is insignificant when the pH is 7; α has a smaller effect on RCd than the Cd2+ concentration does; and RCd decreases as the Cd2+ concentration increases. Figure 3 shows that the interaction of the Cd2+ concentration and the pH (AC) is significant when α is held at 0.175, and the optimum point is a Cd2+ concentration of approximately 13.2 mg/L at a pH of 8.7, where the Cd2+ rejection coefficient exceeds 98%. Figure 4 shows that the interaction of α and the pH (BC) is insignificant when the Cd2+ concentration is held at 25 mg/L; the pH has a greater effect on the Cd2+ rejection coefficient than α, and the Cd2+ rejection coefficient increases with the pH.

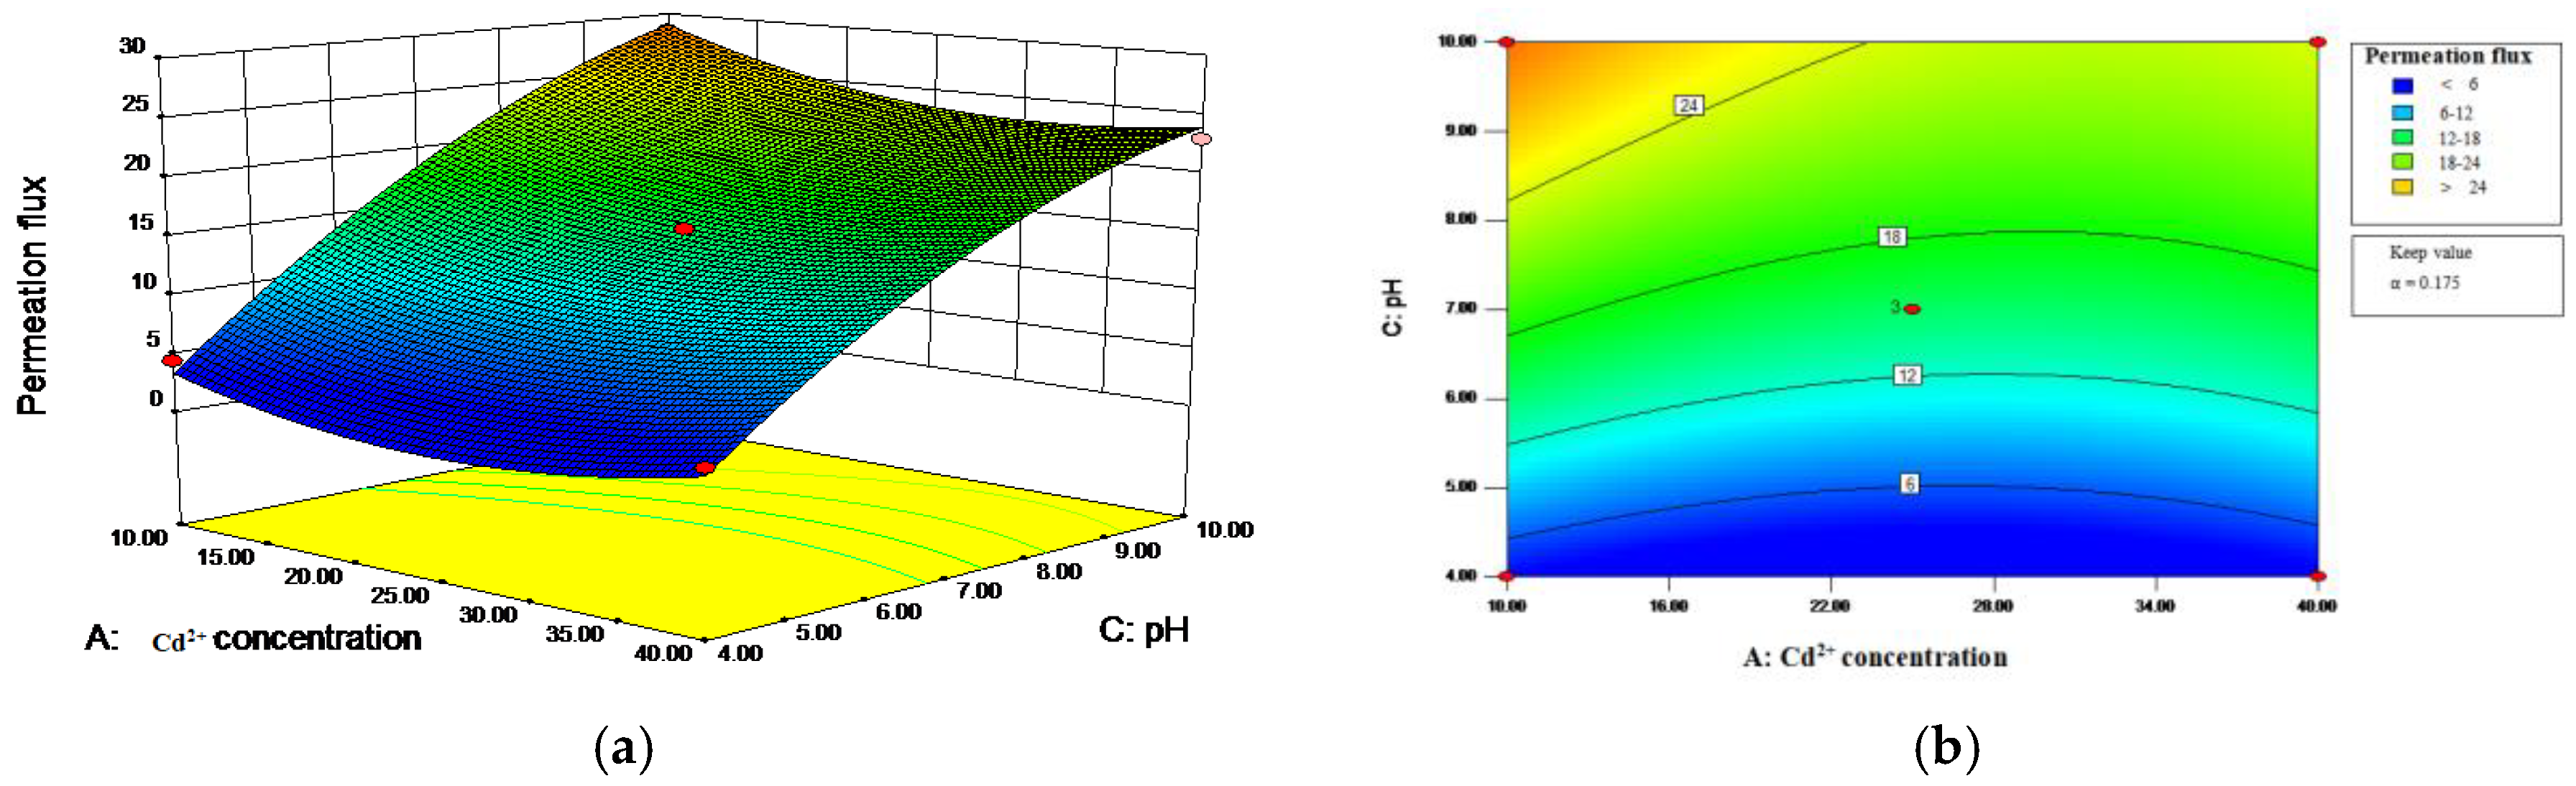
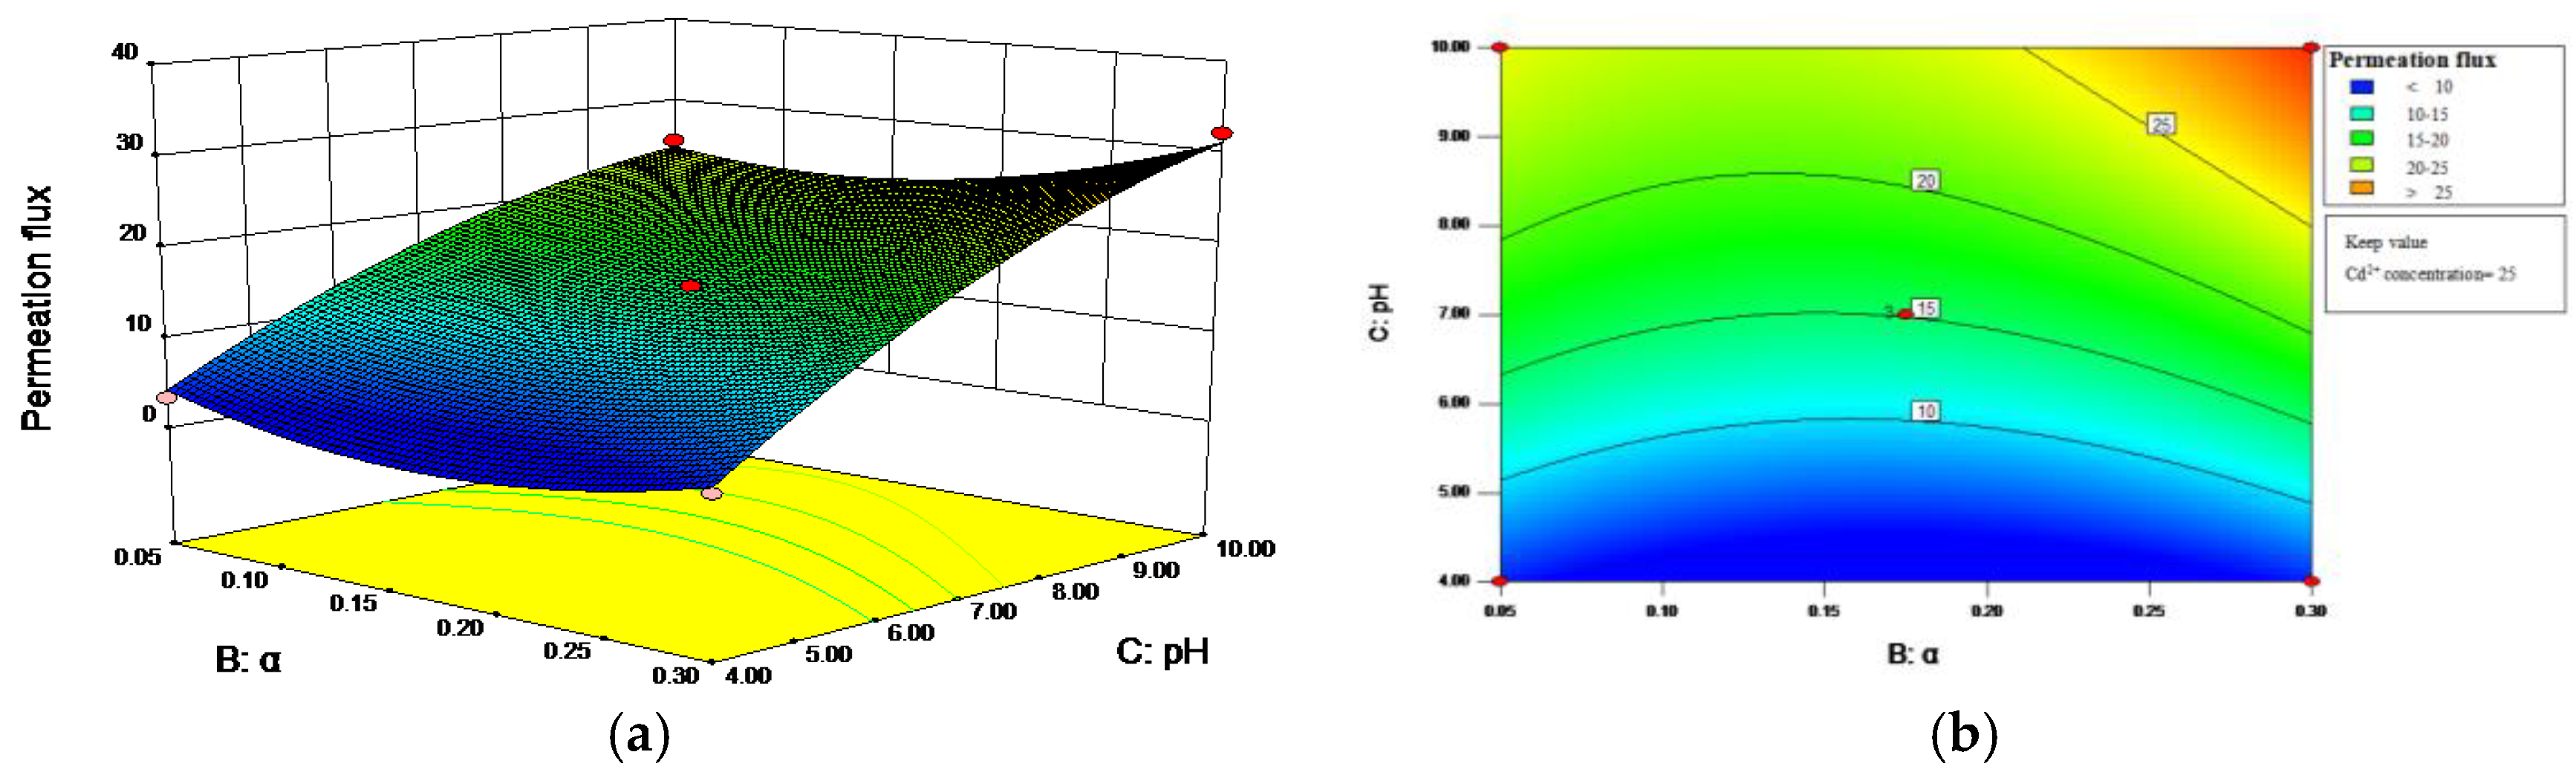
3.2. Analysis of Permeation Flux

The experiments were conducted according to the Box-Behnken design (the response surface design). The experimental and predicted values of the permeation flux (J) are shown in Table 6.
Minitab 16 was used to fit a quadratic regression model for the relationship among the permeation flux (J), the Cd2+ concentration, α and the pH to the experimental values of the permeation flux,
J = −17.532 − 0.342A − 79.793B + 8.618C + 0.012A2 + 261.600B2 − 0.346C2 − 1.120A × B − 0.026A × C + 4.333B × C,
The regression equation shows that the Cd2+ concentration and α had a negative effect on the permeation flux (J), while the pH had a positive effect on J. The results indicate that the higher the pH is, the higher the membrane flux is; the larger the Cd2+ concentration and α are, the smaller the membrane flux is.
According to the F values in Table 7, the factors’ impacts on the permeation flux are in the following order: Cd2+ concentration < α < pH. In addition, the P values in Table 8 show that the effects of α and the pH on J are extremely significant; the effect of the Cd2+ concentration on J is insignificant; that the effects of the quadratic terms (A2, B2 and C2) of the Cd2+ concentration α and the pH on J are extremely significant and that the effects of the interactions between the Cd2+ concentration and α (AB), and between α and the pH (BC), on J are very significant.
Using the quadratic regression model, the surface and isolines (Figure 5, Figure 6 and Figure 7) can be drawn to investigate the effects of the three factors and their interactions on the permeation flux.
Figure 5 shows that the interaction between the Cd2+ concentration and α (AB) is significant when the pH is kept at 7; when the Cd2+ concentration is 10–19.5 mg/L and α is greater than 0.24, the permeation flux is greater than 22.5 L/m2·h. Figure 6 shows that the interaction between the Cd2+ concentration and the pH (AC) is insignificant when α is kept at 0.175; the pH has a greater effect on the permeation flux than the Cd2+ concentration does, and the permeation flux increases with the pH. Figure 7 shows that the interaction between α and the pH (BC) is significant when the Cd2+ concentration is kept at 25 mg/L; α has a smaller effect on the permeation flux than the pH does, and J is greater than 20 L/m2·h when the pH is above 8.6.

3.3. Prediction and Validation of Optimum Filtration Conditions

The response optimizer in Minitab 16 was used to examine the responses of the Cd2+ rejection coefficient and the permeation flux simultaneously. The weight and degree of importance of each index was set to 1 and the optimization results are shown in Table 8.
Table 8 shows that when the Cd2+ concentration is 10.0 mg/L, α is 0.30 and the pH is 9.58, the Cd2+ rejection coefficient and the permeation flux are optimized simultaneously; the optimized composite desirability is 1.00. To further validate the reliability of the model’s predictions, the optimized operating conditions were used to conduct experiments. For convenience in actual operation, the Cd2+ concentration was set to 10.0 mg/L, α was set to 0.30, and the pH was set to 9.5 in the experiments. The measured Cd2+ rejection coefficient and the permeation flux were 98.74 % and 37.02 L/m2·h, respectively. The relative error was no greater than 1%, and the experimental values were close to the predicted values, which indicates that the optimization model used in the paper is very reliable.

4. Conclusions

This work uses a mixture of the environmentally friendly biosurfactants rhamnolipids and sophorolipids as a source of micelles and investigates their effect on the ultrafiltration of Cd. Furthermore, this work optimizes the ultrafiltration conditions by using the Box-Behnken response surface, and provides theoretical support for using MEUF to treat heavy metal-containing wastewater when biosurfactants are used for micelle formation. The main conclusions are as follows:
(1)
Interactions among the three factors (the initial Cd2+ concentration, the ratio of biosurfactants (α) and the pH) affect the enhanced ultrafiltration of Cd2+, and the significance of their effects on the rejection coefficient follows the order α < Cd2+ concentration < pH. The degree of impact on the permeation flux follows the order Cd2+ concentration < α < pH.
(2)
The optimum Cd2+ removal conditions obtained from the experiments are as follows: Cd2+ concentration: 10.0 mg/L; α: 0.30; and pH: 9.58. Under these conditions, the Cd2+ rejection coefficient reaches 99.14 %, and the permeation flux reaches 37.36 L/m2·h. The experimental results confirm that the experimental values agree well with the theoretically predicted values.

Author Contributions

T.C., H.F., and G.H. conceived and designed the experiments; T.C., H.Y., Z.Z., Y.W., and L.J. carried out the experiments; T.C., H.F., and M.X. analyzed the data; T.C. and H.F. wrote the main manuscript text and all authors reviewed the manuscript.

Funding

This work was financially supported by the Fujian Science and Technology Guiding Project (2018Y0079), the National Natural Science Foundation of China (51109181), the Natural Science Foundation Project of Fujian Province (2018J01527) and the Supporting Plan for Excellent Talents in Colleges and Universities in the New Century of Fujian Province.

Conflicts of Interest

The authors declare no conflict of interest.

References

  1. Tortora, F.; Innocenzi, V.; Prisciandaro, M.; Vegliò, F.; di Celso, G.M. Heavy Metal Removal from Liquid Wastes by Using Micellar-Enhanced Ultrafiltration. Water Air Soil Pollut. 2016, 227, 1–11. [Google Scholar] [CrossRef]
  2. Rzętała, M.A. Cadmium contamination of sediments in the water reservoirs in Silesian Upland (southern Poland). J. Soils Sediments 2016, 16, 2458–2470. [Google Scholar] [CrossRef]
  3. García-Alix, A.; Jimenez-Espejo, F.J.; Lozano, J.A.; Jiménez-Moreno, G.; Martinez-Ruiz, F. Anthropogenic impact and lead pollution throughout the Holocene in Southern Iberia. Sci. Total Environ. 2013, 449, 451–460. [Google Scholar] [CrossRef] [PubMed]
  4. Liao, J.; Chen, J.; Ru, X.; Chen, J.; Wu, H.; Wei, C. Heavy metals in river surface sediments affected with multiple pollution sources, South China: Distribution, enrichment and source apportionment. J. Geochem. Explor. 2016, 176, 9–19. [Google Scholar] [CrossRef]
  5. Sánchez-Chardi, A. Biomonitoring potential of five sympatric tillandsia, species for evaluating urban metal pollution (cd, hg and pb). Atmos. Environ. 2016, 131, 352–359. [Google Scholar] [CrossRef]
  6. Hua, M.; Zhang, S.; Pan, B.; Zhang, W.; Lv, L.; Zhang, Q. Heavy metal removal from water/wastewater by nanosized metal oxides: A review. J. Hazard. Mater. 2012, 211–212, 317–331. [Google Scholar] [CrossRef] [PubMed]
  7. Savic, I.M.; Stojiljkovic, S.T.; Gajic, D.G. Modeling and optimization of energy-efficient procedures for removing lead(II) and zinc(II) ions from aqueous solutions using the central composite design. Energy 2014, 77, 66–72. [Google Scholar] [CrossRef]
  8. Qiu, W.; Zheng, Y. Removal of lead, copper, nickel, cobalt, and zinc from water by a cancrinite-type zeolite synthesized from fly ash. Chem. Eng. J. 2009, 145, 483–488. [Google Scholar] [CrossRef]
  9. Tao, H.C.; Zhang, H.R.; Li, J.B.; Ding, W.Y. Biomass based activated carbon obtained from sludge and sugarcane bagasse for removing lead ion from wastewater. Bioresour. Technol. 2015, 192, 611–617. [Google Scholar] [CrossRef] [PubMed]
  10. Xu, X.; Cao, X.; Zhao, L. Comparison of rice husk- and dairy manure-derived biochars for simultaneously removing heavy metals from aqueous solutions: Role of mineral components in biochars. Chemosphere 2013, 92, 955–961. [Google Scholar] [CrossRef] [PubMed]
  11. Ronda, A.; Calero, M.; Blázquez, G.; Pérez, A.; Martín-Lara, M.A. Optimization of the use of a biosorbent to remove heavy metals: Regeneration and reuse of exhausted biosorbent. J. Taiwan Inst. Chem. Eng. 2015, 51, 109–118. [Google Scholar] [CrossRef]
  12. Wang, J.; Chen, C. The current status of heavy metal pollution and treatment technology development in china. Environ. Technol. Rev. 2015, 4, 39–53. [Google Scholar] [CrossRef]
  13. Burakov, A.E.; Galunin, E.V.; Burakova, I.V.; Kucherova, I.E. Adsorption of heavy metals on conventional and nanostructured materials for wastewater treatment purposes: A review. Ecotoxicol. Environ. Saf. 2017, 148, 702. [Google Scholar] [CrossRef] [PubMed]
  14. Zhong, Y.J.; You, S.J.; Wang, X.H.; Zhou, X.; Gan, Y.; Ren, N.Q. Synthesis of carbonaceous nanowire membrane for removing heavy metal ions and high water flux. Chem. Eng. J. 2013, 226, 217–226. [Google Scholar] [CrossRef]
  15. Wang, R.; Guan, S.; Sato, A.; Wang, X.; Wang, Z.; Yang, R. Nanofibrous microfiltration membranes capable of removing bacteria, viruses and heavy metal ions. J. Membr. Sci. 2013, 446, 376–382. [Google Scholar] [CrossRef]
  16. Lu, J.; Li, Y.; Yin, M.; Ma, X.; Lin, S. Removing heavy metal ions with continuous aluminum electrocoagulation: A study on back mixing and utilization rate of electro-generated al ions. Chem. Eng. J. 2015, 267, 86–92. [Google Scholar] [CrossRef]
  17. Al-Shannag, M.; Al-Qodah, Z.; Bani-Melhem, K.; Qtaishat, M.R.; Alkasrawi, M. Heavy metal ions removal from metal plating wastewater using electrocoagulation: Kinetic study and process performance. Chem. Eng. J. 2015, 260, 749–756. [Google Scholar] [CrossRef]
  18. Mitomo, S.K.; Nakahara, M.; Saeki, R.; Murakami, I. Recovery of heavy metals separated from high concentration wastewater by new sulfide precipitation system. J. Surf. Finish. Soc. Jpn. 2014, 65, 528–530. [Google Scholar] [CrossRef]
  19. Salehi, R.; Mousavi, S.M.; Taherian, M. Assessment of micellar-enhanced ultrafiltration process performance for removal of pharmaceutical contaminant from wastewater using response surface methodology. Int. J. Environ. Sci. Technol. 2018. [Google Scholar] [CrossRef]
  20. Fu, H.Y.; Zhang, Z.B.; Chai, T.; Huang, G.H.; Yu, S.J.; Liu, Z. Study of the removal of aniline from wastewater via meuf using mixed surfactants. Water 2017, 9, 365. [Google Scholar] [CrossRef]
  21. Tanhaei, B.; Chenar, M.P.; Saghatoleslami, N.; Hesampour, M.; Kallioinen, M.; Sillanpää, M. Removal of nickel ions from aqueous solution by micellar-enhanced ultrafiltration, using mixed anionic-non-ionic surfactants. Sep. Purif. Technol. 2014, 138, 169–176. [Google Scholar] [CrossRef]
  22. Chavan, M. Mathematical modelling for removal of mixture of heavy metal ions from waste-water using micellar enhanced ultrafiltration (meuf) process. Sep. Sci. Technol. 2015, 50, 365–372. [Google Scholar]
  23. Schwarze, M.; Groß, M.; Moritz, M.; Buchner, G.; Kapitzki, L.; Chiappisi, L.; Gradzielski, M. Micellar enhanced ultrafiltration (meuf) of metal cations with oleylethoxycarboxylate. J. Membr. Sci. 2015, 478, 140–147. [Google Scholar] [CrossRef]
  24. Liu, Z.; Yu, M.; Zeng, G.; Li, M.; Zhang, J.; Zhong, H.; Liu, Y.; Shao, B.; Li, Z.; Wang, Z.; et al. Investigation on the reaction of phenolic pollutions to mono-rhamnolipid micelles using MEUF. Environ. Sci. Pollut. Res. 2017, 24, 1230–1240. [Google Scholar] [CrossRef] [PubMed]
  25. Pham, T.D.; Nguyen, N.K. Small Box–Behnken designs with orthogonal blocks. Stat. Probab. Lett. 2014, 85, 84–90. [Google Scholar] [CrossRef]
Figure 1. Diagram of the experimental setup.
Water 11 00442 g001
Figure 2. Response surface (a) and isolines (b) for the Cd2+ rejection rate, the Cd2+ concentration and α.
Water 11 00442 g002
Figure 3. Response surface (a) and isolines (b) for the Cd2+ rejection rate, the Cd2+ concentration and the pH.
Water 11 00442 g003
Figure 4. Response surface (a) and isolines (b) for the Cd2+ rejection rate, α and the pH.
Water 11 00442 g004
Figure 5. Response surface (a) and isolines (b) for the permeation flux, the Cd2+ concentration and α.
Water 11 00442 g005
Figure 6. Response surface (a) and isolines (b) for the permeation flux, the Cd2+ concentration and the pH.
Water 11 00442 g006
Figure 7. Response surface (a) and isolines (b) for the permeation flux, α and the pH.
Water 11 00442 g007
Table 1. Technical parameters of the equipment.
Size of Main Engine (cm)Membrane Area (cm2)Power (Kw)Minimum Circulating Volume (mL)Working Pressure (MPa)Filtration Capacity (L/h)Applicable Temperature (°C)
23 × 27 × 301500.0680≤0.50.3–35–50
Table 2. Main performance parameters of the ultrafiltration membrane.
Membrane TypeMembrane MaterialMolecular Weight Cutoff (Dalton)Permeation Flux (L/m2·h)Membrane Area (cm2)pH
SMU-420PVDF10,00024–531502–12
Table 3. Independent variables, levels and symbols for the Box-Behnken design.
VariableSymbolVariable Levels
Low (−1)Middle (0)High (+1)
Cd2+ Concentration (mg/L)A102540
αB0.050.1750.3
pHC4710
Table 4. Experimental and predicted values of the Cd2+ rejection coefficient.
StdRunFactorExperimental Cd2+ Rejection Coefficient (%)Predicted Cd2+ Rejection Coefficient (%)
ABC
115−1−1099.798.2
221−1076.280.1
35−11099.395.4
4411079.781.2
53−10−150.554.1
6710−127.225.4
712−10198.099.9
8810199.896.3
990−1−143.341.3
101101−139.740.1
1160−1199.699.3
12101196.798.8
131000094.193.6
141400094.493.6
151300092.293.6
Table 5. Tests of response function RCd.
SourcedfSSMSF-ValuePSignificant
Model99253.671028.1965.52<0.001**
Linear37332.54768.6348.98<0.001**
Square31759.71586.5737.380.001**
Interaction3161.4353.813.430.109
A1521.6441.762.660.164
B11.442.080.130.731
C16809.452004.08127.70.000**
A215.3830.961.970.219
B210.2713.980.890.389
C211754.061754.06111.77<0.001**
AB13.803.800.240.643
AC1157.50157.5010.040.025*
BC10.120.120.010.933
Residual578.4715.69
Lack of fit375.6225.2117.710.054
Pure error22.851.42
Cor total149332.14
R2 = 0.992
Note: P < 0.05 indicates that this item is significant and is denoted by “*”, P < 0.01 indicates that the item is extremely significant and is denoted by “**”. A is the Cd2+ concentration; B is the ratio of the sophorolipid concentration to the total surfactant concentration (α); C is the pH; AC represents the interaction of the Cd2+ concentration (A) and the pH (B), and AB and BC are similarly defined; A2 is the quadratic term of the Cd2+ concentration (A), and B2 and C2 are similarly defined.
Table 6. Experimental and predicted values of the permeation flux.
StdRunFactorExperimental Values of Permeation Flux (L/m2·h)Predicted Values of Permeation Flux (L/m2·h)
ABC
115−1−1019.419.5
221−1021.321.0
35−11026.927.2
4411020.420.3
53−10−14.43.3
6710−13.52.9
712−10128.429.0
8810122.924.0
990−1−13.34.3
101101−13.84.5
1160−1125.124.4
12101132.131.2
131000015.515.1
141400014.915.1
151300014.915.1
Table 7. Tests for the response function, J.
SourcedfSSMSF-ValuePSignificant
Model91299.65144.405113.57<0.001**
Linear31132.7650.79839.950.001**
Square3133.4044.46534.970.001**
Interaction333.4911.1648.780.019*
A115.125.2724.150.097
B124.8523.11518.180.008**
C11092.7892.74172.94<0.001**
A2128.0929.20722.970.005**
B2169.5461.69048.520.001**
C2135.7735.77028.130.003**
AB117.6417.64013.870.014*
AC15.295.2904.160.097
BC110.5610.5628.310.034*
Residual56.361.271
Lack of fit36.122.03916.990.056
Pure error20.240.120
Cor total141306.00
R2 = 0.995
Note: P < 0.05 indicates that the item is significant and is denoted by “*”, P < 0.01 indicates that the item is extremely significant and is denoted by “**”. A is the Cd2+ concentration; B is the ratio of the sophorolipid concentration to the total surfactant concentration (α); C is the pH; AC represents the interaction of the Cd2+ concentration (A) and the pH (C), and AB and BC are similarly defined; A2 is the quadratic term for the Cd2+ concentration (A), and B2 and C2 are similarly defined.
Table 8. Response to optimization results.
Optimization ConditionResponse ProjectResponse ResultDesirabilityOptimized Composite Desirability
Cd2+ concentration = 10.0 mg/LCd2+ rejection rate99.14%1.001.00
Α = 0.30Permeation flux37.36 L/m2·h1.00
pH = 9.58

