Green Smart Technology for Water (GST4Water): Water Loss Identification at User Level by Using Smart Metering Systems


Department of Engineering, University of Ferrara, Ferrara 44122, Italy
*
Author to whom correspondence should be addressed.
Water 2019, 11(3), 405; https://doi.org/10.3390/w11030405
Submission received: 28 December 2018
/
Revised: 18 February 2019
/
Accepted: 20 February 2019
/
Published: 26 February 2019
(This article belongs to the Special Issue Insights on the Water–Energy–Food Nexus)
Abstract
:A real-time household water consumption monitoring and processing system aimed at leakage identification at user level is presented here. The system, developed within the GST4Water project, allows consumption data sent by a generic smart meter installed in a user’s house to be received and transferred to a cloud platform. Here, the consumption data are stored and processed through an empirical algorithm able to automatically identify leakage at the individual user level by looking for non-consumption in certain periods of the day. With reference to a real-life case study, the results obtained show that the algorithm enables leakages on users’ properties to be identified with an accuracy of more than 90%. Therefore, the implementation of this algorithm within a highly innovative smart metering system can represent an efficient tool for reducing water losses at user level.
1. Introduction
In recent years, the issue of sustainable water resource management has taken on key importance worldwide because of several concomitant factors, including climate change and population growth, which have significantly reduced water availability and, at the same time, increased water demand [1]. In addition, the population’s lack of sensitivity concerning the need to save water, along with the aging of infrastructure, is a source of losses that cause environmental, economic, financial, and socio-ethical impacts [2,3]. Real-time water consumption monitoring systems and systems for the recovery and reuse of rain and grey water inside buildings are based on technologies that aim to limit the use of drinking water, while ensuring greater environmental sustainability [4,5]. The “Green-Smart Technology project for the sustainable use of water resources in buildings and urban areas (GST4Water)” fits into this context [6]. The project is funded by the European Community through the financial sponsorship of the Emilia-Romagna Region (POR-FESR 2014–2020). Its general goal is to allow for the conscious use of water resources at the user level (i.e., at housing unit level) and the reuse of rainwater and grey water inside buildings by means of specifically designed hardware and software solutions.
In particular, a real-time water consumption monitoring and processing system was developed, aimed at recording consumption data at the user’s connection to the water distribution network. It transfers the data collected to a cloud platform, where consumption data are processed in order to produce valuable information for the end users, both Water Utility (WU) and its customers [7]. In fact, the entire system allows consumers to know their consumption in near real time and to receive an alarm message in the event of water leaks downstream of their own water meters. As a result, users can become more aware of their water consumption and avoid waste of water. At the same time, the entire infrastructure enables the WU to maintain real time monitoring of the water consumption of all users. As a result, the WU achieves an improved and more sustainable management of the water distribution network.
Furthermore, the GST4Water project focuses on the creation of a suite of software tools that aim to promote a reduction in the consumption of water from drinking water sources through the design of tanks for recovering rainwater and grey water and reusing them for non-drinking purposes [8]. In addition, this suite also aims to optimize the management of rainwater through green technologies that can increase urban resilience against extreme rain events. Finally, another suite of software tools was developed, in order to provide an assessment of the economic and environmental sustainability of the proposed hardware and software solutions through the valuation of indicators based on Urban Metabolism and Life Cycle Assessment techniques [9].
In particular, this paper presents some of the results achieved within the GST4Water project concerning water consumption monitoring and leakage identification at the individual user level. Indeed, nowadays, the issue of the water loss reduction is of great interest, as reducing loss contributes to the sustainable management of water resources. In recent years, many studies and methods aimed at characterizing and quantifying water losses have been presented in the scientific literature. However, the majority of these methods are focused on the identification of leakages across a water distribution network or district metered area (DMA), such as the Minimum Night Flow (MNF) analysis or the Water Balance method [10,11,12]. By contrast, studies concerning the identification of leakages at user level are still limited, and within this framework, it is worth mentioning the study by Britton et al. (2008) [13] where leakages inside housing units are identified through an alarm which is picked up during the meter reading when the meters record an uninterrupted flow for at least two days, and through a review of the consumption trend when data collected by the meters is downloaded [14]. In practice, even though the volume of water that is lost downstream of meters is generally negligible, if evaluated at the individual user level, considering all the users of the network (or DMA), it can actually represent a significant amount of water in the long-term [3] and significant economic damage for the single user. Indeed, media sometimes report of users who receive bills of several hundreds or thousands of euros, when water leakages inside their houses are not promptly detected [15,16]. In this context, smart water consumption metering systems provide a good opportunity to identify and limit water losses, not only within the water distribution network as a whole, but also at the individual user level [17]. In fact, these metering systems permit the real-time collection, storage, and processing of high temporal resolution data and consequently make it possible to optimize the management of water supply networks [17,18], promptly detect leakages, minimize their duration, and schedule maintenance operations in an optimal fashion [19]. In addition, these systems also allow for a continuous transmission of consumption information to users, including feedback on their water consumption patterns and suggestions for personalized water-saving practices [19,20,21]. Therefore, users are motivated to improve their water consumption behaviour and avoid unnecessary waste caused by domestic water losses. Some research highlights that this informational approach can reduce consumption with marginal effects in the short term, but very substantial ones in the long term [4,21,22]. On the other hand, other research proves that informational approaches may not be effective in the long term and water usage can return to previous levels [23]. Currently, leakages within households are generally identified by users themselves only when they are significantly perceptible and/or visible, as traditional mechanical meters are unable to provide a warning in the event of leaks. However, growing experimentation with real-time monitoring systems in the water sector is arousing the interest of WU managers in the new smart meters. The most advanced smart meters are able to identify leakages through a processing unit that implements appropriate algorithms [13,24] and records and sends an alarm notification. Generally, these algorithms require smart meters to be set with specific variables, such as the maximum intensity of the hourly flow rate and the minimum number of hours during which a flow rate of this entity may occur. Therefore, each smart meter should be set with appropriate parameters that can be determined only after an accurate analysis of water consumption patterns and all factors that affect water demand, which are not necessarily known to WU managers. In addition to smart meters, the market offers some software programs capable of identifying water losses within households. For example, Trace Wizard® software has been designed to disaggregate high temporal resolution information of user water consumption and, additionally, it also classifies leakage events as drinking water end uses [25]. However, as indicated in the technical literature, this software is costly in terms of both time and resources, as it requires a preliminary calibration step for the development of specific models that take into account all factors, influencing water consumption [4]. In fact, audits must be performed and diaries kept in order to collect information on these factors, which also requires the involvement of each user. Furthermore, the quality of the final output can be strongly influenced by the subjective interpretation of the collected information. With the aim of overcoming these drawbacks and improving knowledge about leakage identification at user level, a system for real-time water consumption monitoring and leakage identification has been devised. The results obtained by applying it to a real-life case are presented in this paper. First of all, Section 2 provides an illustration of the proposed real-time water consumption monitoring and processing system. Then, the algorithm for the automatic identification of water leakages occurring on individual user premises, downstream of the meters, is shown and explained. This algorithm is implemented within the processing system and the only input it requires is the time series of user water consumption, as provided by the monitoring system. In particular, the underlying idea of the algorithm is somewhat similar to that of the MNF method, but applied to a single user as it allows the identification of leakages by looking for the continuous non-zero hourly water consumptions during an established time window. However, not only minimum night hours but also a longer time window (24 h) is taken into consideration. Lastly, the accuracy of the results that can be obtained with the implementation of this algorithm considering different time windows is evaluated with reference to the real case of the town of Gorino Ferrarese (FE) and compared with the one obtained by implementing that proposed by Britton et al. (2008) [13]. The paper concludes with some final considerations.
2. The Monitoring and Processing System
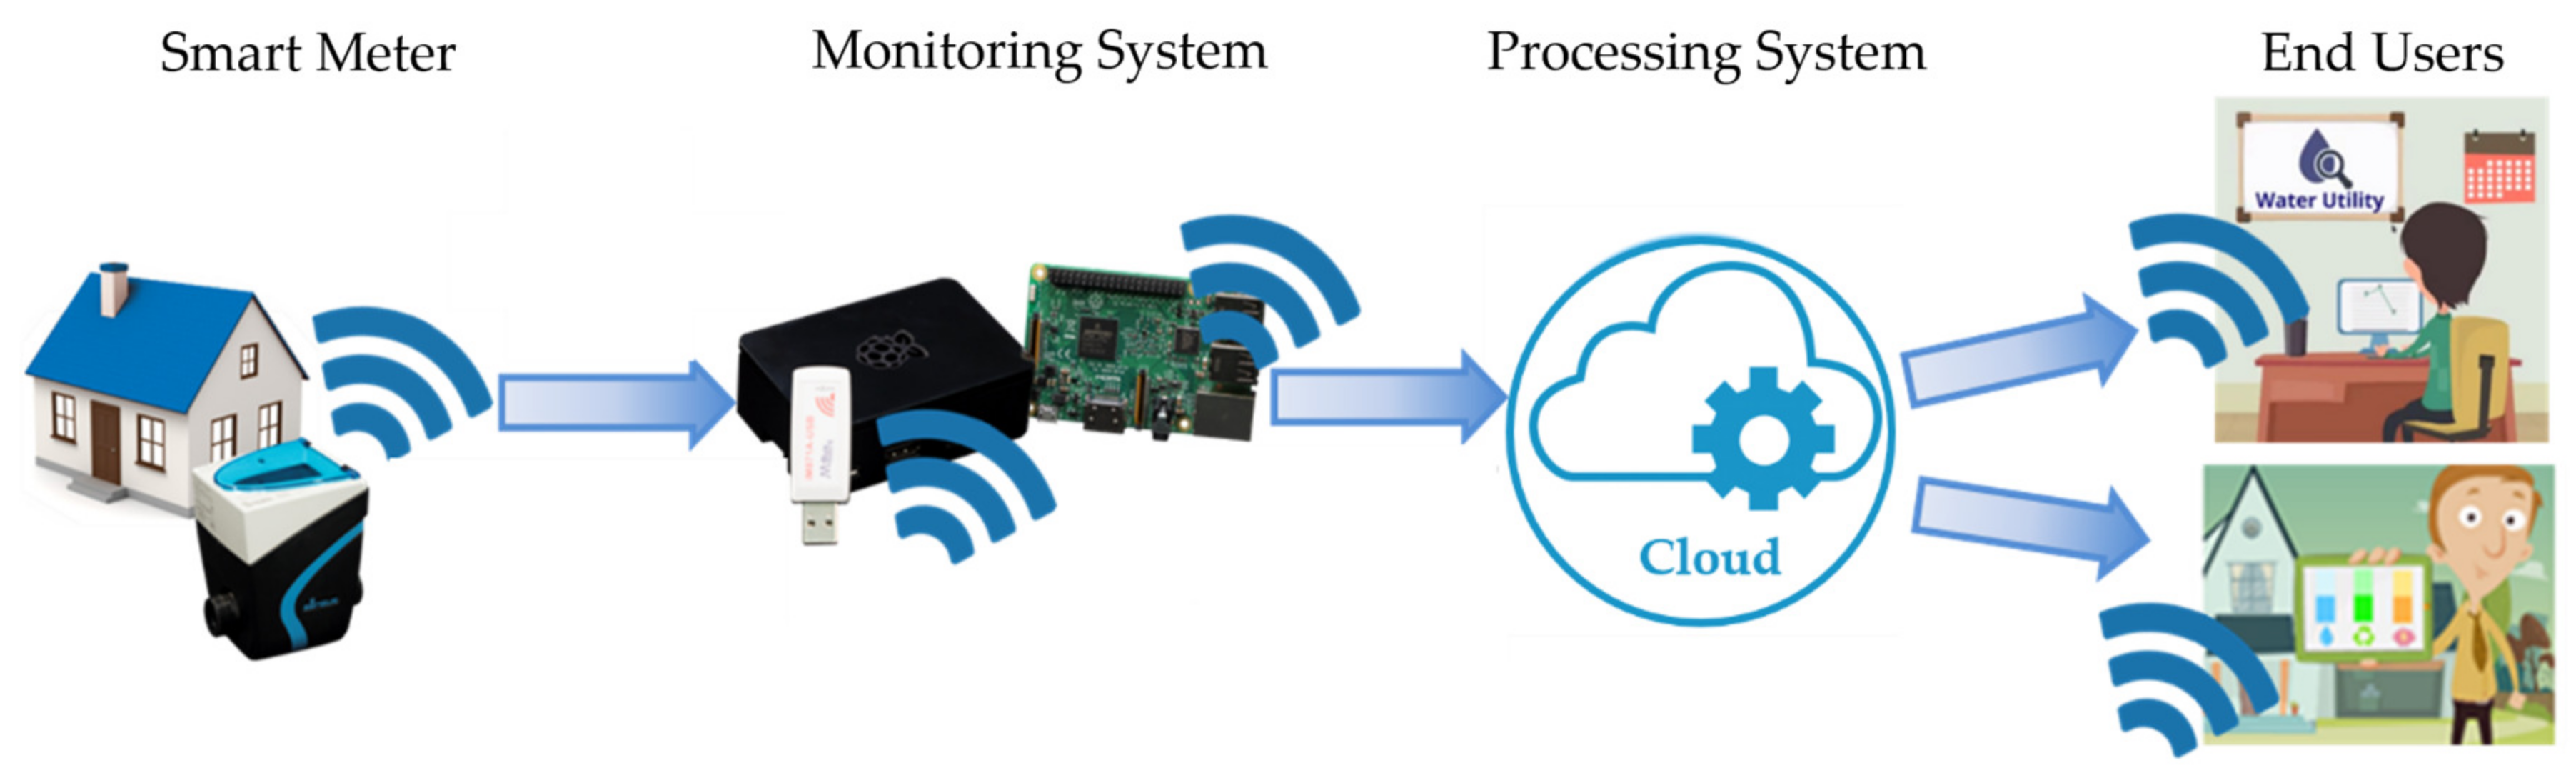
The term “smart metering” is now widely used in technical literature and in utility sectors to define systems that enable the remote reading of electricity, gas, and water meters, and therefore real-time monitoring of consumption. Although, at present, these systems are not widely used by the WU, they are becoming increasingly popular given the benefits previously mentioned that they can provide (such as easier billing of the water consumption and the detection of water losses at district and individual user level). In general, these systems involve the use of smart meters, able to make consumption data available remotely thanks to the presence of an integrated communication unit inside them. In the water utility context, data sent by these smart meters are typically collected relying on expensive architectures made up of instruments supplied by the manufacturers of the water meters. However, innovative Open Source technologies can help to reduce the costs of smart metering devices and of the system as a whole. These technologies have been exploited to develop an Automatic Meter Reading (AMR) system in the framework of the GST4Water project. Figure 1 shows the entire architecture, which is divided into four main components: The smart meter, the monitoring system, the processing system, and the end users. The smart meter transmits water consumption information to the monitoring system, exploiting a radio protocol specifically developed for meter readings. The monitoring system receives consumption data sent by the smart meters and sends them to a cloud platform. This platform processes the consumption data received, in order to return useful near real-time information to the end users: Both consumers and the water utility.
The following is a brief description of each of the two components that represent the main core of the system, that is, the monitoring and the processing system, and of the algorithm that is implemented within the processing system and enables leakages downstream of the users’ smart meters to be identified.
2.1. The Monitoring System
The monitoring system involves the installation, for each user, of a small data collector able to collect consumption data sent by meter devices through the Open Meter Standard (OMS) Wireless M-Bus protocol. This radio protocol, implemented in most smart meters, is designed specifically for metering and can operate at the 169 and 868 MHz ISM (Industrial, Scientific, and Medical) frequencies. Being an open communication protocol, it allows for the reception of consumption data from any meter device implementing it, regardless of the manufacturer.
Hardware components easily available in the market were used for the creation of the data collector, namely, single-board computers (SBCs). In general, SBCs are compact devices with reduced energy consumption, but have a processing capacity comparable to that of a personal computer and are specifically designed to facilitate the addition of further radio modules. Therefore, the SBCs used were combined with wireless M-Bus radio modules designed to receive data from smart meters and Wi-Fi/3G/4G modules for transmitting the data to the cloud platform.
Furthermore, Open Source technologies were used for the creation of the software component of the data collector. In general, these technologies have many advantages, such as a reduction in the costs of the data collector or of the entire system, and also greater reliability guaranteed by the support that can be given by a large community of developers, capable of quickly updating and improving the software. In particular, the software component of the data collector consists of a Linux operating system to which software for the process and connectivity management, such as Supervisor and sakis3g [26,27,28], were added. These technologies are highly adaptable, since the source codes are publicly available and free, and therefore each program can be modified according to need.
2.2. The Processing System
The processing system for water consumption data is designed to be installed both on a cloud computing platform or on a private server owned by the WU. Within the GST4Water project, a cloud computing infrastructure was adopted. This infrastructure enables data to be stored, managed, and processed, thanks to hardware and software resources that can be physically distributed throughout the world and remotely used through the Internet. More specifically, the services provided by Amazon Web Service (AWS) and the Rilheva system, developed by Xeo4 (a project partner), were adopted for the creation of the processing system. The latter is able to receive water consumption data transmitted by the monitoring system and to validate and archive it in a database within the cloud platform. Finally, it processes consumption data through appropriate algorithms that extract useful information for users and the water utility. With reference to users, the cloud platform calculates the water volume consumed by the individual user in the last 24 h and the time series of flow rate at a given time step (e.g., one hour). All the information is updated every time the smart meters send new measured data. In addition, the leakage level inside the user’s residence is determined from the analysis of the time series of flow rates as detailed below and, in the event of a probable water leak, the cloud platform generates an alarm signal to notify the user of its presence. With reference to the water utility, the cloud platform calculates a water balance by comparing the time series of the flow rates of water entering the DMA with the sum of the time series of the consumptions of all the users located in the district. The information concerning the leakages at user and district level are sent, together with the consumption data, to the Rilheva system, which is the graphic interface for the return of data to users and to the water utility. Consequently, users and the water utility can view the information on their devices (PCs, tablets, and smartphones) by simply connecting to the Internet. In addition, the water utility can use these data for billing purposes.
A number of data collectors were placed in around 10 houses, in order to evaluate the correct functioning of the implemented real-time monitoring and processing system and consequently validate the correct flow of information. The references for accessing the Rilheva platform were provided to each of these users (Figure 2).
2.3. Algorithm for The Automatic Identification of Water Losses Inside User Households
An empirical algorithm was developed in order to identify leakages inside households. The implementation of this algorithm within the smart metering infrastructures is aimed at minimizing unnecessary waste due to water leakage. Specifically, the proposed algorithm generates, on a daily basis, an alarm signal for the notification of a possible water leakage, as determined on the basis of some evaluation criteria. These criteria have been defined taking into consideration the know-how gained (or derived) during the manual and visual analysis of the hourly water consumption pattern (explained in detail in the case study section). Indeed, as shown in Figure 3, the criteria are based on the fact that the pattern of residential water consumption is usually characterized by periods of the day when consumption is quite high (typically in the daytime), alternating with periods during which consumption decreases at user level, falling to zero (typically during the night).
Quite the opposite occurs in the presence of a water leakage within the household, which leads to a continuous flow of water entering the house itself, so that consumption never falls to zero at any time of the day or night. The same cannot be clearly stated for non-residential users. In fact, some non-residential users, e.g., a particular kind of factory, could be characterized by continuous consumption throughout the day, due to a particular activity/production cycle and not to a leakage. Thus, the algorithm is set up to assess the presence/absence of leakages inside residential houses by looking for non-consumption in some periods of the day. The basic idea of the algorithm is in line with that of the MNF, but applied to a single user rather than to a district. However, not only minimum night hours but also other periods are considered. In fact, two applicative variants of the algorithm were considered. The first one (indicated below as A2-5) is used to monitor the hourly flow rate during the night-time hours between 02:00 and 05:00 (as for a traditional MNF method), i.e., the period typically used to identify leakages. It is, in fact, the period during which the consumption of residential users typically falls to 0 or, in a dual way, the period during which a continuous flow entering the housing unit could actually be a water leakage. The second one (indicated below as A0-24) evaluates the hourly flow rate during the whole day. Indeed, the algorithm was applied taking into account two different time windows, in order to compare and evaluate the pro and cons of considering a short (2−5) or a long (0−24) period. In any case, if the hourly flow rate is never equal to zero during the hours of minimum consumption (A2-5), or during the whole day (A0-24), the algorithm classifies the consumption pattern as indicative of a probable water leakage. On the other hand, if the hourly flow rate is equal to 0 at least once during the hours of minimum consumption, or at any time during the day, the algorithm classifies the consumption pattern as a correct operation of the plumbing systems and the hygienic and sanitary appliances. This approach is also compared, in the numerical application, with the results produced by the approach proposed by [13] where a time window of 48 h is considered.
The approach implemented for the automatic identification of internal water leaks offers numerous advantages compared to the above-mentioned Trace Wizard® software. In fact, the algorithm does not require any initial training step or analyst evaluation. Consequently, the proposed algorithm is not affected by human arbitrariness and it does not require any variables to be set. On the other hand, given its very nature, it cannot be effectively applied in case of intermittent supply systems, since in such a case, the flow rate entering the house in any case goes to zero during some hours of the day (intermittent supply) and thus, a leakage in the plumbing system would not be detected.
3. Case Study
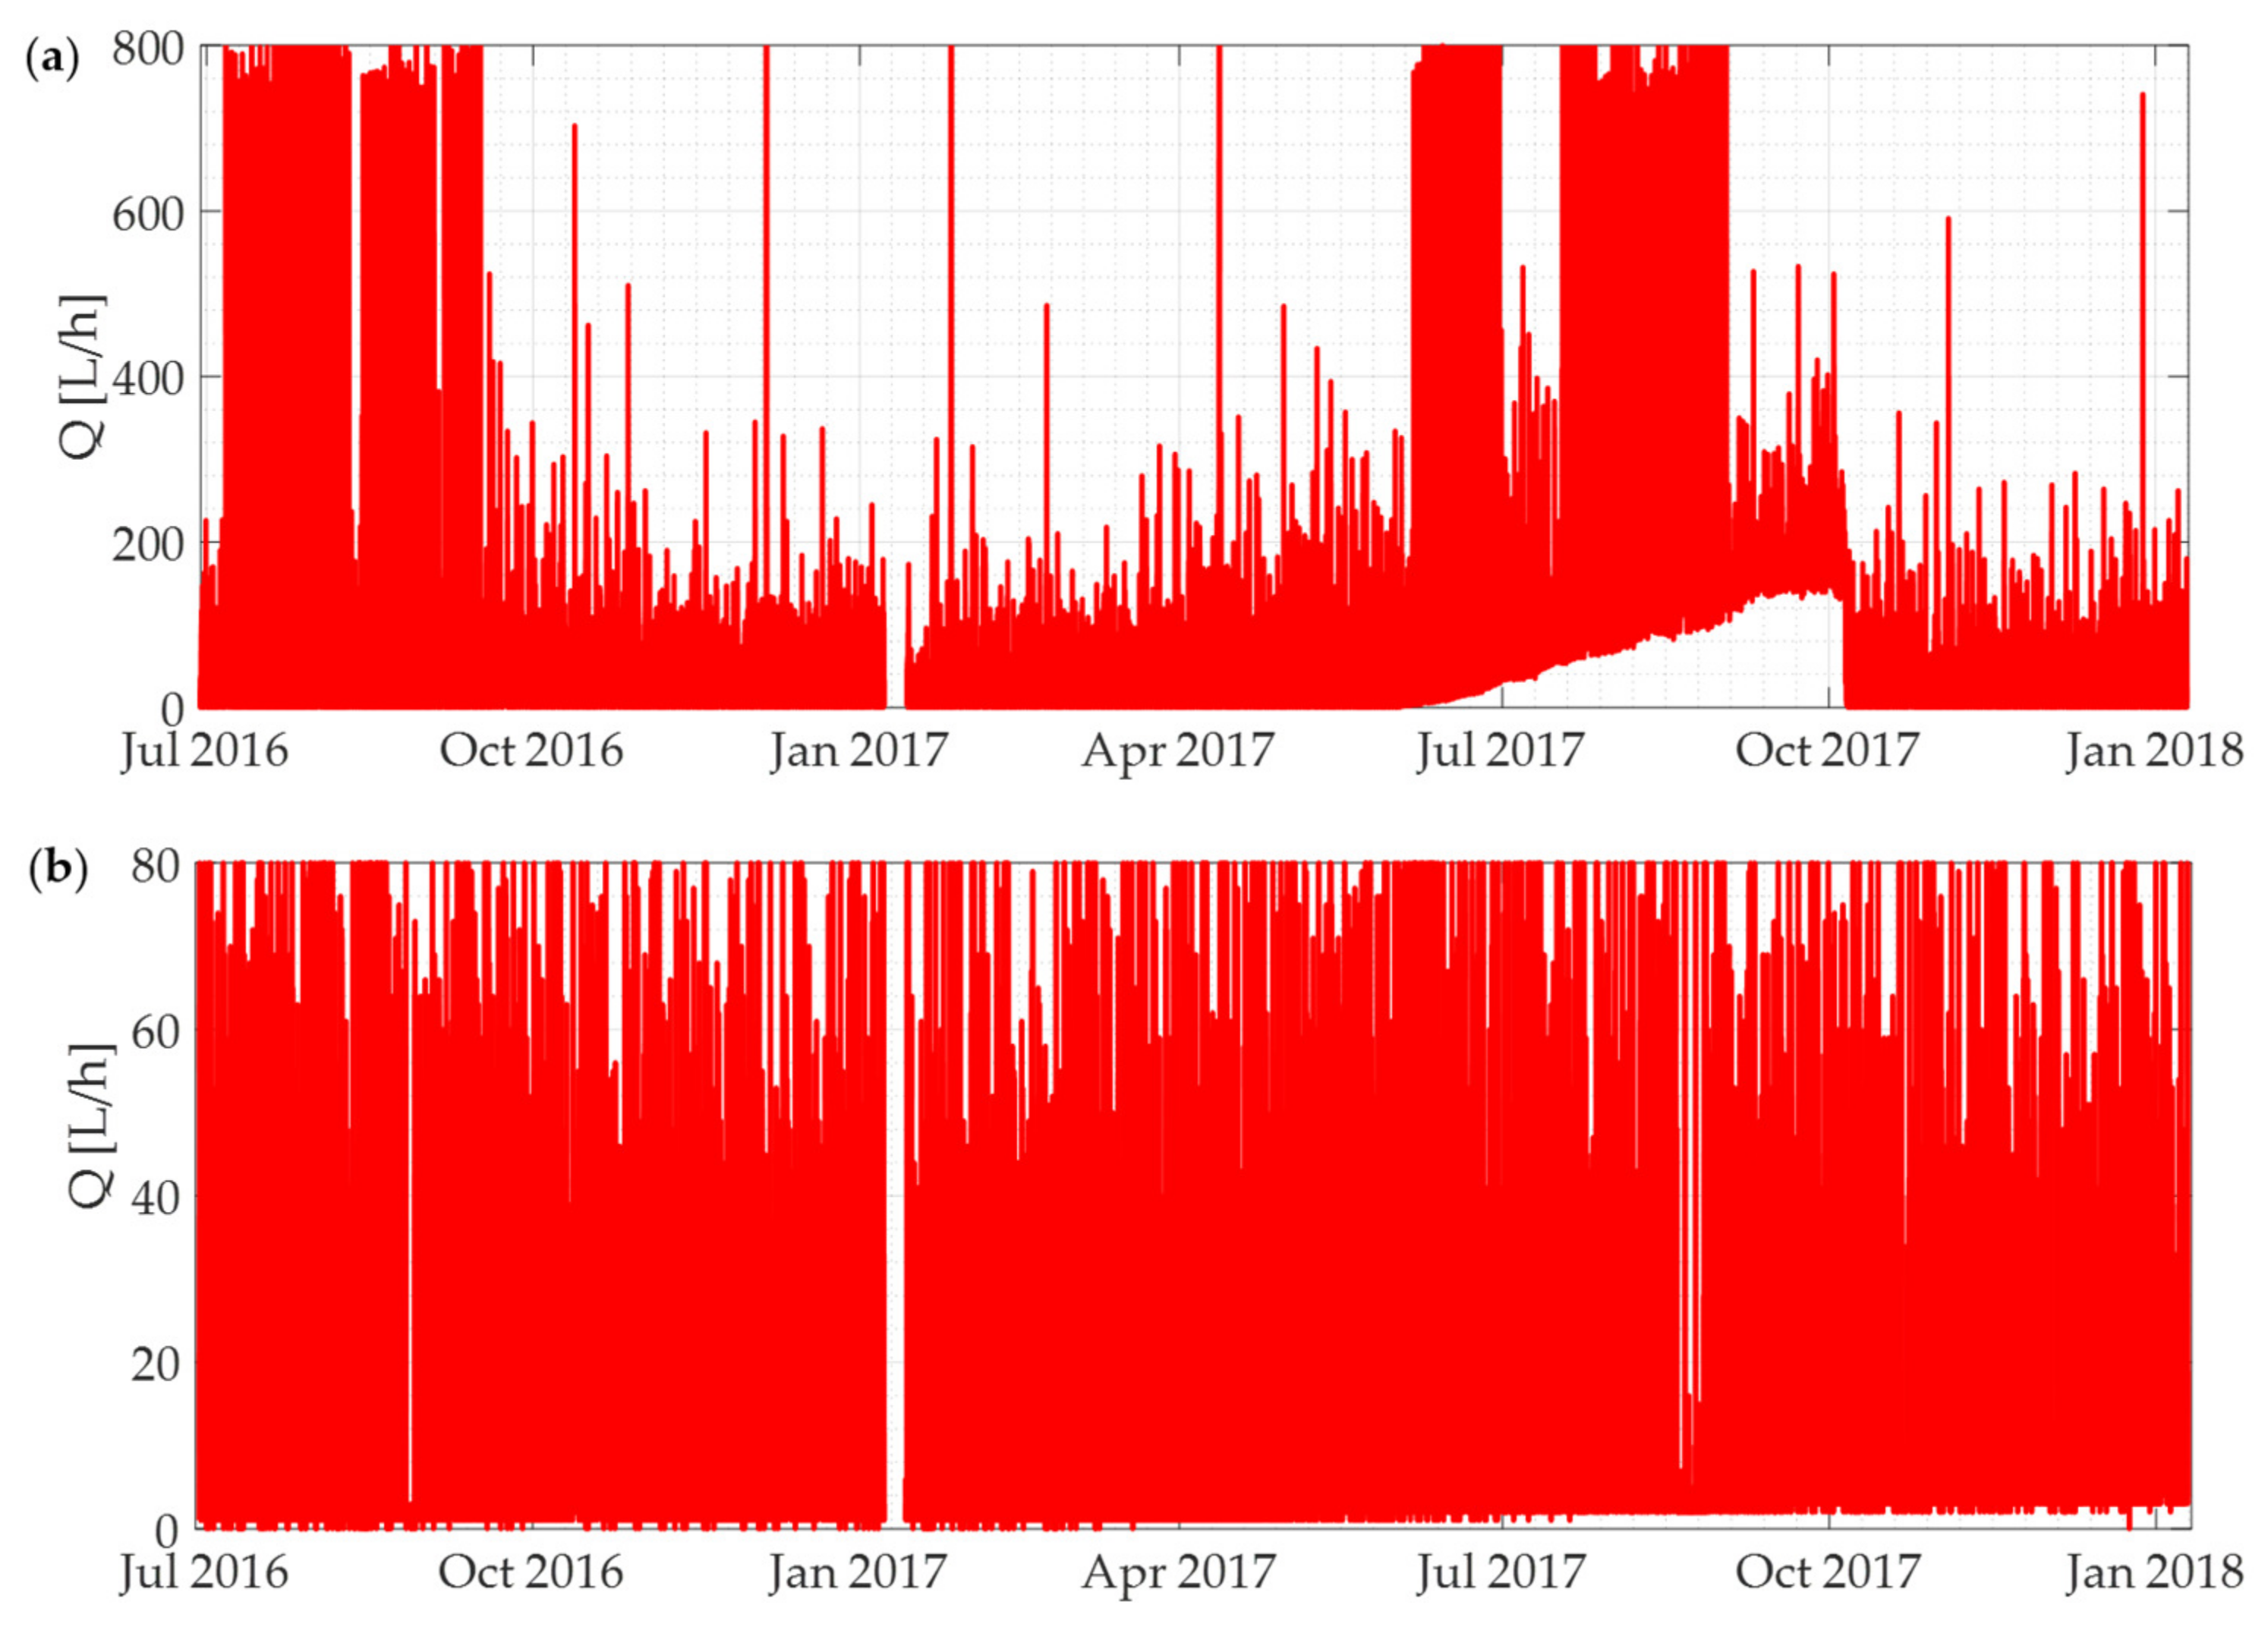
A field laboratory was created at Gorino Ferrarese (FE) with the goal of testing the water consumption monitoring and processing system developed. This small village, located in northern Italy, has an area of about 3 km2 and corresponds to a natural DMA where the entire distribution network is fed at a single point and supplies about 650 residents. These inhabitants correspond to a total of 293 users, of which 276 are residential and 17 represent public-, commercial-, and tourism-related activities. In this DMA, in the spring of 2016, CADF S.p.A., the water utility managing the network, and a project partner replaced the traditional meter devices with electromagnetic smart meters. These meter devices, entitled Sensus iPerl, provide a metrology R800 that assures accurate measurements starting with flow rates as low as 1 L/h. However, operatively, these smart meters can record variations, in terms of cumulative consumed water volume, no less than 1 L in the set time interval, where the set time interval is at least 1 min with remote meter reading (RMR) monitoring and at least 15 min with AMR monitoring. The installation of these smart meters made it possible to undertake a data collection campaign, which involved making preliminary use of an RMR system in a walk-by mode and evaluating the ability of the smart meters to record consumption data. Therefore, from June 2016 to March 2018, the time series of the cumulative volume of water demanded by each user were acquired. All collected data were stored in a one-hour time step time series database, for a total of around 4,500,000 records. Hourly data acquisition of water consumption allows users to be updated almost in real time on their water consumption and on the possible presence of water leakages in their homes. In particular, the collected data were subjected to a preliminary cleaning and pre-processing step. Specifically, the whole dataset was cleaned of the consumption information on commercial users and only residential users were taken into consideration since, as previously observed, the proposed method was based on considerations that typically applied to residential users. On the other hand, the consumption information relating to some residential users was rejected, as their smart meters were faulty and, for this reason, they recorded a decreasing cumulative volume. This problem was due to a particular set of meters provided by the producer. This set of faulty meters represents a high percentage, about 28% of the 293 smart meters belonging to the DMA, which in turn does not represent a large set compared to other field experiences, such as the one described by Britton et al. (2008) [13], where 22,000 m were installed. As a result, the final dataset used included the hourly cumulative volume time series of 193 residential users for the period from 29 June 2016 to 9 January 2018. These time series were pre-processed to obtain hourly time series of flow rates for each user and they were examined by an expert analyst, who performed a visual and manual analysis in order to characterize the water consumption pattern. The analysis was carried out by combining, for each user, the observations obtained from the analysis of the trend in the cumulative volume with those deriving from the pattern in flow rates. The majority of residential users showed a consumption pattern typical of domestic users, in which the periods of high consumption, occurring mainly during daylight hours, alternated with periods in which consumption decreased, even reaching zero values (typically during night-time hours). However, some residential users showed an unusual consumption pattern, due to the presence of leakages inside their homes. While large leakages were identified by analysing the time series of the cumulative volume, since they involved a clear increase in the slope of the consumption trend, identification of the small leakages required the analysis of the hourly flow rate time series. In fact, different types of leakages were identified, differing in size and behaviour: From large leakages due to broken pipes (Figure 4a), to small leakages due to the faulty operation of plumbing systems and sanitary appliances (Figure 4b). Overall, 192 leakages were identified during the monitoring period, with 54 corresponding to water losses of more than 10 L/h and 138 corresponding to water losses in the range from 1 to 10 L/h. The identified leakages were promptly reported to the WU, which in turn, alerted users. Subsequently, the water leakages reduction was verified through field inspections.
Subsequently, a daily benchmark was developed taking into account the results obtained through manual and visual analysis. The benchmark was used to assess the accuracy of the algorithm for the automatic identification of leakages. The performance of the algorithm implemented was inferred on the basis of a confusion matrix evaluation, as well as some metrics commonly used to assess classifiers in a machine learning context (Accuracy, Recall, Specificity, and Precision) [29,30,31,32]. Therefore, the number of days of real loss accurately identified by the algorithm (true positive—TP), real absence of water loss (true negative—TN), non-existent water loss erroneously identified by the algorithm (false positive—FP), and, finally, the number of days of real loss not identified by the algorithm (false negative—FN), were quantified for each user in order to evaluate the performance of the proposed algorithm. As a result, it was possible to obtain a confusion matrix relating to the whole set of users (Table 1), as well as the total number of days of real water loss (TP + FN), the total number of days characterized by a real correct operation of plumbing systems and sanitary appliances (TN + FP), the total number of days of water loss identified by the algorithm (TP + FP), and the total number of days during which the algorithm identified correct operation of plumbing systems and sanitary appliances (TN + FN).
Finally, the following metrics [29,30,31,32] were calculated based on the results provided by the confusion matrix:
Accuracy indicates the rate of total correct identifications provided by the algorithm and allows the overall performance of the algorithm to be defined. The other indices, by contrast, enable a quantification of the degree to which the empirical algorithm is able to distinguish the presence from the absence of water losses. In particular, Recall quantifies the capability of the algorithm to identify alarms, as measured by the ratio between the alarms correctly identified by the algorithm and the total number of true alarms. Similarly, Specificity represents the capability of the algorithm to identify the days characterized by a correct operation of the plumbing systems and sanitary appliances inside homes and is determined on the basis of the ratio between the total number of days characterized by the absence of water loss correctly identified by the algorithm and the total real number of days characterized by a correct operation of plumbing systems and hygienic and sanitary appliances. In contrast, Precision measures the capability of the algorithm to avoid false alarms, based on the ratio between the number of true alarms identified by the algorithm and the total number of alarms identified by it. Finally, the F1 measure was introduced in order to evaluate, using a single metric, the capability of distinguishing between days with or without water loss. F1 is calculated as the harmonic mean of Recall and Precision, according to the following formula:
Accuracy, Recall, Specificity, Precision, and F1 tend to 1 as the effectiveness of the algorithm increases.
4. Results and Discussion
The confusion matrix was determined for both algorithms, A2-5 and A0-24, and the results are summarized in Table 2.
In particular, Table 2a shows the values of TP, FP, FN, and TN resulting from the comparison between the benchmark and A2-5, while Table 2b shows the values of TP, FP, FN, and TN resulting from the comparison between the benchmark and A0-24.
In detail, one immediately observes a small difference in the total number of days classified: A2-5 classifies a total of 102,786 days, while A0-24 classifies 12 days less. This difference (lower number of classified values) is due to the fact that some data were missing in the time series of hourly flow rates relating to daylight hours, which precluded checking all 24 hourly values for some days. Clearly, this difference affects the sum of TP + FN and TN + FP, as well as the sum of TN + FN and TP + FP. Considering the metrics, it can be observed (see Table 3, first column) that the A2-5 algorithm is able to classify most of the days correctly, with an Accuracy of 0.94. In addition, almost all real alarms were detected by A2-5 since the Recall value is 0.99. Likewise, Specificity is higher than 0.9 and this result highlights how almost all cases of correct operation of plumbing systems and sanitary appliances are appropriately classified by the algorithm. Finally, Precision is 0.73 and F1 amounts overall to 0.86.
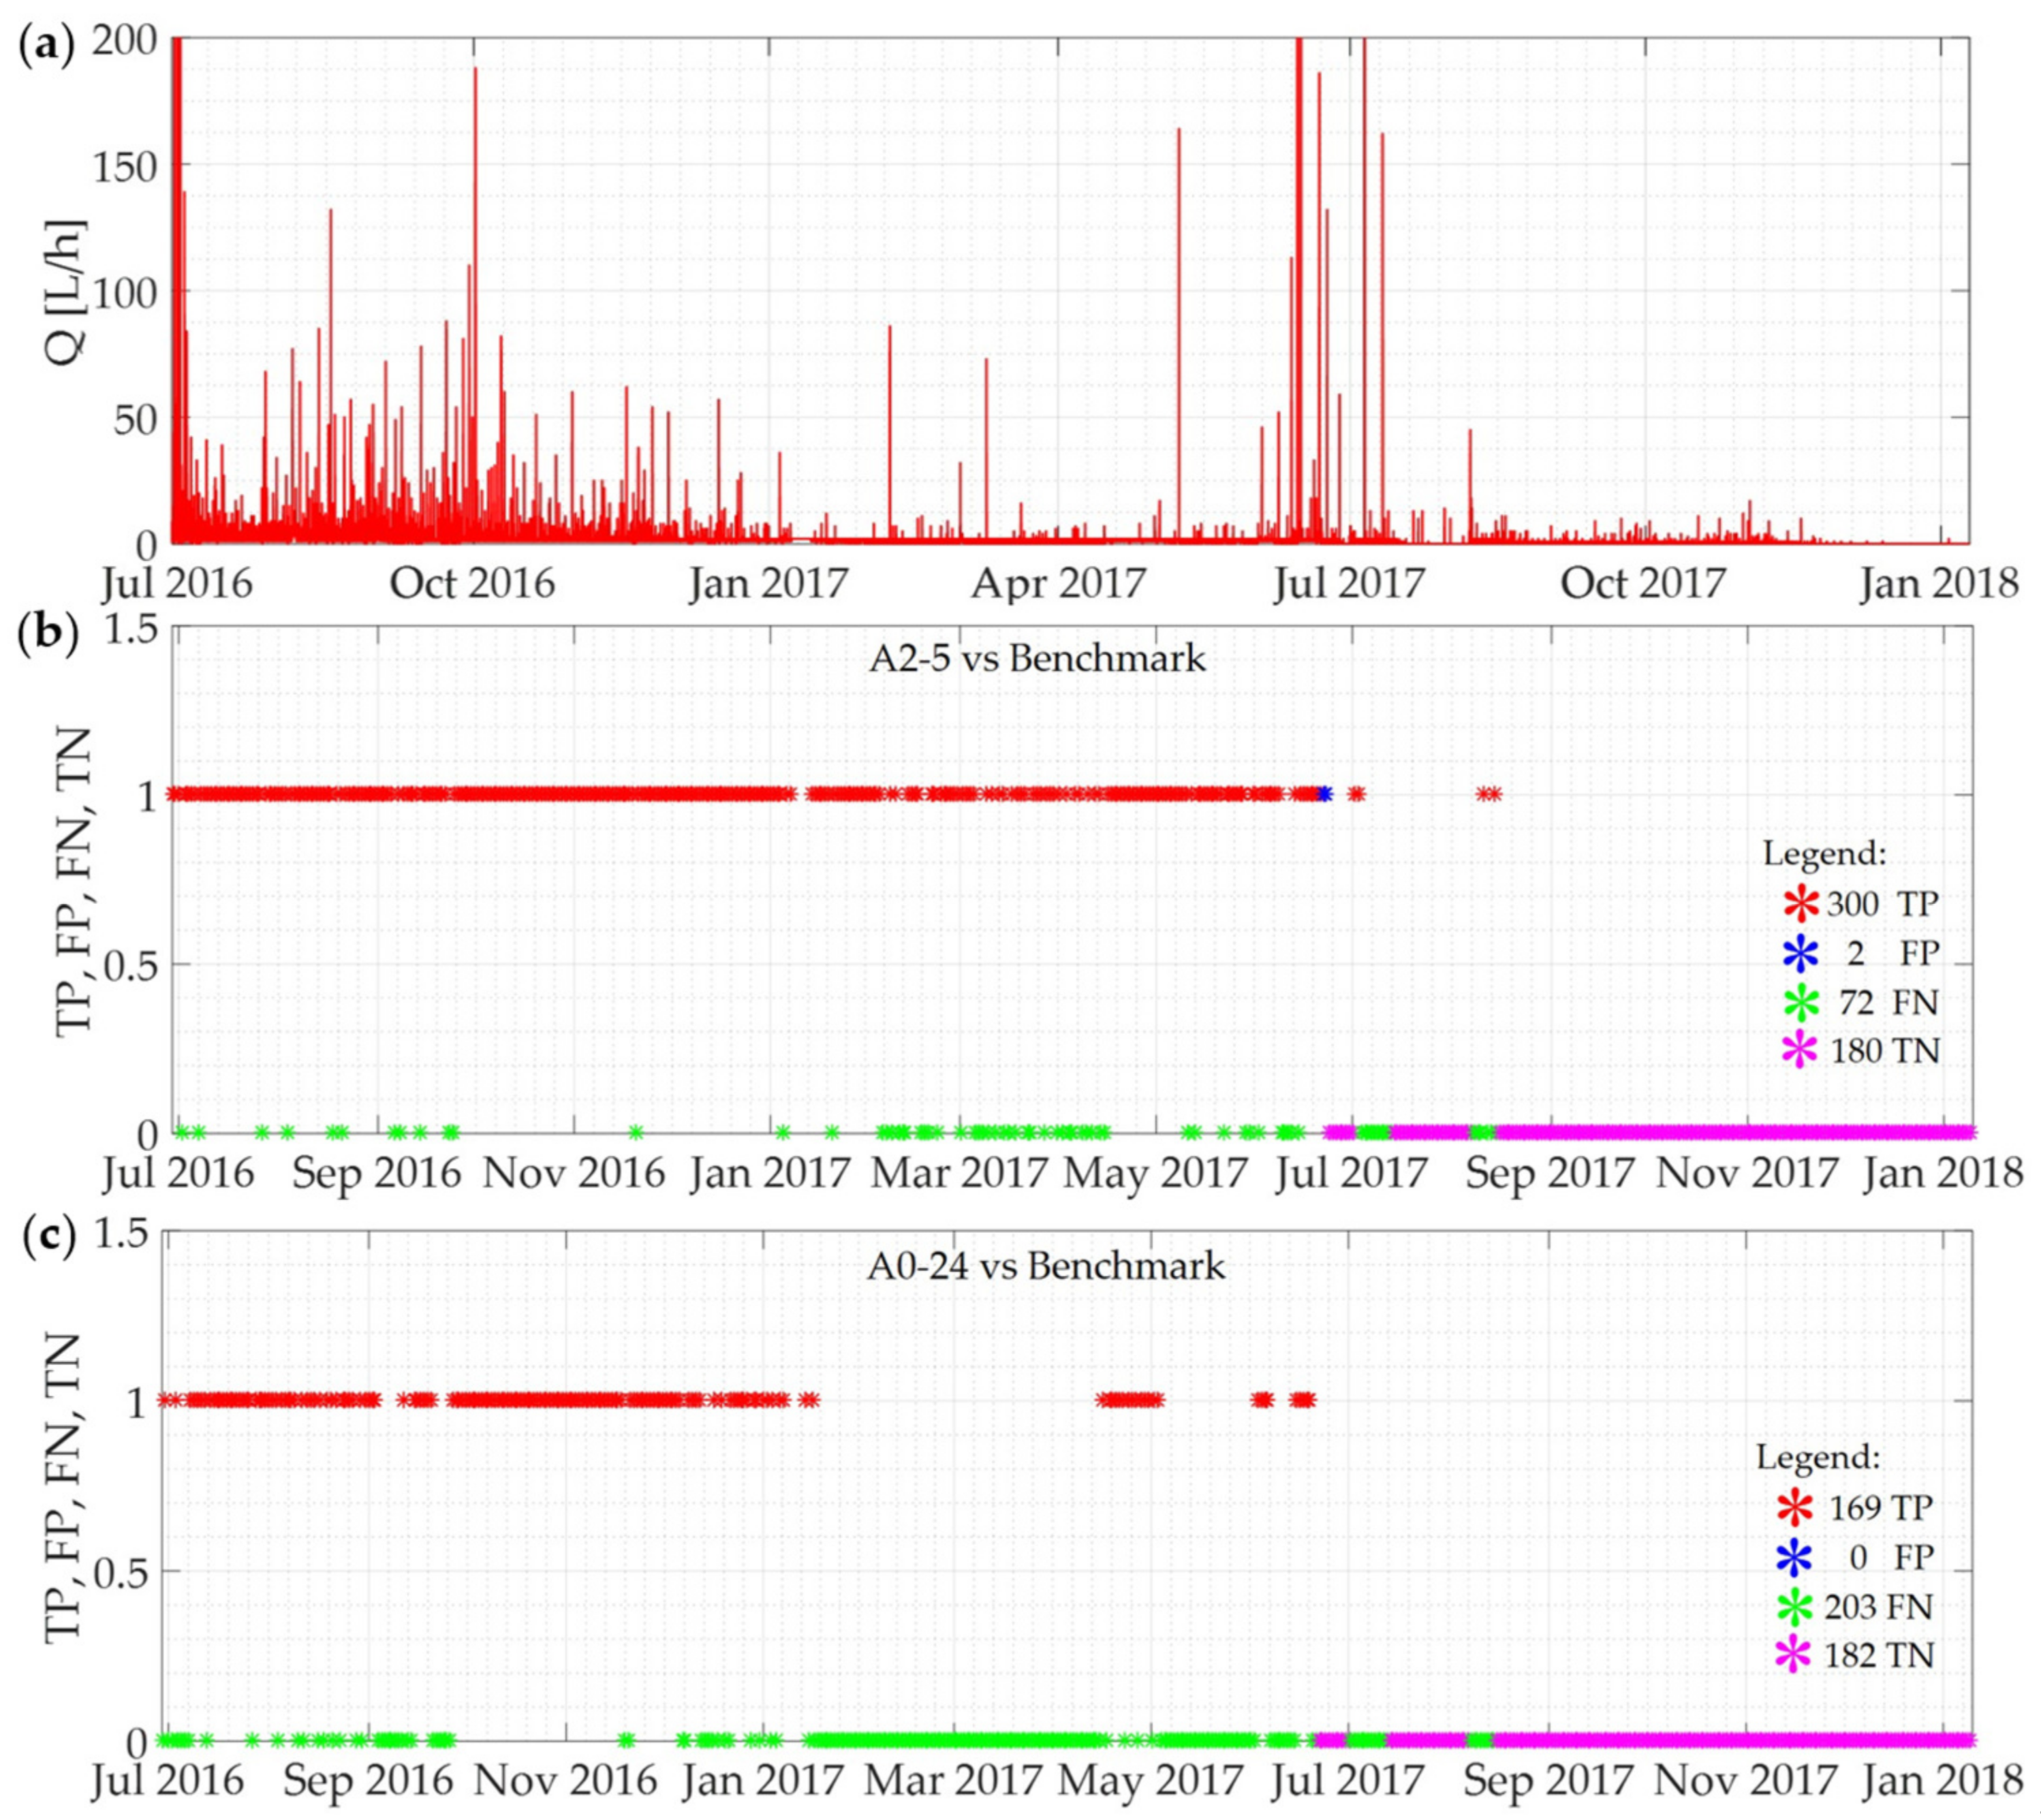
The results of the A0-24 approach show a higher Accuracy (0.98), as the number of cases of non-existent water losses correctly classified by the algorithm significantly increases (TN from 77,701 to 82,965) and the number of non-existent water losses erroneously identified by the algorithm decreases (FP from 5990 to 718). The reduction in false alarms is due to the fact that the hourly flow rates were evaluated over a wider time interval. In order to clarify the improvement in performance, in terms of false alarms, obtained by applying A0-24, Figure 5a shows the hourly flow rate pattern of a specific domestic user, while Figure 5b,c shows the results obtained (in terms of TP, FP, FN, and TN) for the same user on the basis of the comparison between the benchmark and A2-5 and A0-24, respectively.
As Figure 5a shows, the user shows a significant increase in water consumption in the summer period, due to the use of an irrigation system. In detail, the consumption due to the use of the irrigation system, which is reflected in the peak flow rates of more than 600 L/h, occurs regularly in the early hours of the morning (between 02:00 and 05:00) for the entire duration of the summer periods. Clearly, for this user, A2-5 generates some daily alarm signals (124 blue stars in Figure 5b), mistaking the user’s real consumption of water for a water loss. A0-24, by contrast, does not result in the same error and returns a much lower number of false alarms (represented by the 2 blue stars in Figure 5c), thus showing an ability to evaluate the hourly flow pattern throughout the day. The reduction in false alarms (from 5990 to 718) naturally also implies an increase in the Specificity and Precision metrics, which are equal to 0.99 and 0.96 respectively. However, this approach provides less accurate results in terms of the real water losses identified by the algorithm (TP from 18,896 to 18,211) and, as a consequence, the number of days of unidentified real water losses increases (FN from 199 to 880) and Recall decreases (from 0.99 to 0.95). Figure 6 provides an example to explain the reason behind these results. In particular, Figure 6a shows the time series of the hourly flow rates for a user with a very small water loss, while Figure 6b,c shows the results obtained (in terms of TP, FP, FN, and TN) for the same user on the basis of the comparison between the benchmark and A2-5 and A0-24 algorithms, respectively.
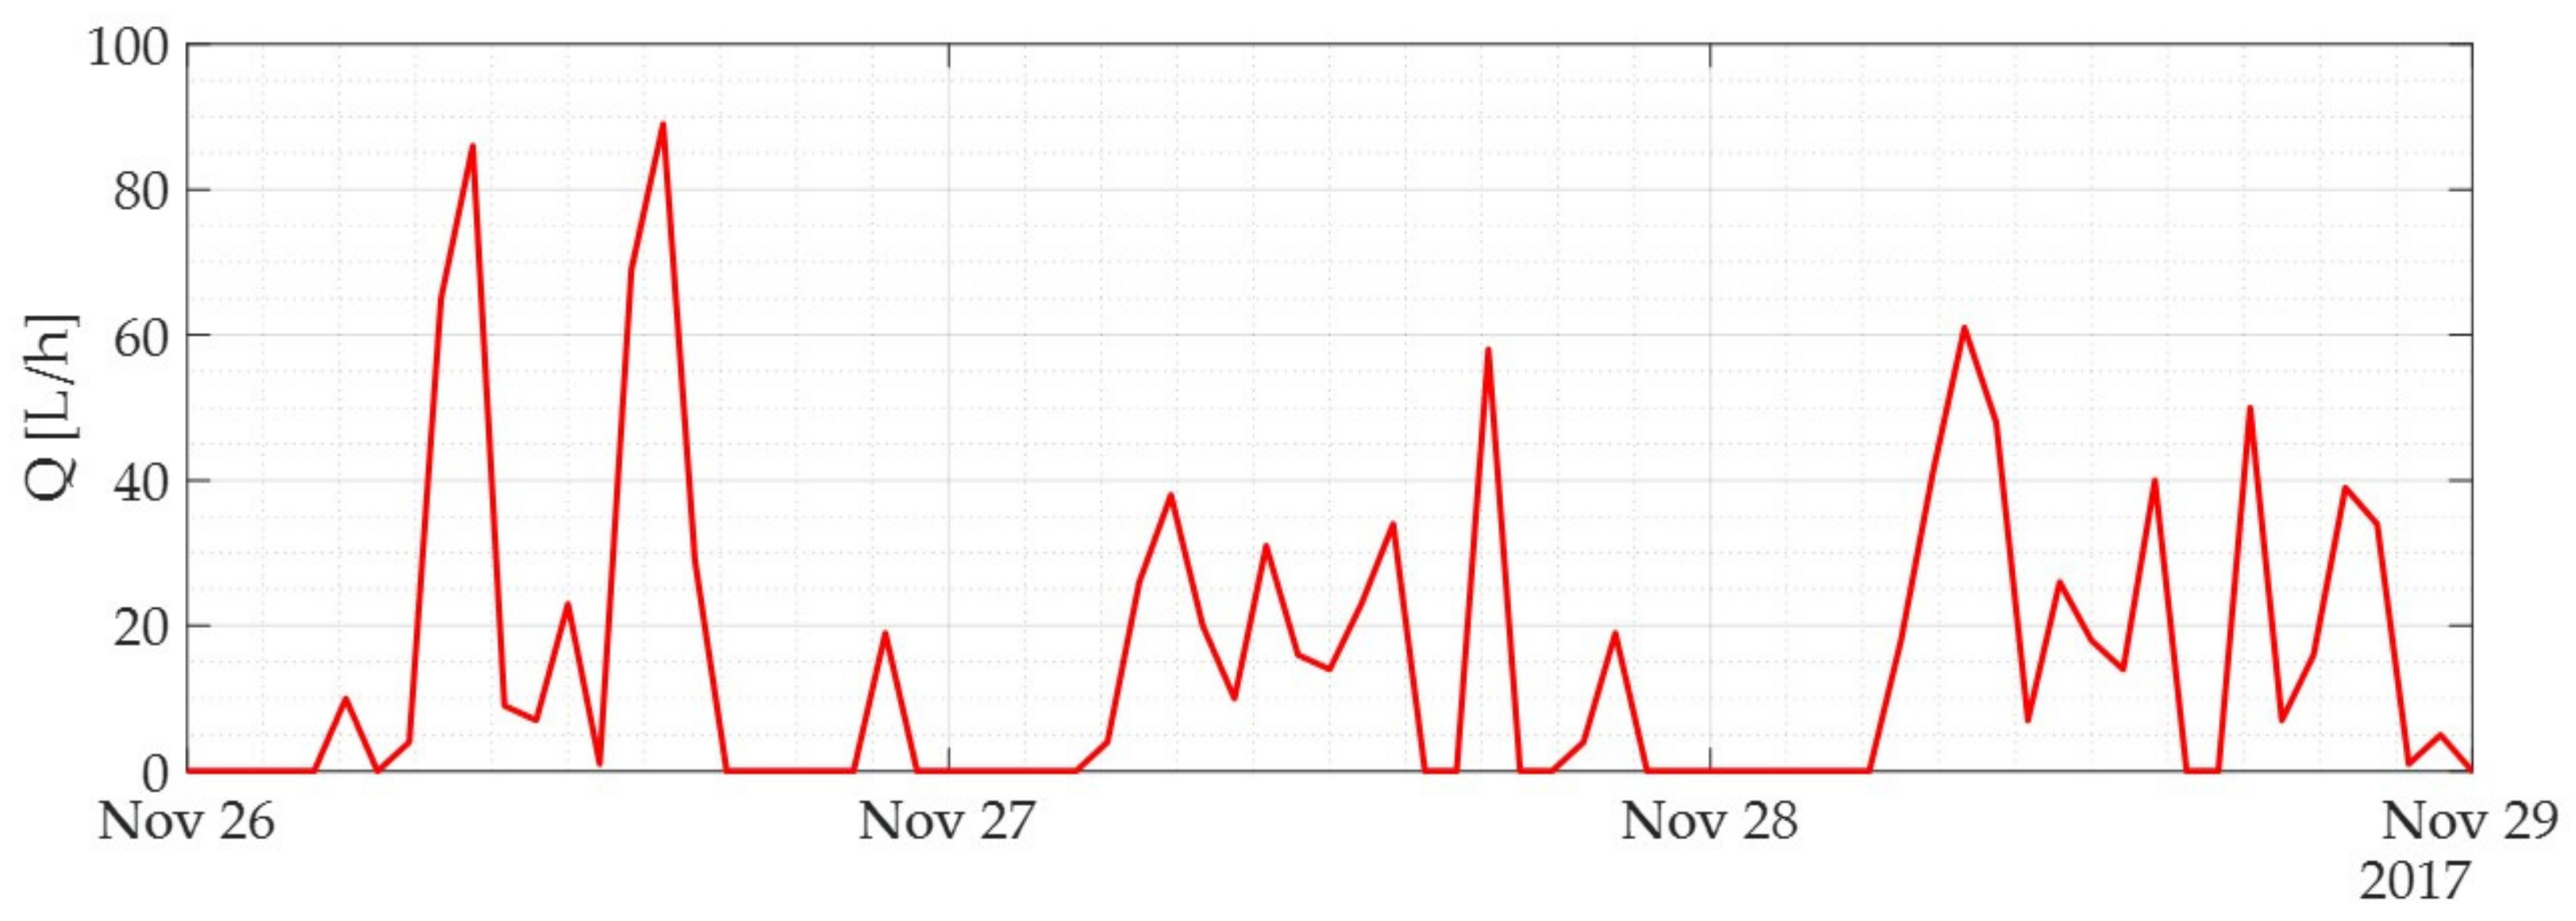
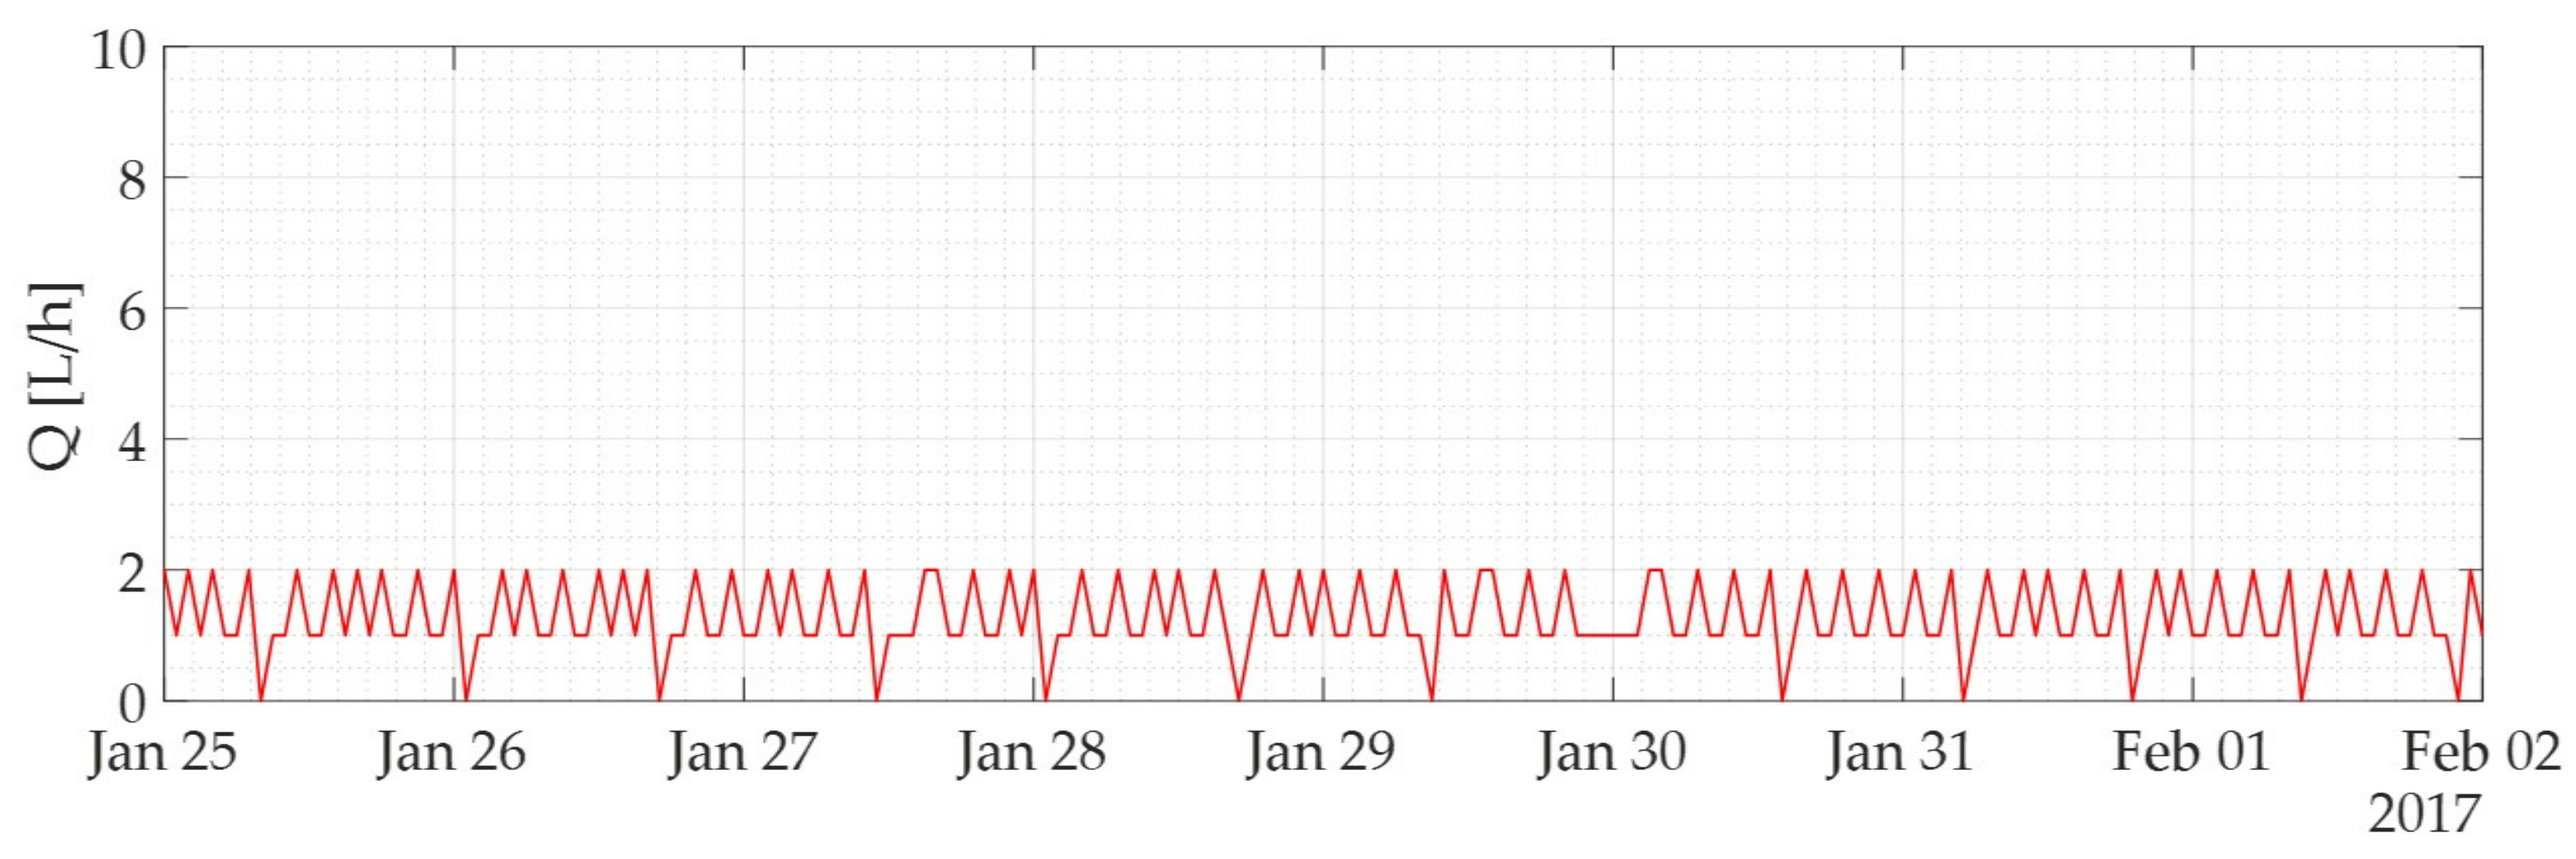
Specifically, for this user, characterized by a lower water consumption than the previous one, an FN of 72 was obtained when A2-5 was compared with the benchmark, while an FN of 203 was obtained when A0-24 was compared with the benchmark. Figure 7 shows the time series of the hourly flow rates for this user recorded from 25 January to 1 February 2017.
As may be observed, this user shows a sawtooth pattern of water consumption that is characterized mainly by a flow rate equal to 1 or 2 L/h but sporadically and irregularly tends to 0. This flow rate trend was classified by the analyst as a water leak of less than 1 L/h, since it is not possible to establish a similarity between this water consumption pattern and the patterns normally associated with the traditional human activities that take place within a generic household. This means that the analyst considered water loss to always be present and attributed the zero values to the sensitivity of the smart meter, which is capable of measuring and recording a minimum cumulative volume increase of 1 L. Basically, in some hours, the cumulative volume caused by the water leak was not sufficient to generate a consumption value greater than zero, even though the water loss occurred, as the leak was close to the meter detection limit. The presence of zero flow values induces the algorithm to confuse some days characterized by real water losses of less than 1 L/h with days characterized by a correct operation of plumbing systems and hygienic and sanitary appliances. Clearly, A2-5 generates fewer false negatives than A0-24, as the probability of identifying a zero value is lower when a shorter time interval is considered. Moreover, it is interesting to highlight that the consumption pattern of this user is the one that generates the highest FN. Indeed, of all the observed false negatives, 36% (A2-5) and 23% (A0-24) were due to this user. In any case, with both approaches, the majority of remaining false negatives are attributable to users characterized by water losses of less than 1 L/h.
Thus, although A0-24 produces somewhat less accurate results when users are affected by water losses of less than 1 L/h, i.e., below the detection limit of the meter itself, the results show that it is more efficient in avoiding false alarms and in automatically identifying the water leaks of residential users, as the F1 measure increases quite significantly from 0.86 to 0.96.
The efficiency of the A0-24 algorithm was also compared with the approach proposed by Britton et al. (2008) [13] based on considering continuous non-zero consumption over a time window of 48 h. The corresponding Accuracy, Recall, Specificity, Precision, and F1 measures are synthetized in the third column of Table 3. As can be observed, when the empirical algorithm looks for continuous non-zero consumption over 2 days, Accuracy and Specificity are equal to 0.97 and 0.99, values in line with those obtained through A0-24 (respectively 0.98 and 0.99). However, Recall significantly decreases (from 0.95 to 0.88) due to a decrease of real loss accurately identified by the algorithm (from 18,211 to 16,764) and to an increase of the number of days of real losses not identified by the algorithm (from 880 to 2270). Therefore, even if Precision slightly increases (from 0.96 to 0.99), the overall F1 measure decreases to 0.93. In short, at least for the considered case study, the A0-24 algorithm seems to be the most effective one.
5. Conclusions
This paper presents a system for the continuous monitoring and processing of water consumption data developed as part of the GST4Water project. The monitoring system receives the consumption data sent by smart meters and relays them to a cloud platform where they are processed in order to return useful information to users and water utility managers on a real-time basis. In particular, with reference to the goal of reducing water losses at the individual user level, an algorithm is proposed. The implementation of this algorithm within the processing system allows for the automatic identification of water leakages downstream of the smart meter. The algorithm analyses the hourly water consumption patterns of each domestic user and searches for zero flow values recorded during the hours of minimum consumption, or around the clock. If the hourly flow value is zero at least once during the specified time interval, the algorithm classifies the consumption pattern of the user as indicative of correct operation of the plumbing system and sanitary appliances. In contrast, if the hourly flow value is never zero in the same time interval, the algorithm classifies the consumption trend as indicative of a probable water loss. The results obtained show that the proposed algorithm allows the water losses of individual residential users to be identified with an accuracy of more than 90%, based on the non-zero flow values recorded both during the hours of minimum consumption and throughout the day or two consecutive days. However, the approach whereby the water consumption pattern over a 24-h period is considered has proven to be more effective in distinguishing between the presence and absence of water leakage, thus providing a much lower number of false alarms. The proposed algorithm would enable users to be directly notified of the presence of probable water leakages inside their homes if it were implemented by exploiting the most innovative infrastructure for real-time water consumption monitoring. This would contribute to the sustainable management of water resources by reducing the volume of wasted water. Although smart meters are still very expensive compared to traditional meters, and thus are still not widely used, the obtained results can represent valid evidence of their practical effectiveness.
Author Contributions
Conceptualization: all the authors; methodology: all the authors; formal analysis: C.L., F.C. and S.A.; software and validation: C.L. and F.C.; writing—original draft preparation: C.L. and F.C.; writing—review and editing: all the authors; visualization: C.L. and F.C.; supervision: S.A. and M.F.; project administration and funding acquisition: M.F.
Funding
This study was carried out as part of the GST4Water project “Green-Smart Technology for the sustainable use of water resources in buildings and in urban areas”, funded by the European Community through the financial sponsorship of the Emilia Romagna Region (POR-FESR 2014–2020).
Conflicts of Interest
The authors declare no conflict of interest.
References
- Boyle, T.; Giurco, D.; Mukheibir, P.; Liu, A.; Moy, C.; White, S.; Stewart, R. Intelligent Metering for Urban Water: A Review. Water 2013, 5, 1052–1081. [Google Scholar] [CrossRef] [Green Version]
- Willis, R.M.; Stewart, R.A.; Panuwatwanich, K.; Williams, P.R.; Hollingsworth, A.L. Quantifying the influence of environmental and water conservation attitudes on household end use water consumption. J. Environ. Manag. 2011, 92, 1996–2009. [Google Scholar] [CrossRef] [PubMed] [Green Version]
- Buchberger, S.G.; Nadimpalli, G. Leak Estimation in Water Distribution Systems by Statistical Analysis of Flow Readings. J. Water Resour. Plann. Manag. 2004, 130, 321–329. [Google Scholar] [CrossRef]
- Cominola, A.; Giuliani, M.; Piga, D.; Castelletti, A.; Rizzoli, A.E. Benefits and challenges of using smart meters for advancing residential water demand modeling and management: A review. Environ. Model. Softw. 2015, 72, 198–214. [Google Scholar] [CrossRef] [Green Version]
- Muthukumaran, S.; Baskaran, K.; Sexton, N. Quantification of potable water savings by residential water conservation and reuse—A case study. Resour. Conserv. Recycl. 2011, 55, 945–952. [Google Scholar] [CrossRef]
- GST4Water, Project Website. Available online: https://www.gst4water.it/ (accessed on 25 January 2019).
- Luciani, C.; Casellato, F.; Alvisi, S.; Franchini, M. From Water Consumption Smart Metering to Leakage Characterization at District and User Level: The GST4Water Project. In Proceedings of the 3rd EWaS International Conference on Insights on the Water-Energy-Food Nexus, Lefkada Island, Greece, 27–30 June 2018; Volume 2. [Google Scholar] [CrossRef]
- Cipolla, S.S.; Altobelli, M.; Maglionico, M. Decentralized water management: Rainwater harvesting, greywater reuse and green roofs within the GST4Water project. In Proceedings of the 3rd EWaS International Conference on Insights on the Water-Energy-Food Nexus, Lefkada Island, Greece, 27–30 June 2018; Volume 2. [Google Scholar] [CrossRef]
- Di Fusco, E.; Lenci, A.; Liserra, T.; Ciriello, V.; Di Federico, V. Sustainability assessment of urban water use from building to urban scale in the GST4Water project. In Proceedings of the 3rd EWaS International Conference on “Insights on the Water-Energy-Food Nexus, Lefkada Island, Greece, 27–30 June 2018; Volume 2. [Google Scholar] [CrossRef]
- Puust, R.; Kapelan, Z.; Savić, D.A.; Koppel, T. A review of methods for leakage management in pipe networks. Urban Water J. 2010, 7, 25–45. [Google Scholar] [CrossRef]
- Farley, M.; Trow, S. Losses in Water Distribution Networks—A Practitioner’s Guide to Assessment, Monitoring and Control; IWA Publishing: London UK, 2003; pp. 146–149. ISBN 13 9781900222112. [Google Scholar]
- IWA, Water Loss Task Force. Best Practice Performance Indicators for Non-Revenue Water and Water Loss Components: A Practical Approach; International Water Association: London, UK, 2005. [Google Scholar]
- Britton, T.; Cole, G.; Stewart, R.; Wiskar, D. Remote diagnosis of leakage in residential households. Water (Australian Water Association) 2008, 35, 56–60. [Google Scholar]
- Britton, T.C.; Stewart, R.A.; O’Halloran, K.R. Smart metering: Enabler for rapid and effective post meter leakage identification and water loss management. J. Clean. Prod. 2013, 54, 166–176. [Google Scholar] [CrossRef]
- Article on a Water Leakage Inside a User in Ferrara, La Nuova Ferrara Website. Available online: https://lanuovaferrara.gelocal.it/ferrara/cronaca/2018/02/20/news/il-tubo-rotto-e-un-salasso-bolletta-da-16mila-euro-1.16504782 (accessed on 13 February 2019).
- Article on a Water Leakage Inside a User in Province of Venice, Venezia Today Website. Available online: http://www.veneziatoday.it/cronaca/bollette-acquaperdite-occulte.html (accessed on 13 February 2019).
- Stewart, R.A.; Nguyen, K.; Beal, C.; Zhang, H.; Sahin, O.; Bertone, E.; Vieira, A.S.; Castelletti, A.; Cominola, A.; Giuliani, M.; et al. Integrated intelligent water-energy metering systems and informatics: Visioning a digital multi-utility service provider. Environ. Model. Softw. 2018, 105, 94–117. [Google Scholar] [CrossRef]
- Gurung, T.R.; Stewart, R.A.; Sharma, A.K.; Beal, C.D. Smart meters for enhanced water supply network modelling and infrastructure planning. Resour. Conserv. Recycl. 2014, 90, 34–50. [Google Scholar] [CrossRef] [Green Version]
- Boulos, P.F.; Wiley, A.N. Can we make water systems smarter? Opflow 2013, 39, 20–22. [Google Scholar] [CrossRef]
- Froehlich, J.; Findlater, L.; Ostergren, M.; Ramanathan, S.; Peterson, J.; Wragg, I.; Larson, E.; Fu, F.; Bai, M.; Patel, S.; et al. The design and evaluation of prototype eco-feedback displays for fixture-level water usage data. In Proceedings of the SIGCHI Conference on Human Factors in Computing Systems, Austin, TX, USA, 5–10 May 2012; ACM: New York, NY, USA, 2012; pp. 2367–2376. [Google Scholar] [CrossRef]
- Sonderlund, A.L.; Smith, J.R.; Hutton, C.; Kapelan, Z. Using smart meters for household water consumption feedback: Knowns and unknowns. Procedia Eng. 2014, 89, 990–997. [Google Scholar] [CrossRef]
- Geller, E.S. The challenge of increasing proenvironment behavior. In Handbook of Environmental Psychology; Wiley: New York, NY, USA, 2002; Chapter 34; pp. 525–540. [Google Scholar]
- Fielding, K.S.; Spinks, A.; Russell, S.; McCrea, R.; Stewart, R.; Gardner, J. An experimental test of voluntary strategies to promote urban water demand management. J. Environ. Manag. 2013, 114, 343–351. [Google Scholar] [CrossRef] [PubMed]
- Stewart, R.A.; Willis, R.; Giurco, D.P.; Panuwatwanich, K.; Capati, G. Web based knowledge management system: Linking smart metering to the future of urban water planning. Aust. Plan. 2010, 47, 66–74. [Google Scholar] [CrossRef]
- DeOreo, W.B.; Heaney, J.P.; Mayer, P.W. Flow trace analysis to assess water use. AWWA 1996, 88, 79–90. [Google Scholar] [CrossRef]
- Linux. Available online: https://www.linux.org/ (accessed on 14 February 2019).
- Supervisor. Available online: https://github.com/Supervisor/supervisor; http://supervisord.org/ (accessed on 14 February 2019).
- Sakis3g. Available online: https://github.com/trixarian/sakis3g-source (accessed on 14 February 2019).
- Wang, G.; Hao, J.; Ma, J.; Huang, L. A new approach to intrusion detection using artificial neural networks and fuzzy clustering. Expert Syst. Appl. 2010, 37, 6225–6232. [Google Scholar] [CrossRef]
- Farah, E.; Shahrour, I. Leakage Detection Using Smart Water System: Combination of Water Balance and Automated Minimum Night Flow. Water Resour. Manag. 2017, 31, 4821–4833. [Google Scholar] [CrossRef]
- Davis, J.; Goadrich, M. The relationship between precision-recall and ROC curves. In Proceedings of the 23rd International Conference on Machine Learning, Pittsburgh, PA, USA, 25–29 June 2006; ACM: New York, NY, USA, 2016; pp. 233–240. [Google Scholar]
- Fawcett, T. An introduction to ROC analysis. Pattern Recognit. Lett. 2006, 27, 861–874. [Google Scholar] [CrossRef]
Figure 1.
Flow of water consumption data/information within the implemented system.

Figure 2.
Screenshot of the Rilheva platform that allows the user to view the processed data.

Figure 3.
Example of the hourly water consumption pattern of a domestic user.

Figure 4.
(a) Hourly flow rate time series of a user affected by a large leakage. (b) Hourly flow rate time series of a user affected by a small leakage.
Figure 4.
(a) Hourly flow rate time series of a user affected by a large leakage. (b) Hourly flow rate time series of a user affected by a small leakage.

Figure 5.
(a) Hourly flow rate time series of a user characterized by a strong seasonal variability in water demand; (b) results in terms of true positive (TP), false positive (FP), false negative (FN), and true negative (TN) obtained by comparing A2-5 against the benchmark and (c) results in terms of TP, FP, FN, and TN obtained by comparing A0-24 against the benchmark.

Figure 6.
(a) Hourly flow rate time series for a user characterized by an unexpected pattern due to a small water leakage; (b) results in terms of TP, FP, FN, and TN obtained by comparing A2-5 against the benchmark and (c) results in terms of TP, FP, FN, and TN obtained by comparing A0-24 against the benchmark.

Figure 7.
Hourly flow rate time series of a user characterized by a water loss of less than 1 L/h, recorded from 25 January to 1 February 2017.
Figure 7.
Hourly flow rate time series of a user characterized by a water loss of less than 1 L/h, recorded from 25 January to 1 February 2017.


Table 1.
Layout of the confusion matrix used.
| Benchmark | |||
|---|---|---|---|
| Presence of Water Loss | Absence of Water Loss | ||
| Algorithm | Presence of water loss | TP | FP |
| Absence of water loss | FN | TN | |
Table 2.
Confusion matrix obtained by comparing (a) algorithm A2-5 against the benchmark and (b) algorithm A0-24 against the benchmark.
Table 2.
Confusion matrix obtained by comparing (a) algorithm A2-5 against the benchmark and (b) algorithm A0-24 against the benchmark.
| (a) | (b) | ||||||
|---|---|---|---|---|---|---|---|
| Benchmark | Benchmark | ||||||
| Presence of Water Loss | Absence of Water Loss | Presence of Water Loss | Absence of Water Loss | ||||
| A2-5 | Presence of water loss | TP = 18,896 (18.4%) | FP = 5990 (5.8%) | A0-24 | Presence of water loss | TP = 18,211 (17.7%) | FP = 718 (0.7%) |
| Absence of water loss | FN = 199 (0.2%) | TN = 77,701 (75.6%) | Absence of water loss | FN = 880 (0.9%) | TN = 82,965 (80.7%) | ||
| TP + FP + FN + TN = 102,786 | TP + FP + FN + TN = 10,2774 | ||||||
| TP + FN = 19,095 | TP + FN = 19,091 | ||||||
| TN + FP = 83,691 | TN + FP = 83,683 | ||||||
| TP + FP = 24,886 | TP + FP = 18,929 | ||||||
| TN + FN = 77,900 | TN + FN = 83,845 | ||||||
Table 3.
Accuracy, Recall, Specificity, Precision, and F1 obtained by comparing A2-5 against the benchmark (first column) and by comparing A0-24 against the benchmark (second column). Measures obtained by considering also 48 h (Britton et al., 2008 [13]) are shown in the third column.
Table 3.
Accuracy, Recall, Specificity, Precision, and F1 obtained by comparing A2-5 against the benchmark (first column) and by comparing A0-24 against the benchmark (second column). Measures obtained by considering also 48 h (Britton et al., 2008 [13]) are shown in the third column.
| Metrics- | A2-5 | A0-24 | A0-48 |
|---|---|---|---|
| Accuracy | 0.94 | 0.98 | 0.97 |
| Recall | 0.99 | 0.95 | 0.88 |
| Specificity | 0.93 | 0.99 | 0.99 |
| Precision | 0.73 | 0.96 | 0.99 |
| F1 | 0.86 | 0.96 | 0.93 |
© 2019 by the authors. Licensee MDPI, Basel, Switzerland. This article is an open access article distributed under the terms and conditions of the Creative Commons Attribution (CC BY) license (http://creativecommons.org/licenses/by/4.0/).
Share and Cite
MDPI and ACS Style
Luciani, C.; Casellato, F.; Alvisi, S.; Franchini, M. Green Smart Technology for Water (GST4Water): Water Loss Identification at User Level by Using Smart Metering Systems. Water 2019, 11, 405. https://doi.org/10.3390/w11030405
AMA Style
Luciani C, Casellato F, Alvisi S, Franchini M. Green Smart Technology for Water (GST4Water): Water Loss Identification at User Level by Using Smart Metering Systems. Water. 2019; 11(3):405. https://doi.org/10.3390/w11030405
Chicago/Turabian StyleLuciani, Chiara, Francesco Casellato, Stefano Alvisi, and Marco Franchini. 2019. "Green Smart Technology for Water (GST4Water): Water Loss Identification at User Level by Using Smart Metering Systems" Water 11, no. 3: 405. https://doi.org/10.3390/w11030405
Note that from the first issue of 2016, this journal uses article numbers instead of page numbers. See further details here.