2D PIV Measurement of Twin Buoyant Jets in Wavy Cross-Flow Environment

1
State Key Laboratory of Hydrology-Water Resources and Hydraulic Engineering, Hohai University, Nanjing 210098, China
2
College of Harbor, Coastal and Offshore Engineering, Hohai University, Nanjing 210098, China
*
Author to whom correspondence should be addressed.
Water 2019, 11(2), 399; https://doi.org/10.3390/w11020399
Submission received: 30 January 2019
/
Revised: 17 February 2019
/
Accepted: 19 February 2019
/
Published: 25 February 2019
(This article belongs to the Section Water Quality and Contamination)
Abstract
:The multiport diffuser effluent discharge facilities constructed beneath the coastal waters were simplified in the laboratory as twin buoyant jets in a wavy cross-flow environment. The near-field flow structure of twin jets was studied by series of experiments conducted in a physical wave–current flume. The particle image velocimetry (PIV) system was used to measure the velocity field of the jets in various cross-flow-only and wavy cross-flow environments. By means of flow visualization, the distinctive “effluent cloud” (EC) phenomenon was clearly observed and the jet penetration height was found to be notably increased compared with that of cross-flow-only environment at the downstream position. It was found that the wave-to-current velocity ratio Rwc is a very important parameter for effluent discharge. A new characteristic velocity uch and the corresponding characteristic length scale lmb for twin buoyant jets in the wavy cross-flow environment were defined. Using curve-fitting, a new equation to estimate the effects of the jet-to-current velocity ratio (Rjc), wave-to-current velocity ratio (Rwc) and Strouhal number (St) on the jet trajectory were derived to enhance understanding the physical processes underpinning the rise and the dilution of buoyant jets, which is critical to the design of discharge facilities.
1. Introduction
With the fast development of industrial economy and the large growth of population at the coastal cities, the marine environment in coastal and offshore areas has been greatly deteriorated. The related pollutants are potential threat to the local marine environmental and ecological systems [1]. The coastal sewage disposal project turns to be one of the available solutions to this problem in maintaining the coastal and offshore marine environment. As an environmentally friendly management practice, the effluents are treated in such a manner that local concentration levels are reduced to the maximum possible extent and the adverse effects are minimized before being discharged into the coastal and offshore waters. The treatment involves different processes, which are aimed at reducing toxicity, heavy metal content, nutrient content, etc. [2,3,4]. Afterwards, the effluent is discharged as horizontal jets, vertical jets, inclined jets, and so on, into the coastal waters from a multiport diffuser at the bottom of the receiving water, which is mostly predominated by wave and current (wavy cross-flow) environment. According to Fan [5], the density of outfall discharges is very close to that of pure water, which is lighter than the seawater. Therefore, most of the outfall discharges can be regarded as positive buoyant jets.
Previous researches on the movement and dilution of jets can be classified based on various hydrodynamic characteristics of the receiving water, including still water, cross-flow, wave flow and wave–current flow.
In still water environment, both the mean and the turbulent properties of buoyant jets were studied and relevant conclusions were made. For the vertical discharged buoyant jets, the average dilution and diffusion rate are mainly subjected to the momentum in the region of z/lms < 1.0 (z is the vertical distance to the jet orifice and lms is the length scale having relationship with initial momentum and buoyancy flux of jets, later defined in Equation (2)) [6]. It was found that the densimetric Froude number has significant effect on the mean velocity decay of buoyant jets [7,8]. The turbulence intensity of buoyant jet enhances with the increasing of Richardson number Ri which is the ratio of jet buoyancy and jet kinetic energy [9]. Davis et al. [10] conducted an experiment to determine the dilution characteristics of single and multiple buoyant jets in still water. The results showed that increase in the number of ports for buoyant discharges might lead to a lower dilution. The penetration and dilution properties of vertical negatively buoyant thermal jets were also discussed by Ahmad et al. [11]. They found large fluctuations of jet penetration in the vertical direction, smaller fluctuations of jet penetration in the horizontal direction and a maximum horizontal penetration of the return flow.
For the buoyant jets under cross-flow-only environment, they have been intensively studied primarily by using the experimental method and the integral model prediction. The basic physical processes for a submerged turbulent buoyant jet in cross-flow-only environment can be divided into four primary stages, namely, the zone of flow establishment, the stage of jet, the stage of intermediate, and the stage of plume [12]. As for the multiple jets, the penetration of leading jet in the cross-flow was found to be comparable to that of the single jet in the near field [13], indicating that it is independent of the sequential rear jets. The leading jet has a sheltering effect on the rear jets, which leads to a smaller bending degree and a deeper penetration for these rear jets [14,15]. The shielding effect of the leading jet will decline with the increase of adjacent jet spacing [15]. The trajectory of rear jet was found to be influenced by the leading jet as it restricts the cross-flow, and the trajectories of all the jets, downstream of the leading jet, are found to be similar [16]. Different discharge configurations of jets have also been investigated and dilution for inclined buoyant jets discharged into cross-flow was found to be lower than that for vertical jets. It was explained that buoyant jets discharged vertically are controlled by buoyancy whilst that discharged horizontally in the co-flowing current environment are controlled by momentum [17,18,19,20,21]. As the cross-flow velocity increases, the buoyant jets bend more; and increase in the buoyancy force results into a reduction of the cross-flow velocity rate [22].
In the wave-only environment, the studies were mainly focused on the single jet and many significant results have been achieved. The dilution rate of buoyant jet can be significantly enhanced by the wave motion. The surface diffusion rate is also significantly higher than that in an environment with no waves [23,24,25,26]. A theoretical Lagrangian model that is potentially capable of describing this additional wave-induced mixing was developed [27]. The wave-induced oscillatory motion makes the jet bifurcate and this phenomenon directly leads to changes in the rate of dilution [28,29,30]. The jet discharged into a regular wave field was studied by Mossa and Davies [31] and different regions of the jet-wave field were found in the study. The jet centerline velocity was found to decay faster. The turbulence intensity, the Reynolds stress, and the jet width increase significantly as the incident wave height increases, while the wave phase has little effect on the jet centerline velocity decay. The wave-to-jet momentum ratio is the most important parameter to characterize the wave effect on jet diffusion [32,33,34].
In conclusion, it is evident that the buoyant jet has been studied by many researchers over the years. Since 2016, the authors [35,36,37] have focused on the behaviors of a single non-buoyant jet in the wavy cross-flow environment and quantized the effect of surface waves on jet discharge. Nevertheless, the knowledge of buoyant jets in the wavy cross-flow environment is still limited, especially for the multiple buoyant jets. In reality, industrial sewage is discharged through multiport diffusers beneath the water surface into the coastal waters predominated by oceanographic influences such as wave action, currents, and density gradients. Hence, understanding the physical processes underpinning the dilution of buoyant fluids in the coexisting wave and current environment is critical to the design of discharge facilities. As a preliminary stage, we simplified the problem by simulating the multiport diffusers with twin buoyant jets and focused on the jet movement in the wavy cross-flow environment. The particle image velocimetry (PIV) system was employed to measure the velocity field of the twin buoyant jet flow and to explore the physics governing the movement of the twin buoyant jets; meanwhile, the dimensional analysis approach was applied to empirically formularize the trajectory of jets.
2. Materials and Methods
2.1. Experimental Setup
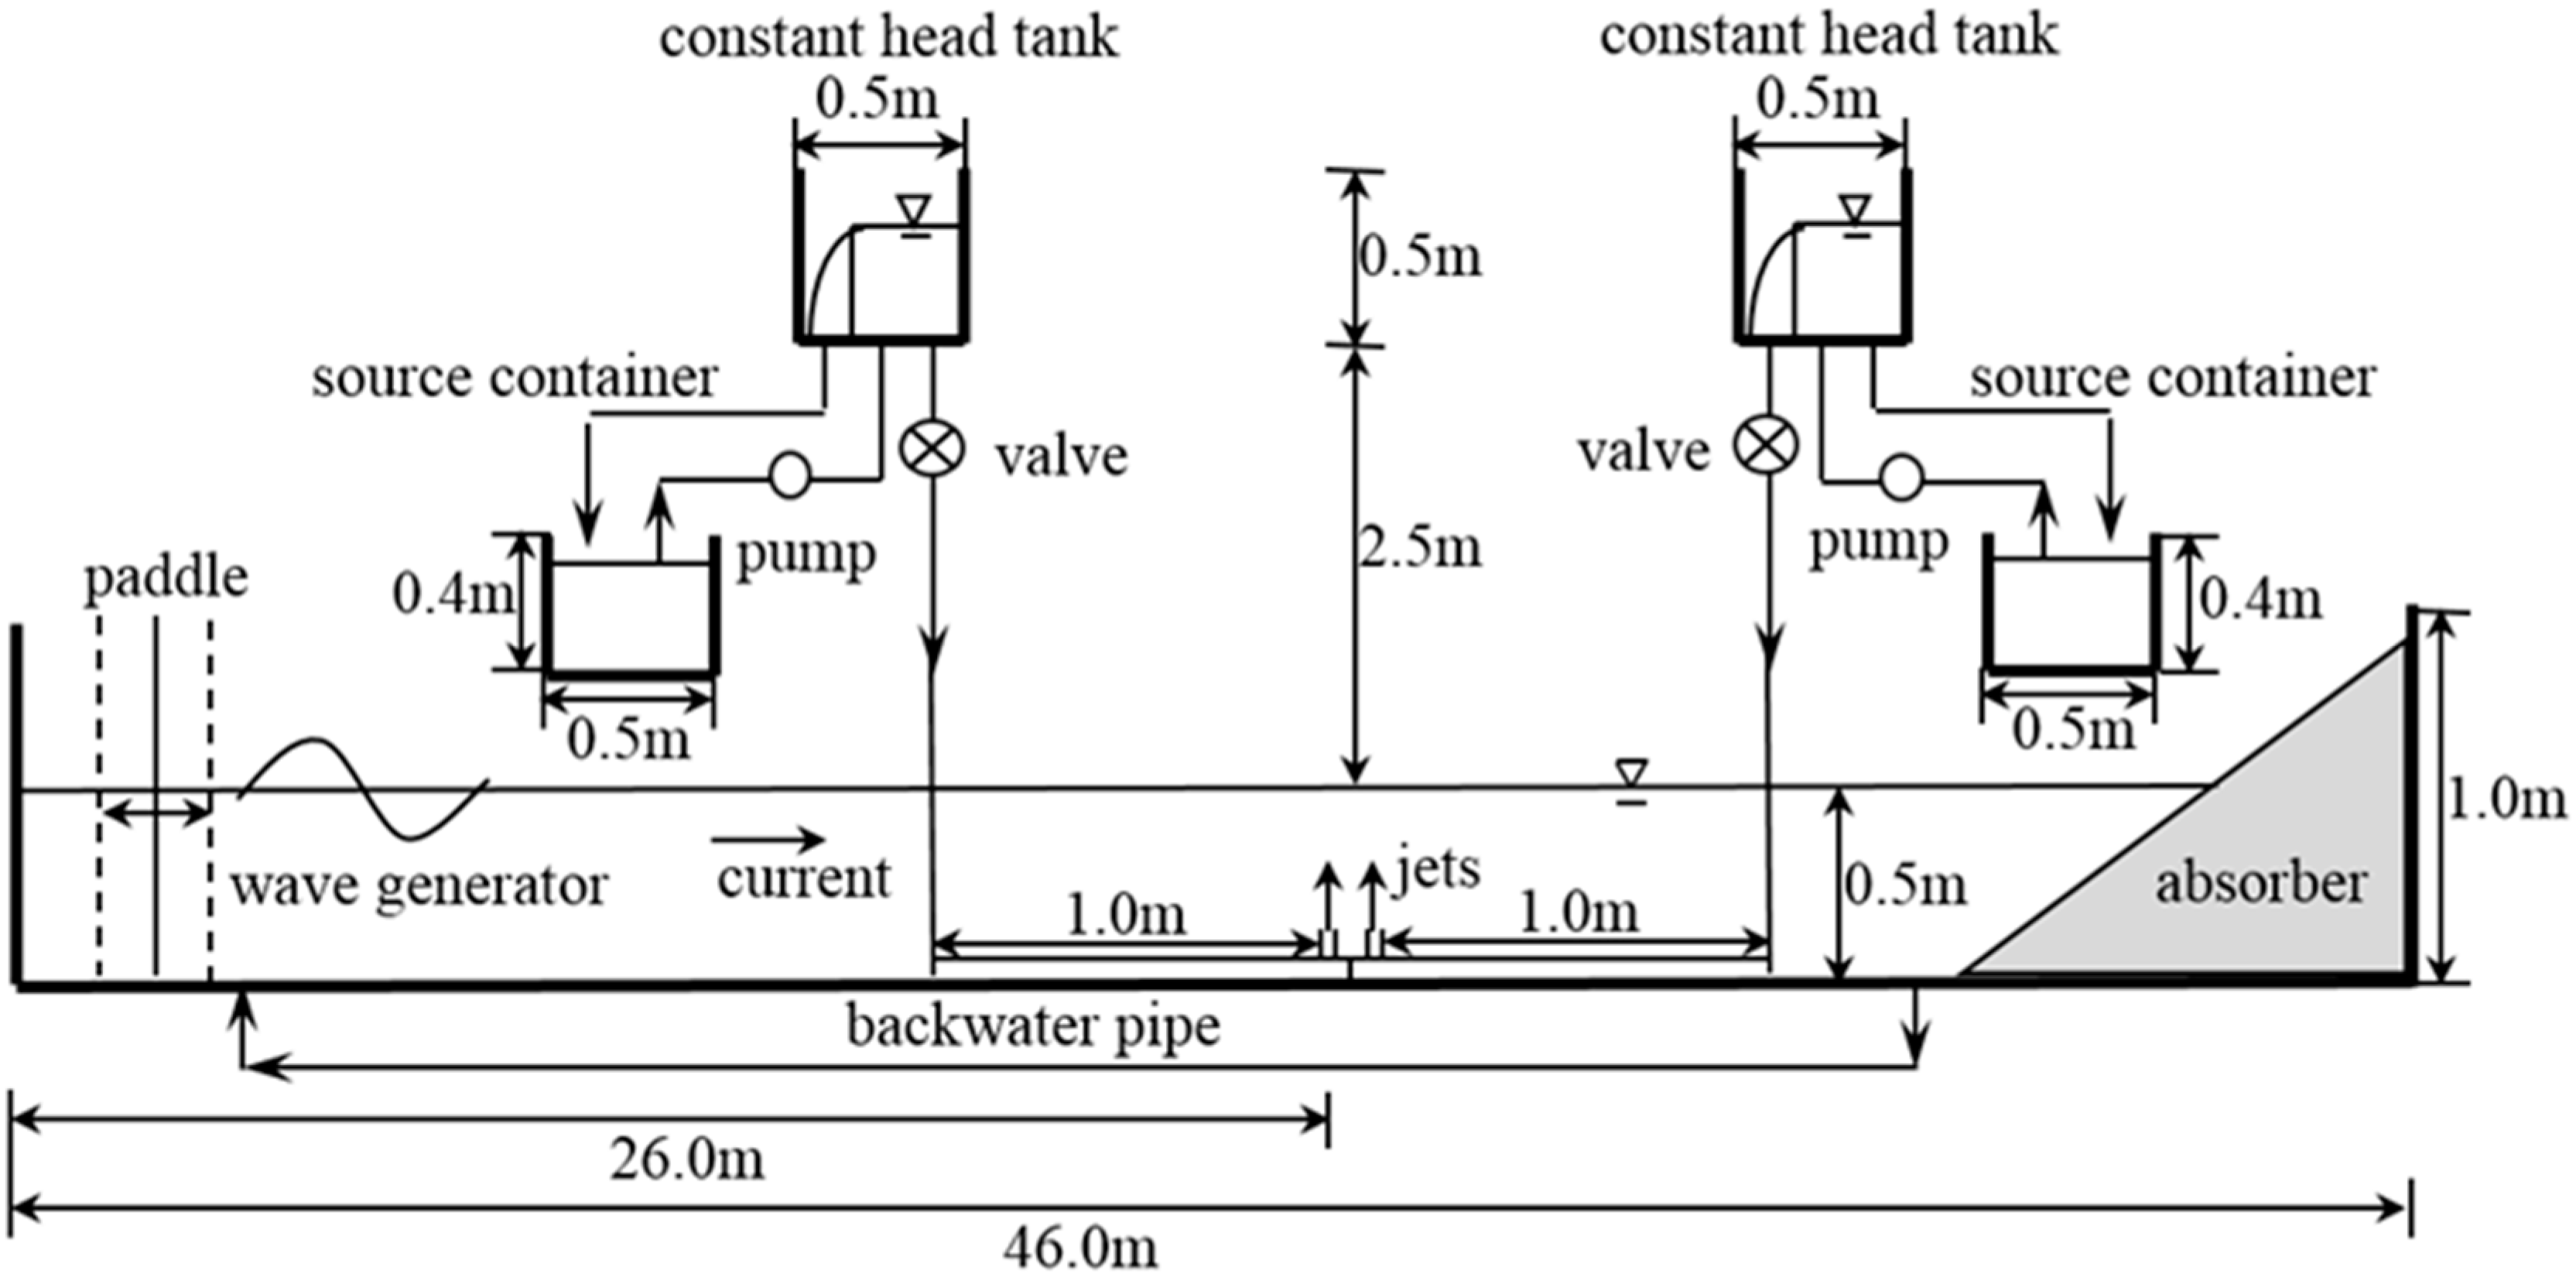
The physical experiments were carried out in a co-directional wave and current flume at the laboratory of the College of Harbor, Coastal and Offshore Engineering, Hohai University. The sketch of experimental setup is illustrated in Figure 1. The wave–current flume has the dimensions of 46.0 m in length and 0.5 m in width and 1.0 m in depth. A computer-controlled wave maker was located at one end of the flume to generate the waves, and an artificial slope was located at the other end to absorb and dissipate the incident wave energy. A group of flow pumps and a V-notch weir were separately settled at the two ends of the flume to generate the current.
The jet generator system consisted of two constant head tanks, two flow meters with valves, and two vertical round jet tubes, as shown in Figure 1. The flow meters were used to control and monitor the discharge volume of the buoyant jets. By adjusting the valve, jet flows with different initial velocities were generated. The side-looking Acoustic Doppler Velocimetry (ADV) was used to monitor the jet initial velocity. The difference of velocity between two jets was less than 3.0%. For all the experiments, the jet orifice, with a diameter of 1 cm, was located 10 cm vertically above the bottom. The twin jets were separated by a center-to-center spacing of 3 cm. Buoyancy was generated by adding industrial alcohol with a 99% purity and a density of 0.791 g/cm3 to the jet solution to make the jet density smaller than the density of the environment.
2.2. PIV Measurements
The PIV system (Figure 2) was used to measure the flow field on the symmetrical plane of the twin buoyant jets in various cross-flow-only and wavy cross-flow environments. The PIV used in this study included a dual-head pulsed laser, laser light sheet optics, a CCD camera, and a synchronizer. The dual-head pulsed laser is a Nd:YAG laser that has a 15Hz repetition rate and a 380 mJ maximum pulse energy output. The PIV images were recorded using a 14-bit CCD camera with a 2048 × 2048 pixel resolution and a 15 frames per second (fps) maximum framing rate.
The shooting frequency of the PIV velocity field was set to 7.25 Hz, and for each experimental group, 290 pairs of PIV images were collected for calculating the velocity field of twin buoyant jets within 40 s. The time interval between the image pair of each single PIV measurement was determined by following the suggestion of Keane and Adrian [38]. The velocity field was measured with a big field of view (FOV1) (−5.0 cm < x < 27.0 cm; −1 cm < z < 31 cm) and a small field of view (FOV2) (−3.0 cm < x < 13.0 cm; −0.5 cm < z < 15.5 cm), as shown in Figure 3. The positive direction of the x-axis was horizontally aligned with the cross-flow direction and the positive direction of the z-axis was vertically upward. This coordinate system was used unless otherwise specified.
The image processing was conducted by using the Insight 4G software supported by TSI. Before the cross-correlation algorithm, the image quality was enhanced by applying a Gaussian filter. Then, each image pair was correlated with interrogation windows of 32 × 32 pixels and 50% overlap between adjacent windows. Fast Fourier transform (FFT) and a Gaussian-peak-finding algorithm were employed in the process. As a result, the spatial resolutions of velocity vectors in two FOVs are of 1.4 mm and 2.8 mm, respectively. Finally, a median filter using the eight neighboring vectors surrounding the vector of interest was applied to identify and remove the spurious vectors. Removed vectors were replaced by interpolation.
By using the method described in Prasad et al. [39], the bias and random errors in the PIV measurement were estimated as less than 2.5%, which is tolerable for the mean velocity calculation. In this study, we also compared the mean velocity values obtained from 20 wave cycles and those from 30 wave cycles. The maximum difference was less than 1.5%.
2.3. Experimental Cases
In order to fully consider the combination of buoyant jet and the ambient water, the jet initial flow flux Q0 of the selected cases of twin buoyant jets were 300 L/h, 250 L/h, and 200 L/h. The corresponding initial velocities w0 were 1.06 m/s, 0.88 m/s, and 0.70 m/s, respectively. An alcohol volume fraction of 5% was used to induce the buoyancy of the jet. That was 5 L of alcohol mixed with 100 L of tap water and their corresponding density differences were 0.73%. The ambient water in the flume has a density (ρ0) of 1.0 g/cm3. The cross-flow velocity uc was set at 0.08 m/s throughout the experiments. The wave periods were 1.0 s and 1.5 s and the wave heights were 2 cm and 4 cm. This study also considered the experimental conditions of twin buoyant jets in the cross-flow-only environment for comparison. The jet-to-current velocity ratio Rjc, wave-to-current velocity ratio Rwc, and the Strouhal number St were expressed according to Xu et al. [35], shown as follows:
where uw is the maximum wave-induced horizontal velocity at the jet orifice. The jet-to-current velocity ratio Rjc of all the experimental conditions was between 8~14, the wave-to-current velocity ratio Rwc was between 0.17~0.63, and the Strouhal number St was between 0.063~0.125. The details of experimental parameters are shown in Table 1.
To examine the reliability of the experimental setup, two cases of single buoyant jet in still water were also conducted, shown in Table 2.
3. Results and Discussion
3.1. Single Buoyant Jet in Stagnant Water
The time-averaged flow characteristics, including the centerline velocity and half-width, of the single buoyant jet in stagnant water were first examined. They are dependent on the initial jet velocity w0, the initial momentum flux M0, the initial buoyancy flux B0, and the vertical distance from the jet orifice z. The initial momentum flux M0 and initial buoyancy flux B0 can be defined as:
where d is the inner diameter of the jet orifice (i.e., 1 cm), Q0 is the jet initial flow flux, and g is acceleration due to gravity (i.e., 9.81 m/s2).
The characteristic length scale lms for the buoyant jet in still water can be defined as:
Figure 4a shows centerline velocity decay along the jet axis and Figure 4b shows the half-width of the single buoyant jet in still water. The measured data were compared with theoretical results of Papanicolaou and List [6]. It can be seen from the comparison results that the data measured in this experiment were consistent with the classical theoretical curve, which indicates that the velocity field of the buoyant jet can be obtained accurately. This agreement does not only confirm the reliability of the PIV measurement techniques but also demonstrate that the experimental jet flow can be accurately controlled.
3.2. Phase-Averaged Flow Structure
The phase-averaged flow structure was examined by analysis of the vertical velocity distribution of twin buoyant jets. It has subtracted the wave-induced vertical velocity, which was calculated by using the linear wave theory. Case A3 was taken as an example to present the periodic motion of jets in a wave cycle, shown in Figure 5. The wave crest phase means the time when the wave crest passes through the orifice of leading jet, as the other phases do. The most distinctive feature is the phenomenon of effluent clouds located at the upper part of jet body, which is similar to those in a single non-buoyant jet in the wave and current coexisting environment [35]. The characteristics related to the effluent clouds are discussed as follows.
At the wave crest phase (see Figure 5a), the wave-induced horizontal velocity reaches the maximum and has the same direction with the cross-flow. This results in a maximum horizontal velocity of the flow in one wave cycle. Therefore, the twin jets get largest deflection along the current and the penetration is the lowest. During the duration from the wave crest phase to the down-zero crossing phase (see Figure 5b), the wave-induced horizontal velocity decreases but is still in the cross-flow direction. As a result, the jet body is in a low position even though the deflection degree of jets is decreasing. After the down-zero crossing phase, the wave-induced horizontal velocity changes direction and starts to increase. At the wave trough phase (see Figure 5c), the wave–current flow reaches the minimum horizontal velocity and the deflection of jets is the smallest. From the wave trough phase to the up-zero crossing phase (see Figure 5d), the jets keep penetrating as an effluent cloud and get a higher position, while their transport distance to the downstream is quite short due to the relatively small horizontal velocity of the flow. From the up-zero crossing phase to the next wave crest phase, the downstream transport distance of the effluent cloud is more significant compared with that in the last quarter-cycle. It can be found that the effluent cloud is discharged in the duration from the down-zero crossing phase to the wave trough phase and then to the up-zero crossing phase. Correspondingly, the lower part of jet body (called as the original part) is discharged in the duration from the up-zero crossing phase to the wave crest phase and then to the down-zero crossing phase.
Under the combined effect of wave and current, the transport of vertical momentum of twin jets branches out into two columns, as shown in Figure 5. One forms the effluent cloud and the other forms the original part. It should be noted that the vertical momentum in both columns decreases gradually when moving to the downstream. Actually, the wave-induced oscillating in the vertical direction could also drive the up-and-down motion of the effluent cloud and the original part, despite that it is not as significant as the motion in the horizontal direction. One evidence is the notable holistic upward movement of the original part from the wave trough phase to the up-zero crossing phase and then to the wave crest phase, when the wave-induced vertical velocity is upward and relatively large.
It can be seen that the leading jet has a shielding effect on the rear jet at each wave phase. The levels of the shielding effect might be distinguished at different wave phases. The leading jet has a larger deflection than the rear jet; meanwhile, the vertical momentum decays faster for the leading jet owing to a stronger interaction with the surrounding wave–current flow. In the process of moving upward, the leading jet becomes closer and closer to the rear jet and finally they merge with each other. Before the merging, the two jets approach each other due to the Coanda effect, which is a typical characteristic of jet–wall or jet–jet interaction [40]. The Coanda effect could be found clearly at the wave trough phase of each case shown in Figure 6.
Figure 6 shows the phase-averaged vertical velocity distributions of the jet in Cases A2, A4, B3, and C3 at the wave trough phase. By comparing them with that in Case A3, the effects of the Strouhal number, the wave-to-current ratio and the jet-to-current ratio were investigated.
For Cases A2 and A3, the main difference regarding to the parameters is the Strouhal number. It leads to the difference of spacing between two adjacent effluent clouds in these two cases (see Figure 5c and Figure 6a). The spacing between two adjacent effluent clouds is 8d in Case A2 while it is 12d in Case A3. This spacing could be estimated as the product of the time-averaged cross-flow velocity and the wave period. Some fresh water fills the gap between two effluent clouds and could be considered as a part of jets. The fresh water interacts with the effluent clouds and shares the vertical momentum with the effluent clouds. Hence, the mean momentum of effluent cloud part in Case A2 is higher than that in Case A3.
The spacing between two adjacent effluent clouds is the same in Cases A3 and A4, because the Strouhal number of each case is 0.083. However, the deflection of jets in Case A3 is larger than that in Case A4 due to a smaller wave-to-current ratio in Case A3 (see Figure 5c and Figure 6b). Moreover, the vertical momentum of effluent cloud in Case A4 is larger than that in Case A3. Considering that the initial momentum of jets in these two cases is the same, it is concluded that the vertical momentum of effluent cloud increases with the wave-to-current ratio increase. Meanwhile, the vertical momentum of original jet part decreases with the wave-to-current ratio increase.
As shown in Figure 5c, Figure 6c,d, the effluent cloud in each case has a commensurable proportion of vertical momentum considering their different initial momentums of jets. It is found that the jets have higher penetration with a larger jet-to-current velocity ratio. Hence, the effluent cloud could reach a higher location as well.
3.3. Mean Flow Structure
The comparison of time-averaged flow fields of twin buoyant jets in different environments is shown in Figure 7, where the red vector denotes that in cross-flow-only environment and the blue vector denotes that in the wavy cross-flow environment. In general, the bending of jet in the wavy cross-flow environment is stronger, indicating that the oscillation of wave effect introduced an additional momentum to the jet bending processes, resulting in the jet having a more significant bend-over towards the flume bottom. When the wave effect is strong enough (see Figure 7c,d), there exist blue vectors that have a smaller deflection than corresponding red ones at the downstream locations with some distance from the jet orifices, as marked using the black square. Those vectors below the black square are marked using the green square as a contrast. It is related to the distinctive effluent clouds which carry part of the vertical momentum. If the wave effect is stronger, more vertical momentum will be distributed to the effluent clouds. It will further affect the time-averaged velocity distribution of twin buoyant jets.
Figure 8 shows the time-averaged vertical velocity distributions of the jets in Cases A0–A5. In no wave cases (see Figure 8a), there are two peaks for the vertical velocity on some downstream locations, i.e., x/d = 10–15. If the wave effect is weak, for instance, Rwc = 0.17 in Case A1, the change of vertical velocity distribution will be insignificant. The two-peak feature of vertical velocity distribution on downstream locations will be modified as the wave-to-current ratio keeps increasing (see Figure 8c,d,f). One of the peaks will be the domination peak and it has a strong relationship with the Strouhal number. Qualitatively, a larger Strouhal number results in the increasing of upper peak, for instance, Case A2. If the wave effect is very strong, for instance, Rwc = 0.63 in Case A4, the change of vertical velocity distribution will be drastic. Similar results are found in Case B0–B5 and in Cases C0–C5. It is not shown here for the sake of briefness.
It was found that the wave-to-current ratio is a key parameter that dominates the vertical velocity distribution of twin buoyant jets in the wave and cross-flow environment, despite that the Strouhal number also has an effect. The wave-to-current ratio determines the proportion of vertical momentum carried by the effluent clouds which could drive the upper part of jets moving upwards.
3.4. Dimensional Analysis
The problem of twin buoyant jets in the wave and cross-flow environment is quite complex, which involves four kinds of driving forces, i.e., wave, current, buoyancy and the jet itself. Dimensional analysis is a commonly used in such a problem to get a better understanding on the interaction of these dynamics. Moreover, the dimensional analysis could form a combined parameter to describe the effects of different driving forces on the jet movement.
For twin buoyant jets discharged vertically into the wavy cross-flow environment, the behaviors of jets are characterized by several variables such as the jet initial velocity w0, the jet initial density ρ0, the inner diameter of the orifice d, the height of the jet orifice from the bottom h0, the water depth h, the cross-flow velocity uc, the density of the ambient fluid ρa, the wave period T and the wave height H. The variable V describing the characteristic of jet movement (e.g., the jet trajectory) can be expressed as a function:
The above function contains too many variables. The combination of characteristic parameters can simplify the function. By using the jet initial momentum flux M0 and the jet initial buoyancy flux B0, the function of variable V can be expressed as follows:
Following the linear wave theory, the horizontal velocity u and the vertical velocity v of the wave at any point (x, z) of the experimental coordinate system in the fluid can be expressed by:
where σ is the angular frequency of wave, h0 is the distance from the jet orifice to bottom of flume (i.e., 10 cm), and k is the wave number.
As shown in Figure 5, the twin buoyant jets in the wavy cross-flow environment are deflected by the current, and simultaneously, the jets sway back and forth due to the wave-induced oscillating flow. This implies that the jets are affected by both the current flow and the wave flow. Hence, the characteristic velocity of such a flow should combine the effects of current and wave. In this study, the characteristic velocity uch can be used to characterize the combined effect of the wave velocity and the current velocity. It is defined as:
where
The dimension of M0 is L4·T−2, and the dimension of B0 is L4·T−3. The dimension of uch is L·T−1. According to the principle of dimensional uniformity, we can propose a new characteristic length scale lmb for the twin buoyant jets in the wavy cross-flow environment:
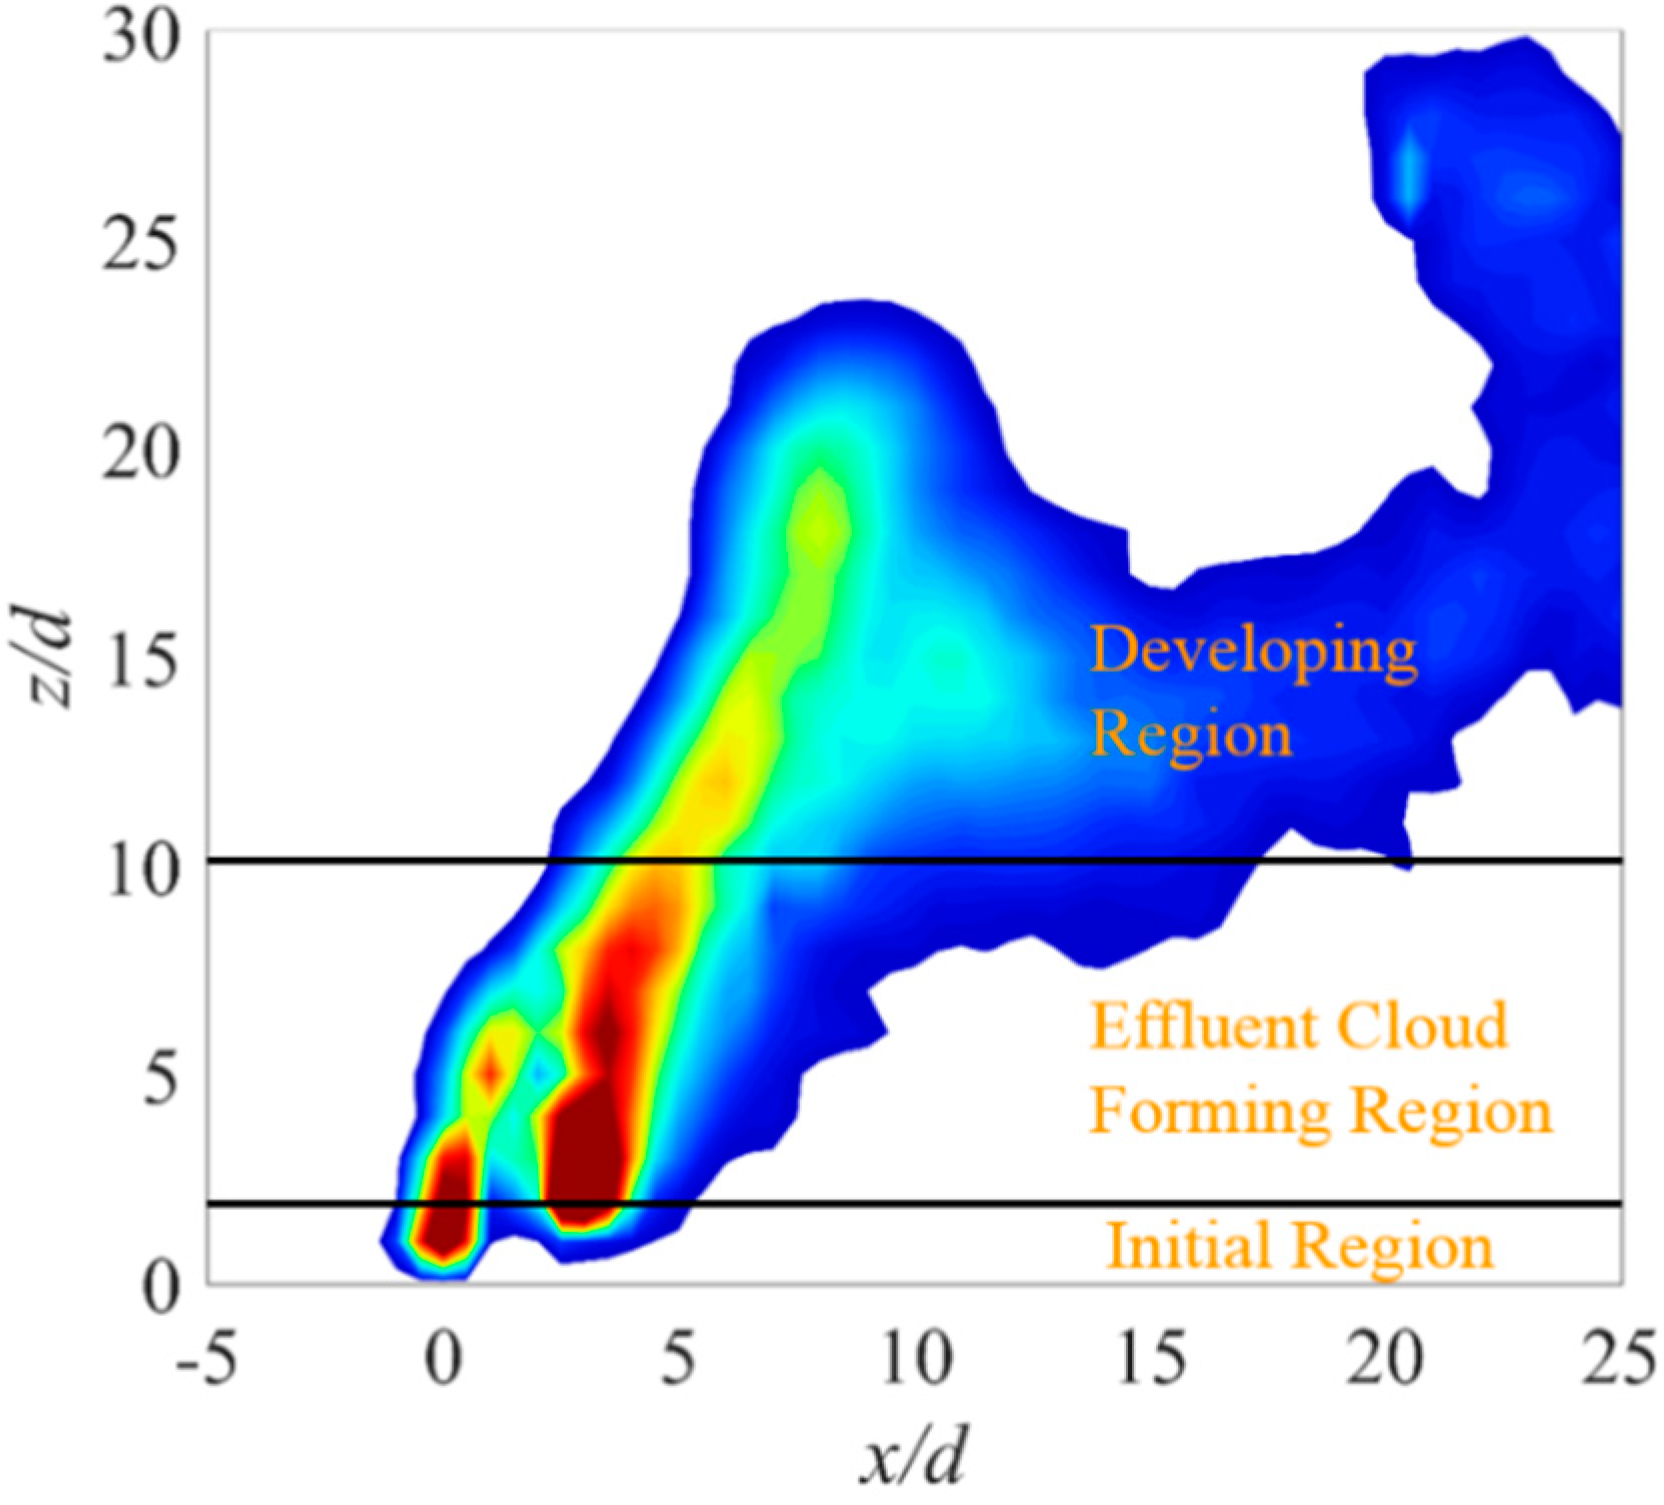
It represents the relative strength of the twin buoyant jets and the wave–current flow. For z < lmb, the jet velocity induced by the momentum and buoyancy is significantly larger than the velocity of the wave–current flow. Thus, the mixing in this region is similar to that of buoyant jets in still water. For z > lmb, there are two stages. The first is that the jet body sways back and forth due to the wave-induced oscillating flow and the effluent cloud emerges. The second is that the formed effluent cloud and the original part of jets develop and move toward downstream, under the effect of the wave–current flow. Hence, the near field of twin buoyant jets in the wave and current environment could be divided into three regions, namely the initial region, effluent cloud-forming region and the developing region. The sketch of three regions is illustrated in Figure 9.
Using the length scale lmb, the function of variable V can be expressed as follows:
3.5. Empirical Formula of Trajectory
The trajectory of jets is a very important indicator to characterize the motion for jets in cross-flow-only and wavy cross-flow environments. Previous researchers used different definitions in the analysis of jet trajectories, i.e., the centerline of maximum concentration points, the centerline of maximum velocity points and the streamline emanating from the center of the jet exit [41]. As illustrated in Figure 8, the vertical velocity distribution on the downstream location might have two peaks and the positions of the two peaks are mutable. Hence, the streamline emanating from the center of the rear jet exit is chosen as the jet trajectories under the wavy cross-flow environment.
Figure 10 shows the effects of dimensionless parameters on the trajectories of twin buoyant jets in the wave and current environment. It is found that the wave-to-current velocity ratio and the jet-to-current velocity ratio have significant influence on the trajectories while the effect of Strouhal number could be neglected. The trajectory will be higher if the jet-to-current velocity ratio is larger. Moreover, the trajectory gets lower with the increasing of wave-to-current velocity ratio.
Then, the variable on each axis in Figure 10 is multiplied by the dimensionless parameter d/lmb. It yields Figure 11, in which the coordinate system is changed to the logarithmic form. It is found that the length scale lmb can accurately represent the influence of both Rjc and Rwc on the trajectories. Using the least-square fitting method, the equation for the trajectories of twin buoyant jets in the wave and current environment is expressed as:
and it is illustrated in Figure 12. The 95% confidence bounds of free coefficients are (4.38, 4.43) and (0.45, 0.48), respectively.
4. Conclusions
A series of physical experiments have been carried out to investigate the characteristic behaviors of the twin buoyant jets vertically discharged into the wavy cross-flow environment. The conclusions are made as follows:
(1) With the combined effects of wave and current, the distinctive “effluent cloud” phenomenon was clearly observed in the twin buoyant jets in the wavy cross-flow environment. As a result, the transport of vertical momentum of twin jets branches out into two columns, namely one forming the effluent cloud and the other forming the original part.
(2) The leading jet has a shielding effect on the rear jet at each wave phase. The levels of the shielding effect vary at different wave phases. It leads to that the leading jet has a larger deflection than the rear jet, and meanwhile the vertical momentum decays faster for the leading jet. In the process of moving upward, the leading jet and the rear jet gradually merge with each other with a so-called Coanda effect.
(3) The vertical momentum of effluent cloud increases with the wave-to-current ratio Rwc increase. The spacing between two adjacent effluent clouds has strong relationship with the Strouhal number St. The jets have higher penetration with a larger jet-to-current velocity ratio Rjc. Compared with the Strouhal number St, the wave-to-current velocity ratio Rwc is more important for effluent discharge.
(4) A new characteristic velocity uch and the corresponding characteristic length scale lmb for both cross-flow-only and wavy cross-flow environments are defined. Based on the characteristic length scale lmb, the near field of twin buoyant jets in the wave and current environment could be divided into three regions, namely the initial region, effluent cloud forming region and the developing region.
(5) The trajectory of twin buoyant jets in the wavy cross-flow environment is significantly subjected by the wave-to-current velocity ratio Rwc and the jet-to-current velocity ratio Rjc. By curve-fitting, a new equation for the trajectory is derived.
Further research should focus on the three-dimensional flow structure and concentration field of twin buoyant jets in the wavy cross-flow environment. The effect of jet spacing should also be studied in detail for the future work.
Author Contributions
Z.X. and E.O. conceived, designed and performed the experiments; all authors contributed to analysis of the data, writing of the paper, and discussions of the manuscript.
Funding
This work was partly supported by the National Natural Science Foundation of China (grant number 51709078) and the Natural Science Foundation of Jiangsu Province [grant number BK20170882].
Conflicts of Interest
The authors declare no conflicts of interest.
References
- Roberts, D.A.; Johnston, E.L.; Knott, N.A. Impacts of desalination plant discharges on the marine environment: A critical review of published studies. Water Res. 2010, 44, 5117–5128. [Google Scholar] [CrossRef] [PubMed]
- Binelli, A.; Magni, S.; Torre, C.D.; Parolini, M. Science of the total environment toxicity decrease in urban wastewaters treated by a new bio filtration process. Sci. Total Environ. 2015, 537, 235–242. [Google Scholar] [CrossRef] [PubMed]
- Mennaa, F.Z.; Arbib, Z.; Perales, J.A. Urban wastewater treatment by seven species of microalgae and an algal bloom: Biomass production, N and P removal kinetics and harvestability. Water Res. 2015, 83, 42–51. [Google Scholar] [CrossRef] [PubMed]
- Zhou, G.Y.; Liu, C.B.; Chu, L.; Tang, Y.H.; Luo, S.L. Rapid and efficient treatment of wastewater with high-concentration heavy metals using a new type of hydrogel-based adsorption process. Bioresour. Technol. 2016, 219, 451–457. [Google Scholar] [CrossRef] [PubMed]
- Fan, L. Turbulent Buoyant Jets into Stratified or Flowing Ambient Fluids; California Institute of Technology: Pasadena, CA, USA, 1967. [Google Scholar]
- Papanicolaou, P.N.; List, E.J. Investigations of round vertical turbulent buoyant jets. J. Fluid Mech. 1988, 195, 341–391. [Google Scholar] [CrossRef]
- Jiang, M.T.; Law, A.W.K.; Lai, A.C.H. Turbulence characteristics of 45° inclined dense jets. Environ. Fluid Mech. 2018, 1–28. [Google Scholar] [CrossRef]
- Shao, D.; Huang, D.; Jiang, B.; Law, A.W.K. Flow patterns and mixing characteristics of horizontal buoyant jets at low and moderate Reynolds numbers. Int. J. Heat Mass Trans. 2017, 105, 831–846. [Google Scholar] [CrossRef]
- Kotsovinos, N.E. A Study of the Entrainment and Turbulence in a Plane Buoyant Jet; University of California: Berkeley, CA, USA, 1975. [Google Scholar]
- Davis, R.M.A.; Siegel, L.; Shirazi, D. Measurement of buoyant jet entrainment from single and multiple sources. J. Heat Transf. 2010, 100, 442–447. [Google Scholar] [CrossRef]
- Ahmad, N.; Baddour, R.E.; Asce, M. Dilution and penetration of vertical negatively buoyant thermal jets. J. Hydraul. Eng. 2012, 138, 850–857. [Google Scholar] [CrossRef]
- Chen, H. Turbulent Buoyant Jets and Plumes in Flowing Ambient Environments; University of Aalborg: Aalborg, Denmark, 1991. [Google Scholar]
- Gutmark, E.J.; Ibrahim, I.M.; Murugappan, S. Dynamics of single and twin circular jets in cross flow. Exp. Fluids 2011, 50, 653–663. [Google Scholar] [CrossRef]
- Yu, D.; Ali, M.S.; Lee, J.H.W. Multiple tandem jets in cross-flow. J. Hydraul. Eng. 2006, 132, 971–982. [Google Scholar] [CrossRef]
- Li, Z.W.; Huai, W.X.; Qian, Z.D. Study on the flow field and concentration characteristics of the multiple tandem jets in crossflow. Sci. China Technol. Sci. 2012, 55, 2778–2788. [Google Scholar] [CrossRef]
- Ziegler, H.; Wooler, P.T. Multiple jets exhausting into a crossflow. J. Aircr. 1971, 8, 414–420. [Google Scholar] [CrossRef]
- Makihata, T.; Miyai, Y. Trajectories of single and double jets injected into a crossflow of arbitrary velocity distribution. J. Fluids Eng. 1979, 101, 217–223. [Google Scholar] [CrossRef]
- Roberts, P. Inclined dense jets in flowing current. J. Hydraul. Eng. 1987, 113, 323–340. [Google Scholar] [CrossRef]
- Lee, J.H.W. Note on Ayoub’s data of horizontal round buoyant jet in current. J. Hydraul. Eng. 1989, 115, 969–975. [Google Scholar] [CrossRef]
- Ben Meftah, M.; Malcangio, D.; De Serio, F.; Mossa, M. Vertical dense jet in flowing current. Environ. Fluid Mech. 2017, 18, 75–96. [Google Scholar] [CrossRef]
- Malcangio, D.; Ben Meftah, M.; Chiaia, G.; De Serio, F.; Mossa, M.; Petrillo, A.F. Experimental studies on vertical dense jets in a crossflow. In Proceedings of the River Flow 2016, St. Louis, MO, USA, 12–15 July 2016; pp. 890–897. [Google Scholar]
- Keramaris, E.; Pechlivanidis, G. The behaviour of a turbulent buoyant jet into flowing environment. Procedia Eng. 2016, 162, 120–127. [Google Scholar] [CrossRef]
- Chen, Y.L.; Hsiao, S.C. Numerical modeling of a buoyant round jet under regular waves. Ocean Eng. 2018, 161, 154–167. [Google Scholar] [CrossRef]
- Ger, A.M. Wave effects on submerged buoyant jets. In Proceedings of the 18th IAHR, Cagliari, Italy, 10–14 September 1979; pp. 295–300. [Google Scholar]
- Sharp, J.J. The effects of waves on buoyant jets. Proc. Inst. Civ. Eng. Part 2 1986, 81, 471–475. [Google Scholar]
- Chin, D.A. Influence of surface waves on outfall dilution. J. Hydraul. Eng. 1987, 113, 1006–1018. [Google Scholar] [CrossRef]
- Chin, D.A. Model of buoyant jet-surface-wave interaction. J. Waterw. Port Coast. Ocean Eng. 1988, 114, 331–345. [Google Scholar] [CrossRef]
- Kwan, K.H.; Swan, C. Near-field measurements of a buoyant jet in waves and currents. In Proceedings of the 25th Conference on Coastal Engineering, Orlando, FL, USA, 2–6 September 1996; pp. 4569–4582. [Google Scholar]
- Mori, N.; Chang, K.A. Experimental study of a horizontal jet in a wavy environment. J. Eng. Mech. 2003, 129, 1149–1155. [Google Scholar] [CrossRef]
- Ferrari, S.; Badas, M.G.; Querzoli, G. On the effect of regular waves on inclined negatively buoyant jets. Water 2018, 10, 726. [Google Scholar] [CrossRef]
- Mossa, M.; Davies, P.A. Some aspects of turbulent mixing of jets in the marine environment. Water 2018, 10, 522. [Google Scholar] [CrossRef]
- Ryu, Y.; Chang, K.A.; Mori, N. Dispersion of neutrally buoyant horizontal round jet in wave environment. J. Hydraul. Eng. 2005, 131, 1088–1097. [Google Scholar] [CrossRef]
- Chang, K.A.; Ryu, Y.; Mori, N. Parameterization of neutrally buoyant horizontal round jet in wave environment. J. Waterw. Port Coast. Ocean Eng. 2009, 135, 100–107. [Google Scholar] [CrossRef]
- Hsiao, S.C.; Hsu, T.W.; Lin, J.F.; Chang, K.A. Mean and turbulence properties of a neutrally buoyant round jet in a wave environment. J. Waterw. Port Coast. Ocean Eng. 2011, 137, 109–122. [Google Scholar] [CrossRef]
- Xu, Z.S.; Chen, Y.P.; Tao, J.F.; Pan, Y.; Sowa, D.M.A.; Li, C.W. Three-dimensional flow structure of a non-buoyant jet in a wave-current coexisting environment. Ocean. Eng. 2016, 116, 42–54. [Google Scholar] [CrossRef]
- Xu, Z.S.; Chen, Y.P.; Wang, Y.N.; Zhang, C.K. Near-field dilution of a turbulent jet discharged into coastal waters: Effect of regular waves. Ocean Eng. 2017, 140, 29–42. [Google Scholar] [CrossRef]
- Xu, Z.S.; Chen, Y.P.; Pan, Y. Initial dilution equations for wastewater discharge: Example of non-buoyant jet in wave-following-current environment. Ocean Eng. 2018, 164, 139–147. [Google Scholar] [CrossRef]
- Keane, R.; Adrian, R.J. Optimization of particle image velocimeters. Part I: Double plused system. Meas. Sci. Technol. 1990, 1, 1202–1215. [Google Scholar] [CrossRef]
- Prasad, A.K.; Adrian, R.J.; Landreth, C.C.; Offutt, P.W. Effect of resolution on the speed and accuracy of particle image velocimetry interrogations. Exp. Fluids 1992, 13, 105–116. [Google Scholar] [CrossRef]
- Oshima, Y.; Kinoshita, O. Coanda Effect of Water Jet. Trans. Soc. Instrum. Control Eng. 2009, 11, 491–496. [Google Scholar]
- Su, L.K.; Mungal, M.G. Simultaneous measurements of scalar and velocity field evolution in turbulent crossflowing jets. J. Fluid Mech. 2004, 513, 1–45. [Google Scholar] [CrossRef]
Figure 1.
Sketch of the experimental setup.

Figure 2.
PIV system.

Figure 3.
Sketch of two FOVs.

Figure 4.
(a) Centerline velocity wc decay along the axis, and (b) half-width bw of single buoyant jet in still water.
Figure 4.
(a) Centerline velocity wc decay along the axis, and (b) half-width bw of single buoyant jet in still water.


Figure 5.
Phase-averaged vertical velocity distributions of the jet in Case A3 at four typical wave phases: (a) t/T = 0, wave crest; (b) t/T = 1/4, down-zero crossing; (c) t/T = 1/2, wave trough; (d) t/T = 3/4, up-zero crossing.
Figure 5.
Phase-averaged vertical velocity distributions of the jet in Case A3 at four typical wave phases: (a) t/T = 0, wave crest; (b) t/T = 1/4, down-zero crossing; (c) t/T = 1/2, wave trough; (d) t/T = 3/4, up-zero crossing.


Figure 6.
Phase-averaged vertical velocity distribution of the jet in the wavy cross-flow environment at the wave trough phase: (a) Case A2; (b) Case A4; (c) Case B3; (d) Case C3.
Figure 6.
Phase-averaged vertical velocity distribution of the jet in the wavy cross-flow environment at the wave trough phase: (a) Case A2; (b) Case A4; (c) Case B3; (d) Case C3.

Figure 7.
Comparison of time-averaged flow fields of twin buoyant jets in different environments: (a) Case A0 vs. Case A2; (b) Case A0 vs. Case A3; (c) Case A0 vs. Case A4; (d) Case C0 vs. Case C4.
Figure 7.
Comparison of time-averaged flow fields of twin buoyant jets in different environments: (a) Case A0 vs. Case A2; (b) Case A0 vs. Case A3; (c) Case A0 vs. Case A4; (d) Case C0 vs. Case C4.

Figure 8.
Time-averaged vertical velocity distribution of the jets in the wavy cross-flow environment: (a) Case A0; (b) Case A1; (c) Case A2; (d) Case A3; (e) Case A4; (f) Case A5.
Figure 8.
Time-averaged vertical velocity distribution of the jets in the wavy cross-flow environment: (a) Case A0; (b) Case A1; (c) Case A2; (d) Case A3; (e) Case A4; (f) Case A5.

Figure 9.
Sketch of three regions of twin buoyant jets in the wave and current environment.

Figure 10.
Effects of dimensionless parameters on the trajectories of twin buoyant jets in the wave and current environment: (a) effect of St; (b) effect of Rwc; (c) effect of Rjc.
Figure 10.
Effects of dimensionless parameters on the trajectories of twin buoyant jets in the wave and current environment: (a) effect of St; (b) effect of Rwc; (c) effect of Rjc.

Figure 11.
Effects of dimensionless parameters on the trajectories of twin buoyant jets in the wave and current environment when the length scale lmb is considered: (a) effect of St; (b) effect of Rwc; (c) effect of Rjc.
Figure 11.
Effects of dimensionless parameters on the trajectories of twin buoyant jets in the wave and current environment when the length scale lmb is considered: (a) effect of St; (b) effect of Rwc; (c) effect of Rjc.

Figure 12.
Equation for the trajectory of twin buoyant jets in the wave and current environment.


Table 1.
Experimental jet, wave and cross-flow conditions.
| Case | Jet-to-Current Velocity Ratio Rjc | Wave-to-Current Velocity Ratio Rwc | Strouhal Number St | Initial Flow Flux Q0 (L/h) | Initial Velocity w0 (m/s) | Wave Period T (s) | Wave Height H (cm) | Cross-Flow Velocity uc (m/s) |
|---|---|---|---|---|---|---|---|---|
| A0 | 8.75 | — | — | 200 | 0.70 | — | — | — |
| A1 | 8.75 | 0.17 | 0.125 | 200 | 0.70 | 1 | 2 | 0.08 |
| A2 | 8.75 | 0.35 | 0.125 | 200 | 0.70 | 1 | 4 | 0.08 |
| A3 | 8.75 | 0.32 | 0.083 | 200 | 0.70 | 1.5 | 2 | 0.08 |
| A4 | 8.75 | 0.63 | 0.083 | 200 | 0.70 | 1.5 | 4 | 0.08 |
| A5 | 8.75 | 0.37 | 0.063 | 200 | 0.70 | 2 | 2 | 0.08 |
| B0 | 11.00 | — | — | 250 | 0.88 | — | — | — |
| B1 | 11.00 | 0.17 | 0.125 | 250 | 0.88 | 1 | 2 | 0.08 |
| B2 | 11.00 | 0.35 | 0.125 | 250 | 0.88 | 1 | 4 | 0.08 |
| B3 | 11.00 | 0.32 | 0.083 | 250 | 0.88 | 1.5 | 2 | 0.08 |
| B4 | 11.00 | 0.63 | 0.083 | 250 | 0.88 | 1.5 | 4 | 0.08 |
| B5 | 11.00 | 0.37 | 0.063 | 250 | 0.88 | 2 | 2 | 0.08 |
| C0 | 13.25 | — | — | 300 | 1.06 | — | — | — |
| C1 | 13.25 | 0.17 | 0.125 | 300 | 1.06 | 1 | 2 | 0.08 |
| C2 | 13.25 | 0.35 | 0.125 | 300 | 1.06 | 1 | 4 | 0.08 |
| C3 | 13.25 | 0.32 | 0.083 | 300 | 1.06 | 1.5 | 2 | 0.08 |
| C4 | 13.25 | 0.63 | 0.083 | 300 | 1.06 | 1.5 | 4 | 0.08 |
| C5 | 13.25 | 0.37 | 0.063 | 300 | 1.06 | 2 | 2 | 0.08 |
Table 2.
Experimental cases of buoyant jet in the still water environment.
| Case | Water Depth h (m) | Flow Flux Q0 (L/h) | Density Difference Δρ | Initial Velocity w0 (m/s) |
|---|---|---|---|---|
| S1 | 0.60 | 50 | 0.73% | 0.18 |
| S2 | 0.70 | 100 | 0.73% | 0.36 |
© 2019 by the authors. Licensee MDPI, Basel, Switzerland. This article is an open access article distributed under the terms and conditions of the Creative Commons Attribution (CC BY) license (http://creativecommons.org/licenses/by/4.0/).
Share and Cite
MDPI and ACS Style
Xu, Z.; Otoo, E.; Chen, Y.; Ding, H. 2D PIV Measurement of Twin Buoyant Jets in Wavy Cross-Flow Environment. Water 2019, 11, 399. https://doi.org/10.3390/w11020399
AMA Style
Xu Z, Otoo E, Chen Y, Ding H. 2D PIV Measurement of Twin Buoyant Jets in Wavy Cross-Flow Environment. Water. 2019; 11(2):399. https://doi.org/10.3390/w11020399
Chicago/Turabian StyleXu, Zhenshan, Ebenezer Otoo, Yongping Chen, and Hongwei Ding. 2019. "2D PIV Measurement of Twin Buoyant Jets in Wavy Cross-Flow Environment" Water 11, no. 2: 399. https://doi.org/10.3390/w11020399
Note that from the first issue of 2016, this journal uses article numbers instead of page numbers. See further details here.