A Systematic Review of Coastal Vulnerability Assessment Studies along Andhra Pradesh, India: A Critical Evaluation of Data Gathering, Risk Levels and Mitigation Strategies

 ,
, 
Abstract
:1. Introduction
2. Snapshot of Coastal Vulnerability Methodologies
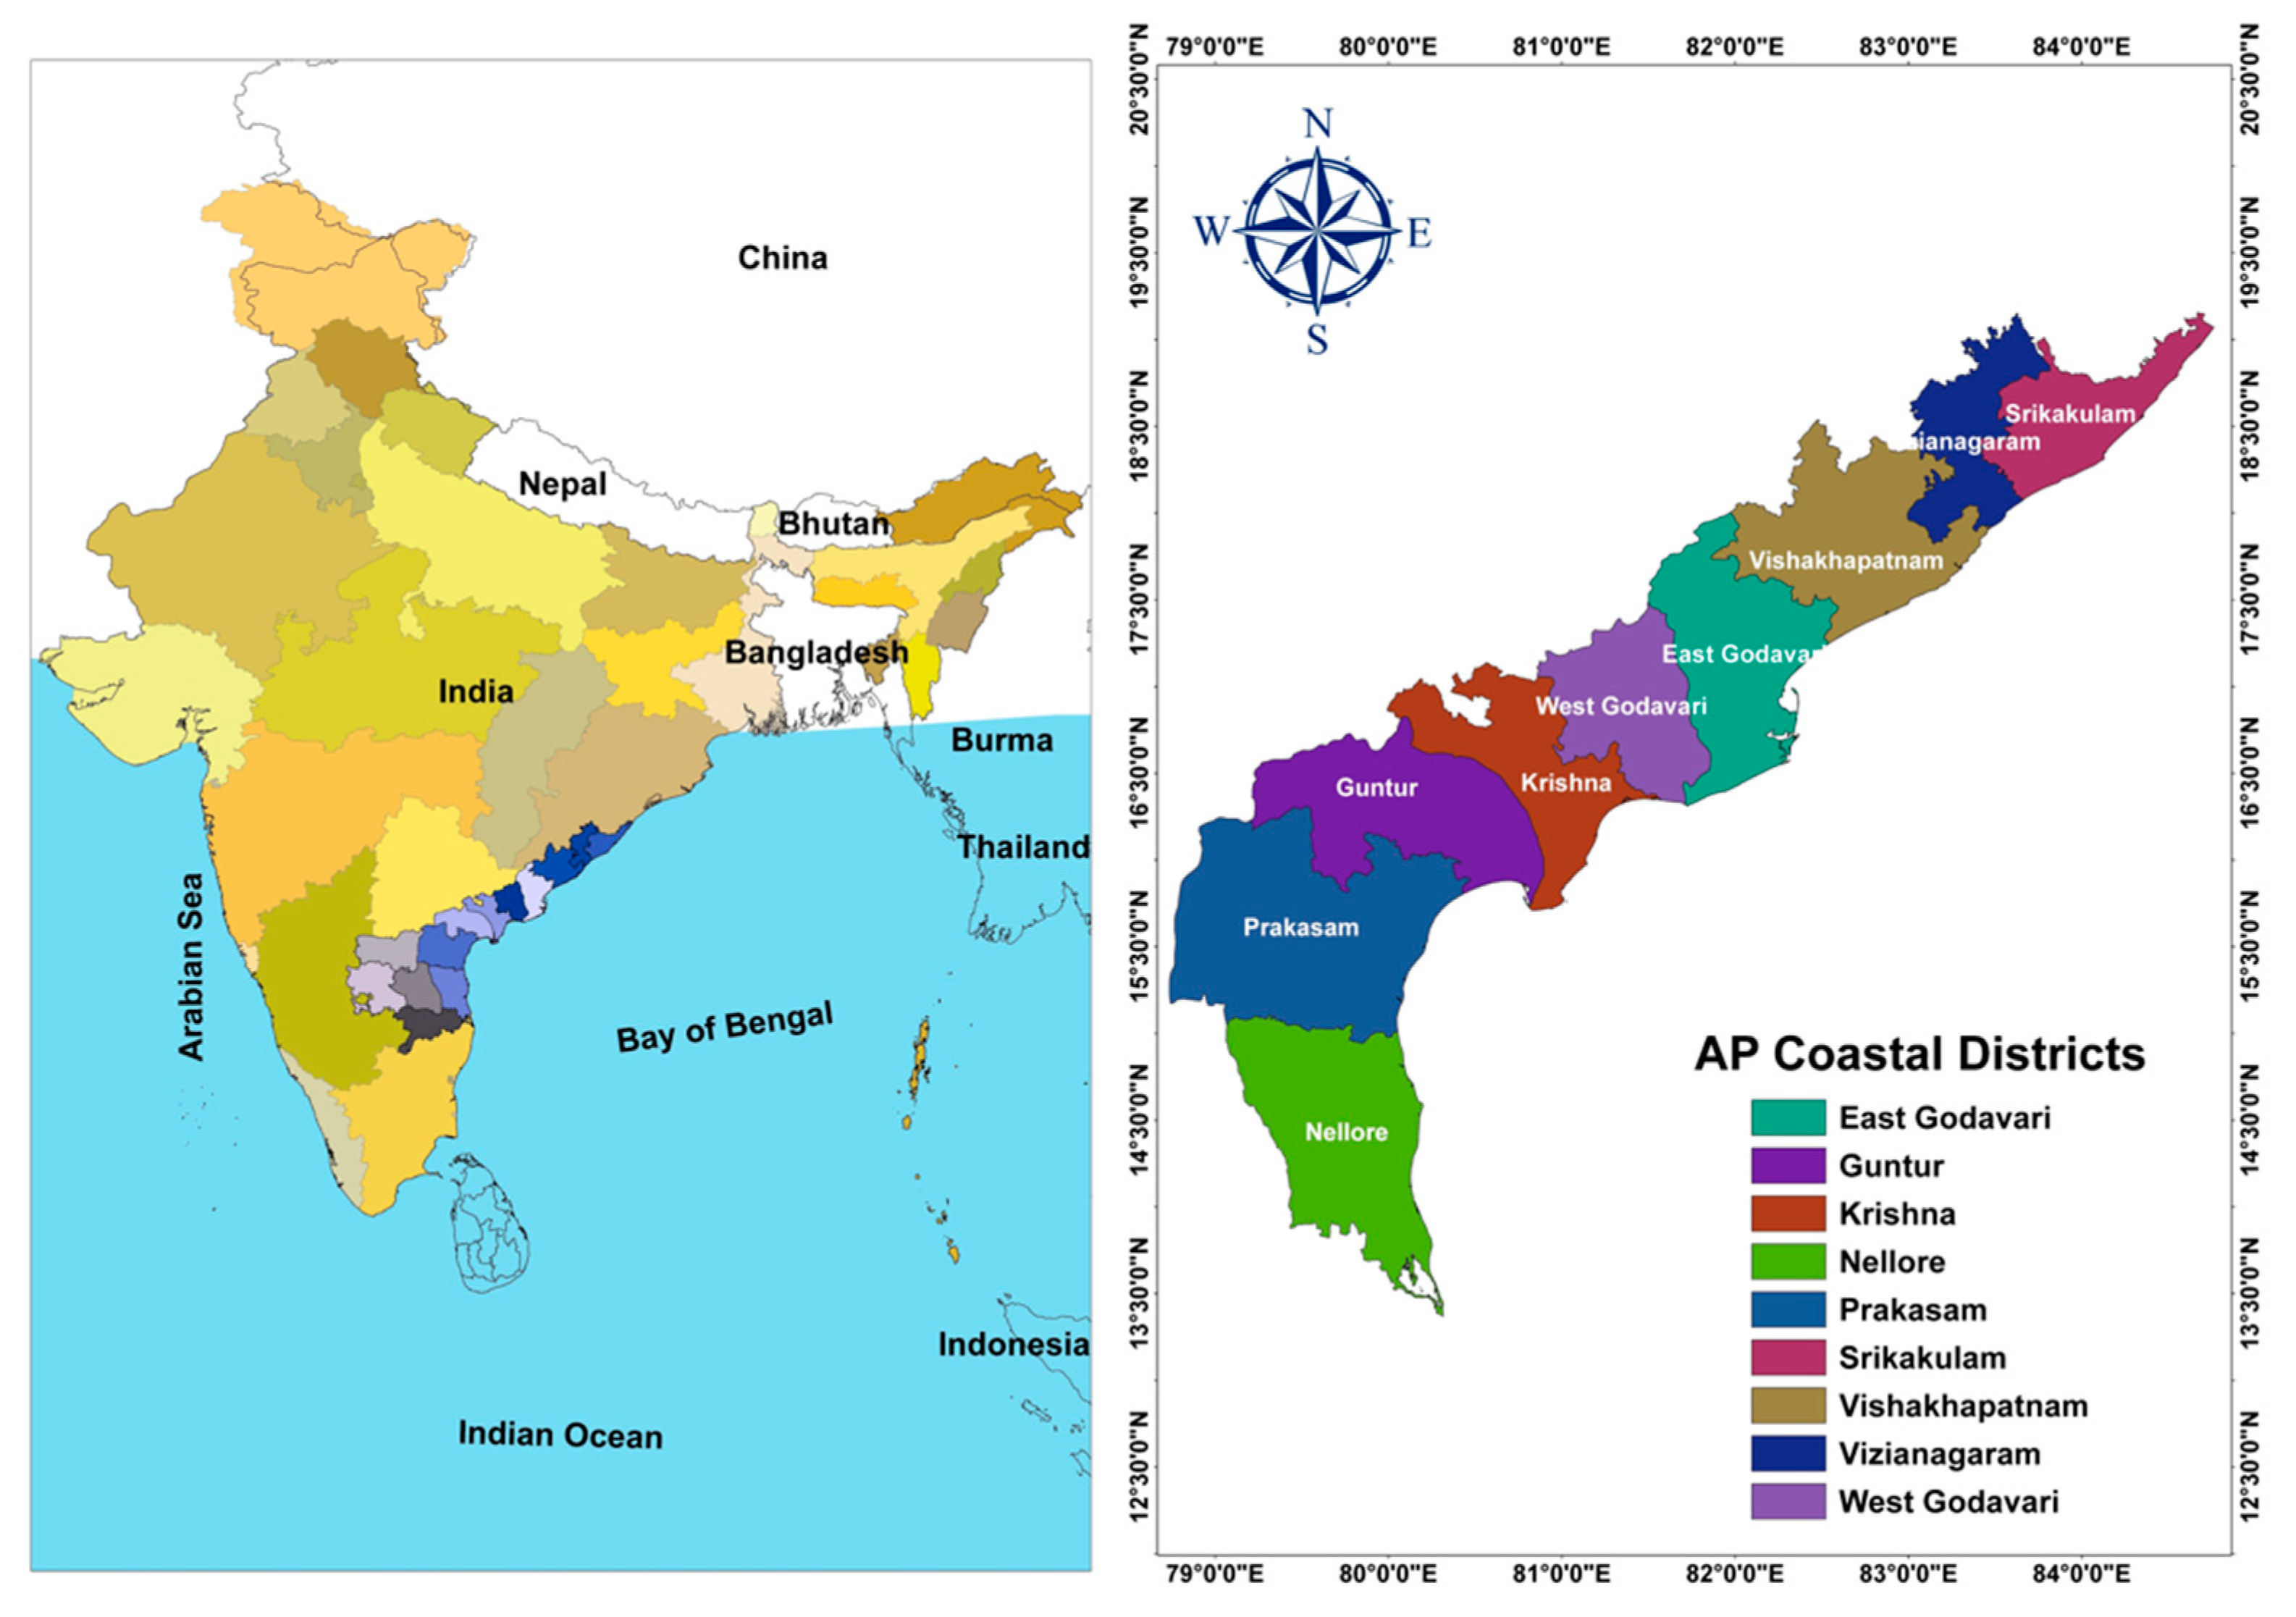
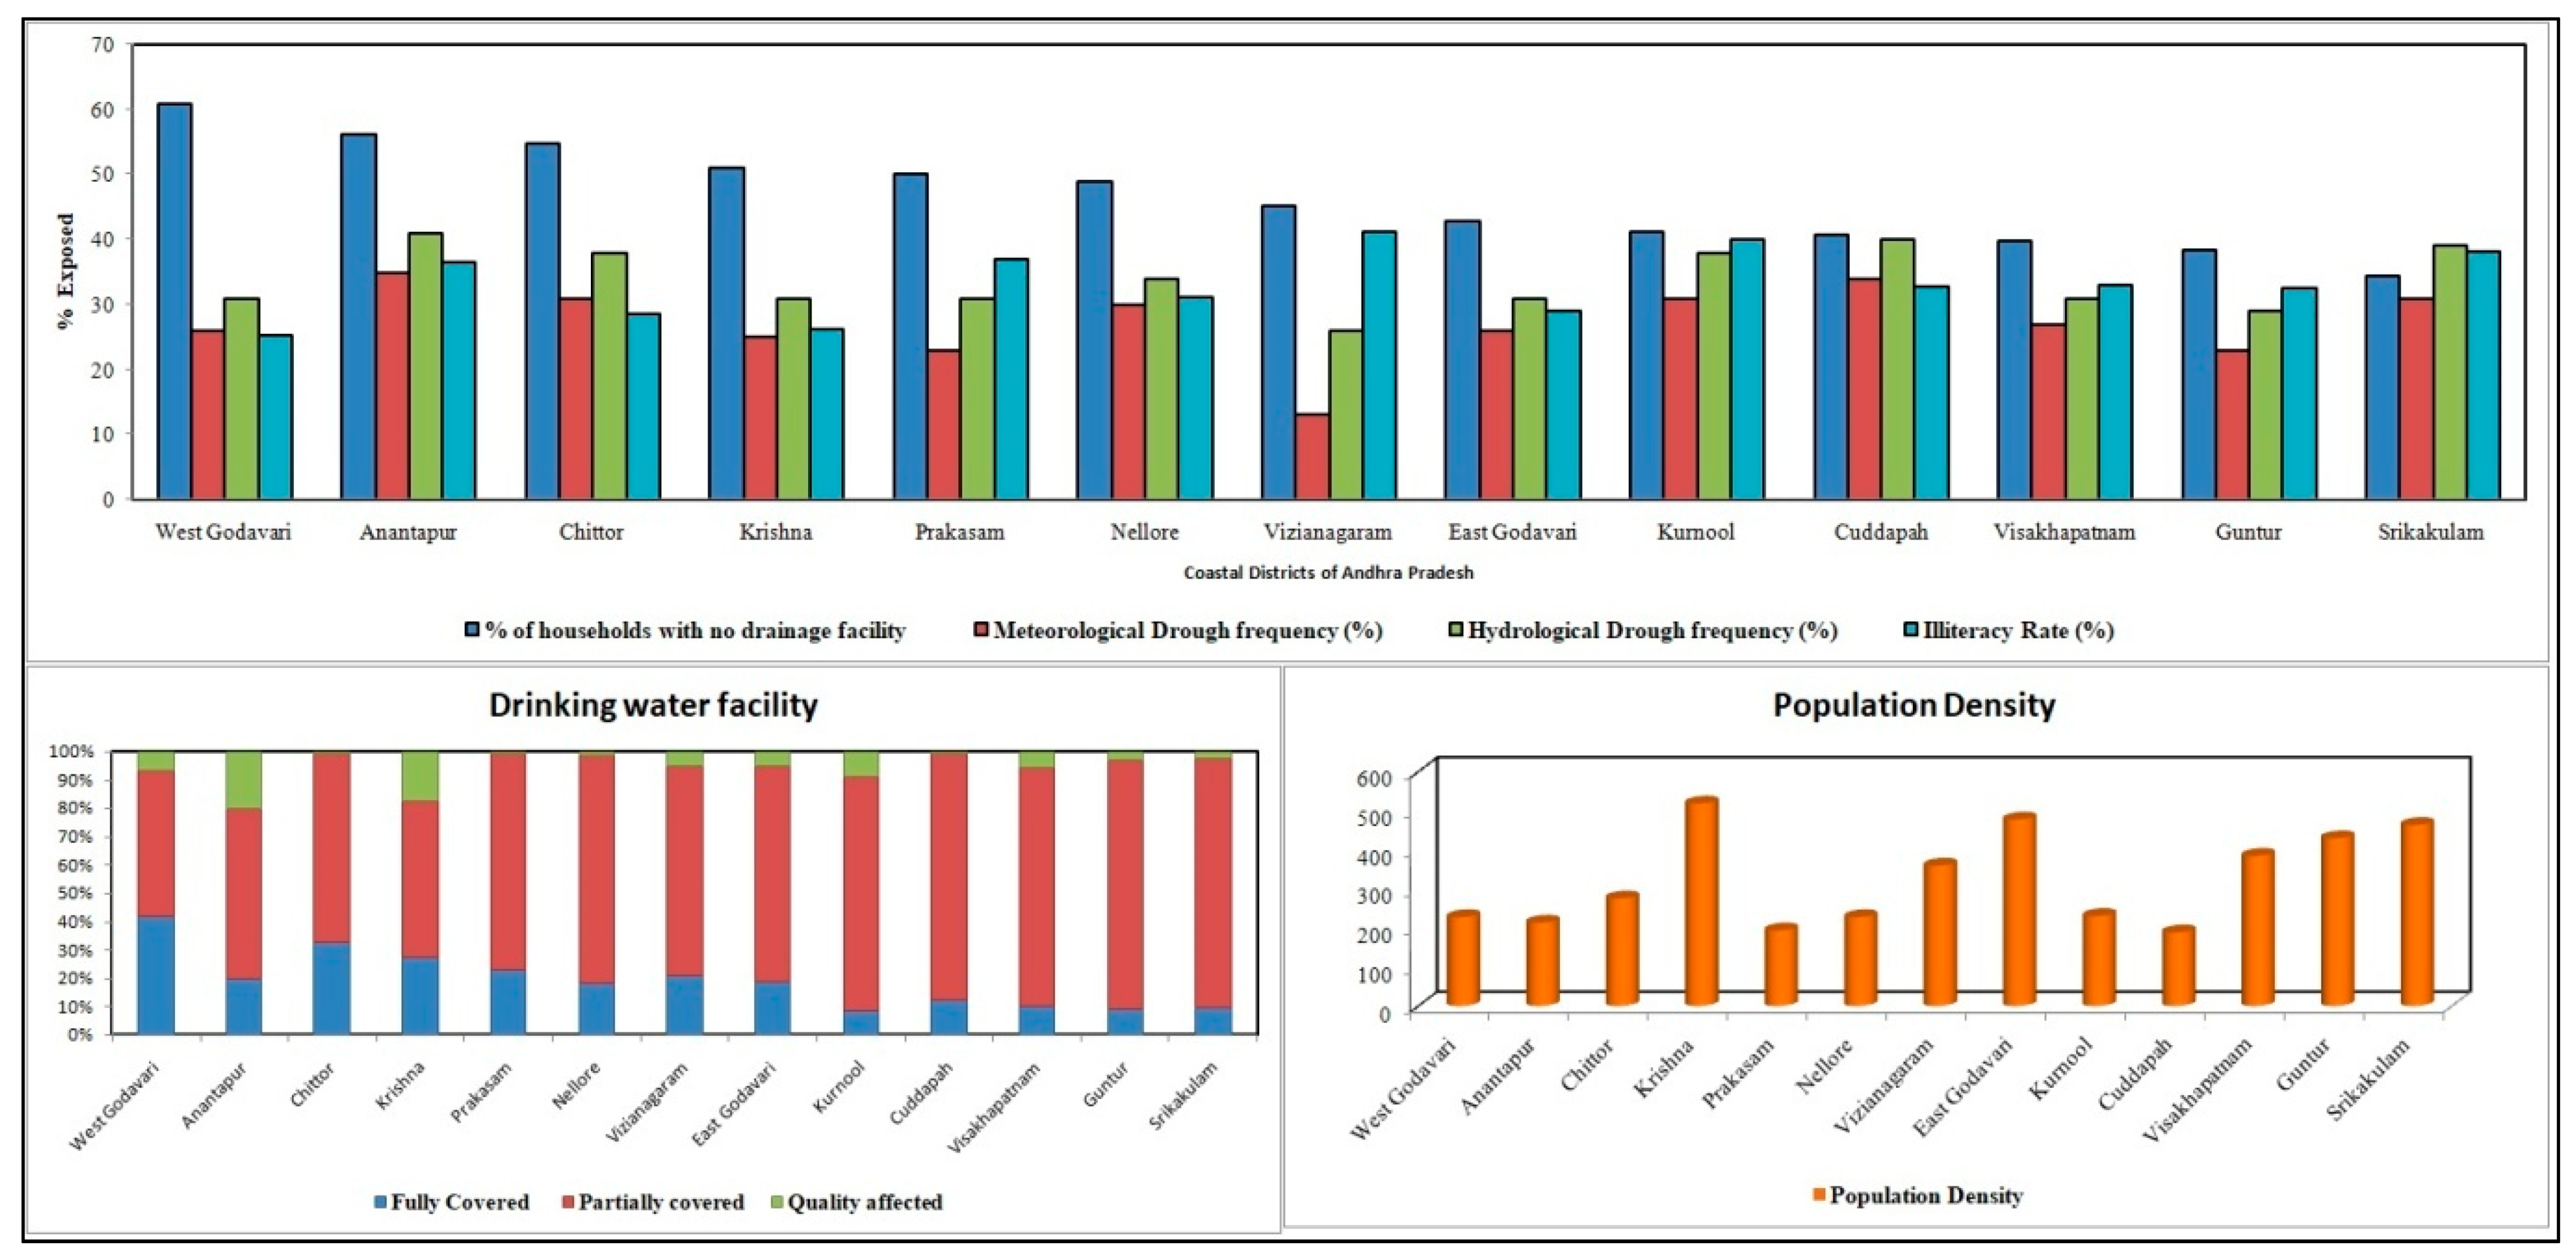
3. Study Area
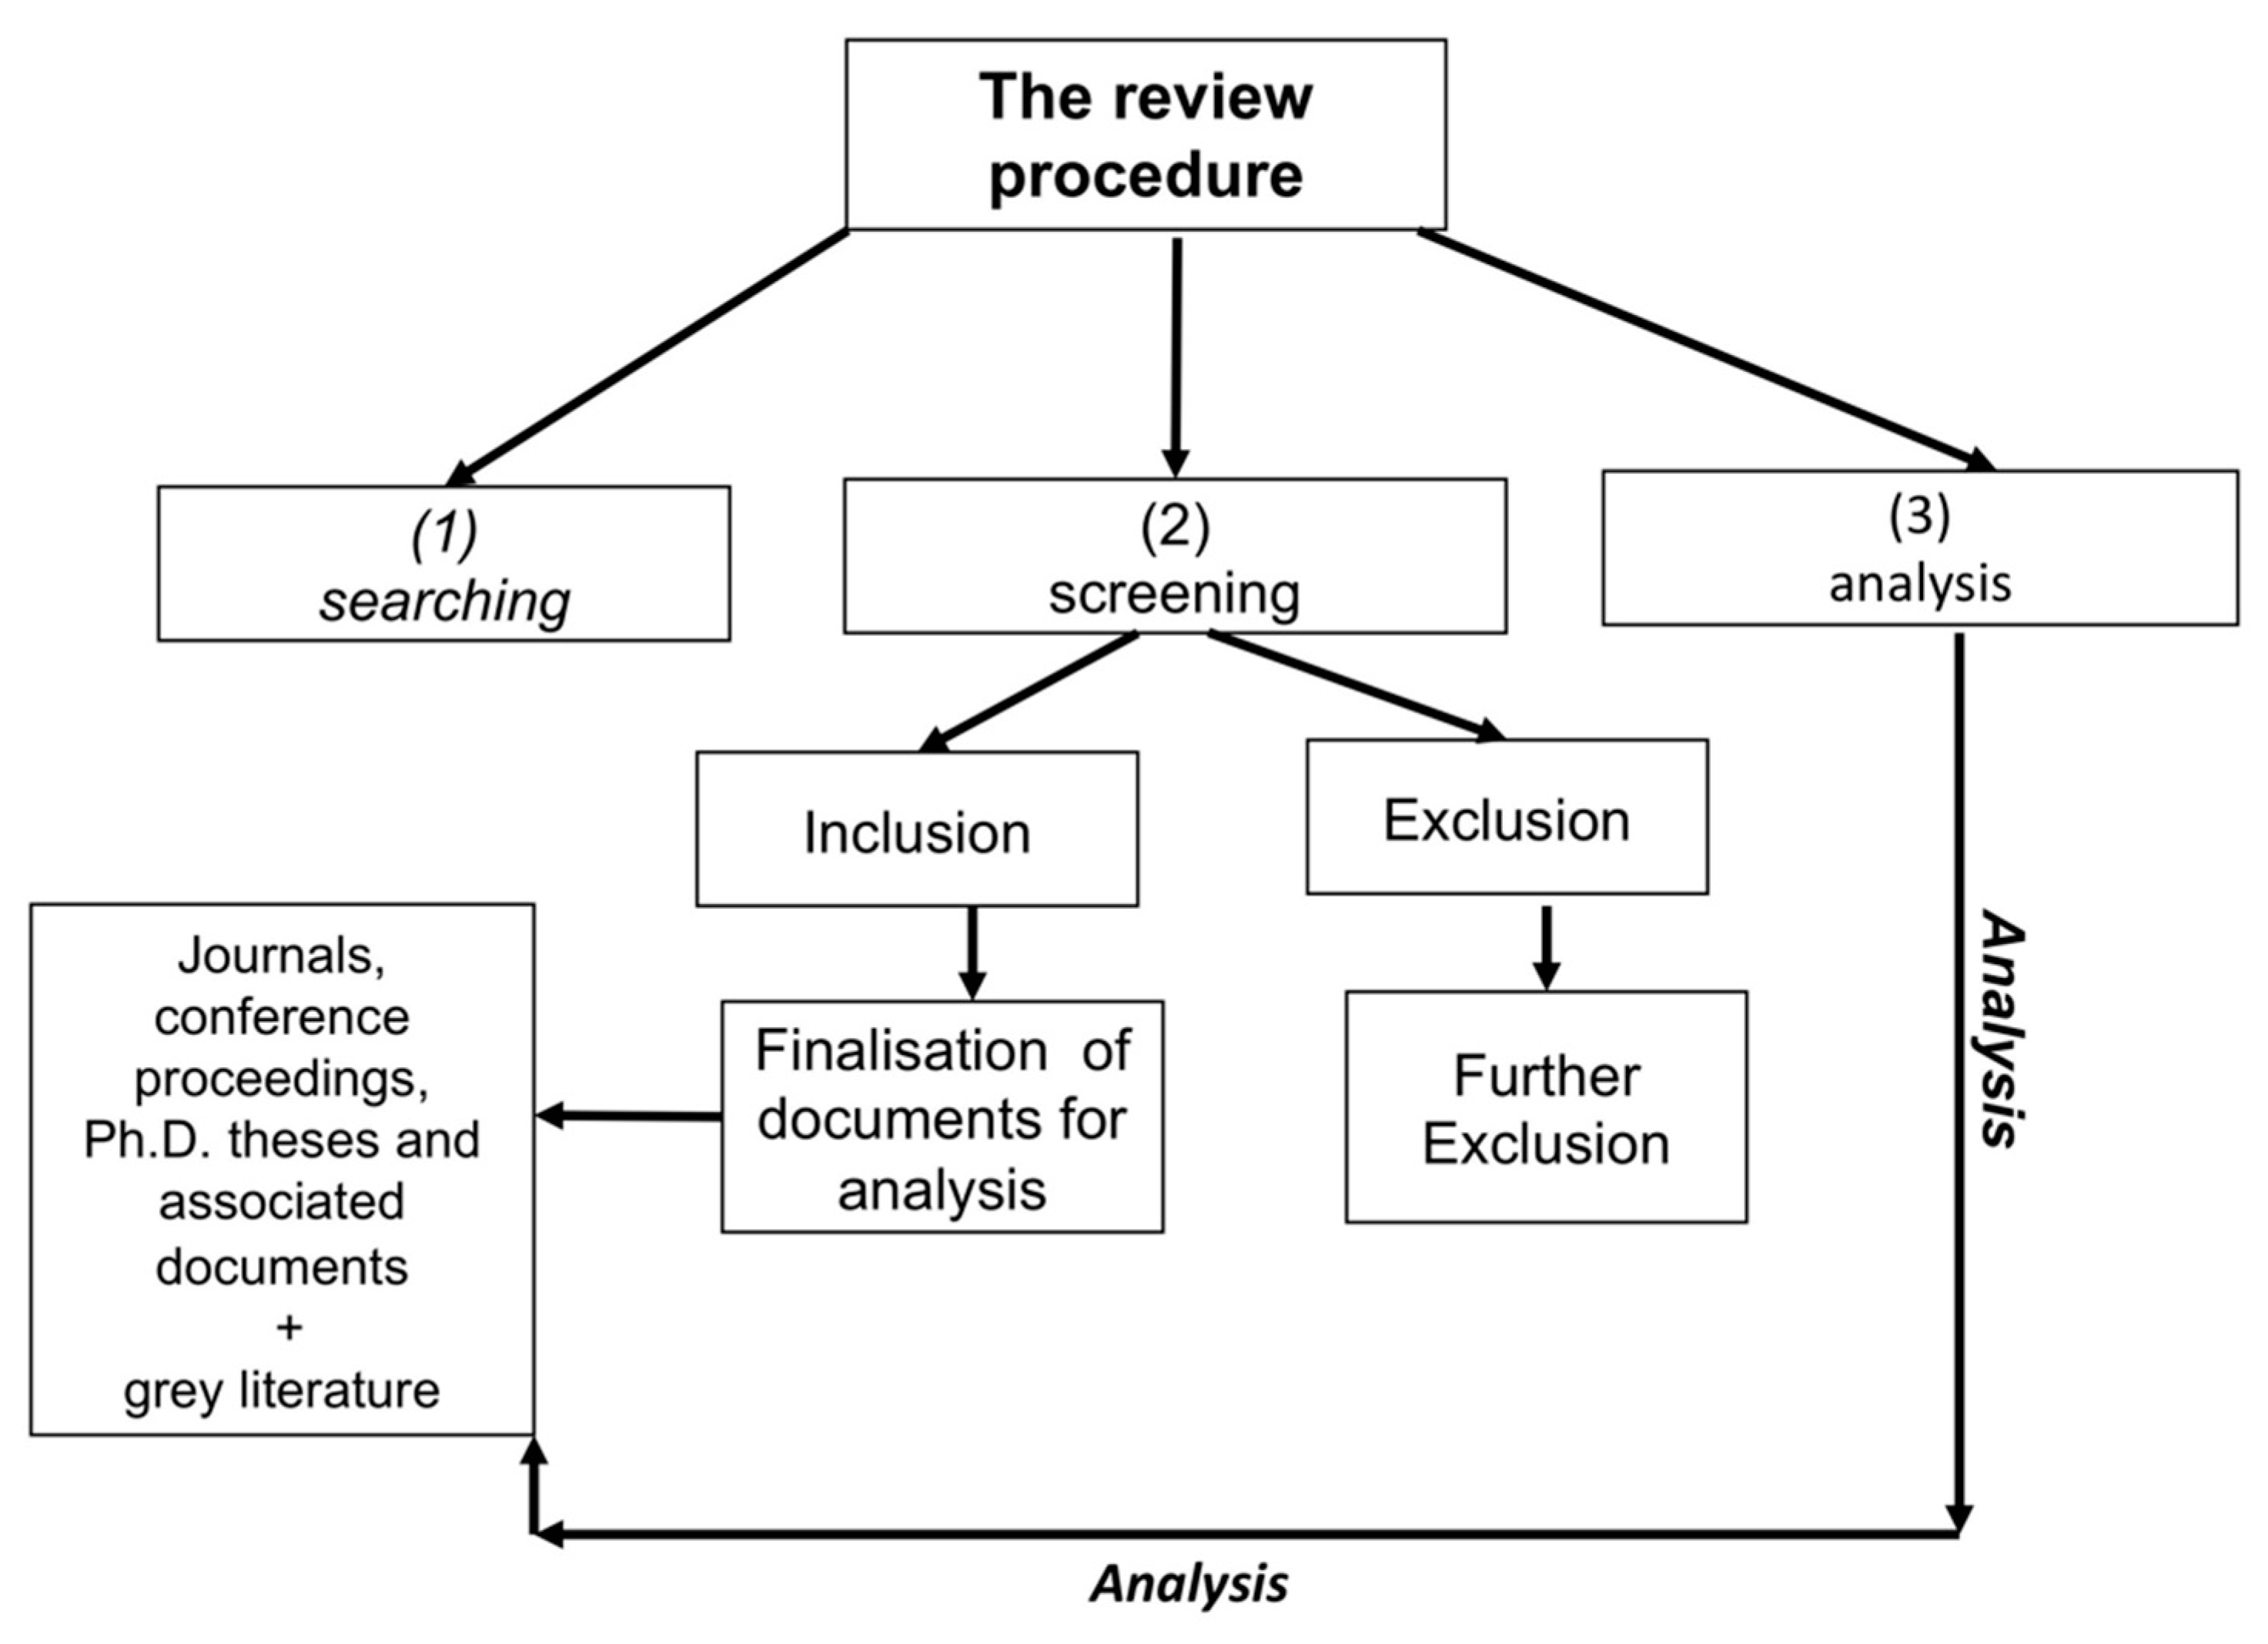
4. Methodology
Coastal Vulnerability Index Formulations and Parameters
- (a)
- Geomorphology
- (b)
- Shoreline change-rate
- (c)
- Coastal-slope
- (d)
- Relative sea-level rise
- (e)
- Mean significant wave-height
- (f)
- Mean tidal-range
5. Results
5.1. Coastal Geomorphology
5.2. Shoreline Change-Rate
5.3. Coastal Slope
5.4. Relative Sea Level Rise
5.5. Significant Wave Height
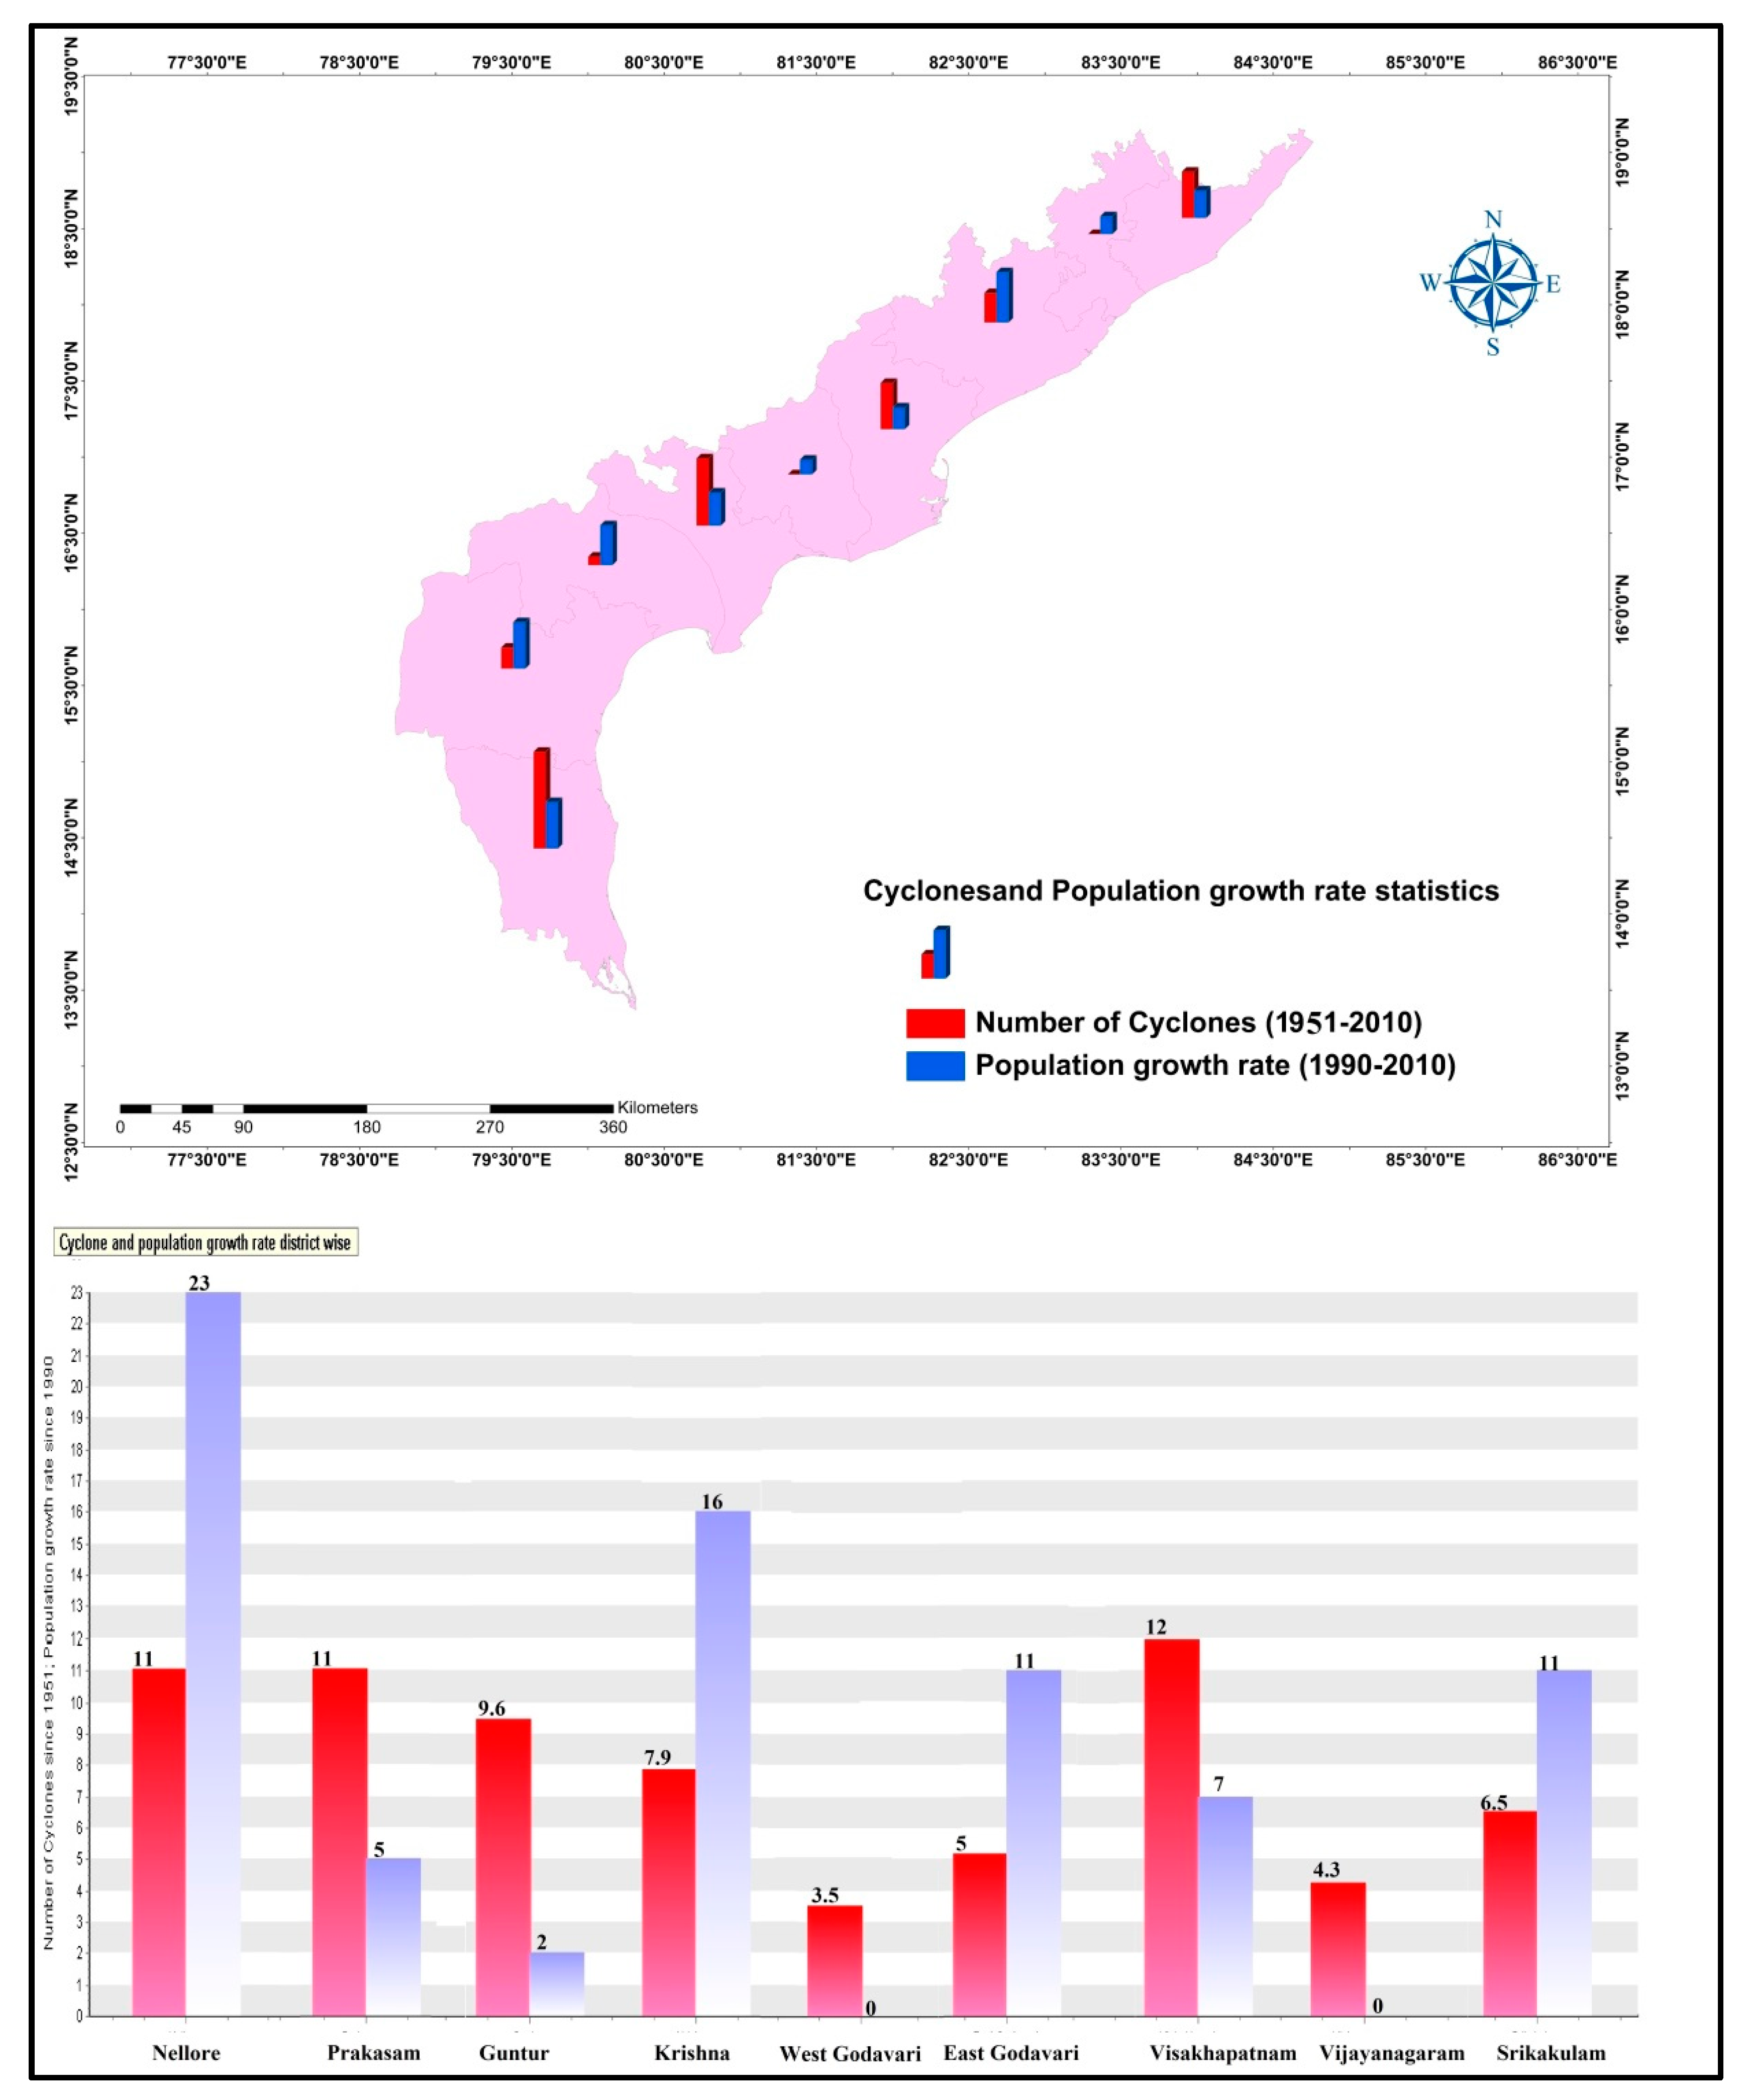
5.6. Mean Tidal Range, Tropical Cyclone and Induced Storm Surge
6. Discussion
6.1. CVI Analysis
6.2. Mitigation Strategies and Approaches
6.3. Data Gathering Techniques
7. Conclusions
Author Contributions
Funding
Acknowledgments
Conflicts of Interest
References
- Sekovski, I.; Newton, A.; Dennison, W.C. Megacities in the coastal zone: Using a driver-pressure-state-impact-response framework to address complex environmental problems. Estuar. Coast. Shelf Sci. 2012, 96, 48–59. [Google Scholar] [CrossRef]
- Gari, S.R.; Newton, A.; Icely, J.D. A review of the application and evolution of the DPSIR framework with an emphasis on coastal social-ecological systems. Ocean Coast. Manag. 2015, 103, 63–77. [Google Scholar] [CrossRef] [Green Version]
- Rani, N.S.; Satyanarayana, A.; Bhaskaran, P.K. Coastal vulnerability assessment studies over India: A review. Nat. Hazards 2015, 77, 405–428. [Google Scholar] [CrossRef]
- Paula, J. Overall assessment of the state of the coast in the Western Indian. Ocean Reg. State Coast Rep. 2016, 500–527. [Google Scholar] [CrossRef]
- Kantamaneni, K.; Gallagher, A.; Du, X. Assessing and mapping regional coastal vulnerability for port environments and coastal cities. J. Coast. Conserv. 2019, 23, 59–70. [Google Scholar] [CrossRef]
- Brown, S.; Nicholls, R.J.; Lázár, A.N.; Hornby, D.D.; Hill, C.; Hazra, S.; Addo, K.A.; Haque, A.; Caesar, J.; Tompkins, E.L. What are the implications of sea-level rise for a 1.5, 2 and 3 °C rise in global mean temperatures in the Ganges-Brahmaputra-Meghna and other vulnerable deltas? Reg. Environ. Chang. 2018, 18, 1829–1842. [Google Scholar] [CrossRef] [Green Version]
- Sahoo, B.; Bhaskaran, P.K. Multi-hazard risk assessment of coastal vulnerability from tropical cyclones—A GIS based approach for the Odisha coast. J. Environ. Manag. 2018, 206, 1166–1178. [Google Scholar] [CrossRef] [PubMed]
- UNEP. Global Environment Outlook 3: Past, Present and Future Perspectives. UNEP/Earthscan: Nairobi, Kenya, 2012. Available online: https://wedocs.unep.org/bitstream/handle/20.500.11822/8609/GEO-3%20REPORT_English.pdf?sequence=7&isAllowed=y (accessed on 12 September 2014).
- Vivek, G.; Mahendra, R.S.; Mohanty, P.C.; Srinivasa Kumar, T. Sachikanta Nanda Coastal Vulnerability Assessment for North East Coast of Andhra Pradesh, India. Int. J. Remote Sens. Geosci. (IJRSG) 2016, 5, 1–7. [Google Scholar]
- Patwardhan, A.; Semenov, S.; Schnieder, S.; Burton, I.; Magadza, C.; Oppenheimer, M.; Pittock, B.; Rahman, A.; Smith, J.; Suarez, A. Assessing key vulnerabilities and the risk from climate change. Clim. Chang. 2007, 779–810. [Google Scholar]
- Few, R. Flood hazards, vulnerability and risk reduction. In Flood Hazards and Health; Routledge: London, UK, 2013; pp. 20–39. [Google Scholar] [CrossRef]
- Elliott, M.; Cutts, N.D.; Trono, A. A typology of marine and estuarine hazards and risks as vectors of change: A review for vulnerable coasts and their management. Ocean Coast. Manag. 2014, 93, 88–99. [Google Scholar] [CrossRef]
- Ramesh, R.; Chen, Z.; Cummins, V.; Day, J.; D’Elia, J.; Dennison, B.; Forbes, D.L.; Glaeser, B.; Glaser, M.; Glavovic, B.; et al. Land–ocean interactions in the coastal zone: Past, present & future. Anthropocene 2015, 12, 85–98. [Google Scholar]
- Nicholls, R.J.; Wong, P.P.; Burkett, V.R.; Codignotto, J.O.; Hay, J.E.; McLean, R.F.; Ragoonaden, S.; Woodroffe, C.D. Coastal systems and low-lying areas. In Climate Change 2007: Impacts, Adaptation and Vulnerability: Contribution of Working Group II to the Fourth Assessment Report of the Intergovernmental Panel on Climate Change; Parry, M.L., Canziani, O.F., Palutikof, J.P., van der Linden, P.J., Hanson, C.E., Eds.; Cambridge University Press: Cambridge, UK, 2017; pp. 315–356. [Google Scholar]
- Schuur, E.A.G.; McGuire, A.D.; Schädel, C.; Grosse, G.; Harden, J.W.; Hayes, D.J.; Hugelius, G.; Koven, C.D.; Kuhry, P.; Lawrence, D.M.; et al. Climate change and the permafrost carbon feedback. Nature 2015, 520, 171–179. [Google Scholar] [CrossRef] [PubMed]
- Dow, K.; Downing, T.E. The Atlas of Climate Change: Mapping the World’s Greatest Challenge; University of California Press: Brighton, UK, 2016. [Google Scholar]
- Lal, M. Global climate change: India’s monsoon and its variability. J. Environ. Stud. Policy 2003, 6, 1–34. [Google Scholar]
- Lioubimtseva, E.; Henebry, G.M. Climate and environmental change in arid Central Asia: Impacts, vulnerability, and adaptations. J. Arid Environ. 2009, 73, 963–977. [Google Scholar] [CrossRef]
- Karim, M.F.; Mimura, N. Impacts of climate change and sea-level rise on cyclonic storm surge floods in Bangladesh. Glob. Environ. Chang. 2008, 18, 490–500. [Google Scholar] [CrossRef]
- Knutson, T.R.; McBride, J.L.; Chan, J.; Emanuel, K.; Holland, G.; Landsea, C.; Held, I.; Kossin, J.P.; Srivastava, A.K.; Sugi, M. Tropical cyclones and climate change. Nat. Geosci. 2010, 3, 157–163. [Google Scholar] [CrossRef] [Green Version]
- Vousdoukas, M.I.; Mentaschi, L.; Voukouvalas, E.; Verlaan, M.; Jevrejeva, S.; Jackson, L.P.; Feyen, L. Global probabilistic projections of extreme sea levels show intensification of coastal flood hazard. Nat. Commun. 2018, 9, 2360. [Google Scholar] [CrossRef] [PubMed]
- The South Asian Disaster Report (SADR), Changing Limits, Impeding Risks, Emerging Perspectives. 2010. Available online: http://www.ndma.gov.pk/Publications/South%20Asia%20Disaster%20Report%202010%20unisdr.pdf (accessed on 12 March 2016).
- McCarthy, J.J.; Canziani, O.F.; Leary, N.A.; Dokken, D.J.; White, K.S. Climate Change 2001: Impacts, Adaptation, and Vulnerability: Contribution of Working Group II to the Third Assessment Report of the Intergovernmental Panel on Climate Change; Cambridge University Press: Cambridge, UK, 2001; Volume 2. [Google Scholar]
- Moss, R.H.; Edmonds, J.A.; Hibbard, K.A.; Manning, M.R.; Rose, S.K.; van Vuuren, D.P.; Carter, T.R.; Emori, S.; Kainuma, M.; Kram, T.; et al. The next generation of scenarios for climate change research and assessment. Nature 2010, 463, 747–756. [Google Scholar] [CrossRef] [PubMed]
- Neumann, B.; Vafeidis, A.T.; Zimmermann, J.; Nicholls, R.J. Future coastal population growth and exposure to sea-level rise and coastal flooding-a global assessment. PLoS ONE 2015, 10, e0118571. [Google Scholar] [CrossRef] [PubMed]
- Chen, W.-Y.; Suzuki, T.; Lackner, M. Sea-Level Rise and Hazardous Storms: Impact Assessment on Coasts and Estuaries; Springer: New York, NY, USA, 2016. [Google Scholar]
- Arkema, K.K.; Griffin, R.; Maldonado, S.; Silver, J.; Suckale, J.; Guerry, A.D. Linking social, ecological, and physical science to advance natural and nature-based protection for coastal communities. Ann. N. Y. Acad. Sci. 2017, 1399, 5–26. [Google Scholar] [CrossRef] [PubMed]
- Kantamaneni, K.; Phillips, M.; Thomas, T.; Jenkins, R. Assessing coastal vulnerability: Development of a combined physical and economic index. Ocean Coast. Manag. 2018, 158, 164–175. [Google Scholar] [CrossRef] [Green Version]
- Blaikie, P.; Cannon, T.; Davis, I.; Wisner, B. At Risk: Natural Hazards, People’s Vulnerability and Disasters, 1st ed.; Routledge: London, UK, 1994. [Google Scholar] [CrossRef]
- Parry, M.; Parry, M.L.; Canziani, O.; Palutikof, J.; Van der Linden, P.; Hanson, C. Climate Change 2007-Impacts, Adaptation and Vulnerability: Working Group II Contribution to the Fourth Assessment Report of the IPCC; Cambridge University Press: Cambridge, UK, 2007; Volume 4. [Google Scholar]
- Nguyen, T.T.; Bonetti, J.; Rogers, K.; Woodroffe, C.D. Indicator-based assessment of climate-change impacts on coasts: A review of concepts, methodological approaches and vulnerability indices. Ocean Coast. Manag. 2016, 123, 18–43. [Google Scholar] [CrossRef] [Green Version]
- Kumar, P.D. Potential vulnerability implications of sea level rise for the coastal zones of Cochin, southwest coast of India. Environ. Monit. Assess. 2006, 123, 333. [Google Scholar] [CrossRef] [PubMed]
- Kanakara, R.; Subramanian, B. Oil spill sensitivity analysis and risk assessment for Gulf of Kachchh, India, using integrated modeling. J. Coast. Res. 2007, 14, 1251–1258. [Google Scholar] [CrossRef]
- Chandrasekar, N.; Joevivek, V. John Prince Soundaranayagam DC Geospatial Analysis of Coastal Geomorphological Vulnerability along Southern Tamil Nadu Coast; Geospatial World Forum: Hyderabad, India, 2011. [Google Scholar]
- ManiMurali, R.; Ankita, M.; Amrita, S.; Vethamony, P. Coastal Vulnerability Assessment of Puducherry Coast, India, using the Analytical Hierarchical Process. Nat. Hazards Earth Syst. Sci. 2013, 13, 3291–3311. [Google Scholar] [CrossRef]
- Saxena, S.; Purvaja, R.; Suganya, G.M.D.; Ramesh, R. Coastal hazard mapping in the Cuddalore region, South India. Nat. Hazards 2013, 66, 1519–1536. [Google Scholar] [CrossRef]
- Appelquist, L.R.; Balstrøm, T. Application of a new methodology for coastal multi-hazard-assessment & management on the state of Karnataka, India. J. Environ. Manag. 2015, 152, 1–10. [Google Scholar] [Green Version]
- Appelquist, L.R. Generic framework for meso-scale assessment of climate change hazards in coastal environments. J. Coast. Conserv. 2013, 17, 59–74. [Google Scholar] [CrossRef]
- Gilard, O. Hazards, Vulnerability and Risk. In Climate Change and Agriculture Worldwide; Springer: New York, NY, USA, 2016; pp. 19–29. [Google Scholar]
- Thieler, E.R.; Hammar-Klose, E.S. National Assessment of Coastal Vulnerability to Sea-level Rise: Preliminary Results for the US Gulf of Mexico Coast; Geological Survey Open-File Report; U.S. Geological Survey: Woods Hole, MA, USA, 2000.
- Boruff, B.J.; Emrich, C.; Cutter, S.L. Erosion hazard vulnerability of US coastal counties. J. Coast. Res. 2005, 21, 932–942. [Google Scholar] [CrossRef]
- Szlafsztein, C.; Sterr, H. A GIS-based vulnerability assessment of coastal natural hazards, state of Pará, Brazil. J. Coast. Conserv. 2007, 11, 53–66. [Google Scholar] [CrossRef]
- Abuodha, P.A.; Woodroffe, C.D. Assessing vulnerability to sea-level rise using a coastal sensitivity index: A case study from southeast Australia. J. Coast. Conserv. 2010, 14, 189–205. [Google Scholar] [CrossRef]
- Torresan, S.; Critto, A.; Rizzi, J.; Marcomini, A. Assessment of coastal vulnerability to climate change hazards at the regional scale: The case study of the North Adriatic Sea. Nat. Hazards Earth Syst. Sci. 2012, 12, 2347–2368. [Google Scholar] [CrossRef]
- Ahsan, M.N.; Warner, J. The socioeconomic vulnerability index: A pragmatic approach for assessing climate change led risks—A case study in the south-western coastal Bangladesh. Int. J. Disaster Risk Reduct. 2014, 8, 32–49. [Google Scholar] [CrossRef]
- Cui, L.; Ge, Z.; Yuan, L.; Zhang, L. Vulnerability assessment of the coastal wetlands in the Yangtze Estuary, China to sea-level rise. Estuar. Coast. Shelf Sci. 2015, 156, 42–51. [Google Scholar] [CrossRef]
- Satta, A.; Snoussi, M.; Puddu, M.; Flayou, L.; Hout, R. An index-based method to assess risks of climate-related hazards in coastal zones: The case of Tetouan. Estuar. Coast. Shelf Sci. 2016, 175, 93–105. [Google Scholar] [CrossRef]
- Coletti, A.; De Nicola, A.; Villani, M.L. Building climate change into risk assessments. Nat. Hazards 2016, 84, 1307–1325. [Google Scholar] [CrossRef]
- Ciccarelli, D.; Pinna, M.S.; Alquini, F.; Cogoni, D.; Ruocco, M.; Bacchetta, G.; Sartic, G.; Fenu, G. Development of a coastal dune vulnerability index for Mediterranean ecosystems: A useful tool for coastal managers? Estuar. Coast. Shelf Sci. 2017, 187, 84–95. [Google Scholar] [CrossRef]
- Ghoussein, Y.; Mhawej, M.; Jaffal, A.; Fadel, A.; El Hourany, R.; Faour, G. Vulnerability assessment of the South-Lebanese coast: A GIS-based approach. Ocean Coast. Manag. 2018, 158, 56–63. [Google Scholar] [CrossRef]
- Vittal Hegde, A.; Radhakrishnan Reju, V. Development of coastal vulnerability index for Mangalore coast, India. J. Coast. Res. 2007, 23, 1106–1111. [Google Scholar] [CrossRef]
- Dwarakish, G.S.; Vinay, S.A.; Natesan, U.; Asano, T.; Kakinuma, T.; Venkataramana, K.; Pai, B.J.; Babita, M.K. Coastal vulnerability assessment of the future sea level rise in Udupi coastal zone of Karnataka state, west coast of India. Ocean Coast. Manag. 2009, 52, 467–478. [Google Scholar] [CrossRef]
- Kumar, T.S.; Mahendra, R.; Nayak, S.; Radhakrishnan, K.; Sahu, K. Coastal vulnerability assessment for Orissa State, east coast of India. J. Coast. Res. 2010, 26, 523–534. [Google Scholar] [CrossRef]
- Kumar, A.A.; Kunte, P.D. Coastal vulnerability assessment for Chennai, east coast of India using geospatial techniques. Nat. Hazards 2012, 64, 853–872. [Google Scholar] [CrossRef]
- Klemas, V.V. Coastal and environmental remote sensing from unmanned aerial vehicles: An overview. J. Coast. Res. 2015, 31, 1260–1267. [Google Scholar] [CrossRef]
- Prabhakara Rao, P.; Nair, M.; Raju, D. Assessment of the role of remote sensing techniques in monitoring shoreline changes: A case study of the Kerala coast. Int. J. Remote Sens. 1985, 6, 549–558. [Google Scholar] [CrossRef]
- Pavri, F. Urban expansion and sea-Level rise related flood vulnerability for Mumbai (Bombay), India using remotely sensed data. In Geospatial Techniques in Urban Hazard and Disaster Analysis; Springer: Dordrecht, The Netherlands, 2009; pp. 31–49. [Google Scholar]
- Rao, K.N.; Subraelu, P.; Rao, T.V.; Malini, B.H.; Ratheesh, R.; Bhattacharya, S.; Rajawat, A. Sea-level rise and coastal vulnerability: An assessment of Andhra Pradesh coast, India through remote sensing and GIS. J. Coast. Conserv. 2008, 12, 195–207. [Google Scholar]
- Jana, A.; Bhattacharya, A.K. Assessment of coastal erosion vulnerability around Midnapur-Balasore Coast, Eastern India using integrated remote sensing and GIS techniques. J. Indian Soc. Remote Sens. 2013, 41, 675–686. [Google Scholar] [CrossRef]
- Kaliraj, S.; Chandrasekar, N.; Ramachandran, K.; Srinivas, Y.; Saravanan, S. Coastal landuse and land cover change and transformations of Kanyakumari coast, India using remote sensing and GIS. Egypt. J. Remote Sens. Space Sci. 2017, 20, 169–185. [Google Scholar]
- Thakur, S.; Dey, D.; Das, P.; Ghosh, P.; De, T. Shoreline change detection using Remote Sensing in the Bakkhali Coastal Region, West Bengal, India. Indian J. Geosci. 2017, 71, 611–626. [Google Scholar]
- Venkataraman, C.; Mishra, T.; Ghosh, S.; Karmakar, S. Climate Change Signals and Response: A Strategic Knowledge Compendium for India; Springer: Singapore, 2018. [Google Scholar]
- Mujabar, P.S.; Chandrasekar, N. Coastal erosion hazard and vulnerability assessment for southern coastal Tamil Nadu of India by using remote sensing and GIS. Nat. Hazards 2013, 69, 1295–1314. [Google Scholar] [CrossRef]
- Mahendra, R.; Mohanty, P.; Bisoyi, H.; Kumar, T.S.; Nayak, S. Assessment and management of coastal multi-hazard vulnerability along the Cuddalore–Villupuram, east coast of India using geospatial techniques. Ocean Coast. Manag. 2011, 54, 302–311. [Google Scholar] [CrossRef]
- Poompavai, V.; Ramalingam, M. Geospatial analysis for coastal risk assessment to cyclones. J. Indian Soc. Remote Sens. 2013, 41, 157–176. [Google Scholar] [CrossRef]
- AP (Andhra Pradesh). State Portal. AP at a Glance. 2017. Available online: https://www.ap.gov.in/?page_id=30 (accessed on 25 March 2018).
- Rani, M.; Rehman, S.; Sajjad, H.; Chaudhary, B.; Sharma, J.; Bhardwaj, S.; Kumar, P. Assessing coastal landscape vulnerability using geospatial techniques along Vizianagaram–Srikakulam coast of Andhra Pradesh, India. Nat. Hazards 2018, 94, 711–725. [Google Scholar] [CrossRef]
- NRSC (National Remote sensing Centre). AP at a Glance. 2014. Available online: https://nrsc.gov.in/uim_2014_proceedings/papers_ppts/UIM2014_US5_EVinodKumar.pdf (accessed on 24 June 2016).
- National Disaster Management Authority (NDMA). Annual Report for 2016–2017-Government of India. 2016. Available online: https://ndma.gov.in/images/annreport/ENG-2016-17-AR.pdf (accessed on 25 March 2018).
- The Ministry of Environment & Forests, Govt. of India. Coastal Zones of India. 2012. Available online: http://www.moef.nic.in/sites/default/files/Coastal_Zones_of_India.pdf (accessed on 26 June 2017).
- AP State Disaster Management Authority. Revenue Department. 2017. Available online: http://www.apsdma.ap.gov.in (accessed on 22 March 2018).
- Gornitz, V. Vulnerability of the East Coast, USA to future sea level rise. J. Coast. Res. 1990, 9, 201–237. [Google Scholar]
- Rao, A.; Babu, S.; Prasad, K.; Murty, T.R.; Sadhuram, Y.; Mahapatra, D. Investigation of the generation and propagation of low frequency internal waves: A case study for the east coast of India. Estuar. Coast. Shelf Sci. 2010, 88, 143–152. [Google Scholar] [CrossRef]
- Krishnan, P.; Ananthan, P.S.; Purvaja, R.; Joyson Joe Jeevamani, J.; Amali Infantina, J.; Srinivasa Rao, C.; Anand, A.; Mahendra, R.S.; Sekar, I.; Kareemulla, K.; et al. Framework for mapping the drivers of coastal vulnerability and spatial decision making for climate-change adaptation: A case study from Maharashtra, India. Ambio 2018, 48, 192–212. [Google Scholar] [CrossRef] [PubMed]
- Pramanik, M.K.; Biswas, S.S.; Mondal, B.; Pal, R. Coastal vulnerability assessment of the predicted sea level rise in the coastal zone of Krishna–Godavari delta region, Andhra Pradesh, east coast of India. Environ. Dev. Sustain. 2016, 18, 1635–1655. [Google Scholar] [CrossRef]
- Basheer Ahammed, K.; Mahendra, R.; Pandey, A. Coastal Vulnerability Assessment for Eastern Coast of India, Andhra Pradesh by Using Geo-Spatial Technique. Geoinform. Geostat. Overv. 2016, 4. [Google Scholar] [CrossRef]
- Unnikrishnan, A.; Shankar, D. Are sea-level-rise trends along the coasts of the north Indian Ocean consistent with global estimates? Glob. Planet. Chang. 2007, 57, 301–307. [Google Scholar] [CrossRef]
- Kumar, K.K.; Tholkappian, S. Relative vulnerability of Indian coastal districts to sea-level rise and climate extremes. Int. Rev. Environ. Strat. 2006, 6, 3–22. [Google Scholar]
- Matta, S.; Tejaswi Baddam, S. Cyclone Vulnerability and Risk Analysis for Coastal Districts of Andhra Pradesh. 2015. Available online: http://imetsociety.org/wp-content/pdf/vayumandal/2015/2015_6.pdf (accessed on 26 March 2017).
- NRSC-ISRO. NATURAL RESOURCES CENSUS Ninth Cycle (2012-13) NATIONAL LAND USE AND LAND COVER MAPPING USING MULTI-TEMPORAL AWiFS DATA (LULC-AWiFS) Remote Sensing Applications Area & Regional Remote Sensing Centres NATIONAL REMOTE SENSING CENTER & North Eastern Space Applications Centre (NESAC) Indian Space Research Organisation. 2013. Available online: https://bhuvan-noeda.nrsc.gov.in/gis/thematic/tools/document/LULC250/1213.pdf (accessed on 23 February 2019). [CrossRef]
- Kavya, A.; Bhavani, A.G.; Rao, P.J.; Chandrudu, V.B. Impact of Land Use/Land Cover and Mangrove Degradation on Coastal Erosion in Godavari Delta Region, Andhra Pradesh—A Geospatial Approach. In Proceedings of International Conference on Remote Sensing for Disaster Management; Springer Series in Geomechanics and Geoengineering; Springer: Cham, Switzerland, 2019; pp. 413–421. [Google Scholar]
- Kumari, K.P.; Srinivas, K. Applications of RS and GIS Techniques for Disaster Studies in East Godavari District, Andhra Pradesh, India. In Proceedings of International Conference on Remote Sensing for Disaster Management; Springe Series in Geomechanics and Geoengineering; Springer: Cham, Switzerland, 2019; pp. 199–214. [Google Scholar]
- Topno, P.N. Multi-stakeholder Support in Disaster Risk Governance in India. In Disaster Risk Governance in India and Cross Cutting Issues; Springer: Singapore, 2018; pp. 127–142. [Google Scholar]
- Bhattacharyya, R.; Ghosh, B.N.; Dogra, P.; Mishra, P.K.; Santra, P.; Kumar, S.; Fullen, M.A.; Mandal, U.K.; Anil, K.S.; Lalitha, M.; et al. Soil conservation issues in India. Sustainability 2016, 8, 565. [Google Scholar] [CrossRef]
- FAOUN (The Food and Agriculture Organization of the United Nations). Chapter-4: Protection from Coastal Erosion. 2016. Available online: http://www.fao.org/docrep/010/ag127e/AG127E09.htm (accessed on 10 August 2017).


| Vulnerability Method | Geographical Location | Parameters Considered | Remarks | Reference |
|---|---|---|---|---|
| CVI due to erosion | Coast between Kanyakumari and Tuticorin, Tamil Nadu | Geomorphology, shoreline change rate, coastal slope, sea level change, mean wave height, mean tidal range | Physical and human intervention processes are major causes of erosion | [63] |
| CVI due to erosion | Coast between Rasulpur (Midnapur) and Subarnarekha (Balasore), Orissa | Shore line change rate, land use and human activities, population density | Assessment of CVI using socio-economic parameters | [59] |
| Multi hazard vulnerability | Cuddalore, Pondicherry and Villupuram districts, Tamil Nadu | Probability of maximum storm surge height during the return period, future sea level rise, coastal erosion and high resolution coastal topography | Used multi hazard vulnerability technique | [64] |
| CVI | Orissa State, East Coast of India | Shoreline change rate, significant wave height, sea-level change rate, tidal range, coastal regional elevation, coastal slope, tsunami run-up and coastal geomorphology | - | [53] |
| CVI | From Talapady to Surathkal along Mangalore Coast | Geomorphology, regional coastal slope, shoreline change rates, population | Assessment of CVI using socio-economic parameters | [51] |
| CVI | Udupi coast in Karnataka | Geomorphology, shoreline erosion/accretion, coastal slope, mean tide range, mean significant wave height, mean sea level rise | Considered the CVI due to future SLR | [52] |
| CRI | Coastal stretch from Kattivakkam to Kovalam, Tamil Nadu | Environmental Vulnerability Index (EVI), Social Vulnerability Index (SVI), Hazard Potential Index (HPI), Mitigation Capacity Index (MCI) | Computed integrated coastal risk index. It is a multi-scale approach. Considered cyclones as indicator coastal risk | [65] |
| Potential Vulnerability Implications | Cochin | Sea-level variations | Used sea-level-rise scenario as an indicator for vulnerability of Cochin coast | [32] |
| Gulf of Kachchh, India | Gulf of Kachchh, India | Oil pollution, social and cultural values, scientific values, environmental, and economic values | Used an integrated numerical simulation modelling integrated with GIS | [33] |
| Coastal geomorphological vulnerability | Coastline between Kallar and Vembar lies in the Gulf of Mannar, Tamil Nadu | Land use/land cover changes, shoreline changes over the years, rate of erosion and accretion, sediment transport during pre-monsoon, monsoon, post-monsoon seasons | Beach morphological changes are influenced by intensive sand mining along the coast and coral mining in the barrier coral islands | [34] |
| Parameter | Data |
|---|---|
| Spatial | |
| Shoreline change | Satellite or Aircraft or UAVs |
| Coastal slope | DEM generated from SRTM or any SAR data |
| Bathymetry | GEBCO |
| Sea level change | Satellite altimeter data from TOPEX/Poseidon |
| Land use land cover change | Satellite data (like LANDSAT 8) |
| Conventional | |
| Significant wave height | JASON-1 data or Wintidex software generated data |
| Cyclones and storm surge | IMD cyclone data |
| Coastal slope | Elevation measured from point observations |
| Bathymetry | National hydrographic charts |
| Sea level change | Tide gauge data from Permanent Service for Mean Sea Level (PSMSL) |
| Historical floods, water quality | Disaster management reports |
| Social parameters | Census reports |
| CVI (Coastal Vulnerability Index) Ranking Criteria | |||||
|---|---|---|---|---|---|
| Parameters | Very Low (1) | Low (2) | Medium (3) | High (4) | Very High (5) |
| Geomorphology | Rocky coasts | Indented coasts | Beach ridge, high dunes and vegetation | Low fore dunes (<3 m), estuaries and lagoons | Mudflats, mangroves, beaches and barriers/spits |
| Slope (%) | >1.00 | 0.50–1.00 | 0.10–0.50 | 0.05–0.10 | <0.05 |
| Mean sea level change rate (deg) | <1.80 | 1.8–2.5 | 2.50–3.00 | 3.00–3.40 | >3.40 |
| Significant mean wave height (m) | <0.55 | 0.55–0.55 | 0.85–1.05 | 1.05–1.25 | <1.25 |
| Mean tidal range (m) | <1.00 | 1.0–2.0 | 2.00–4.00 | 4.00–6.00 | >6.00 |
| Number | Severe Cyclonic Storm/Factor Effected | Maximum Wind (km/h) | Lowest Pressure (mbh) | Fatalities | Economic Loss (million-USD) |
|---|---|---|---|---|---|
| 1 | 1977 | 165 | 919 | 14,204 | 499 |
| 2 | 1990 | 230 | 920 | 967 | 600 |
| 3 | 1996 | 145 | 988 | 1077 | 602 |
| 4 | 2014 | 185 | 215 | 124 | 3400 |
| Vulnerability Hazard | Location | Vulnerability Parameters | Technique | Remarks | Reference |
|---|---|---|---|---|---|
| CVI–Square Root of Product (SRoP) | Vijayanagaram-Srikakulam coast, AP | Shoreline change rate, coastal elevation, bathymetry, sea level rise, significant wave height | Remote sensing (space-borne) and GIS | - | [67] |
| CVI–SRoP | North East-coast of AP | Shoreline change rate, coastal slope, regional elevation, sea level change rate, significant wave height, tidal range, geomorphology, tsunami run-up | Remote sensing and GIS | Parts of Bheemavaram and Visakhapatnam are highly vulnerabble; Nakkapalli and Kancherpulem are at medium risk; Thallapalem is at low risk | [9] |
| CVI–-SRoP | Entire AP coast | Shoreline change, coastal slope, coastal regional elevation, mean sea level, mean tide range, and geomorphology | Remote sensing and GIS | Small stretches in Nellore have very high vulnerability; Nellore, Kothapatnam and Kakinada Southern part are highly vulnerable; Most parts of Sompeta, Koduru and Kothapatnam are moderately vulnerable; Vishakhapatnam and Vizianagaram coasts are very low vulnerability | [76] |
| CVI (summing of variables with weightage) | AP | Geomorphology, coastal slope, shoreline change, mean spring tide, significant wave height | Remote sensing and GIS | Considered sea-level rise as an indicator for coastal vulnerability. The Krishna–Godavari delta coast is notably very highly vulnerable due to its low flat terrain and mud flats | [73] |
| CVI–SRoP | Krishna–Godavari delta region, AP | Shoreline change rate, coastal elevation, slope, geomorphology, sea level rise, significant wave height, mean tidal range | Remote sensing and GIS | Tuni, Kundukur, Narsapur, Razole at low risk; Pithapuram, Amalapuram, Chirala at High risk; Kakinada, Machilipatnam, Bapatla, Ongole at medium risk; Mummidivaram, Avanigadda & Repalle at very high risk | [75] |
| Vulnerability from storm surges and cyclone wind fields on the coast | AP | Vulnerability measured for the situations—frequent (return period of 10 years), 50-year return period, global warming-likely scenario, global warming-extreme case | - | - | [77] |
| Cyclone Vulnerability and Risk Analysis | AP | Vulnerable locations, casualties’ prediction and shelters for cyclone induced vulnerability mitigation | GIS mapping | Prime focus is on socio-economical assessment for mitigation purposes. | [80] |
| Vulnerability of Indian Coastal Districts to Sea-Level Rise and Climate Extremes | Entire India | Demographic: Population density, annual growth rate of population, population at risk due to sea-level rise. Physical: Coast length, insularity, frequency of cyclones based on historic data, probable maximum surge height, area at risk of inundation due to SLR, number of vulnerable houses Economic: Agricultural dependency, income and/or infrastructure index. Social: Literacy, spread of institutional set-up Life-Loss: Storms and human casualties | Available historic statistical data | The study finely described the adaptation and mitigation strategies along the Indian coast with policy issues | [78] |
© 2019 by the authors. Licensee MDPI, Basel, Switzerland. This article is an open access article distributed under the terms and conditions of the Creative Commons Attribution (CC BY) license (http://creativecommons.org/licenses/by/4.0/).
Share and Cite
Kantamaneni, K.; Sudha Rani, N.N.V.; Rice, L.; Sur, K.; Thayaparan, M.; Kulatunga, U.; Rege, R.; Yenneti, K.; Campos, L.C. A Systematic Review of Coastal Vulnerability Assessment Studies along Andhra Pradesh, India: A Critical Evaluation of Data Gathering, Risk Levels and Mitigation Strategies. Water 2019, 11, 393. https://doi.org/10.3390/w11020393
Kantamaneni K, Sudha Rani NNV, Rice L, Sur K, Thayaparan M, Kulatunga U, Rege R, Yenneti K, Campos LC. A Systematic Review of Coastal Vulnerability Assessment Studies along Andhra Pradesh, India: A Critical Evaluation of Data Gathering, Risk Levels and Mitigation Strategies. Water. 2019; 11(2):393. https://doi.org/10.3390/w11020393
Chicago/Turabian StyleKantamaneni, Komali, N.N.V. Sudha Rani, Louis Rice, Koyel Sur, Menaha Thayaparan, Udayangani Kulatunga, Rajshree Rege, Komali Yenneti, and Luiza C. Campos. 2019. "A Systematic Review of Coastal Vulnerability Assessment Studies along Andhra Pradesh, India: A Critical Evaluation of Data Gathering, Risk Levels and Mitigation Strategies" Water 11, no. 2: 393. https://doi.org/10.3390/w11020393