Green Smart Technology for Water (GST4Water): Life Cycle Analysis of Urban Water Consumption
by
 ,
,
Alessandra Bonoli
1,2, 
Emanuela Di Fusco
3, 
Sara Zanni
4,
Ilaria Lauriola
1,
Valentina Ciriello
1,3 and
Vittorio Di Federico
1,3,* 1
Department of Civil, Chemical, Environmental and Materials Engineering (DICAM), University of Bologna, Viale Risorgimento 2, 40136 Bologna, Italy
2
Interdepartmental Centre for Industrial Research in Renewable resources, Environment, Sea and Energy, Via del Lazzaretto, 15/5 40131 Bologna, Italy
3
Interdepartmental Centre for Industrial Research in Building and Construction, University of Bologna, Via del Lazzaretto, 15/5 40131 Bologna, Italy
4
Department of Management, via Capo di Lucca 34, 40126 Bologna, Italy
*
Author to whom correspondence should be addressed.
Water 2019, 11(2), 389; https://doi.org/10.3390/w11020389
Submission received: 30 December 2018
/
Revised: 11 February 2019
/
Accepted: 16 February 2019
/
Published: 23 February 2019
(This article belongs to the Special Issue Insights on the Water–Energy–Food Nexus)
Abstract
:The increasing scarcity of water is encouraging strategies in water saving and urban water management systems devoted to reducing natural resource consumption and environmental impact. At household and urban scales, there is an increasing interest in onsite greywater and non-potable water reuse systems in order to improve water availability. In this framework, the project GST4Water funded by the European Union (EU) under the POR-FESR 2014–2020 Program of Emilia-Romagna Region, has been developed with the aim to implement water consumption monitoring systems, to define solutions for greywater reuse, and to develop tools for environmental sustainability evaluation applied to water systems. The present study focuses on this last goal, performing a life cycle assessment of the solutions optimized at a district level. In particular, six different scenarios are compared, starting from two models considering traditional water supply together with or without energy consumption related to hot water generation, and five additional models related with different assumptions in terms of greywater recovery systems, and energy and hot water production, at varying percentages of renewable and photovoltaic energy supply. Finally, an evaluation of the return time of environmental investment is carried out, based on the results obtained through the scenario analysis.
1. Introduction
Facing water scarcity is becoming increasingly urgent in the urban context. Climate change, population growth, and limits in natural resources availability threaten water supply systems. Analysis aimed at improving reliability of existing urban infrastructure and the implementation of water-saving strategies represent basic conditions for sustainable and effective development (e.g., [1,2] and references therein). In this context, there is an increasing interest in onsite non-potable water systems, which favor migration towards sustainable and resilient water management at different scales. Greywater supply systems, providing the separation of different domestic wastewater streams, enable cities to reduce their vulnerability with respect to climate change [3].
Both individual consumers (i.e., individual/family flat, multi-flat building, etc.) and public subjects (i.e., local authority, public water utility, private water company, central government, etc.) benefit from the use of alternative water resources. In the first case, there are benefits related to money savings in water supply and drainage bills; on a larger scale, the utilities can reduce the resources required for water and wastewater management (transport and treatment) and reduce the need for the identification of alternative water resources [4]. In residential buildings, wastewater is produced by bathroom sinks, showers, and bathtubs, while kitchen water is excluded due to the high levels of organic matter and solids along with foodborne pathogens [5,6]. Despite in some countries the end-user acceptability for greywater systems is still limited by hygiene concerns [7], this technology has a considerable advantage: greywater is a year-round continuous source of water for non-potable use, reducing demand from local water supplies and impacts from discharge.
Wastewater reuse offers the potential for substantial potable water savings and could be key in limiting the problem of water scarcity, reimagining urban water infrastructure towards efficient water use [8]. In spite of the fact that major sectors reusing treated wastewater are the agricultural (32%) and industrial (19.3%) sectors, it is expected that the future trends in wastewater management increasingly focus on water reuse and resource recovery at municipal and urban scales (8.3% currently). As shown by the Sustainable Urban Drainage Systems (SUDS) index, there is a strong correlation between the urban dimension and the reuse/recovery potential effect: the large urban centers can achieve more efficient recovery solutions compared with the smaller ones [9].
The GST4Water project (Green-Smart Technology for the sustainable use of water resources in buildings and urban areas) is collocated precisely in the context of water saving management: in particular, it has been aimed at supporting sustainable water use and promoting grey water reuse systems at an urban scale. In particular, the project compared the environmental impacts of different recycling and reuse water solutions at a building scale. The present study aims to conduct a similar investigation at a larger scale (district scale), using life cycle assessment (LCA) as a methodology. To this end, a brief summary of the GST4Water project is first presented in Section 1.1; then the methodology used for the analysis is described in Section 1.2, and finally the outline of the research is illustrated in Section 1.3.
1.1. The GST4Water Project
The GST4Water project, funded by the European Union (EU) under the POR-FESR 2014–2020 Program of the Emilia-Romagna Region, consists of four work packages. It is aimed at implementing: (i) real time monitoring systems that record consumption data (both at the user’s connection to the distribution network and at the single sanitary appliance level) and transfer them to the cloud; (ii) a platform for water consumption processing and reporting to operators and users [10]; (iii) analysis and methodologies which allow for integrated decentralized solutions such as rainwater harvesting, grey water reuse, and green technologies; (iv) methods and tools for the assessment of economic and environmental sustainability of solutions at household and urban scales [11].
In order to develop a more sustainable approach to wastewater management and to face the water scarcity problem at the urban scale, suitable models are required; these tools need to be capable to evaluate and compare the impact of different measures and policies for water demand management and water reuse. To this purpose, a novel model based on urban metabolism (GSTMM, Green-Smart Technology Metabolic Model) has been developed within the project to: (i) calculate mass and energy fluxes at multiple scales; (ii) evaluate related performance indicators for both sustainability assessment and benchmarks; and (iii) design grey and meteoric water tanks.
At a household scale, a tool able to easily show to the user the quantity of pollutants generated, energy wasted, or money saved, can help the decision-making process and push towards more sustainable choices. For this purpose, an analytic tool (WSC, Water Sustainability Calculator) was developed to encourage social change by increasing awareness of wastes and costs on the water consumer’s part. By taking advantage of smart technologies, real time monitoring of domestic water consumption, and data transfer to the cloud platform, the WSC tool analyses data and returns several easy-to-read indicators that describe water consumption and environmental impact. The WSC is conceived to work in symbiosis with outdoor water meters that record the volume of water consumed in real time [10].
It is clear that user bad habits and higher standards of living lead to the wasting of water in the domestic context. Therefore, in order to improve the management of water resources, the adoption of different strategies would be optimal in an urban framework; an effective plan should set out (i) a ‘forced saving’ through greywater tank installation, and (ii) a ‘responsible saving’ with the help of software tools available to the user [11] that develop a suite of indicators accounting for consumption performance and sustainability.
Environmental impacts of the selected management practices (i.e., greywater tanks) can be assessed by means of life cycle assessment (LCA) methodology. This powerful tool applied to water recycling solutions provides synthetic indicators for the evaluation of environmental benefits [12]. Following an earlier work [12], that focuses on evaluating and comparing the environmental impacts of different recycling and reuse water solutions at the building scale, the present study aims to conduct a similar investigation at a larger scale (district scale), using life cycle assessment (LCA) as a methodology.
1.2. The Life Cycle Assessment (LCA)
The life cycle approach is commonly used to assess the environmental impact of, and compare different scenarios for, a process or a product.
Life cycle assessment (LCA) based on the ISO 14040-44 (ISO, 2006a,b) [13] has so far played a key role, for instance, in the identification of the best strategy or in the comparison of different end-of-life options from an environmental point of view [14]. However, LCA is also considered a useful tool to support decision making for environmental issues’ solutions, such as evaluation of remediation techniques for contaminated soils and water in order to understand the environmental impacts related with clean-up interventions [15]. Moreover, LCA can be usefully applied to assess environmental impacts related with natural resource valorization and water and energy saving techniques. In this sense, LCA may certainly represent an important tool to support policy makers’ decisions and sustainable urban planning, approaching environmental issues in terms of rainwater harvesting systems and wastewater recycling, at the building level [16].
Within the framework of this particular application, LCA applied by Zanni et al. [12] seems to suggest that the best outcomes, in terms of environmental benefit, should be pursued either through the maximization of usage-intensity of the solutions or with the application on a wider scale, as proposed in the present paper, moving from a single dwelling to neighborhoods and the district scale in order to optimize possible solutions (i.e., urban green technologies) for water recycling. A similar optimization and LCA approach were investigated by Angrill et al. [17] and Vargas Parra [18], for rainwater harvesting systems (RHS) and related infrastructure, in order to explain correctly the actual environmental benefits or, on the contrary, hot spots and disadvantages.
1.3. Research Outline
The research work represents the last step of the above mentioned GST4Water project [12], with the aim to implement the environmental assessment of the urban green technologies’ application at the district scale. The previous work focused at the household level, with the evaluation of rainwater harvesting systems (RHS) and greywater recovery systems (GRS) for different sizes of households in terms of water recovery opportunity and global environmental impact of the solutions. Since the conclusion of the work suggested that the application of these kind of technologies should have been driven by use-intensity related considerations, careful planning at the urban scale, rather than building design only, appears as the best option for GST4Water solution implementation.
For this reason, the present study focused on the environmental impact assessment, performed through LCA, of the possible application of a grid of GRS, optimized at district level, in order to maximize the benefits deriving from a high use-intensity application.
2. Materials and Methods
2.1. Study Area and Data Collection
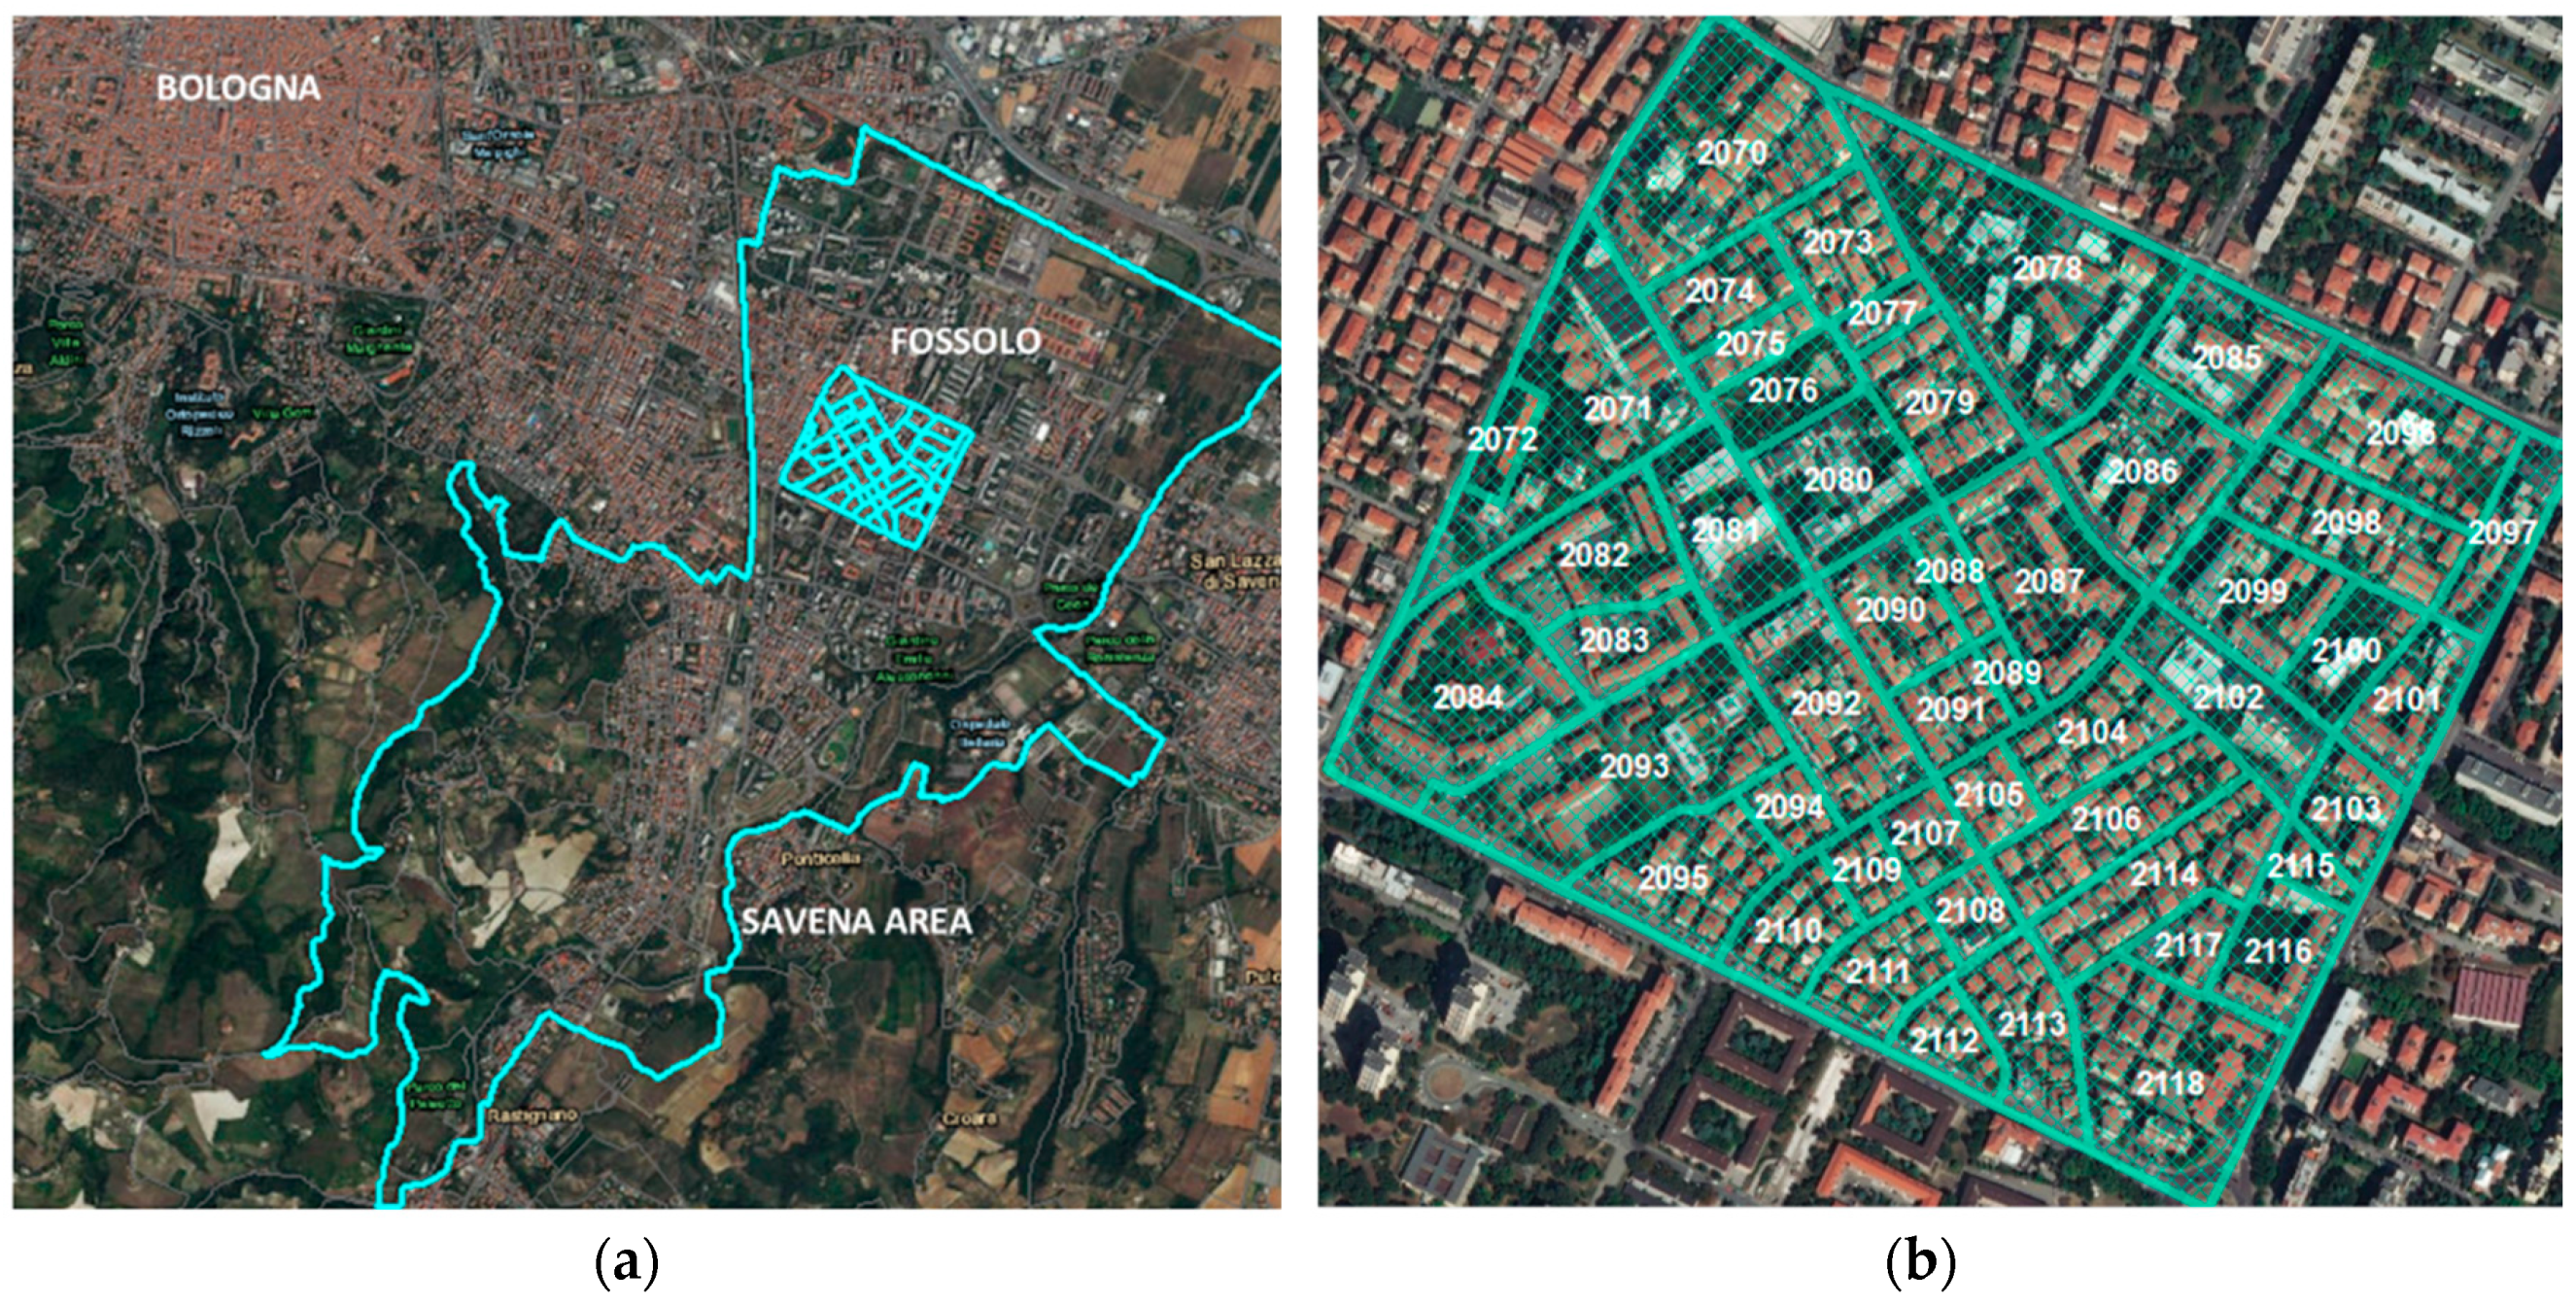
This work explores the environmental impacts linked to GRS installation at the district scale. For this purpose, we selected the urban catchment “Fossolo”, located on the outskirts of Bologna (Italy) within the Savena district, as shown in Figure 1a [19].
The study area extends between via Emilia Levante, via Arno, via Po, and via Ortolani, and covers an area of about 50 ha. The buildings within the area are almost exclusively for residential and tertiary purposes. Population data were taken from the 2011 census data [20]. Figure 1b shows the census sections in the study area, while Table 1 contains the following information: the area extension (m2), the resident population, and the number of buildings in each section.
In order to estimate user’s water consumption in the study area, we adopted data provided by the National Agency for the New Technologies, Energy and Sustainable Economic Development (ENEA). These data derive from a measurement campaign conducted in Bologna, through the installation of indoor and outdoor water meters. The average water consumption is 123 L/person/day while the total water consumption is divided into: personal water consumption (37.7%), bathroom sink (23.2%), shower (5.6%), kitchen sink (17.7%), washing machine (13.2%), and dishwasher (2.5%).
In a previous contribution [12], a quantification of environmental impacts attributable to alternative water supply systems, as well as greywater tanks, was carried out in an LCA framework. This recent work, using two combined models (LCA model and a hydrological model) applied to several configurations of buildings, shows how the use intensity of the solution is tightly bound to impact: indeed, the installation of greywater storage and treatment systems provide a positive impact for densely populated buildings (users served ≥ 30). On this basis, the present work has entailed the census section analysis identifying 80 buildings suitable for greywater technology over 365 days.
Moreover, another significant factor influencing the environmental impacts must be taken into account. Domestic water consumption involves the use of energy, mainly for hot water use, which inevitably produces carbon dioxide. Hot water daily use in residential buildings has been widely investigated and characterized in many research studies. The analysis reported in a previous study [21] provides the residential average daily domestic hot water (DHW) consumption profiles in different countries (Canada, USA, Switzerland, Finland, UK, Germany, France, Spain, and Portugal); the analysis shows an average DHW consumption per occupant of 51.7 L/person/day (reference parameter used to evaluate the building hot water percentage).
Electricity and the combustion of methane gas are the most common sources of energy used by domestic appliances. Considering that approximately a cubic meter of warm water requires 4.8 m3 of methane gas to be burnt, on the basis of the domestic hot water average of 51.7 L/person/day, the equivalent value in terms of heating kWh is 9.5 [22].
Table 1 shows the census sections in the Fossolo district, with corresponding area, population, and number of buildings. These were needed to evaluate the water consumption data of the total population in the study area. Towards this end, GIS maps that associate different attributes to census sections have been used to deduce the number/type of buildings and the number of inhabitants per building. Consequently, the water consumption per building and the water consumption over the whole area (sum of individual contributions) were derived. The last column in Table 1 shows the distribution, among the different sections, of those 80 buildings deemed suitable for the introduction of greywater technology, as explained above.
2.2. Application of LCA Methodology
The application of LCA methodology started defining the goal of the study, i.e., the evaluation of environmental impact assessment for GRS implementation at a district planning level. In order to achieve the identified goal:
- SimaPro 8 has been applied as modeling software [13];
- Ecoinvent 3.3. database has been used as complementary to primary data [13]; and
- ReCiPe 2016 Midpoint (H) V1.01 as the LCIA (life cycle impact assessment) calculation method, focused on midpoint indicators and compliant with ISO 14044 [13].In order to simplify the visualization of data and the following uncertainties evaluation over the typical 18 midpoint indicators, only five main impact categories are reported, i.e., Global Warming (GW), Stratospheric Ozone Depletion (OD), Land Occupation (LO), Water Consumption (WC), and Fossil Resource Scarcity (FS);
- A cradle-to-grave approach has driven the assessment;
- The GRS system has been modeled in accordance with Zanni et al. [12], in terms of technological elements over the whole life cycle (i.e., production, installation, use and maintenance, end-of-life), time span (i.e., 50 years), and water balance (i.e., considering a general water saving of 30% to be attributed to GRS implementation);
- Water consumption per person per day has been updated, following considerations reported in Section 2.1;
- Energy demand for DHW generation has been modeled as indicated in the abovementioned Section 2.1; and
- Several scenarios have been defined, following two main frameworks, i.e., including hot water generation into energy supply requirements or considering a standard perspective, i.e., excluding the abovementioned requirement.
In particular, two scenarios framing business-as-usual were built for the district described in Section 2.1, considering water supply and wastewater discharge for the totality of the buildings, over a time span of 50 years, as suggested by Angrill et al. [17].
The ”Scenario 0” models the standard, while “Scenario 1” considers also hot water generation by electricity retrieved from the national grid, i.e., applying the Italian country mix as proposed by Ecoinvent 3.3.
Scenarios 2 and 3 model the application of GRS, following previous studies [12], firstly excluding, and then considering hot water generation.
The last three scenarios 4–6 are aimed at outlining the application of GRS in a framework of general interventions to improve the sustainability of the neighborhood, i.e., considering a quota of electricity as supplied by photovoltaic systems (100%, 50%, or 10%).
Scenarios studied are summarized in Table 2.
Following the scenarios definition and LCIA, a scenarios analysis has been applied to evaluate environmental impact and benefit deriving from technological solution implementation, in comparison between the application of GST4Water solution and its related “zero option”, i.e., business-as-usual with or without considering hot water production.
Scenario analyses performed are summarized in Table 3.
As a final step of environmental impact assessment, an evaluation of time necessary to achieve the complete return of environmental investment has been performed, based on the environmental benefits obtained as results of the scenario analysis. In particular, the return time has been calculated as inversely dependent from scenario evaluation and impact/benefit generated, i.e., considering the environmental impacts and/or benefit generated over the whole life cycle of the solution proposed and the time span of its application, a yearly environmental balance has been traced and the time for return of the investment assessed consequently.
3. Results
First, the different scenarios have been evaluated in terms of environmental impact characterization, based on the ReCiPe method’s five main impact categories. Table 4 reports numerical results in terms of each category: Global Warming (GW, unit: kg CO2 eq), Stratospheric Ozone Depletion (SOD, unit: kg CFC11 eq), Land Occupation (LO, unit: m2a crop eq), Fossil Resource Scarcity (FS, unit: kg oil eq) and Water Consumption (WC, unit: m3); each category is reported with units, so that actual values can be compared. Scenarios 0 and 2 rank last in each category, except for LO, where they rank first and second, respectively. Figure 2 shows the percentage of total impact due to each category for the proposed scenarios; GW and FS are dominant for each scenario, while WC and LO are less influential and rank third or fourth depending on the scenario.
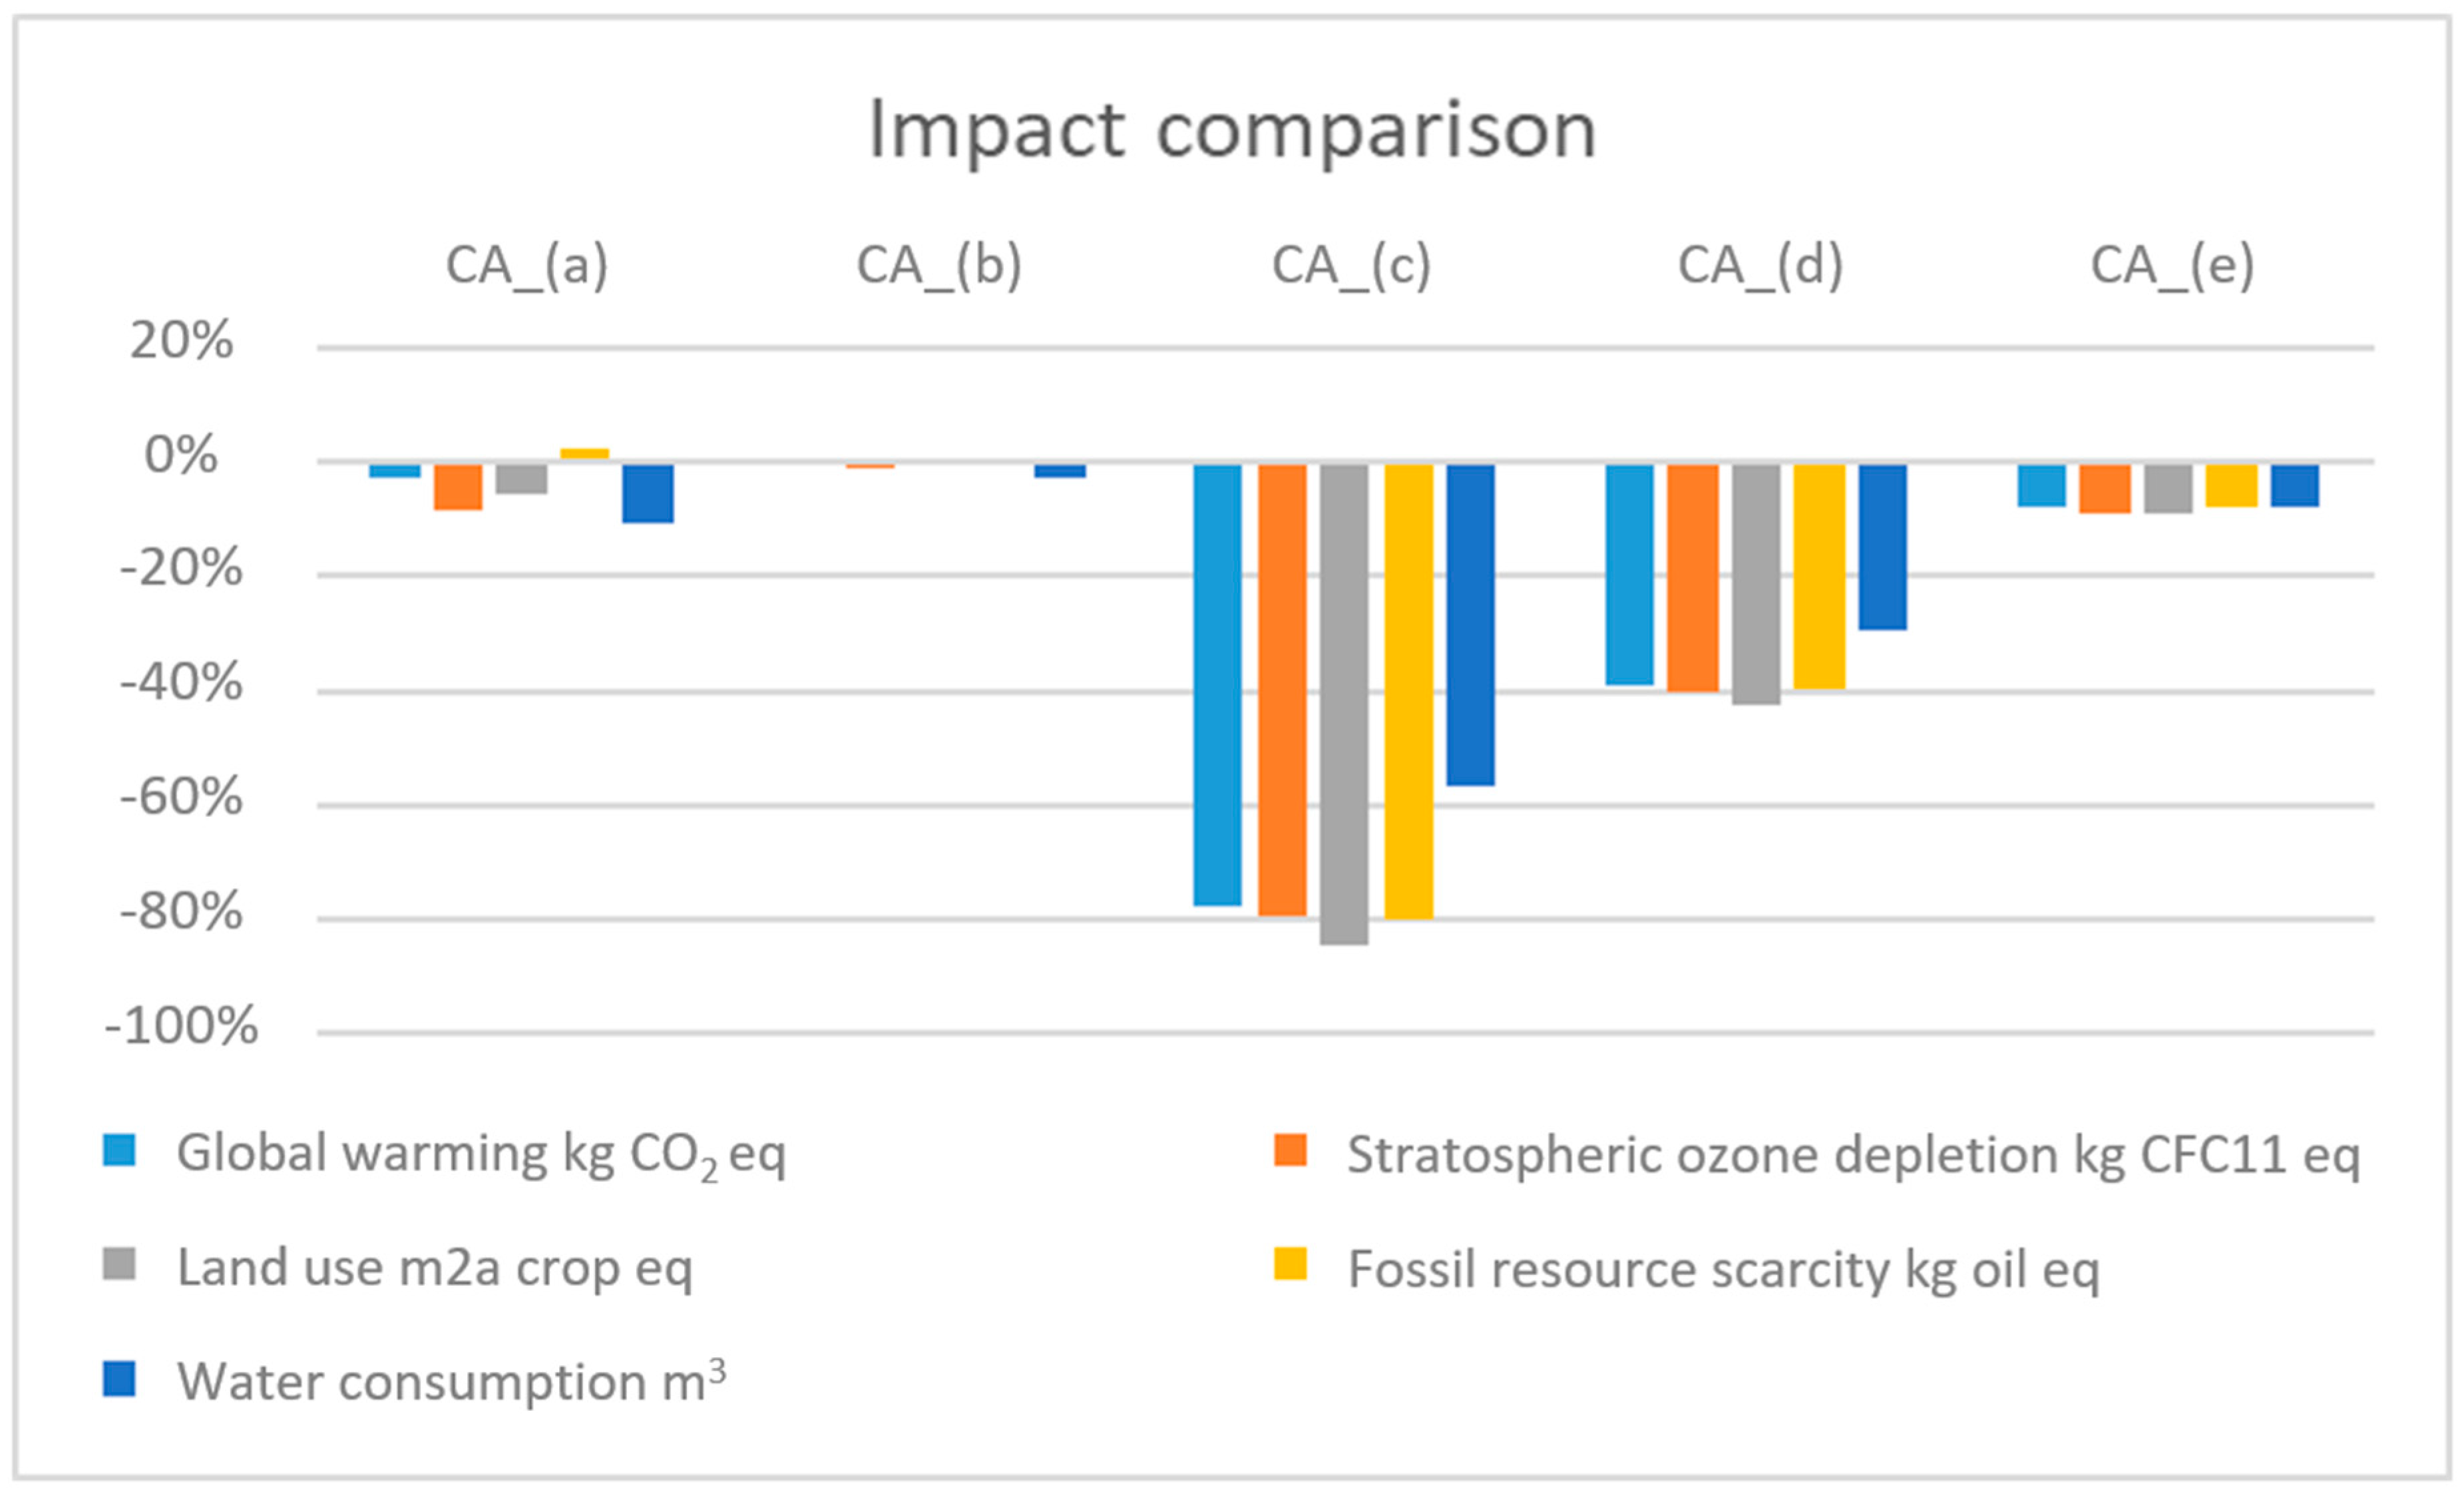
Table 5 lists the numerical results of the impact comparison CA (comparative assessment), from (a) to (e) as explained in Table 3; results are shown as percent impact decrease or increase for each category with respect to the base scenario defined in Table 3. Figure 3 shows the same impact comparison as the histogram graph. It is clearly seen that CA_(c) implies the most marked impact decrease for all categories, followed by CA_(d) and CA_(e), while the overall impact decrease for CA_(b) and CA_(a) is very low, with some categories showing a modest increase rather than a decrease.
Finally, in Table 6 the return time of each environmental impact related with each scenario analysis is reported. It is seen that return times vary widely between different comparison analyses, with CA_(b) showing very large return times for each category, followed by CA_(a) and CA_(e), while CA_(c) and CA_(d) show return times of 1–3 years for each category and overall.
4. Discussion
The impact characterization shows how impacts are distributed in all scenarios analyzed. Business-as-usual (BaU) apparently generates the lowest impact level for Fossil Resource Scarcity and the second lowest for Global Warming, because of the absence of technological support and equipment construction’s related impacts. On the contrary, the other scenarios present higher impacts due to the production of the greywater recycling tank and/or photovoltaic panels, where an alternative energy production system is outlined. The BaU scenario, obviously, shows a higher impact in terms of water scarcity, confirming the efficiency of solutions proposed at the local level.
All the solutions including any kind of technologies or equipment for energy supply or water collection and storage seem to be more impacting, compared to the BaU scenario, as already outlined in previous studies [12], but this is typically related to the scope of the LCA, which focuses on the global level, against the solution, which focuses at the local scale to fight against water scarcity.
As suggested by the analysis of the impact comparison data, the best outlook for this urban green technology application is represented by the concurrent application of both GRS, optimized at the neighborhood scale, and photovoltaic panels, providing 100% of energy supply, for hot water generation also (CA_(c)). Then, a lower impact profile is outlined for the two scenarios considering, respectively, 50% and 10% of electricity produced using photovoltaic panels, with a linear behavior of the environmental impacts in relation to the percentage of photovoltaic energy supply.
Through the evaluation of return time for the environmental investment, it can be underlined that only Water Consumption presents favorable conditions, in terms of environmental investment, with a return time shorter than the expected lifespan of the technological solution proposed. For the Fossil Resource Scarcity, it is not possible to envisage a return time, since the environmental impact is always negative. In terms of hot water production, a useful return time is possible only in the case of a photovoltaic energy supply application, with extraordinary results with higher percentages of renewable energy supply.
As already shown by Zanni et al. [12], environmental sustainability can be achieved only in the case of a district scale design and not at the single building level. For some impact categories, such as Fossil Resource Scarcity, no return time can be reached because of the materials utilized for GRS equipment and photovoltaic panel construction.
An interesting development of the present study could be a life cycle assessment in the case of a wide application of secondary raw materials for GRS equipment.
5. Conclusions
Water saving is a critical and challenging problem that has to be faced at different levels by resorting to multiple actions. Actions should be focused at: (i) increasing the sustainability of water withdrawals in order to preserve natural water resources, (ii) assuring the reliability of water supply systems in order to reduce the wasting of water, and (iii) enhancing water reuse strategies through the evaluation of the best technological solutions. Here, we focused on this last action.
Specifically, in this work, we have shown how water saving technologies at the building scale, such as greywater recovery systems (GRS), can be evaluated at a larger scale, i.e., the district scale, through an LCA approach, and in combination with renewable energy solutions. This kind of analysis allows the supporting of decision making by comparing the environmental impacts of different technological combinations at the planning level.
Results of this study show that it is indispensable to analyze the potentiality of water saving technologies at different scales, in order to optimize their design while minimizing the return time for the environmental investment.
Author Contributions
The individual contributions are provided in this section. Conceptualization, A.B., V.C. and V.D.F.; methodology, S.Z., V.C. and E.D.F.; software, S.Z.; validation, S.Z., A.B. and V.D.F.; formal analysis, S.Z.; investigation, S.Z. and V.C.; resources, I.L.; data curation, S.Z.; E.D.F. and I.L.; writing—original draft preparation, S.Z., A.B. and E.D.F; writing—review and editing, V.D.F., S.Z., A.B. and E.D.F.; supervision, V.C.; project administration, A.B. and V.D.F.
Funding
This research was funded by project GST4Water, funded by the EU under the POR-FESR 2014–2020 Emilia-Romagna Region Program, grant number 735387.
Acknowledgments
The authors would like to thank all Colleagues involved in the project GST4Water, and in particular Marco Franchini and Stefano Alvisi (University of Ferrara, Italy), Marco Maglionico and Sara Simona Cipolla (DICAM, University of Bologna, Italy), ENEA and the other colleagues involved in data collection and in Green Technologies and Greywater systems modeling for their cooperation in this study.
Conflicts of Interest
The authors declare no conflict of interest. The funders had no role in the design of the study; in the collection, analyses, or interpretation of data; in the writing of the manuscript, or in the decision to publish the results.
References
- WWAP (United Nations World Water Assessment Programme). The United Nations World Water Development Report 2015: Water for a Sustainable World; UNESCO (United Nations Educational, Scientific and Cultural Organization): Paris, France, 2015. [Google Scholar]
- Liserra, T.; Maglionico, M.; Ciriello, V.; Di Federico, V. Evaluation of Reliability Indicators for WDNs with Demand-Driven and Pressure-Driven Models. Water Resour. Manag. 2014, 28, 1201–1217. [Google Scholar] [CrossRef]
- Zimmermann, M.; Felmeden, J.; Bernhard, M. Integrated Assessment of Novel Urban Water Infrastructures in Frankfurt am Main and Hamburg, Germany. Water 2018, 10, 211. [Google Scholar] [CrossRef]
- Friedler, E.; Hadari, M. Economic feasibility of on-site greywater reuse in multi-storey buildings. Desalination 2006, 190, 221–234. [Google Scholar] [CrossRef] [Green Version]
- Eriksson, E.; Auffarth, K.; Henze, M.; Ledin, A. Characteristics of grey wastewater. Urban Water 2002, 4, 85–104. [Google Scholar] [CrossRef]
- National Academies of Sciences, Engineering and Medicine. Using Graywater and Stormwater to Enhance Local Water Supplies: An Assessment of Risks, Costs, and Benefits; The National Academies Press: Washington, DC, USA, 2016; pp. 9–12. ISBN 978-0-309-38835-1. [Google Scholar]
- Domiínguez, I.; Ward, S.; Mendoza, J.G.; Rincòn, C.I.; Oviedo-Ocana, E.R. End-User Cost-Benefit Prioritization for Selecting Rainwater Harvesting and Greywater Reuse in Social Housing. Water 2017, 9, 516. [Google Scholar] [CrossRef]
- Al-Jayyousi, O. Greywater reuse: Towards sustainable water management. Desalination 2003, 156, 181–192. [Google Scholar] [CrossRef]
- WWAP (United Nations World Water Assessment Programme). The United Nations World Water Development Report 2017. Wastewater: The Untapped Resource; UNESCO (United Nations Educational, Scientific and Cultural Organization): Paris, France, 2017. [Google Scholar]
- Luciani, C.; Casellato, F.; Alvisi, S.; Franchini, M. From water consumptions smart metering to leakage characterization at district and user level: The GST4Water project. In Proceedings of the 3rd EWaS International Conference on Insights on the Water-Energy-Food Nexus, Lefkada Island, Greece, 27–30 June 2018. [Google Scholar]
- Di Fusco, E.; Lenci, A.; Liserra, T.; Ciriello, V.; Di Federico, V. Sustainability assessment of urban water use from building to urban scale in the GST4Water project. In Proceedings of the 3rd EWaS International Conference on Insights on the Water-Energy-Food Nexus, Lefkada Island, Greece, 27–30 June 2018. [Google Scholar]
- Zanni, S.; Cipolla, S.S.; Di Fusco, E.; Lenci, A.; Altobelli, M.; Currado, A.; Maglionico, M.; Bonoli, A. Modeling for sustainability: Life cycle assessment application to evaluate environmental performance of water recycling solutions at the dwelling level. Sustain. Prod. Consumption 2019, 17, 47–61. [Google Scholar] [CrossRef]
- International Organization for Standardization (ISO). Environmental management—Life cycle assessment—Requirements and guidelines; UNI EN ISO 14044; ISO: Geneva, Switzerland, 2006. [Google Scholar]
- Princigallo, R.; Visini, D.; Bonoli, A.; Olsen, S.I.; Niero, M. Comparative environmental and economic assessment of production, use and recycling of aluminium cans: Bologna vs Copenhagen. In Proceedings of the 10th Convegno dell’ Associazione Rete Italiana LCA, Ravenna, Italy, 23–24 June 2016. [Google Scholar]
- Antonozzi, L.; Bonoli, A.; Zanni, S. Life cycle assessment (LCA) as a means of comparison between active and passive remediation technology for wastewater and contaminated soils. Environ. Eng. Manag. J. 2013, 12, 141–144. [Google Scholar]
- Bonoli, A.; Mastroddi, M.; Zanni, S. A Life Cycle Assessment application to evaluate environmental issues in saving and reusing water at domestic level. In Proceedings of the ICEEM09—9th International Conference on Environmental Engineering and Management, Bologna, Italy, 6–9 September 2017. [Google Scholar]
- Angrill, S.; Farreny, R.; Gasol, C.M.; Gabarrell, X.; Vinolas, B.; Josa, A.; Rieradevall, J. Environmental analysis of rainwater harvesting infrastructures in diffuse and compact urban models of Mediterranean climate. Int. J. Life Cycle Assess. 2012, 17, 25–42. [Google Scholar] [CrossRef]
- Vargas Parra, M.V. Optimizing Rainwater Harvesting Systems in Urban Areas. Ph.D. Thesis, Universitat Autònoma de Barcelona (UAB), Bellaterra, Spain, 2015. [Google Scholar]
- Freni, G.; Maglionico, M.; Mannina, G.; Viviani, G. Comparison between a detailed and a simplified integrated model for the assessment of urban drainage environmental impact on an ephemeral river. Urban Water J. 2008, 5, 87–96. [Google Scholar] [CrossRef]
- Istituto Nazionale di Statistica. Available online: https://www.istat.it/it/archivio/104317 (accessed on 29 November 2018).
- Fuentes, E.; Arce, L.; Salom, J. A review of domestic hot water consumption profiles for application in systems and buildings energy performance analysis. Renew. Sustain. Energy Rev. 2018, 81, 1530–1547. [Google Scholar] [CrossRef]
- Regione Emilia Romagna. Available online: https://energia.regione.emilia-romagna.it/servizi-on-line/allegati-banche-dati (accessed on 29 November 2018).
- Byrne, D.M.; Lohman, H.A.C.; Cook, S.M.; Peters, G.M.; Guest, J.S. Life cycle assessment (LCA) of urban water infrastructure: emerging approaches to balance objectives and inform comprehensive decision-making. Environ. Sci.: Water Res. Technol. 2017, 3, 1002–1014. [Google Scholar] [CrossRef]
Figure 1.
(a) Location of the urban catchment Fossolo, located in the Savena district on the outskirts of Bologna (Italy); (b) census sections (48) in the study area.
Figure 1.
(a) Location of the urban catchment Fossolo, located in the Savena district on the outskirts of Bologna (Italy); (b) census sections (48) in the study area.

Figure 2.
Percentage impact of impact categories for the scenarios proposed.

Figure 3.
Scenario analysis: impact comparison.


Table 1.
Census sections in the Fossolo district (Bologna, Italy), with relative area, population, number of buildings, and the distribution of the 80 buildings suitable for greywater technology (GT; users served ≥ 30).
Table 1.
Census sections in the Fossolo district (Bologna, Italy), with relative area, population, number of buildings, and the distribution of the 80 buildings suitable for greywater technology (GT; users served ≥ 30).
| Section | Area (m2) | Population | No. of Buildings | No. of Buildings for GT |
|---|---|---|---|---|
| 2070 | 24,374.79 | 530 | 16 | 10 |
| 2071 | 24,671.03 | 293 | 6 | 7 |
| 2072 | 2982.23 | - | - | - |
| 2073 | 8503.02 | 178 | 10 | - |
| 2074 | 7125.11 | 113 | 7 | - |
| 2075 | 3590.59 | 87 | 4 | - |
| 2076 | 6376.07 | - | - | - |
| 2077 | 2630.26 | 79 | 2 | 2 |
| 2078 | 32,327.14 | 483 | 13 | 5 |
| 2079 | 11,225.21 | 271 | 9 | 6 |
| 2080 | 12,424.63 | 440 | 8 | 2 |
| 2081 | 11,307.06 | 231 | 2 | 3 |
| 2082 | 12,369.22 | 152 | 5 | - |
| 2083 | 7217.72 | 70 | 3 | - |
| 2084 | 21,410.64 | 211 | 6 | - |
| 2085 | 12,381.18 | 281 | 4 | 2 |
| 2086 | 15,742.14 | 505 | 7 | 6 |
| 2087 | 16,520.92 | 565 | 10 | 4 |
| 2088 | 3380.76 | 18 | 2 | - |
| 2089 | 1828.27 | 16 | 3 | - |
| 2090 | 8546.78 | 147 | 7 | 1 |
| 2091 | 5705.43 | 143 | 9 | 1 |
| 2092 | 14,951.23 | 318 | 18 | 2 |
| 2093 | 26,037.81 | 181 | 7 | 2 |
| 2094 | 3799.51 | 49 | 5 | - |
| 2095 | 12,442.82 | 209 | 13 | 1 |
| 2096 | 16,132.80 | 242 | 17 | - |
| 2097 | 7098.37 | 84 | 3 | 3 |
| 2098 | 12,961.85 | 204 | 17 | - |
| 2099 | 11,381.78 | 351 | 5 | 2 |
| 2100 | 6584.84 | 58 | 2 | 1 |
| 2101 | 7910.70 | 263 | 4 | 3 |
| 2102 | 11,046.24 | 157 | 2 | 1 |
| 2103 | 6102.79 | 146 | 4 | 3 |
| 2104 | 9494.81 | 261 | 10 | 5 |
| 2105 | 4244.19 | 137 | 6 | 2 |
| 2106 | 12,211.87 | 118 | 23 | - |
| 2107 | 4256.30 | 59 | 4 | 1 |
| 2108 | 3862.24 | 36 | 3 | 1 |
| 2110 | 7462.64 | 106 | 13 | - |
| 2111 | 7884.86 | 84 | 15 | - |
| 2112 | 4854.74 | 35 | 8 | - |
| 2113 | 9854.85 | 102 | 14 | - |
| 2114 | 13,517.22 | 258 | 19 | - |
| 2115 | 2357.12 | 26 | 2 | 1 |
| 2116 | 8123.67 | 166 | 3 | 1 |
| 2117 | 4080.01 | 101 | 3 | 1 |
| 2118 | 21,677.89 | 306 | 13 | 1 |
Table 2.
Scenario outline.
| Scenario | Definition | Details |
|---|---|---|
| 0 | Business-as-Usual (BaU) | Case study modeling, with traditional water supply |
| 1 | Business-as-Usual + Hot Water (BaU+HW) | Case study modeling, with traditional water supply, considering electricity consumption for hot water generation |
| 2 | Greywater Recovery System (GRS) | Case study modeling, including optimized GRS [15] |
| 3 | Greywater Recovery System + Hot Water (GRS+HW) | Case study modeling, including optimized GRS [15], considering electricity consumption for hot water generation |
| 4 | Greywater Recovery System + Hot Water + Photovoltaic (GRS+HW+PV) | Case study modeling, including optimized GRS [15], considering electricity consumption for hot water generation, as totally supplied by photovoltaic panels |
| 5 | Greywater Recovery System + Hot Water + 50% Photovoltaic (GRS+HW+50%PV) | Case study modeling, including optimized GRS [15], considering electricity consumption for hot water generation, as 50% supplied by photovoltaic panels |
| 6 | Greywater Recovery System + Hot Water + 10% Photovoltaic (GRS+HW+10%PV) | Case study modeling, including optimized GRS [15], considering electricity consumption for hot water generation, as 10% supplied by photovoltaic panels |
Table 3.
Scenario analysis. CA: comparative assessment.
| Analysis | Scenarios Compared | Details |
|---|---|---|
| CA_(a) | 0–1 | Comparison between BaU scenarios, aimed to evaluate environmental impact of electricity consumption for hot water generation |
| CA_(b) | 3–1 | Comparison between scenarios of application for GRS solutions, aimed to evaluate environmental impact of electricity consumption for hot water generation |
| CA_(c) | 4–1 | Comparison between scenarios of application for GRS solutions, aimed to evaluate environmental impact of electricity consumption for hot water generation, where photovoltaic panels would provide 100% of energy supply |
| CA_(d) | 5–1 | Comparison between scenarios of application for GRS solutions, aimed to evaluate environmental impact of electricity consumption for hot water generation, where photovoltaic panels would provide 50% of energy supply |
| CA_(e) | 6–1 | Comparison between scenarios of application for GRS solutions, aimed to evaluate environmental impact of electricity consumption for hot water generation, where photovoltaic panels would provide 10% of energy supply |
Table 4.
Impact characterization: numerical results. GW: Global Warming; SOD: Stratospheric Ozone Depletion; LO: Land Occupation; FS: Fossil Resource Scarcity; WC: Water Consumption.
Table 4.
Impact characterization: numerical results. GW: Global Warming; SOD: Stratospheric Ozone Depletion; LO: Land Occupation; FS: Fossil Resource Scarcity; WC: Water Consumption.
| Scenario | Impact Category | ||||
|---|---|---|---|---|---|
| GW (kg CO2 eq) | SOD (kg CFC11 eq) | LO (m2a crop eq) | FS (kg oil eq) | WC (m3) | |
| Scenario 0 | 394,922.2 | 0.587921 | 9,214,498 | 86,973,34 | 44,867.07 |
| Scenario 2 | 385,692.8 | 0.537786 | 8,692,913 | 89,241,61 | 40,234.69 |
| Scenario 1 | 8,168,212 | 5,907,437 | 311,883.7 | 2,175,785 | 194,391.2 |
| Scenario 3 | 8,158,982 | 5,857,302 | 311,362.1 | 2,178,053 | 189,758.8 |
| Scenario 4 | 1,801,823 | 1,198,032 | 47,937.07 | 434,703.1 | 83,573.57 |
| Scenario 5 | 4,980,403 | 3,527,667 | 179,649.6 | 1,306,378 | 136,666.2 |
| Scenario 6 | 7,523,266 | 5,391,375 | 285,019.6 | 2,003,718 | 179,140.3 |
Table 5.
Impact comparison: numerical results.
| Impact Category | CA_(a) | CA_(b) | CA_(c) | CA_(d) | CA_(e) |
|---|---|---|---|---|---|
| GW | −2.3% | −0.1% | −77.9% | −39.0% | −7.9% |
| SOD | −8.5% | −0.8% | −79.7% | −40.3% | −8.7% |
| LO | −5.7% | −0.2% | −84.6% | −42.4% | −8.6% |
| FS | 2.6% | 0.1% | −80.0% | −40.0% | −7.9% |
| WC | −10.3% | −2.4% | −57.0% | −29.7% | −7.8% |
| Average | −4.8% | −0.7% | −75.9% | −38.3% | −8.2% |
Table 6.
Scenarios analysis: Return time for the environmental impacts generated (years).
| Impact Category | CA_(a) | CA_(b) | CA_(c) | CA_(d) | CA_(e) |
|---|---|---|---|---|---|
| GW | 43 | 885 | 1 | 3 | 13 |
| SOD | 12 | 118 | 1 | 2 | 11 |
| LO | 18 | 598 | 1 | 2 | 12 |
| FS | - | - | 1 | 3 | 13 |
| WC | 10 | 42 | 2 | 3 | 13 |
| Overall return time for environmental investment | 21 | 147 | 1 | 3 | 12 |
© 2019 by the authors. Licensee MDPI, Basel, Switzerland. This article is an open access article distributed under the terms and conditions of the Creative Commons Attribution (CC BY) license (http://creativecommons.org/licenses/by/4.0/).
Share and Cite
MDPI and ACS Style
Bonoli, A.; Di Fusco, E.; Zanni, S.; Lauriola, I.; Ciriello, V.; Di Federico, V. Green Smart Technology for Water (GST4Water): Life Cycle Analysis of Urban Water Consumption. Water 2019, 11, 389. https://doi.org/10.3390/w11020389
AMA Style
Bonoli A, Di Fusco E, Zanni S, Lauriola I, Ciriello V, Di Federico V. Green Smart Technology for Water (GST4Water): Life Cycle Analysis of Urban Water Consumption. Water. 2019; 11(2):389. https://doi.org/10.3390/w11020389
Chicago/Turabian StyleBonoli, Alessandra, Emanuela Di Fusco, Sara Zanni, Ilaria Lauriola, Valentina Ciriello, and Vittorio Di Federico. 2019. "Green Smart Technology for Water (GST4Water): Life Cycle Analysis of Urban Water Consumption" Water 11, no. 2: 389. https://doi.org/10.3390/w11020389
Note that from the first issue of 2016, this journal uses article numbers instead of page numbers. See further details here.