Spatial and Temporal Variation of Dissolved Heavy Metals in the Mun River, Northeast Thailand
by
 , , ,
, , ,
Bin Liang
1 ,
,
Guilin Han
1,*,
Man Liu
1,
Xiaoqiang Li
1,
Chao Song
2,
Qian Zhang
3,4 and
Kunhua Yang
1 1
Institute of Earth Sciences, China University of Geosciences (Beijing), Beijing 100083, China
2
Institute of Hydrogeology and Environmental Geology, Chinese Academy of Geological Sciences, Shijiazhuang 050061, China
3
School of Water Resources and Environment, China University of Geosciences (Beijing), Beijing 100083, China
4
Institute of Geographic Sciences and Natural Resources Research, Chinese Academy of Sciences, Beijing 100101, China
*
Author to whom correspondence should be addressed.
Water 2019, 11(2), 380; https://doi.org/10.3390/w11020380
Submission received: 22 January 2019
/
Revised: 16 February 2019
/
Accepted: 19 February 2019
/
Published: 22 February 2019
(This article belongs to the Special Issue Environmental Chemistry of Water Quality Monitoring)
Abstract
:River water samples between August 2017 (wet season) and March 2018 (dry season) from the Mun River Basin in northeast Thailand were collected and their dissolved heavy metals concentrations (Al, Mn, Fe, Cu, Zn, and Ba) were measured. Compared with international drinking water guidelines, Mn was the dominant pollutant in the dry season. The correlation analysis (CA) suggested that similar sources were shown in each element pair of Al-Fe, Mn-Zn, and Fe-Ba in both seasons. The principal component analysis (PCA) results showed that the dominant source of dissolved heavy metals was sedimentary inputs or colloid destabilization in the wet season, while anthropogenic inputs were the main sources in the dry season, such as agricultural runoff, industrial effluents, and domestic discharge. On the basis of water quality index (WQI), water at most sites in the wet and dry seasons can be categorized as excellent water, except for a few sites with substandard values. The river water posed no significant health risks according to the health risk assessment, but Mn, Fe, and Ba needed to be paid more attention due to the relatively high values. Al, Fe, and Ba were the main dissolved heavy metals flowing into the Mekong River, and Cu contributed to the background value in the Mekong river.
1. Introduction
Heavy metals are a global concern due to their effects on ecological risks to human health [1,2,3,4]. Moreover, heavy metals are difficult to be degraded or relieved of harmfulness through physical, chemical, or biological purification in natural environments [5], and can cause severe diseases, such as nervous disorders, visceral dysfunction, and cancers, through food chains [6,7]. Heavy metals in the dissolved phase are one of the most harmful substances that can directly affect the water quality of drinking water and irrigation water [8,9,10,11], and they are of greater toxicity than those in suspended and sedimentary phases [12,13,14]. In order to control water pollution and protect local water resources, it is of great significance to understand the spatial distribution, temporal variation, and sources of dissolved heavy metals, as well as the water quality and health risk level of water.
The Mun river, a large drainage basin in northeastern Thailand, receives large amounts of heavy metal pollutants from different sources every year. Sources of dissolved heavy metals in the river may include emissions by industrial activities [7,15], urban construction [9,16], vehicle exhaust [17], etc. Many heavy metal elements used to be detected in industrial and domestic sewage without treatment, such as Al, Cr, Mn, Fe, Ni, Cu, Zn, Cd, Sb, Ba, Pb, etc. [3,8]. In addition, agriculture lands occupy the main area of the drainage basin [18], where the emission sources of agricultural activities have to be taken into consideration, such as commercial fertilizers, pesticides, and sewage sludge containing a variety of heavy metals [19,20,21], which may divert the sources of dissolved heavy metals. Moreover, the factors of heavy metal enrichment may change with the seasons.
To identify the possible pollution sources of dissolved heavy metals in the Mun River, 104 water samples were collected from 57 sampling sites in the Mun River, northeast Thailand, during the wet season (August 2017) and dry season (March 2018). Multivariate statistical methods were applied to six dissolved heavy metals (Al, Mn, Fe, Cu, Zn, and Ba), including correlation analysis (CA) and principal component analysis (PCA). Water quality index (WQI) was performed to evaluate the water quality, and hazard quotient (HQ) and hazard index (HI) were calculated to assess the risk to human health. The purpose of this article is to help develop local water management for preventing hazardous contamination of dissolved heavy metals.
2. Materials and Methods
2.1. Study Area
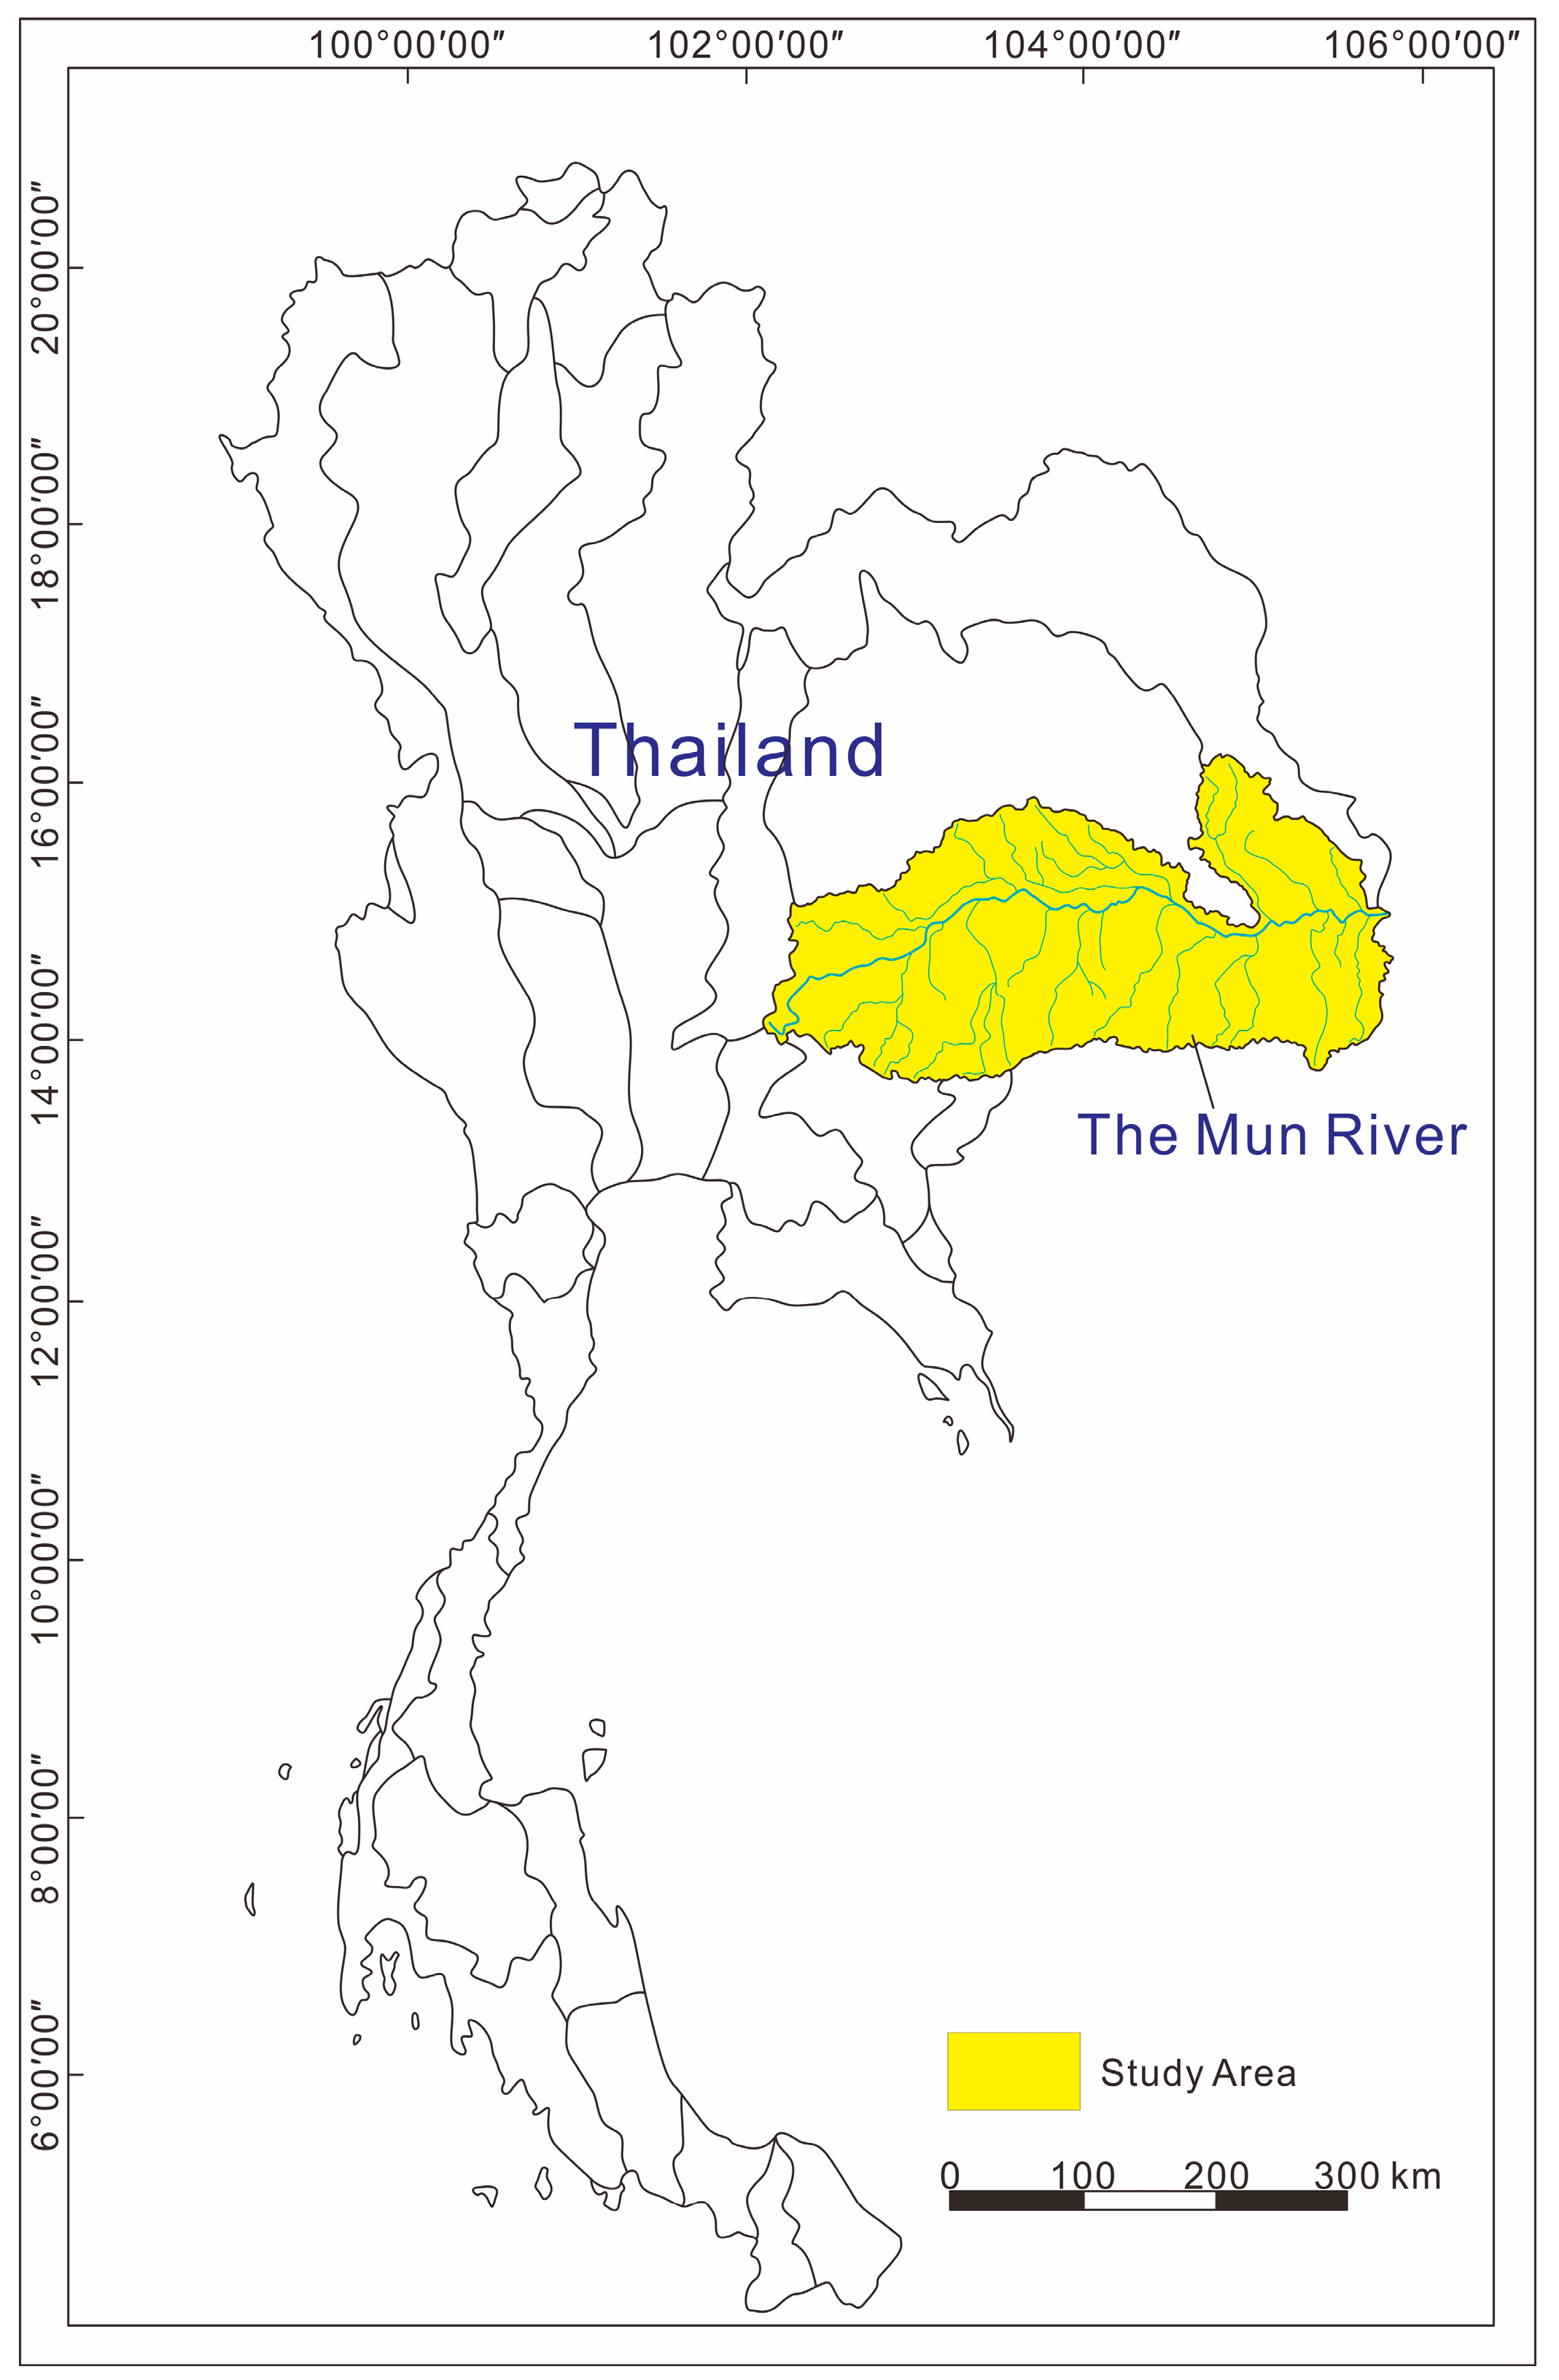
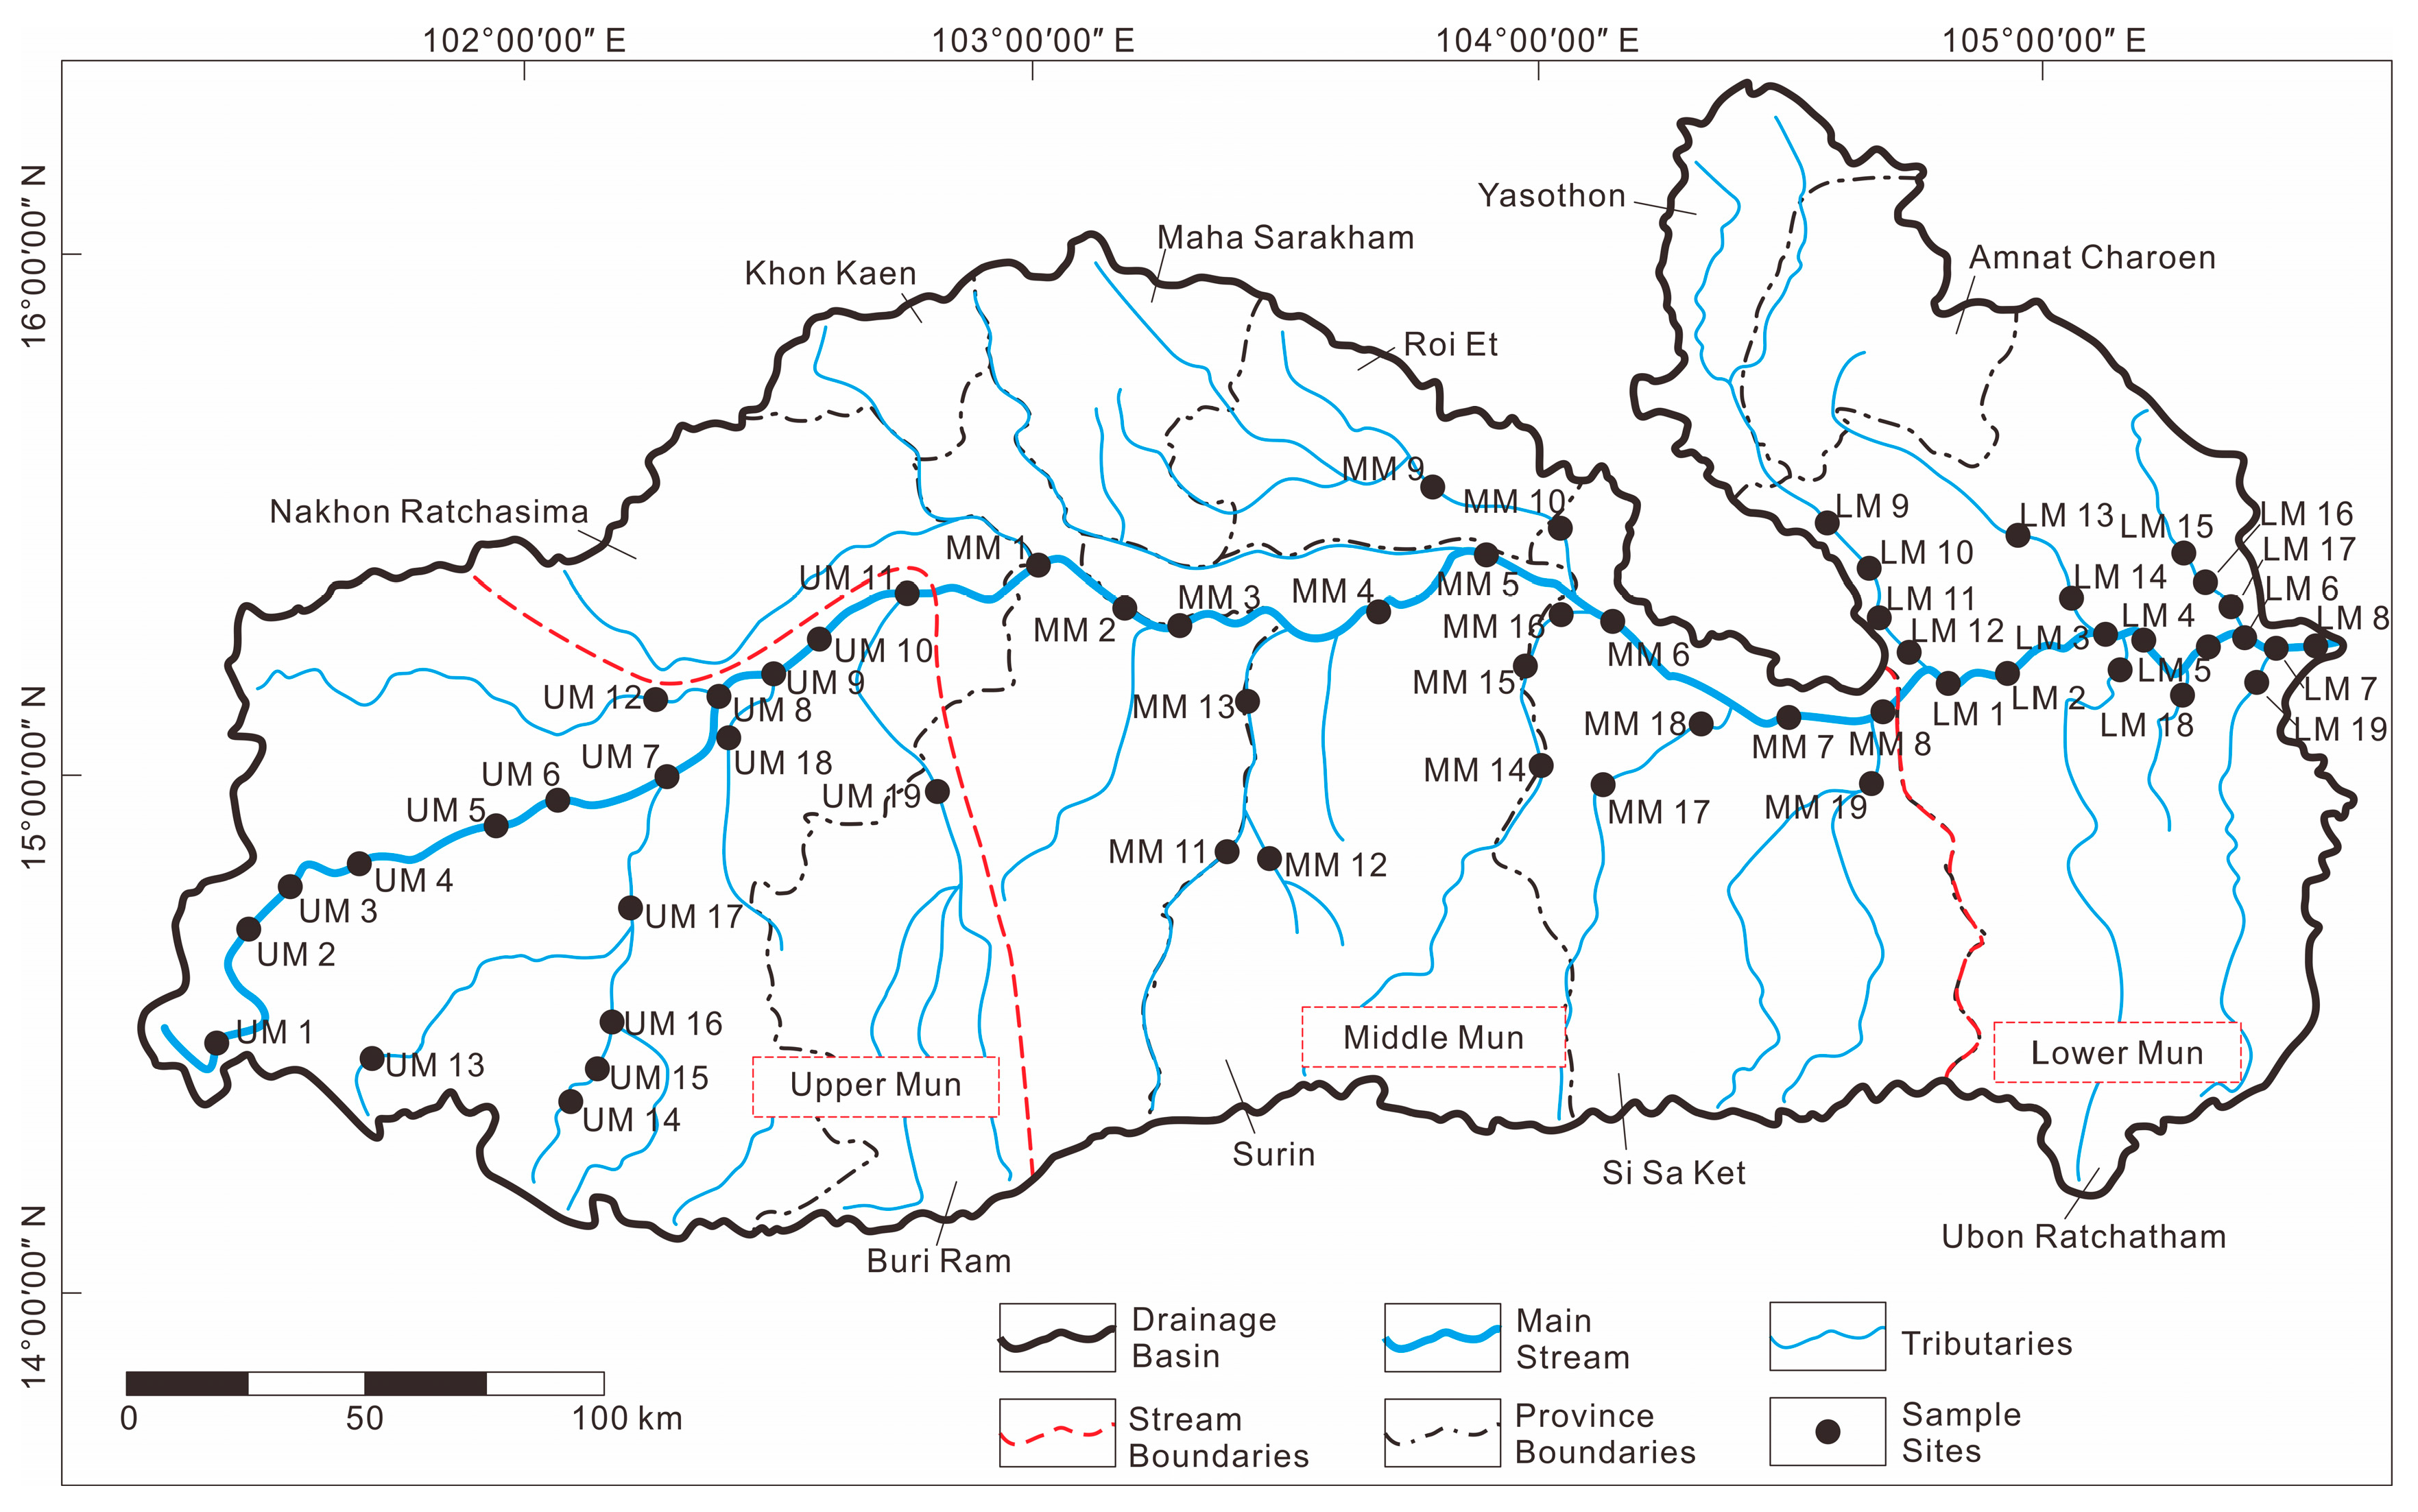
The Mun River is the largest river in the northeastern part of Thailand (Figure 1) and is also a right bank tributary of the Mekong River. It lies in the drainage basin approximately between latitudes of 14°00′ N–16°00′ N and longitudes 101°30′ E–105°30′ E (Figure 1). The whole drainage basin has an approximate area of 82,000 km2 [22], where plateaus and mountains are located in the southwestern area, and plains are situated in the central and eastern areas [23]. The Mun River originates from Nakhon Ratchasima and flows towards the east for 673 km until it joins the Mekong River in the Ubon Ratchathani province (Figure 2) [19]. The average runoff rate of the Mun River is about 959 m3/s during the wet season and 367 m3/s during the dry season [24], and the annual contribution to the Mekong River is about 2.5 × 10¹⁰ m3 [25]. The Mun River is divided into three main reaches: upper Mun (101°30′ E–102°30′ E), middle Mun (102°30′ E–104°30′ E), and lower Mun (104°30′ E–105°30′ E) (Figure 2) [19].
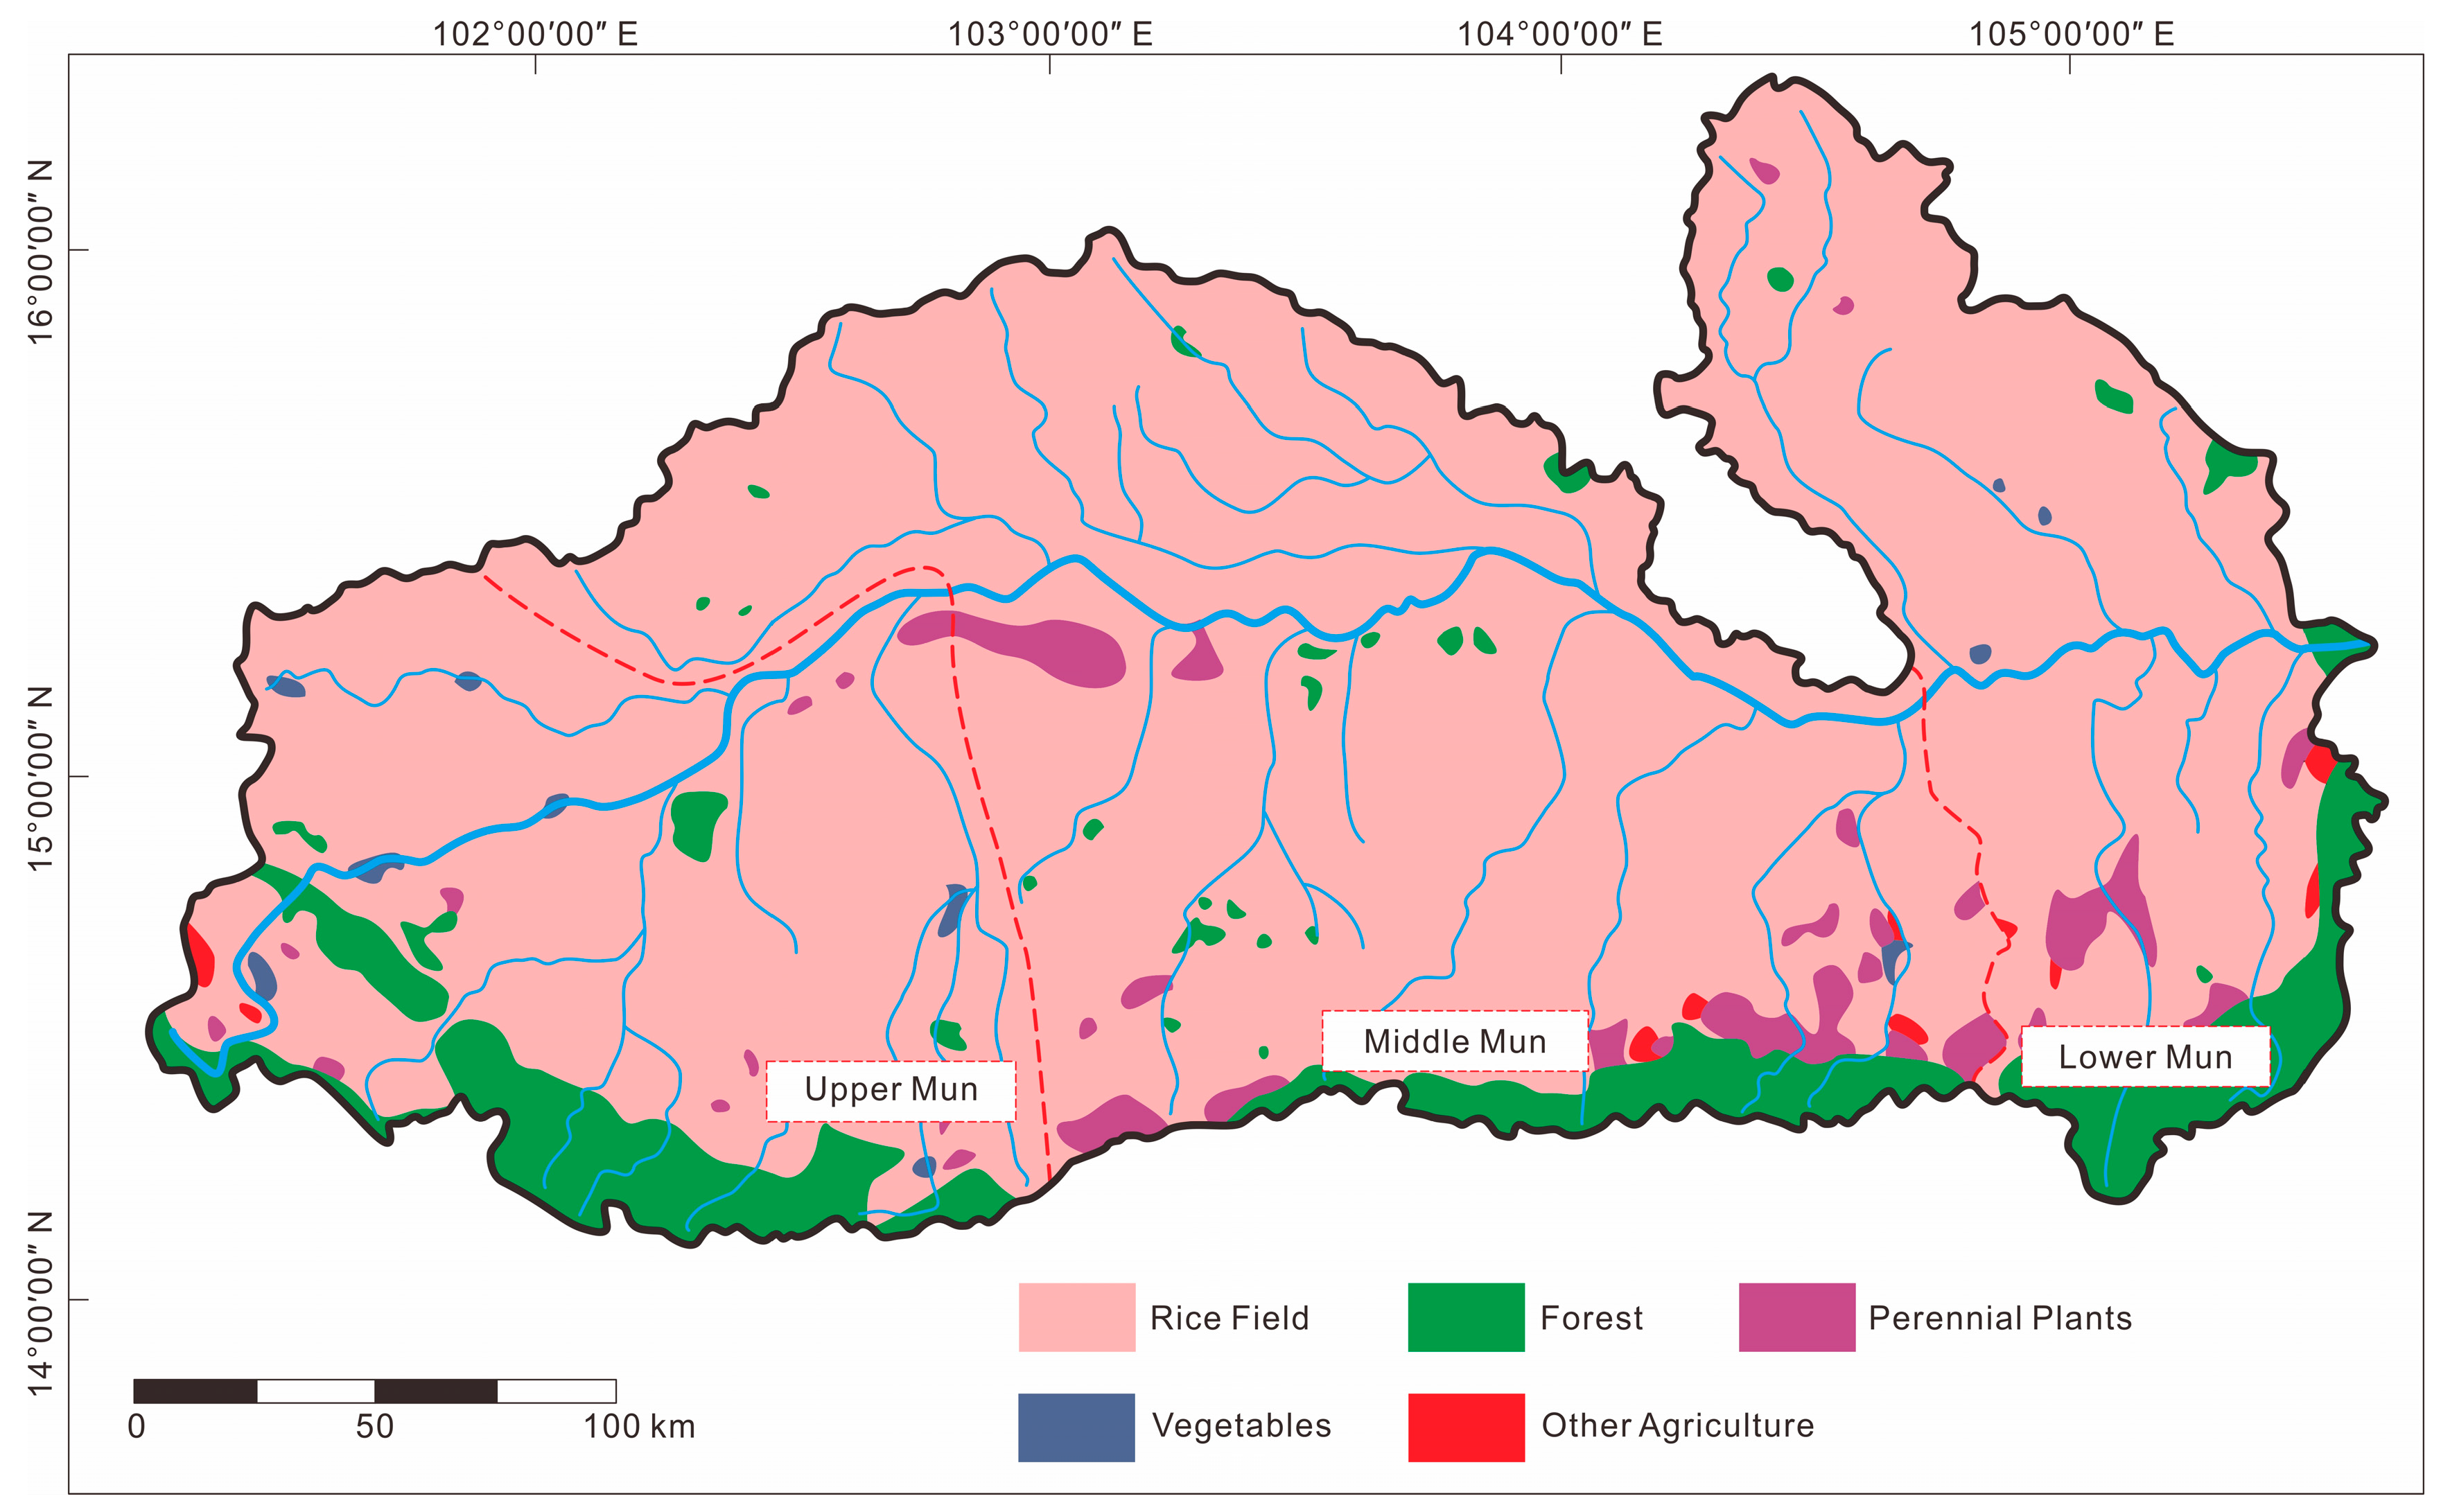
Thailand is among the top ten largest rice-producing countries in the world [18]. The industry area is sporadically distributed in the basin, and the agriculture is well-developed in the Mun River Basin [20], where the main types of agriculture are rice, forest, perennial plants, vegetables, and other plants (Figure 3). The duration of rice cultivation includes the vegetative stage (July–September), reproductive stage (October), and ripening stage (November) [26]. The drainage basin is situated in a savannah climate zone [27], and the main mechanism for the rainfall pattern is the southeastern monsoon. The annual precipitation is within 955–1711 mm, and the precipitation in the wet season and the dry season are 880–1617 mm and 42–120 mm, respectively [22]. The mean annual precipitation is 1131 mm for the whole basin, whereas it is 1082 mm in the upper Mun, 1197 mm in the middle Mun, and 1436 mm in the lower Mun [19].
2.2. Sample Collection and Storage
Sampling surveys were conducted in August 2017 (wet season) and March 2018 (dry season). A total of 104 water samples were collected from 57 sampling sites in the upper Mun River, middle Mun River, and lower Mun River, and labelled with UM 1–19, MM 1–19, and LM 1–19, respectively (Figure 2). Samples UM 1–11, MM 1–8, and LM 1–9 were collected from the mainstream, and other samples are collected from tributaries. Before sample collection, all sampling instruments were rinsed with river water three times, to avoid contamination of dissolved heavy metals. Samples were collected using a water sampler and stored in pre-cleaned high-density polyethylene (HDPE) plastic bottles [28]. Water samples were filtered through a 0.22-μm filter membrane for the determination of dissolved heavy metals. The filtrate was acidified to pH ≤ 2 using ultra-pure concentrated nitric acid (HNO3). All water samples were stored in the dark before subsequent measurement and determination.
2.3. Physicochemical Measurement and Elemental Determination
The physicochemical parameters were monitored on-site using a YSI water quality monitoring instrument (Xylem Inc., Yellow Springs, OH, USA). Dissolved heavy metals were measured using an inductively coupled plasma mass spectrometer (ICP-MS, Elan 9000, Perkin Elmer Optima, Waltham, MA, USA) at Institute of Geology and Geophysics, Chinese Academy of Sciences, China. The standard reference used for quality control was GSB 04-1767-2004, and the uncertainty was below 0.7%. The percentage recoveries varied from 97.21% to 109.80%, showing a good agreement between the determined elements and standard reference material. Procedural blanks were determined between every 10 samples. Method precision was controlled by determining replicate samples between each batch of 10 water samples, and the relative standard deviations (RSD) of the randomly selected replicate samples were 0.01%–6.08%.
2.4. Multivariate Statistics
For comparison of the distribution and to search for the possible sources of dissolved heavy metals in the Mun River, all of the data were processed using Microsoft Office 2019 (Microsoft Corporation, Redmond, WA, USA) and SPSS 25.0 (IBM Corporation, Armonk, NY, USA). One-way analysis of variance (ANOVA) was performed in this study (p < 0.05; least-significance difference, LSD) to test the spatial and temporal variation between physicochemical variables and dissolved heavy metals of the Mun River. Pearson correlation matrixes were used to investigate the relations and interactions of dissolved heavy metals in the Mun River. The principal component analysis (PCA) was used to explore the possible sources of trace metals by converting a large number of potentially related variables into a set of linearly unrelated variables using a dimensionality reduction technique. In PCA, the Kaiser-Meyer-Olkin (KMO) and Bartlett’s sphericity test were used to examine the adequacy and suitability of the dataset. Before performing the PCA, the dataset was standardized by z-scale transformation to avoid numerical ranges of the original variables [29].
2.5. Water Quality and Health Risk Assessment
2.5.1. Water Quality Index
The WQI is introduced as a mathematical tool to convert the water quality dataset into a single number at each sampling site, where the results are eliminating subjective assessments of water quality and biases of individual water quality experts [30,31]. To assess the WQI, the impacts caused by different water quality variables were calculated with the following equation:
where Wi represents the weight of each parameter and is calculated on the basis of the eigenvalues for each principal component (PC) and factor loading for each parameter from the PCA results; Ci represents the concentration of each dissolved heavy metal; and Si is the guideline values for each element, and obtained from Nabizadeh et al. [30]. Based on WQI values, the water quality is interpreted as: (1) excellent water quality (0 ≤ WQI < 50); (2) good water quality (50 ≤ WQI < 100); (3) poor water quality (100 ≤ WQI < 200); (4) very poor water quality (200 ≤ WQI < 300); and (5) water unsuitable for drinking (WQI ≥ 300) [30].
WQI = Σ [Wi × (Ci/Si)] × 100,
2.5.2. Health Risk Assessment
The HQ and HI are calculated to assess the toxicity of heavy metals in aqueous systems [7]. HQ is the ratio between exposure through individual pathways and the reference dose. HI is the sum of the HQs from both the applicable pathways, which is aimed to identify the potential non-carcinogenic risk. Non-carcinogenic risk or adverse effects on human health exist when HQ or HI is ≥1, and no deleterious effects exist when HQ or HI is <1 [32]. The values of HQ and HI are calculated by equations as follows:
where the ADDingestion and ADDdermal represents the average daily dose from ingestion and dermal absorption, respectively (μg/kg/day); Cw represents the average concentration of each element in water (μg/L); BW is the average body weight (70 kg for adults and 15 kg for children); IR is the ingestion rate (2 L/day for adults and 0.64 L/day for children); EF is the exposure frequency (350 days/year); ED is the exposure duration (30 years for adults and 6 years for children); AT is the average time (=ED × 365 days/year); SA represents the exposed skin area (18,000 cm2 for adults and 6600 cm2 for children); ET is the exposure time (0.58 h/day for adults and 1 h/day for children); Kp represents the dermal permeability coefficient in water (cm/h); RfD is the reference dose (μg/kg/day); ABSGI is the gastrointestinal absorption factor. The reference values were obtained from the United States Environmental Protection Agency [33].
ADDingestion = (Cw × IR × EF × ED)/(BW × AT),
ADDdermal = (Cw × SA × Kp × ET × EF × ED × 10−3)/(BW × AT),
HQ = ADD/RfD,
RfDdermal = RfD × ABSGI,
HI = ΣHQs,
2.6. Fluxes of Dissolved Heavy Metals
The Mun river is a large tributary that eventually flows into the Mekong river. The effects of dissolved heavy metals on the Mekong River can be estimated by calculating the fluxes on the basis of the discharge data and weighted volume concentrations in the wet season and dry season of the Mun River. The flux of each dissolved heavy metals was calculated using the following equation:
where QA is the average water discharge in the wet season (959 m3/s) and dry season (367 m3/s) [24]; CA is the average concentration of dissolved heavy metals near the estuary, which are collected from sites LM5–9, LM15–17, and LM19.
flux (tons/month) = QA × CA,
3. Results and Discussion
3.1. Dissolved Heavy Metals in the River Water
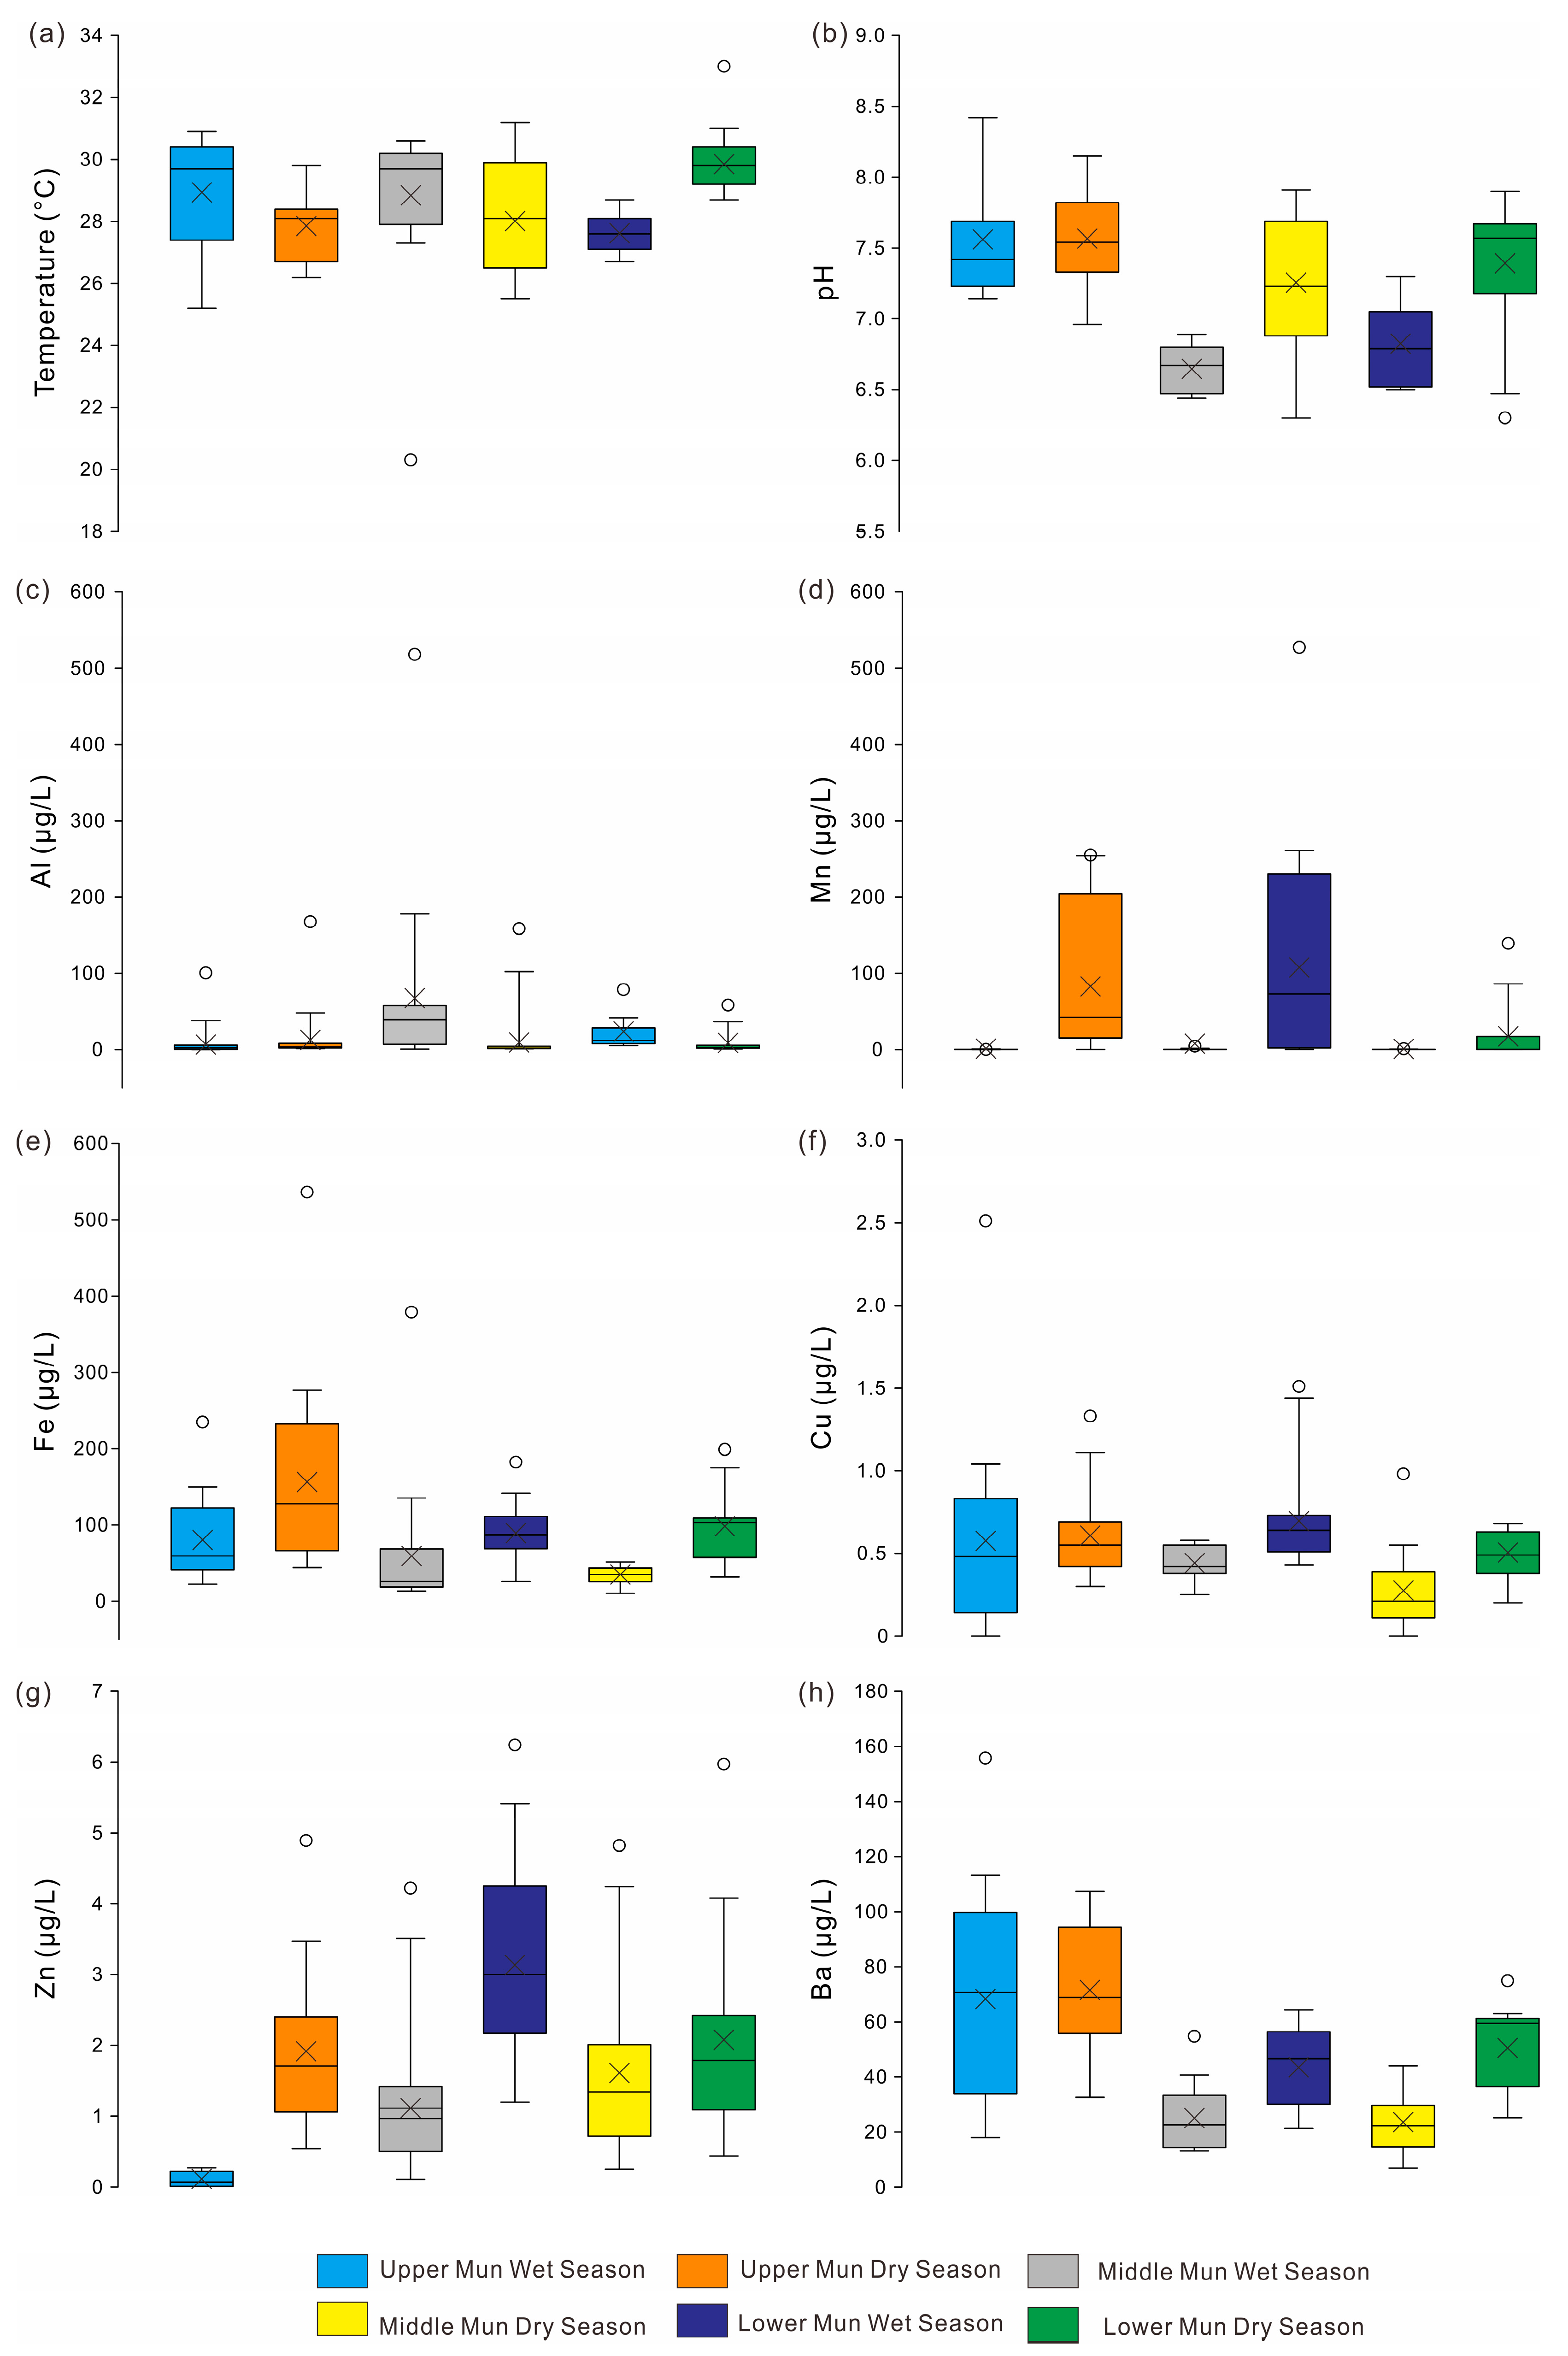
The results of physicochemical parameters and concentrations of dissolved heavy metals are listed in Table 1. The Kolmogorov-Smirnov (K-S) statistics were processed to test the normal distribution of the data [7], which indicated that only temperature is normally distributed with bilateral significance >0.100. The K-S test results and large standard deviation values of Al (75.17), Fe (60.61), and Ba (31.10) suggested that the mean values reflected the reliability of the data, due to the presence of outliers with extremely high or low values. In this study, the median values were used for calculation; however, the mean values were used for comparisons with the guideline values given as arithmetic means.
The water temperature is relatively high with little variation throughout the year, ranging from 20.30 °C to 31.10 °C in the wet season and 24.00 °C to 33.00 °C in the dry season (Figure 4a). In the wet season, the water pH values in the upper Mun River exhibit an alkaline condition ranging from 7.06 to 8.42; the pH of samples from middle Mun River were of low values, ranging from 6.36 to 6.90; and the pH values of the lower Mun River water change between weak acidic and weak alkaline, ranging from 6.45 to 7.36 (Figure 4b); the pH values of samples in the dry season were significantly higher than that in the wet season (Figure 4b). Statistically, there are many wet season samples in the middle Mun River that are not within approved limits (6.50–8.50) [34], which may be harmful to human health and should be paid more attention.
The one-way ANOVA results are shown in Supplementary Materials (Table S1). The results suggested that Mn, Fe, and Cu in both seasons showed some significant spatial patterns (p < 0.05), while dissolved Zn and Ba in the wet season exhibited a greater level of significance with p < 0.01, indicating that the river water had a strong mixing ability. However, Al showed no significant variation among the sampling sites.
The total concentrations of dissolved heavy metals in the wet and dry season are displayed in Table 1. Based on the mean concentrations, the dissolved heavy metals were classified into two categories: (1) Mn, Cu, and Zn (<10 μg/L); (2) Al, Fe, and Ba (>10 μg/L). The concentrations of Mn, Fe, Cu, Zn, and Ba in the dry season are basically higher than those in the wet season, while the concentration of Al in the middle Mun and lower Mun are higher in the wet season (Figure 4). Based on the guideline values for drinking water reported by the World Health Organization [34], the United States Environmental Protection Agency [35], and China GB 5749-2006 [36] (Table 2), contamination of dissolved heavy metals was evaluated by comparing their concentrations of each element. The maximum concentrations of Cu, Zn, and Ba were lower than all the guidelines listed in Table 2. The peak values of Al, Mn, and Fe were higher than the World Health Organization (WHO) drinking water guideline values (200 μg/L, 400 μg/L, and 300 μg/L, respectively). However, Mn concentrations in 15 water samples in the dry season were out of limits of the Chinese standard (100 μg/L). Excessive intake of Mn can cause severe diseases, such as hyperthyroidism and damage vital organs [37]. Therefore, local management should pay more attention to the concentration of Mn.
Based on previously published results, low concentrations of dissolved heavy metals in rivers might result from natural sources and be characterized by slow accumulation [15], while concentrations of some elements can be largely increased through anthropogenic activities [8]. The world average concentrations of Al, Mn, Fe, Cu, Zn, and Ba are 32 μg/L, 34 μg/L, 66 μg/L, 1.5 μg/L, 0.6 μg/L, and 23 μg/L, respectively (Table 3). Among the wet season samples, the concentration of Al, Fe, Cu, and Zn are close to the world average values; Cu and Zn in dry season water were close to the world average values, while other elements differ significantly from the world average. The concentration of Al is higher than that of Tonle Sap-Bassac Rivers. The concentrations of Mn in the dry season, as well as Ba, are lower than that in Citarum River. The concentrations of Fe are far below the values in Citarum River and Saigon River. Cu and Zn are not abundant relative to the values in the Mahanadi River during the wet season and dry season, as well as the metal concentrations in the other four rivers.
3.2. Source Identification
3.2.1. Correlation Matrix
The interrelationships between pairs of dissolved heavy metals were investigated using correlation matrixes (Table 4). Among the wet season water samples, dissolved Mn had significant positive correlation with Al (0.414), Fe (0.319), and Zn (0.425) (p < 0.01), Al and Fe were strongly correlated with each other (0.736) (p < 0.01), Fe and Cu also exhibited a strong positive correlation (0.470) (p < 0.01), Ba had a strong positive correlation with Fe (0.522) and Cu (0.703), and a strong negative correlation with Zn (−0.411) (p < 0.01). Among the dry season water samples, Fe had a strong correlation with Al (0.344) and Ba (0.500) (p < 0.01), and Mn was strongly correlated with Cu (0.366) (p < 0.01) and Zn (0.292) (p < 0.05). Three different sources in the dry season were marked by the element pairs of Al-Fe, Mn-Cu-Zn, and Fe-Ba. Overall, Al-Fe, Mn-Zn, and Fe-Ba exhibited strong interrelationships in both seasons, and similar sources were identified in each pair of Al-Fe, Mn-Zn, and Fe-Ba.
3.2.2. Principal Component Analysis
The PCA was processed to explore the origins of dissolved heavy metals by reducing the dataset to several influencing factors. The factor contribution or variables with minor significance obtained by PCA were further reduced using a varimax rotation method. The data was standardized by z-scale transformation to avoid numerical ranges of the original variables. The suitability of the data was tested by the Kaiser-Meyer-Olkin (KMO) and Bartlett’s sphericity test, and the reliability for PCA was under 0.001.
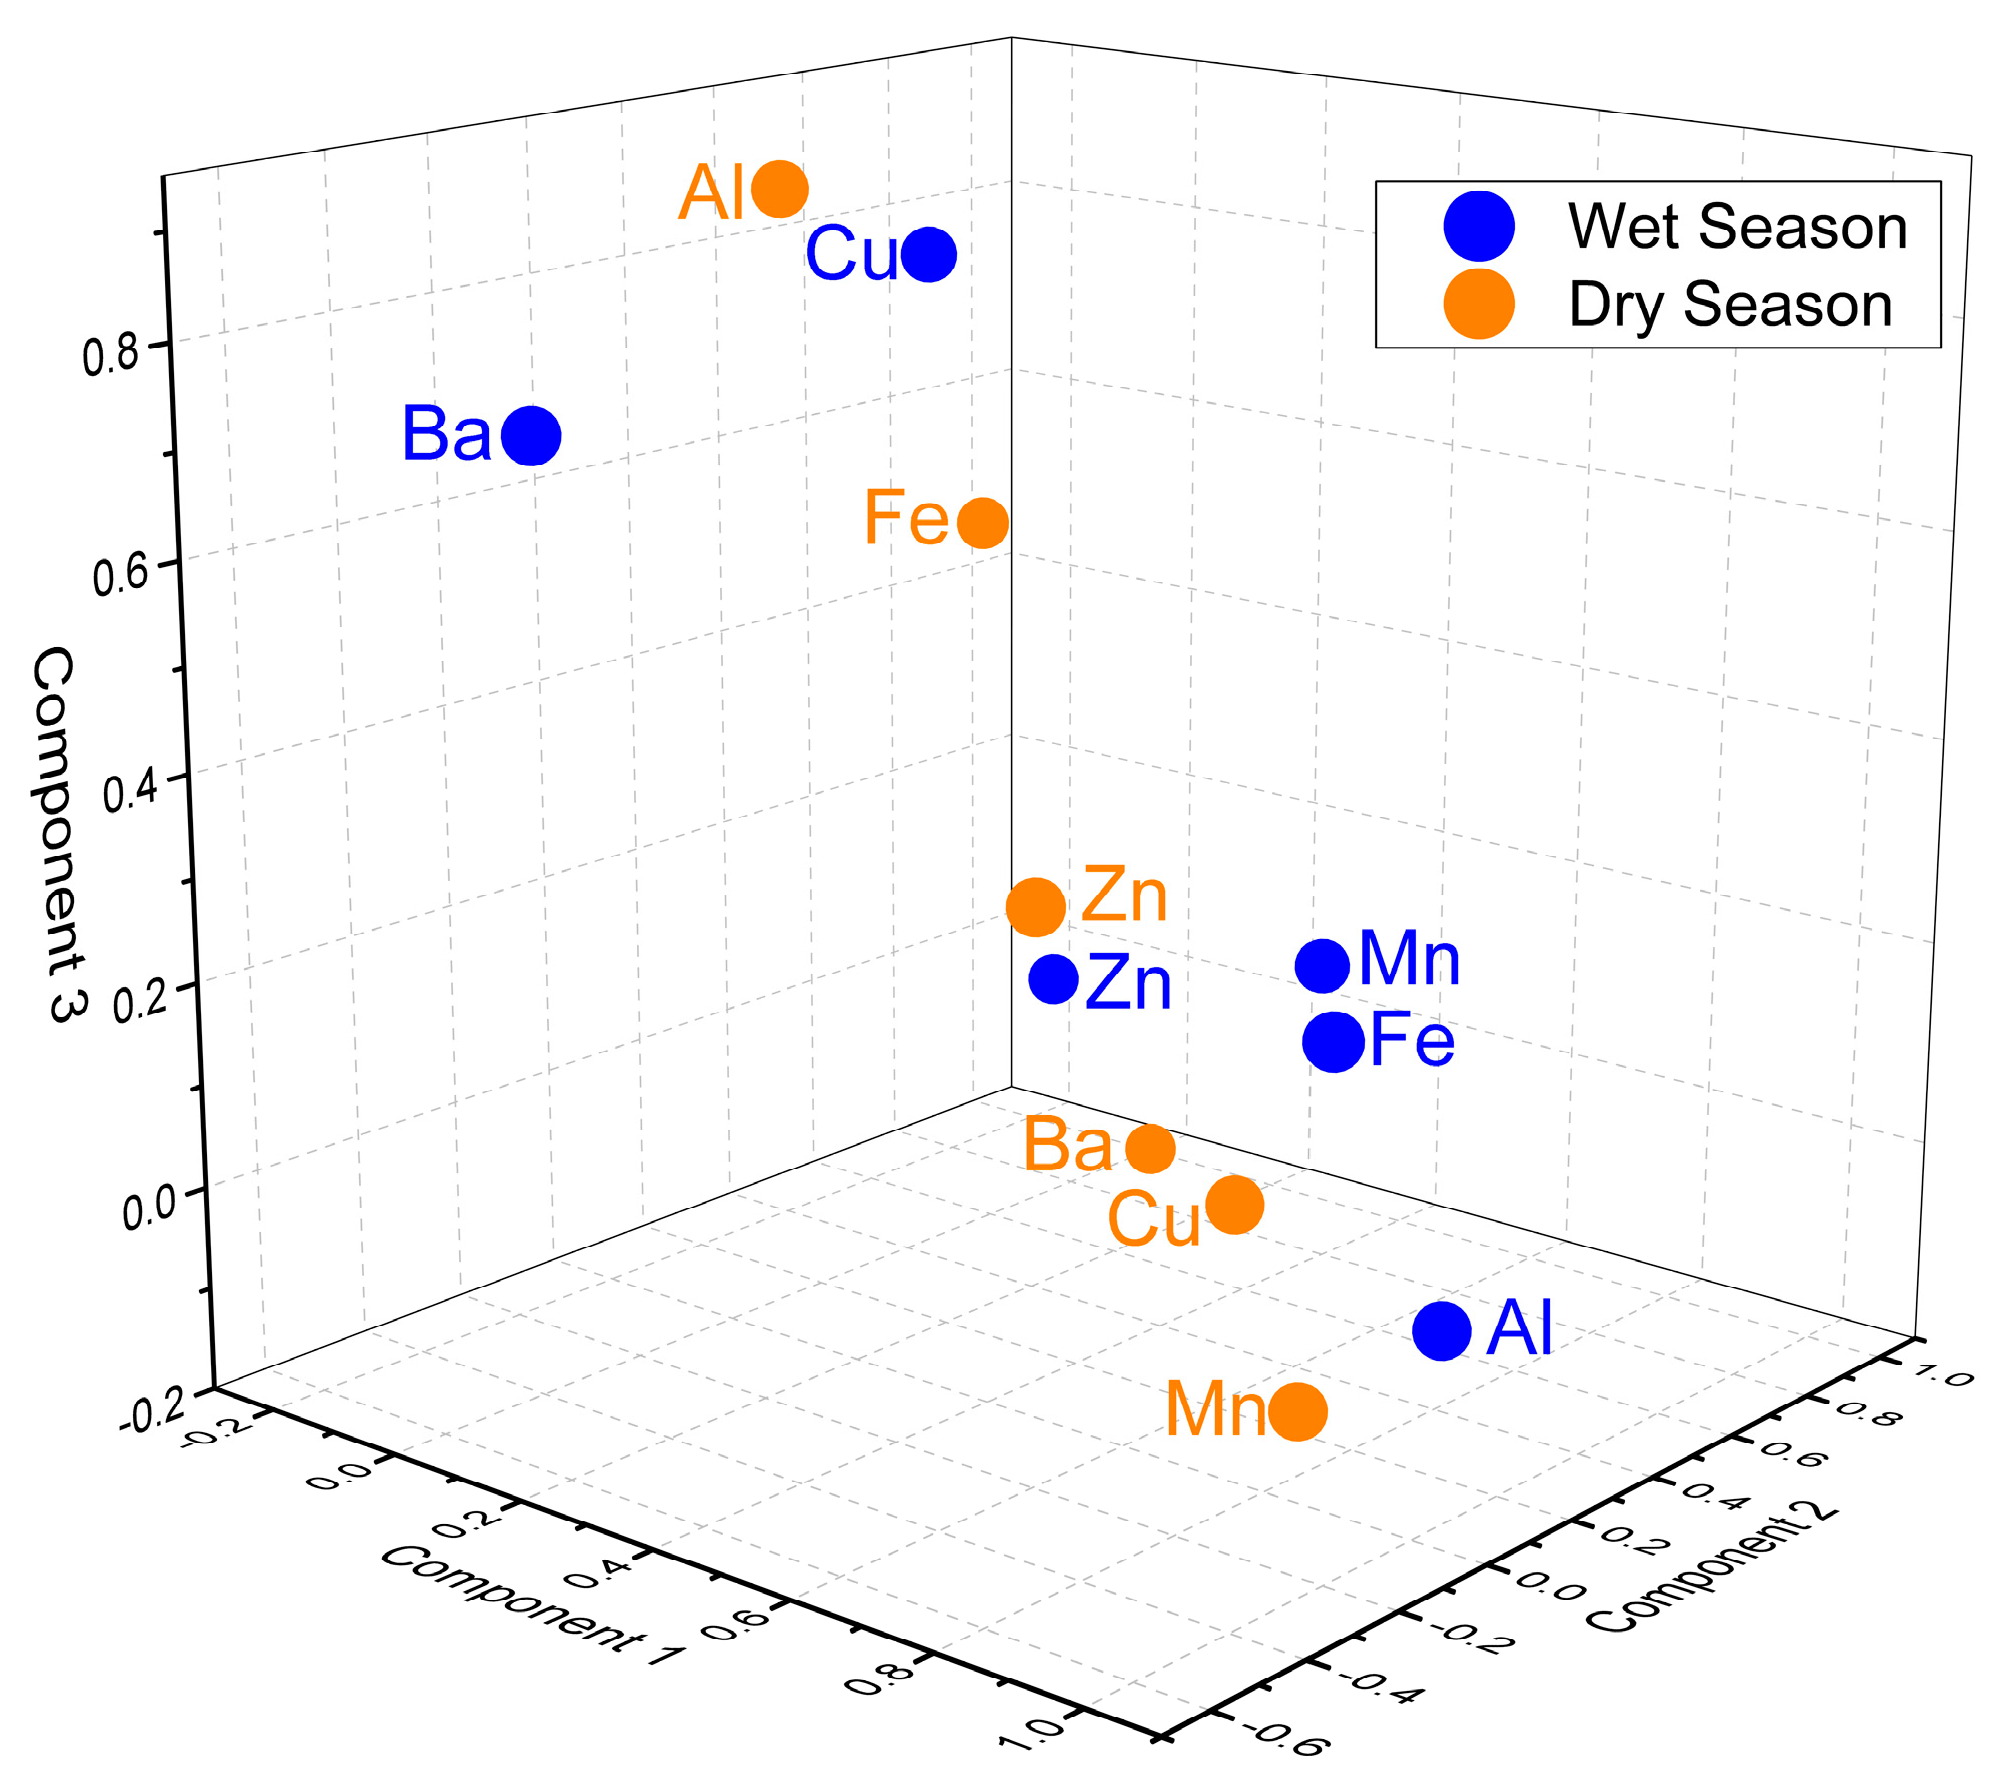
The results of PCA, including the eigenvalues, variance, and communalities, are listed in Table 5, and the factor scores for each dissolved heavy metal are plotted in Figure 5. Three PCs with eigenvalues were extracting accounting for 83.82% in the wet season water. The loadings of PCs were classified into three categories: strong loading, moderate loading, and weak loading, on the basis of the loading values of >0.75, 0.75–0.50, and 0.50–0.30, respectively. PC 1 had strong positive loadings of Al (0.96) and Fe (0.94), and a weak loading of Mn (0.46), with a variance of 38.61%. Al and Fe are major components of crustal materials [7,8,17], and Fe and Mn are affected by the adsorption or desorption of iron and manganese oxyhydroxides in rivers [40]. Rocks and sediments were largely exposed in the upper and middle Mun River [41]. Thus, PC 1 might represent the sedimentary inputs or colloid destabilization. PC 2 had a strong loading of with Zn (0.90), a moderate loading of Mn (0.68), and a weak loading of Cu (0.31). Mn, Cu, and Zn are the nutrient elements affected by anthropogenic sources [42,43,44], and their concentrations may be mainly related to the irregular utilization of pesticides and fertilizers by the residents in the Mun River Basin [22]. Moreover, the middle Mun River had more human interference than in the upper Mun River and lower Mun River [23], which might also contribute to the concentrations of Mn, Cu, and Zn. PC 3 explained 17.78% of the total variance, which had strong loadings of Cu (0.83) and Ba (0.74). Ba is a product of natural weathering [7], and PC 3 indicated that the concentrations of Cu and Ba were attributed to a mixed agricultural and natural source. Comparatively, there were also three PCs accounting for 71.73% of the total variances among the dry season samples, with the percentage of 27.46%, 26.16%, and 18.11% for PC 1, PC 2, and PC 3, respectively. PC 1 was strongly correlated with Mn (0.82), Cu (0.74), and Zn (0.58), similar to PC 2 in the wet season, which was probably affected by anthropogenic sources, such as agricultural runoff, industrial effluents, and domestic discharge [7,45]. PC 2 had strong loading of Fe (0.77) and Ba (0.92), reflecting a natural source from the input of sediments and weathering of rocks [43]. PC 3 was strongly correlated with Al (0.91), and weakly correlated with Fe (0.49) and Zn (0.34), which might be dominated by the inputs of crustal materials, as well as a small proportion of anthropogenic inputs.
3.3. Water Quality and Health Risk Assessment
3.3.1. Water Quality Index
The recommended limit of pH for drinking water varies from 6.5 to 8.5 [34], and 91.23% and 87.72% of samples in the wet season and in the dry season reach the pH standard. The weights of each parameter (Wi) obtained on the basis of the PCA results are provided in Supplementary Materials (Table S2). Based on the WQI values (Figure 6), the average water quality in the wet season (WQIwet = 10.23) is better than that in the dry season (WQIdry = 22.93). Water at site UM2, UM13, and MM9 in the dry season are of good water quality. The water quality in the wet season is categorized as excellent water, except for the poor water quality at MM15.
3.3.2. Hazard Quotient and Hazard Index
The HI values (=ΣHQs) for dissolved heavy metals are listed in Table 6. The HQ for each element by ingestion and dermal pathways for adults and children are presented in Supplementary Materials (Table S3). Compared to adults, the higher HQingestion and HQdermal values for children suggested that children are more sensitive when exposed to dissolved heavy metals in water. For both adults and children, the HQingestion and HQdermal values for Al, Mn, Fe, Cu, Zn, and Ba in both seasons were smaller than 1, indicating no health effects on the human body and potential carcinogenic concern via daily intake and dermal absorption. The HI results showed that all the elements posed non-carcinogenic risks to human health in both seasons. Although Al, Cu, and Zn are low in concentrations and pose little health risk, Mn, Fe, and Ba in the dry season might be potentially harmful, with relatively high concentrations. The discharge of Mn, Fe, and Ba should be paid more attention in case of unnecessary health threats.
3.4. Fluxes of Dissolved Heavy Metals
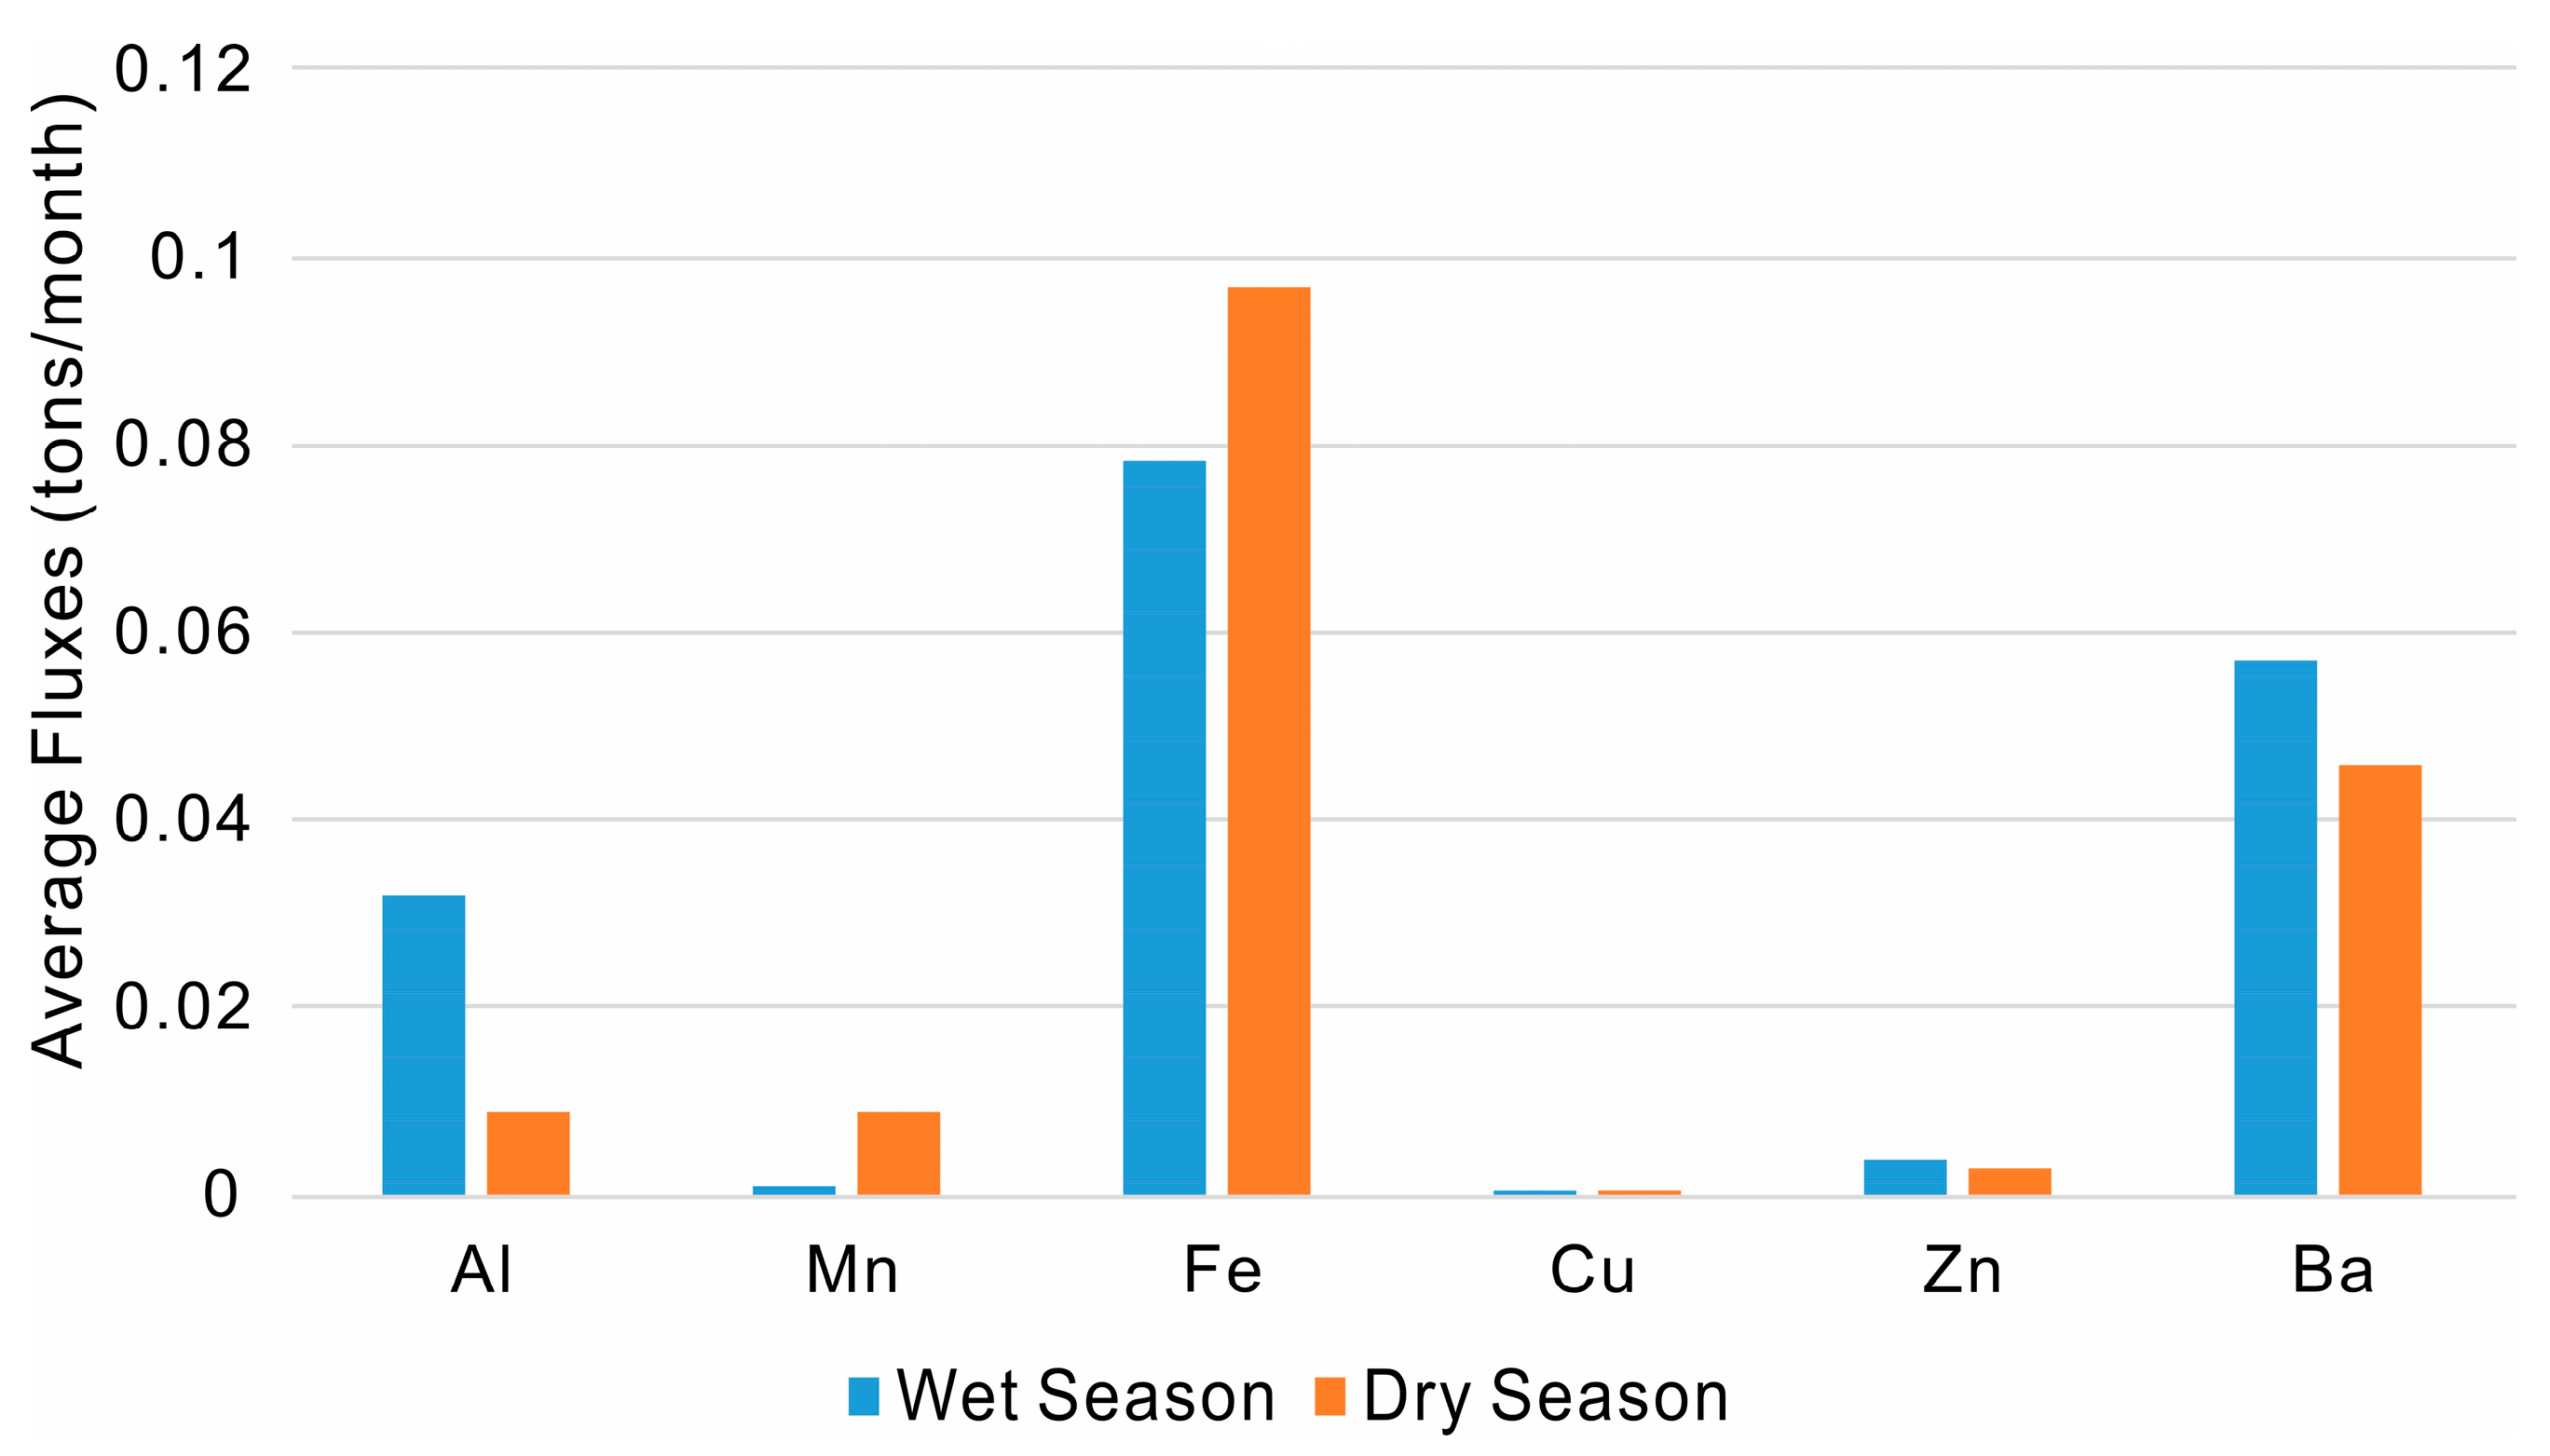
The monthly fluxes of dissolved heavy metals from the Mun River to the Mekong River in the wet season and dry season are estimated from the water discharge and the weighted volume concentrations (Figure 7). On the basis of the water fluxes, Fe and Ba were the dominant elements discharging into the Mekong River during both seasons. Although Mn was abundant in the whole drainage basin, its fluxes into the Mekong River were small. The elemental fluxes of Cu and Zn are negligible, but Cu might have a significant impact on the dissolved heavy metals in the Mekong River, the background values of which are 0.96 μg/L–3.96 μg/L in the wet season and 0.63 μg/L–1.41 μg/L in the dry season [46,47]. The estimated values suggested that the Mun River might be an important input of dissolved heavy metals in the Mekong, but it still needed further investigation.
4. Conclusions
This study reports the dissolved heavy metals compositions of river water in the Mun River, northeast Thailand. Based on the multivariate statistical methods, WQI values, and health risk assessment for the dissolved heavy metals in the Mun River, the results showed:
(1) The concentrations of Mn, Fe, Cu, Zn, and Ba in the dry season were higher than those in the wet season, while the concentration of Al in the middle and lower Mun River were higher in the wet season. Compared with the international guidelines for drinking water, Mn was the dominant pollutant in the dry season.
(2) The CA results suggested that similar sources were found in each pair of Al-Fe, Mn-Zn, and Fe-Ba in the wet and dry season. The PCA results showed that the dominant source of dissolved heavy metals was sedimentary inputs or colloid destabilization in the wet season, and anthropogenic inputs in the dry season are affected by agricultural runoff, industrial effluents, and domestic discharge.
(3) The WQI values showed that water at most sites in both seasons is categorized as excellent water, except for a few sites (UM2, UM13, and MM9 in the dry season, and MM15 in the wet season) with substandard values. The river water posed no significant health risks according to the health risk assessment, but Mn, Fe, and Ba needed to be paid more attention due to the relatively high values. Al, Fe, and Ba were the main elements flowing into the Mekong River, and Cu contributed the background value in the Mekong river.
Supplementary Materials
The following are available online at https://www.mdpi.com/2073-4441/11/2/380/s1. Table S1: One-way ANOVA for dissolved heavy metals in the Mun River. Table S2: Weights for the variables in the water samples. Table S3: Hazard quotient and hazard index for dissolved heavy metals in the Mun River.
Author Contributions
Conceptualization, B.L., G.H.; methodology, B.L., G.H.; software, B.L.; validation, G.H.; investigation, G.H., M.L., X.L., C.S., and Q.Z.; resources, G.H.; data curation, G.H., K.Y.; writing—original draft preparation, B.L.; writing—review and editing, B.L., G.H.; supervision, G.H.; project administration, G.H.; funding acquisition, G.H.
Funding
This work was supported jointly by the National Natural Science Foundation of China (No. 41661144029; 41325010).
Acknowledgments
The authors gratefully acknowledge Fairda Malem from Ministry of Natural Resource and Environment of Thailand, and Aiguo Dong from China University of Geosciences for their assistance with field sampling.
Conflicts of Interest
The authors declare no conflict of interest.
References
- Chowdhury, S.; Mazumder, M.A.J.; Al-Attas, O.; Husain, T. Heavy metals in drinking water: Occurrences, implications, and future needs in developing countries. Sci. Total Environ. 2016, 569–570, 476–488. [Google Scholar] [CrossRef] [PubMed]
- Zhang, Z.; Lu, Y.; Li, H.; Tu, Y.; Liu, B.; Yang, Z. Assessment of heavy metal contamination, distribution and source identification in the sediments from the Zijiang River, China. Sci. Total Environ. 2018, 645, 235–243. [Google Scholar] [CrossRef] [PubMed]
- Zuzolo, D.; Cicchella, D.; Catani, V.; Giaccio, L.; Guagliardi, I.; Esposito, L. Assessment of potentially harmful elements pollution in the Calore River basin (Southern Italy). Environ. Geochem. Health 2017, 39, 531–548. [Google Scholar] [CrossRef] [PubMed]
- Cai, L.; Wang, Q.; Luo, J.; Chen, L.; Zhu, R.; Wang, S.; Tang, C. Heavy metal contamination and health risk assessment for children near a large Cu-smelter in central China. Sci. Total Environ. 2019, 650, 725–733. [Google Scholar] [CrossRef] [PubMed]
- Shotyk, W.; Bicalho, B.; Cuss, C.W.; Grant-Weaver, I.; Nagel, A.; Noernberg, T.; Poesch, M.; Sinnatamby, N.R. Bioaccumulation of Tl in otoliths of Trout-perch (Percopsis omiscomaycus) from the Athabasca River, upstream and downstream of bitumen mining and upgrading. Sci. Total Environ. 2019, 650, 2559–2566. [Google Scholar] [CrossRef] [PubMed]
- Li, S.; Li, J.; Zhang, Q. Water quality assessment in the rivers along the water conveyance system of the Middle Route of the South to North Water Transfer Project (China) using multivariate statistical techniques and receptor modeling. J. Hazard. Mater. 2011, 195, 306–317. [Google Scholar] [CrossRef] [PubMed]
- Wang, J.; Liu, G.; Liu, H.; Lam, P.K.S. Multivariate statistical evaluation of dissolved trace elements and a water quality assessment in the middle reaches of Huaihe River, Anhui, China. Sci. Total Environ. 2017, 583, 421–431. [Google Scholar] [CrossRef] [PubMed]
- Liang, B.; Han, G.; Liu, M.; Yang, K.; Li, X.; Liu, J. Distribution, sources, and water quality assessment of dissolved heavy metals in the Jiulongjiang River water, southeast China. Int. J. Environ. Res. Public Health 2018, 15, 2752. [Google Scholar] [CrossRef]
- Islam, S.; Ahmed, K.; Raknuzzaman, M. Heavy metal pollution in surface water and sediment: A preliminary assessment of an urban river in a developing country. Ecol. Indic. 2015, 48, 282–291. [Google Scholar] [CrossRef]
- Tepanosyan, G.; Sahakyan, L.; Belyaeva, O.; Asmaryan, S.; Saghatelyan, A. Continuous impact of mining activities on soil heavy metals levels and human health. Sci. Total Environ. 2018, 639, 900–909. [Google Scholar] [CrossRef]
- Jiang, Y.; Xie, Z.; Zhang, H. Effects of land use types on dissolved trace metal concentrations in the Le’an River Basin, China. Environ. Monit. Assess. 2017, 189, 663. [Google Scholar] [CrossRef] [PubMed]
- Shotyk, W.; Bicalho, B.; Cuss, C.W.; Donner, M.W.; Grant-Weaver, I.; Haas-neill, S.; Javed, M.B.; Krachler, M.; Noernberg, T.; Pelletier, R.; et al. Trace metals in the dissolved fraction (<0.45 μm) of the lower Athabasca River: Analytical challenges and environmental implications. Sci. Total Environ. 2017, 580, 660–669. [Google Scholar] [CrossRef] [PubMed]
- Li, R.; Tang, C.; Cao, Y.; Jiang, T.; Chen, J. The distribution and partitioning of trace metals (Pb, Cd, Cu, and Zn) and metalloid (As) in the Beijiang River. Environ. Monit. Assess. 2018, 190, 399. [Google Scholar] [CrossRef] [PubMed]
- Li, S.; Zhang, Q. Spatial characterization of dissolved trace elements and heavy metals in the upper Han River (China) using multivariate statistical techniques. J. Hazard. Mater. 2010, 176, 579–588. [Google Scholar] [CrossRef] [PubMed]
- Meng, Q.; Zhang, J.; Zhang, Z.; Wu, T. Geochemistry of dissolved trace elements and heavy metals in the Dan River Drainage (China): Distribution, sources, and water quality assessment. Environ. Sci. Pollut. Res. 2016, 23, 8091–8103. [Google Scholar] [CrossRef]
- Komínková, D.; Nabelkova, J. Effect of urban drainage on bioavailability of heavy metals in recipient. Water Sci. Technol. 2007, 56, 43–50. [Google Scholar] [CrossRef] [PubMed]
- Kumar, A.V.; Patil, R.S.; Nambi, K.S.V. Source apportionment of suspended particulate matter at two traffic junctions in Mumbai, India. Atmos. Environ. 2001, 35, 4245–4251. [Google Scholar] [CrossRef]
- Food and Agriculture Organization. Food and Agriculture Organization FAO Statistical Yearbook 2013; Food and Agriculture Organization of the United Nations: Rome, Italy, 2013; ISBN 9788578110796. [Google Scholar]
- Akter, A.; Babel, M.S. Hydrological modeling of the Mun River basin in Thailand. J. Hydrol. 2012, 452–453, 232–246. [Google Scholar] [CrossRef]
- Prabnakorn, S.; Maskey, S.; Suryadi, F.X.; De Fraiture, C. Rice yield in response to climate trends and drought index in the Mun River Basin, Thailand. Sci. Total Environ. 2018, 621, 108–119. [Google Scholar] [CrossRef]
- Franco-Uría, A.; López-Mateo, C.; Roca, E.; Fernández-Marcos, M.L. Source identification of heavy metals in pastureland by multivariate analysis in NW Spain. J. Hazard. Mater. 2009, 165, 1008–1015. [Google Scholar] [CrossRef]
- Zhao, Z.; Liu, G.; Liu, Q.; Huang, C.; Li, H. Studies on the spatiotemporal variability of river water quality and its relationships with soil and precipitation: A case study of the Mun River Basin in Thailand. Int. J. Environ. Res. Public Health 2018, 15, 2466. [Google Scholar] [CrossRef] [PubMed]
- Zhao, Z.; Liu, G.; Liu, Q.; Huang, C.; Li, H.; Wu, C. Distribution characteristics and seasonal variation of soil nutrients in the Mun River Basin, Thailand. Int. J. Environ. Res. Public Health 2018, 15, 1818. [Google Scholar] [CrossRef] [PubMed]
- Toda, O.; Tanji, H.; Somura, K.; Higuchi, K. Evaluation of tributaries contribution in the Mekong River Basin during rainy and dry season. In Proceedings of the 2nd Asia Pacific Association of Hydrology and Water Resources Conference, Singapore, 5–9 June 2004; pp. 239–248. [Google Scholar]
- Binnie, P. Mun River Basin Water Resources Development Master Plan; Royal Irrigation Department: Nonthaburi, Thailand, 1995.
- Brouwer, C.; Heibloem, M. Irrigation water management: Irrigation water needs. Train. Man. 1986, 3, 1–11. [Google Scholar]
- Peel, M.C.; Finlayson, B.L.; McMahon, T.A. Updated world map of the Köppen-Geiger climate classification. Hydrol. Earth Syst. Sci. 2007, 11, 1633–1644. [Google Scholar] [CrossRef]
- Yang, K.; Han, G.; Liu, M.; Li, X.; Liu, J.; Zhang, Q. Spatial and seasonal variation of O and H isotopes in the Jiulong River, Southeast China. Water 2018, 10, 1677. [Google Scholar] [CrossRef]
- Simeonov, V.; Stratis, J.A.; Samara, C.; Zachariadis, G.; Voutsa, D.; Anthemidis, A.; Sofoniou, M.; Kouimtzis, T. Assessment of the surface water quality in Northern Greece. Water Res. 2003, 37, 4119–4124. [Google Scholar] [CrossRef]
- Nabizadeh, R.; Amin, M.V.; Alimohammadi, M.; Naddafi, K.; Mahvi, A.H.; Yousefzadeh, S. Development of innovative computer software to facilitate the setup and computation of water quality index. J. Environ. Health Sci. Eng. 2013, 11, 1. [Google Scholar] [CrossRef] [PubMed]
- Štambuk-Giljanović, N. Water quality evaluation by index in Dalmatia. Water Res. 1999, 33, 3423–3440. [Google Scholar] [CrossRef]
- Lim, D.S.; Roh, T.H.; Kim, M.K.; Kwon, Y.C.; Choi, S.M.; Kwack, S.J.; Kim, K.B.; Yoon, S.; Kim, H.S.; Lee, B.-M. Non-cancer, cancer, and dermal sensitization risk assessment of heavy metals in cosmetics. J. Toxicol. Environ. Health Part A 2018, 81, 432–452. [Google Scholar] [CrossRef] [PubMed]
- United States Environmental Protection Agency. Risk Assessment Guidance for Superfund Volume I: Human Health Evaluation Manual (Part E, Supplemental Guidance for Dermal Risk Assessment); Office of Superfund Remediation and Technology Innovation: Washington, DC, USA, 2004.
- World Health Organization. Guidelines for Drinking Water Quality: Fourth Edition Incorporating the First Addendum; WHO: Geneva, Switzerland, 2017; ISBN 9789241549950. [Google Scholar]
- United States Environmental Protection Agency 2012. Edition of the Drinking Water Standards and Health Advisories; United States Environmental Protection Agency: Washington, DC, USA, 2012.
- China GB 5749-2006 Environmental Quality. Standards for Drinking Water Quality; Standards Press of China: Beijing, China, 2006. [Google Scholar]
- Akoto, O.; Bismark Eshun, F.; Darko, G.; Adei, E. Concentrations and Health Risk Assessments of Heavy Metals in Fish from the Fosu Lagoon. Int. J. Environ. Res. 2014, 8, 403–410. [Google Scholar]
- Chanpiwat, P.; Sthiannopkao, S. Status of metal levels and their potential sources of contamination in Southeast Asian rivers. Environ. Sci. Pollut. Res. 2014, 21, 220–233. [Google Scholar] [CrossRef] [PubMed]
- Kumar, S.; Binod, S.; Nayak, B.; Kumar, T.; Dinabandhu, K. Dynamics and quantification of dissolved heavy metals in the Mahanadi river estuarine system, India. Environ. Monit. Assess. 2012, 184, 1157–1179. [Google Scholar] [CrossRef]
- Bu, H.; Wang, W.; Song, X.; Zhang, Q. Characteristics and source identification of dissolved trace elements in the Jinshui River of the South Qinling Mts., China. Environ. Sci. Pollut. Res. 2015, 22, 14248–14257. [Google Scholar] [CrossRef] [PubMed]
- Bhattarai, R.; Dutta, D. A comparative analysis of sediment yield simulation by empirical and process-oriented models in Thailand. Hydrol. Sci. J. 2008, 53, 1253–1269. [Google Scholar] [CrossRef]
- Yu, J.B.; Chen, X.B.; Mao, P.L.; Wu, C.F.; Dong, H.F.; Shan, K. The Spatial Differentiation of Soil Trace Nutrient Elements in New-Born Coastal Wetland. Wetl. Sci. 2010, 8, 213–219. [Google Scholar]
- Bu, H.; Song, X.; Guo, F. Dissolved trace elements in a nitrogen-polluted river near to the Liaodong Bay in Northeast China. Mar. Pollut. Bull. 2017, 114, 547–554. [Google Scholar] [CrossRef] [PubMed]
- Shiller, A.M. Dissolved trace elements in the Mississippi River: Seasonal, interannual, and decadal variability. Geochim. Cosmochim. Acta 1997, 61, 4321–4330. [Google Scholar] [CrossRef]
- Gao, L.; Wang, Z.; Shan, J.; Chen, J.; Tang, C.; Yi, M. Ecotoxicology and Environmental Safety Distribution characteristics and sources of trace metals in sediment cores from a trans-boundary watercourse: An example from the Shima River, Pearl River Delta. Ecotoxicol. Environ. Saf. 2016, 134, 186–195. [Google Scholar] [CrossRef]
- Strady, E.; Tuc, Q.; Julien, N. Spatial variation and risk assessment of trace metals in water and sediment of the Mekong Delta. Chemosphere 2017, 179, 367–378. [Google Scholar] [CrossRef]
- Wilbers, G.; Becker, M.; Thi, L.; Sebesvari, Z.; Renaud, F.G. Spatial and temporal variability of surface water pollution in the Mekong Delta, Vietnam. Sci. Total Environ. 2014, 485–486, 653–665. [Google Scholar] [CrossRef]
Figure 1.
Location of the Mun River Basin.

Figure 2.
Sample distribution in the Mun River.

Figure 3.
Agricultural land use map of the Mun River Basin (land use data from Akter and Babel [19]).
Figure 3.
Agricultural land use map of the Mun River Basin (land use data from Akter and Babel [19]).

Figure 4.
Box plots of (a) temperature, (b) pH value, and the concentration of (c) Al, (d) Mn, (e) Fe, (f) Cu, (g) Zn, and (h) Ba in the Mun River (o donates respective outliers, and × represents mean values).
Figure 4.
Box plots of (a) temperature, (b) pH value, and the concentration of (c) Al, (d) Mn, (e) Fe, (f) Cu, (g) Zn, and (h) Ba in the Mun River (o donates respective outliers, and × represents mean values).

Figure 5.
Loading plot of dissolved heavy metals in the Mun River.

Figure 6.
Water quality index (WQI) values of water in the Mun River.

Figure 7.
Estimated fluxes of dissolved heavy metals to the Mekong River.


Table 1.
Physicochemical parameters and concentrations of dissolved heavy metals in the Mun River.
| Min | Max | Mean | Median | SD 1 | K-S Test 2 | |
|---|---|---|---|---|---|---|
| Wet Season | ||||||
| T (°C) | 20.30 | 31.10 | 28.47 | 28.70 | 1.89 | 0.181 |
| pH | 6.36 | 8.42 | 7.01 | 6.89 | 0.49 | 0.014 |
| Al (μg/L) | nd3 | 517.96 | 34.76 | 12.01 | 75.17 | 0.000 |
| Mn (μg/L) | 0.03 | 4.35 | 0.39 | 0.22 | 0.61 | 0.000 |
| Fe (μg/L) | 8.04 | 378.90 | 57.94 | 41.48 | 60.61 | 0.000 |
| Cu (μg/L) | nd | 2.51 | 0.47 | 0.41 | 0.37 | 0.000 |
| Zn (μg/L) | nd | 4.82 | 1.07 | 0.81 | 1.13 | 0.000 |
| Ba (μg/L) | 6.24 | 155.75 | 38.99 | 26.66 | 31.10 | 0.000 |
| Dry Season | ||||||
| T (°C) | 24.00 | 33.00 | 28.58 | 28.70 | 1.79 | 0.198 |
| pH | 6.11 | 8.51 | 7.41 | 7.50 | 0.49 | 0.086 |
| Al (μg/L) | 0.27 | 167.42 | 12.99 | 2.32 | 33.00 | 0.000 |
| Mn (μg/L) | 0.09 | 527.00 | 72.17 | 20.70 | 104.94 | 0.000 |
| Fe (μg/L) | 21.49 | 536.05 | 114.64 | 103.07 | 80.91 | 0.000 |
| Cu (μg/L) | 0.17 | 1.51 | 0.60 | 0.58 | 0.27 | 0.001 |
| Zn (μg/L) | 0.15 | 6.24 | 2.38 | 2.03 | 1.41 | 0.019 |
| Ba (μg/L) | 11.96 | 115.89 | 55.18 | 58.41 | 22.37 | 0.063 |
1 SD: standard deviation; 2 K-S test: Kolmogorov-Smirnov test; nd: no data.
Table 2.
Guideline values for heavy metals in drinking water.
| Elements | WHO 1 | US EPA 2 | China 3 |
|---|---|---|---|
| Al (μg/L) | 200 | / | 200 |
| Mn (μg/L) | 400 | / | 100 |
| Fe (μg/L) | 300 | / | 300 |
| Cu (μg/L) | 2000 | 1300 | 1000 |
| Zn (μg/L) | / | / | 1000 |
| Ba (μg/L) | 1300 | 2000 | 700 |
Table 3.
The concentrations of dissolved heavy metals (μg/L) in southeast Asian rivers.
| Element | World Average 1 | Tonle Sap-Bassac Rivers, Cambodia 1 | Citarum River, Indonesia 1 | Lower Chao Phraya River, Thailand 1 | Saigon River, Vietnam 1 | Mahanadi River, India (Wet Season) 2 | Mahanadi River, India (Dry Season) 2 |
|---|---|---|---|---|---|---|---|
| Al | 32 | 11 | 130 | 100 | 245 | / | / |
| Mn | 34 | 1 | 260 | 210 | 90 | 22.04 | 17.51 |
| Fe | 66 | 10 | 230 | 100 | 370 | 222.3 | 113.5 |
| Cu | 1.5 | 1 | 3 | 4 | 5 | 9.53 | 9.86 |
| Zn | 0.6 | / | 12 | 53 | 75 | 18.76 | 23.21 |
| Ba | 23 | 7 | 30 | 175 | 19 | / | / |
Table 4.
Pearson correlation matrix of dissolved heavy metals in the Mun River.
| Al | Mn | Fe | Cu | Zn | Ba | |
|---|---|---|---|---|---|---|
| Wet Season | ||||||
| Al | 1 | |||||
| Mn | 0.414 1 | 1 | ||||
| Fe | 0.736 1 | 0.391 1 | 1 | |||
| Cu | 0.025 | 0.237 | 0.470 1 | 1 | ||
| Zn | 0.042 | 0.425 1 | −0.131 | 0.001 | 1 | |
| Ba | −0.113 | 0.031 | 0.522 1 | 0.703 1 | −0.411 1 | 1 |
| Dry Season | ||||||
| Al | 1 | |||||
| Mn | 0.041 | 1 | ||||
| Fe | 0.344 1 | −0.118 | 1 | |||
| Cu | 0.129 | 0.366 1 | −0.048 | 1 | ||
| Zn | 0.148 | 0.292 2 | 0.005 | 0.217 | 1 | |
| Ba | −0.078 | 0.053 | 0.500 1 | 0.006 | −0.106 | 1 |
1 Correlation is significant at the 0.01 level (2-tailed); 2 Correlation is significant at the 0.05 level (2-tailed).
Table 5.
Varimax rotated component matrix for the dissolved heavy metals in the Mun River.
| Variable | PC 1 | PC 2 | PC 3 | Communalities |
|---|---|---|---|---|
| Wet Season | ||||
| Al | 0.96 | 0.14 | −0.04 | 0.94 |
| Mn | 0.46 | 0.68 | 0.13 | 0.70 |
| Fe | 0.94 | −0.09 | 0.27 | 0.96 |
| Cu | 0.10 | 0.31 | 0.83 | 0.80 |
| Zn | −0.09 | 0.90 | −0.01 | 0.81 |
| Ba | 0.10 | −0.51 | 0.74 | 0.82 |
| Eigenvalues (%) | 2.32 | 1.65 | 1.07 | |
| Variance (%) | 38.61 | 27.43 | 17.78 | |
| Cumulative (%) | 38.61 | 66.04 | 83.82 | |
| Dry Season | ||||
| Al | 0.08 | 0.03 | 0.91 | 0.84 |
| Mn | 0.82 | 0.04 | −0.13 | 0.69 |
| Fe | −0.12 | 0.77 | 0.49 | 0.85 |
| Cu | 0.74 | 0.02 | 0.06 | 0.55 |
| Zn | 0.58 | −0.17 | 0.34 | 0.48 |
| Ba | 0.05 | 0.92 | −0.18 | 0.89 |
| Eigenvalues (%) | 1.65 | 1.57 | 1.09 | |
| Variance (%) | 27.46 | 26.16 | 18.11 | |
| Cumulative (%) | 27.46 | 53.62 | 71.73 | |
Significance of Kaiser-Meyer-Olkin (KMO) and Bartlett’s sphericity test is <0.001. Extraction method: Principal component analysis. Rotation method: Varimax with Kaiser normalization. Rotation converges after 4 iterations.
Table 6.
Hazard index (HI) values for dissolved heavy metals in the Mun River.
| Wet Season | Dry Season | |||
|---|---|---|---|---|
| Adults | Children | Adults | Children | |
| Al | 3.38 × 10⁻⁴ | 5.17 × 10⁻⁴ | 6.52 × 10⁻⁵ | 9.97 × 10⁻⁵ |
| Mn | 3.35 × 10⁻⁴ | 5.57 × 10⁻⁴ | 3.21 × 10⁻² | 5.33 × 10⁻² |
| Fe | 3.92 × 10⁻³ | 6.05 × 10⁻³ | 9.74 × 10⁻³ | 1.50 × 10⁻² |
| Cu | 2.89 × 10⁻⁴ | 4.42 × 10⁻⁴ | 4.10 × 10⁻⁴ | 6.27 × 10⁻⁴ |
| Zn | 7.54 × 10⁻⁵ | 1.14 × 10⁻⁴ | 1.88 × 10⁻⁴ | 2.85 × 10⁻⁴ |
| Ba | 1.07 × 10⁻² | 1.64 × 10⁻² | 2.35 × 10⁻² | 3.59 × 10⁻² |
© 2019 by the authors. Licensee MDPI, Basel, Switzerland. This article is an open access article distributed under the terms and conditions of the Creative Commons Attribution (CC BY) license (http://creativecommons.org/licenses/by/4.0/).
Share and Cite
MDPI and ACS Style
Liang, B.; Han, G.; Liu, M.; Li, X.; Song, C.; Zhang, Q.; Yang, K. Spatial and Temporal Variation of Dissolved Heavy Metals in the Mun River, Northeast Thailand. Water 2019, 11, 380. https://doi.org/10.3390/w11020380
AMA Style
Liang B, Han G, Liu M, Li X, Song C, Zhang Q, Yang K. Spatial and Temporal Variation of Dissolved Heavy Metals in the Mun River, Northeast Thailand. Water. 2019; 11(2):380. https://doi.org/10.3390/w11020380
Chicago/Turabian StyleLiang, Bin, Guilin Han, Man Liu, Xiaoqiang Li, Chao Song, Qian Zhang, and Kunhua Yang. 2019. "Spatial and Temporal Variation of Dissolved Heavy Metals in the Mun River, Northeast Thailand" Water 11, no. 2: 380. https://doi.org/10.3390/w11020380
Note that from the first issue of 2016, this journal uses article numbers instead of page numbers. See further details here.