Formation and Evolution of Soil Salinization in Shouguang City Based on PMS and OLI/TM Sensors

1
School of Water Conservancy and Environment, University of Jinan, Jinan 250022, China
2
Engineering Technology Institute for Groundwater Numerical Simulation and Contamination Control, Jinan 250022, China
3
Institute of Deep-Sea Science and Engineering, Chinese Academy of Sciences, Sanya 57200, China
4
Shandong Zhengyuan Construction Engineering Co. Ltd, Jinan 250000, China
*
Author to whom correspondence should be addressed.
Water 2019, 11(2), 345; https://doi.org/10.3390/w11020345
Submission received: 27 December 2018
/
Revised: 4 February 2019
/
Accepted: 13 February 2019
/
Published: 18 February 2019
(This article belongs to the Special Issue Satellite Application on Support to Water Monitoring and Management)
Abstract
:To explore the evolution process of soil salinization in Shouguang, the current study applied the Pan and Multi-spectra Sensor (PMS), Operational Land Imager (OLI) and Thematic Mapper (TM) data to establish a remote sensing monitoring model of soil salinization. Based on the vegetation and salinity indexes, we extracted the information of soil salinization in the flourishing period of plant growth in Shouguang in 2017. At the same time, we monitored the spatial and temporal patterns of soil salinization in Shouguang from 1998 to 2017. We compared the range of soil salinization reflected by remote sensing data and the regional groundwater level and revealed the formation and evolution mechanism of soil salinization in Shouguang. The results reflected that the distribution of soil salinization in Shouguang demonstrated obvious banding characteristics in distribution, and soil salinization gradually increased from the south to the north. Based on the imagery interpretation of Landsat images of three periods from 1998 to 2017, we found that the area of saline land in Shouguang severely decreased as a whole, but the coastal salinization intensified. Moreover, the inversion of surface soil salinity using the GF-1 satellite PMS image has a high precision, and the goodness of fit (R2) is up to 0.871. Compared with the GF-1 image, the Landsat image is more suitable for grading and monitoring soil salinization in a wide range. We also confirmed that the change in ground water level is the main reason for the evolution of salinization. Excessive exploitation of groundwater by vegetable production caused the intensification of seawater intrusion and secondary salinization in coastal areas, while the water level dropped in areas far from the coastline. To prevent the deterioration from soil salinization in Shouguang, it is necessary for us to extract the local groundwater resources reasonably and optimally.
1. Introduction
Soil salinization is perceived as a kind of environmental disaster with adverse environmental impacts worldwide. The environmental impacts are mainly manifested in the form of low productivity of affected lands, causing the low emergence rate of crops, dwarf plants, and low yield, etc. At present, soil salinization is threatening about 7% of the global land area, and this number is gradually increasing with global warming [1]. In China, soil salinization is mainly distributed in 17 provinces and regions (including the northwest, northeast, north China, and coastal areas), covering an estimated total area of about 36 million hm2 (i.e., accounting for 4.88% of the available land area in China) [2]. To properly manage the challenges of soil salinization, it is important to understand how soil salinization occurs through monitoring the spatial and temporal changes in soil salinization. Nonetheless, soil salinization is very sensitive to variations in temperature, precipitation, groundwater level, and seasons. Hence it is difficult to monitor soil salinization. To this end, remote sensing technology, which has been widely applied in the study of land use/land cover change (having the advantages of large monitoring range, fast processing speed, and short research cycle), plays an important role in managing and preventing soil salinization.
Remote sensing technology has been applied in the study of soil salinization since the 1970s. With continued technological advances, the development of 3S technology has emerged one after another, and various satellites were launched, and the replacement systems gradually improved. For the research on soil salinization, the research methods have also evolved from qualitative research to quantitative research [3,4]; from the analysis of spectral and texture characteristics of saline soil to the analysis of framework models, such as comprehensive vegetation coverage and soil moisture change, etc. [5,6]. R. L. Dehaan and colleagues demonstrated that the growth and distribution of vegetation have a strong correlation with soil salinity [7]. By developing the Normalized difference vegetation index-Salinity index (NDVI-SI) feature space remote sensing model of soil salinization, Wang et al. successfully monitored the salinity change of saline soil in the Tarim Basin, Xinjiang [5]. However, most of these relevant studies focused on inland saline areas, such as northwest, northeast, and North China, with few studies focusing on coastal areas.
A variety of remote sensing data have been used for salinization identification and monitoring, including aerial photographs, video images and panchromatic, infrared, multispectral, hyperspectral, and radar images. In 1992, Dwivedi R.S. used Thematic Mapper (TM) images to analyze the optimal band set for saline–alkali land and found that the method of band set could improve the accuracy of extraction for monitoring saline–alkali land [8]. Based on fuzzy classification and Landsat TM image data, Metternicht [9] was able to differentiate types of salinized soils in Bolivia. In 2005, Masoud et al. [10] applied the Landsat TM/ETM+ (Enhanced Thematic Mapper) and digital elevation model (DEM) data with a spatial resolution of 30-m to monitor and analyze the changes of saline–alkali soil in the Siwa area of Egypt from 1987 to 2003. By relating the spectral parameters from MODIS images (e.g., vegetation index) to salinization, Bouaziz et al. [11] constructed the linear spectral unmixing (LSU) model to examine the status of soil salinization in semi-arid areas. Nonetheless, when extracting and monitoring the information of soil salinization, researchers mostly used the medium/low spatial resolution images [12,13,14,15,16]. While broadly satisfying the monitoring of soil salinization, the application of relatively coarse spatial resolution satellite images limits the ability to describe soil salinization in detail. To be specific, such an approach would fail to meet the needs of precision agriculture, especially in the field of intensive cultivation in eastern China.
At present, coastal areas in China accommodate 40% of the total population, produce 65% of the total industrial output value, constitute 55% of the Gross National Product, and cover 70% of the large and medium-sized cities [17]. However, rapid urbanization and socioeconomic development are increasing exploitation of groundwater resource to the point of worsening seawater intrusion in nearby coastal areas. Due to intensifying mining activities, there have been different degrees of seawater intrusion in the Liaodong Peninsula, Qinhuangdao City, Shandong Peninsula, the northern coastal areas of Jiangsu Province and Beihai of Guangxi [8]. Taking Shouguang City as an example, in the 1990s, the large-scale exploitation of groundwater resource resulted in seawater intrusion. That caused the increase of the concentration of chloride ion in groundwater in the northern area, which not only endangered the safety of water use but also led to secondary salinization of soil, numerous deserted machine wells, soil consolidation, poor soil fertility, and low crop production. With soil salinization, native plants gradually disappeared, and salt-tolerant plants replaced them as the dominant species, resulting in the simplification of local plant species and the decrease of regional ecological functions [18]. At the same time, the coastal saline soil contains a large amount of chloride, which has strong corrosiveness to concrete and reinforced concrete materials [19]. It destroys roadbed, endangers engineering construction, and seriously constrains the socioeconomic development in coastal areas. Relative to Landsat satellite image, high-resolution image (GF-1) has higher resolution and wider broad width, which improves the ability to monitor soil salinization patterns in greater detail. However, we have not seen the application of the domestic GF-1 and GF-2 for monitoring soil salinization in any previous studies [20]. In this paper, we utilize the domestic GF-1 and Landsat satellite images, the measured soil total salt content, the NDVI-SI remote sensing monitoring index of soil salinization to invert the surface soil salinity in Shouguang (Weifang city, Shandong Province, China), and extract the distribution information of salinization. By a comparison of the extraction results of soil salinization information of the two sensors, we can obtain the distribution map of soil salinity in Shouguang city. Meanwhile, Landsat satellite images were used to study the spatial and temporal evolution of soil salinization in Shouguang. By combining them with the local groundwater level information, we analyze the influence of groundwater level on soil salinization, and investigate the causes and evolution mechanism of soil salinization in Shouguang.
2. Materials and Methods
2.1. The Background Conditions of the Study Area
Shouguang (Longitude: 118°32’ E–119°10’ E, Latitude: 36°41’ N–37°19’ N) is a part of Weifang city, Shandong Province. It is located in the north-central part of Shandong Province, the northwest of Weifang city and the southwest coast of Laizhou Bay, Bohai Sea. It is a warm temperate monsoon zone, characterized by a continental climate and strong monsoon, with annual precipitation of 593.8 mm (which mainly concentrates in June to August). In terms of annual potential evaporation, it annual average value is 1834 mm, with maximum and minimum values of 2531.8 mm and 1453.5 mm, respectively. The annual average temperature is 12.9 °C, the monthly average temperature is the highest in July (26.6 °C), the lowest in January (−2.8 °C), the extreme maximum temperature is 42.5 °C, the extreme minimum temperature is −22.3 °C, the annual average sunshine duration is 2444.4 h, the annual average evaporation is 1834.0 mm, and the frost-free period is 202 days. Since Shouguang is located in the coastal plain area of north-central Shandong Province, its terrain belongs to the depression type which gradually decreases from the south to the north. The coast is a silty plain, and the coastline is relatively straight, with many shoals covered by sandy soil. Socioeconomically, Shouguang is known as the hometown of vegetable production in China. It supplies high-quality fresh vegetables to the whole country all year round. Both the industrial and agricultural sectors have been growing rapidly along the coast. In December 2017, Shouguang was selected as one of the Chinese top 100 industrial counties (cities). The major crops grown in Shouguang include corn, wheat, and cotton. The soils in Shouguang are characterized by Eutrochrepts, Hapludalf, Aquents, Calciaquert, and Haplaguept (according to United States Department of Agriculture soil taxonomy). Being the largest vegetable production base in the north of China, Shouguang relies heavily on the groundwater extraction for irrigation purpose. In recent years, the north of Shouguang has been affected by high salinity and alkalinity due to seawater intrusion [21]. In addition, the average groundwater level fell sharply in the city, with a cumulative decrease of 17.56 m over a 33-year period, i.e., an average annual decrease of 0.53 m [22]. The surface soil salinity is low for the towns in the southern part of the city, where vegetable cultivation is primarily conducted using greenhouses. Although the greenhouse soils may also suffer from salinization, it is not possible to see it in a satellite image. By deriving the characteristics of soil salinization from remote sensing images, this study investigates the distribution of soil salinization in bare land located in the north of Shouguang.
2.2. Data
2.2.1. Remote Sensing Data
This study applies the GF-1 data products on 28 May 2017; and Landsat data products from 1987 to 2017. The GF-1 data was obtained from China High-resolution Earth Observation System Shandong Center of Data and Application, while the Landsat image data was downloaded from the National Aeronautics and Space Administration (NASA) website [23]. The selected band number is 121 and the row number is 34. The specific data parameters of the image are shown in Table 1.
A series of processes involving radiometric calibration, atmospheric and geometric correction were performed on the high-resolution and Landsat images. Meanwhile, the high-resolution image also required orthographic correction. Then we used a vector map of Shouguang to cut the image and create a complete image mosaic. The fusion of the panchromatic and multispectral bands adopts the NNDiffuse Pan Sharpening method, and the processed image meets the application standard.
2.2.2. Surface Soil Measured Data
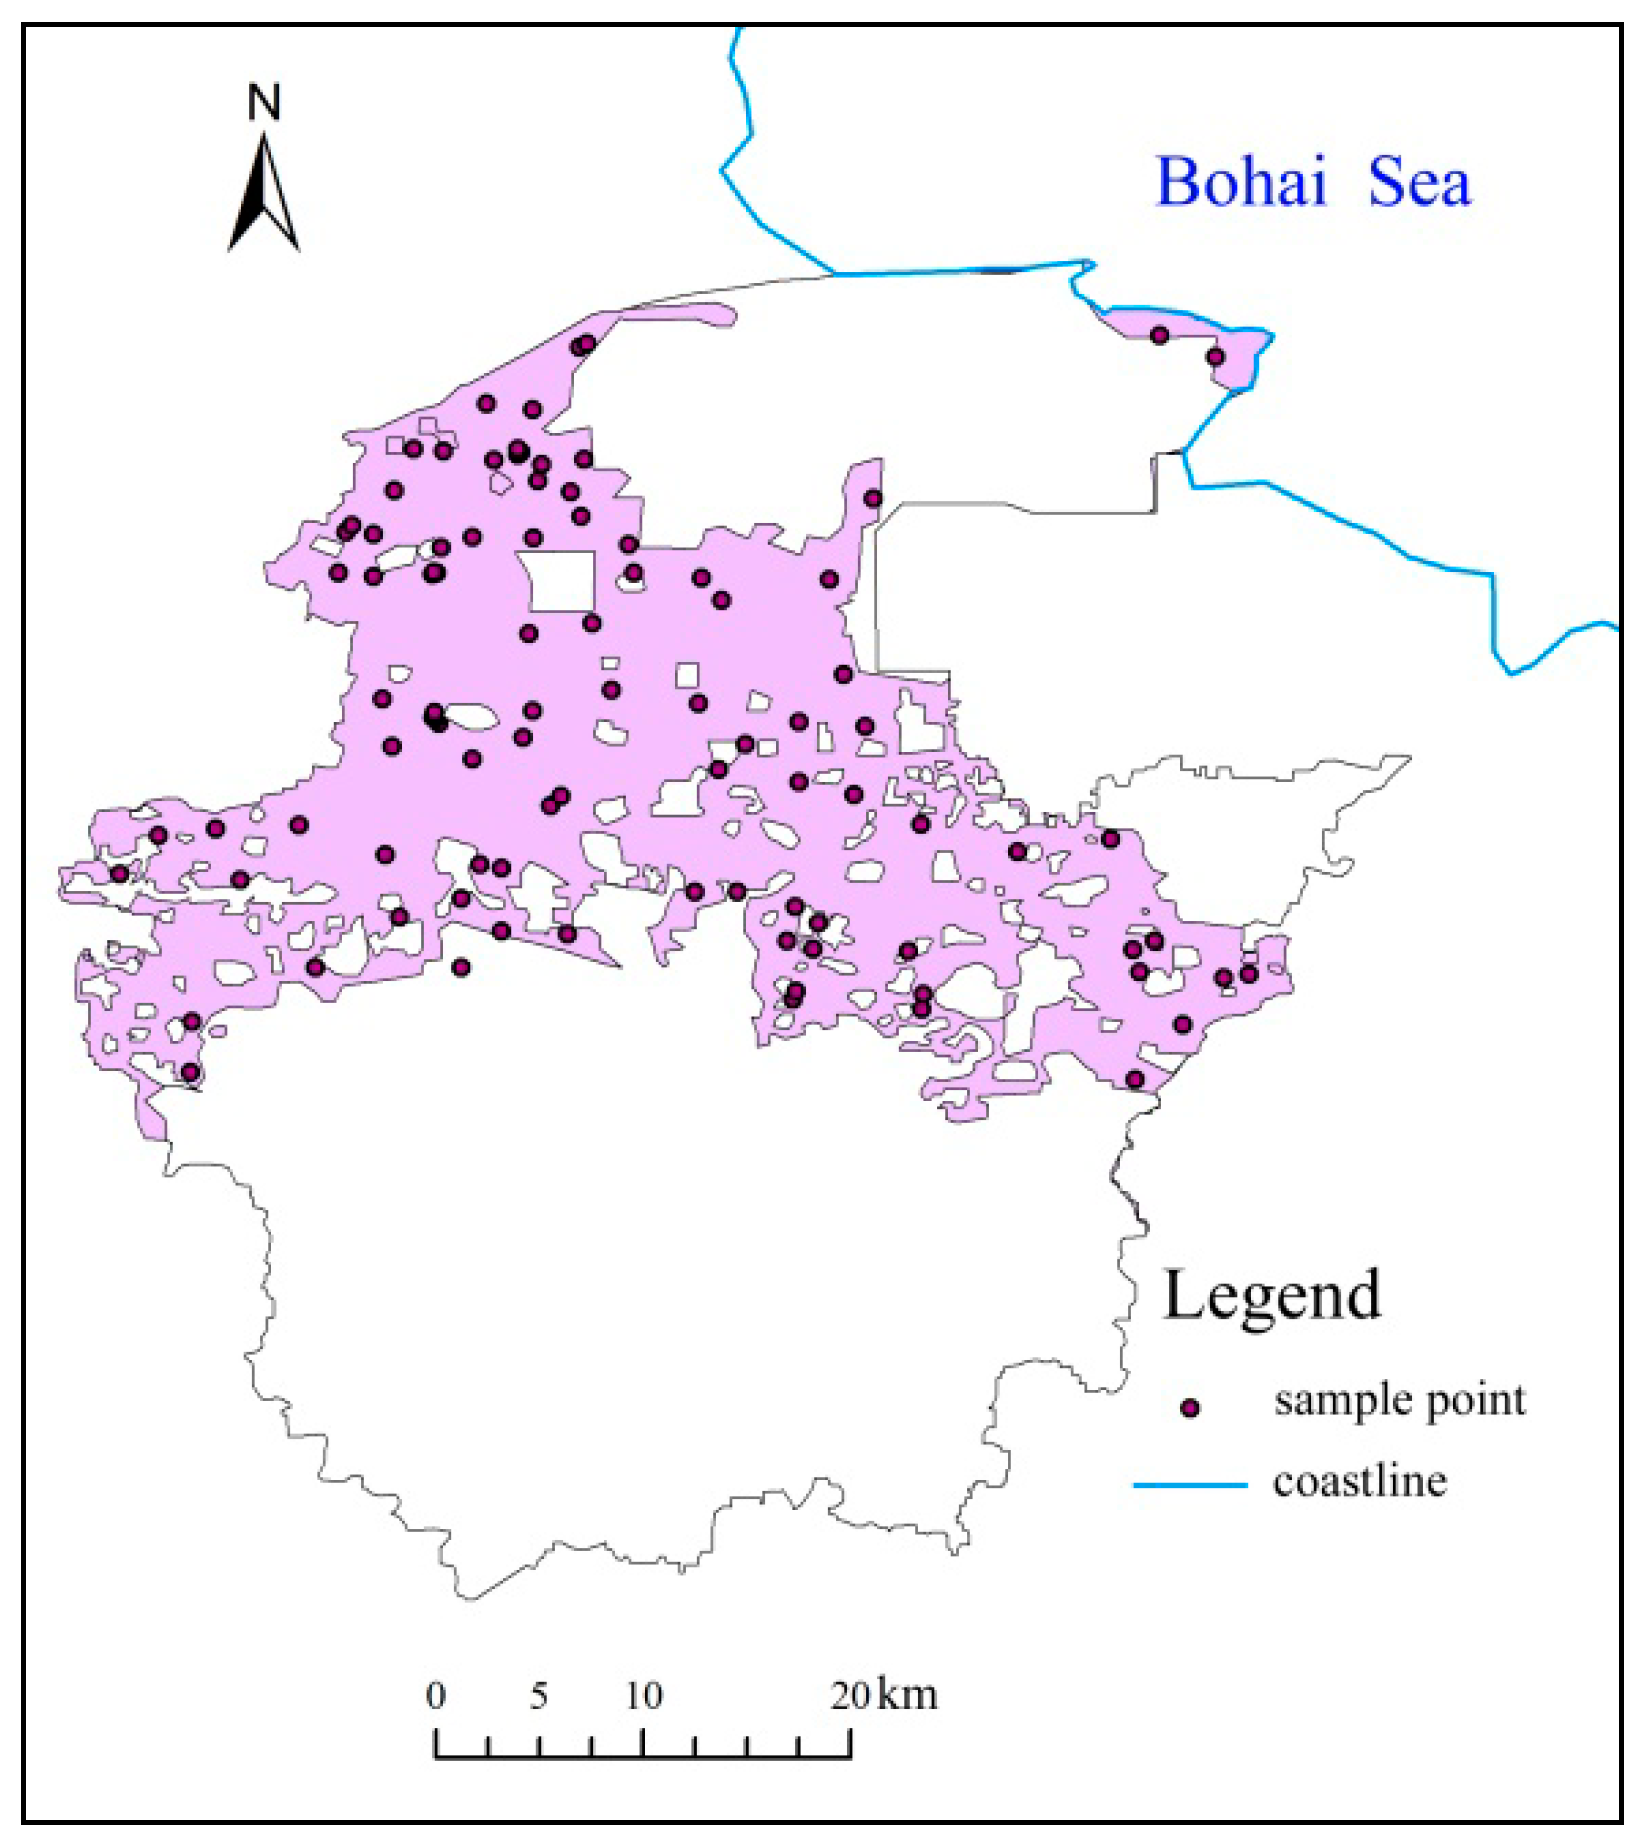
Based on the hand-held GPS positioning in Shouguang City from 9 to 11 May 2017, we identified 100 salifirious sampling points of soil surface from the south to the north. To avoid the interference due to complex surface features in a single pixel, the collection points of soil samples were mostly set at the center of farmland and wasteland which had a large area. The sample collection points covered all kinds of saline soils (Figure 1). To better reflect the relationship between the soil salinity and the surface albedo, saline soil samples were collected at a depth of 0 to 5 cm on the surface. They were recorded and brought back to the laboratory for salinity detection.
2.3. Surface Soil Sample Processing Method
The collected soil samples (100 in total) were air-dried in a cool place. Then, they were ground and screened using soil sieve. From there, each soil sample was split into different particle sizes and stored separately. A soil solution was prepared by mixing 10 g soil sample of particle size less than 2 mm with 50 mL carbon dioxide-free distilled water (deionized water) in a 100 mL volumetric flask. After plugging and oscillating for 5 min, the soil leachate was filtered and separated, and placed in a 25 °C thermostat and sealed for reserve. After drying the evaporating dish in the oven for 3 h, its mass M0 was weighed. A pipette was used to transport 30 mL of the solution to be tested in an evaporating dish of known mass (M0) for drying. A small amount of 15% H2O2 solution should be added at almost the end of steaming. In the process of preparing the residue, the evaporating dish was rotated continuously; the organic matter contained was removed by continuous heating, and the residue was treated repeatedly until the residue turned white. (Note that the organic matter would have been completely burnt and removed in the heating process.) After heating and drying for two hours, the evaporating dish (together with the white residue) was left to be cooled at room temperature, and weighed using an analytical balance. The evaporating dish was heated and dried again (for one hour); and then cooled and weighed again until we got a constant weight (M1), i.e., the weight difference between the two times should be no more than 0.0003 g. To calculate the salinity of the soil samples, we use the following equation.
where Z is the soil salt content (g/kg), M is the soil sample weight (g), M1 is the sum of the drying vessel and the salt mass (g), and M0 is the dried weight of the vessel (g). To convert the results to g/kg, we multiply the (M1 − M0) by 1000. Through the calculation, we can obtain the salinity data of 100 saline soil samples.
2.4. SDI
SDI is a remote sensing synthesis index model for monitoring of soil salinization based on NDVI-SI. The salinity index (SI) determined red and blue bands could better reflect the degree of soil salinization when it is used to extract salinization information [24,25]. However, the vegetation information on the surface is seldom considered in SI index when extracting soil salinity. When applying a similar approach to the land covered with vegetation, and its ability in extracting salinization information is poor. Other studies have shown that a negative correlation exists between surface soil salinity and normalized differential vegetation index (NDVI), and such correlation is relatively high. With the increase of surface soil salinity, the NDVI gradually decreases [26]. Based on previous research results, we established the feature space of NDVI-SI as a remote sensing image factor for quantitative inversion of surface soil salinity in the study area and established an inversion model together with measured data.
After image pre-processing, we use a Pan and Multi-spectra Sensor (PMS) image to calculate the SI, NDVI, and soil salinization monitoring index (SDI).
The calculation formula is given by:
where SI is the salinity index, NDVI is the normalized difference vegetation index, b1 is the reflectivity of blue band, b3 is the reflectivity of red band, and b4 is the reflectivity of near-infrared band.
The maximum and minimum values of NDVI and SI are counted, and transform into non-dimensional sequences.
where NDVImin is the minimum value of NDVI, NDVImax is the maximum value of NDVI, N is the normalized value of NDVI, SImin is the minimum value of SI, SImax is the maximum value of SI, S is the normalized value of SI.
Calculating SDI value of soil salinization monitoring index using remote sensing.
where N is the non-dimensional sequences of NDVI (Equation (4)), S is the non-dimensional sequences of SI (Equation (5)), SDI is the soil salinization monitoring index.
3. Results and Discussion
3.1. Remote Sensing Monitoring Model of Surface Soil Salinization Based on PMS and OLI Images
Here, 80 sample points were randomly selected from 100 sample points for modeling, and the remaining 20 sample points were taken as verification points. A correlation analysis was conducted between surface soil salinity data of ground points and SDI values of the corresponding pixels in PMS/ Operational Land Imager (OLI) images. Table 2 displays the corresponding relationship between surface soil salinity data and image SDI values.
The correlation analysis showed that the goodness of fit R2 between the soil salinity measured in the field and the soil salinization monitoring index of PMS soil salinization was 0.871 (Figure 2), and the significance level p < 0.01.
The remaining 20 sample values were used to verify the accuracy of the model (Table 3), through this equation.
where R is the root mean square error, Xobs,i is the measured surface soil salinity, Xmodel,i is the predicted surface soil salinity, and n is 20.
The RMSE (Root Mean Squard Error) value is 2.373. In t-test, a = 0.02, T (19) = 2.539, because 2.373 < 2.539, the accuracy is within acceptable range. The developed model should be robustness enough for monitoring and inversion of salinization information.
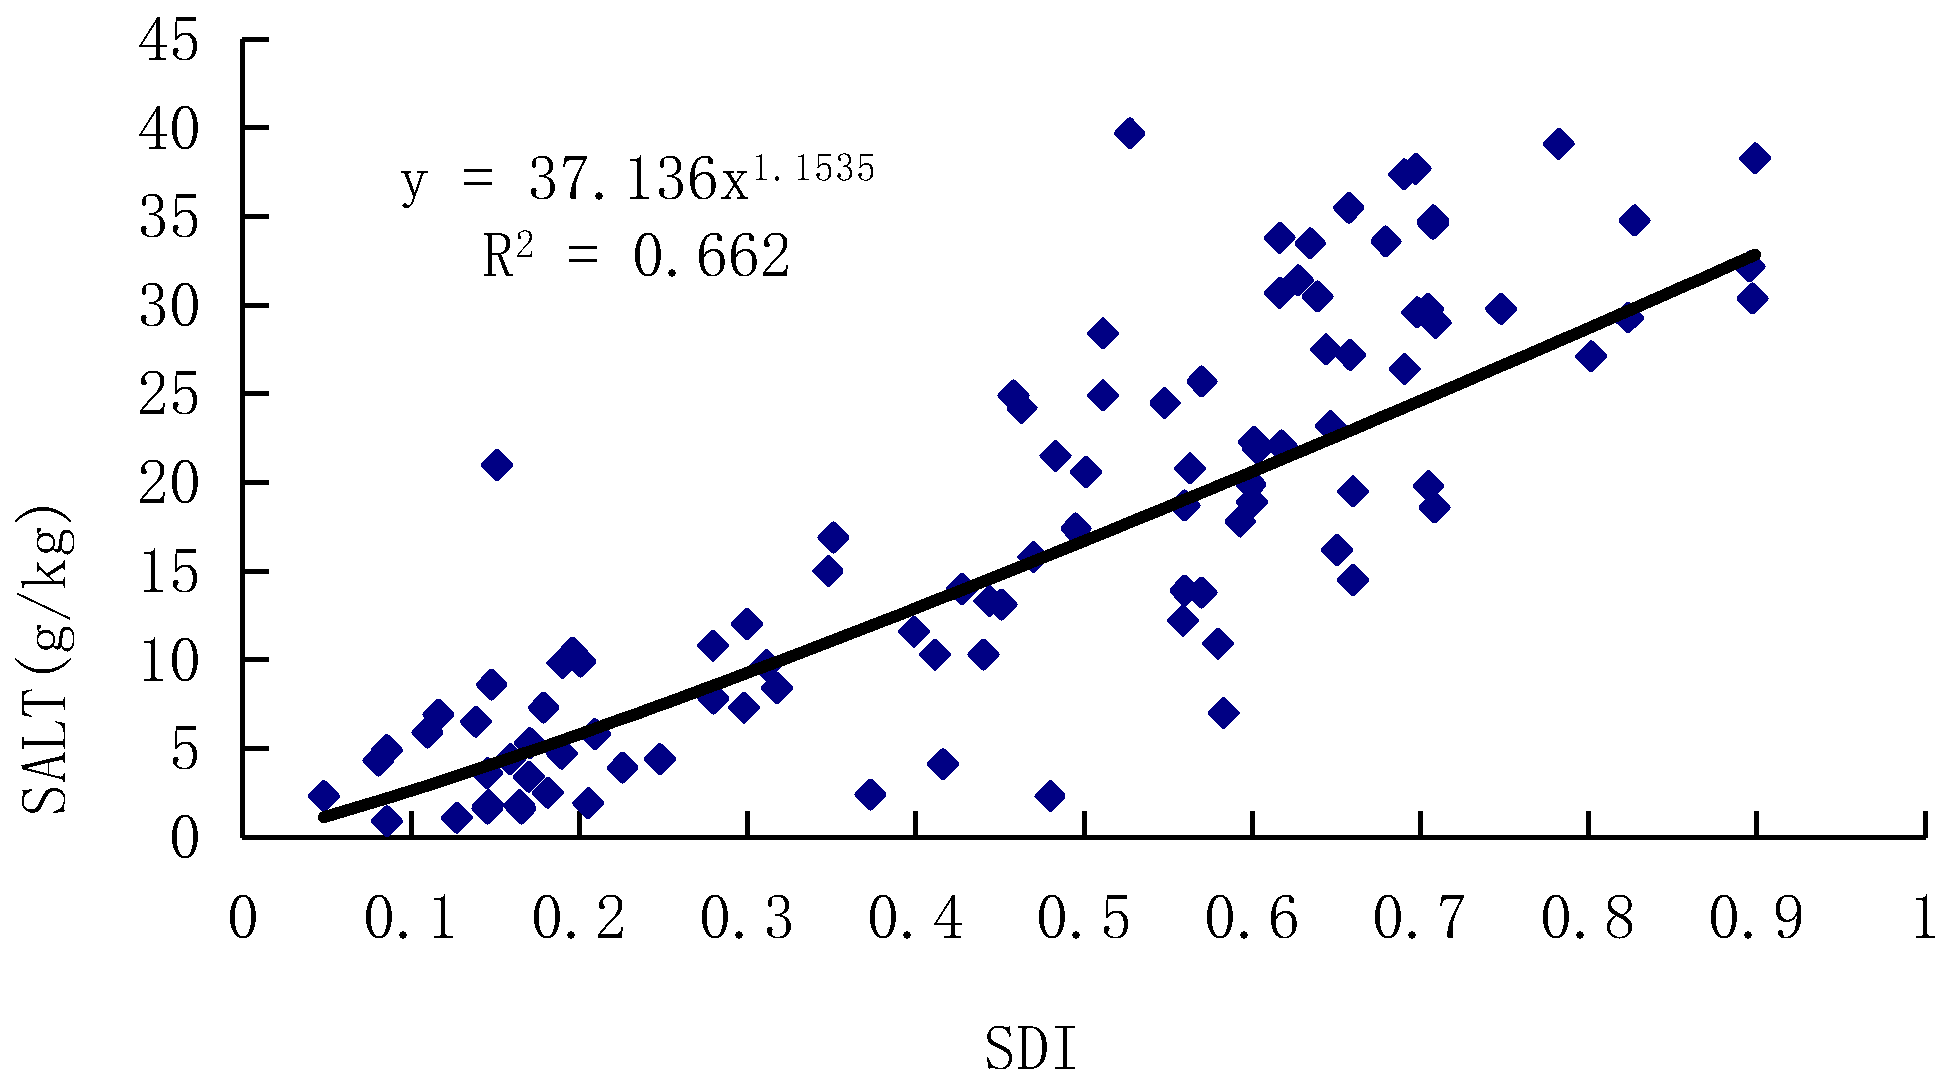
When we performed the correlation analysis between the sample points of surface soil salinity corresponding to the PMS image and SDI values corresponding to the OLI image, we found that the goodness of fit R2 between surface soil salinity and OLI soil salinization remote sensing monitoring index was 0.662 (Figure 3).
Since the spatial resolutions of the OLI image and PMS image are 30 m and 2 m, respectively, a substantial difference in the resolution of surface features is expected. Therefore, the corresponding relationship between the image pixel values and the measured data of surface soil salinity is also different. The Landsat images have higher requirements for sampling because each pixel contains various types of ground objects. Hence, it is difficult to invert the salt content of surface soil accurately. Nonetheless, there is still a certain correlation between the SDI of the OLI image and the measured salinity, which can reflect the macroscopic characteristics of soil salinization in the region, and the Landsat series satellite images are still needed for monitoring in a longer time scale.
When monitoring soil salinization in a small area, high-resolution PMS data can provide higher inversion accuracy about salinization information; and a stronger response to the measured data of surface soil salinization. It could be roughly classified in accordance with the relationship between SDI value and surface soil salinity.
Using characteristic two-dimensional space remote sensing data of NDVI and SI, we establish a simple and convenient standard for monitoring soil salinity in Shouguang even in the eastern coastal cities. It is expected to provide an effective working idea for monitoring large-scale soil salinization.
Based on the difference of spatial resolution between GF-1 and Landsat images, and the subtle difference in reflectance of ground objects, we also develop different standards which are basically consistent but slightly different between GF-1 and Landsat images (see the specific standard settings in Table 4).
3.2. Soil Salinization Inversion Results Based on PMS Images in 2017
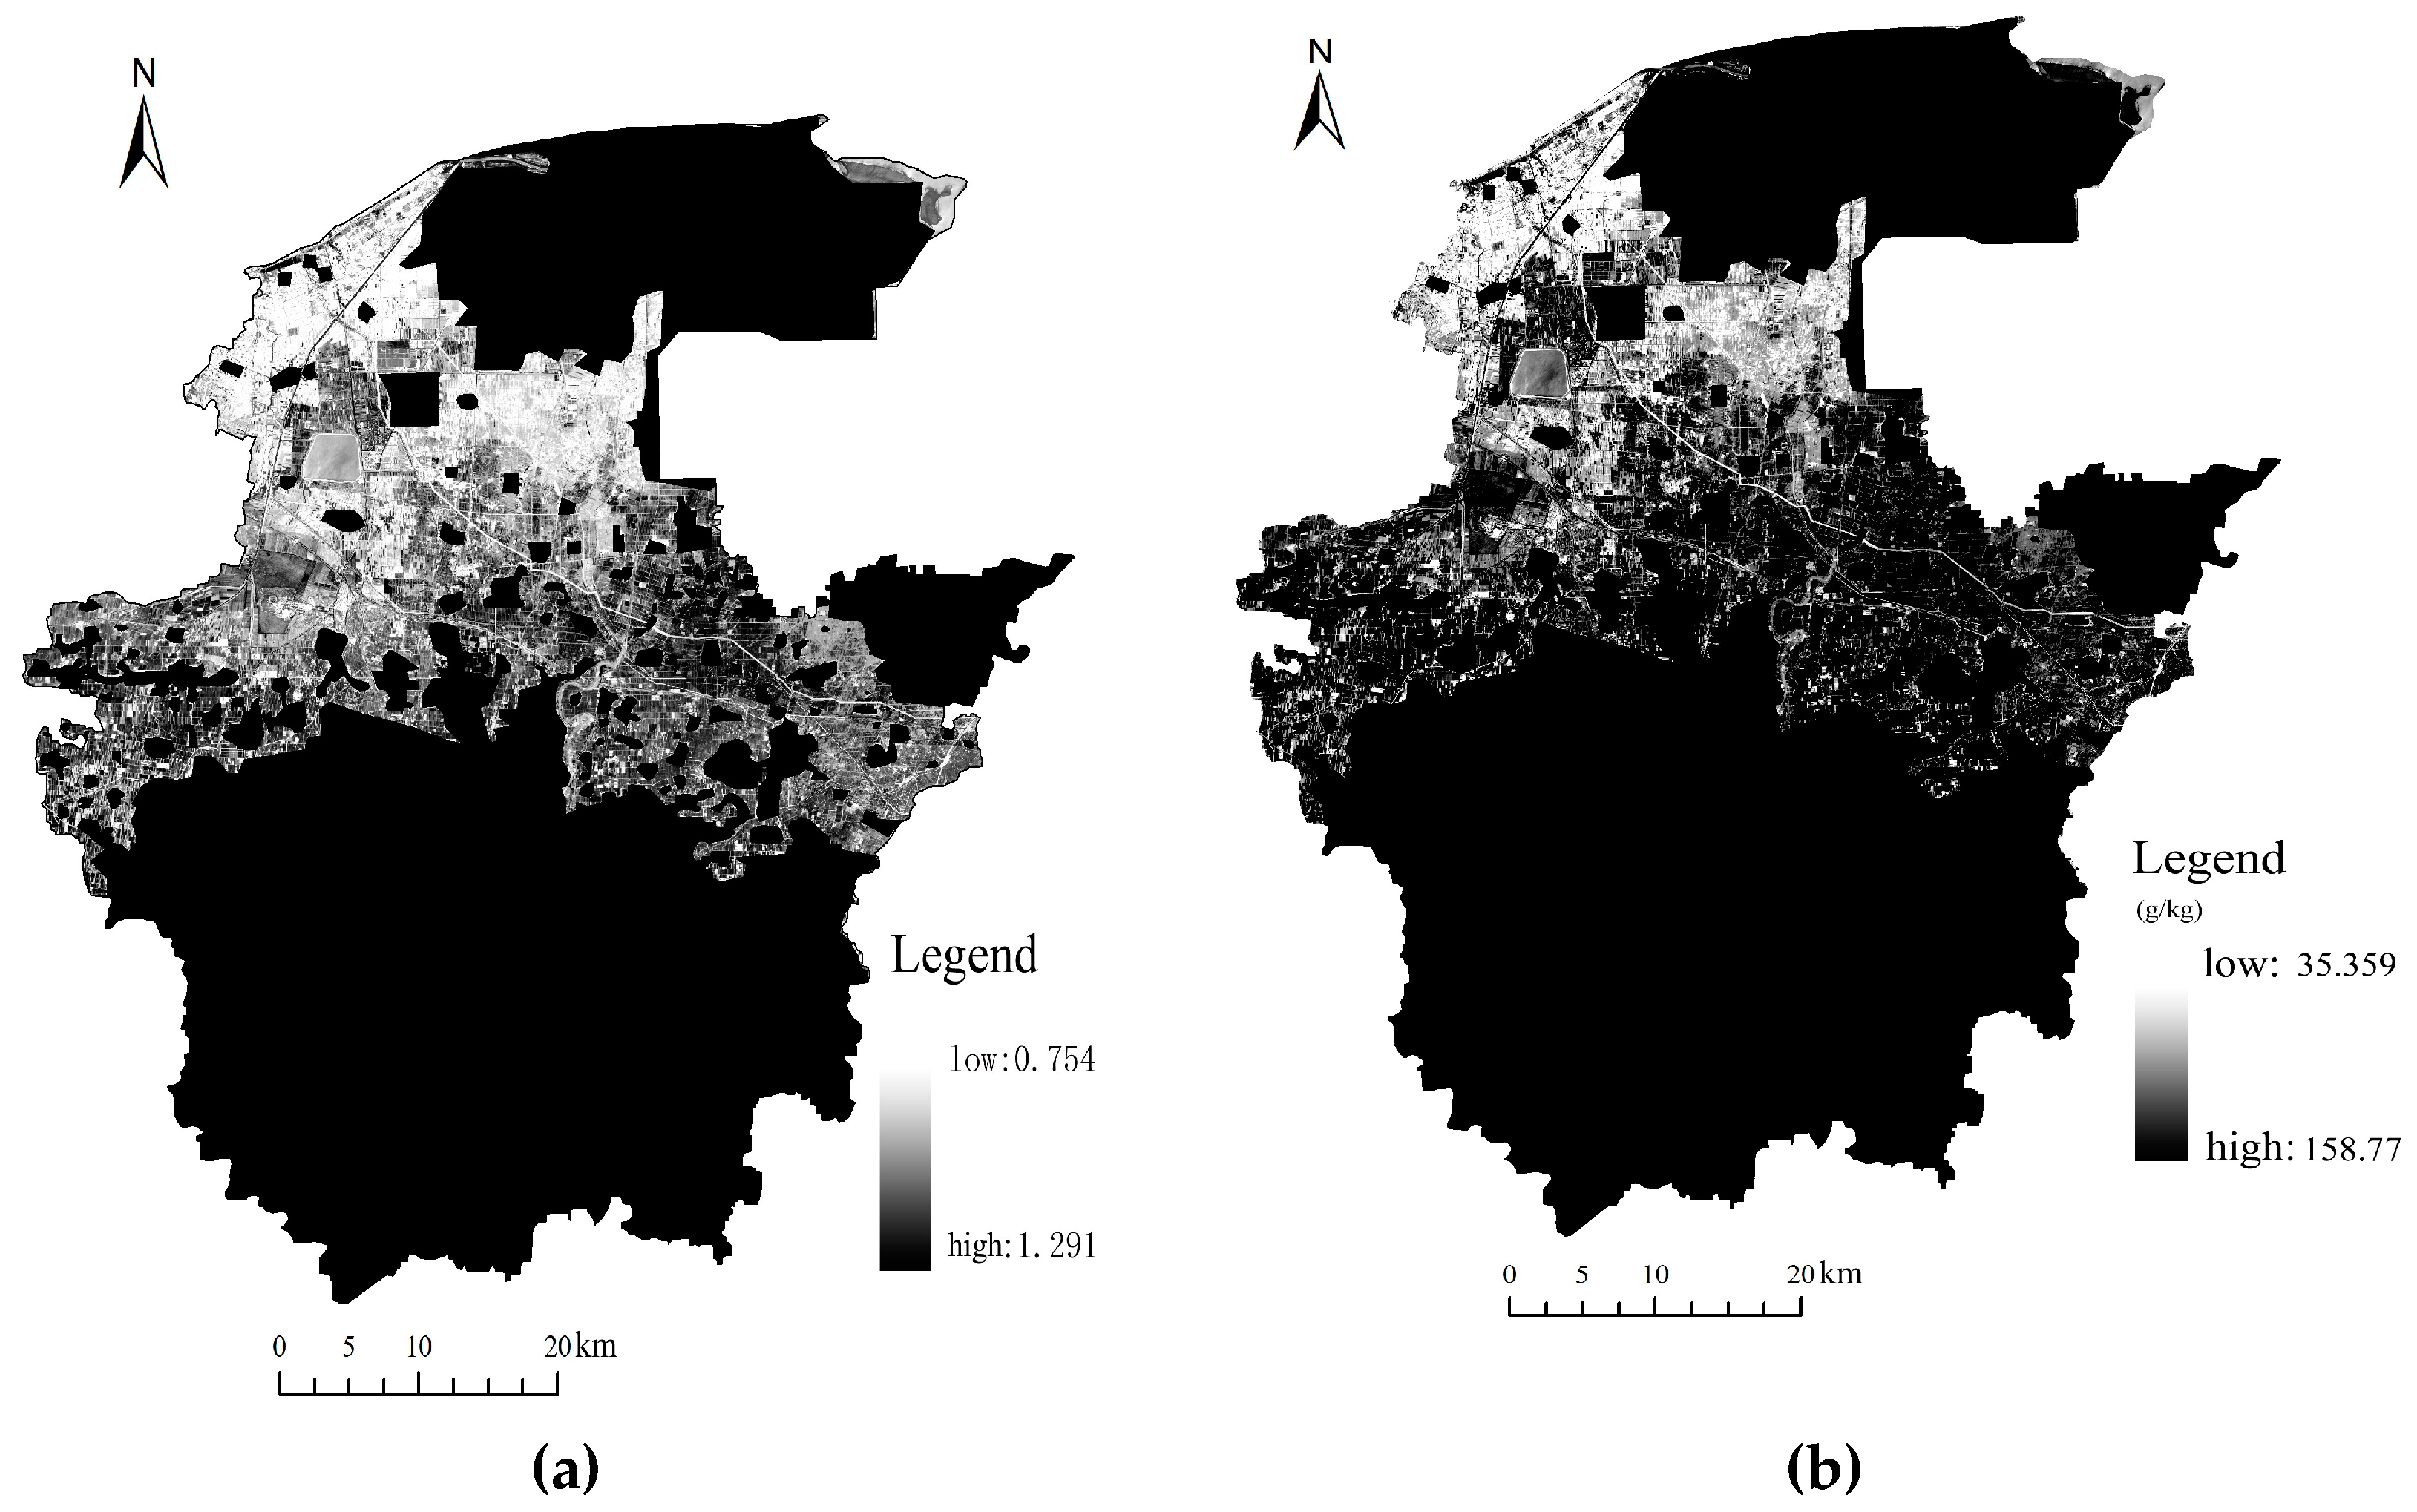
According to Equation (6), the SDI values of all pixels in the PMS image are calculated (Figure 4a), and the maximum SDI in the study area is 1.291, and the minimum is 0.754. Based on the established remote sensing monitoring model of soil salinization from PMS images (see the regression model in Figure 2), we performed the inversion of soil salinity using the PMS images of Shouguang in 2017 (Figure 4b). It showed that the maximum and minimum values of surface soil salinity in the study area are 158.77 g/kg and 35.359 g/kg, respectively.
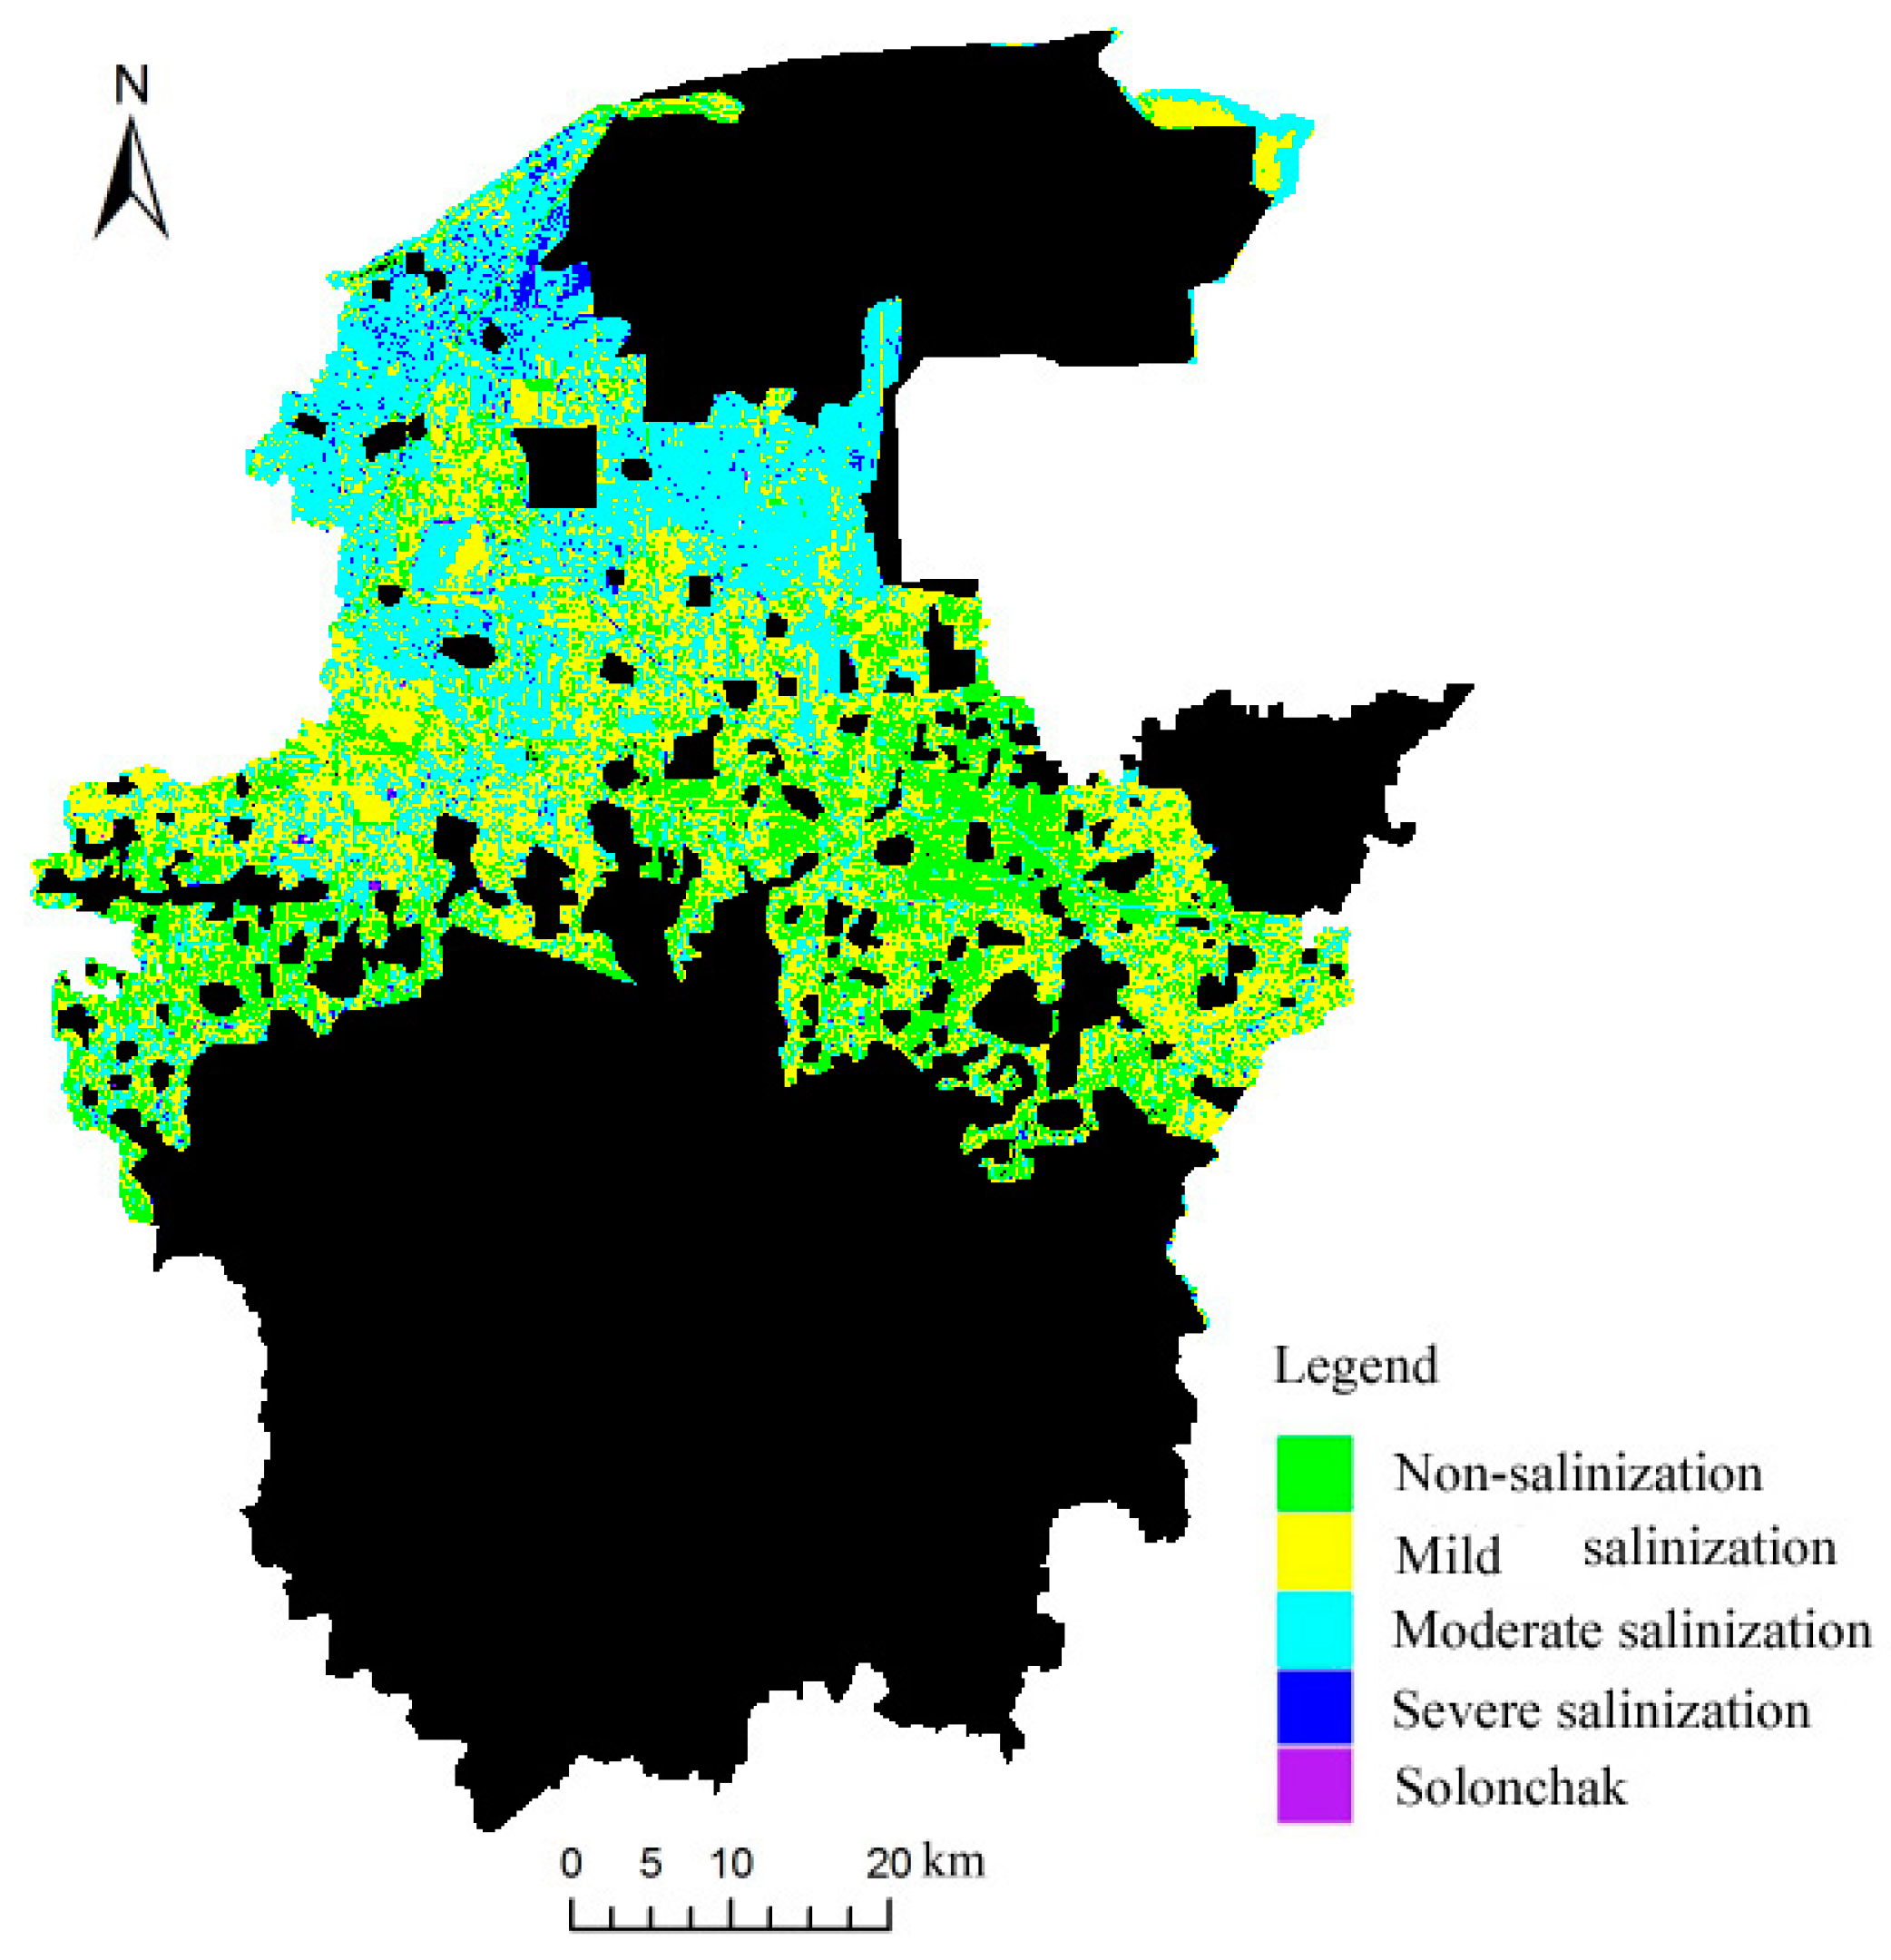
According to the grading standard of saline soil, the soils in Shouguang were categorized into five grades (i.e., non-salinization, mild salinization, moderate salinization, severe salinization. and solonchak). Because of the strong correlation between SDI and the measured soil salinity, SDI can be used to classify the soil salinity. Thus, the distribution area of different grades of soil salinity in the study area was obtained. Based on the salinization classification standard of PMS (Table 4), we classified the SDI image (Figure 4a) into five grades (Figure 5). Table 5 demonstrates the quantitative features of surface soils of Shouguang which were categorized using the grading standard of saline soil.
We studied the distribution of soil salinization in bare land in the north of Shouguang city in 2017 (after removing the whole area of southern Shouguang, and part of the northern residential land, and vegetable greenhouse land). In terms of area size (see Table 5 and Figure 5), mild salinization soil ranks the top (258.210 km2), followed by moderately saline soil (256.613 km2), non-saline soil (155.336 km2), severe saline soil and solonchak (11.709 km2). Spatially, the salinity of surface soil in the northern Shouguang shows obvious zonal distribution. Most of the soil in the central area is either normal or slightly salinized. With the increase of latitude, the salinity of surface soil in Shouguang gradually increases from the south to the north, and transits from normal to mild salinized soil, indicating that the degree of salinization of surface soil is lower when it is far away from the sea. With the increase of soil salinity, the number of vegetable greenhouses gradually decreased from the south to the north where the number of vegetable greenhouses was almost zero along Houzhen to Wopu. The main crops were salt-tolerant cotton and fruit trees. Soil salinity continued to increase near Yangkou town, and there are many local saltpans, mainly chemical plants.
3.3. Dynamic Monitoring of Soil Salinization
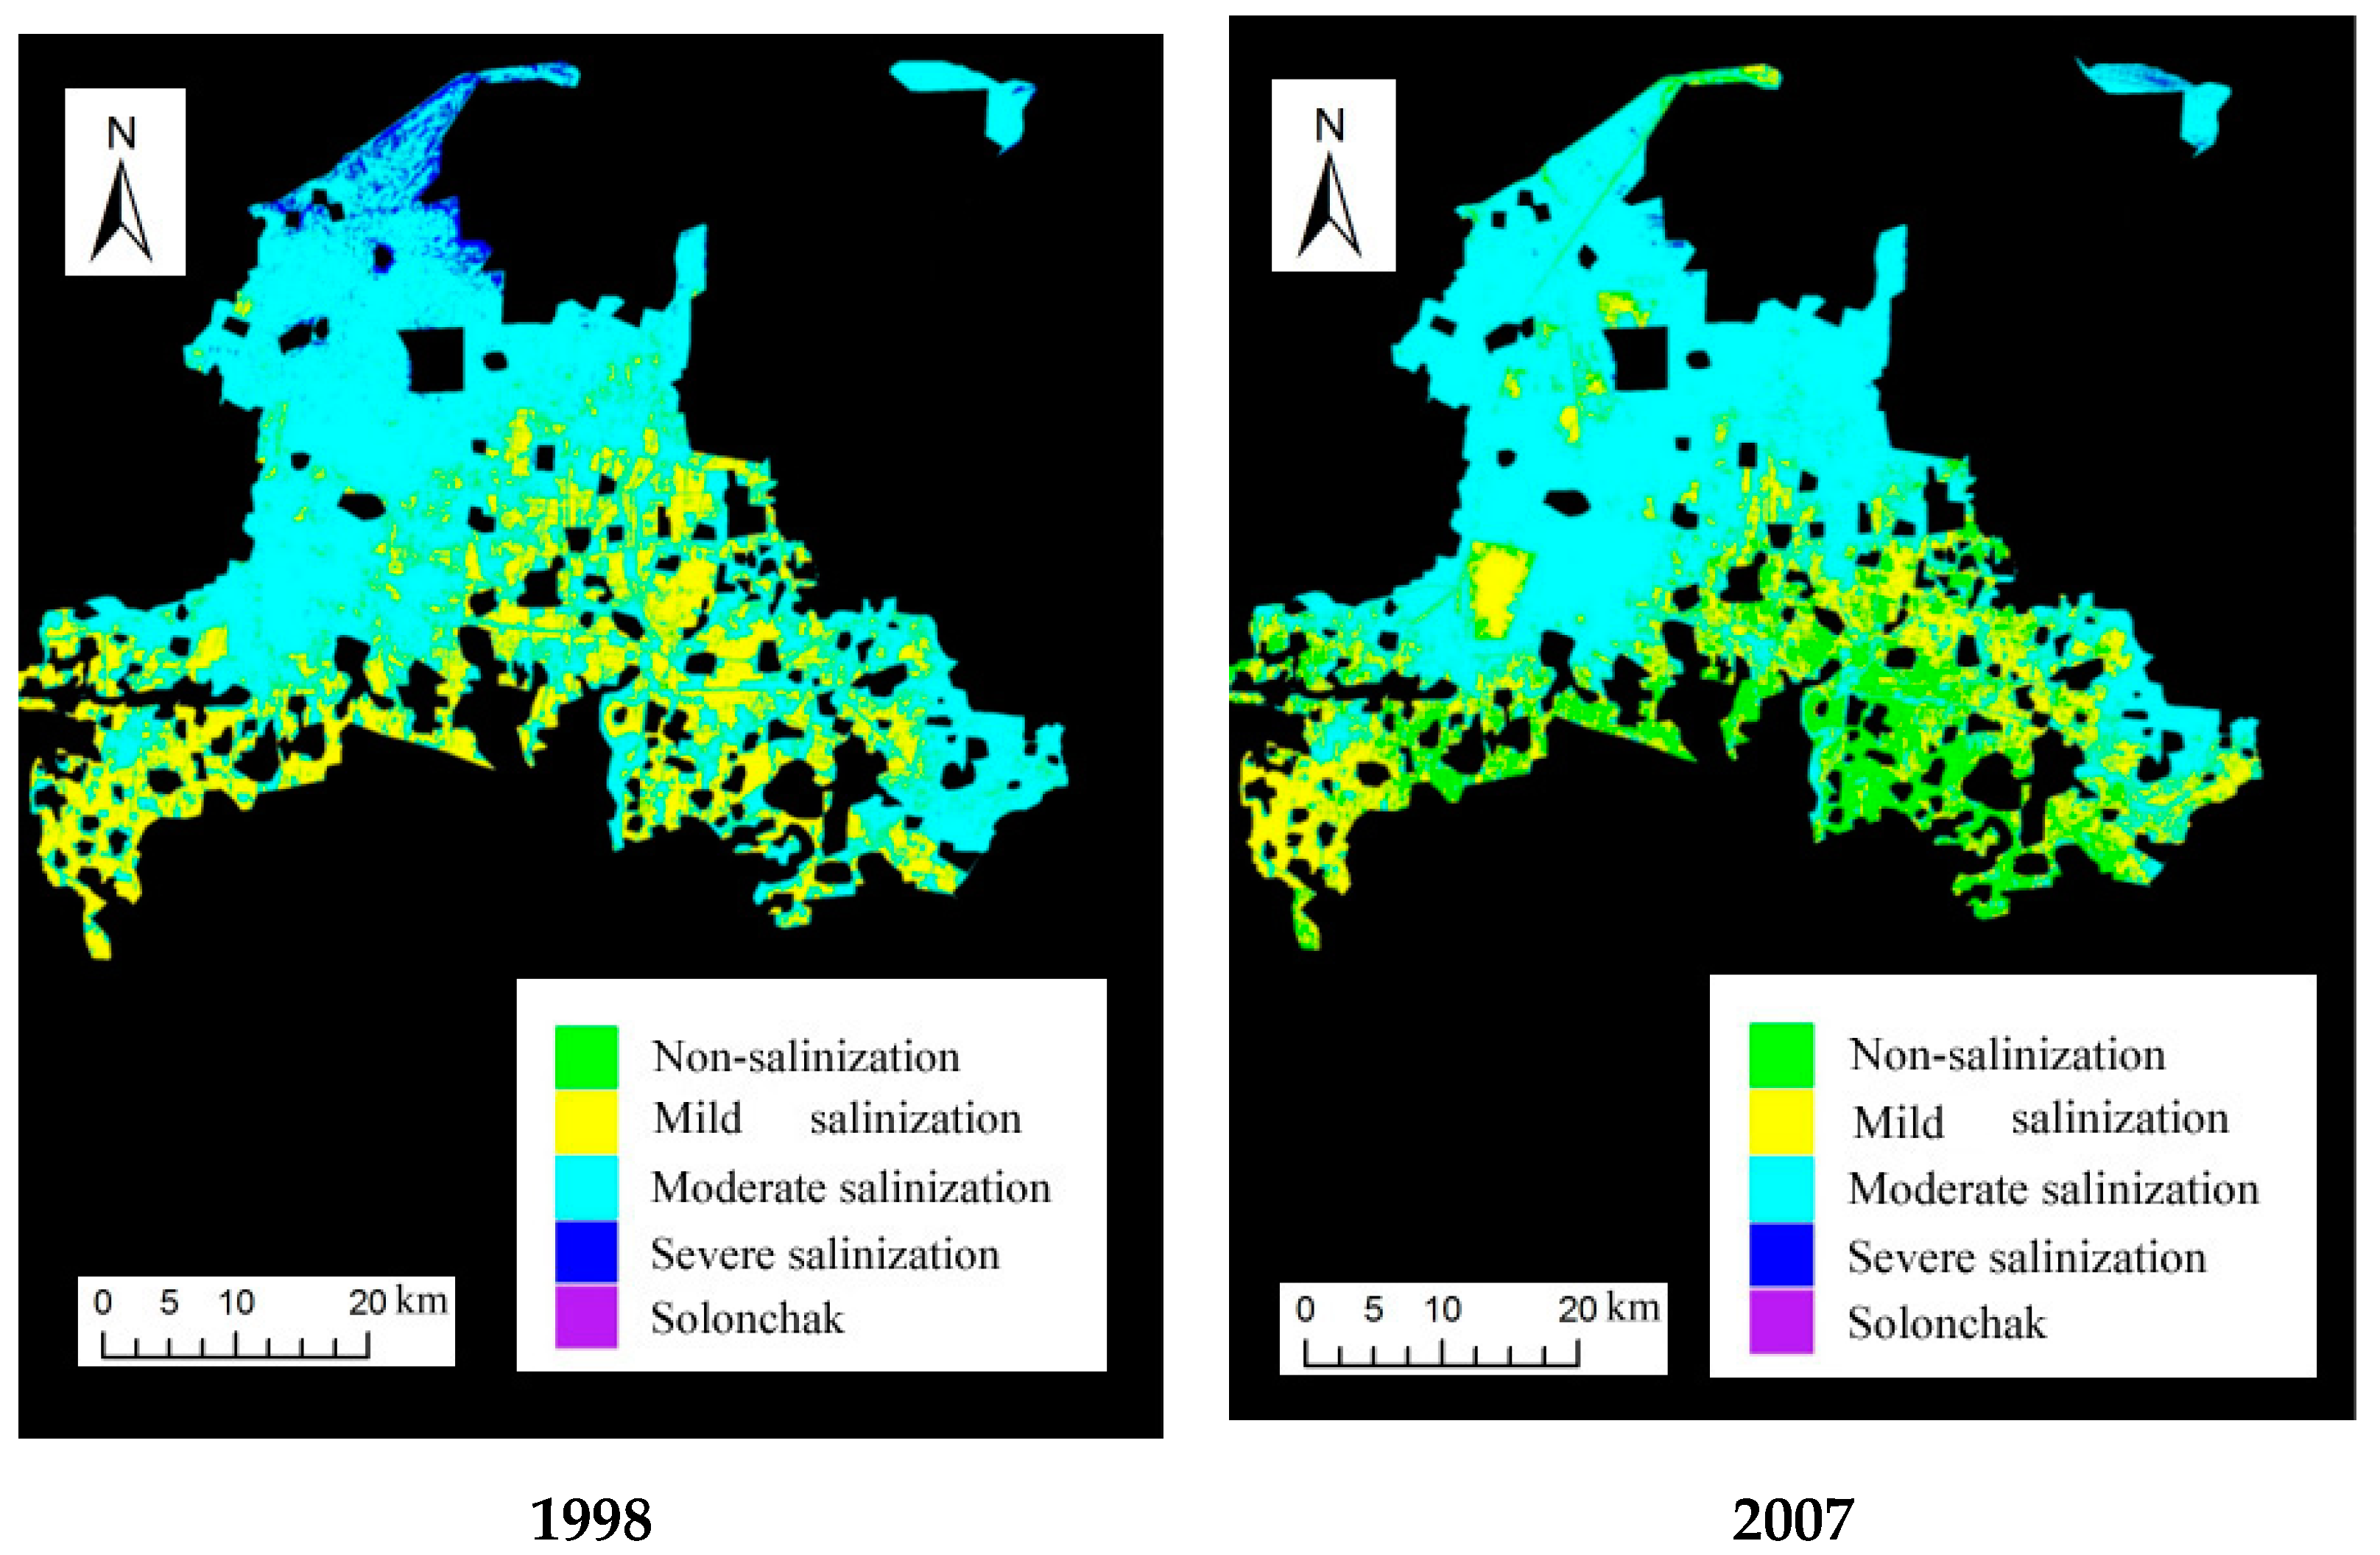
While the high-resolution satellites can offer more accurate soil salinization information, they are limited by their late launching time. Hence the Landsat satellite images are still needed for supplementing the monitoring of soil salinization on a longer time scale. Based on these images, we can deepen the understanding of the dynamic development of soil salinization in the northern Shouguang, explore the evolution law of soil salinization, and support the management of soil salinization in Shouguang. OLI and TM are sensors on LANDSAT. The reflectivity of typical objects is roughly the same in the visible and near-infrared range. So, we can also use TM images to extract soil salinity. We extracted the information of soil salinization from 1998 to 2007 in Shouguang from the Landsat image (Figure 6) and extracted the information of soil salinization in 2017 from the PMS image (Figure 5). From there, we analyzed the spatial and temporal patterns of soil salinization in Shouguang from 1998 to 2017.
Through the monitoring index of remote sensing, we extracted the changes in soil salinity in different grades from 1998 to 2017 (Table 6). Figure 5 and Figure 6 show that the area of non-salinized soil steadily increased, whereas the area of mildly salinized soil increased slightly from 1998 (201.453 km2) to 2017 (258.210 km2). By contrast, the area of moderately salinized soil decreased significantly in the past 20 years, with the most severe decrease occurred in the past 10 years (reaching 168.113 km2 or a reduction rate of 39.58%). Whilst the area of severely salinized soil and solonchak was smaller in the study area, it gradually increased in the past 20 years.
From Table 6, the degree of soil salinization showed a steady improvement in the northern part of Shouguang in 1998 to 2007 and 2007 to 2017. In particular, more than 90% of the saline soils remained either stable or improved. Overall, soil desalination has occurred gradually.
In the northern part of Shouguang, soil salinization mainly concentrated around the coastal areas. For example, the salinization of land has obviously aggravated in the northeast, while the inland areas far from the coast exhibited little change in soil salinity. From Table 6 and Figure 6, it can be seen that from 1998 to 2007, the northwest part of the study area showed either small/obvious reduction in soil salinization, while the central part demonstrated the aggravation and deterioration of soil salinization. From 2007 to 2017, most parts of the study area showed stability and improvement in terms of reduced soil salinity. Since 1998, soil salinization in Yingli town and Yangkou town in the north of Shouguang has stabilized. The soil salinization in the central and northern areas weakened from 1998 to 2017, i.e., characterized by a gradual shift from moderately saline soil to mildly saline soil and non-saline soil.
The distribution and evolution of soil salinization in Shouguang demonstrated obvious characteristics of zonal distribution. To put this into perspective, we found the distribution of non-salinization, mild salinization, moderate salinization to severe salinization and even solonchak to be from the south to the north. Most of the areas with the most serious salinization are located around the coastline.
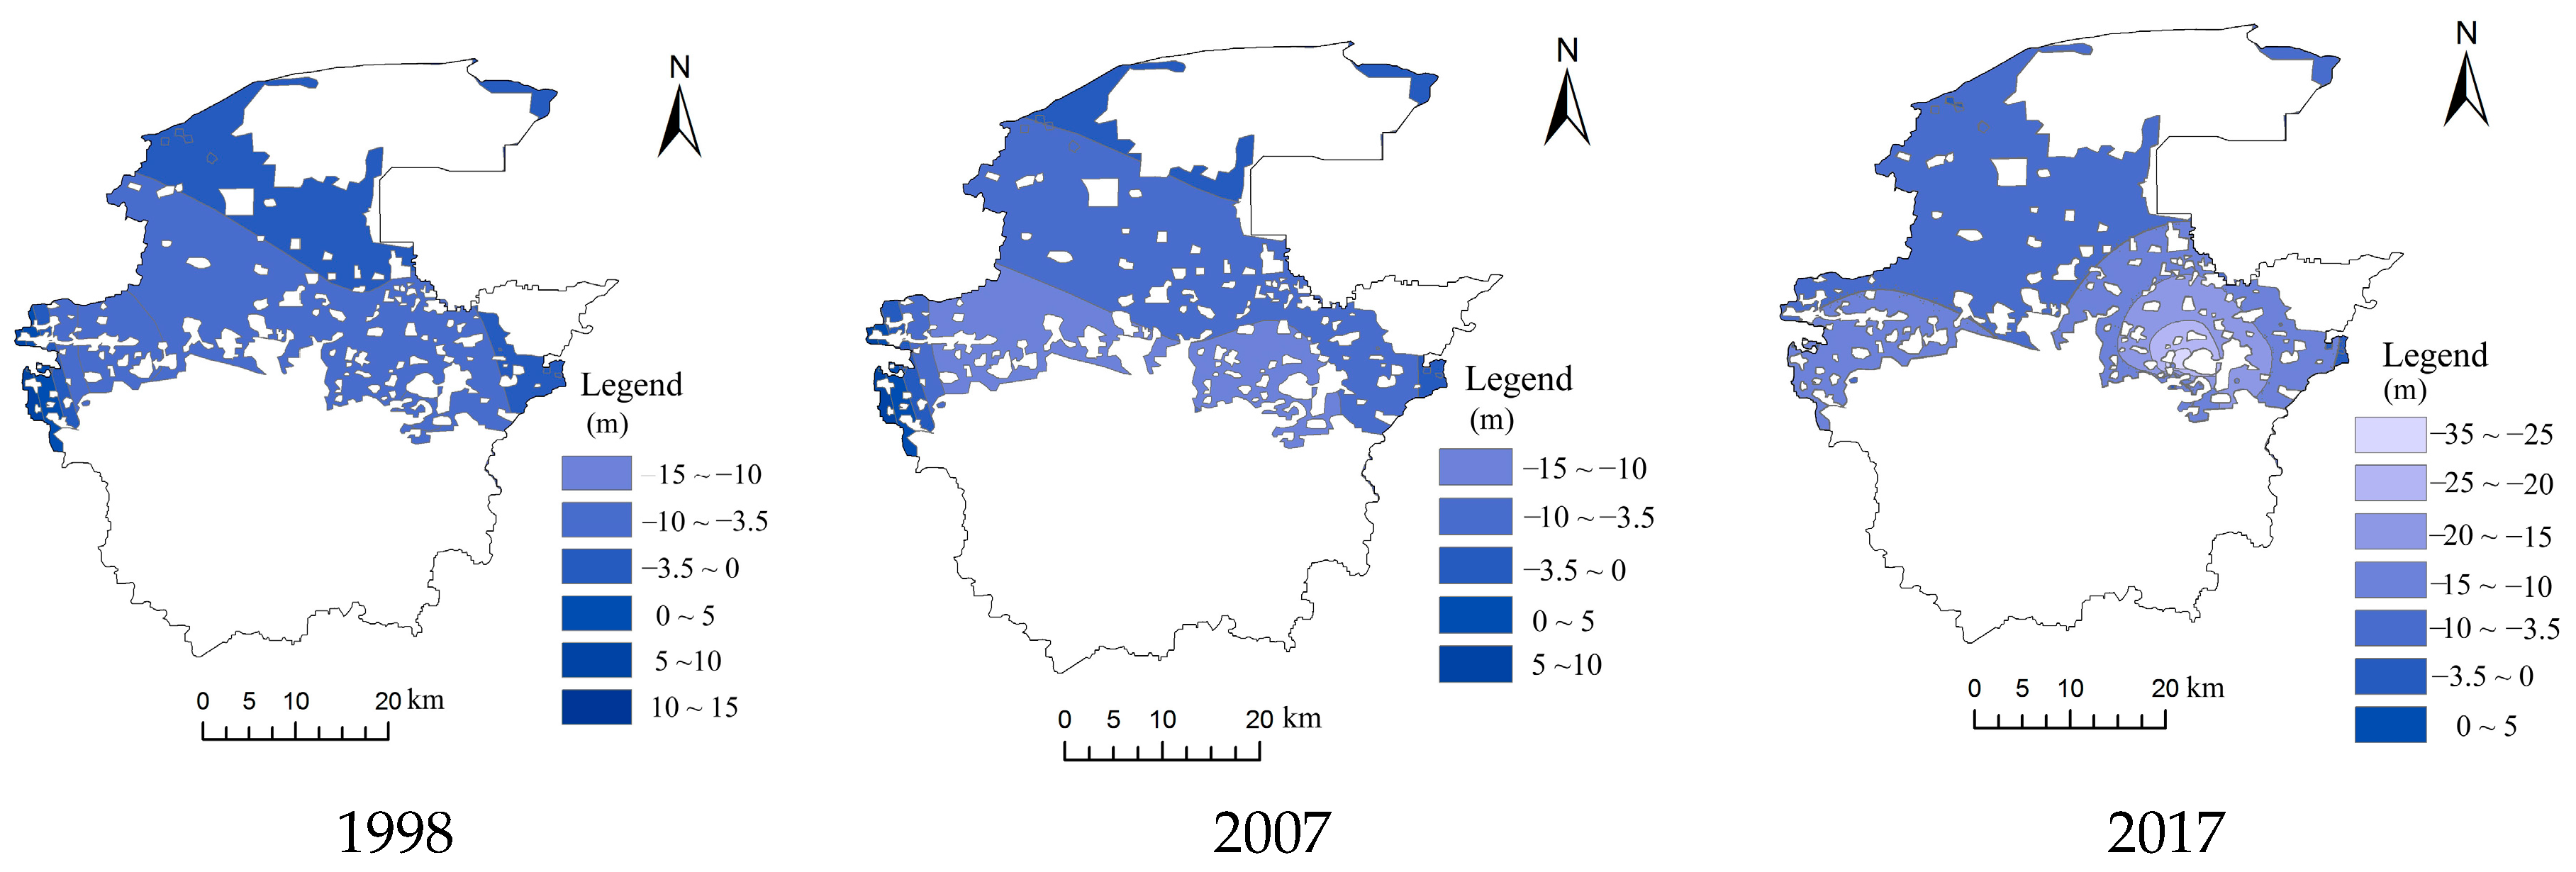
Groundwater data were obtained from measured data of 14 observation points in the study area by wells (available in 1998, 2007, and April 2017). To evaluate the evolution mechanism of surface soil salinization in the area from 1998 to 2017, the distribution map of groundwater level (Figure 7) was obtained from the Natural Neighbor of spatial interpolation analysis based on the data of sampling points.
Before the 1970s, the groundwater in this area flowed northward into the sea [16]. After the 1980s, Shouguang City established the largest vegetable production base in the north of China. Hence, the exploitation of groundwater increased sharply. From Figure 7, we can see that the underground water level in the study area was lower as a whole at the end of the 20th century. The southwest corner of the study area was only place with the ground water level above sea level, while the ground water level of the rest of the area was below sea level. The spatial distribution is characterized by low south and high north, and the groundwater level gradually increases from the south to the north, but both are lower than the sea level. From 1998 to 2007, the groundwater level in the northern coastal area was within the range of −3.5 to 0 m; however, it dropped to the range of −10 to 0 m in 2017.
3.4. Formation and Evolution Mechanism of Soil Salinization
3.4.1. Formation Mechanism of Soil Salinization
To study the relationship between the groundwater level and the degree of soil salinization, we superimposed the spatial distribution map of the groundwater level of this area with the spatial distribution map of soil salinization. In such a way, we obtained the distribution area of various saline soils within different groundwater levels in the study area in 2017 (Table 7). Table 7 and Figure 7 show that the eastern corner with a high groundwater level is dominated by non-saline soil and mildly saline soil, with a small total area. The areas with very low ground water level (−35 m–−15 m) are dominated by non-saline soil and mild saline soil, which account for more than 12.044% of the total area. The proportion of moderately salinized soil in areas with low ground water level (−15 m–0 m) gradually increased in this order: 7.162% (−15 m–−3.5 m) and 29.186% (−3.5 m–0 m). In this region, the proportion of mildly salinized soil remained high, while non-salinized soil showed a decreasing trend, from about 10% to 6%. Although the area coverages of severely salinized soil and solonchak are small, the proportions of these two types of soil in different groundwater level regions also have obvious characteristics. Severely salinized soils and solonchaks are mainly distributed in areas with groundwater level ranging from −3.5 m to 0 m.
In general, the groundwater level in the study area is lower than the sea level, and only one corner in the east is higher than the sea level (see Figure 7). With the increase of latitude, the ground water level gradually increases from the south to the north in Shouguang. The southeast part of the study area has the lowest ground water level, and its surface soil was primarily non-salinized soil. Extending towards the northern part of the study area (near the Bohai Bay region), the ground water level begins to rise (but is still lower than the sea level), the surface soil salinity also gradually increases, turning into mildly saline soil and moderately saline soil.
According to the contrast of distribution of ground water level with salinization in Shouguang, it can be seen that the formation of salinization is constrained by the ground water level in this area. The evaporation and concentration of groundwater is strong in the area with ground water depth less than 3.5 m, and the soil collects salt. Due to water pumping for irrigation, the ground water level would drop to form a depression funnel, causing seawater intrusion and the increase of salinity in the groundwater resource and hence the eventual soil salinization. In this sense, human activity is the main driver of soil salinization, and the salinization is characterized by secondary salinization in this area.
3.4.2. Evolution of Severely Saline Soil
The area coverage of severely saline soil increased obviously from 1998 to 2017. By overlaying the spatial distribution map of groundwater level and salinization map of soil, we estimated the distribution area of various saline soils within different groundwater levels in the study area in 1998 (Table 8). We compared them with the data in 2017 (Table 7) to understand the evolution mechanism of severely saline soil.
From both Table 7 and Table 8, the severe salinized soil was mainly distributed within the range of the ground water level of −3.5 to 0 m. From 1998 to 2017, the area of the study area with the ground water level of −3.5 to 0 m expanded from 204.9702 km2 to 381.1904 km2, while the percentage of the severe salinized soil also increased from 0.570% to 1.641%.
In terms of the geographical location of the evolution of soil salinization, the soil salinization has aggravated in the northeastern of Shouguang. The main reason is that its groundwater level was relatively low, which allowed the invasion of seawater and worsened the soil salinization.
Under natural conditions, groundwater would move from the south to the north by gravity, with freshwater being discharged into the sea, and there would be no severe salinization along the coast. However, in recent decades, Shouguang has vigorously developed vegetable production bases and mined a huge amount of the ground water resource for irrigation. This resulted in a decrease in the ground water level and the change in the direction of regional groundwater flow. After the vegetable production bases were built, the groundwater funnel was formed because of excessive extraction of groundwater resource, the flow direction of groundwater has changed. Eventually, the seawater intruded on the northern coast, causing the groundwater resource to turn salty and it could not be utilized. With the long-term evaporation, the concentration of soil salt increased and hence intensified soil salinization in the northern part of the study area.
3.4.3. Evolution of Mildly Saline Soils
The southern part of the study area is dominated by mildly salinized soil, and the degree of salinization of the soil improved from 1998 to 2017 (i.e., from moderately salinized soil to mildly salinized soil and non-salinized soil). During the period 1998 to 2017, the lowest groundwater level decreased from −15 to −10 m (in 1998) to −35 to −25 m (in 2017). This reflects that the fact that groundwater exploitation by the vegetable production bases in this region has a profound effect on the declining groundwater water level. However, with the long-term leaching effect of precipitation, the salinity of the groundwater has dropped, and hence soil salinization has reduced.
4. Conclusions
This paper applied the GF-1 remote sensing images to establish NDVI-SI feature space to extract soil salinization information of Shouguang. The following conclusions are drawn:
(1) The method of NDVI-SI feature space is applicable to the inversion of soil salinization information of the GF-1 PMS images with high spatial resolution, which enables the full utilization of the spatial information contained in the image. Relative to the traditional medium-spatial resolution image, the GF-1 PMS image has a higher resolution and is significantly superior in presenting the details of spatial information. As such, the high-resolution image offers more accurate information about soil salinization.
(2) The total area of saline soil decreased from 1998 (681.323 km2) to 2017 (526.532 km2) with a reduction rate of 22.719%. There was a significant drop in the moderately salinized soil area from 474.938 km2 to 256.613 km2 in the past 20 years (a reduction rate of 45.969%), whereas the area of mildly salinized soil increased slightly to 258.210 km2. While the area of severely salinized soil and solonchak was smaller in the study area, it gradually increased.
(3) The distribution of soil salinization in Shouguang presented obvious characteristics of strip distribution. The change of soil salinization from the south to the north followed the order of: non-salinization, mild salinization, moderate salinization, severe salinization, salinized soil. In particular, the most serious areas of salinization were mostly distributed around the coastline. From 1998 to 2017, the coastal area of severe soil salinization has increased, while the inland area of mild soil salinization has also expanded.
(4) Soil salinization has occurred as secondary salinization in the study area. It was mainly caused by seawater intrusion due to excessive exploitation of groundwater resource. To slow down the degree of soil salinization locally, it is necessary to control the amount of groundwater extraction and optimize the distribution of its exploitation.
Author Contributions
F.D. and Y.T. conceived and designed the experiments; Y.T. performed the experiments and processed images; X.X. investigated the soil; Z.L. and L.X. analyzed the data; F.D., Y.T. And L.X. wrote the paper.
Funding
This research is supported by Ph.D. Programs Foundation of University of Jinan (XBS1816, XBS1817, XBS1818), the National Natural Science Foundation of China (41772257, 41472216).
Acknowledgments
Data comes from China High-resolution Earth Observation System Shandong Center of Data and Application.
Conflicts of Interest
The authors declare no conflict of interest. The founding sponsors had no role in the design of the study; in the collection, analyses, or interpretation of data; in the writing of the manuscript, and in the decision to publish the results.
References
- Li, J.; Pu, L.; Zhu, M.; Zhang, R. The Present situation and hot issues in the salt-affected soil research. Acta Geogr. Sin. 2012, 67, 1233–1245. [Google Scholar]
- Wang, J.; Huang, X.; Zhong, T.; Chen, Z. Review on Sustainable Utilization of Salt-affected Land. Acta Geogr. Sin. 2011, 66, 673–684. [Google Scholar]
- Kag, Q.; Yu, R.; Zhan, Z.; Zhao, X. Advances in Study on Remote Sensing Application of Soil Salinization. Remote Sens. Technol. Appl. 2005, 20, 447–454. [Google Scholar]
- Metternicht, G.I. Remote sensing of soil salinity-potentials and constraints. Remote Sens. Environ. 2003, 85, 1–20. [Google Scholar] [CrossRef]
- Wang, F.; Ding, J.; Wu, M. Remote sensing monitoring models of soil salinization based on NDVI-SI feature space. Trans. Csae 2010, 26, 168–173. [Google Scholar]
- Chen, S.; Xu, B.; Jin, Y.; Huang, Y.; Zhang, W.; Guo, J.; Shen, G.; Yang, X. Remote Sensing Monitoring and Spatial-temporal Characteristics Analysis of Soil Salinization in Agricultural Area of Northern Xinjiang. Acta Geogr. Sin. 2015, 35, 1607–1615. [Google Scholar]
- Dehaan, R.L.; Taylor, G.R. Field-derived spectra of salinized soils and vegetation as indicators of irrigation-induced soil-salinization. Remote Sens. Environ. 2002, 80, 406–417. [Google Scholar] [CrossRef]
- Dwivedi, R.S.; Rso, B.R.M. The selection of the best possible Landsat TM band combination for delineating salt-affected soils. Int. J. Remote Sens. 1992, 13, 2051–2058. [Google Scholar] [CrossRef]
- Metternicht, G.I.; Categorical, F. A comparison between crisp and fuzzy class boundary modelling for mapping salt-affected soils using Landsat TM data and a classification based on anion ratios. Ecol. Model. 2003, 168, 371–389. [Google Scholar] [CrossRef]
- Masoud, A.; Koike, K. Arid land salinization detected by remotely-sensed landcover changes: A case study in the Siwa region, NW Egypt. J. Arid Environ. 2006, 66, 151–167. [Google Scholar] [CrossRef]
- Bouaziz, M.; Matschullat, J.; Gloaguen, R. Improved remote sensing detection of soil salinity from a semi-arid climate in northeast Brazil. C R Geosci. 2011, 343, 795–803. [Google Scholar] [CrossRef]
- Pijanowski, B.C.; Brown, D.; Shellito, B.A.; Manik, G.A. Using neural networks and GIS to forecast land use changes: A land transformation model. Comput. Environ. Urban Syst. 2002, 26, 553–575. [Google Scholar] [CrossRef]
- Jiang, H.N.; Ding, J.L.; Tashpolat, T. Extraction of salinized soil information in arid area based on ETM+ data. Acta Pedol. Sin. 2008, 45, 222–228. [Google Scholar]
- Mulder, V.L.; Bruin, S.D.; Schaepman, M.E.; Mayr, T.R. The use of remote sensing in soil and terrain mapping: A review. Geoderma 2011, 162, 1–19. [Google Scholar] [CrossRef]
- Rao, B.R.M.; Dwivedi, R.S.; Venkataratnam, L.; Ravishankar, T.; Thammappa, S.S.; Bhargawa, G.P.; Singh, A.N. Mapping the magnitude of sodicity in part of the Indo-Gangetic plains of Uttar Pradesh, Northern India using Landsat—TM data. Int. J. Remote Sens. 1991, 12, 419–425. [Google Scholar] [CrossRef]
- Shamsi, S.R.F.; Zare, S.; Abtahi, S.A. Soil salinity characteristics using moderate resolution imaging spectroradiometer (MODIS) images and statistical analysis. Arch. Agron. Soil Sci. 2013, 59, 471–489. [Google Scholar] [CrossRef]
- Chen, W. Study on Groundwater Table Control and Management in Representation Areas of China; China University of Geosciences: Beijing, China, 2010. [Google Scholar]
- Li, J.; Wei, Z. Study on seawater intrusion and soil salinization in Laizhou Bay. J. Anhui Agric. Sci. 2010, 38, 4187–4189. [Google Scholar]
- Tian, G.; Leng, F.; Zhang, R.; Ma, X. Experimental study of corrosion regularity and mechanism of concrete in alkaline soil. Equip. Environ.Eng. 2007, 4, 10–14. [Google Scholar]
- Niu, Z.; Ding, J.; Li, Y.; Wang, S.; Wang, L.; Ma, C. Soil salinization information extraction method based on GF-1 image. Arid Land Geogr. 2016, 39, 171–181. [Google Scholar]
- Chen, G. Mechanisms Underlying of Seawater Intrusion and Evaluation of Early Warning Systems in the Laizhou Bay Area; East China Normal University: Shanghai, China, 2013. [Google Scholar]
- Shen, Q. Current situation of groundwater overexploitation in Shouguang city and its prevention and control measures. Hydrol. Water Resour. 2016, 2, 57–58. [Google Scholar]
- National Aeronautics and Space Administration (NASA). Available online: http://glovis.usgs.gov (accessed on 17 February 2019).
- Ha, X.; Ding, J.; Tashpolat, T.; Luo, J.; Zhang, F. Si-albedo space-based extraction of salinization information in arid area. Acta Pedolocica Sin. 2009, 46, 382–385. [Google Scholar]
- Khan, N.M.; Sato, Y. Monitoring hydro-salinity status and its impact in irrigated semi-arid areas using IRS-1B LISS-II data. Asian J. Geoinform. 2001, 1, 63–73. [Google Scholar]
- Wang, H.; Li, H.; Dong, Z.; Chen, X.; Shao, S. Salinization characterstics of affordested coastal saline soil as affected by species of trees used in afforestation. Acta Pedol. Sin. 2015, 52, 706–712. [Google Scholar]
Figure 1.
The sketch map of the sample point in Shouguang.

Figure 2.
Analysis of correlation between Salinization monitoring index (SDI) of Pan and Multi-spectra Sensor (PMS) image and measured salt content.
Figure 2.
Analysis of correlation between Salinization monitoring index (SDI) of Pan and Multi-spectra Sensor (PMS) image and measured salt content.

Figure 3.
Analysis of correlation between SDI of Operational Land Imager (OLI) image and measured salt content.
Figure 3.
Analysis of correlation between SDI of Operational Land Imager (OLI) image and measured salt content.

Figure 4.
SDI and Retrieval of Soil Salt Content from PMS Images in Northern Shouguang in 2017. (a) SDI; (b) SALT.
Figure 4.
SDI and Retrieval of Soil Salt Content from PMS Images in Northern Shouguang in 2017. (a) SDI; (b) SALT.

Figure 5.
Soil Salinization Distribution of PMS Image in Northern Shouguang in 2017.

Figure 6.
Soil Salinization Distribution of OLI Image in Northern Shouguang in 1998 and 2007.

Figure 7.
Groundwater level distribution in northern Shouguang in 1998, 2007, and 2017.


Table 1.
Remote sensing data source.
| Satellite Type | Sensor | Date Acquired | Spatial Resolution/m |
|---|---|---|---|
| GF-1 | PMS | 28 May 2017 | 8(XS)/2(P) |
| LANDSAT | OLI | 25 May 2017 | 30 |
| TM | 14 May 2007 | 30 | |
| TM | 3 April 1998 | 30 |
Table 2.
Salinization monitoring index (SDI) and soil saltcontents.
| Sample | SDI (PMS) | SDI (OLI) | Salinity (g/kg) | Sample | SDI (PMS) | SDI (OLI) | Salinity (g/kg) |
|---|---|---|---|---|---|---|---|
| 1 | 0.6325 | 0.279455 | 10.8 | 41 | 0.6069 | 0.4950921 | 17.4 |
| 2 | 0.5686 | 0.299731 | 12 | 42 | 0.4088 | 0.138425 | 6.5 |
| 3 | 0.4311 | 0.179735 | 7.8 | 43 | 0.5141 | 0.398918 | 11.6 |
| 4 | 0.5611 | 0.195987 | 10.4 | 44 | 0.2495 | 0.145396 | 1.6 |
| 5 | 0.3106 | 0.170675 | 5.3 | 45 | 0.686259 | 0.627247 | 31.4 |
| 6 | 0.3143 | 0.158997 | 4.4 | 46 | 0.6006 | 0.617489 | 22.1 |
| 7 | 0.2749 | 0.081287 | 2.5 | 47 | 0.689039 | 0.783087 | 21.5 |
| 8 | 0.5798 | 0.827496 | 14 | 48 | 0.610816 | 0.717553 | 30.4 |
| 9 | 0.4573 | 0.811291 | 9.7 | 49 | 0.7646 | 0.782247 | 39.1 |
| 10 | 0.533 | 0.611329 | 10.3 | 50 | 0.599944 | 0.648024 | 24.5 |
| 11 | 0.6608 | 0.86299 | 20.8 | 51 | 0.577438 | 0.611329 | 28.4 |
| 12 | 0.398 | 0.183087 | 7 | 52 | 0.649004 | 0.747951 | 15 |
| 13 | 0.2285 | 0.205347 | 1.9 | 53 | 0.577753 | 0.50918 | 21 |
| 14 | 0.3654 | 0.016229 | 6.9 | 54 | 0.6446 | 0.603079 | 21.9 |
| 15 | 0.376522 | 0.097951 | 7.3 | 55 | 0.6075 | 0.469875 | 15.8 |
| 16 | 0.5023 | 0.643916 | 13.3 | 56 | 0.6626 | 0.601224 | 22.3 |
| 17 | 0.3145 | 0.047819 | 4.4 | 57 | 0.3329 | 0.109587 | 5.9 |
| 18 | 0.3287 | 0.10918 | 5.8 | 58 | 0.6495 | 0.698024 | 29.6 |
| 19 | 0.4706 | 0.117553 | 8.4 | 59 | 0.6705 | 0.701424 | 27.1 |
| 20 | 0.5112 | 0.659938 | 13.9 | 60 | 0.7121 | 0.723474 | 29.3 |
| 21 | 0.5327 | 0.640152 | 10.3 | 61 | 0.6337 | 0.704524 | 29.8 |
| 22 | 0.4648 | 0.016229 | 4.1 | 62 | 0.5588 | 0.450991 | 13.1 |
| 23 | 0.3326 | 0.070044 | 3.4 | 63 | 0.6468 | 0.646724 | 23.2 |
| 24 | 0.3932 | 0.095724 | 3.9 | 64 | 0.6025 | 0.658024 | 24.9 |
| 25 | 0.3517 | 0.073011 | 2.4 | 65 | 0.658403 | 0.695724 | 32.2 |
| 26 | 0.307 | 0.079987 | 2.3 | 66 | 0.7153 | 0.634547 | 33.5 |
| 27 | 0.2325 | 0.085515 | 0.9 | 67 | 0.614553 | 0.46299 | 24.2 |
| 28 | 0.6857 | 0.801287 | 20.6 | 68 | 0.7341 | 0.699047 | 38.3 |
| 29 | 0.371136 | 0.189677 | 4.7 | 69 | 0.679682 | 0.616229 | 30.7 |
| 30 | 0.555 | 0.179735 | 10.9 | 70 | 0.672789 | 0.616229 | 33.8 |
| 31 | 0.6936 | 0.592917 | 17.8 | 71 | 0.4412 | 0.085515 | 4.9 |
| 32 | 0.4134 | 0.145961 | 1.8 | 72 | 0.6565 | 0.870044 | 25.7 |
| 33 | 0.3325 | 0.048024 | 2.3 | 73 | 0.4162 | 0.1899769 | 9.8 |
| 34 | 0.2974 | 0.145396 | 3.6 | 74 | 0.4665 | 0.599937 | 18.9 |
| 35 | 0.294717 | 0.127247 | 1.1 | 75 | 0.772 | 0.727247 | 39.7 |
| 36 | 0.5021 | 0.550973 | 16.9 | 76 | 0.708 | 0.690564 | 26.4 |
| 37 | 0.2724 | 0.164396 | 1.8 | 77 | 0.5938 | 0.599493 | 19.9 |
| 38 | 0.4909 | 0.200735 | 9.9 | 78 | 0.5618 | 0.659905 | 19.5 |
| 39 | 0.2902 | 0.165396 | 1.6 | 79 | 0.73 | 0.697247 | 37.7 |
| 40 | 0.3122 | 0.080515 | 4.3 | 80 | 0.7184 | 0.690347 | 37.4 |
Table 3.
Measured and predicted soil salt content.
| Point Number | Measured Salinity (g/kg) | Predicted Salinity (g/kg) | Point Number | Measured Salinity (g/kg) | Predicted Salinity (g/kg) |
|---|---|---|---|---|---|
| 1 | 29.84 | 26.74 | 11 | 16.15 | 14.81 |
| 2 | 18.55 | 17.00 | 12 | 35.54 | 32.74 |
| 3 | 33.64 | 31.11 | 13 | 29.04 | 24.65 |
| 4 | 18.65 | 19.72 | 14 | 12.24 | 10.18 |
| 5 | 14.54 | 13.60 | 15 | 8.56 | 9.05 |
| 6 | 27.54 | 23.79 | 16 | 27.24 | 29.94 |
| 7 | 24.94 | 24.55 | 17 | 19.78 | 18.12 |
| 8 | 34.84 | 34.99 | 18 | 13.84 | 11.40 |
| 9 | 30.54 | 33.50 | 19 | 34.64 | 37.75 |
| 10 | 34.84 | 32.73 | 20 | 7.34 | 7.29 |
Table 4.
Salinization classification standard.
| SDI | Non-Salinization | Mild Salinization | Moderate Salinization | Severe Salinization | Solonchak |
|---|---|---|---|---|---|
| SDI (PMS) | ≤0.3 | 0.3–0.5 | 0.5–0.8 | 0.8–1.2 | ≥1.2 |
| SDI (OLI) | ≤0.2 | 0.2–0.4 | 0.4–0.8 | 0.8–1.6 | ≥1.6 |
Table 5.
Statistics of Salinized Soil in Shouguang City.
| Degree of Soil Salinity | Non-Salinization | Mild Salinization | Moderate Salinization | Severe Salinization | Solonchak |
|---|---|---|---|---|---|
| Acreage (km2) | 155.336 | 258.210 | 256.613 | 11.195 | 0.514 |
Table 6.
Statistics of Saline Soil Area in Shouguang from 1998 to 2017.
| Year | Non-Salinization (km2) | Mild Salinization (km2) | Moderate Salinization (km2) | Severe Salinization (km2) | Solonchak (km2) |
|---|---|---|---|---|---|
| 1998 | 0.544 | 201.453 | 474.938 | 4.932 | 0 |
| 2007 | 65.748 | 189.739 | 424.726 | 1.701 | 0 |
| 2017 | 155.336 | 258.210 | 256.613 | 11.195 | 0.514 |
Table 7.
Statistical Table of Groundwater Level and Salinized Soil in 2017.
| Groundwater Level (m) | Non-Salinization (%) | Mild Salinization (%) | Moderate Salinization (%) | Severe Salinization (%) | Solonchak (%) |
|---|---|---|---|---|---|
| −35–−25 | 0.171 | 0.130 | 0.033 | 0.000* | 0.000* |
| −25–−20 | 1.539 | 1.075 | 0.244 | 0.000* | 0.000* |
| −20–−15 | 4.592 | 4.537 | 1.008 | 0.000* | 0.000* |
| −15–−10 | 9.920 | 12.583 | 6.783 | 0.000* | 0.000* |
| −10–−3.5 | 0.357 | 0.603 | 0.379 | 0.000* | 0.000* |
| −3.5–0 | 6.068 | 18.934 | 29.186 | 1.641 | 0.075 |
| 0–5 | 0.135 | 0.005 | 0.000* | 0.000* | 0.000* |
Note: %: a percentage of the total area for each salinization category; *: value less than 0.001%.
Table 8.
Statistical Table of Groundwater Level and Salinized Soil in 1998.
| Groundwater Level (m) | Non-Salinization (%) | Mild Salinization (%) | Moderate Salinization (%) | Severe Salinization (%) |
|---|---|---|---|---|
| −15–−10 | 0.000* | 3.527 | 8.839 | 0.002 |
| −10–−3.5 | 0.074 | 19.060 | 35.132 | 0.151 |
| −3.5–0 | 0.004 | 5.023 | 24.463 | 0.570 |
| 0–5 | 0 | 1.340 | 0.956 | 0 |
| 5–10 | 0.001 | 0.569 | 0.214 | 0 |
| 10–15 | 0.001 | 0.026 | 0.048 | 0 |
Note: %: a percentage of the total area for each salinization category; *: value less than 0.001%.
© 2019 by the authors. Licensee MDPI, Basel, Switzerland. This article is an open access article distributed under the terms and conditions of the Creative Commons Attribution (CC BY) license (http://creativecommons.org/licenses/by/4.0/).
Share and Cite
MDPI and ACS Style
Dong, F.; Tang, Y.; Xing, X.; Liu, Z.; Xing, L. Formation and Evolution of Soil Salinization in Shouguang City Based on PMS and OLI/TM Sensors. Water 2019, 11, 345. https://doi.org/10.3390/w11020345
AMA Style
Dong F, Tang Y, Xing X, Liu Z, Xing L. Formation and Evolution of Soil Salinization in Shouguang City Based on PMS and OLI/TM Sensors. Water. 2019; 11(2):345. https://doi.org/10.3390/w11020345
Chicago/Turabian StyleDong, Fang, Yongjie Tang, Xuerui Xing, Zhanhong Liu, and Liting Xing. 2019. "Formation and Evolution of Soil Salinization in Shouguang City Based on PMS and OLI/TM Sensors" Water 11, no. 2: 345. https://doi.org/10.3390/w11020345
Note that from the first issue of 2016, this journal uses article numbers instead of page numbers. See further details here.