Article

Analysis of a Hybrid Suspended-Supported Photocatalytic Reactor for the Treatment of Wastewater Containing Benzothiazole and Aniline

by
Cristian Ferreiro
1,*,
Natalia Villota
2,
José Ignacio Lombraña
1,
María J. Rivero
3,
Verónica Zúñiga
4 and
José Miguel Rituerto
4
1
Department of Chemical Engineering, University of the Basque Country UPV/EHU, P.O. Box 644, E-48080 Bilbao, Spain
2
Department of Environmental and Chemical Engineering, Escuela Universitaria de Ingeniería Vitoria-Gasteiz, University of the Basque Country UPV/EHU, Nieves Cano, 12. 01006 Alava, Spain
3
Department of Chemical and Biomolecular Engineering, University of Cantabria, 39005 Santander, Spain
4
General Química, S.A.U. (Grupo Dynasol), 01213 Lantaron, Spain
*
Author to whom correspondence should be addressed.
Water 2019, 11(2), 337; https://doi.org/10.3390/w11020337
Submission received: 24 January 2019 / Revised: 12 February 2019 / Accepted: 13 February 2019 / Published: 16 February 2019
(This article belongs to the Special Issue Advanced Oxidation Technologies in Industrial Wastewater Treatment)

Abstract

:
In this work, a study of the main operating variables affecting TiO2/UV photocatalysis was carried out. The treatment of an industrial effluent containing aniline and benzothiazole from the manufacture of accelerants for vulcanization was performed in a TiO2-supported commercial photoreactor. The degradation of both contaminants was monitored by GC-MS analysis. The proposed experiments were able to properly identify the phenomenon of adsorption, as well as to improve the performance of the commercial photoreactor by adding small amounts of TiO2 in suspension. The removal performance, durability of the photocatalytic material, and energy costs were analysed. The results showed that the use of suspensions intensifies the degradation obtaining an improvement of 23.15% with respect to the use of the supported catalyst. For an aniline and benzothiazole solution, the best operating conditions were found at pH = 12.0, introducing 60.0 mg L−1 of suspended TiO2 together with the existing supported catalyst.

1. Introduction

The industrial scale of many production processes has generated increasing amounts of waste by-products that have been dumped into the environment assuming that nature itself would absorb them properly. However, many of these compounds such as aniline (ANI) and benzothiazole (BT) have been shown to affect the health of live organisms [1]. These pollutants are typical of effluents from industries related to the manufacture of dyes for textiles, accelerators for vulcanization, oil refining, biocides, paper and leather manufacturing, anticorrosive agents in antifreeze formulations, and photosensitizers in photography [2,3].
Aniline and benzothiazole are two pollutants of concern due to their effects on the environment and human health [4,5]. These chemicals are highly soluble in water, resistant to biodegradation and have toxic effects [6]. In addition, together with the scarcity of information about the toxicity of BT, which is known to cause acute toxicity in the aquatic environment, the US Environmental Protection Agency has included it in the Contaminant Candidate List 4 (CCL4) [7]. Only in the USA BT’s production was around 450 t in 2016 [4,8]. Many of these pollutants cannot be completely eliminated by conventional water treatment processes and consequently BT has been detected in drinking water distribution networks that reach household taps [9]. Moreover, a study has been published showing genotoxicity and growth inhibition caused by aniline in wheat crops. The low biodegradability, stable chemical structure, and toxicity of this type of organic compounds prevent their removal in a biological treatment [6].
The degradation of these non-biodegradable organic pollutants could be satisfactorily achieved using advanced oxidation processes (AOPs). These processes could remove these contaminants completely or make them less harmful to human health and the aquatic environment [10].
TiO2/UV photocatalysis can be an alternative to conventional processes or other AOPs with low oxidation rates and high operating costs to treat recalcitrant and non-biodegradable contaminants [11]. This technology is proposed due to its low cost, operating temperature and atmospheric pressure, so it does not require complex installations. Among the most commonly used photoactive materials, TiO2 stands out due to its high activity under UV radiation. Oxidation reactions take place near the catalytic surface of the semiconductor. The electrons of the valence band under UV light move to the conduction band generating a hollow electron pair. These electrons in contact with air reduce O2 by forming superoxide ions. On the other hand, the generated holes oxidize the adsorbed water generating hydroxyl radicals (HO) on the TiO2 surface. Next, these generated radical species will be in charge of oxidizing the organic compounds present in the aqueous reaction medium to produce CO2 [2,12]. The extent of the degradation can be conditioned by the adsorption of the organic compounds [13,14,15].
Although photocatalysis in suspension is becoming important within AOPs, the recovery of the catalyst has been always a challenge to its commercial implementation [2,16,17]. The immobilization of the catalyst on a support could overcome this limitation [12,16,18,19,20,21,22]. For example, in Kecskmét (Hungary) the Mercedes-Benz factory installed in 2016 a TiO2-supported photocatalytic h2o.TITANIUM® equipment to treat the flush water of the factory for chemical-free purposes [23]. Many studies indicate that TiO2 can be supported on several materials such as pebbles, glass spheres, silica gel beads, or cellulose. However, the simultaneous use of the catalyst supported on the wall of a photoreactor as well as suspended has not been studied yet. This would be a way of improving the performance of a commercial reactor of supported catalytic configuration.
The present work focuses on the improvement of commercial photoreactors for industrial implementation, which have TiO2 supported to remove aniline and benzothiazole. Therefore, TiO2 suspensions will be introduced to increase the degradation in this hybrid system. The adsorption and degradation of synthetic solutions containing aniline or benzothiazole using TiO2 catalyst under different experimental conditions have been investigated. The adsorption equilibrium and kinetic parameters were estimated from the adsorption experiments. In addition, a kinetic study of the main operating variables of the photocatalytic process has been carried out with synthetic solutions of aniline or benzothiazole, varying the initial pH of the solution, dose of catalyst in suspension, configuration of the TiO2 and the effect of the mixture of both compounds was analysed. Finally, the operating variables that lead to a higher removal percentage without generating difficulties and higher costs in the recovery process of the catalytic particles of TiO2 were selected.

2. Materials and Methods

2.1. Reagents

Aniline (C6H5NH2, Acros Organics, 99.5%), benzothiazole (C7H5NS, Sigma-Aldrich, 97%), hydrogen chloride (HCl, Merck, 37%), sodium hydroxide (NaOH, Panreac, 50%), dichloromethane (CH2Cl2, Merck, >99.9%), and diphenylamine (C12H11N, Merck, 99%). Deionized water was supplied by a Milli-Q water purification unit from Merck. The TiO2 Aeroxide® P25 catalyst was obtained from Evonik Industries.

2.2. Product Analysis

The quantification of each individual compound was determined by an Agilent 6890N gas chromatograph coupled to an Agilent 5975 mass spectrometer. The chromatograph was equipped with a 30.0 cm non-polar phase capillary column. The aqueous samples to be analysed, previously adjusted to pH = 11.0 for the determination of aniline and pH = 3.0 for benzothiazole, are subjected to an extraction with dichloromethane (with 0.1% diphenylamine as internal standard). A sample volume of 0.4 µL is then injected into the GC/MS chromatograph (Agilent, CA, USA) in a program consisting of an initial temperature of 60.0 °C for 2 min and a subsequent heating ramp of 12.0 °C min−1 until 280.0 °C is reached, a temperature that is maintained for 20 min. Other conditions: He is used as carrier gas with a flow rate of 1.0 mL min−1; split ratio, 1:50. pH monitoring was performed with a Knicks 911 pH meter. The degree of mineralization was quantified by Total Organic Carbon TOC analysis in a Shimadzu TOC-VCSH Analyzer (Izasa Scientific, Alcobendas, Spain).

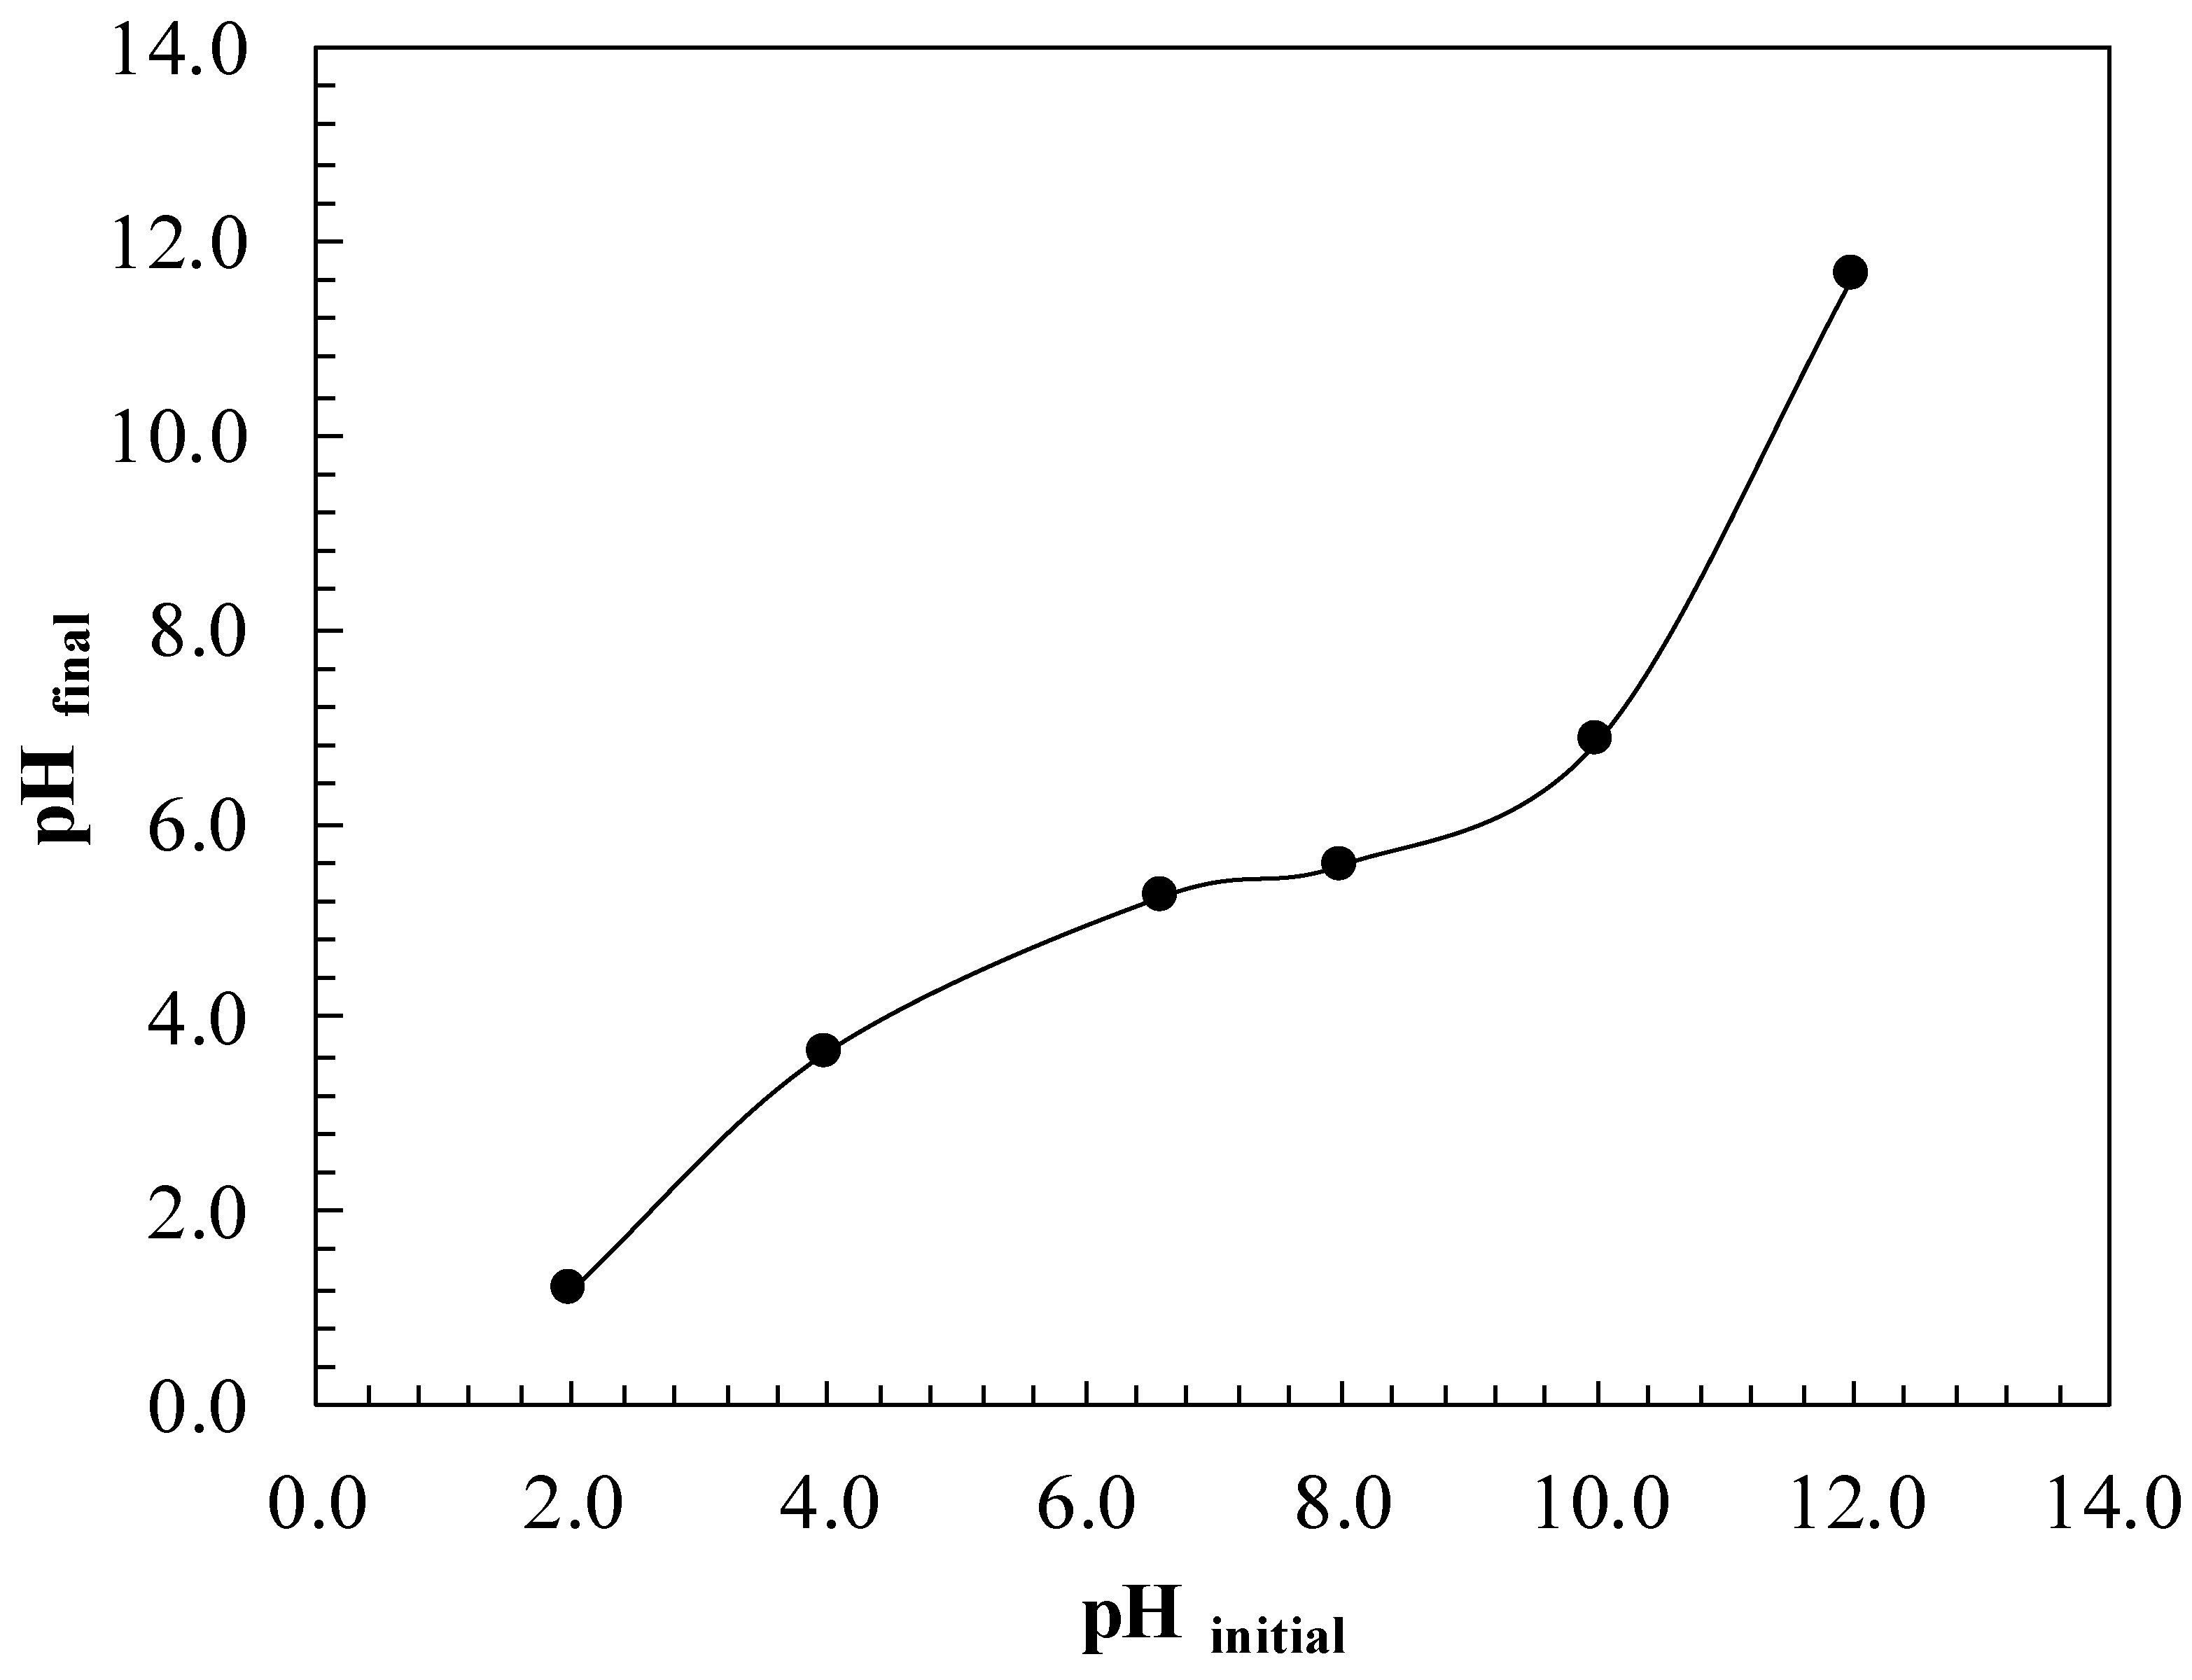
2.3. Determination of pHpzc

The point of zero charge of TiO2 P25 was determined by acid-base titration method according to Silva et al. [24]. For this purpose, 50 mL of 0.01 M NaCl solution was transferred to 100 mL flask. The values of these solutions were adjusted between 2 and 12 using 0.1 M HCl or NaOH. Then, 0.15 g of TiO2 were added to the solution. After a contact time of 24 h, the final pH was measured. The final pH measured were plotted against the initial pH. The point of intersection of the curve result in pHpzc.

2.4. Adsorption Experiments

The adsorption experiments were performed in the dark to obtain equilibrium and kinetic data in the temperature ranged of 10–60 °C, pH of 2.0–12.0 for aniline and benzothiazole. All experiments were carried out at constant temperature and pH. The isotherms were obtained by preparing suspensions in which 500.0 mL solutions of aniline or benzothiazole were dissolved with 0.05 g of TiO2 catalyst powder in 0.5 L jacketed reactor provided with a stirrer. The agitation was maintained constant at 1750 rpm in order to keep perfect mixing. The temperature was controlled by a refrigerating bath. The adsorption equilibrium concentration was reached after the solutions were stirred magnetically for 24 h in the dark. To remove the catalyst particles, the solutions were filtered through a 0.45 μm membrane (MF-Millipore) before proceeding to the analysis of the concentration of each contaminant by GC/MS chromatography. The amount of aniline or benzothiazole adsorbed onto TiO2 at equilibrium, qe (mg g−1), was calculated using the Equation (1):
q e = ( C 0 C e ) V M
where C0 and Ce are the initial and equilibrium aniline or benzothiazole concentration in mg L−1 respectively, V is the volume of the solution (L) and M is the mass of TiO2 (g). Similarly, the amount adsorption of pollutant at time t (min), was calculated by Equation (2):
q t = ( C 0 C t ) V M
where C0 and Ct are the initial at any time aniline or benzothiazole concentration in mg L−1 respectively, V is the volume of the solution (L) and M is the mass of adsorbent (g). All adsorption experiments were performed in triplicate and the mean values were used for the adsorption study. The maximum standard deviation of measured concentrations was no greater than 0.052 mg L−1.

2.5. Photocatalytic Experiments

The removal of aniline and benzothiazole was carried out in a photoreactor unit AOP 1 of h2o.TITANIUM®. The experimental system consists of a tubular reactor, a mercury lamp and its corresponding power supply, a 16.0 L mixing tank and a centrifugal pump (Figure 1).
The reactor consisted of a titanium sintered monobloc with a volume of 2.15 L, length of 473 mm, diameter 76 mm and thickness of 5 mm. The reactor had 2.3 mg TiO2 cm−2 deposited therein on a structural substrate as a coating, as it is described in the patent US 2003/0059549A1 [25]. With regard to the photoreactor arrangement, it was oriented vertically with the entrance orifice of the effluent on the bottom, two orifices on the top and one on the side. The side one was used to insert the probe containing a compact infrared temperature meter, together with a radiometer (PLS Systems AB, Sloga Ingenieros S.L., Puertollano, Spain). The two remaining orifices were used to connect/disconnect the pipe with the water to be treated. The reactor is equipped with a 26 W low-medium pressure mercury UVC lamp (GPH436T5L/4-Eubizz Water, Eubizz Water, Høyanger, Norway) with a maximum emission band at 254 nm enclosed in a quartz casing which provides a minimum dose of 400 J m−2, equivalent to an irradiation intensity of 25.8 W m−2 [26]. The installation has a flowmeter (GPI Electronic Digital Meter, GPImeters.com, NJ, USA) at the reactor inlet and a device (Pool Pump-72512, The Pool Shop, Tauranga, New Zealand) to pump out the effluent with a flow rate of 0.5 m3 h−1, from the homogenization tank to the reactor.
The experiments were carried out at a constant temperature of 25.0 °C to treat 16.0 L of synthetic solutions of aniline or benzothiazole and mixtures of both with initial concentrations of 22.0 mg L−1, maintaining a constant pH and adding TiO2 P25 catalyst between 20.0 and 120.0 mg L−1. The solution was transferred to the mixing tank with the lamp switched off and in darkness to achieve adsorption equilibrium. The natural pH of the synthetic solution of aniline (pH = 6.23), benzothiazole (pH = 5.45) and a mixture of both (pH = 5.92) was adjusted with NaOH at 50% or HCl at 33% according to the experiment and was kept constant throughout the experiment. The pump and agitator were switched on at 1750 rpm. After 1 h, the adsorption equilibrium was reached. Then, the UV light source was switched on. The reactive mixture was irradiated for 22 h. The samples collected for monitoring the evolution of the photocatalytic reaction were filtered with a 0.45 µm (MF-Millipore) membrane (Merck KGaA, Darmstadt, Germany) for further analysis.

3. Results and Discussion

3.1. Characterization of TiO2 P25

The efficiency of the catalyst to remove pollutants and adsorptive properties could be affected by its point of zero charge (PZC). When the surface of the catalyst is positively charged (pH < pHpzc), interactions with anionic pollutants can be favoured (Equation (3)), whereas when it is negatively charged (pH > pHpzc), interactions with cationic pollutants would be promoted (Equation (4)) [27].
pH < pH pzc      TiOH + H + TiOH 2 +
pH > pH pzc      TiOH + OH TiO + H 2 O
The experimental curve obtained by the drift method for TiO2 P25 shown in Figure 2. The point of zero charge, pHpzc, of TiO2 P25 was 3.5. The calculated value differs from the typical value of 6.5 based on two reasons. The first one is that the proportion of the existing groups on the TiO2 surface (singly coordinated Ti3O0, doubly coordinated Ti2O2/3−, and triply coordinated TiO4/3−) with varying pK constants are capable of modifying the pH of the isoelectric point. Secondly, the increase in the size of the agglomerates is able to displace the zero point charged to lower pH values [28,29].
Another important physical property of the catalyst is the surface area (S). It can be calculated from Equation (5) [30,31] from adsorption data.
S = q m a x C S A N A
where qmax is the monolayer adsorption capacity (mg pollutant g−1 TiO2) obtained from Langmuir isotherm model, CSA is the cross-sectional area occupied by aniline molecule (36.6 Å2) [32] and NA is the Avogadro’s number (6.022 × 10²³ mol−1). The specific surface area of TiO2 P25 was found to be 50.03 m2 g−1.

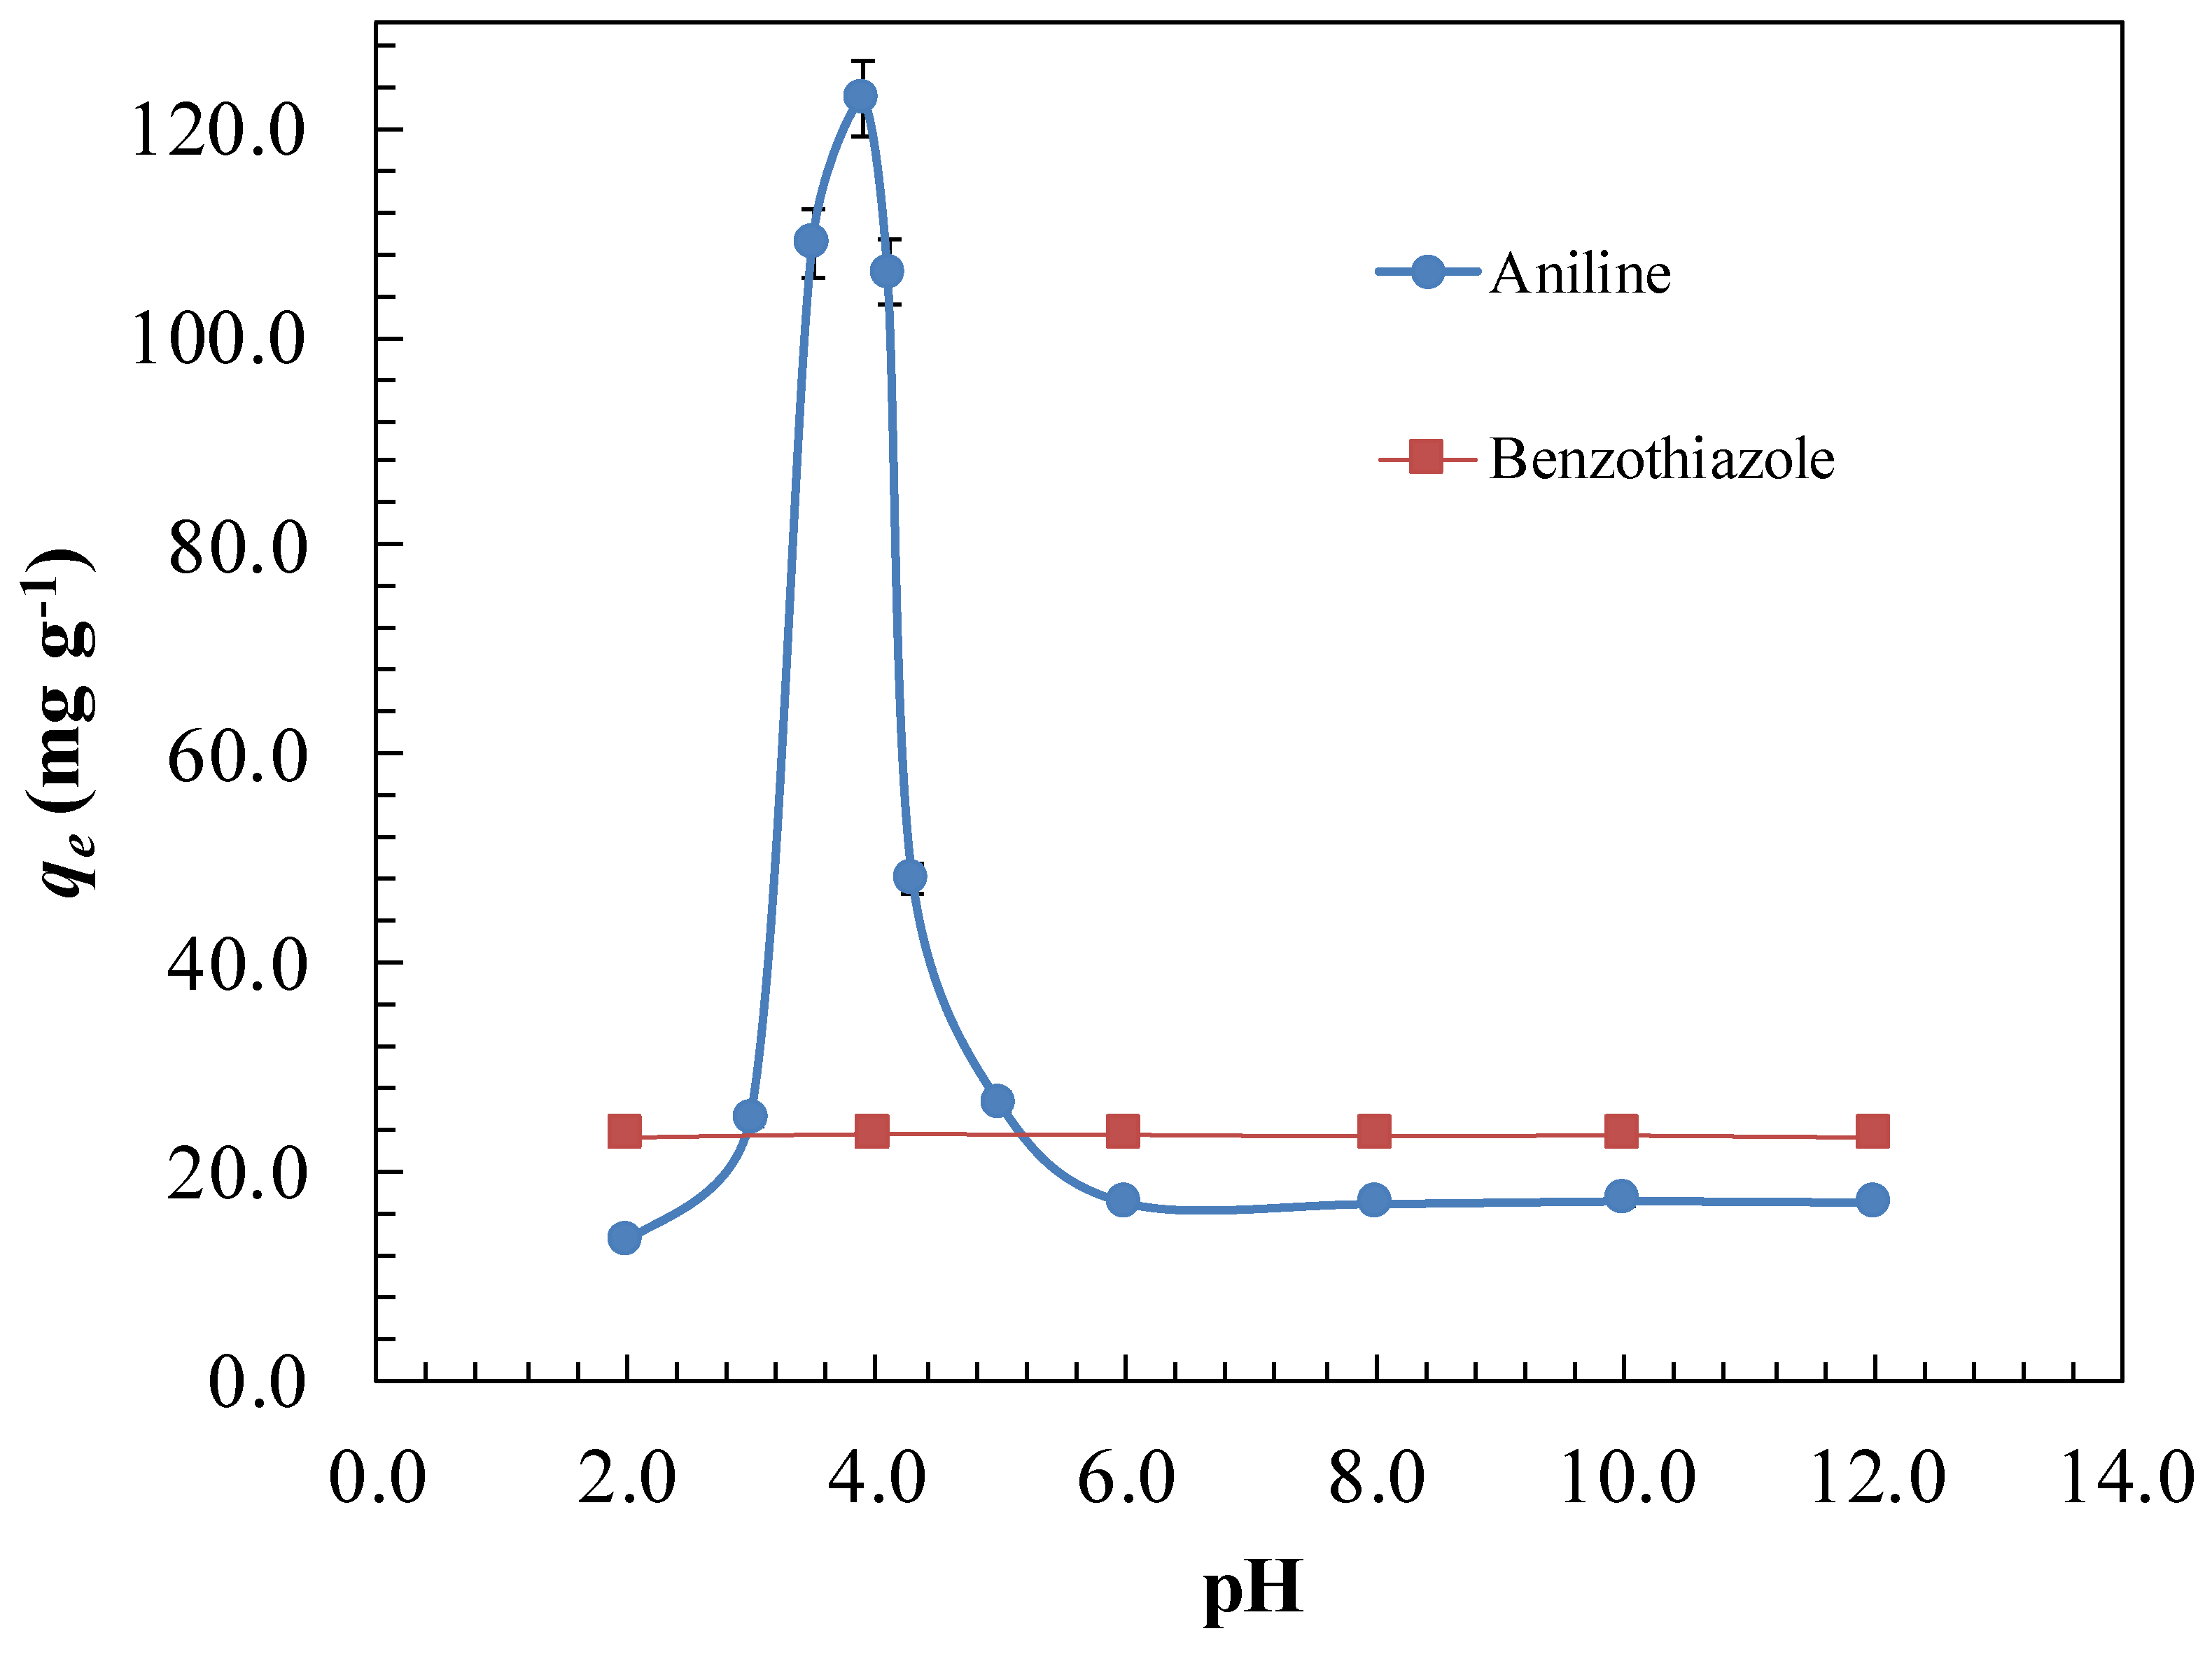
3.2. Effect of pH in Adsorption Process

The study of the effect of pH was carried out taking into account the load on the surface of TiO2 with respect to its isoelectric point [27]. Figure 3 shows the effect of pH in the range of 2.0–12.0 for the adsorption of aniline or benzothiazole on TiO2 starting from solutions of initial concentration of 22.0 mg L−1.
As observed in Figure 3 the effect of pH on the adsorbed amount of benzothiazole in TiO2 remains almost negligible in the studied pH range with a value of 23.5 mg g−1. The fact that it remains unchanged can be related to the isoelectric point of TiO2 found at pHpzc = 3.5 and to the speciation of benzothiazole according to Equation (6):
C 7 H 5 NS ( aq ) + H 2 O ( l ) C 7 H 6 NS + ( aq ) + OH ( aq )   pK a = 0.85
According to the pKa of the reaction in Equation (6), the observed in Figure 3 is due to the fact that benzothiazole in the pH range studied were in neutral form, therefore the effect of the electrical charge on the adsorption equilibrium of this compound in TiO2 is very limited.
However, in the case of aniline adsorption a considerable increase in the amount adsorbed was observed from 17.1 mg g−1 to an alkaline pH at a maximum of 122.78 mg g−1 at pH = 3.9. This could be explained by aniline dissociation equilibrium [6]:
C 6 H 5 NH 2 ( aq ) + H 2 O ( l ) C 6 H 5 NH 3 + ( aq ) + OH ( aq )   pK a = 4.61
The pKa of Equation (7) indicates that aniline at pKa > 4.61 is in its neutral state. While at an acidic pH (pKa < 4.61) it is in the form of anilinium cation. If the isoelectric point of TiO2 is related to the latter with a pHpzc > 3.5 the surface of the TiO2 catalyst would be negatively charged so at a pH between 3.5 and 4.61 the aniline cation would be attracted by the negative charges of the external surface of TiO2, improving the adsorption.

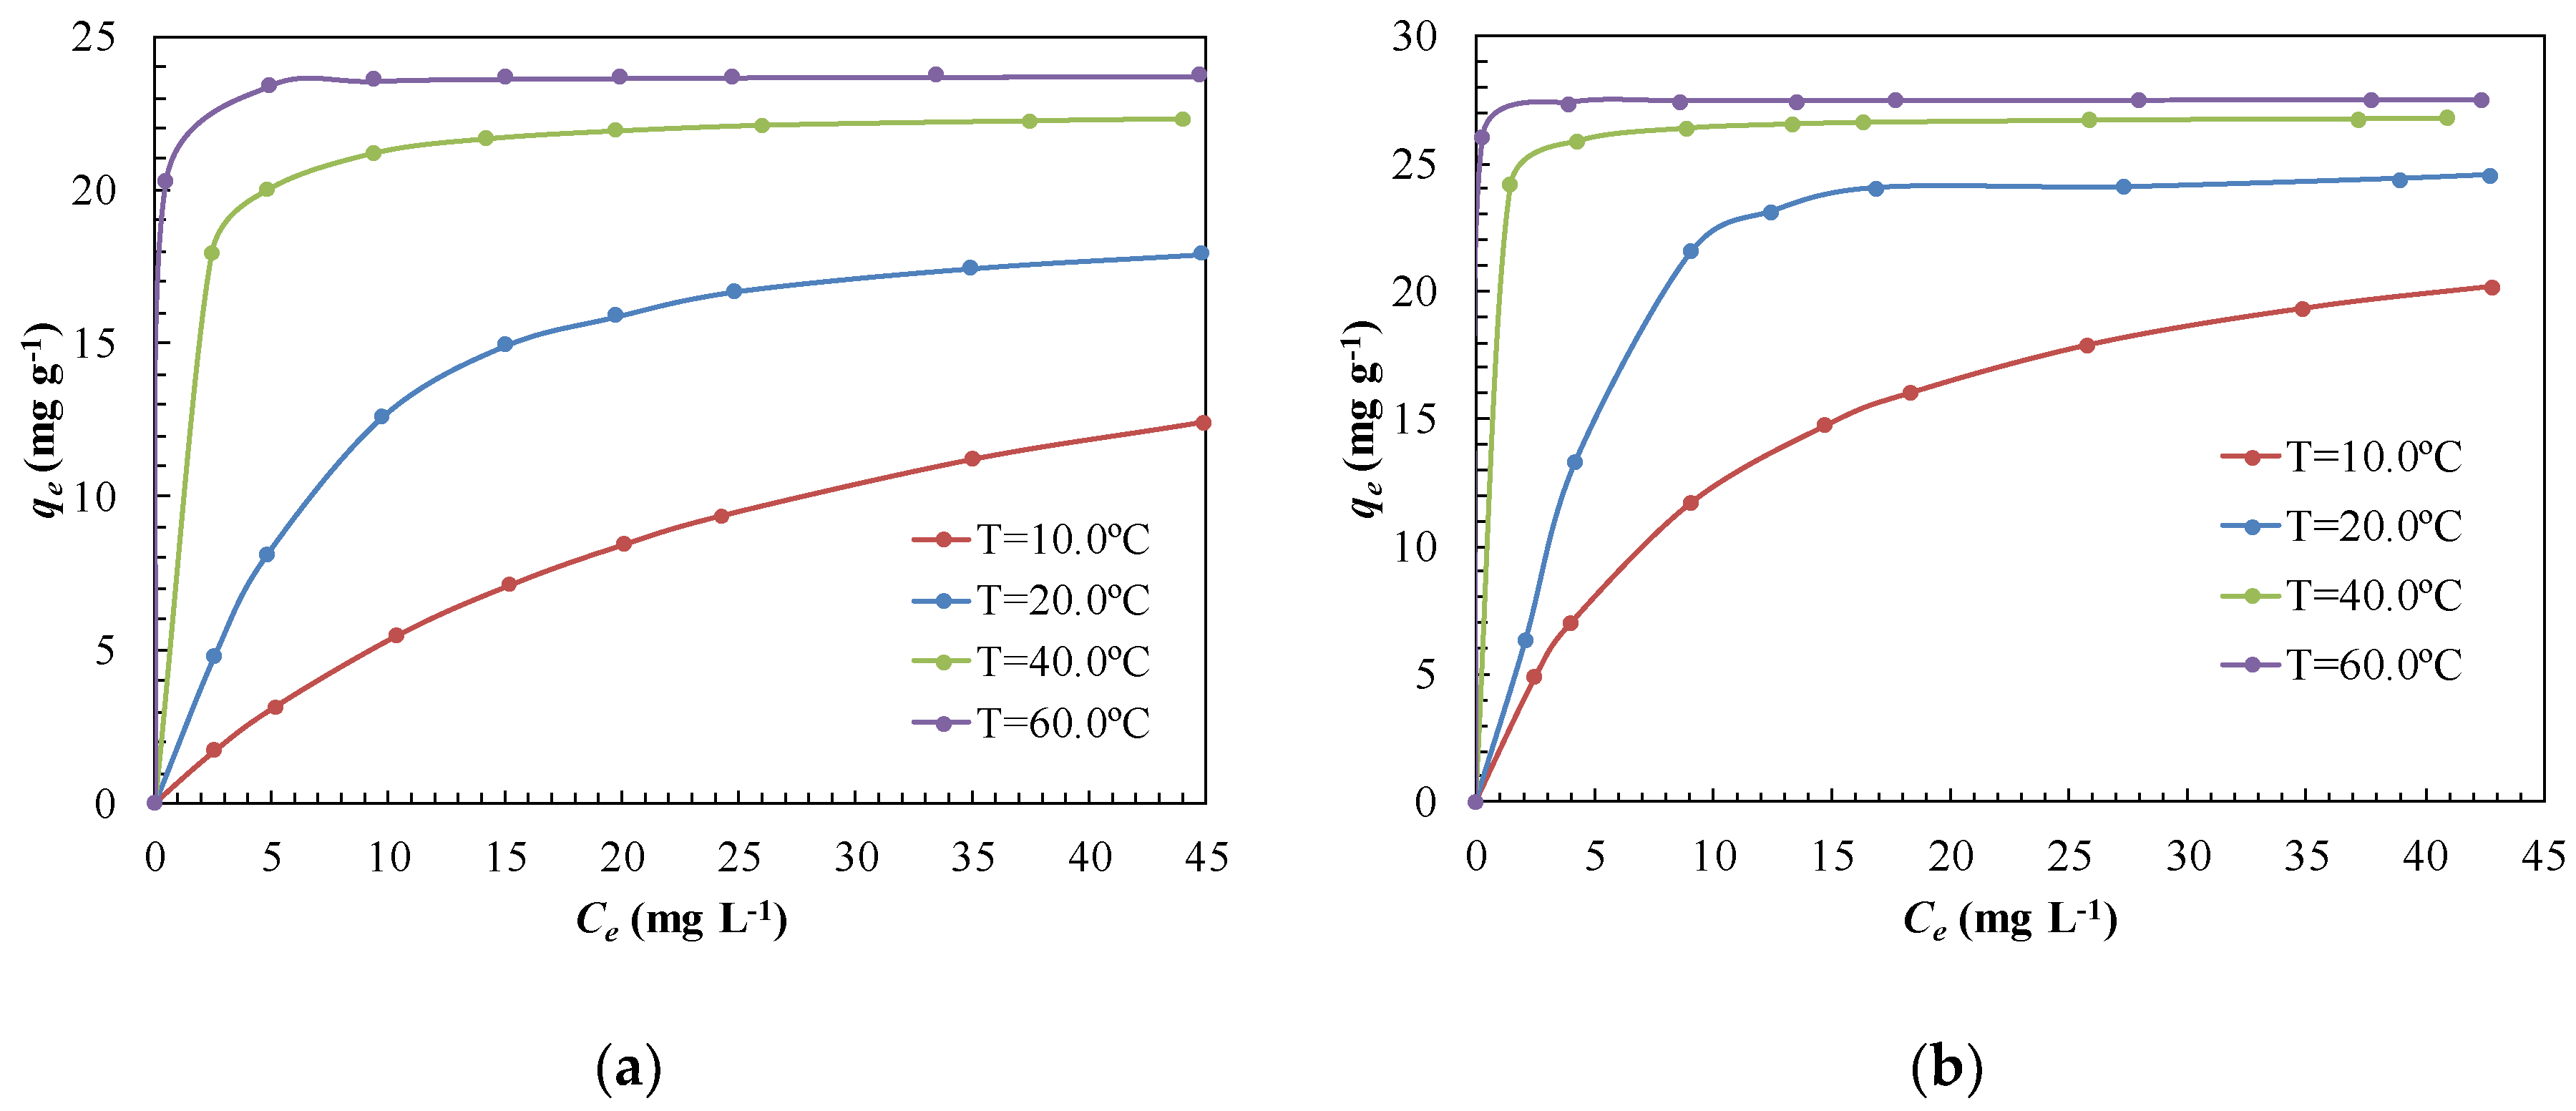
3.3. Adsorption Isotherms

To analyse the process of adsorption, various isotherm models such as Langmuir, Freundlich, Temkin, Dubinin-Radushkevich, Elovich and Generalized isotherm were used to fit obtained experimental data. Figure 4 shows the adsorption isotherms of aniline and benzothiazole on TiO2 at 10 °C, 20 °C, 40 °C and 60 °C at pH = 12.0 for aniline and at pH = 8.0 for benzothiazole [33].

3.3.1. Langmuir Isotherm

This model assumes that the adsorbate forms a monolayer on the adsorbent surface and adsorption occurs over specific homogeneous sites on the adsorbent. There is also an absence of interaction between the adsorbed molecules. Langmuir isotherm model linearized is given by the Equation (8) [34]:
C e q e = 1 q m a x K L + 1 q m a x C e
where KL is the equilibrium constant related to the affinity of the binding sites (L mg−1). Model parameters can be calculated from slope and intercept of linear regression Ce/qe versus Ce. According to Meena et al. [35] the characteristics of Langmuir isotherm can be described by a separation factor RL. This separation factor could be calculated from Equation (9). This factor indicates the nature of adsorption according to the criteria shown on Table 1.
R L = 1 1 + K L C 0
Table 2 shows the Langmuir adsorption isotherm values. Since RL values lie between 0 and 1 for aniline or benzothiazole adsorption onto TiO2, the adsorption process is favourable. According to the values obtained of maximum adsorption capacity, the adsorption process shows an increase in adsorption capacity as temperature increases from 20.08 mg g−1 to 23.75 mg g−1 for aniline and from 25.06 mg g−1 to 27.47 mg g−1 for benzothiazole. This may be due to aniline or benzothiazole molecules acquiring enough energy to experience an interaction with the active site on the surface. The values of the Langmuir equilibrium constant suggest that there is a strong interaction between aniline or benzothiazole with the TiO2 surface at high temperatures. However, at low temperatures the KL value obtained (0.036 or 0.097 L mg−1) indicates that the interaction between adsorbate and adsorbent is somewhat weaker.

3.3.2. Freundlich Isotherm

This empirical model of multilayer adsorption assumes the existence of interactions between adsorbed molecules. Freundlich equation can be defined by the following expression in linear form:
ln q e = ln K F + 1 n ln C e
where KF (mg g−1) (L mg−1)1/n is the Freundlich constant, indicative of adsorption capacity, and n is the heterogeneity factor. Isotherm parameters can be calculated from slope and intercept of linear regression ln qe versus ln Ce. A value of n less than one indicates the irreversibility of the process and greater than one reveals favourable adsorption [36,37]. The values of the constants are presented in Table 2. The adsorption capacity of TiO2 increases with temperature as it was observed with the Langmuir model. The value of n > 1 is indicative of a favourable adsorption. However, the adjustment coefficient is significantly lower, R2 ≅ 0.920, compared to the one obtained with the Langmuir model (R2 ≅ 0.990).

3.3.3. Temkin Isotherm

Temkin’s model assume that the heat of adsorption decreases linearity with coverage due to adsorbent and adsorbate interactions. This adsorption differs from a uniform distribution of the bonding energies [37,38,39]. Temkin model can be applied in the linear form by the following expression:
q e = B 1 ln K T + B 1 ln C e
where KT (L mg−1) is the equilibrium constant corresponding to maximum binding energy and B1 is the variation of adsorption energy (kJ mol−1). These constants can be obtained from plotting qe versus ln Ce and are presented in Table 2. The increase of KT equilibrium constant from 0.362 L mg−1 to 2.727 L mg−1 with the increase of the temperature in the case of aniline or from 0.931 L mg−1 to 2.459 L mg−1 for benzothiazole it could be related to heat of adsorption.

3.3.4. Dubinin-Radushkevich (D-R) Isotherm

This model describes the adsorption isotherms of single solute system. This isotherm is more general than Langmuir isotherm and it does not assume the homogeneity of the surface or constant adsorption potential [31,36,40]. The linear form of D-R model can be expressed from the following equation:
ln q e = ln q s β ε 2
where qs (mg g−1) is the maximum amount of pollutant that can be adsorbed on TiO2, β (mol2 kJ−2) is the activity coefficient related to adsorption energy and ε is the Polyani potential, which can be calculated from this correlation [40]:
ε = R T ln ( 1 + 1 C e )
where R is the universal gas constant (8.314 J mol−1 K−1), T is the absolute temperature (K). The mean adsorption free energy, E (kJ mol−1) per molecule of adsorbate can be calculate using this expression:
E = 1 2 β
According to the obtained values of adsorption free energy, the adsorption energy of benzothiazole (12.70 kJ mol−1) is greater than the one obtained with aniline (2.50 kJ mol−1) at 60 °C. Regarding the quality of the adjustment of the experimental data, it would be behind Langmuir’s model. Even so, the quality of the fit suggests, based on the peculiarities of the D-R isotherm model, that the predominant mechanism is chemical adsorption in both cases.

3.3.5. Elovich Isotherm

This model assumes that adsorption sites increase exponentially with adsorption, implying a multilayer adsorption [41,42]. The linear form of the Elovich model is described in the following equation:
ln q e C e = ln K E q m a x 1 q m a x q e
where Elovich constant, KE (L mg−1) and maximum adsorption capacity can be calculated from the slope and intercept of ln (qe/Ce) versus qe. Modelized parameters are presented in Table 2.

3.3.6. Generalized Isotherm

The expression of the generalized equation is shown below:
ln ( q m a x q e 1 ) = ln K G N ln C e
where KG (mg L−1) is the saturation constant and N is the cooperative binding constant [36]. The parameters KG and N have been calculated from the slope and intercept of the plot of ln (qmax/qe − 1) versus ln Ce. Table 2 gives these values of generalized adsorption isotherm.
According to the R2 coefficient, the best fitting was obtained for the Langmuir isotherm model for all temperatures and pollutants studied. This good agreement can be attributed to the following causes according with Meena et al. [35]: (i) the formation of monolayer coverage on the surface of TiO2 with minimal interaction among molecules of aniline or benzothiazole, (ii) all sites having the same adsorption energies, and (iii) the maximum adsorption corresponds to a saturated monolayer of aniline or benzothiazole on TiO2 surface.

3.4. Adsorption Kinetics Models

In order to study adsorption kinetics, five possible models have been presented. The pseudo-first order equation, pseudo-second order equation, intraparticle diffusion, Elovich model and Bangham model have been studied. Figure 5 shows the adsorption kinetics of aniline and benzothiazole on TiO2 at 10 °C, 20 °C, 30 °C, 40 °C and 60 °C at pH = 12.0 for aniline and at pH = 8.0 for benzothiazole.

3.4.1. Pseudo-First Order Kinetic Model

The pseudo-first order model is based on the consideration that adsorption occurs through a physisorption mechanism because the limiting stage is film diffusion. By controlling the velocity of diffusion into the film, the velocity of adsorption will vary inversely with particle size, film thickness and distribution coefficient. This model assumes: (i) the adsorption only occurs on localized sites, (ii) the energy of adsorption process does not depend on surface coverage, (iii) maximum adsorption corresponds to a saturated monolayer, and (iv) the concentration of aniline or benzothiazole is considered constant, because it is provided in great excess [43,44]. Lagergren’s pseudo-first order equation can be expressed in the following terms:
d q t d t = k 1 ( q e q t )
where qt (mg g −1) is the amount of adsorbate adsorbed at time t, qe (mg g−1) is the adsorption capacity at equilibrium and k1 (min−1) is the pseudo first order rate constant. The integration of Equation (17) applying boundary conditions t = 0 to t = t and qt = 0 to qt = qe, leads to the following expression:
log ( q e q t ) = log q e k 1 2.303 t
The kinetic parameter can be obtained from the slope of a plot of log (qeqt) versus t. The values of k1 for the adsorption of aniline or benzothiazole onto TiO2 are given in Table 3.
The correlation coefficient R2 shows that the pseudo-first order kinetic model is not the most appropriate for adjusting experimental data (R2 ≅ 0.980), so physisorption does not appear to be the adsorption mechanism taking place for both aniline and benzothiazole.

3.4.2. Pseudo Second Order Kinetic Model

The pseudo second order model assumes that in this type of adsorption the chemical reaction seems significant, so the controlling stage is the velocity of the chemical reaction. Thus, the mechanism that takes place is chemisorption. In this mechanism the adsorption kinetics corresponds to a second order of a reversible reaction. The adsorption rate can be described as:
d q t d t = k 2 ( q e q t ) 2
where k2 (g mg−1 min−1) is the pseudo second order rate constant. Integrating Equation (19) for the boundary conditions t = 0 to t = t and qt = 0 to qt = qt and linearization leads to following expression:
t q t = 1 k 2 q e 2 + 1 q e t
The equilibrium adsorption capacity kinetic parameter can be obtained with the slope and k2 is obtained from the intercept of a plot of t/qt versus t. The values of k2 for the adsorption of aniline or benzothiazole onto TiO2 are given in Table 3. According to the correlation coefficient obtained (R2 = 0.990) the pseudo second order kinetic model shows a greater fit than pseudo first order model (R2 ≅ 0.980). Contrary to the other models, this model predicts that the adsorption mechanism is chemisorption and consequently, the reaction is the rate controlling step [43]. This prediction agrees with the observation of an increase of adsorption of aniline or benzothiazole at high temperatures, variable strongly dependent on chemical reactions.

3.4.3. Intraparticle Diffusion Kinetic Model

This empirical kinetic model explains the diffusion mechanism [37,39]. The functional relationship is represented as:
q t = k d i f t + C
where kdif (mg g−1 min−0.5) is the intraparticle diffusion rate constant. The values of the intercept, C (mg g−1) give an idea about the thickness of the boundary layer [37]. Kinetic model parameters are shown in Table 3. Obtaining a value other than zero in parameter C is indicative of the coexistence of the external diffusion step along with the intraparticular diffusion. According to Adam [31], the value of C indicates that the amount is adsorbed in a short period of time. This magnitude can be measured by the initial adsorption factor Ri as shown below:
R i = 1 C q m a x
The criteria of Ri ratio of the initial adsorption amount is shown on Table 4:
The Ri values obtained from Table 3 were found between 0.96 and 0.30 for aniline or benzothiazole. This factor indicates that with increasing temperature the initial adsorption was stronger than at low temperatures.

3.4.4. Elovich Kinetic Model

This kinetic model assumes that the adsorption occurs on localized sites and the energy adsorption increases with the surface coverage. Additionally, the concentration of the TiO2 is considered to be constant [42,44]. The linear form of Elovich model can be illustrated as follows:
q t = 1 β e ln ( α e β e ) + 1 β e ln t
where αe is the initial adsorption rate (mg g−1 s−1) and βe is the constant related to the extent of surface coverage and activation energy for chemisorption (g mg−1). Table 3 shows the parameters obtained from the Elovich model for experimental kinetic data. As can be seen, the initial adsorption becomes stronger in both cases the higher the temperature, going from 0.05 to 2.18 × 10⁵ mg g−1 min−1. This may be due to the fact that at high temperature the diffusion control is much stronger in a film diffusion step.

3.4.5. Bangham Kinetic Model

This model allows to know how slow the adsorption stage in the process. The Bangham equation [36] is given by:
log ( log ( C 0 C 0 q t M ) ) = log ( k B M 2.303 V ) + A log t
where kB (g) and A are constants of the Bangham system. The Bangham model responds to a diffusion in the micropores [45]. Since the double logarithm is capable of modelling experimental data (R2 = 0.940) it means that the diffusion of aniline or benzothiazole into the adsorbent pores is the phase that controls the rate of adsorption.
The best fit model was selected based on the determination coefficient R2. According to that criteria, the correlation coefficients were the highest (R2 = 0.990) for the pseudo-second order kinetic model for all temperatures and pollutants studied. As described throughout this section, several adsorption steps may be involved in the kinetic control regime, along with the main chemisorption mechanism of aniline or benzothiazole. Some of these identified steps are summarized in the next sections: (i) external mass transfer from the aqueous medium to the boundary film (ii) Mass transfer from boundary film to TiO2 external surface (iii) Mass transfer in the pores (iv) Adsorption onto TiO2 active sites (strong initial adsorption at high temperatures) and (iv) Internal diffusion step (intraparticle diffusion).

3.5. Thermodynamic Parameters

The influence of the temperature of adsorption of aniline or benzothiazole on TiO2 was studied in the range of 10–60 °C. As observed in Figure 4 and Figure 5, the adsorption of aniline or benzothiazole increased with the temperature increase from 10 to 60 °C. This increase in TiO2 adsorption capacity with temperature is indicative of endothermic processes [31,35,38]. This increase in adsorption can be attributed to the favourable intermolecular forces between the adsorbate, aniline or benzothiazole, and the adsorbent, TiO2, are much stronger than those between the adsorbate and the solvent. As a result of all this, the increase in temperature to 60 °C makes the adsorbate easier to be adsorbed. Increased adsorption can also be promoted by increasing the number of active sites available and decreasing the boundary layer. As the temperature increases, the diffusivity through the pores is enhanced and could contribute to increased adsorption. Other factors such as the external mass transfer could also be favoured with the increase of temperature. All these hypotheses can be corroborated from the evaluation of thermodynamic parameters.
The thermodynamic parameters: enthalpy, entropy and free energy changes, during adsorption, can be calculated using the following expressions [35]:
Δ G = R T ln K L
where ΔG is the free energy change (J mol−1), R is the universal gas constant (8.314 J mol−1 K−1), T is the absolute temperature (K) and KL is the equilibrium constant (L mol−1). The determination of enthalpy and entropy was carried out using Van’t Hoff equation [38]:
ln K L = Δ S R Δ H R 1 T
where ΔS is the entropy change (J mol−1 K−1) and ΔH is the enthalpy change (J mol−1). These parameters can be obtained from the slope and intercept of ln KL versus 1/T. Table 5 summarizes obtained thermodynamic parameters. The positive value of enthalpy change confirms that the adsorption of aniline or benzothiazole onto TiO2 is endothermic. According with Adam [31], a value of enthalpy change less than 84 kJ mol−1 indicates a physisorption mechanism, while a chemisorption reaches typical enthalpy values between 84 and 420 kJ mol−1. In this work, enthalpy values of 92.78 and 101.26 kJ mol−1 for aniline and benzothiazole respectively confirm the hypothesis of a chemisorption mechanism. The positive values of entropy change indicate the increase of the randomness between solution and solid interface and, consequently, structural changes in the TiO2 and aniline or benzothiazole. The negative values of free energy change in both cases indicate the feasibility and spontaneous nature of adsorption process [35].
From the kinetic data taken at different temperatures between 10 and 60 °C, the activation energy was estimated using the following expression [40]:
ln k 2 = ln k 0 E a R 1 T
where k2 is the pseudo-second order adsorption kinetic constant (g mg−1 min−1), k0 is the frequency factor, R is the universal gas constant (8.314 J mol−1 K−1), T is the absolute temperature (K) and Ea is the activation energy for the adsorption process (J mol−1). The activation energy was determined from the slope of ln k2 versus 1/T according with Equation (27). The activation energy indicates the type of adsorption. According to Fil et al. [40,42] an activation energy value between 0–88 kJ mol−1 indicates a physical adsorption while, between 88–400 kJ mol−1, indicates chemical adsorption. The obtained values of activation energy for aniline (89.23 kJ mol−1) and benzothiazole (93.67 kJ mol−1) also confirm a chemisorption mechanism.

3.6. Adsorption Effect on the Photodegradation of Aniline and Benzothiazole

In order to identify the controlling step during the photocatalytic process, the kinetics of aniline and benzothiazole removal by adsorption and photocatalysis were adjusted to pseudo-first order (Equation (18)) and pseudo-second order models (Equation (20)). The results of kinetics parameters obtained by both models are presented in Table 6.
According to Table 6, slight differences in the fitting of the experimental data were observed, with good results in general, except in the cases when the photocatalysis participates, and the pseudo second order model is considered (R2 < 0.890). Supposing the overall photocatalysis process consist of an in-series combination of adsorption and photocatalysis steps, the lowest step kinetic will determine the rate of the overall process [46]. The pseudo first order model fitted the best overall process. Moreover, since the kinetic constant referring the photocatalysis step (k1 = 0.0065 min−1) is lower than that of adsorption only (k1 = 0.0124 min−1), either for aniline or benzothiazole, the photocatalysis step is postulated as the controlling one of the overall process.

3.7. Effect of pH on Photodegradation

The effect of pH was analysed with synthetic solutions of aniline or benzothiazole with a C0 = 22.0 mg L−1 and different initial pH using the supported configuration of the TiO2 catalyst. Modelling the oxidation kinetics of aniline or benzothiazole requires a model approach that satisfactorily predicts profiles in which the oxidation rate increases with the irradiation time until reaching a point in which the velocity remains constant. This behaviour is reflected in the Langmuir-Hinshelwood (L-H) model, a model widely used in photocatalytic reactions [47]. This model considers that a surface reaction occurs in five consecutive steps: (i) diffusion of the reagent molecules to the surface of TiO2, (ii) adsorption on the surface, (iii) reaction on the surface on which product formation occurs, (iv) desorption of products and (v) diffusion of non-absorbed products away from the surface of TiO2. L-H model is expressed according to Equation (28):
r = d C d t = k K a d C 1 + K a d C
where, C is the aniline or benzothiazole concentration at time t (mg L−1), Kad is the L-H adsorption constant (L mg−1), k is the kinetic constant (L mg−1 h−1) and r is the reaction rate (mg L−1 h−1). In this study, since the initial concentrations of benzothiazole and aniline were lower than 1.0 × 10⁻³ mol L−1, the product Kad × C << 1.0 and consequently Equation (28) could approximate to Equation (29) [48].
r = d C d t = k K a d C
Integrating, Equation (30) is obtained:
ln ( C 0 C ) = k K a d t k a p p t
where kapp is the kinetic constant of pseudo-first order (h−1). Figure 6 shows the removal kinetics obtained for aniline or benzothiazole solutions at different pHs with only supported TiO2.
Figure 6 shows that, in the case of aniline removal (Figure 6a), the photocatalytic oxidation rate is favoured at alkaline pH (above pH = 12.0). However, operating at pH = 2.5 results in less degradation rates, the formation of polyaniline on the lamp is induced [49]. This compound on the lamp surface prevents the passage of UV light reaches the reactor wall TiO2 resulting in low degradation rate.
For the benzothiazole removal (Figure 6b), slower kinetics than those obtained in the case of aniline were obtained. In this case the elimination is favoured at pH = 8.0. The lower degradation of benzothiazole could be due to the presence of several oxidation intermediates by-products, negatively charged, that compete with the initial compound [50].
The dependence of the kinetic constants of pseudo-first order for the degradation of aniline or benzothiazole with pH are shown in Figure 7.
In the case of aniline, there is an upward trend in the kinetic constant with pH, with a maximum value of =0.327 h−1 at pH = 12.0. This maximum can be attributed to the good interaction between the hydroxyl radicals located on the surface of the catalyst and aniline [50]. However, the decrease of kapp at acid pH led to observed minimum value of =0.112 h−1 at pH = 2.5. The appearance of condensation reactions that compete with oxidation reactions when polyaniline is deposited over the UV lamp [49] explains this behavior. In the elimination of benzothiazole at pH = 8.0, a maximum in the degradation rate was observed, with a value of kapp = 0.150 h−1.

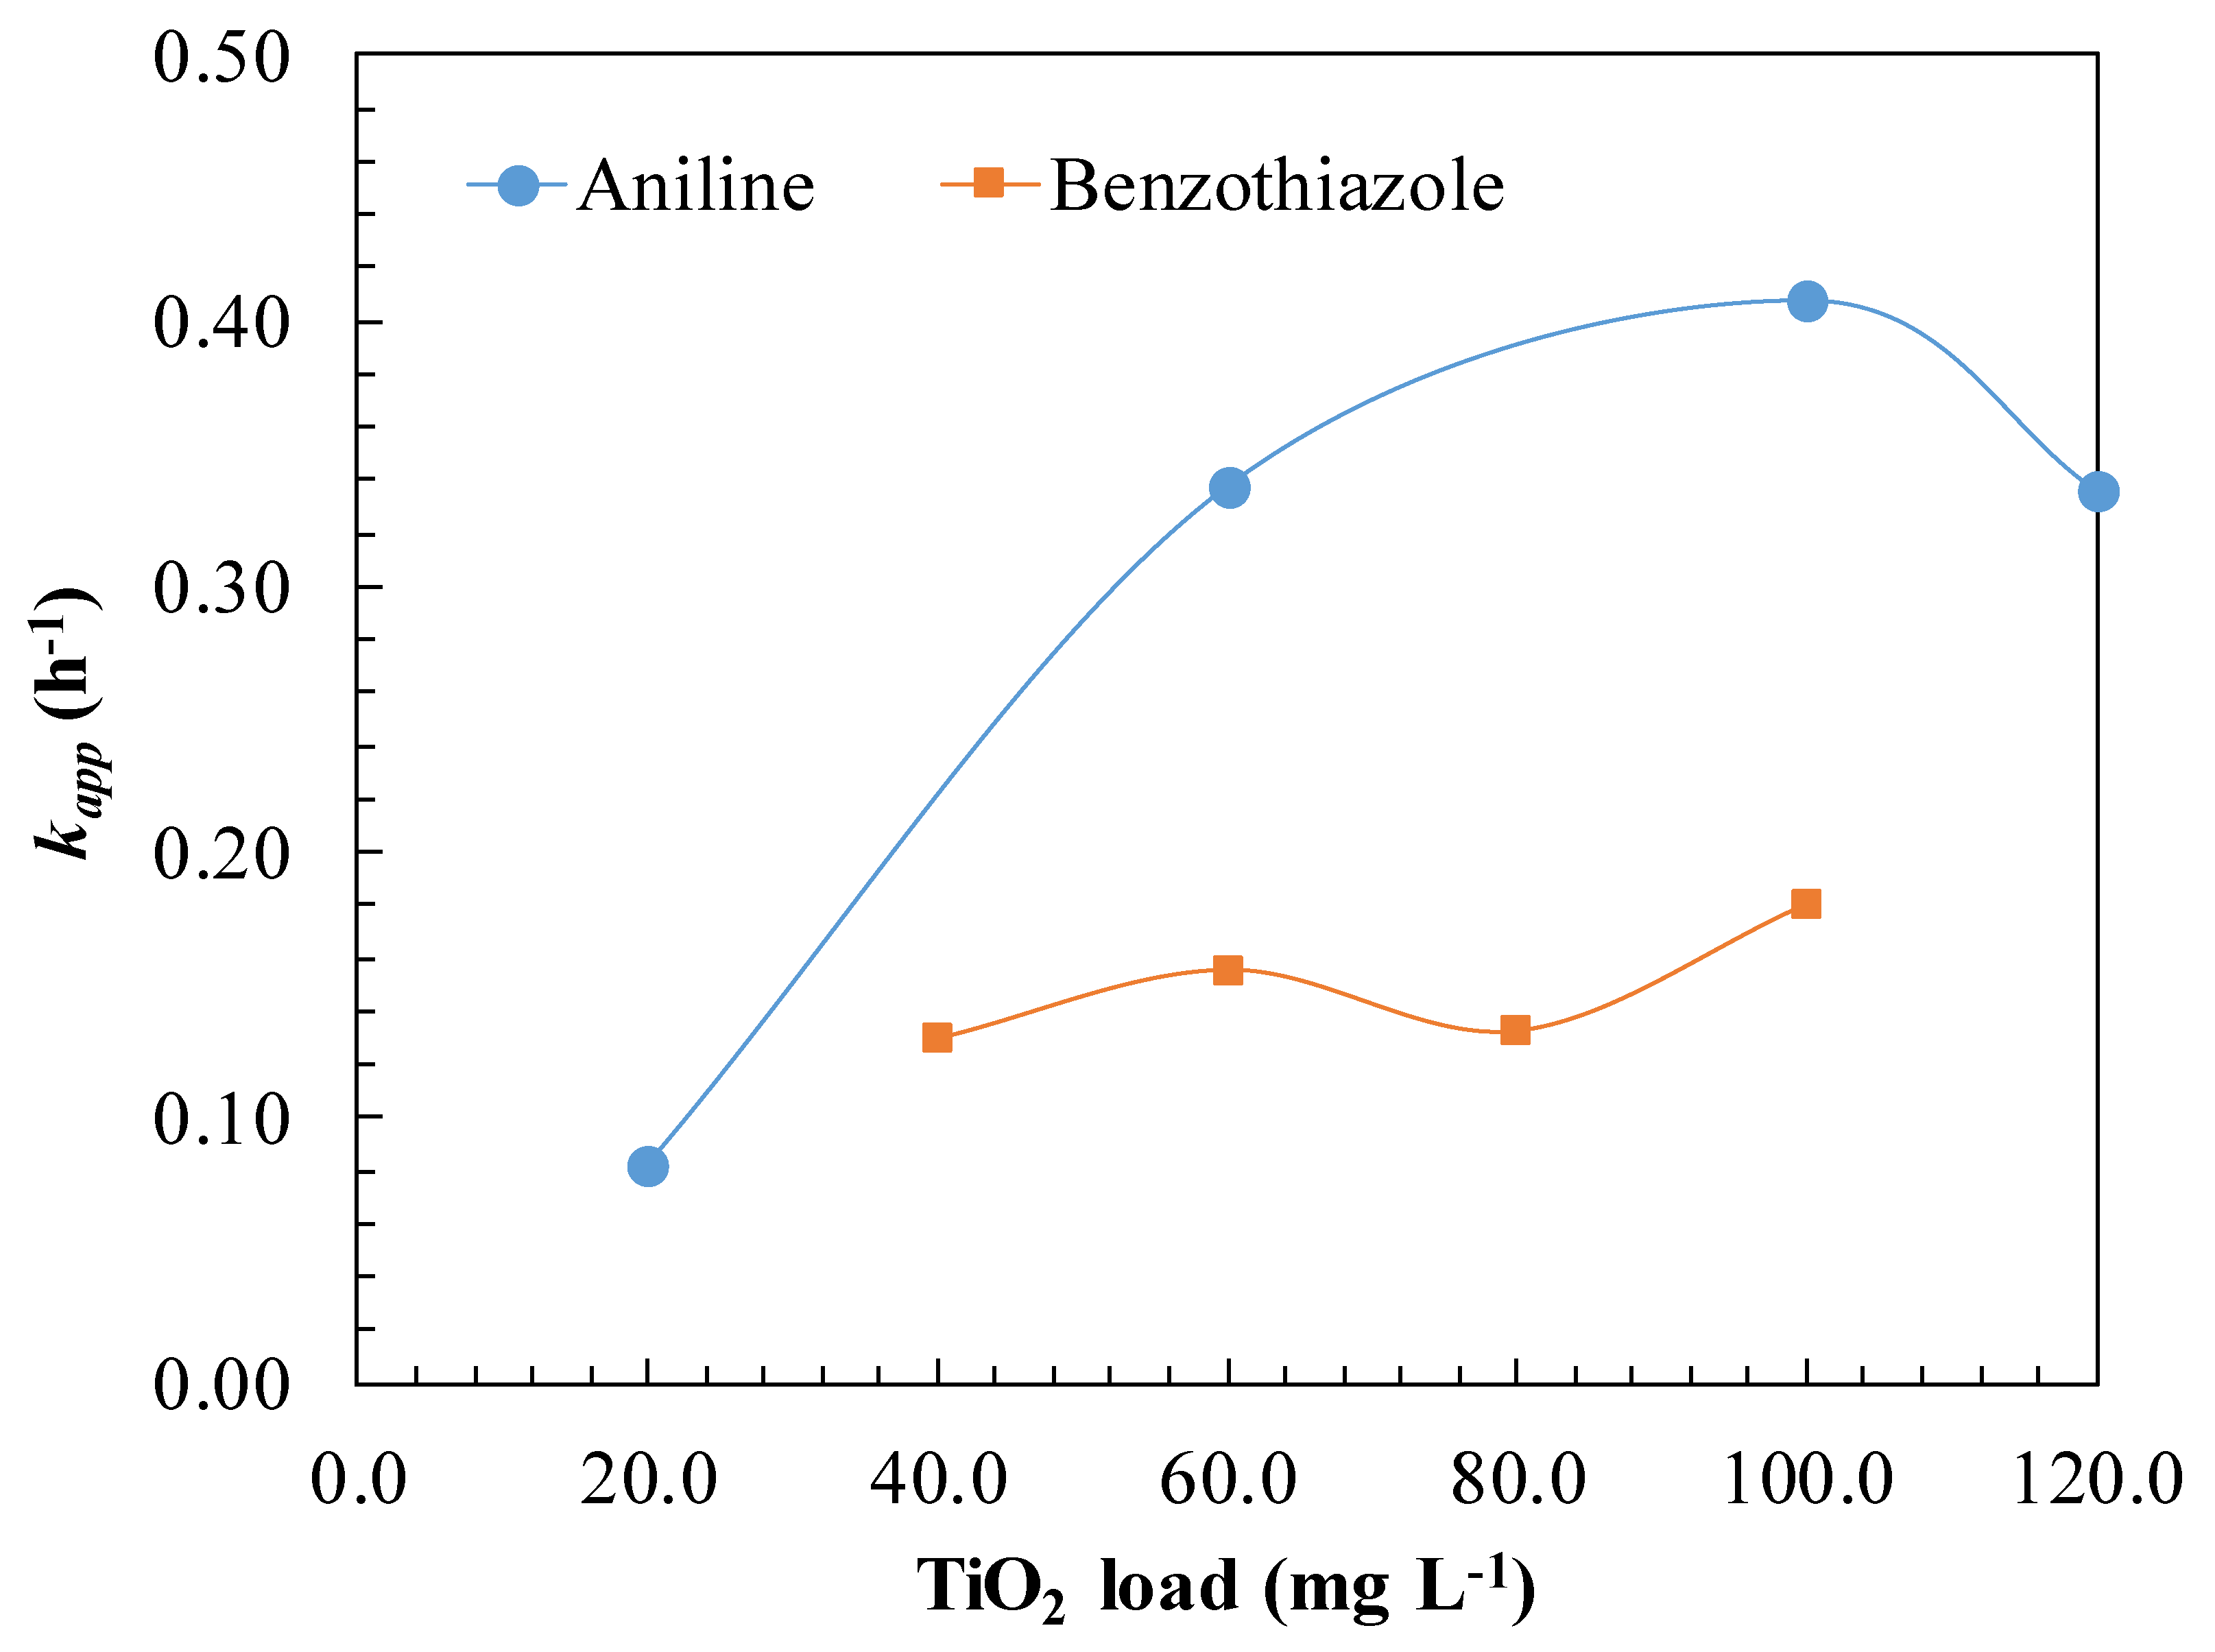
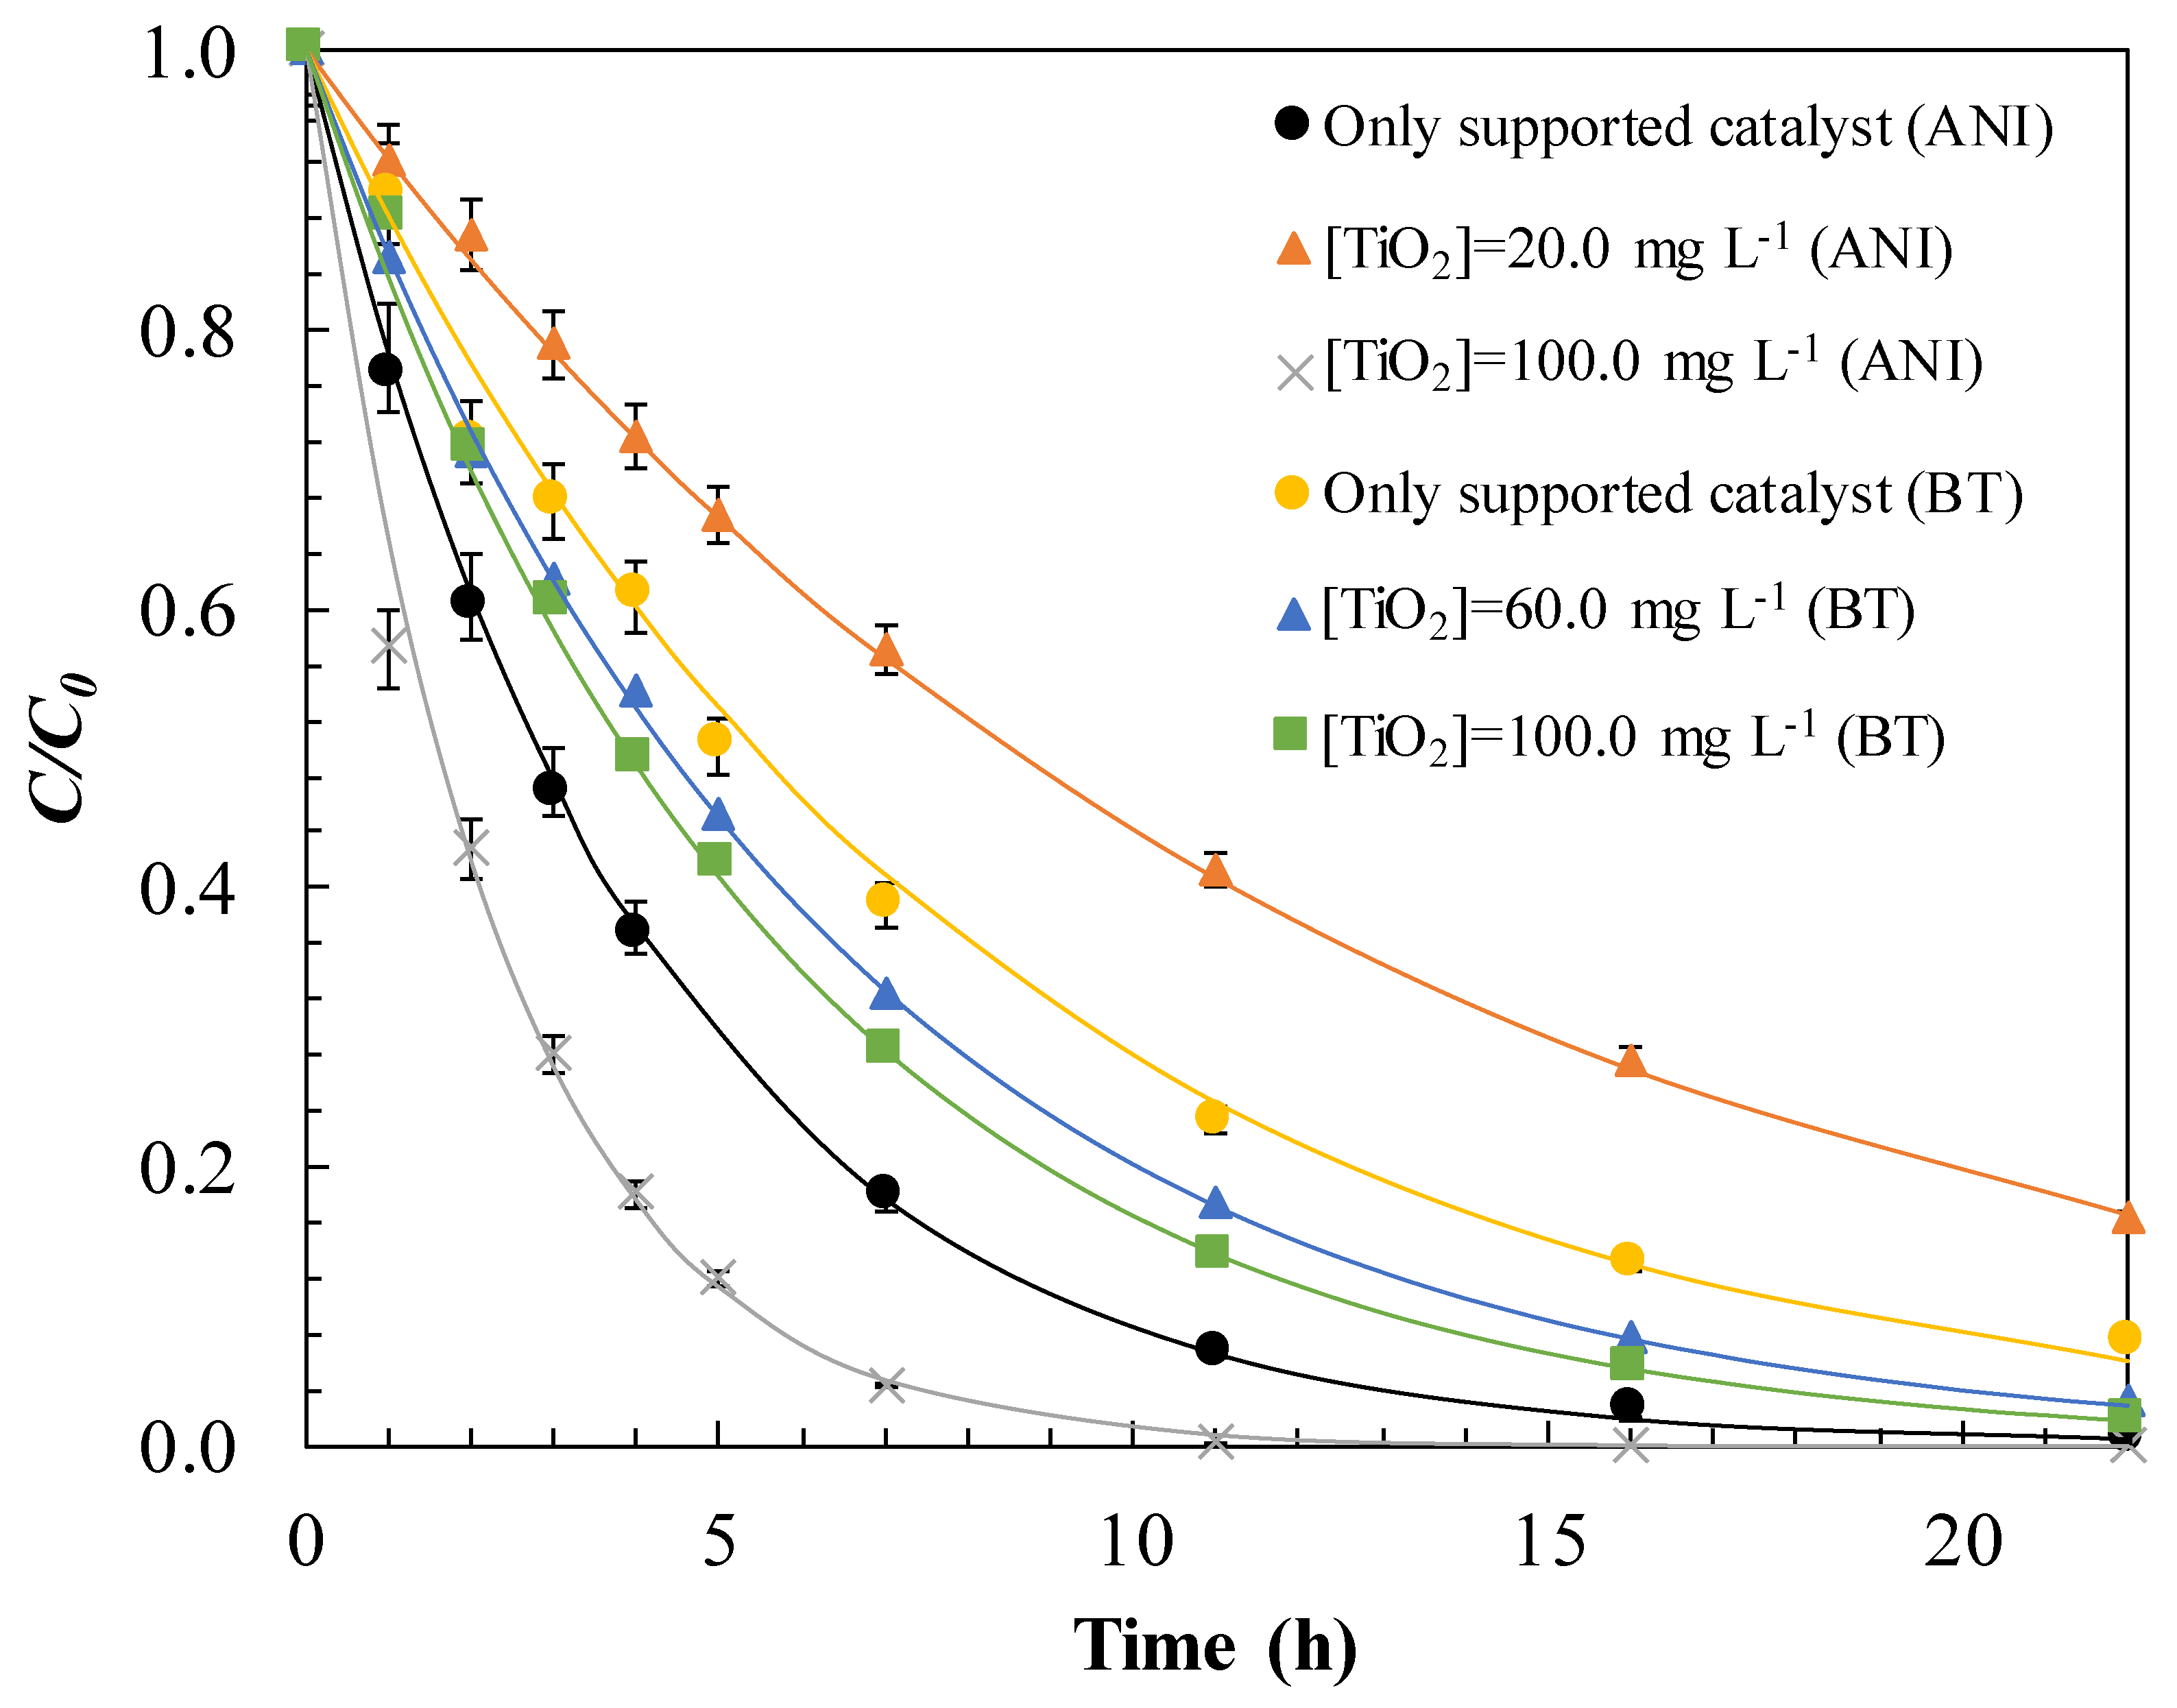
3.8. Effect of TiO2 Suspended Catalyst Loading

The concentration of TiO2 in the photocatalytic reaction system directly affects the oxidation rate of aniline or benzothiazole, where the amount of TiO2 catalyst is directly proportional to the overall photocatalytic reaction rate. In this type of systems, it is common that initially a linear dependence is maintained between introduced catalyst dose and oxidation rate until reaching a certain critical concentration, from which the reaction rate begins to decrease due to the light scattering effect [50]. Figure 8 shows the removal kinetics obtained for aniline or benzothiazole solutions at different doses of TiO2 in a hybrid system with supported catalyst of TiO2.
In the case of aniline, a progressive increase in oxidation rate is observed when the existing supported catalyst in the photoreactor is used simultaneously with introduced TiO2. Thus, with a hybrid supported suspended configuration, 82% aniline removal was achieved, using a dose of 100.0 mg L−1 after 5 h of irradiation. However, with the addition of 20.0 mg L−1 of TiO2 only a 30% removal was achieved for the same time. In the case of benzothiazole, the differences observed in the degradation kinetics were not so relevant. Thus, with 100.0 mg L−1 TiO2 suspension a slight improvement was observed obtaining a 58% removal, for a reaction time of 5 h, clearly lower than that observed on aniline.
The effect of the simultaneous use of suspended and supported TiO2 catalyst on the pseudo first order kinetic constants can be observed in Figure 9 according to the model proposed in Equation (30).
In the case of aniline, it is observed that initially a TiO2 load between 20.0 and 80.0 mg L−1, there is a linear tendency between the dose of catalyst used and the obtained apparent kinetic constant. Over a critical 100.0 mg L−1 TiO2 dose (kapp = 0.408 h−1), kapp begins to decrease. This phenomenon may be due to a screen effect. Catalytic particles leads to an increase in turbidity, covering each other and reducing the light received by the TiO2 suspended and also that supported on the wall [50]. The consequences of this effect could be reduced with a reactor design in which the annular space between the UV lamp and the reactor wall was as small as possible in order to facilitate the efficiency of the UV light emitted [51].
In the degradation of benzothiazole, the influence of the catalyst dose on the apparent kinetic constant is smaller than for aniline. A kinetic constant of kapp = 0.181 h−1 was obtained with a TiO2 dose of 100.0 mg L−1. The lack of significant improvements in the degradation of benzothiazole suggests that the appearance of intermediate oxidation compounds, derived from the strong excision of the aromatic ring, would lead to the generation of ammonia, nitrate, amide compounds such as N-formyl-oxamic acid, and nitrous derivatives. These compounds of greater complexity than those derived from the oxidation of aniline could compete with benzothiazole for hydroxyl radicals and lead to a lower value of kapp [52,53].

3.9. Photocatalytic Reactor Configuration

The reactors used for water treatment by photocatalysis can be classified into two main configurations: reactors with suspended photocatalytic particles and reactors with immobilized photocatalyst. Systems based on the use of suspended catalyst were preferred due to their large active surface area per unit volume and the ease of regenerating once used with a simple wash with deionized water [12,21,50]. The configuration supported does not require a downstream separation stage either by decanting tanks or a cross-flow filtration system, to allow the reactor to operate continuously, but requires maintenance processes for reuse the catalyst after each use as a result of fouling [19]. Catalyst fouling is due to the accumulation of adsorbed by-products on the surface and cavities of the TiO2 support reducing received UV radiation. Besides, fouling also affects the blockage of the active adsorption sites resulting in significantly reduced catalytic activity [54]. Therefore, oxidizing fouling compounds would be required to fully recover the activity, with the consequent shutdown of the system; this is one of the great challenges posed by this configuration.
The progressive loss of activity of the photocatalyst after several cycles has to be considered, especially in the case of supported configurations [18,20,21], Figure 10 shows that the loss of activity can be compensated thanks to the use of hybrid form of the supported catalyst and the introduction of TiO2 in suspension in small concentrations (<<1.0 g L−1).
Figure 10 shows that adding the optimal dose of 100.0 mg L−1 of TiO2 in suspension, for both compounds, achieves higher yields than with the exclusive use of the supported catalyst. The adjustment to a pseudo-first order kinetics of the C/C0 profiles, in the case of aniline, gave an apparent kinetic constant variation from kapp = 0.327 h−1 to kapp = 0.408 h−1, while the degradation rate of benzothiazole increased from kapp = 0.150 h−1 to kapp = 0.181 h−1. This represents an improvement of 24.77% and 20.66%, respectively, respect to the only TiO2 supported configuration. With the simultaneous use of both configurations, species that were previously adsorbed on the supported catalyst could be oxidized. Thus, there would be no accumulation of degradation by-products, avoiding blockage of the active sites and catalyst activity loss. The results obtained are promising since authors such as Santiago et al. [21] or Velmurugan et al. [54] conducted studies comparing the mineralization of imazalil and gelatin industry effluent using Evonik commercial suspension catalysts such as P25 and P90 and only supported configuration concluded that the suspension configuration resulted in a higher degree of mineralization. Kete et al. [20] also studied the three catalytic configurations exposed for the removal of RB19 dye. It obtained worse results in the hybrid configuration with respect to the supported or suspended configurations due to the annular space of the reactor was 5.0 cm compared to the 2.5 used in this work. Another relevant aspect to consider is the durability of catalyst, according with Verma et al. [19] studies, the suspended catalyst maintains almost intact its catalytic activity after more than 100 cycles compared to the supported catalyst that loses 20% of its activity. The proposed hybrid configuration would avoid long stoppages in an industrial treatment plant for the regeneration stage. Regarding the recovery of TiO2 particles, using a concentration of 100.0 mg L−1, instead of 2.0–3.0 g L−1 dosage used by Bansal et al. [18], would considerably facilitate their separation by means of a tangential membrane filtration. Operating costs would not increase because of the improvement in degradation yields of approximately 25%, since there is no need of having to resort to a highly complex supported configuration using pebbles, glass spheres or silica gel beads [12,19,20,21,22].

3.10. Simultaneous Removal of Aniline and Benzothiazole

The effect of a synthetic aqueous matrix of aniline and benzothiazole on operational conditions was compared to each catalyst removal separately. In Figure 11, the oxidation of a mixture of both contaminants with C0 = 22.0 mg L−1 was studied at pH = 12.0, and introducing 60.0, 80.0 and 100.0 mg L−1 of catalyst in suspension.
Figure 11 shows that the pH of the solution that pH = 12.0 gives rise to a higher removal efficiency with a kapp = 0.341 h−1, for aniline, and kapp = 0.091 h−1 for benzothiazole. Under these conditions, a higher generation of hydroxyl radicals is obtained compared to pH = 8.0, in which a kapp = 0.138 h−1 was obtained, for aniline, and kapp = 0.228 h−1 for benzothiazole. The mechanistic degradation route of this binary matrix generates oxidation byproducts such as nitrobenzene, phenol, nitrate and amidic compounds that compete with aniline and benzothiazole [13,52,53] for the hydroxyl radicals. Most intermediates present a positive charge, which facilitates the interaction with the surface of the TiO2 catalyst. The introduction of a suspended catalyst did not behave in the same way as when each compound was studied separately. Therefore, it is necessary to reach an agreement that will lead to the highest levels of elimination of both aniline and benzothiazole. This break-even point is at a dose of [TiO2] = 60.0 mg L−1 with kapp = 0.220 h−1 for aniline and kapp = 0.181 h−1 for benzothiazole. In any case, it seems to be evidenced that in global terms the introduction of TiO2 suspensions in a photoreactor with internal TiO2 supported walls leads to an improvement in the oxidation of aniline and benzothiazole, in addition to the advantages indicated in the previous section [18].
Additionally, the degree of mineralization obtained from the mixture of aniline with benzothiazole was monitored using the supported configuration together with the addition of 60.0 mg L−1 of TiO2 in suspension at pH = 12.0. Figure 12 shows the evolution of total organic carbon (TOC).
As shown in Figure 12, a complete TOC removal is not reached, unlike the primary degradation of the aniline and benzothiazole mixture. This indicates that both compounds are easily transformed into more recalcitrant reaction by-products.

3.11. Energy Consumption

In order to compare and quantify the energy cost of the improvement introduced in this commercial photoreactor, the operating cost was estimated. The term electric energy per order (EEO) is defined as the energy required to degrade a pollutant by an order of magnitude. EEO values can be calculated from the following equation [55]:
E E O = P t 1000 V 60 log ( C 0 C t )
where P is the electrical power (kW), t is the irradiation time (min), V is the volume of treated effluent (L), C0 and Ct are the initial at any time aniline or benzothiazole concentration in mg L−1 respectively. Estimated energy costs for experiments with a mixture of aniline and benzothiazole are shown in Figure 13.
The price of electricity that was considered for industrial consumers in Spain was 0.1059 € per kWh [56]. Under optimal conditions the suspended-supported photoreactor with 60.0 mg L−1 TiO2 (variant C of Figure 13) gives the lowest treatment cost (2.19 € m−3 order−1).

4. Conclusions

In this work, the removal performance of aniline and benzothiazole has been improved in a commercial reactor, getting the most favourable operational conditions using a hybrid photoreactor based on the simultaneous use of supported and suspended TiO2 catalyst. Different operational variants have been offered to enhance the photodegradation removal with small TiO2 concentrations in suspension. The phenomenon of adsorption of aniline and benzothiazole on TiO2 P25 was studied. The best adjustment was achieved to the Langmuir isotherm with parameter values of KL at T = 20 °C of 0.138 and 0.419 L mg−1 for aniline and benzothiazole, respectively. From the thermodynamic analysis, a chemisorption type adsorption mechanism on TiO2 was deducted. Regarding the photocatalytic oxidation, from the individualized analysis of each compound, the most favourable conditions for aniline degradation was determined at pH = 12.0 (kapp = 0.327 h−1). On the other hand, at pH = 2.5 the poorest degradation rate was e obtained (kapp = 0.112 h−1), because of darkening effect of formed polyaniline. In the case of benzothiazole, slower oxidation kinetics than for aniline were obtained due to the presence of several negatively charged by-products that difficult the chemisorption process on TiO2.
A 100.0 mg L−1 TiO2 suspended dose was found to be the most convenient either for aniline (kapp = 0.408 h−1) or benzothiazole (kapp = 0.181 h−1) removal, in separate solutions. Higher concentrated suspensions prevented UV light to reach the TiO2 on the reactor wall.
When treating samples with both compounds, pH = 12.0 was found the most convenient and a higher removal (23% of the total pollutant amount), respect to the only supported catalyst, was obtained. The optimal TiO2 dose used was 60.0 mg L−1, leading to the lowest energy cost: 2.19 € m−3 order−1.

Author Contributions

V.Z. performed the conceptualization; M.J.R. and J.I.L. carried out the design of the methodology and analyses; C.F. and N.V. contributed to the model validation; C.F. carried out the formal analysis; C.F. performed the investigation; C.F. wrote the original draft preparation; C.F. and N.V. wrote the review & editing; V.Z. supervised the experimentation; J.I.L. and J.M.R. could acquire the funding.

Funding

This research was funded by the Basque Government for the financial support of the study through the AID PPG17/53 within the program to consolidate Groups (Basque University System), European funding (ERDF and ESF), and the University of the Basque Country for the C. Ferreiro’s predoctoral PIF grant.

Acknowledgments

Authors are very grateful to General Química S.A.U. (Dynasol group) for the availability for experimenting with a pilot photoreactor of its own.

Conflicts of Interest

The authors declare no conflict of interest.

References

  1. Harvey, P.J.; Campanella, B.F.; Castro, P.M.L.; Harms, H.; Lichtfouse, E.; Schaffner, A.R.; Smrcek, S.; Werck-Reichharts, D. Phytoremediation of polyaromatic hydrocarbons, anilines and phenols. Environ. Sci. Pollut. Res. 2002, 9, 29–47. [Google Scholar] [CrossRef]
  2. Shahrezaei, F.; Mansouri, Y.; Zinatizadeh, A.A.L.; Akhbari, A. Photocatalytic degradation of aniline using TiO2 nanoparticles in a vertical circulating photocatalytic reactor. Int. J. Photoenergy 2012, 2012, 430638. [Google Scholar] [CrossRef]
  3. Herrero, P.; Borrull, F.; Pocurull, E.; Marcé, R.M. An overview of analytical methods and occurrence of benzotriazoles, benzothiazoles and benzenesulfonamides in the environment. TrAC Trends Anal. Chem. 2014, 62, 46–55. [Google Scholar] [CrossRef]
  4. Mestankova, H.; Parker, A.M.; Bramaz, N.; Canonica, S.; Schirmer, K.; von Gunten, U.; Linden, K.G. Transformation of Contaminant Candidate List (CCL3) compounds during ozonation and advanced oxidation processes in drinking water: Assessment of biological effects. Water Res. 2016, 93, 110–120. [Google Scholar] [CrossRef] [Green Version]
  5. Jin, X.; Peldszus, S.; Huck, P.M. Reaction kinetics of selected micropollutants in ozonation and advanced oxidation processes. Water Res. 2012, 46, 6519–6530. [Google Scholar] [CrossRef] [PubMed]
  6. Anotai, J.; Jevprasesphant, A.; Lin, Y.-M.; Lu, M.-C. Oxidation of aniline by titanium dioxide activated with visible light. Sep. Purif. Technol. 2012, 84, 132–137. [Google Scholar] [CrossRef]
  7. US EPA. Contaminant Candidate List 4-CCL 4. Available online: https://www.epa.gov/ccl/contaminant-candidate-list-4-ccl-4-0 (accessed on 9 October 2018).
  8. Felis, E.; Sochacki, A.; Magiera, S. Degradation of benzotriazole and benzothiazole in treatment wetlands and by artificial sunlight. Water Res. 2016, 104, 441–448. [Google Scholar] [CrossRef]
  9. Wang, L.; Zhang, J.; Sun, H.; Zhou, Q. Widespread Occurrence of Benzotriazoles and Benzothiazoles in Tap Water: Influencing Factors and Contribution to Human Exposure. Environ. Sci. Technol. 2016, 50, 2709–2717. [Google Scholar] [CrossRef]
  10. Ikehata, K.; Gamal El-Din, M.; Snyder, S.A. Ozonation and advanced oxidation treatment of emerging organic pollutants in water and wastewater. Ozone-Sci. Eng. 2008, 30, 21–26. [Google Scholar] [CrossRef]
  11. Canle, L.M.; Santaballa, J.A.; Vulliet, E. On the mechanism of TiO2-photocatalyzed degradation of aniline derivatives. J. Photochem. Photobiol. A Chem. 2005, 175, 192–200. [Google Scholar] [CrossRef]
  12. Elfalleh, W.; Assadi, A.A.; Bouzaza, A.; Wolbert, D.; Kiwi, J.; Rtimi, S. Innovative and stable TiO2 supported catalytic surfaces removing aldehydes under UV-light irradiation. J. Photochem. Photobiol. A Chem. 2017, 343, 96–102. [Google Scholar] [CrossRef]
  13. Sánchez, L.; Peral, J.; Domènech, X. Photocatalyzed destruction of aniline in UV-illuminated aqueous TiO2 suspensions. Electrochim. Acta 1997, 42, 1877–1882. [Google Scholar] [CrossRef]
  14. Chen, H.Y.; Zahraa, O.; Bouchy, M. Inhibition of the adsorption and photocatalytic degradation of an organic contaminant in an aqueous suspension of TiO2 by inorganic ions. J. Photochem. Photobiol. A Chem. 1997, 108, 37–44. [Google Scholar] [CrossRef]
  15. Stafford, U.; Gray, K.A.; Kamat, P.V.; Varma, A. An in situ diffuse reflectance FTIR investigation of photocatalytic degradation of 4-chlorophenol on a TiO2 powder surface. Chem. Phys. Lett. 1993, 205, 55–61. [Google Scholar] [CrossRef]
  16. Murgolo, S.; Yargeau, V.; Gerbasi, R.; Visentin, F.; El Habra, N.; Ricco, G.; Lacchetti, I.; Carere, M.; Curri, M.L.; Mascolo, G. A new supported TiO2 film deposited on stainless steel for the photocatalytic degradation of contaminants of emerging concern. Chem. Eng. J. 2017, 318, 103–111. [Google Scholar] [CrossRef]
  17. Costa, A.R.; de Pinho, M.N. Performance and cost estimation of nanofiltration for surface water treatment in drinking water production. Desalination 2006, 196, 55–65. [Google Scholar] [CrossRef]
  18. Bansal, P.; Verma, A.; Aggarwal, K.; Singh, A.; Gupta, S. Investigations on the degradation of an antibiotic Cephalexin using suspended and supported TiO2: Mineralization and durability studies. Can. J. Chem. Eng. 2016, 94, 1269–1276. [Google Scholar] [CrossRef]
  19. Verma, A.; Toor, A.P.; Prakash, N.T.; Bansal, P.; Sangal, V.K. Stability and durability studies of TiO2 coated immobilized system for the degradation of imidacloprid. New J. Chem. 2017, 41, 6296–6304. [Google Scholar] [CrossRef]
  20. Kete, M.; Pliekhova, O.; Matoh, L.; Štangar, U.L. Design and evaluation of a compact photocatalytic reactor for water treatment. Environ. Sci. Pollut. Res. Int. 2018, 25, 20453–20465. [Google Scholar] [CrossRef]
  21. Santiago, D.E.; Espino-Estévez, M.R.; González, G.V.; Araña, J.; González-Díaz, O.; Doña-Rodríguez, J.M. Photocatalytic treatment of water containing imazalil using an immobilized TiO2 photoreactor. Appl. Catal. A Gen. 2015, 498, 1–9. [Google Scholar] [CrossRef]
  22. Ribao, P.; Rivero, M.J.; Ortiz, I. TiO2 structures doped with noble metals and/or graphene oxide to improve the photocatalytic degradation of dichloroacetic acid. Environ. Sci. Pollut. Res. Int. 2017, 24, 12628–12637. [Google Scholar] [CrossRef] [PubMed]
  23. Inwatech Környezetvédelmi Kft. Innováció és Technológiák a Környezetért. Available online: http://www.inwatech.com/en/ (accessed on 18 January 2019).
  24. Silva, T.L.; Ronix, A.; Pezoti, O.; Souza, L.S.; Leandro, P.K.T.; Bedin, K.C.; Beltrame, K.K.; Cazetta, A.L.; Almeida, V.C. Mesoporous activated carbon from industrial laundry sewage sludge: Adsorption studies of reactive dye Remazol Brilliant Blue R. Chem. Eng. J. 2016, 303, 467–476. [Google Scholar] [CrossRef]
  25. Morrow, W.; McLean, L. Self-Cleaning UV Reflective Coating. U.S. Patent No. 2003/0059549, 27 March 2003. [Google Scholar]
  26. Matthews, R.W.; McEvoy, S.R. A comparison of 254 nm and 350 nm excitation of TiO2 in simple photocatalytic reactors. J. Photochem. Photobiol. A Chem. 1992, 66, 355–366. [Google Scholar] [CrossRef]
  27. Sanchez, M.; Rivero, M.J.; Ortiz, I. Kinetics of dodecylbenzenesulphonate mineralisation by TiO2 photocatalysis. Appl. Catal. B Environ. 2011, 101, 515–521. [Google Scholar] [CrossRef]
  28. Zhou, D.; Ji, Z.; Jiang, X.; Dunphy, D.R.; Brinker, J.; Keller, A.A. Influence of Material Properties on TiO2 Nanoparticle Agglomeration. PLoS ONE 2013, 8, e81239. [Google Scholar] [CrossRef]
  29. Plieth, W. 12—Nanoelectrochemistry. In Electrochemistry for Materials Science; Plieth, W., Ed.; Elsevier: Amsterdam, The Netherlands, 2008; pp. 365–388. ISBN 978-0-444-52792-9. [Google Scholar]
  30. Yousef, R.I.; El-Eswed, B. The effect of pH on the adsorption of phenol and chlorophenols onto natural zeolite. Colloids Surf. A Physicochem. Eng. Asp. 2009, 334, 92–99. [Google Scholar] [CrossRef]
  31. Adam, O.E.-A.A. Removal of Resorcinol from Aqueous Solution by Activated Carbon: Isotherms, Thermodynamics and Kinetics. Am. Chem. Sci. J. 2016, 16, 1–13. [Google Scholar] [CrossRef]
  32. Mack, E. Average cross-sectional areas of molecules by gaseous diffusion methods. J. Am. Chem. Soc. 1925, 47, 2468–2482. [Google Scholar] [CrossRef]
  33. Sing, K.S.W.; Everett, D.H.; Haul, R.A.W.; Moscou, L.; Pierotti, R.A.; Rouquerol, J.; Siemieniewska, T. Reporting Physisorption Data for Gas/Solid Systems. In Handbook of Heterogeneous Catalysis; Ertl, G., Ed.; Wiley-VCH Verlag GmbH & Co. KGaA: Weinheim, Germany, 2008; ISBN 978-3-527-31241-2. [Google Scholar]
  34. Lin, J.; Weng, X.; Jin, X.; Megharaj, M.; Naidu, R.; Chen, Z. Reactivity of iron-based nanoparticles by green synthesis under various atmospheres and their removal mechanism of methylene blue. RSC Adv. 2015, 5, 70874–70882. [Google Scholar] [CrossRef]
  35. Meena, A.K.; Kadirvelu, K.; Mishraa, G.K.; Rajagopal, C.; Nagar, P.N. Adsorption of Pb(II) and Cd(II) metal ions from aqueous solutions by mustard husk. J. Hazard. Mater. 2008, 150, 619–625. [Google Scholar] [CrossRef]
  36. Kaur, S.; Rani, S.; Mahajan, R.K. Adsorption Kinetics for the Removal of Hazardous Dye Congo Red by Biowaste Materials as Adsorbents. J. Chem. 2013, 2013, 628582. [Google Scholar] [CrossRef]
  37. Gupta, V.K.; Agarwal, S.; Sadegh, H.; Ali, G.A.M.; Bharti, A.K.; Hamdy Makhlouf, A.S. Facile route synthesis of novel graphene oxide-β-cyclodextrin nanocomposite and its application as adsorbent for removal of toxic bisphenol A from the aqueous phase. J. Mol. Liq. 2017, 237, 466–472. [Google Scholar] [CrossRef] [Green Version]
  38. Enniya, I.; Rghioui, L.; Jourani, A. Adsorption of hexavalent chromium in aqueous solution on activated carbon prepared from apple peels. Sustain. Chem. Pharm. 2018, 7, 9–16. [Google Scholar] [CrossRef]
  39. Markandeya; Shukla, S.P.; Kisku, G.C. Linear and Non-Linear Kinetic Modeling for Adsorption of Disperse Dye in Batch Process. Res. J. Environ. Toxicol. 2015, 9, 320–331. [Google Scholar]
  40. Banerjee, S.; Chattopadhyaya, M.C. Adsorption characteristics for the removal of a toxic dye, tartrazine from aqueous solutions by a low cost agricultural by-product. Arab. J. Chem. 2017, 10, S1629–S1638. [Google Scholar] [CrossRef] [Green Version]
  41. Ayawei, N.; Ebelegi, A.N.; Wankasi, D. Modelling and Interpretation of Adsorption Isotherms. J. Chem. 2017, 2017, 3039817. [Google Scholar] [CrossRef]
  42. Fil, B.A.; Yilmaz, M.T.; Bayar, S.; Elkoca, M.T. Investigation of adsorption of the dyestuff astrazon red violet 3RN (basic violet 16) on montmorillonite clay. Braz. J. Chem. Eng. 2014, 31, 171–182. [Google Scholar] [CrossRef]
  43. Ho, Y.S.; McKay, G. A Comparison of Chemisorption Kinetic Models Applied to Pollutant Removal on Various Sorbents. Process Saf. Environ. Prot. 1998, 76, 332–340. [Google Scholar] [CrossRef] [Green Version]
  44. Largitte, L.; Pasquier, R. A review of the kinetics adsorption models and their application to the adsorption of lead by an activated carbon. Chem. Eng. Res. Des. 2016, 109, 495–504. [Google Scholar] [CrossRef]
  45. Inyinbor, A.A.; Adekola, F.A.; Olatunji, G.A. Kinetics, isotherms and thermodynamic modeling of liquid phase adsorption of Rhodamine B dye onto Raphia hookerie fruit epicarp. Water Resour. Ind. 2016, 15, 14–27. [Google Scholar] [CrossRef] [Green Version]
  46. Orha, C.; Pode, R.; Manea, F.; Lazau, C.; Bandas, C. Titanium dioxide-modified activated carbon for advanced drinking water treatment. Process Saf. Environ. Prot. 2017, 108, 26–33. [Google Scholar] [CrossRef]
  47. O’Shea, K.E.; Dionysiou, D.D. Advanced Oxidation Processes for Water Treatment. J. Phys. Chem. Lett. 2012, 3, 2112–2113. [Google Scholar] [CrossRef]
  48. Wols, B.A.; Hofman-Caris, C.H.M. Review of photochemical reaction constants of organic micropollutants required for UV advanced oxidation processes in water. Water Res. 2012, 46, 2815–2827. [Google Scholar] [CrossRef] [PubMed]
  49. Yang, H.; Bard, A.J. The application of fast scan cyclic voltammetry. Mechanistic study of the initial stage of electropolymerization of aniline in aqueous solutions. J. Electroanal. Chem. 1992, 339, 423–449. [Google Scholar] [CrossRef]
  50. Chong, M.N.; Jin, B.; Chow, C.W.K.; Saint, C. Recent developments in photocatalytic water treatment technology: A review. Water Res. 2010, 44, 2997–3027. [Google Scholar] [CrossRef] [PubMed]
  51. Doña, J.M.; Garriga, C.; Araña, J.; Pérez, J.; Colon, G.; Macías, M.; Navio, J.A. The effect of dosage on the photocatalytic degradation of organic pollutants. Res. Chem. Intermed. 2007, 33, 351–358. [Google Scholar] [CrossRef]
  52. Andreozzi, R.; Insola, A.; Caprio, V.; D’Amore, M.G. Ozonation of pyridine in aqueous solution: Mechanistic and kinetic aspects. Water Res. 1991, 25, 655–659. [Google Scholar] [CrossRef]
  53. Valdés, H.; Zaror, C.A.; Jekel, M. Removal of Benzothiazole from Contaminated Waters by Ozonation: The Role of Direct and Indirect Ozone Reactions. J. Adv. Oxid. Technol. 2016, 19, 338–346. [Google Scholar] [CrossRef]
  54. Velmurugan, R.; Subash, B.; Krishnakumar, B.; Selvam, K.; Swaminathan, M. Solar photocatalytic treatment of gelatin industry effluent: Performance of pilot scale reactor with suspended TiO2 and supported TiO2. Indian J. Chem. Technol. 2016, 23, 8. [Google Scholar]
  55. Davididou, K.; McRitchie, C.; Antonopoulou, M.; Konstantinou, I.; Chatzisymeon, E. Photocatalytic degradation of saccharin under UV-LED and blacklight irradiation. J. Chem. Technol. Biotechnol. 2018, 93, 269–276. [Google Scholar] [CrossRef]
  56. European Union. Eurostat Regional Yearbook, 2018 ed.; Statistical Books; Publications Office of the European Union: Luxembourg, 2018; ISBN 978-92-79-87876-3. [Google Scholar]
Figure 1. Schematic of the experimental equipment used to carry out the photocatalytic tests with aniline and benzothiazole.
Water 11 00337 g001
Figure 2. Isoelectric point of TiO2 P25 catalyst determined by acid-base titration method.
Water 11 00337 g002
Figure 3. Effect of solution pH on aniline or benzothiazole adsorption on TiO2 at equilibrium. Experimental conditions: C0 = 22.0 mg L1, [TiO2] = 100.0 mg L1, T = 25.0 °C.
Water 11 00337 g003
Figure 4. Adsorption isotherms of (a) aniline at pH = 12.0 and (b) benzothiazole at pH = 8.0 on TiO2 P25 catalyst at different temperatures.
Water 11 00337 g004
Figure 5. Evolution of the adsorbed capacity with time for effect of temperature (a) aniline at pH = 12.0 and (b) benzothiazole at pH = 8.0 on TiO2 P25 catalyst.
Water 11 00337 g005
Figure 6. Effect of pH on the photocatalytic degradation of; (a) aniline and (b) benzothiazole, using only TiO2-supported catalyst. Experimental (dots) and pseudo-1st-order modelled ( Water 11 00337 i001
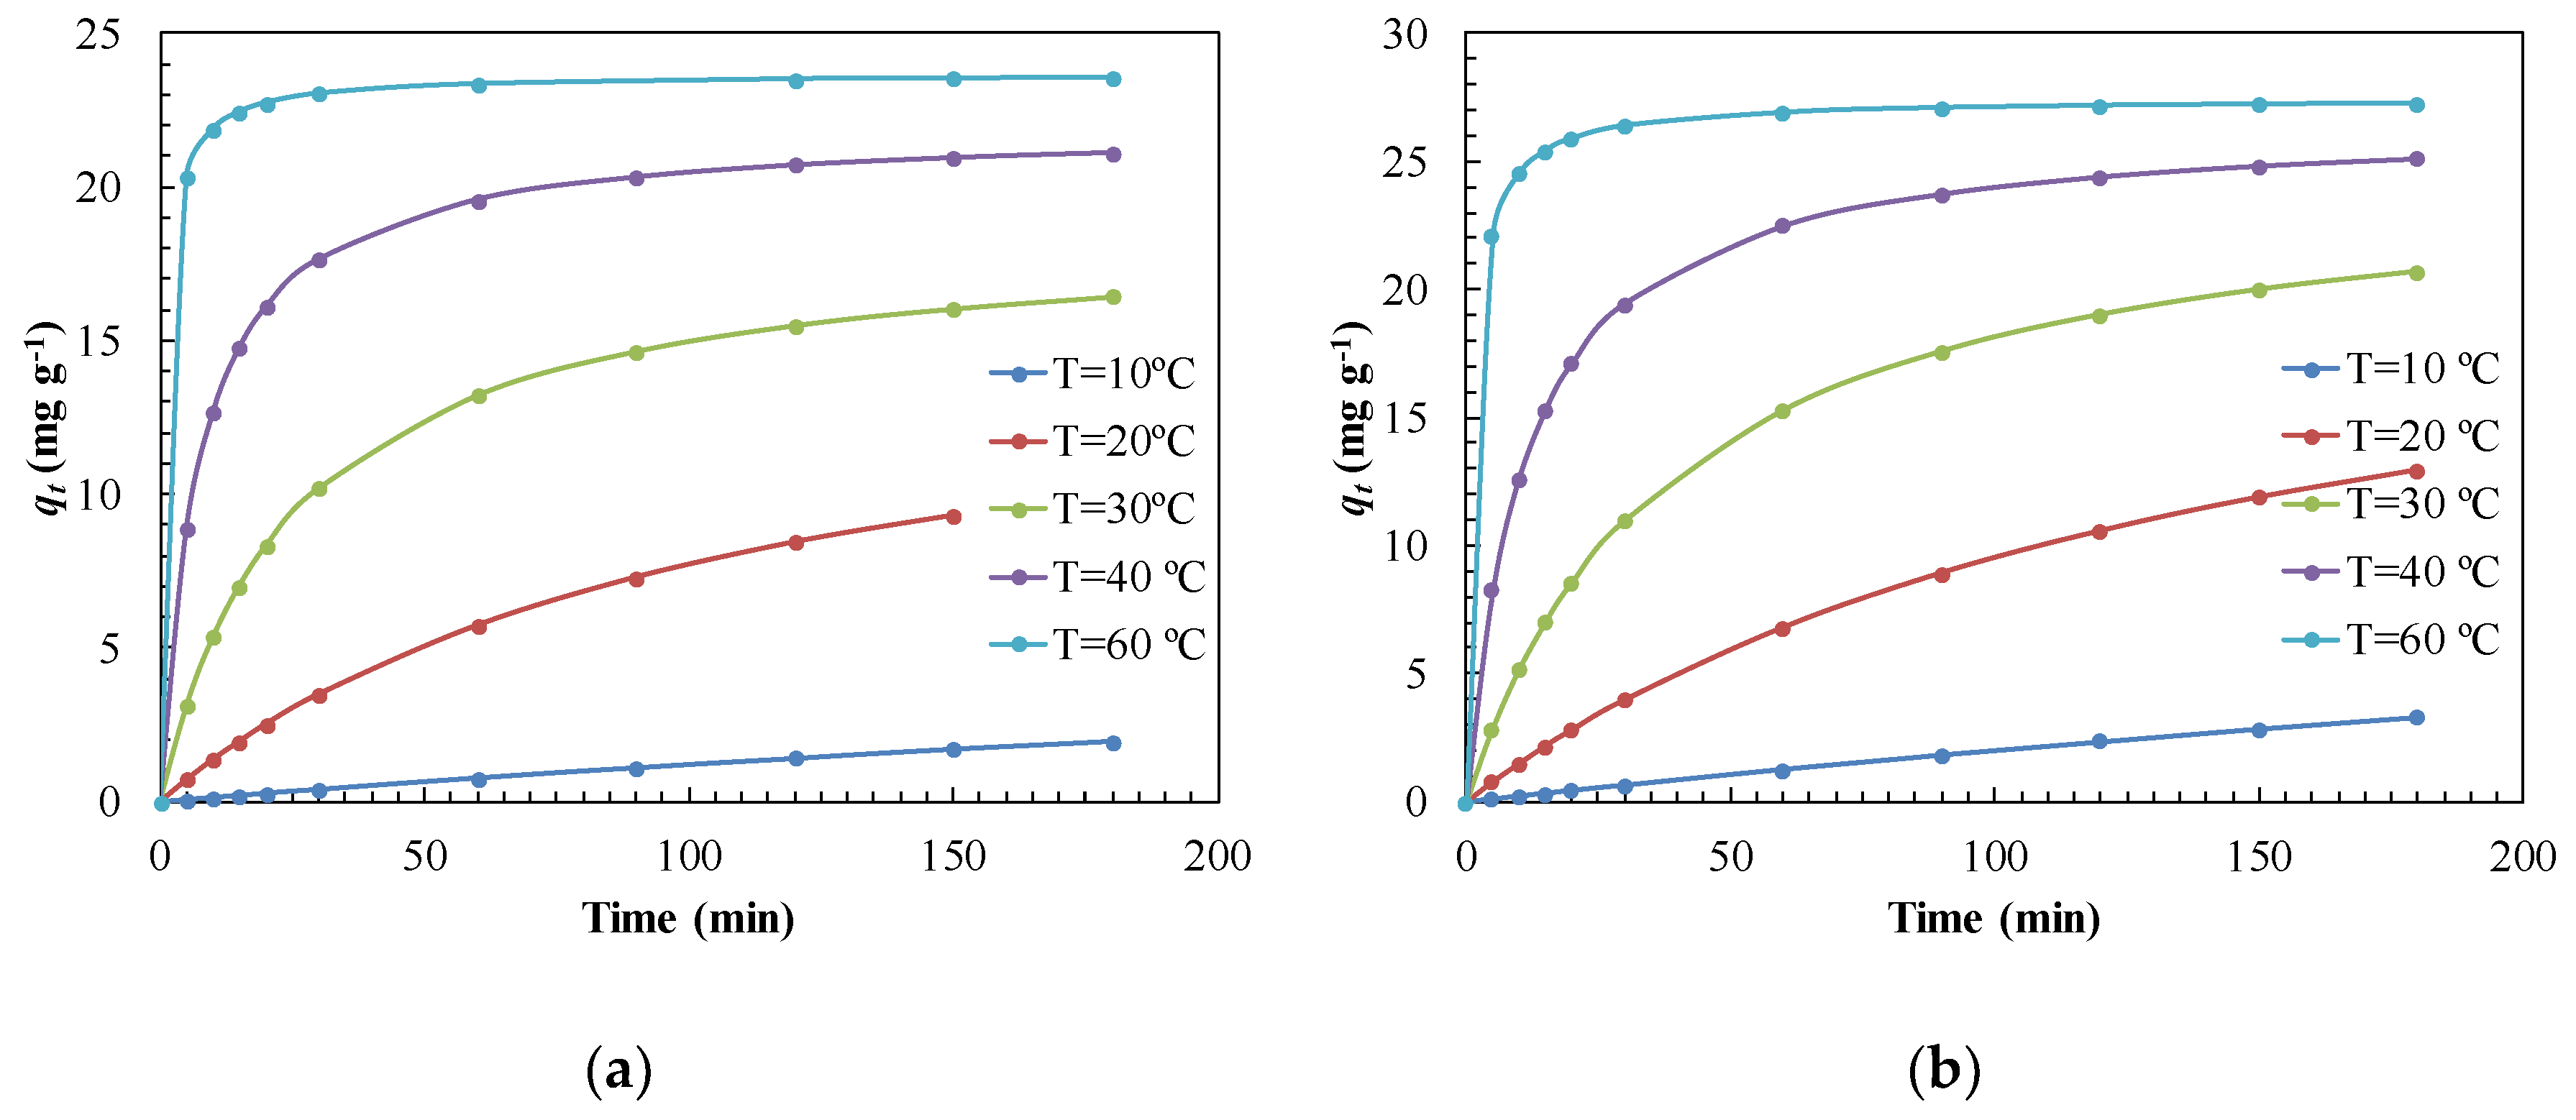
) kinetic results. Conditions: C0 = 22.0 mg L−1; T = 25.0 °C; P = 1.0 atm.
Water 11 00337 g006
Figure 7. Pseudo-first order kinetic constants, kapp, at different pHs, for photocatalytic degradation of aniline or benzothiazole with only TiO2-supported catalyst. Experimental conditions: C0 = 22.0 mg L−1; T = 25.0 °C; P = 1.0 atm.
Water 11 00337 g007
Figure 8. Experimental (dots) and pseudo-1st-order modelled ( Water 11 00337 i001
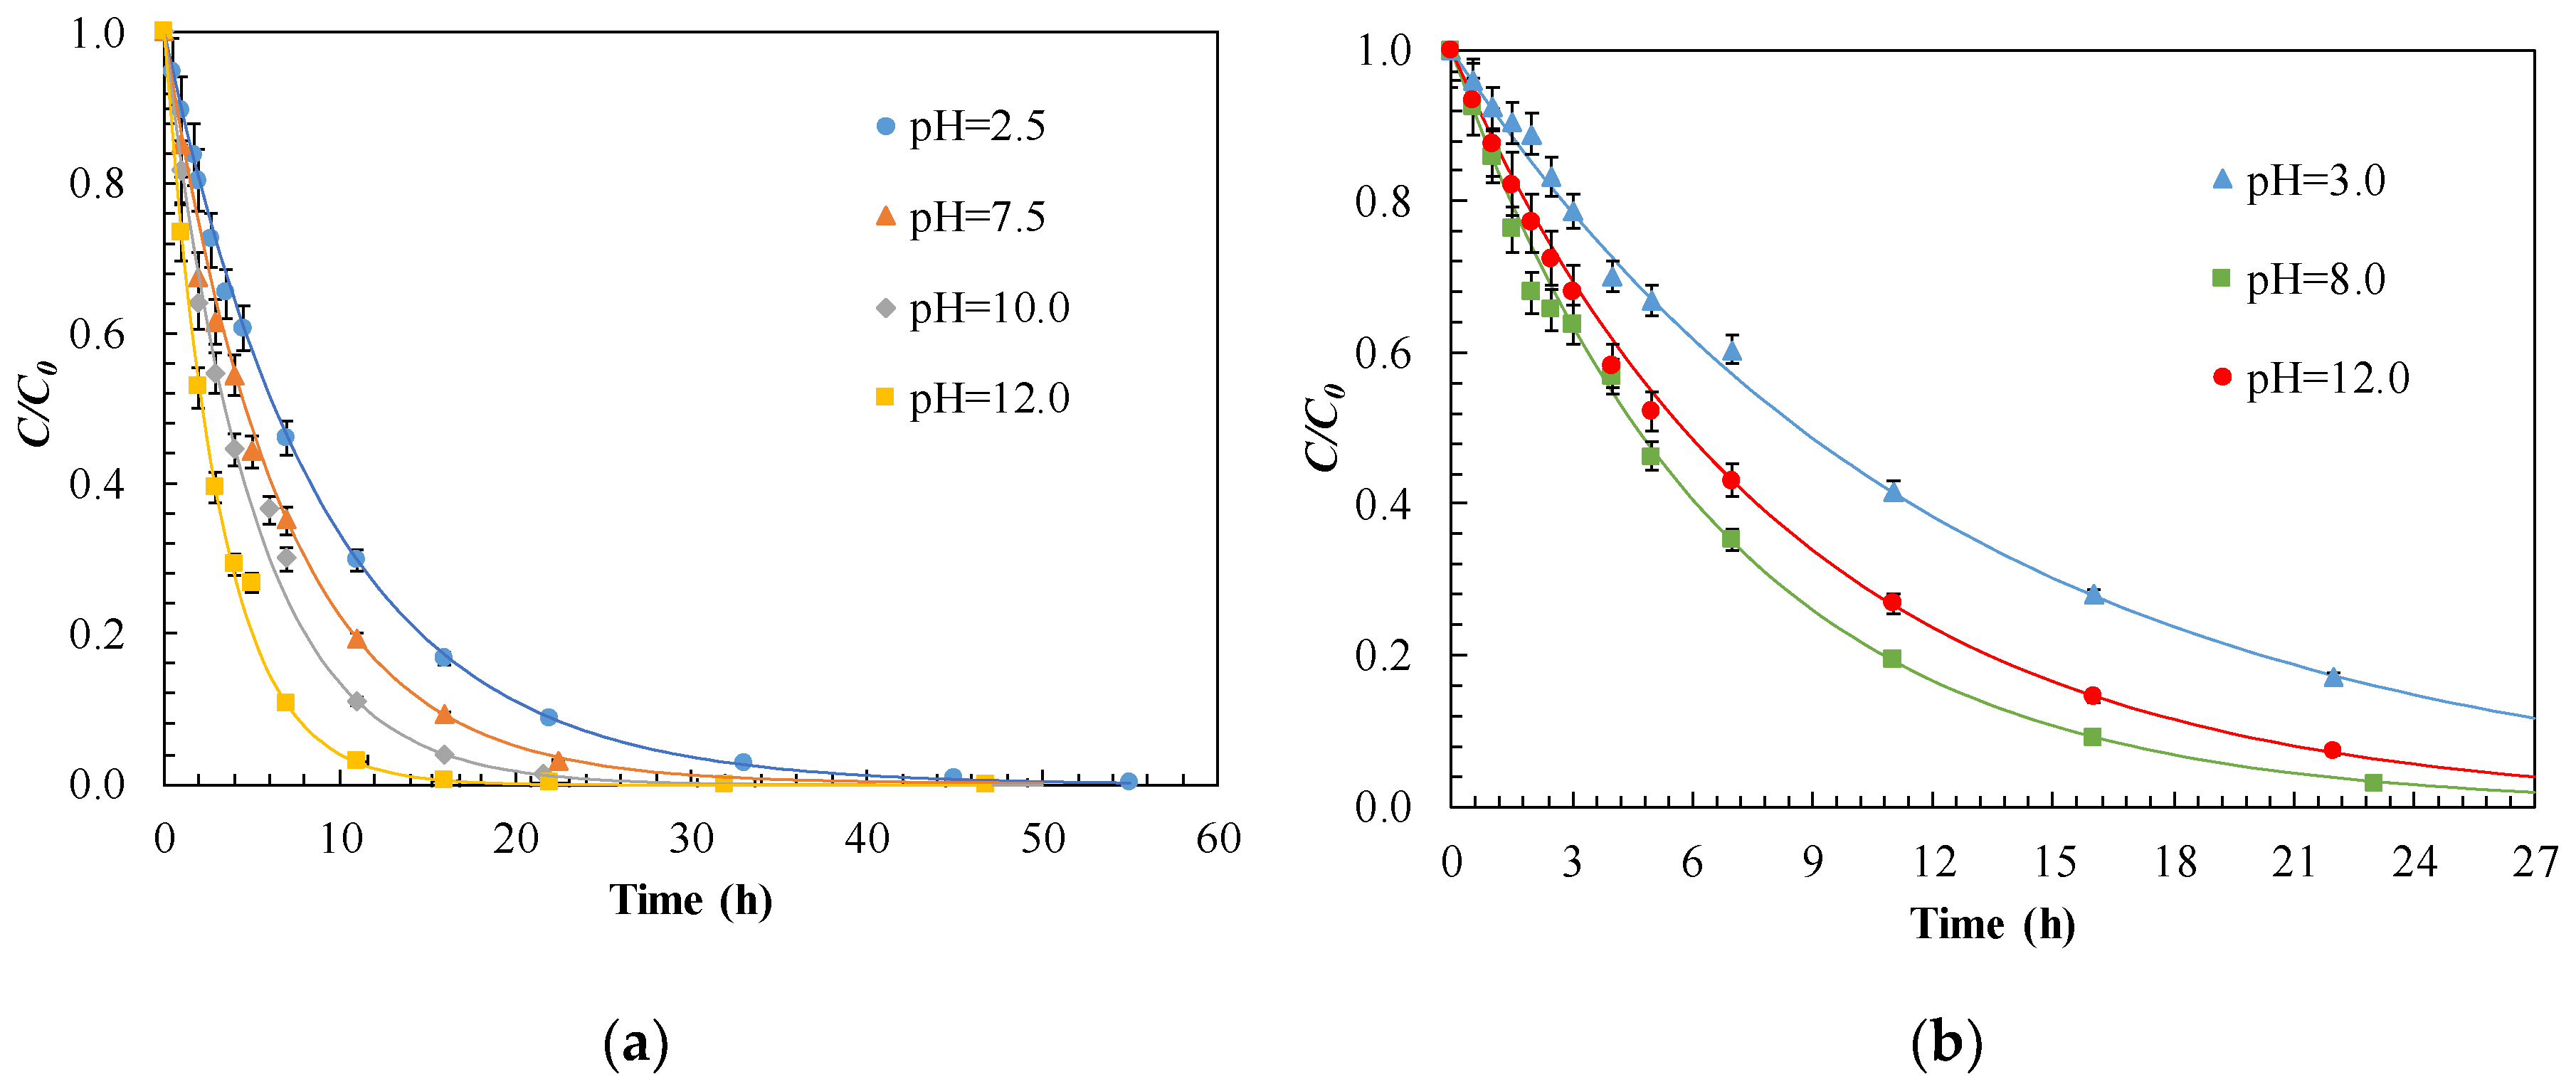
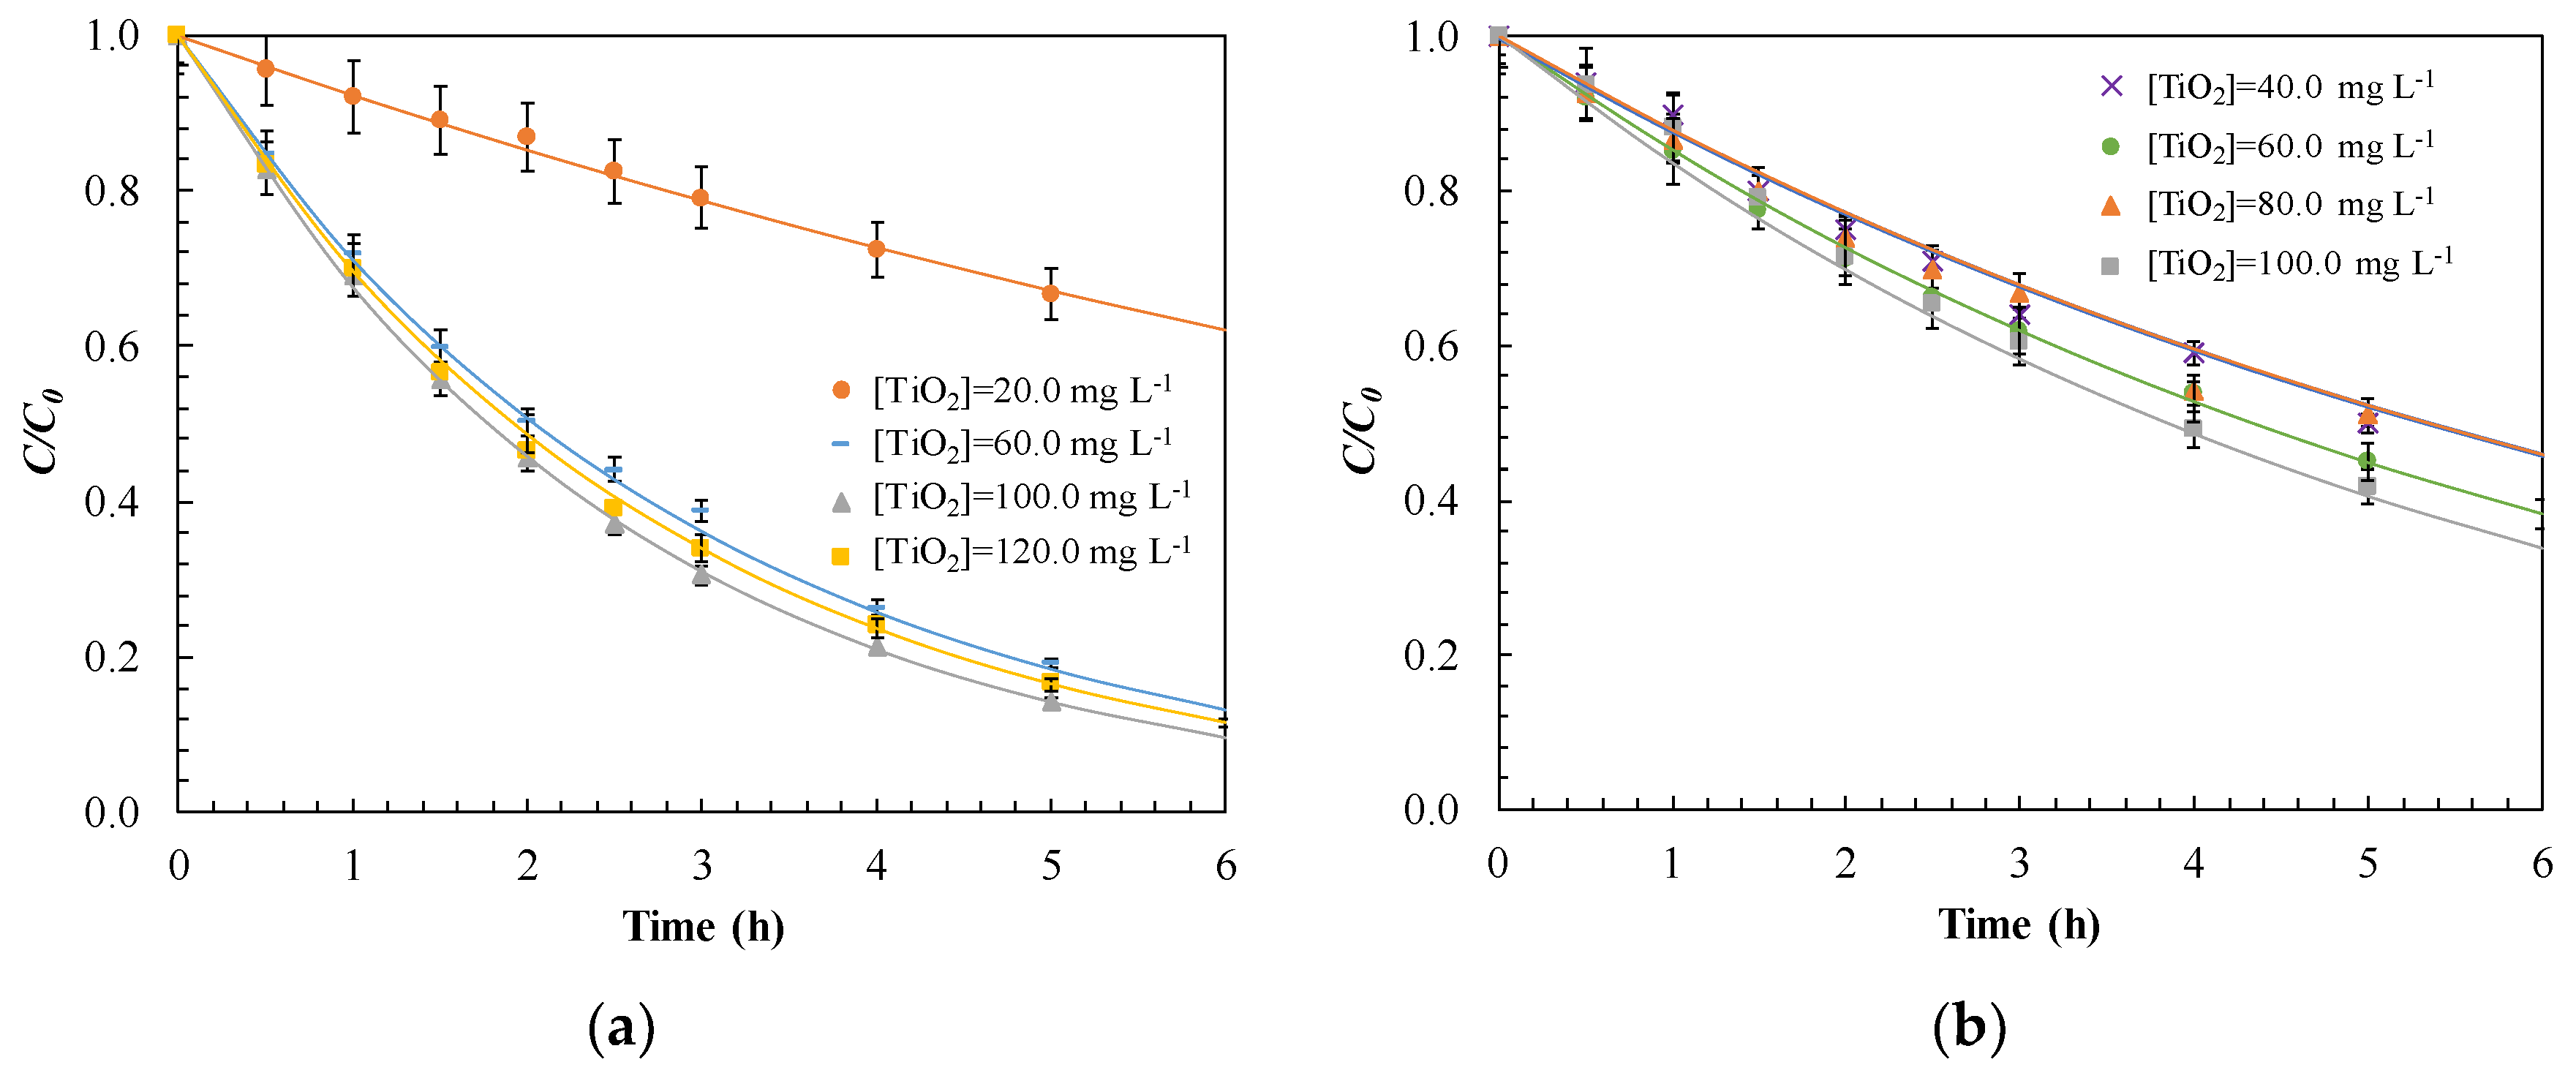
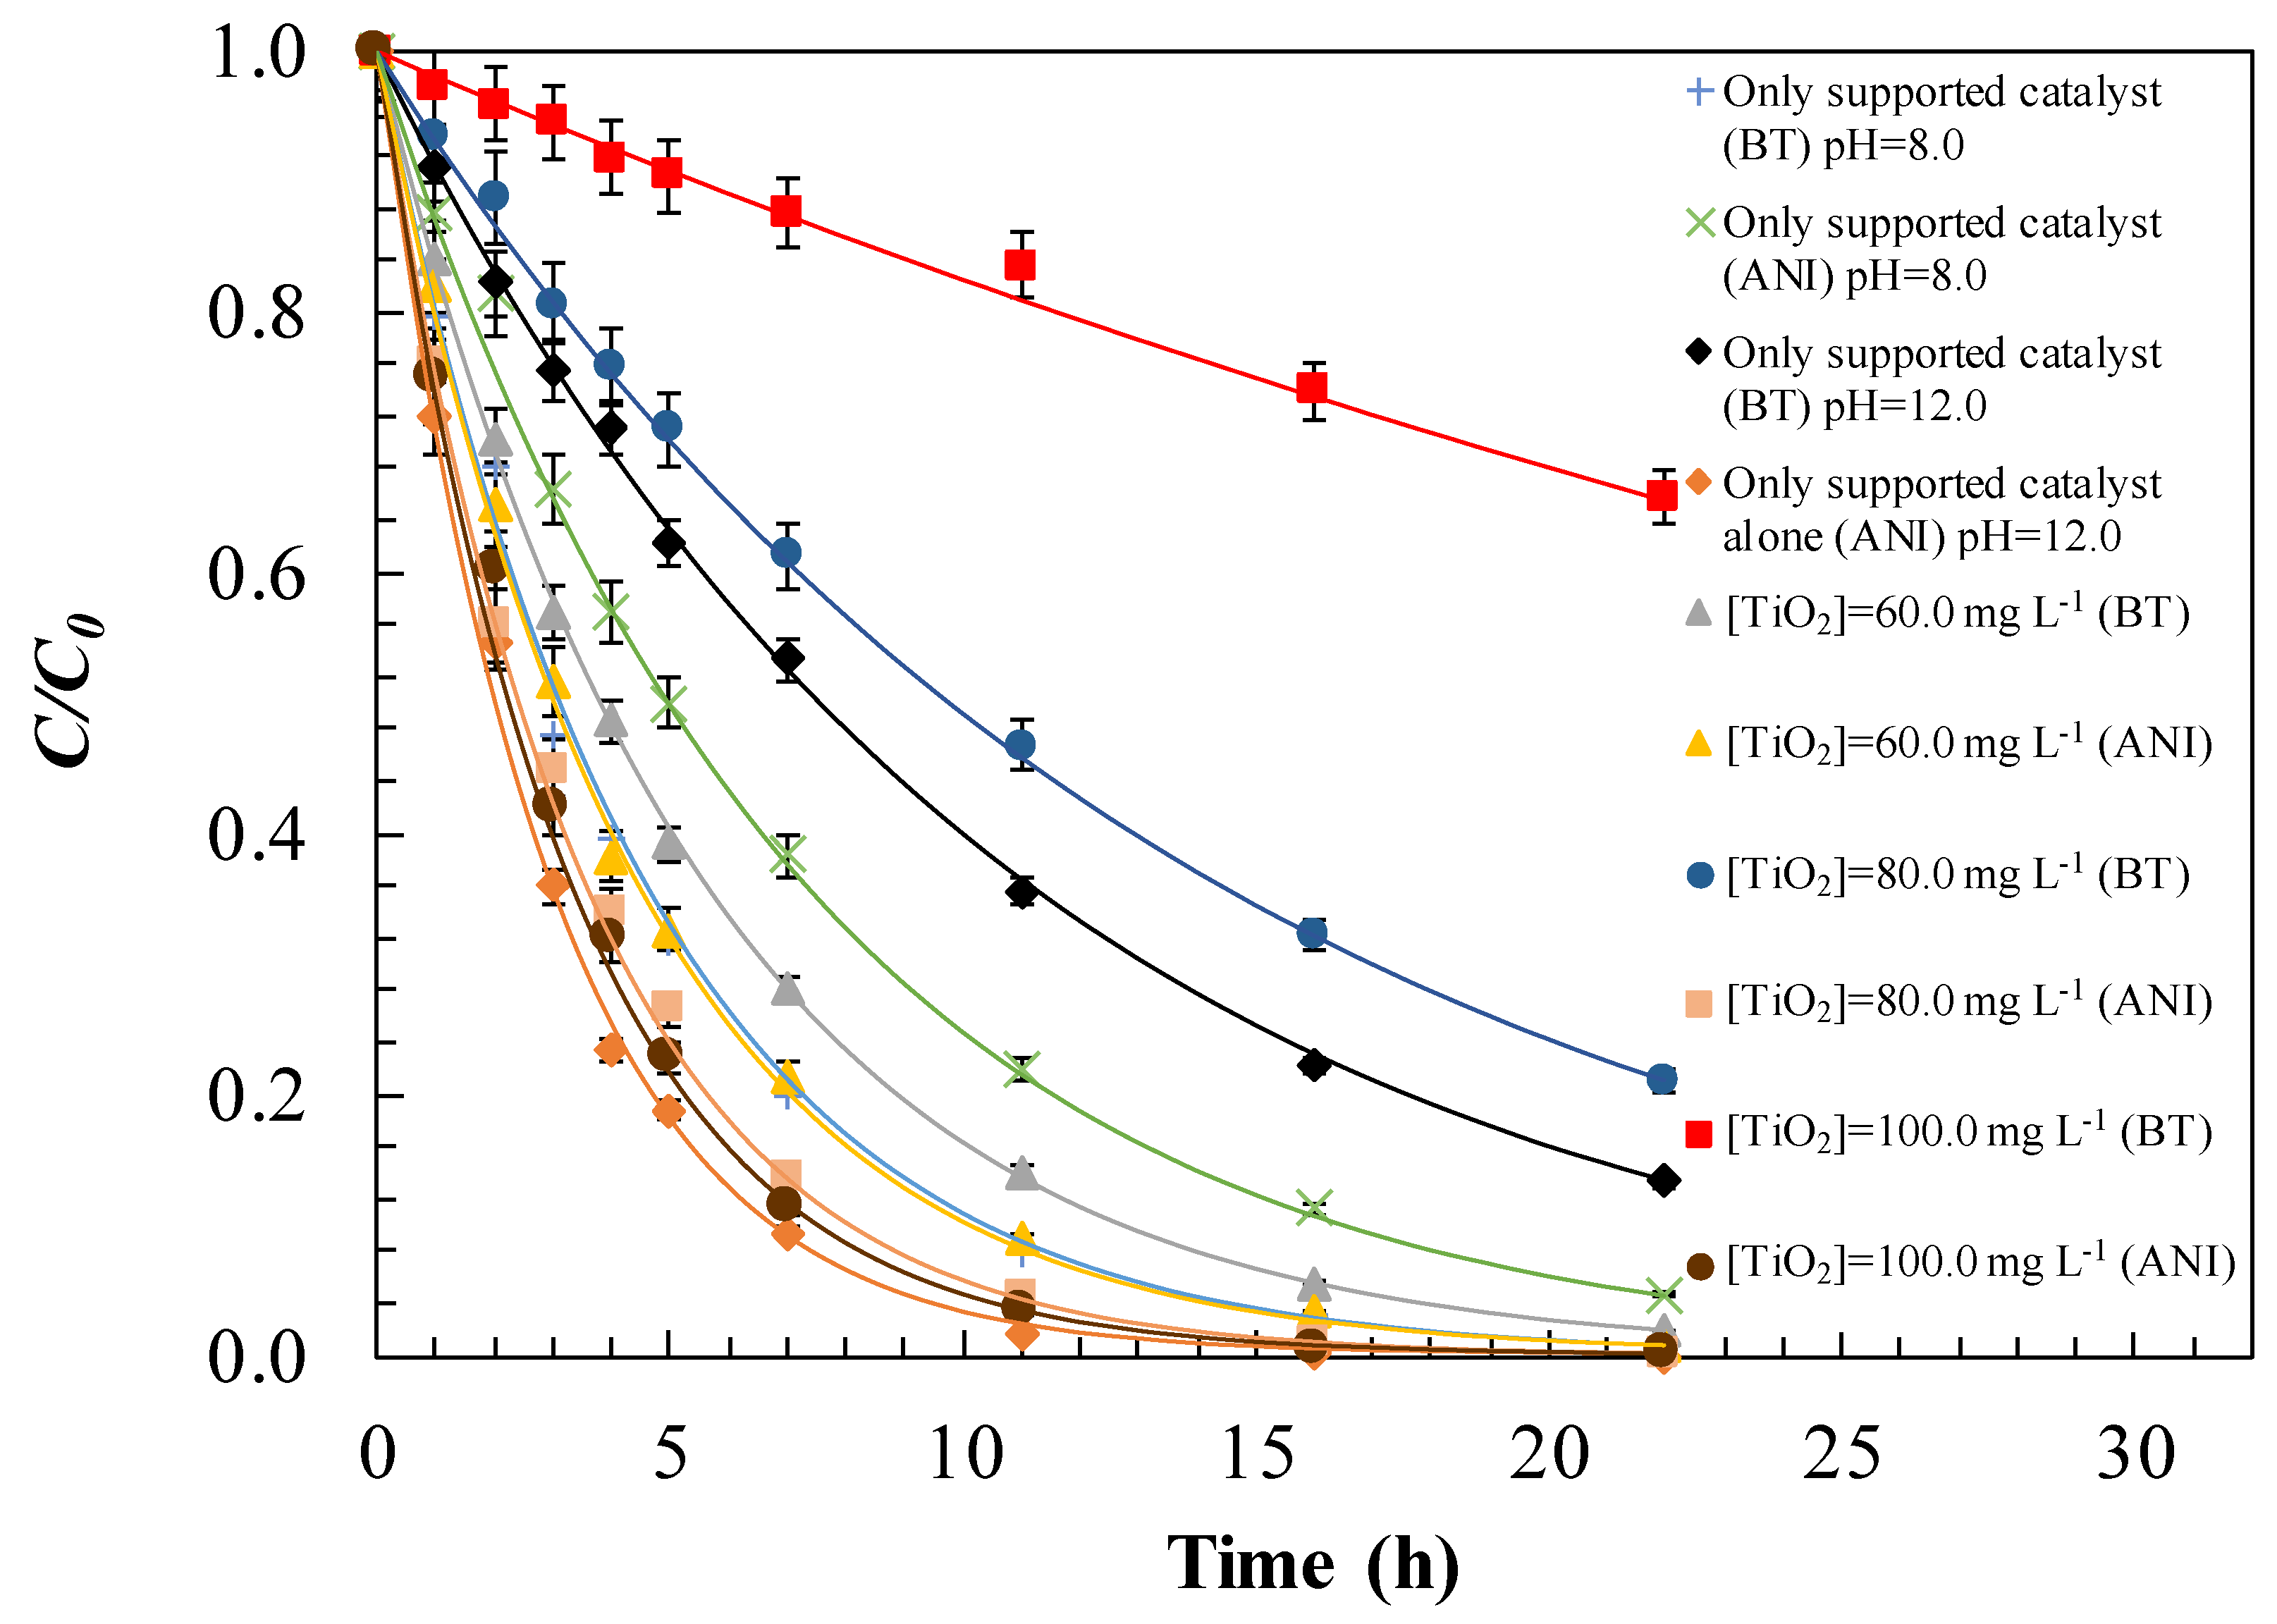
) kinetic results for photocatalytic degradation of: (a) aniline operating at pH = 12.0 or (b) benzothiazole operating at pH = 8.0 carrying out the treatment in a hybrid system with supported catalyst of TiO2 and different doses of TiO2 in suspension simultaneously. Experimental conditions: C0 = 22.0 mg L−1; T = 25.0 °C; P = 1.0 atm.
Water 11 00337 g008
Figure 9. Effect of the suspended TiO2 dosage on the pseudo-first order kinetic constants for the degradation of aniline or benzothiazole. Experimental conditions: C0 = 22.0 mg L−1; pH = 12.0 (aniline); pH = 8.0 (benzothiazole); T = 25.0 °C; P = 1.0 atm.
Water 11 00337 g009
Figure 10. Comparison between only supported and suspended-supported TiO2 for the degradation of: aniline or benzothiazole, through the experimental (dots) and modelled ( Water 11 00337 i001
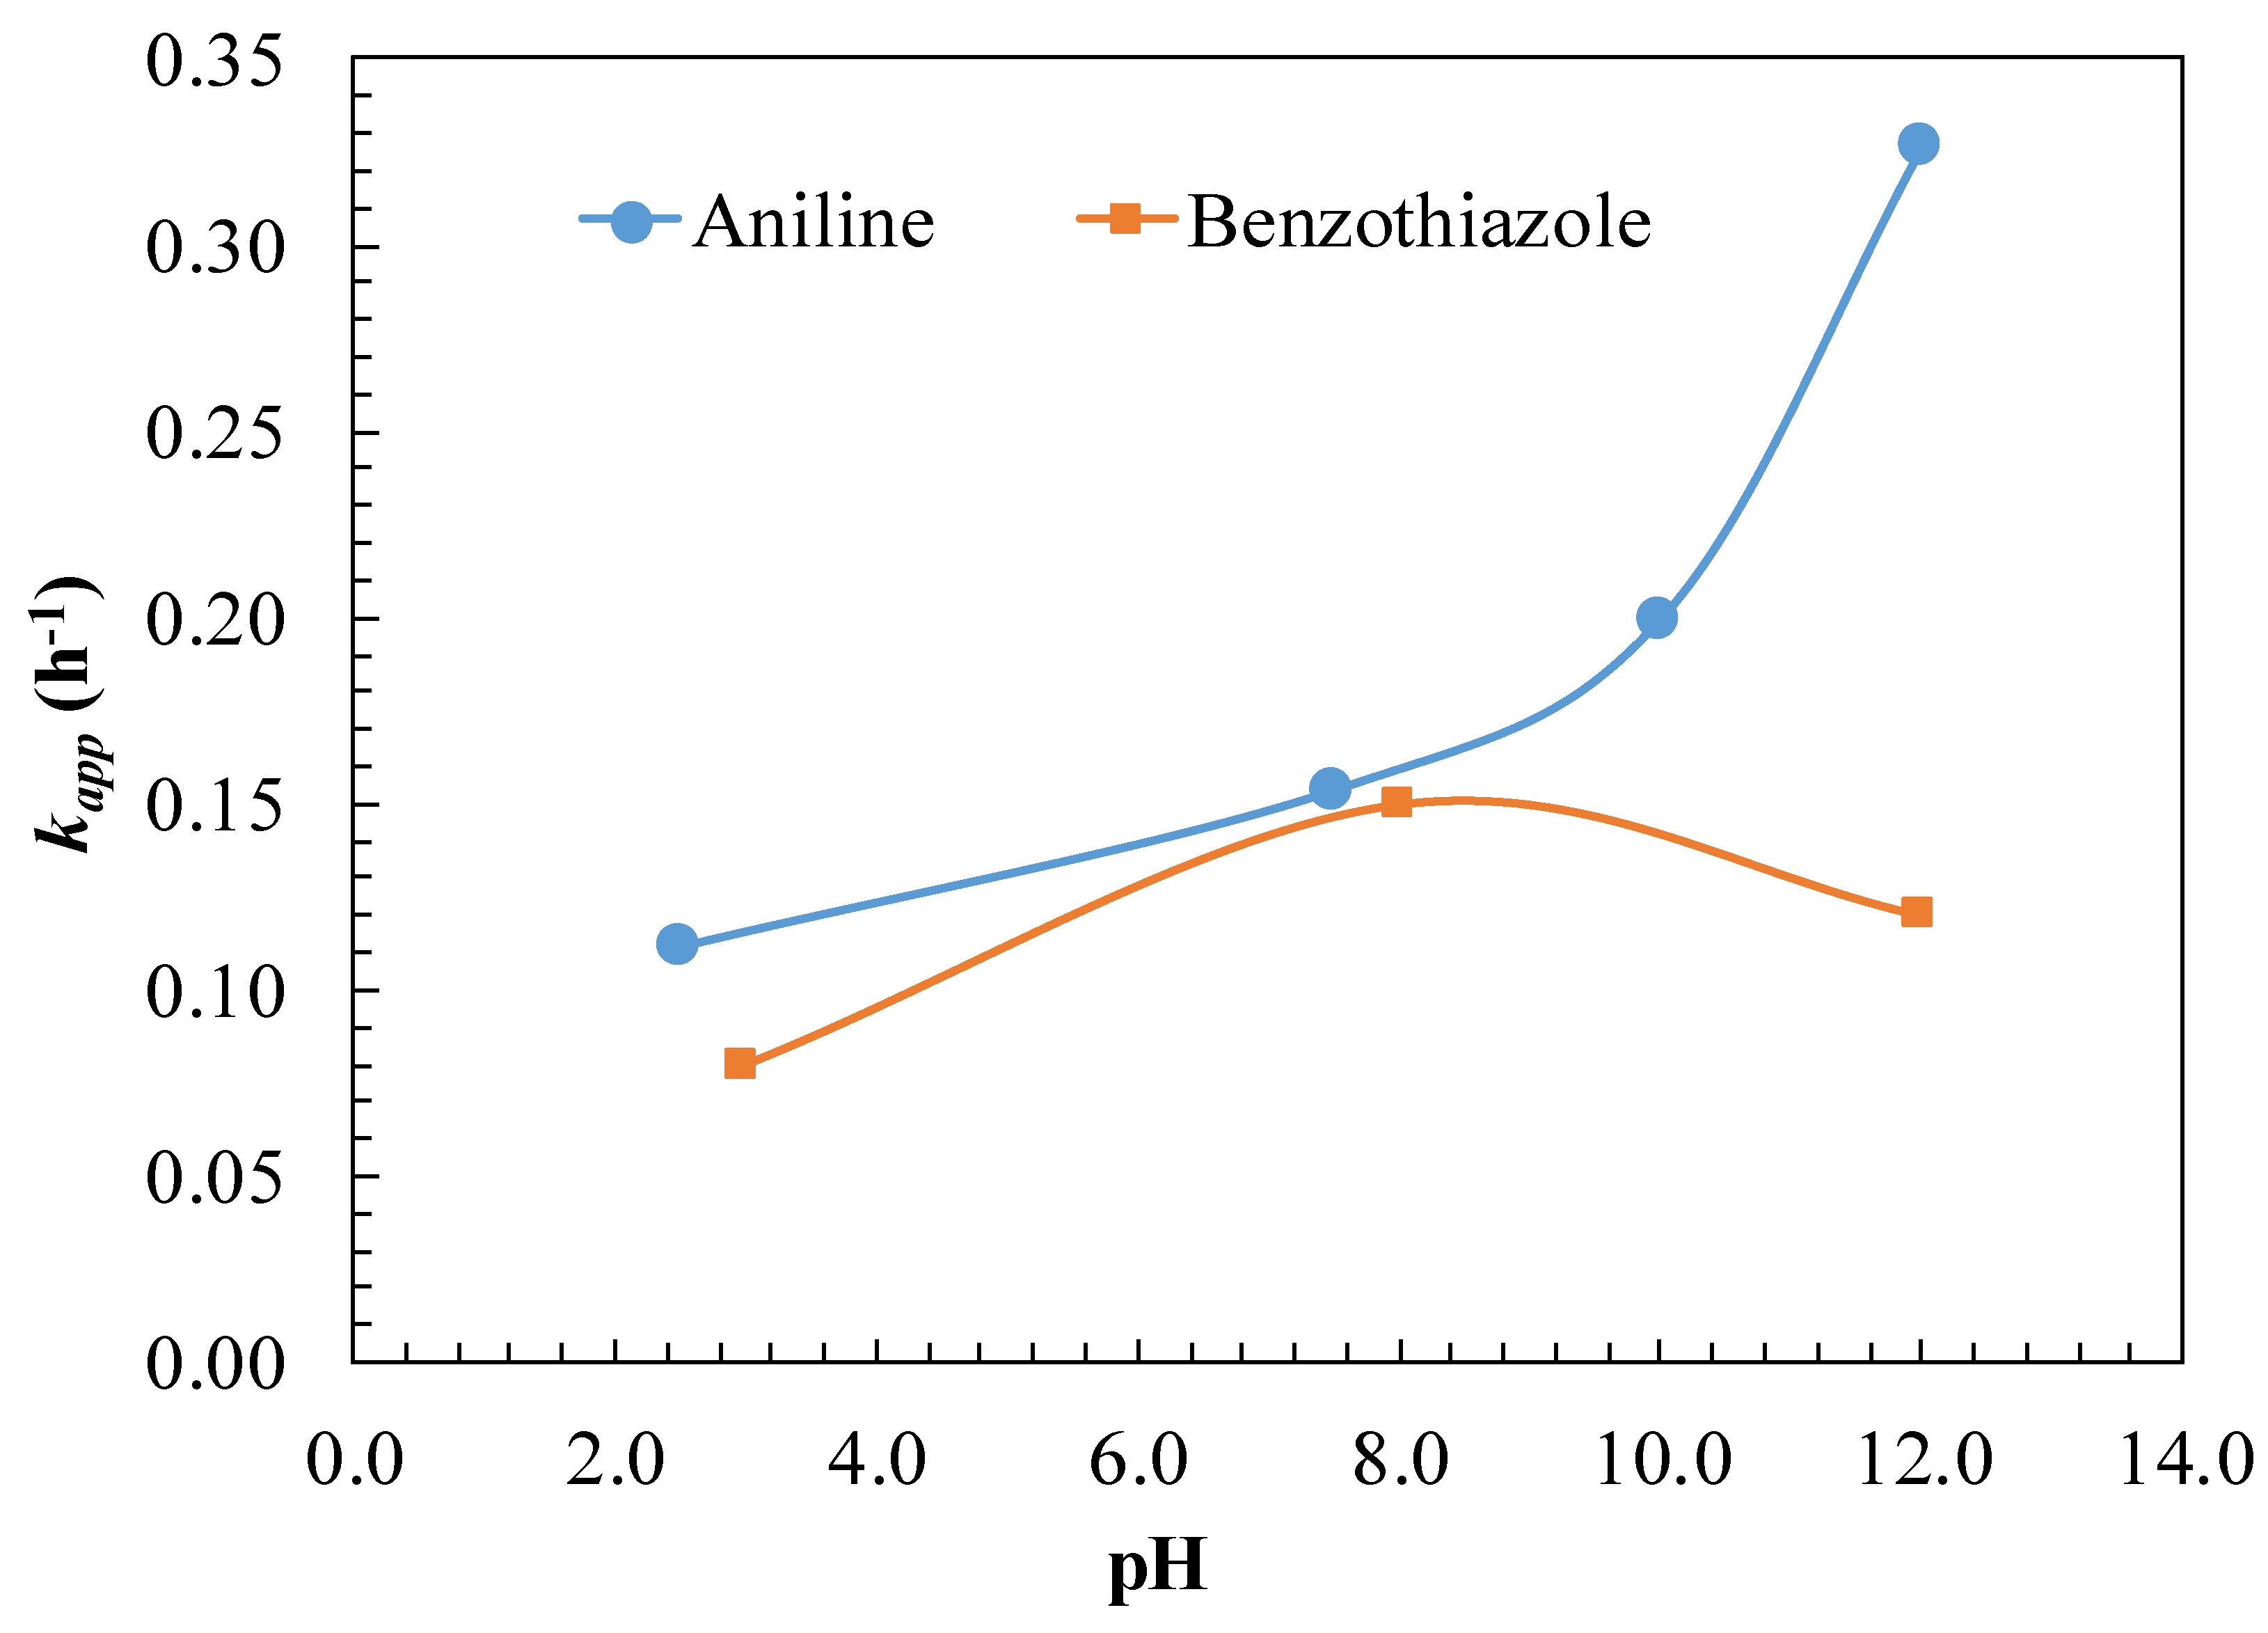
) pseudo-first order kinetics. Experimental conditions: C0 = 22.0 mg L−1; pH = 12.0 (aniline); pH = 8.0 (benzothiazole); T = 25.0 °C; P = 1.0 atm.
Water 11 00337 g010
Figure 11. Effect of the matrix on photocatalytic oxidation of aniline and benzothiazole using the supported or supported configuration with addition of TiO2 in suspension fitted to the pseudo-first order kinetic model ( Water 11 00337 i001
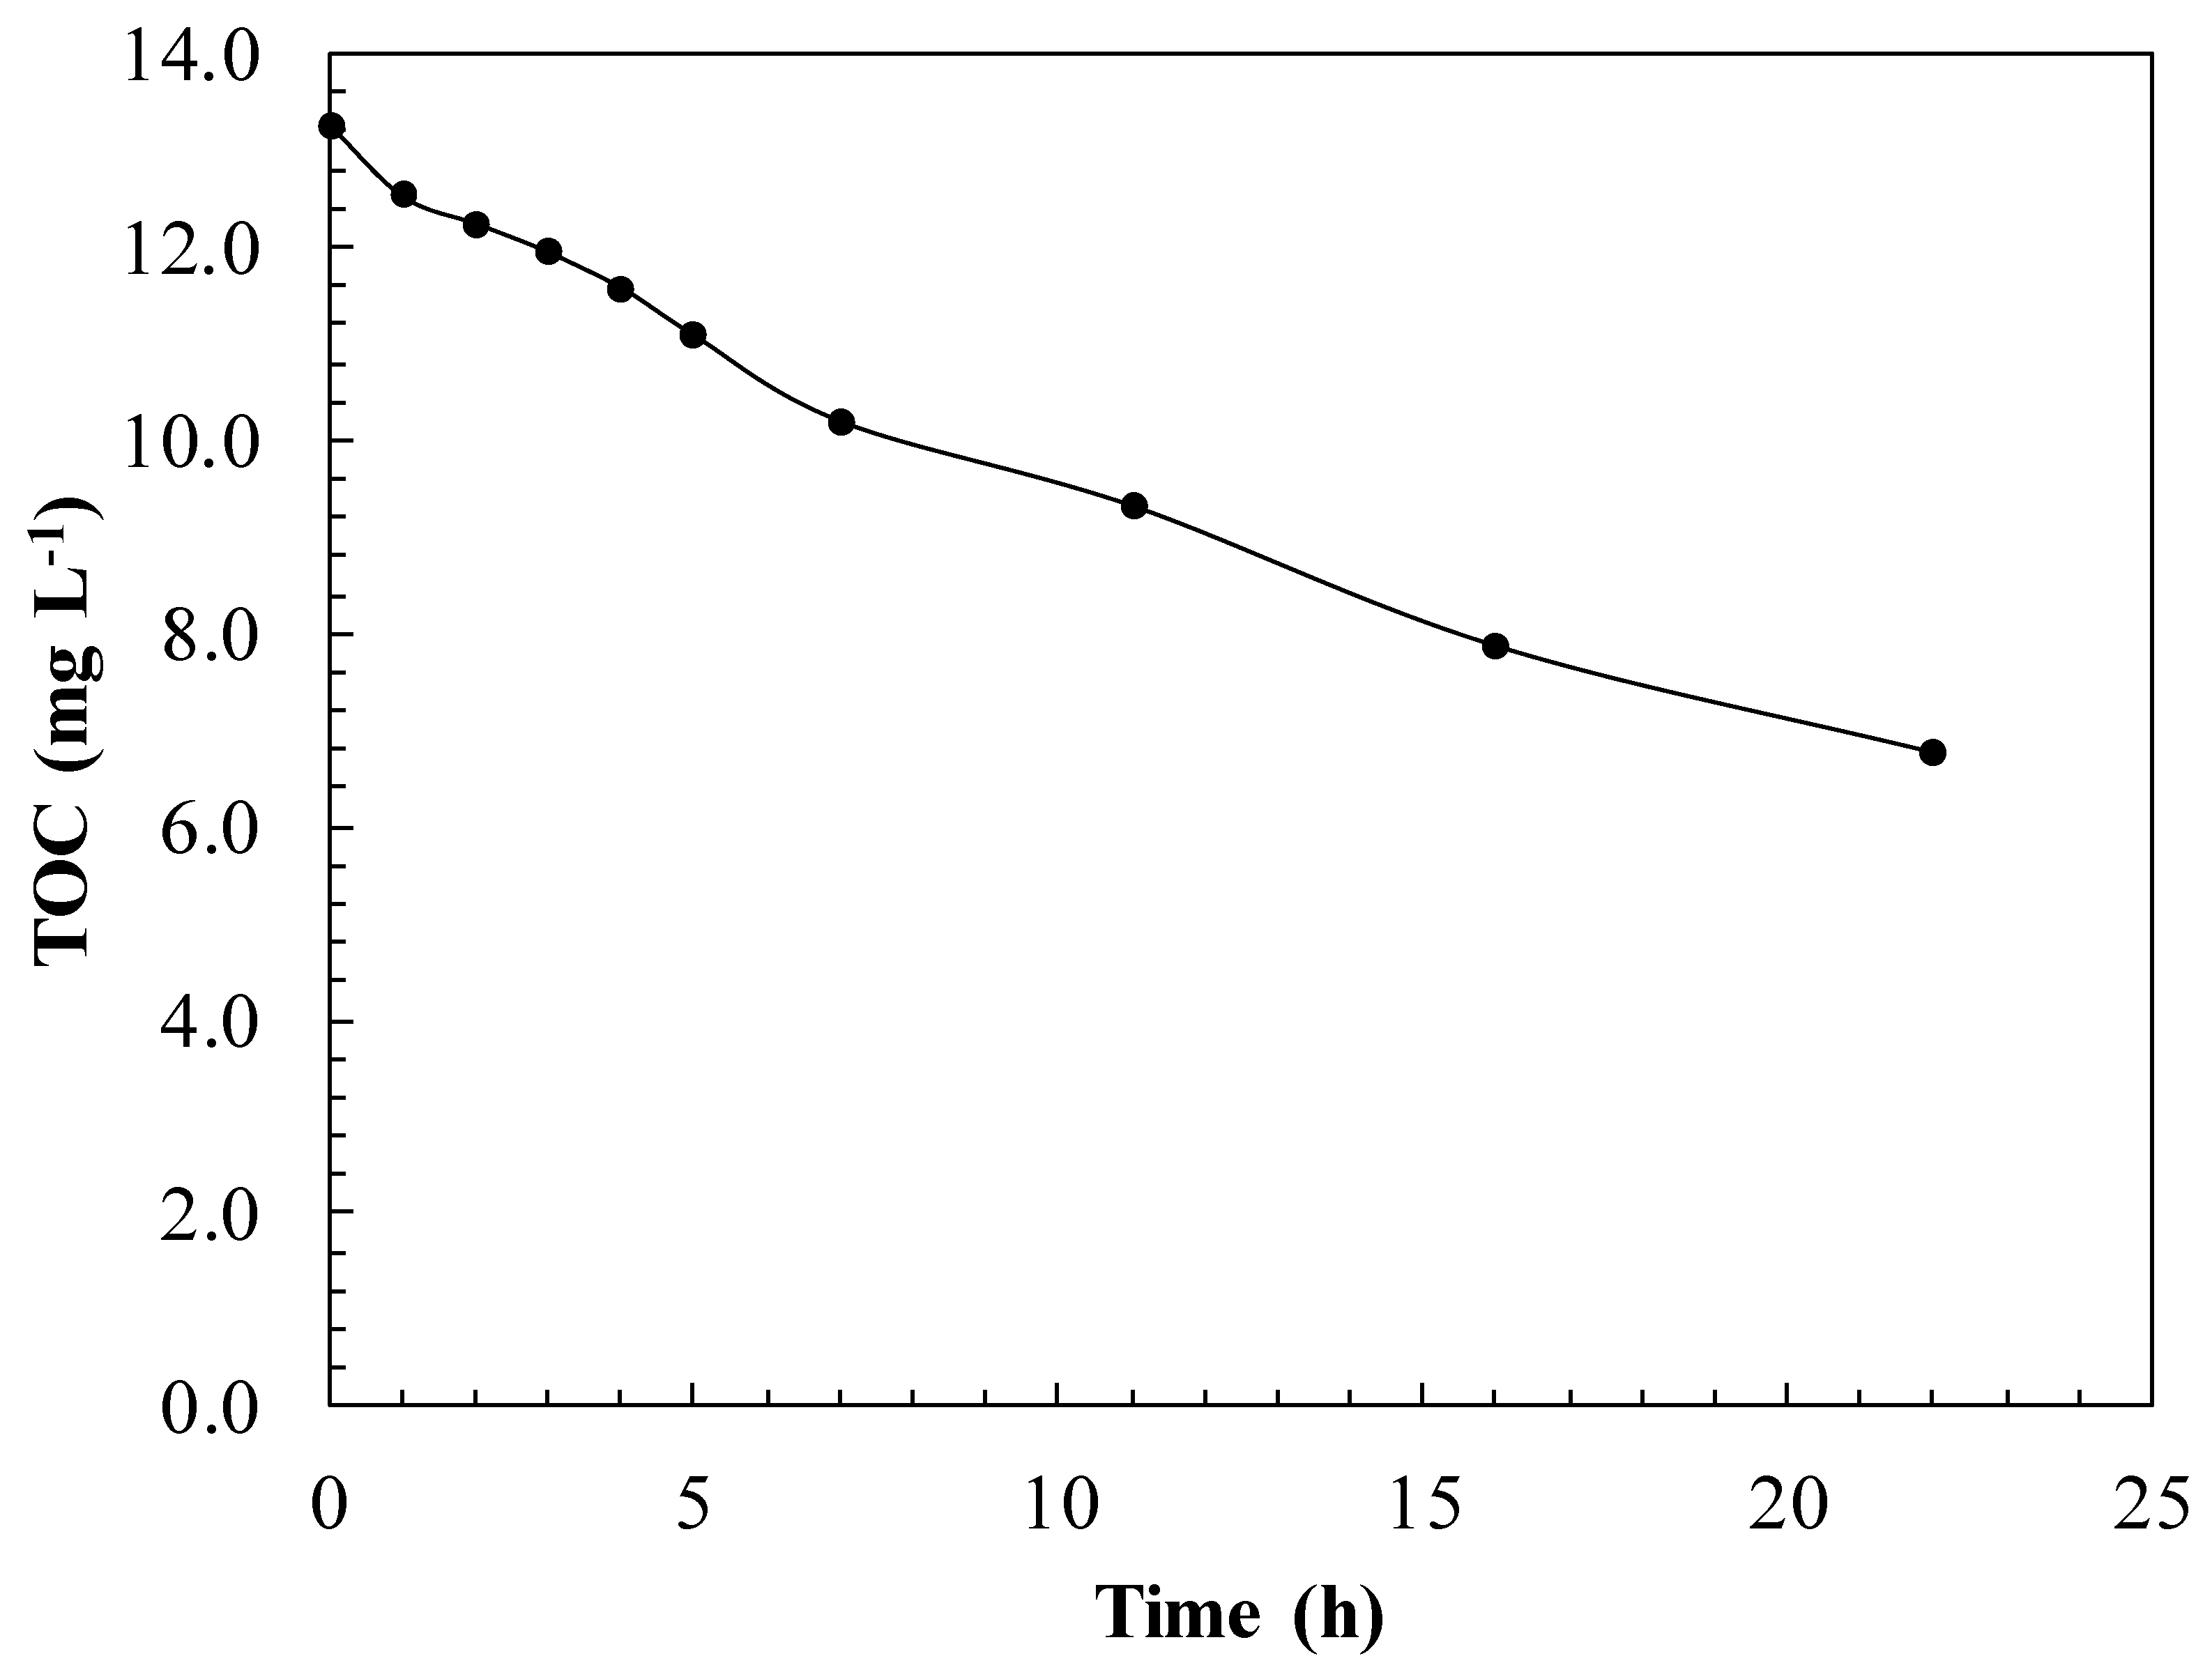
). Experimental conditions: C0 = 22.0 mg L−1; T = 25.0 °C; P = 1.0 atm.
Water 11 00337 g011
Figure 12. Photocatalytic oxidation of aniline and benzothiazole mixtures monitored by total organic carbon (TOC) with hybrid suspended-supported TiO2 configuration. Experimental conditions: C0 = 22.0 mg L−1; [TiO2] = 60.0 mg L−1; pH = 12.0; T = 25.0 °C; P = 1.0 atm.
Water 11 00337 g012
Figure 13. Electrical cost estimation for photocatalytic oxidation of mixtures of aniline and benzothiazole. Photoreactor variants: A and B, only supported TiO2 (pH = 8.0); C, D and E, supported-suspended TiO2 at pH = 12. Conditions: A (pH = 8.0), B (pH = 12.0), C ([TiO2] = 60.0 mg L−1), D ([TiO2] = 80.0 mg L−1), E ([TiO2] = 100.0 mg L−1).
Water 11 00337 g013
Table 1. Nature of adsorption from Langmuir isotherm fitted equilibrium data.
RL valuesAdsorption Nature
RL > 1Unfavourable
RL = 1Linear
0 < RL < 1Favourable
RL = 0Irreversible
Table 2. Values of adsorption isotherm models for adsorption of aniline or benzothiazole onto TiO2 at different temperatures.
AdsorbateAnilineBenzothiazole
Isotherm ModelTemperature, °CTemperature, °C
1020406010204060
Langmuir
KL, L mg−10.0360.1381.56813.3140.0970.4195.95861.528
qmax, mg g−120.0821.1422.6223.7525.0626.1126.8927.47
R20.9970.9970.9980.9940.9950.9970.9960.998
RL values0.560.250.033.4 × 10−30.320.100.017.38 × 10−4
Freundlich
KF, (mg g−1)(L mg−1)1/n0.842.9916.8223.143.4855.41325.29527.303
n1.281.6910.52131.582.002.9055.87555.56
R20.9860.9600.9280.8960.9060.8590.9370.926
Temkin
KT, L mg−10.3621.2432.1072.7270.9311.0352.0502.459
B1, kJ mol−14.344.785.426.115.56088.906810.11515.192
R20.9950.9940.9070.8950.9980.9740.9450.958
Dubinin-Radushkevich
qs, mg g−111.5417.8022.2623.7115.2823.6426.5727.44
β, mol2 kJ−217.4286.3150.7550.0801.9961.5330.0540.003
E, kJ mol−10.170.280.812.500.500.573.0512.70
R20.9900.9420.9650.9930.9080.9770.9670.999
Elovich
KE, L mg−10.0644.73318.41533.3600.3002.25424.89037.601
qmax, mg g−112.474.650.590.1611.152.210.310.03
R20.9840.9500.9620.9460.9630.7620.8280.952
Generalized
KG, mg L−127.798.060.640.0810.3395.2770.1680.016
N1.071.041.011.001.361.281.211.08
R20.9990.9890.9860.9950.9030.9200.9520.991
Table 3. Kinetic parameters for the adsorption of aniline or benzothiazole onto TiO2 at different temperatures.
AdsorbateAnilineBenzothiazole
Kinetic ModelTemperature, °CTemperature, °C
10203040601020304060
Pseudo-1st order
k1, min−10.0010.0060.0260.0530.0840.0010.0050.0190.0430.097
R20.9490.9790.9550.9390.9660.9690.9400.9520.9600.962
Pseudo-2nd order
k2, g mg−1 min−10.00020.00060.00210.00620.05137.87 × 10−50.00030.0010.00340.0305
R20.9930.9960.9990.9910.9980.9950.9970.9980.9910.999
Intraparticle diffusion
kdif, mg g−1 min−0.50.170.891.161.831.670.291.141.883.451.27
C, mg g−10.461.382.516.7116.590.782.070.291.3120.01
R20.9860.9980.9320.8810.7560.9840.9980.9790.9750.880
Ri0.980.930.890.700.300.970.920.990.950.27
Elovich
αe, mg g−1 min−10.050.431.617.872.18 × 1050.070.471.554.726.00 × 103
βe, g mg−13.6540.4970.2420.2310.6563.3660.5700.2220.1590.419
R20.8800.9320.9950.9780.9500.9310.9480.9810.9990.956
Bangham
kB, g0.365.5844.03174.70469.670.586.4744.35193.85573.80
A0.9350.7550.4450.2200.0360.9500.7570.4840.2350.035
R20.9990.9900.9460.8840.8000.9990.9940.9730.9380.896
Table 4. Initial adsorption factor means from intraparticle diffusion kinetic model fitted kinetic data.
Ri Values
Ri = 1No exist initial adsorption
0.9 < Ri < 1Weak initial adsorption
0.5 < Ri < 0.9Intermediately initial adsorption
0.1 < Ri < 0.5Strong initial adsorption
Ri < 0.1Approaching complete initial adsorption
Table 5. Activation energy and thermodynamic parameters of aniline or benzothiazole onto TiO2.
AdsorbateT
°C
KL
L mol1
ΔH
kJ mol1
ΔS
J mol1 K1
ΔG
kJ mol1
Ea
kJ mol1
k0
Aniline103.35 × 10392.78395.13−19.1189.234.92 × 1012
201.29 × 10⁴−23.06
401.46 × 10⁵−30.96
601.24 × 10⁶−38.86
Benzothiazole101.31 × 104101.26436.41−22.3193.671.44 × 1013
205.67 × 10⁴−26.68
408.05 × 10⁵−35.41
608.32 × 10⁶−44.13
Table 6. Determined kinetic parameters of adsorption and photocatalysis processes for the removal of aniline or benzothiazole with TiO2 catalyst. Experimental conditions: C0 = 22.0 mg L−1; T = 25.0 °C; P = 1.0 atm; [TiO2] = 100.0 mg L−1; pH = 12.0 (aniline removal); pH = 8.0 (benzothiazole removal).
PollutantAnilineBenzothiazole
Kinetics ModelProcess
AdsorptionPhotocatalysis 1AdsorptionPhotocatalysis 1
Pseudo-1st-order
k1 (min−1)0.01240.00650.00970.0031
R20.9630.9990.9570.997
Pseudo-2nd-order
k2 (g mg−1 min−1)0.00350.000810.00057.39 × 10−6
R20.9990.8890.9970.864
1 Adsorption process with simultaneous photocatalysis.

