Biological Treatment of Wastewater from Pyrolysis Plant: Effect of Organics Concentration, pH and Temperature
by
 , , , and
Luca Di Palma
1 ,
,
Irene Bavasso
1,*,
Mauro Capocelli
2 ,
,
Paolo De Filippis
1 and
Vincenzo Piemonte
2 1
Department of Chemical Engineering Materials & Environment, Sapienza University of Rome, Via Eudossiana, 18, 00184 Rome, Italy
2
Faculty of Engineering, University Campus Biomedico of Rome, Via Alvaro del Portillo, 21, 00128 Rome, Italy
*
Author to whom correspondence should be addressed.
Water 2019, 11(2), 336; https://doi.org/10.3390/w11020336
Submission received: 19 December 2018
/
Revised: 6 February 2019
/
Accepted: 12 February 2019
/
Published: 16 February 2019
(This article belongs to the Special Issue Technologies for Water Reuse: Current Status and Future Challenges)
Abstract
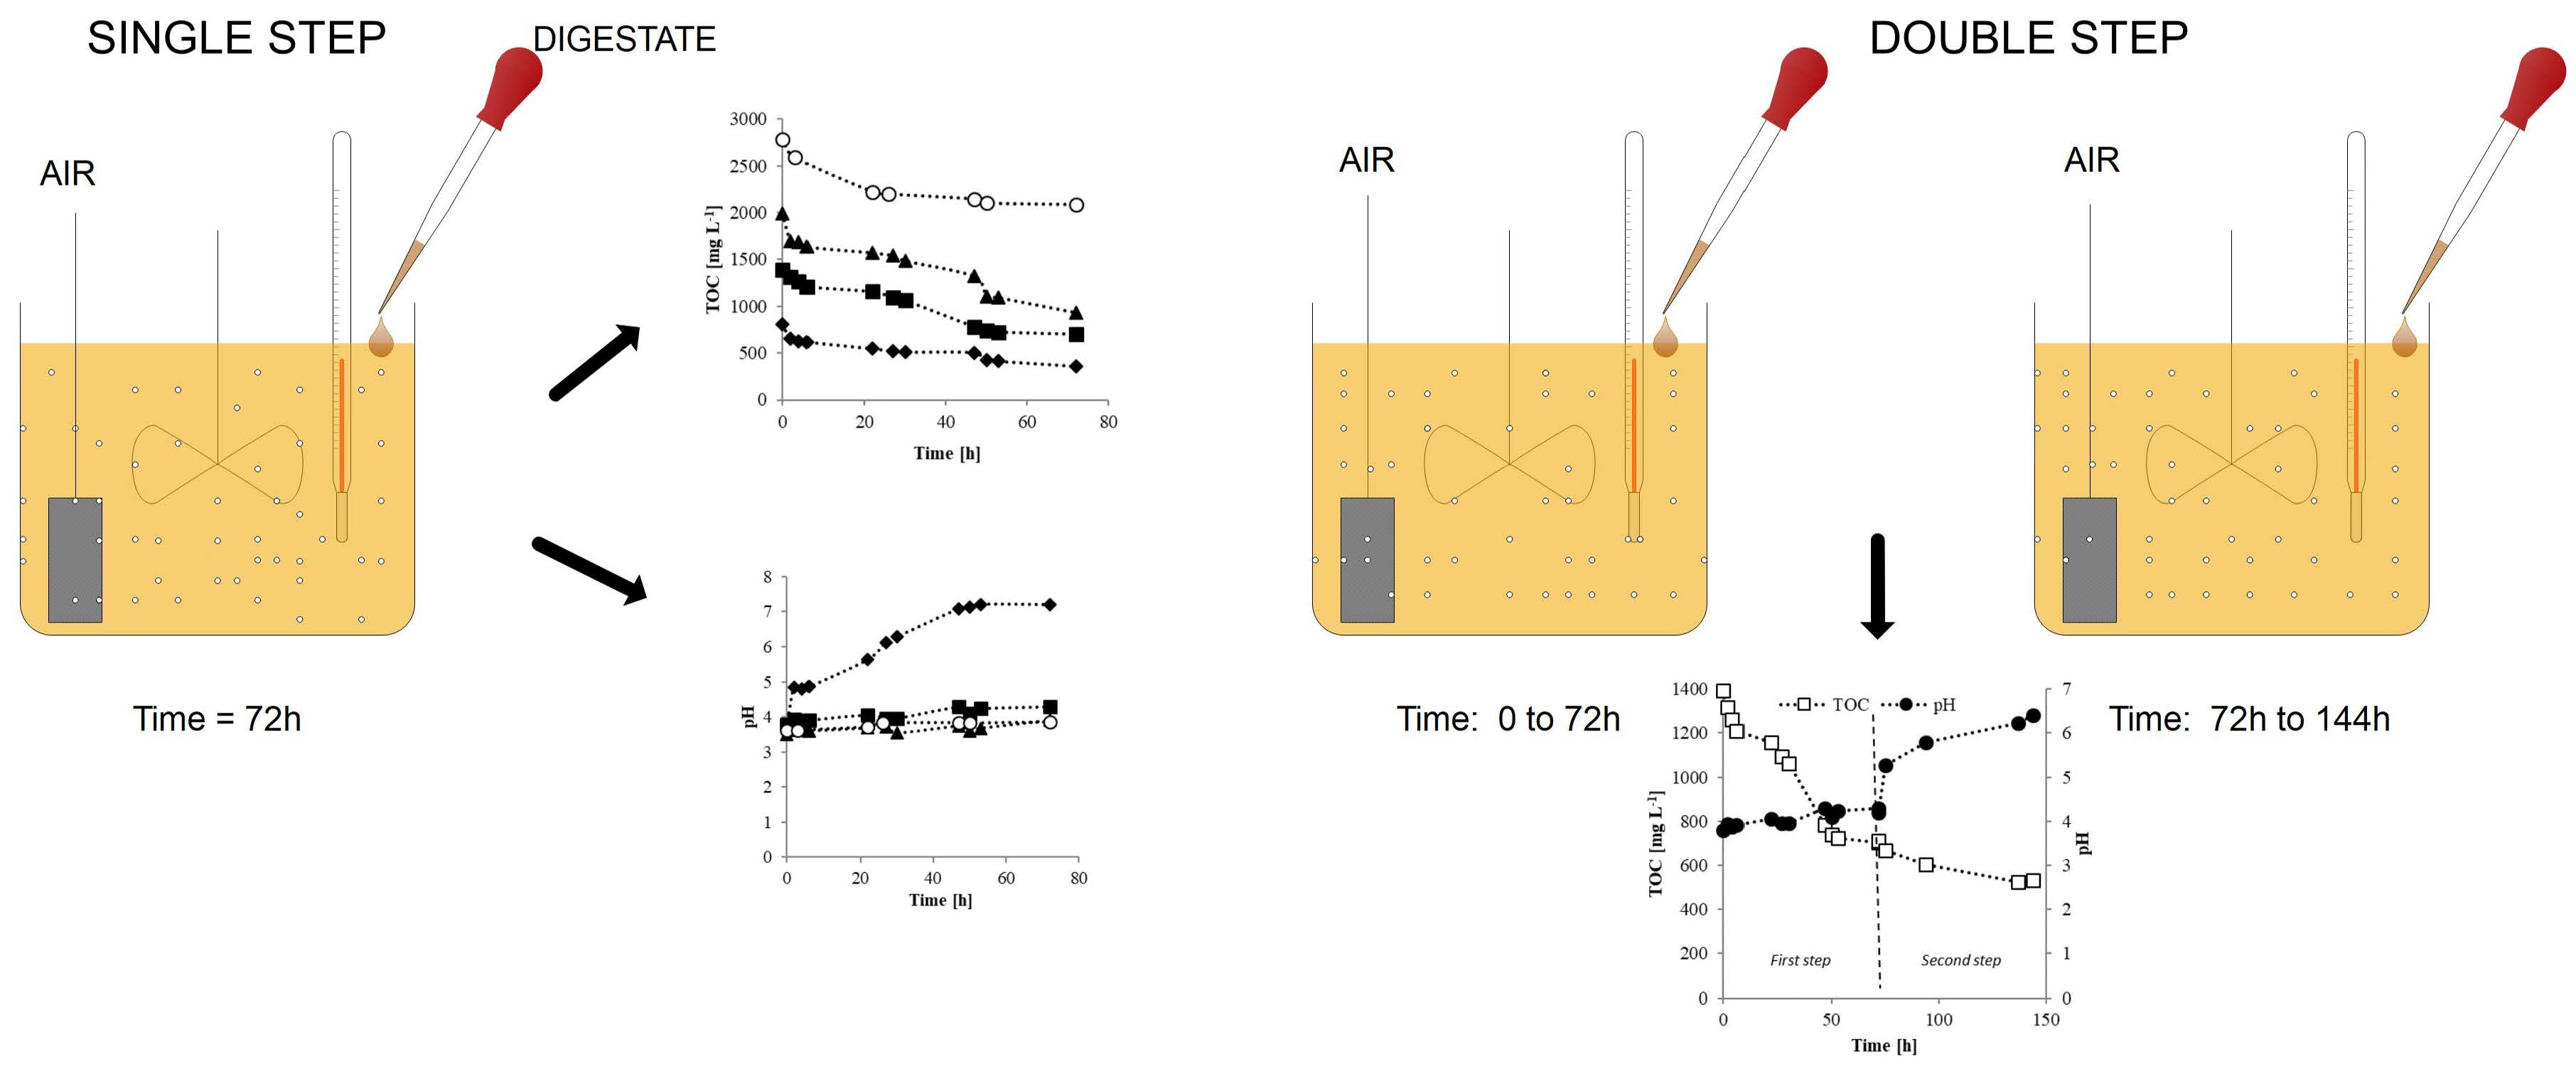
:The biological treatment of the aqueous residue produced during poplar wood pyrolysis was investigated. The biological treatment experiments were carried out at two different pH conditions (controlled at 7, uncontrolled) in batch mode at three different temperatures (15 °C, 25 °C and 30 °C) and initial total organic carbon of the water ranging from 800 mg/L to 2800 mg/L. Results show that a substantial removal of organic carbon could be achieved in aerobic conditions after biomass acclimation. After 72 h of treatment, total organic carbon (TOC) removal mean values of 49.47% and 53.03% were observed at 30 °C for solution at 1400 and 2000 mg/L initial TOC, respectively. In the case of 1400 mg/L, a further mineralization (61.80%) was achieved during 144 h of treatment, by using a two-step process. A kinetic study of the process was also made, showing that organics mineralization followed a first-order kinetic model.

1. Introduction
Pyrolysis is the thermal decomposition of organic matrices in the absence of oxidizing agents, with the production of an array of solids, liquid and gaseous products [1]. The interest in pyrolysis is mainly related to the conversion of solid biomass and organic wastes into liquid products (bio-oil and water containing soluble organics compounds), thus showing great advantages in terms of transport and storage [2]. Seeking to achieve an environmentally sound production based on the principles of circular economy, pyrolysis bio-oil can be successfully used to replace fossil fuel for heat and power generation, providing a renewable source of energy. In addition, the solid residue (char) could be used as cheap carbon-based material precursor for the production of activated carbon [3,4,5], the properties of which depend on the raw materials and activation processes used [6,7]. The liquid generated during the pyrolysis process, also known as “pyroligneous liquor” is a complex mixture of water, alcohols, organic acids, phenols, aldehydes, ketones, esters, furan and pyran derivatives, hydrocarbons, and nitrogen compounds [8,9], yield and composition depending on the operating conditions of the process as well as biomass composition.
While the process is highly variable, it typically produces an amount of highly polluted wastewater that accounts for up to 50% of the liquid phase.
Many organic compounds and a list of hazardous constituents have been identified in such wastewaters [10]. As an example, the reddish-brown wood distillate was considered in the past as a major source of chemicals, including acetic acid and methanol. At present the recovery of chemicals appears to not be economically feasible, especially in the case of small decentralized plants, although it still has some minor application as natural antiseptic, and in the food industry as additives [11], and smoke flavoring [12]. The correct disposal of pyrolysis aqueous phase becomes, therefore, critical for the diffusion of small-scale pyrolysis technology; as a consequence alternative treatment technologies need to be evaluated to limit the environmental impact of such products [13].
To this purpose, physicochemical methods, mainly based on radical mechanisms activated through the combined use of ozone, H2O2, UV, cavitation (Advanced Oxidation Processes—AOP), have been proposed for the destruction of refractory organic pollutants [14,15]. Catalytic and photocatalytic ozonation of pyrolysis wastewaters showed good results in alkaline conditions [16].
As an alternative, chemical processes could be used to increase wastewater biodegradability as a pretreatment of a biological process. Silva et al. [17] reported promising results of the hybrid electrochemical/microbiological degradation of phenolic compounds from pyrolysis wastewater. Despite these methods having demonstrated high treatment efficiencies, they still present a relative high-energy footprint and can generate uncontrolled by-products [18]. Therefore, these methods are still considered complex and expensive with respect to the most common biological oxidation processes, which are generally environmentally friendly and cost-effective [19,20].
Furthermore, the biological oxidation of selected pollutants generally found in pyrolysis wastewater have already been investigated, even in complex mixtures [21].
To our knowledge, very few experiments of biological treatment of pyrolysis wastewater have been carried out. In addition, biodegradation efficiency is strongly related to the biomass pyrolyzed due to the presence of slowly biodegradable or even refractory compounds.
In this paper, the aerobic biological process has been investigated as a possible solution for the treatment of pyrolysis wastewater. A careful investigation of the influence of operating conditions was performed, by evaluating the effect of total organic carbon (TOC) concentration, pH conditions and temperature on biodegradation efficiency. A simplified kinetic model has also been proposed to evaluate the experimental results.
2. Materials and Methods
2.1. Pyrolysis Process
Pyrolysis of dried and crushed poplar wood was carried out in a continuous screw reactor (25 mm i.d., 550 mm length) under N2 atmosphere. Before starting the pyrolysis experiment, 150 g of dried biomass was loaded in the hopper, and the system was flushed with nitrogen at 500 mL/min to ensure inert atmosphere. After 30 min, the reactor was heated up to 450 °C and the feeding was started at a rate of 100 g/h. The vapors produced during biomass pyrolysis were cooled down and the condensate collected in liquid traps. The condensate separates spontaneously into two phases, an organic phase, the so called bio-oil, and an aqueous phase. In this work, to reduce the separation time and to assure a reduced amount of bio drops in the aqueous phase, a centrifugation step was also adopted. The aqueous phase was then analyzed by a GC-MS analyzer (Agilent, Santa Clara, CA, USA) using a thin film (30 m × 0.32 mm, 0.5 μm film thickness) HP-MS5 capillary column to determine the main soluble organic compounds TOC and pH were also determined. The main characteristics of the aqueous phase are reported in Table 1.
2.2. Biological Treatment of the Liquid Residue
A microbial biomass from municipal wastewater treatment was used. Microbial acclimation was carried out in a 1 L glass batch reactor, filled by 800 mL of municipal wastewater, by addition of 20 mL of pyrolysis wastewater every 5 days for a month, at 25 °C under aerated condition and stirring at 1000 rpm by Velp Scientifica (Velp Scientifica, Usmate, Italy) magnetic stirrer.
The biomass taken from the acclimation reactor (5 mL) was inoculated in 500 mL flasks, where batch tests were conducted to investigate the effect of TOC, pH and temperature on the biodegradation rate. In the first series of tests performed at 30 °C, the effect of initial organics concentration was investigated. To this aim, TOC starting values of 800 mg/L, 1400 mg/L, 2000 mg/L and 2800 mg/L were tested.
Subsequently the effect temperature was assessed through tests at 15 °C, 25 °C and 30 °C and fixed pH conditions (pH = 7) obtained by adding to the reactor an equimolar buffer phosphate solution to the reactor, and at an initial TOC concentration of 1400 mg/L. The tests lasted 72 h and were carried out under oxygen flow (3.5 L/min) provided by an air pump (AC 9902 (Resun, Shenzhen, China)).
A supplementary test was finally performed by adding a second reactor in series, to evaluate the enhancement of the degradation rate by the addition of acclimated microbial biomass.
Samples from each reactor were analyzed in term of TOC (Total Organic Carbon analyzer TOC-L (Shimadzu, Milan, Italy)), and pH (GLP21 (Crison Instrument, Barcelona, Spain)). Chemical oxygen demand (COD) was measured by the colorimetric method [22] with an UV/Vis spectrophotometer (UV-2700, Shimadzu Co., Kyoto, Japan).
All results are reported as mean value of at least three repetitions and a standard deviation of 5% was calculated.
3. Results
3.1. Influence of the Initial Concentration
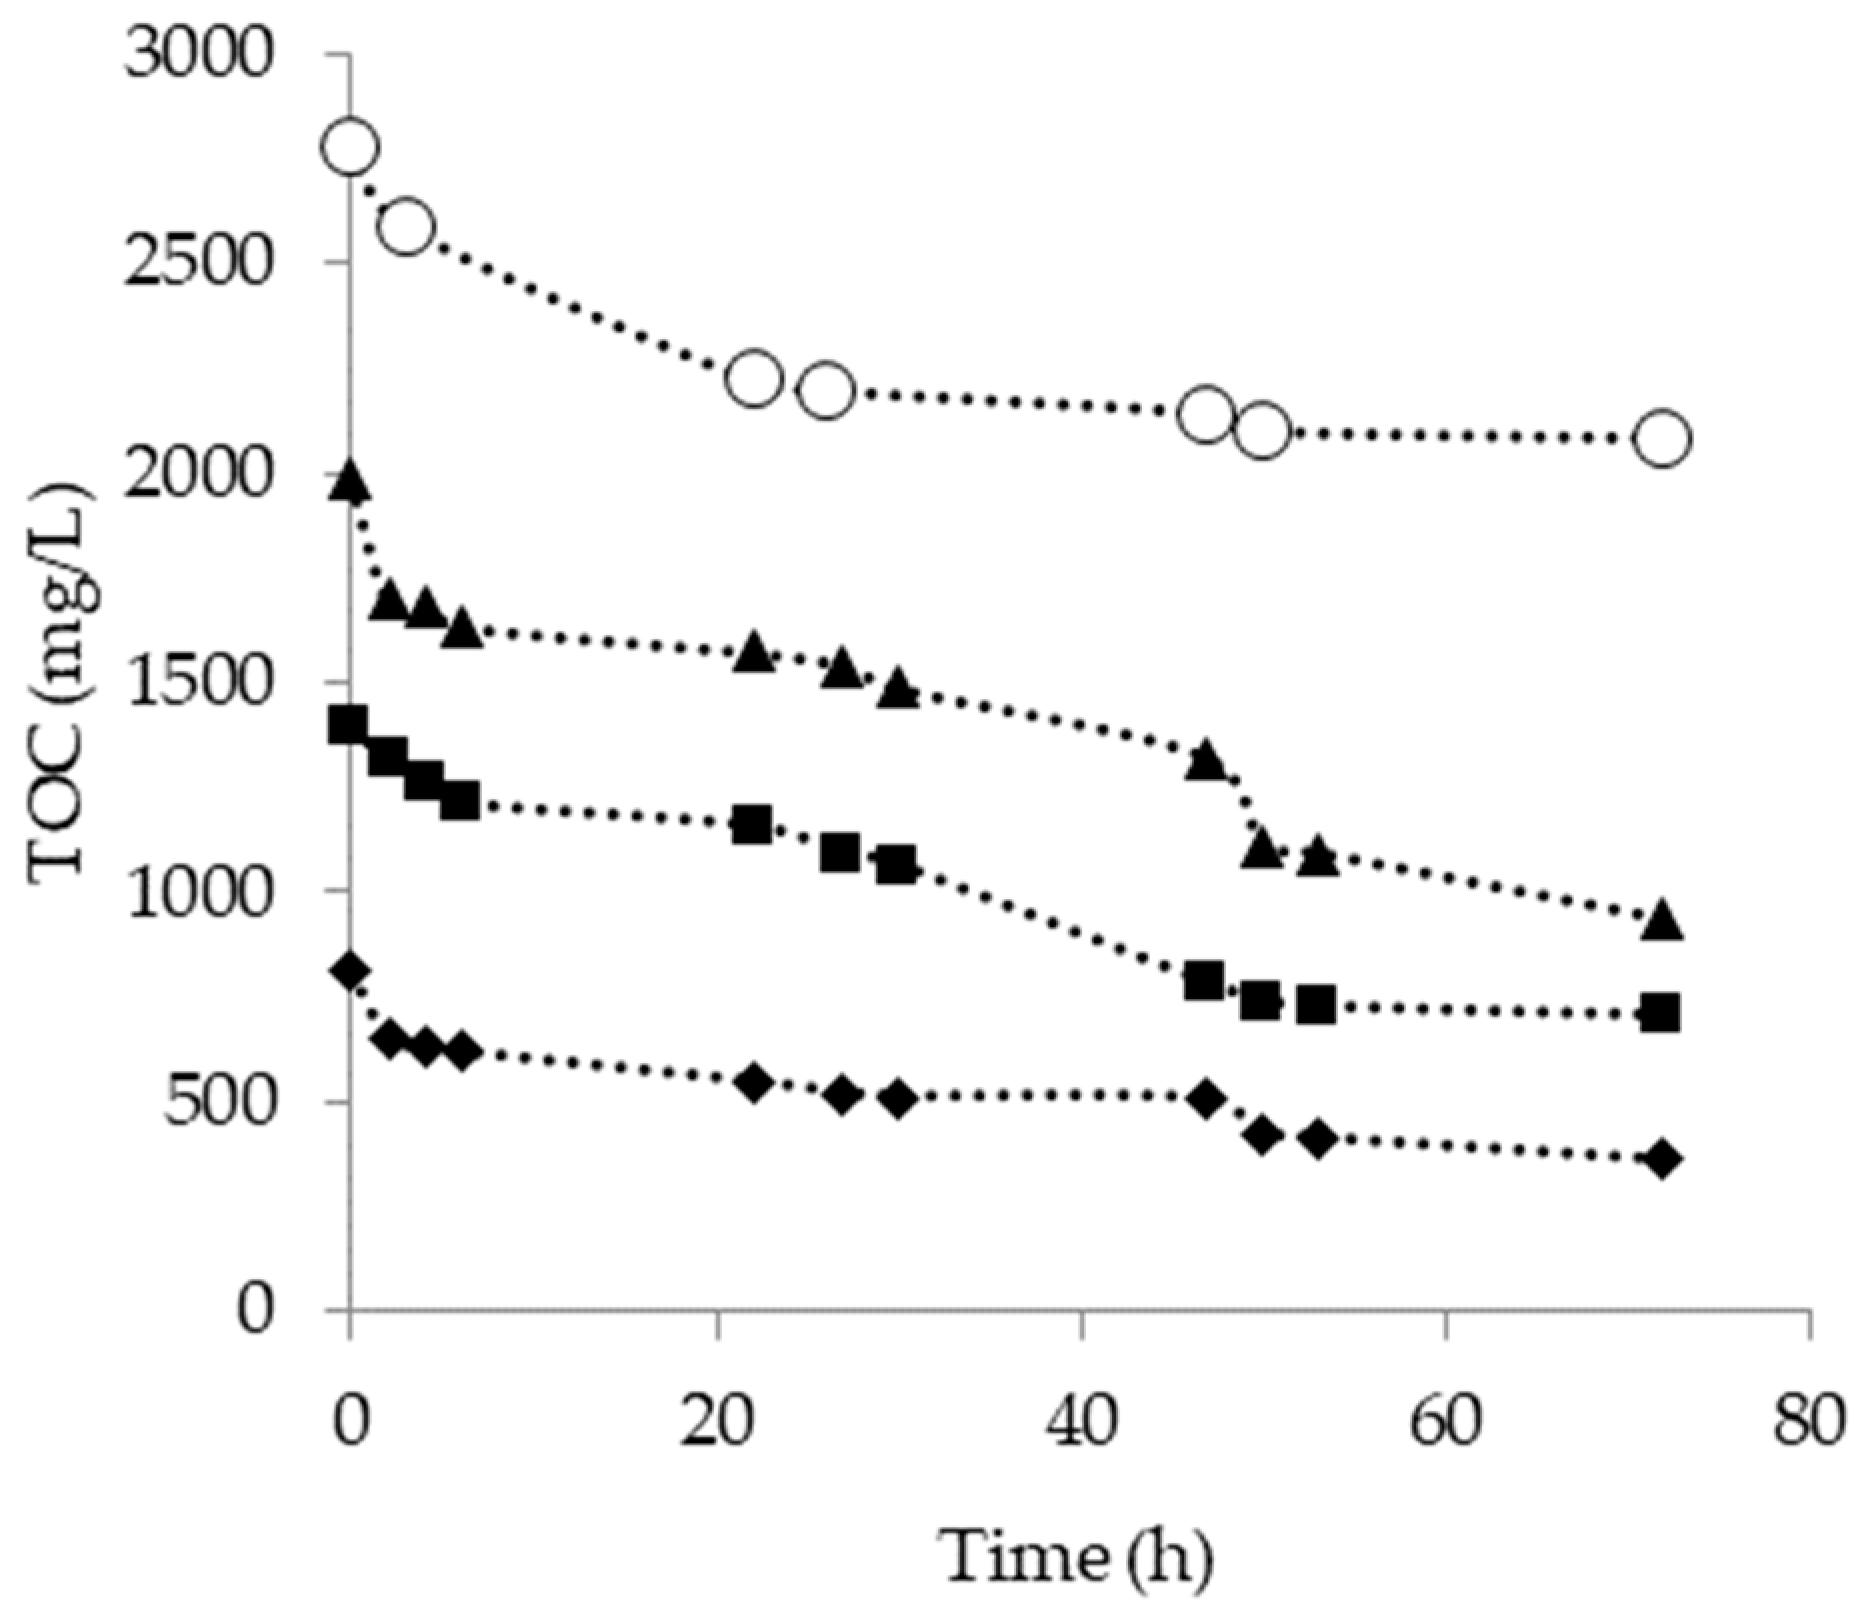
Figure 1 reports trend of TOC removal during the 72 h aerobic degradation experiments for water at different initial TOC values.
During 72 h of biodegradation at 30 °C and uncontrolled pH, TOC removal efficiency was similar for all the tested initial TOC concentration up to 2000 mg/L. Removal of TOC was 55.65%, 49.47% and 53.03% for initial TOC 800 mg/L, 1400 mg/L, and 2000 mg/L, respectively. These results suggested that microorganism acclimation successfully occurred. The TOC removal rate for the initial concentrations of TOC 800 mg/L, 1400 mg/L, and 2000 mg/L for 72 h, shows a similar trend, and the TOC profile show an alternating degradation period and adaptation period (Figure 1).
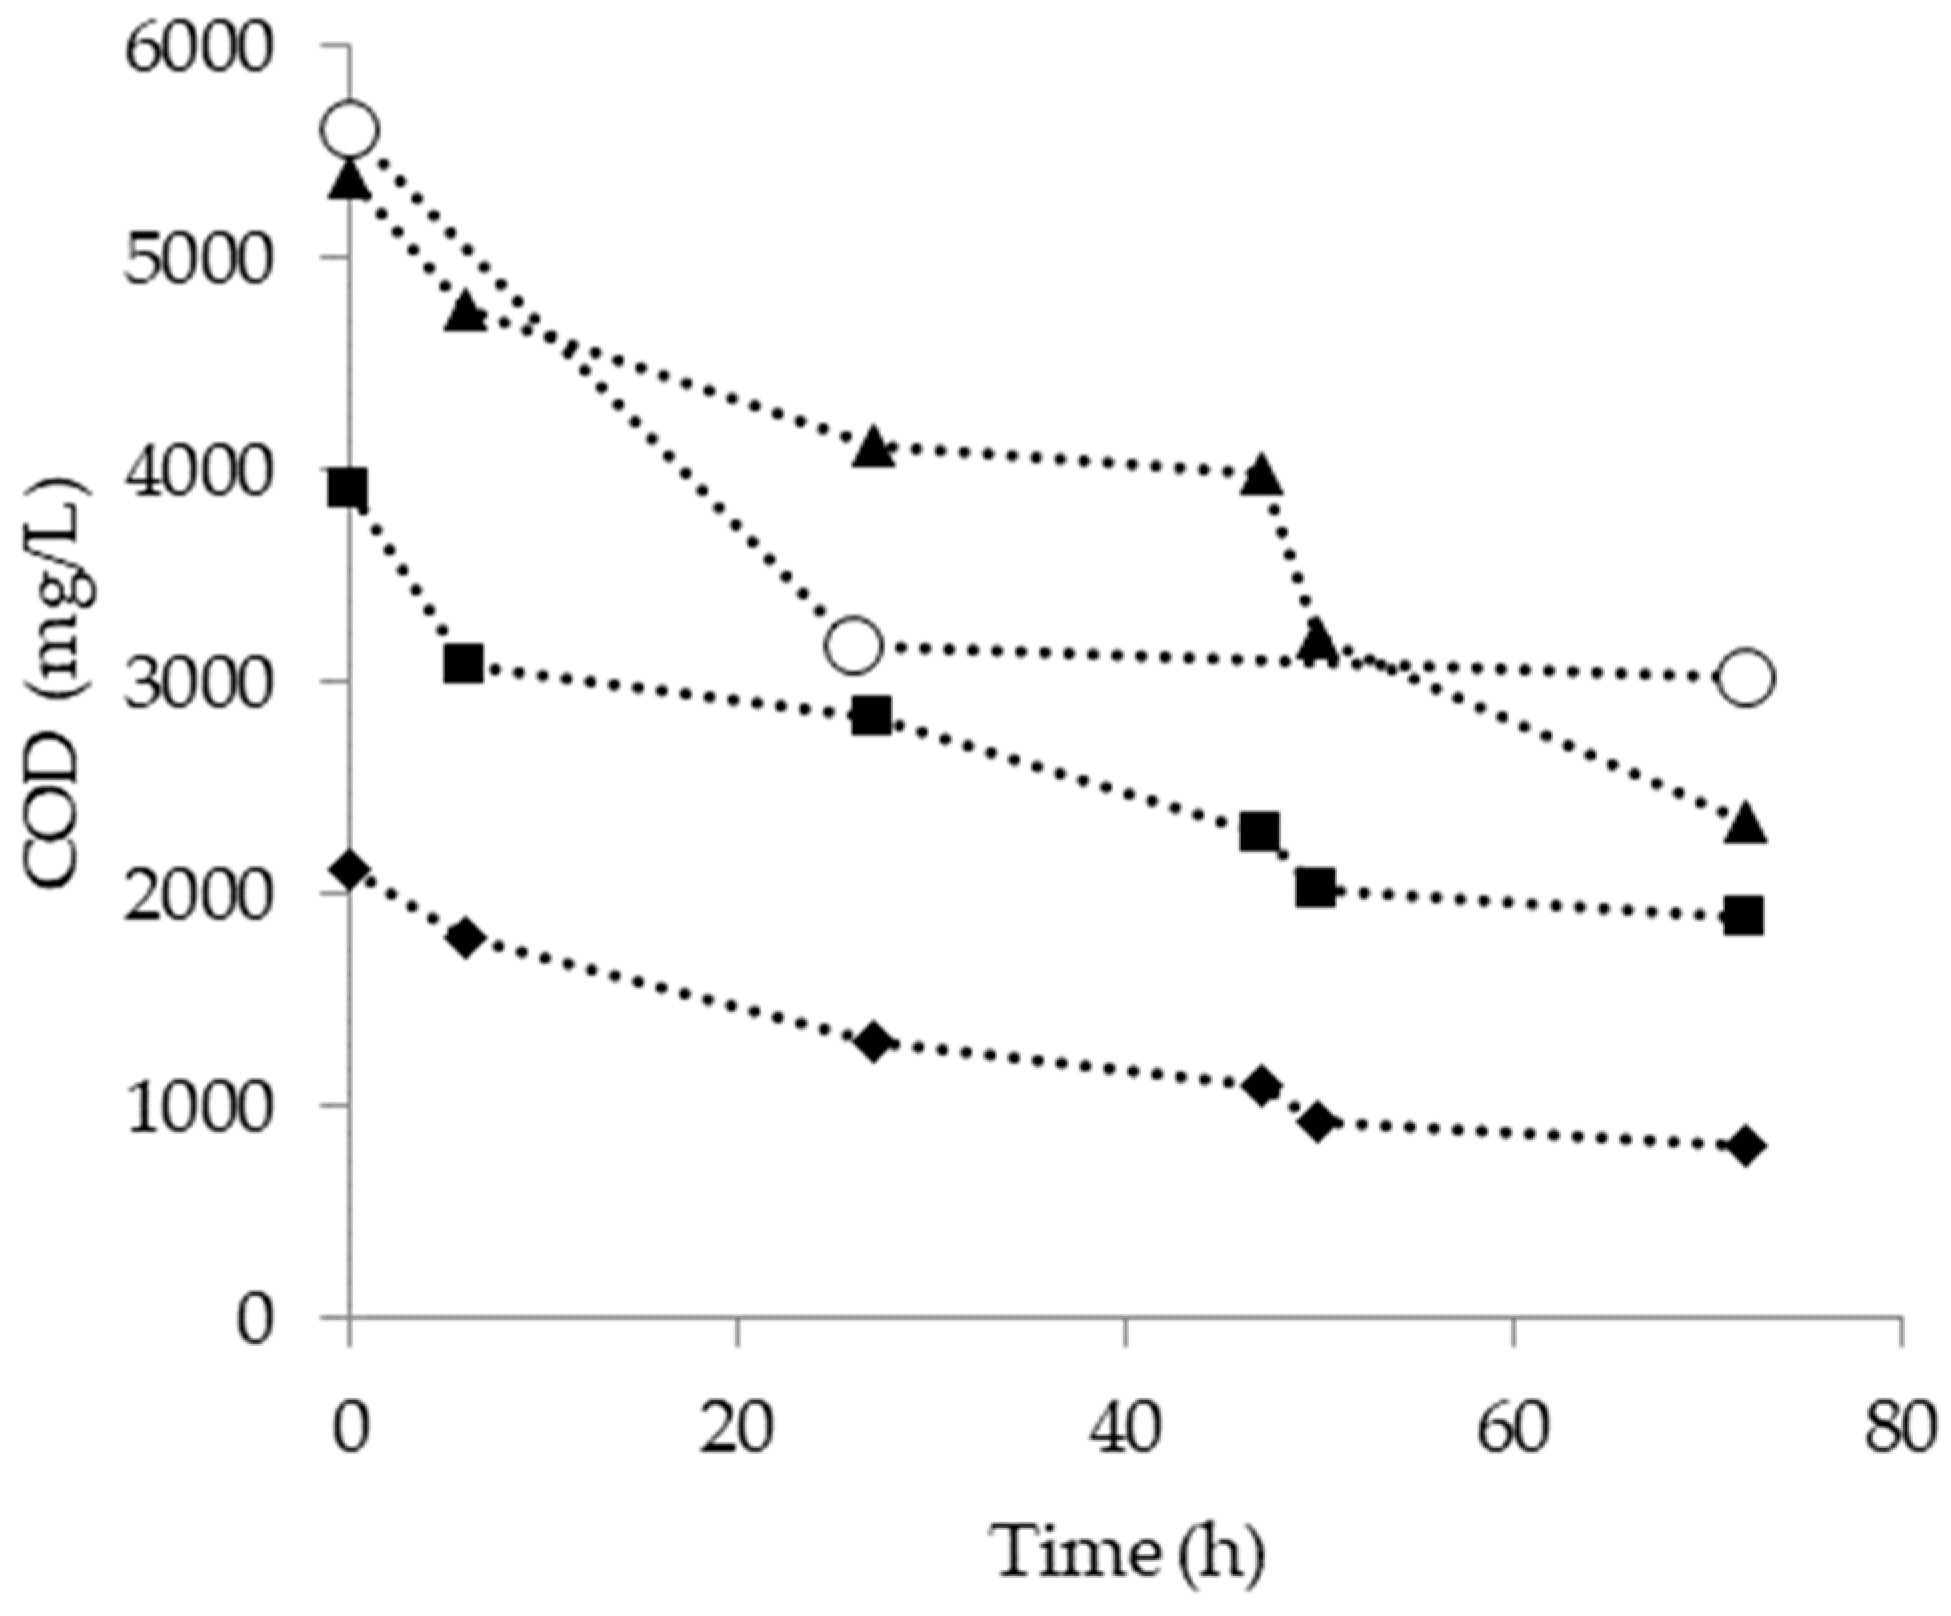
The same microbial activity is shown in the COD degradation (Figure 2). In fact COD/TOC ratio in experiments with an initial TOC concentration 800 mg/L, 1400 mg/L, and 2000 mg/L was almost constant, and equal to 2.44 (±0.29), 2.72 (±0.14), and 2.78 (±0.19), respectively. Such proportional removal of COD and TOC also highlighted the absence of other reducing compounds apart from organic compounds in the tested pyrolysis wastewater.
By comparing the TOC and COD degradation curves (Figure 1 and Figure 2), the highest TOC and COD removal rate (21.02% and 43.21%) was observed during the first 24 h of degradation at the initial TOC 2800 mg/L, but further degradation was negligible. In this case, the largest proportion of readily and hardly biodegradable compounds was observed and this could be explained by the occurrence of an initial fast degradation followed by inhibition of the microbial biomass. Ruiz-Ordaz and co-workers (1998) found that a concentration of phenols, as an organic carbon source exceeding 2500 mg/L (TOC 1900 mg/L) determined a substrate inhibition due to their toxicity effect on microbial growth [23]. In the present work, the overall concentration of phenolic compounds resulted in a TOC value of 140 mg/L, suggesting that the inhibitory effect cannot be associated only with phenolic compounds but also with the co-presence of slowly biodegradable or even refractory species such as butyrolactone (3.47%) [24]. However, since acetic acid was the most abundant fraction of the liquid phase, the occurrence of pH fluctuations in the reaction media was assumed to be the main factor responsible for the inhibition of microorganisms activity [25].
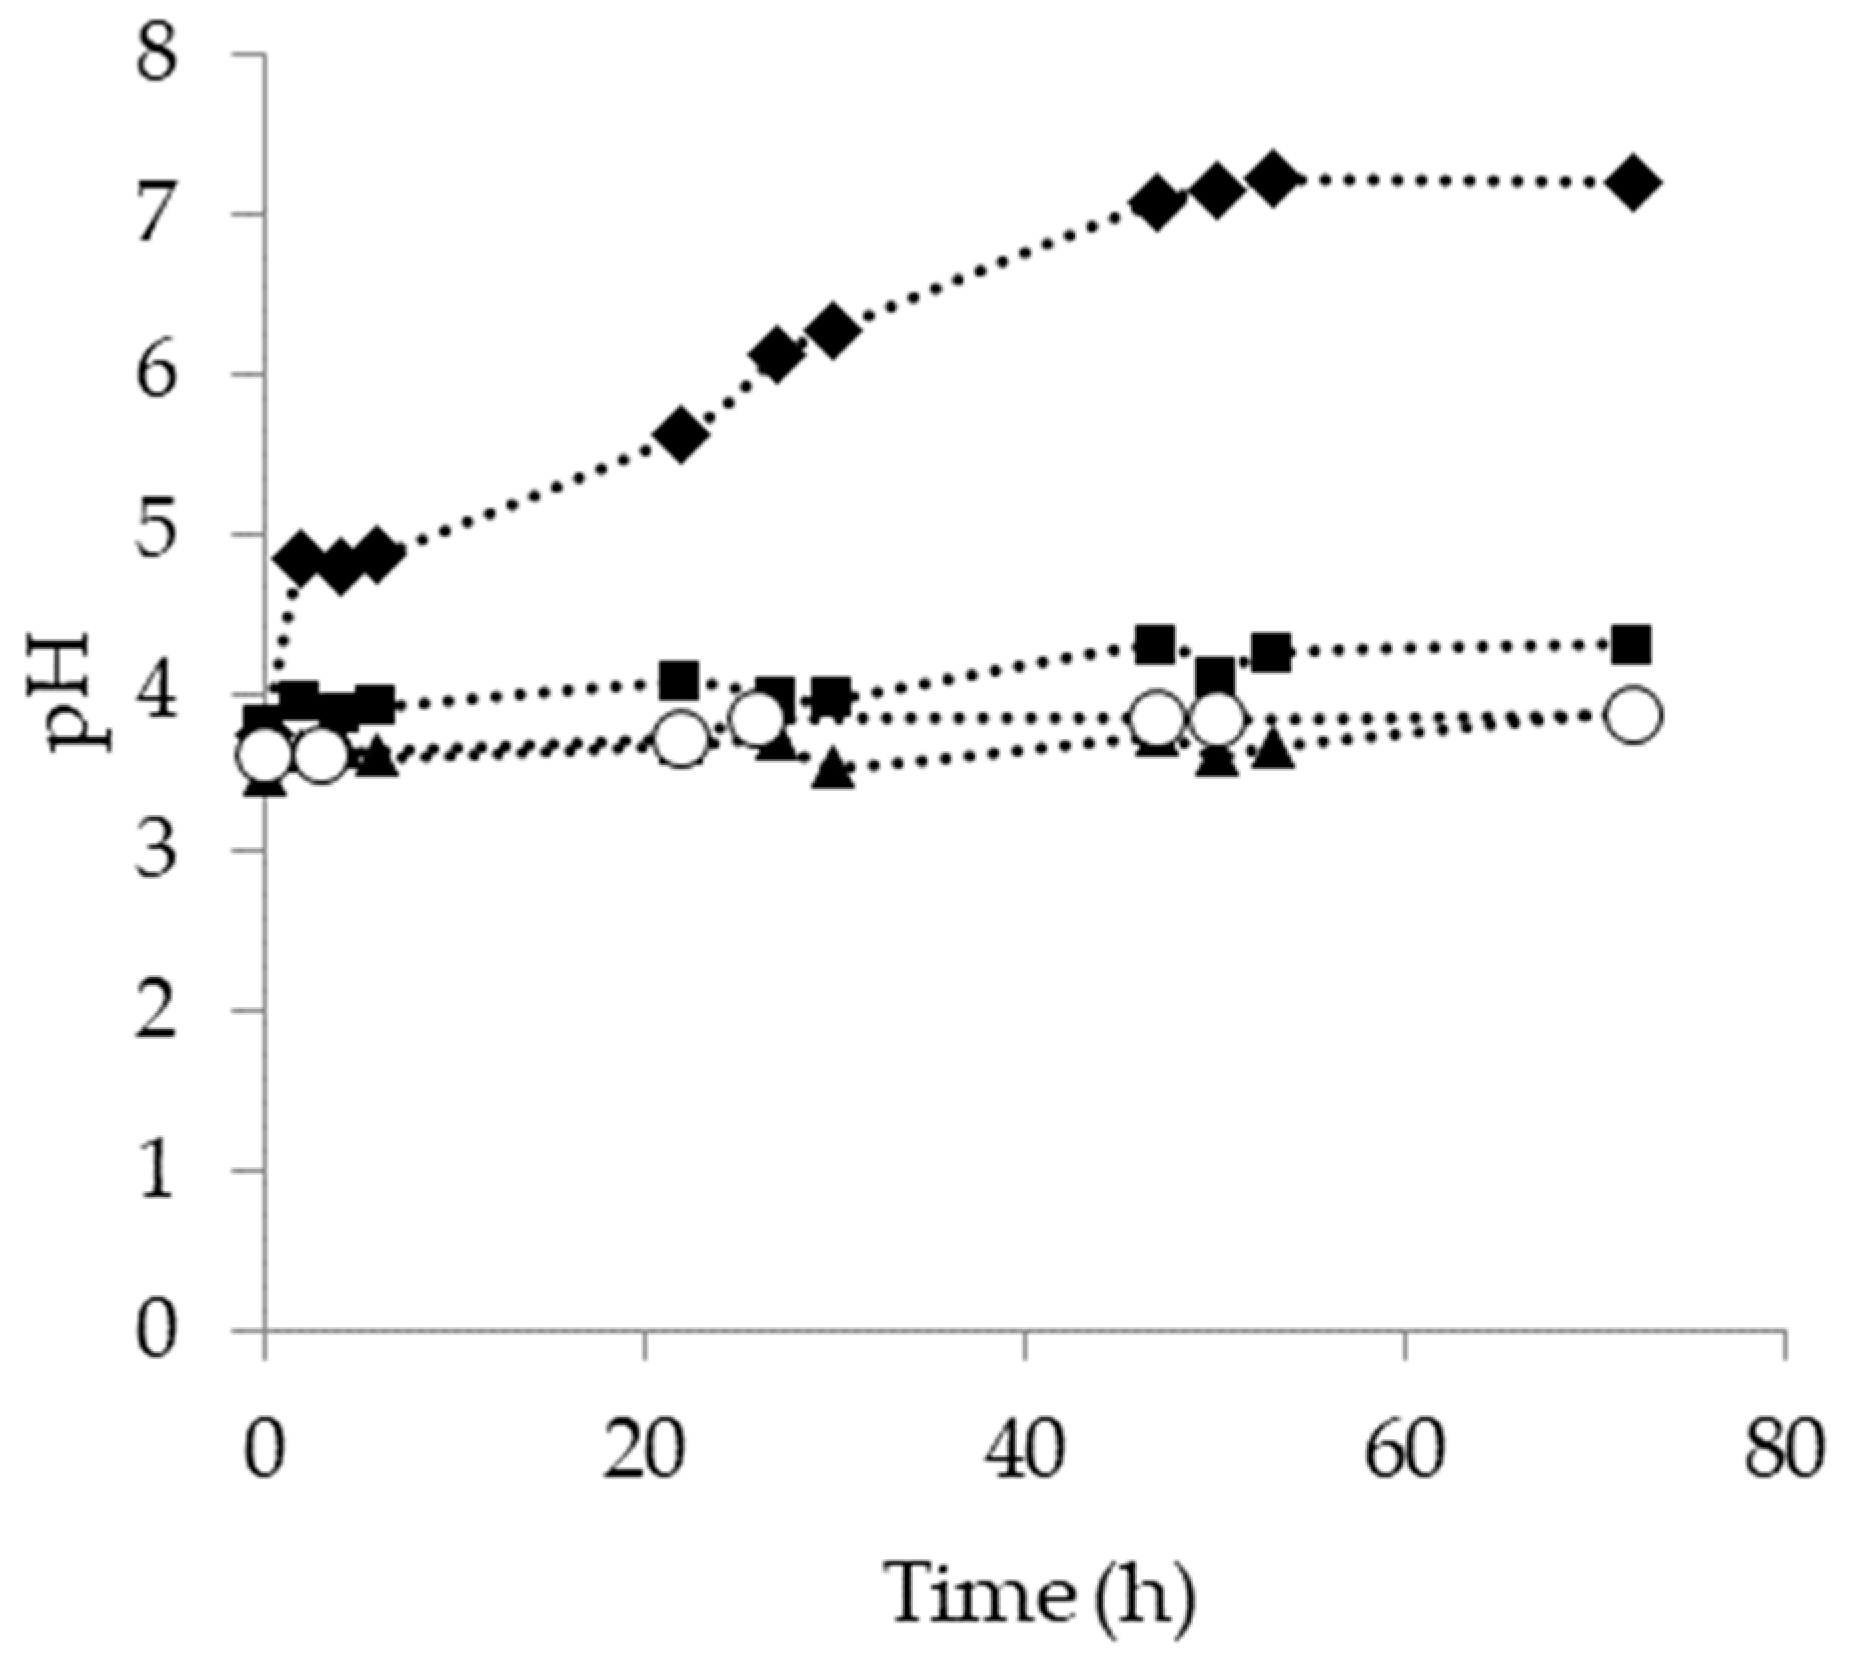
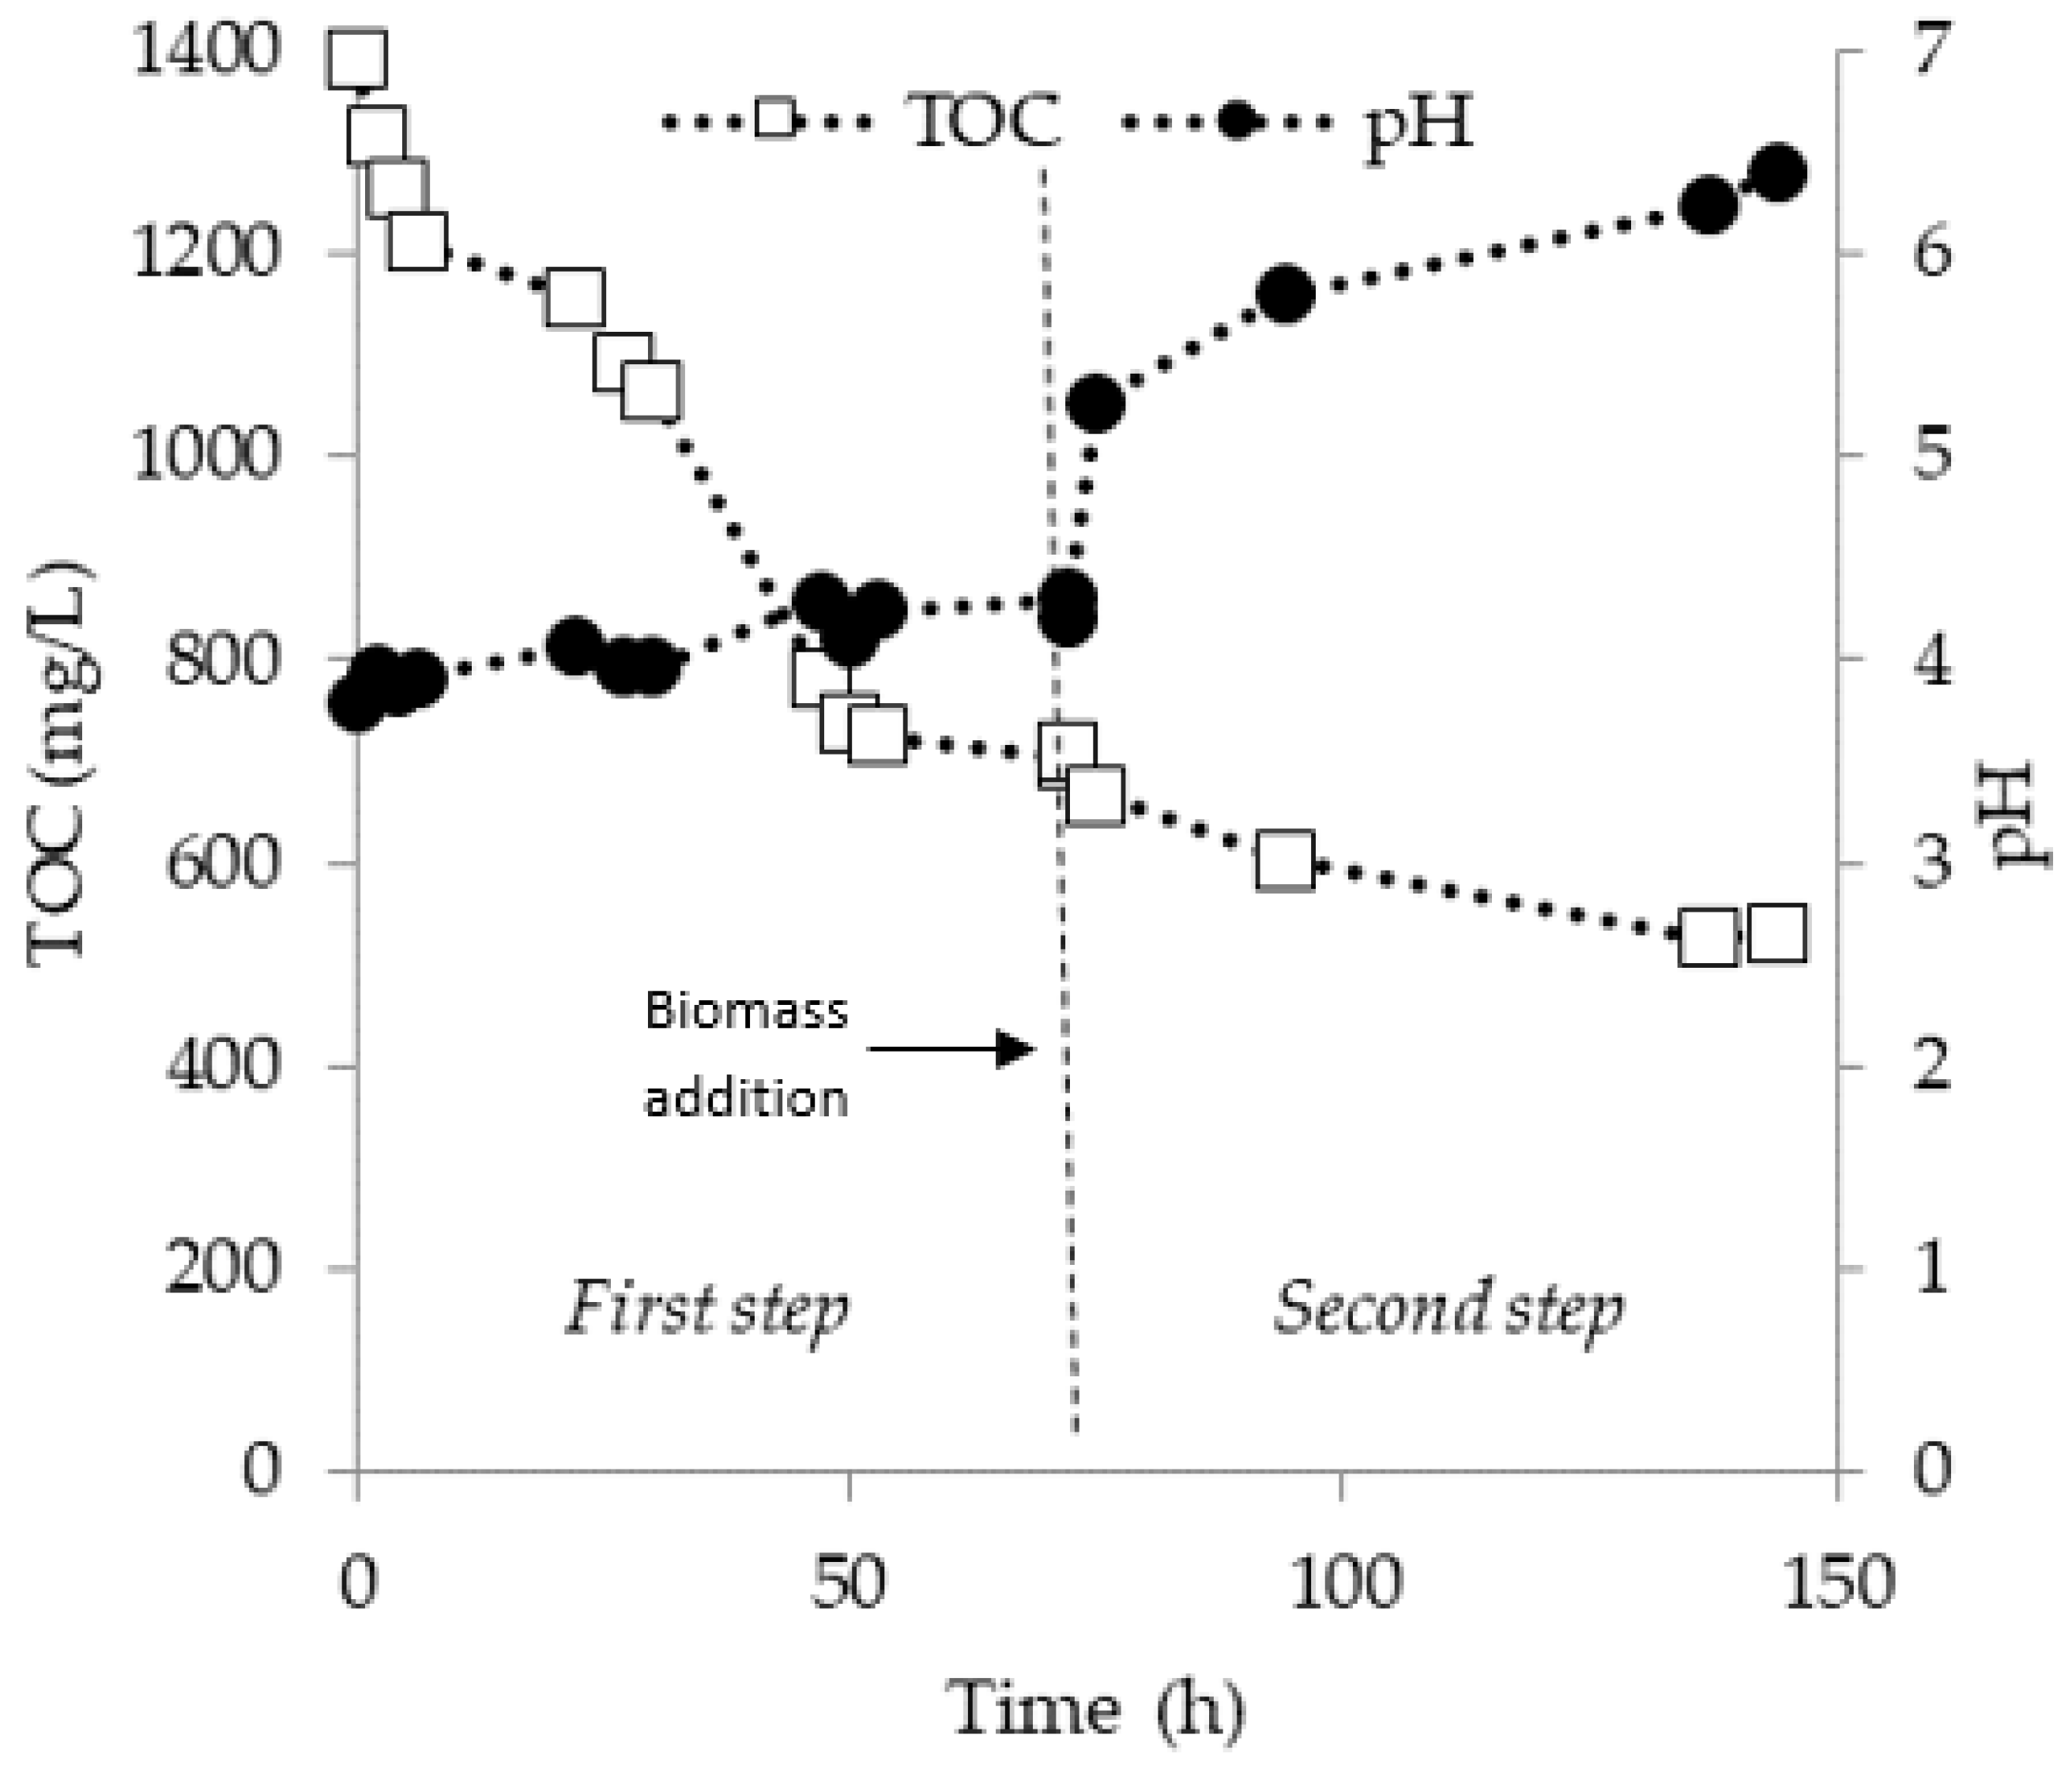
Acidic conditions were observed during the 72 h of treatment in all the tests, except at the low TOC initial value (800 mg/L), where neutral condition (pH equal to 7.2) were achieved after 27 h (Figure 3). This result suggests that in the case of low TOC values a faster degradation occurred, with the mineralization of acidic compounds, thus resulting in a quick increase of pH. On the basis of the above results and in view of the implementation of a biological step for the treatment of pyrolysis wastewater, a pretreatment depending upon organics concentration could be required to reduce initial organics concentration to a suitable range for bacterial degradation. To this aim an additional test of bioaugmentation was carried out: 1400 mg/L was considered as optimal value for the biological treatment of pyrolysis water. After the first 72 h treatment a new amount of biomass (5 mL) was added by driving the test for further 72 h. A further degradation (from 72–144 h) was interpreted from the initial TOC 1400 mg/L at 30 °C, and resulted in a degradation of TOC of 61.80%, after 144 h (Figure 4).
A reduction of COD/TOC down to 1.77 after 144 h was determined.
3.2. Influence of pH
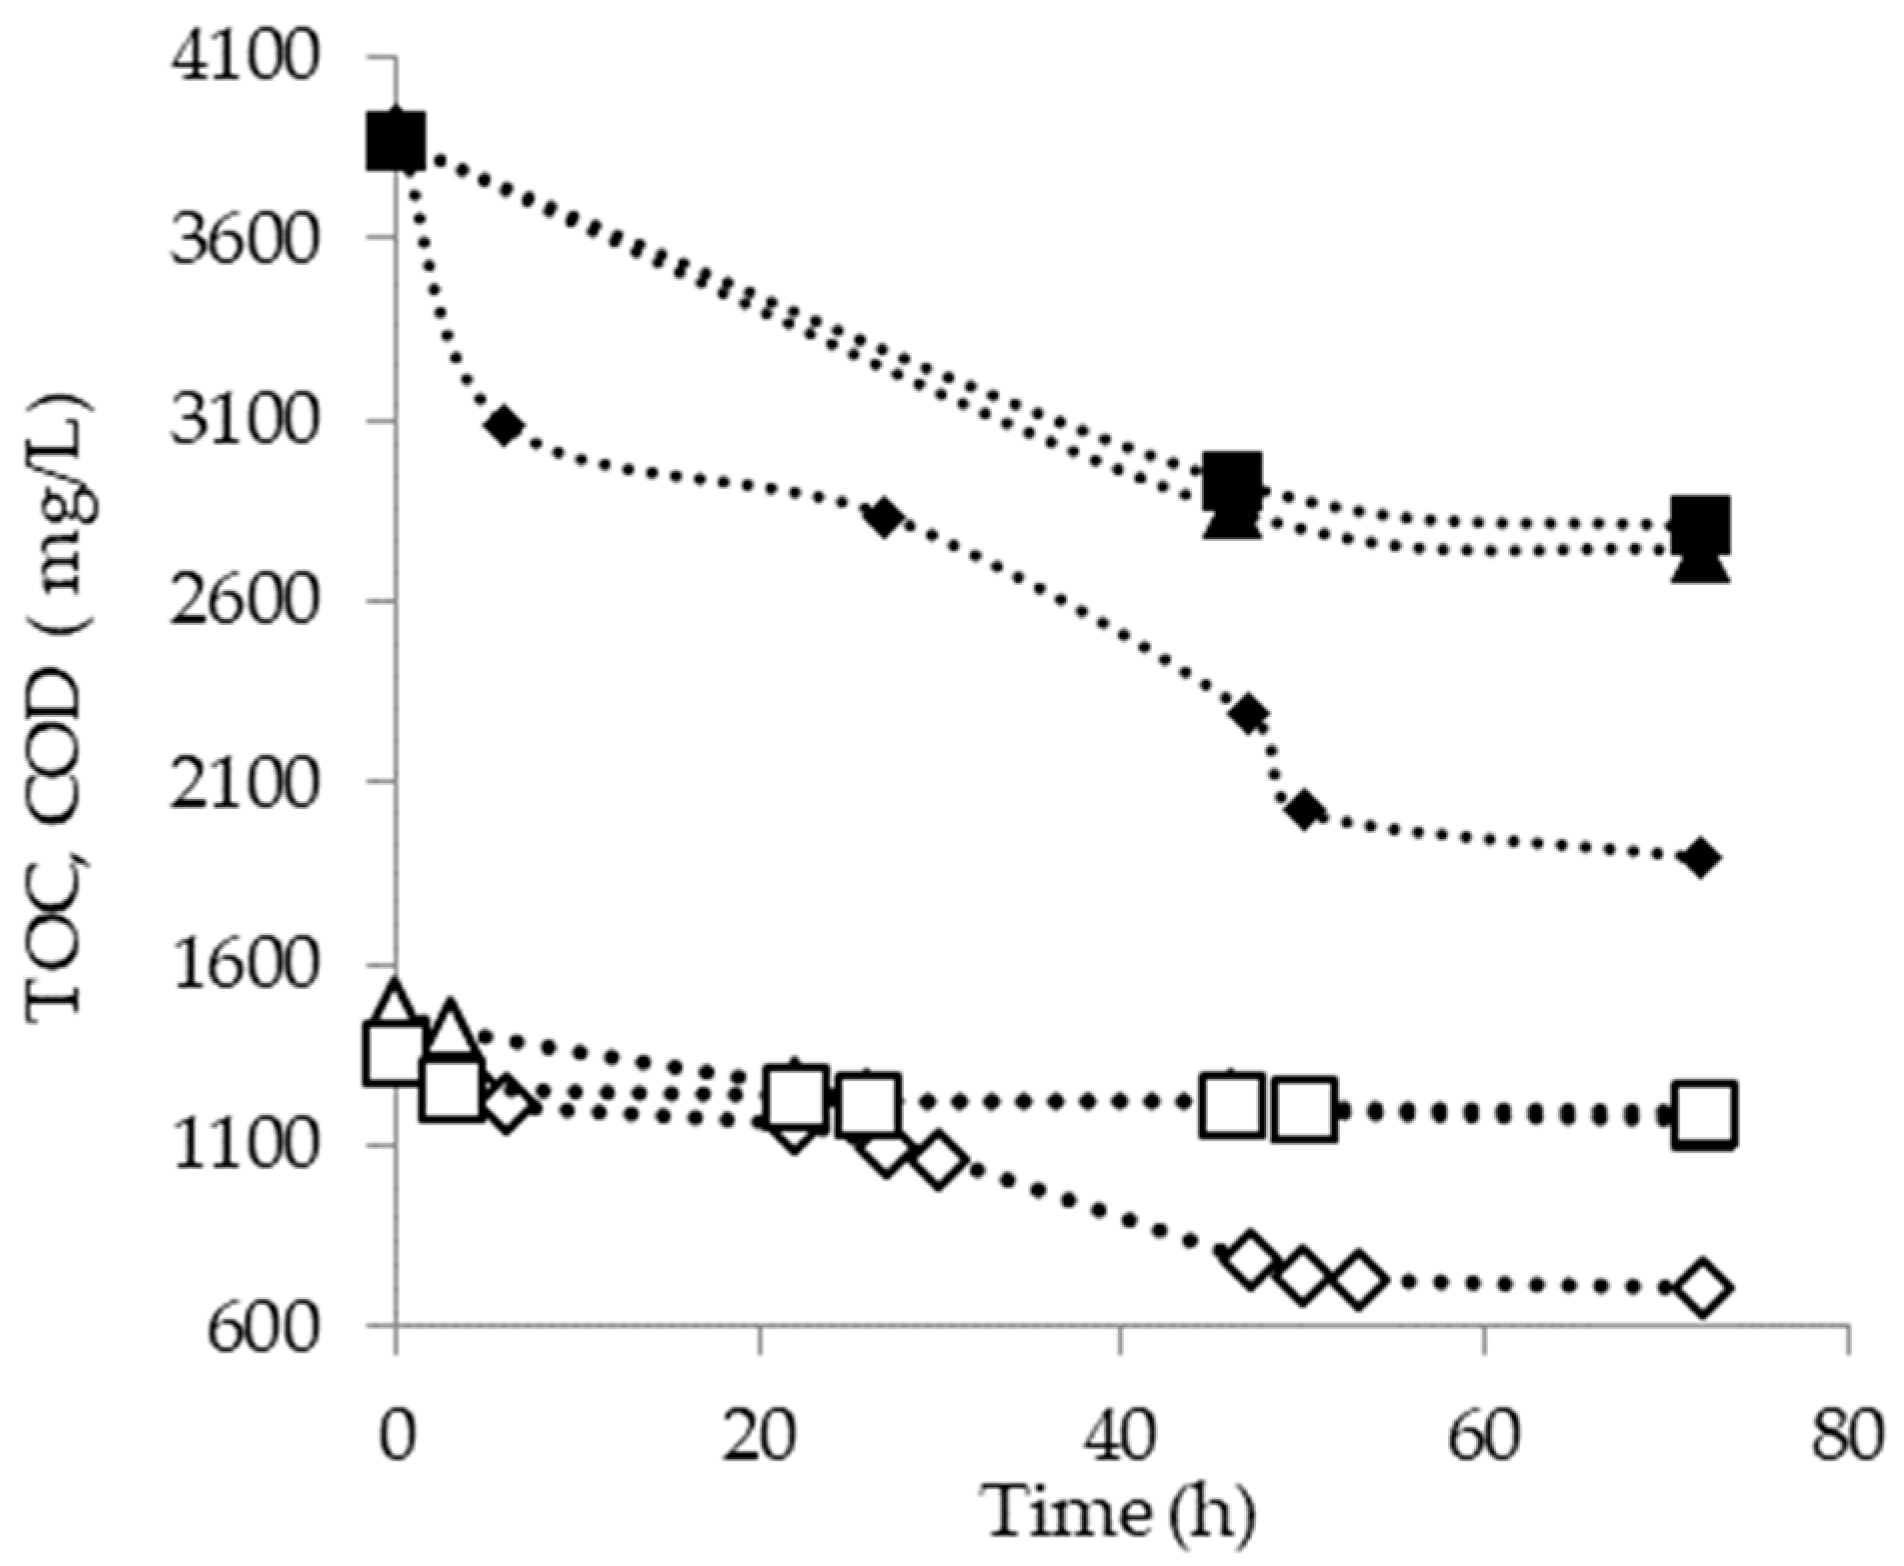
Tests were carried out to investigate the effect of pH on organic degradation at an initial concentration of 1400 mg/L. In Figure 5, TOC and COD removal over time are presented in the tests performed at controlled (pH = 7) and uncontrolled pH.
In the tests performed at pH = 7, a 30.12% TOC removal and 39.40% COD removal were observed. Comparing these values to the corresponding values obtained in the tests performed at uncontrolled pH (49.47% TOC removal and 51.54% COD removal), it was possible to confirm that neutral pH compromised the microbial metabolism reducing process effectiveness (Figure 5). This effect also suggests that the acclimation of microorganism under acidic pH conditions could result in a process enhancement and prevent process inhibition under acidic conditions [26,27].
3.3. Influence of Temperature
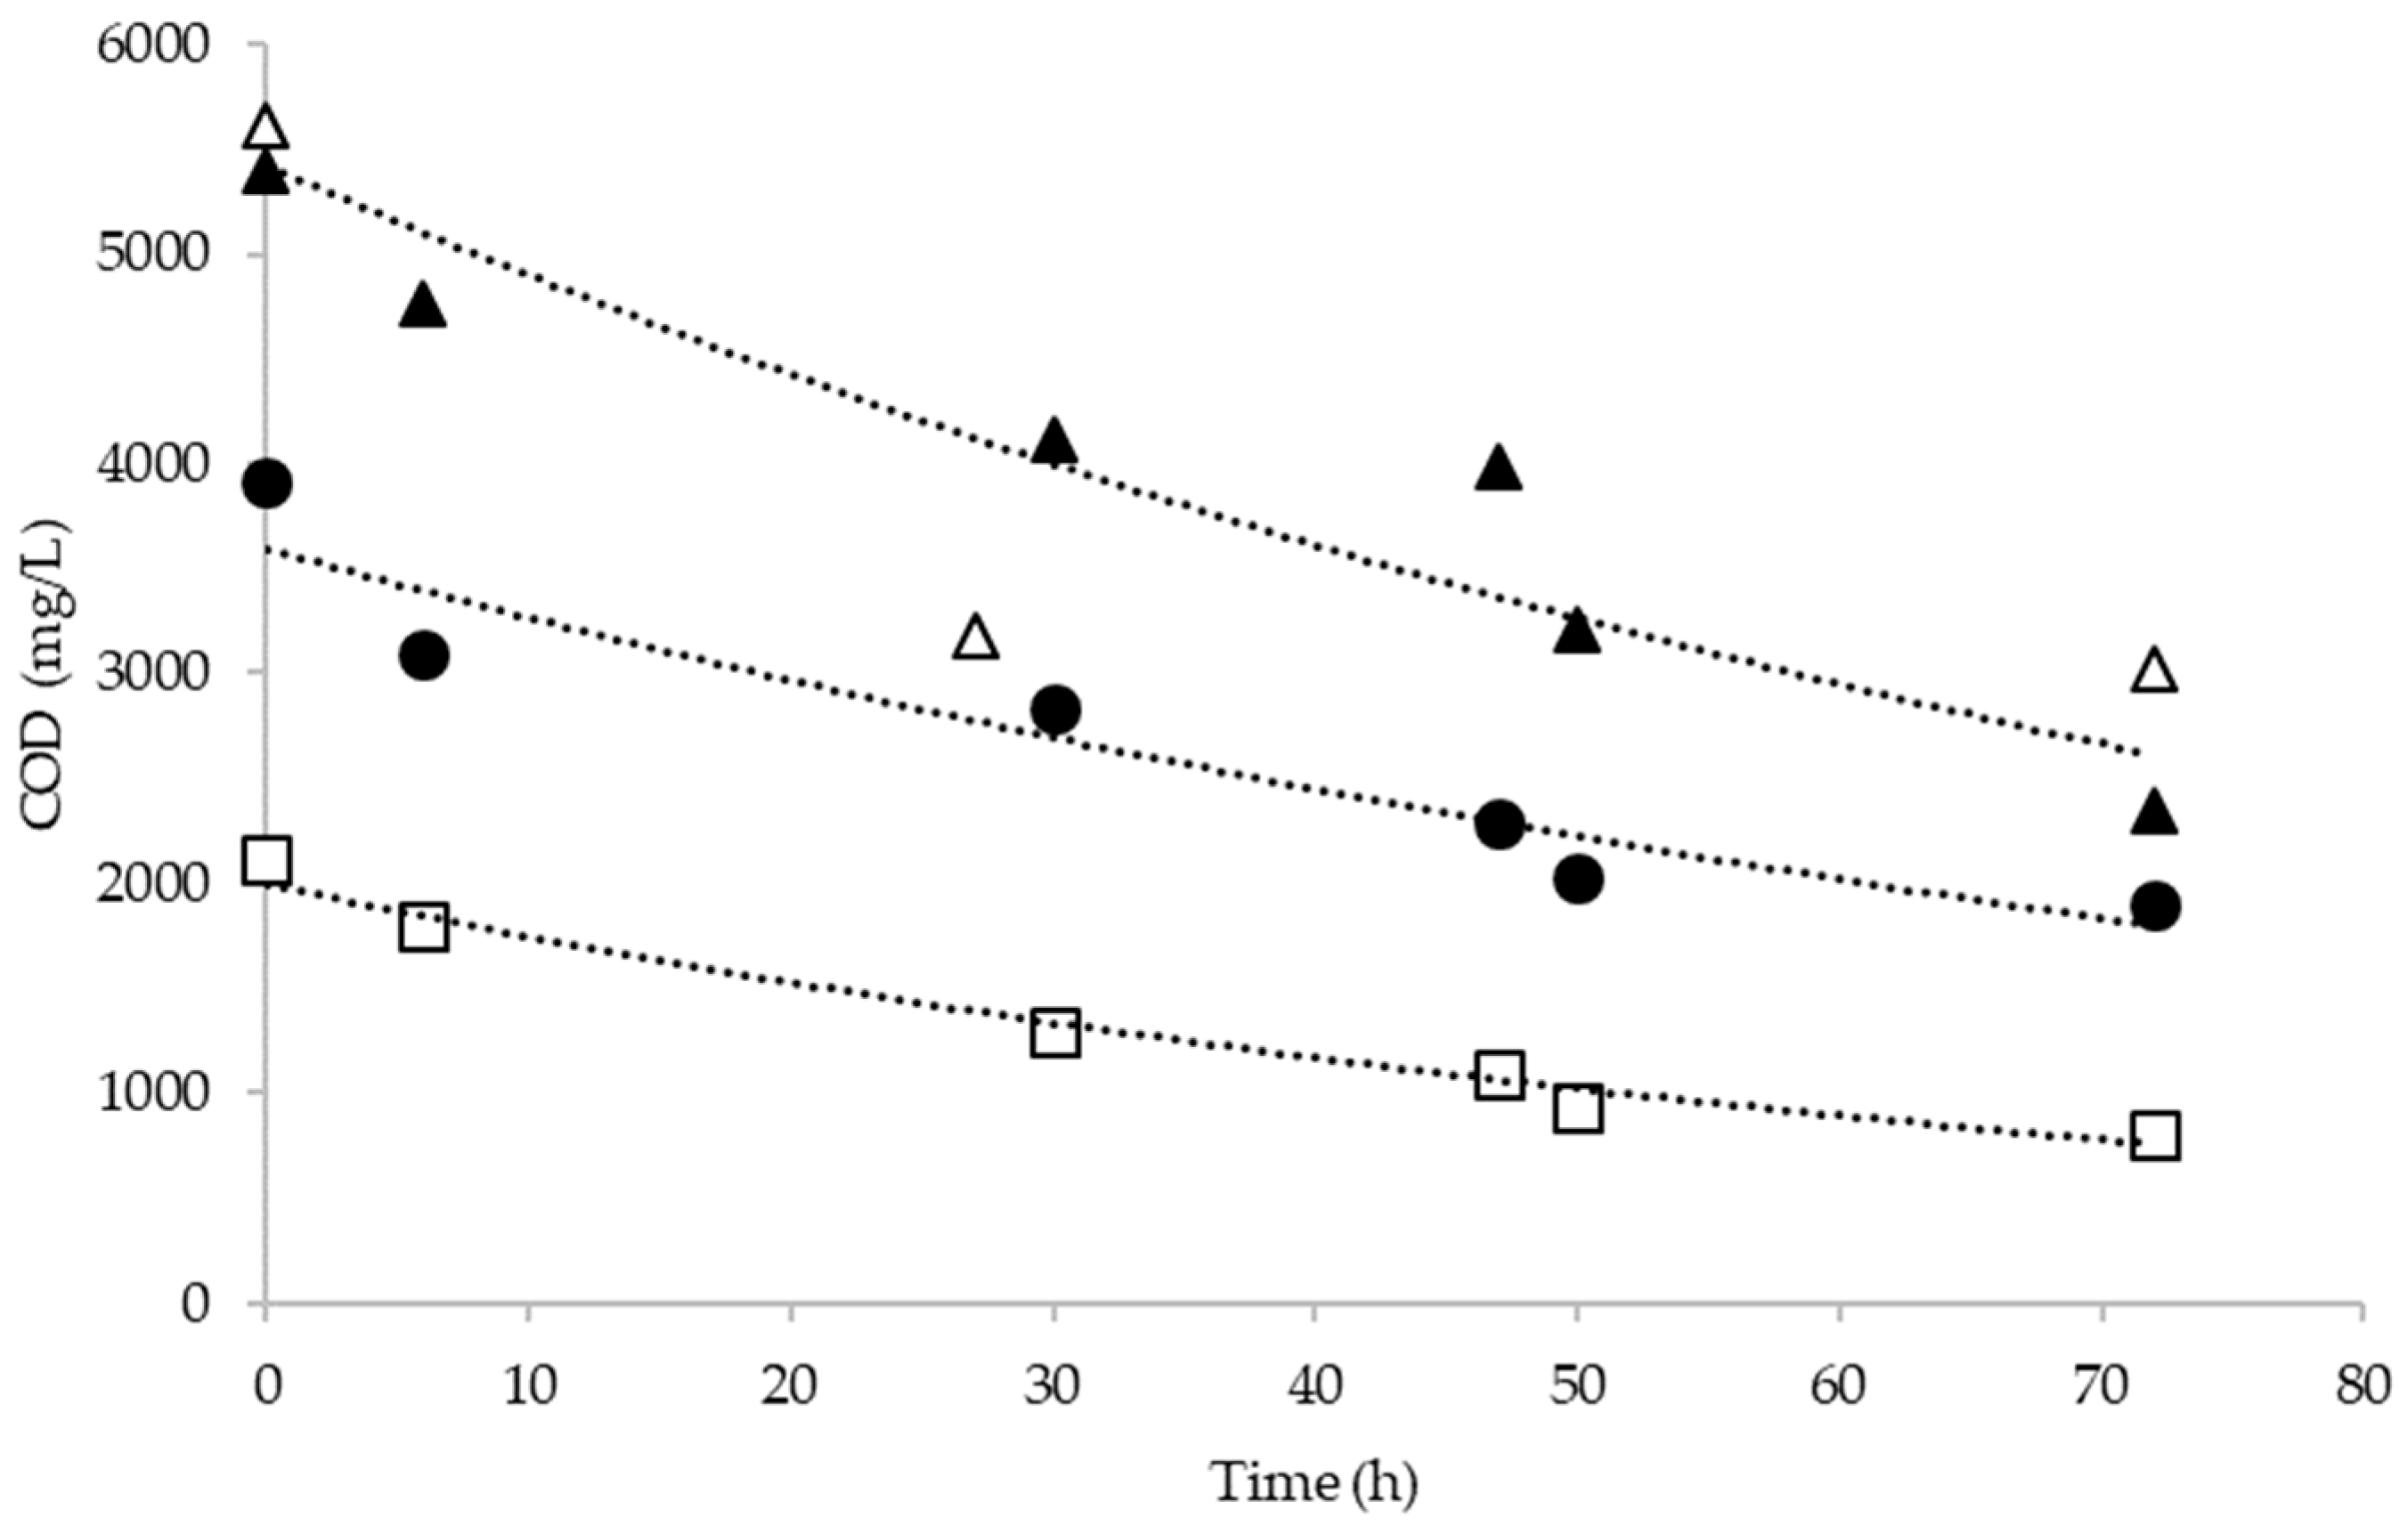
In regards to the influence of temperature on the degradation rate, tests at 15 °C, 25 °C and 30 °C were performed at 1400 mg/L, initial TOC value and at uncontrolled pH. The results of TOC and COD removal yields are reported in Figure 6.
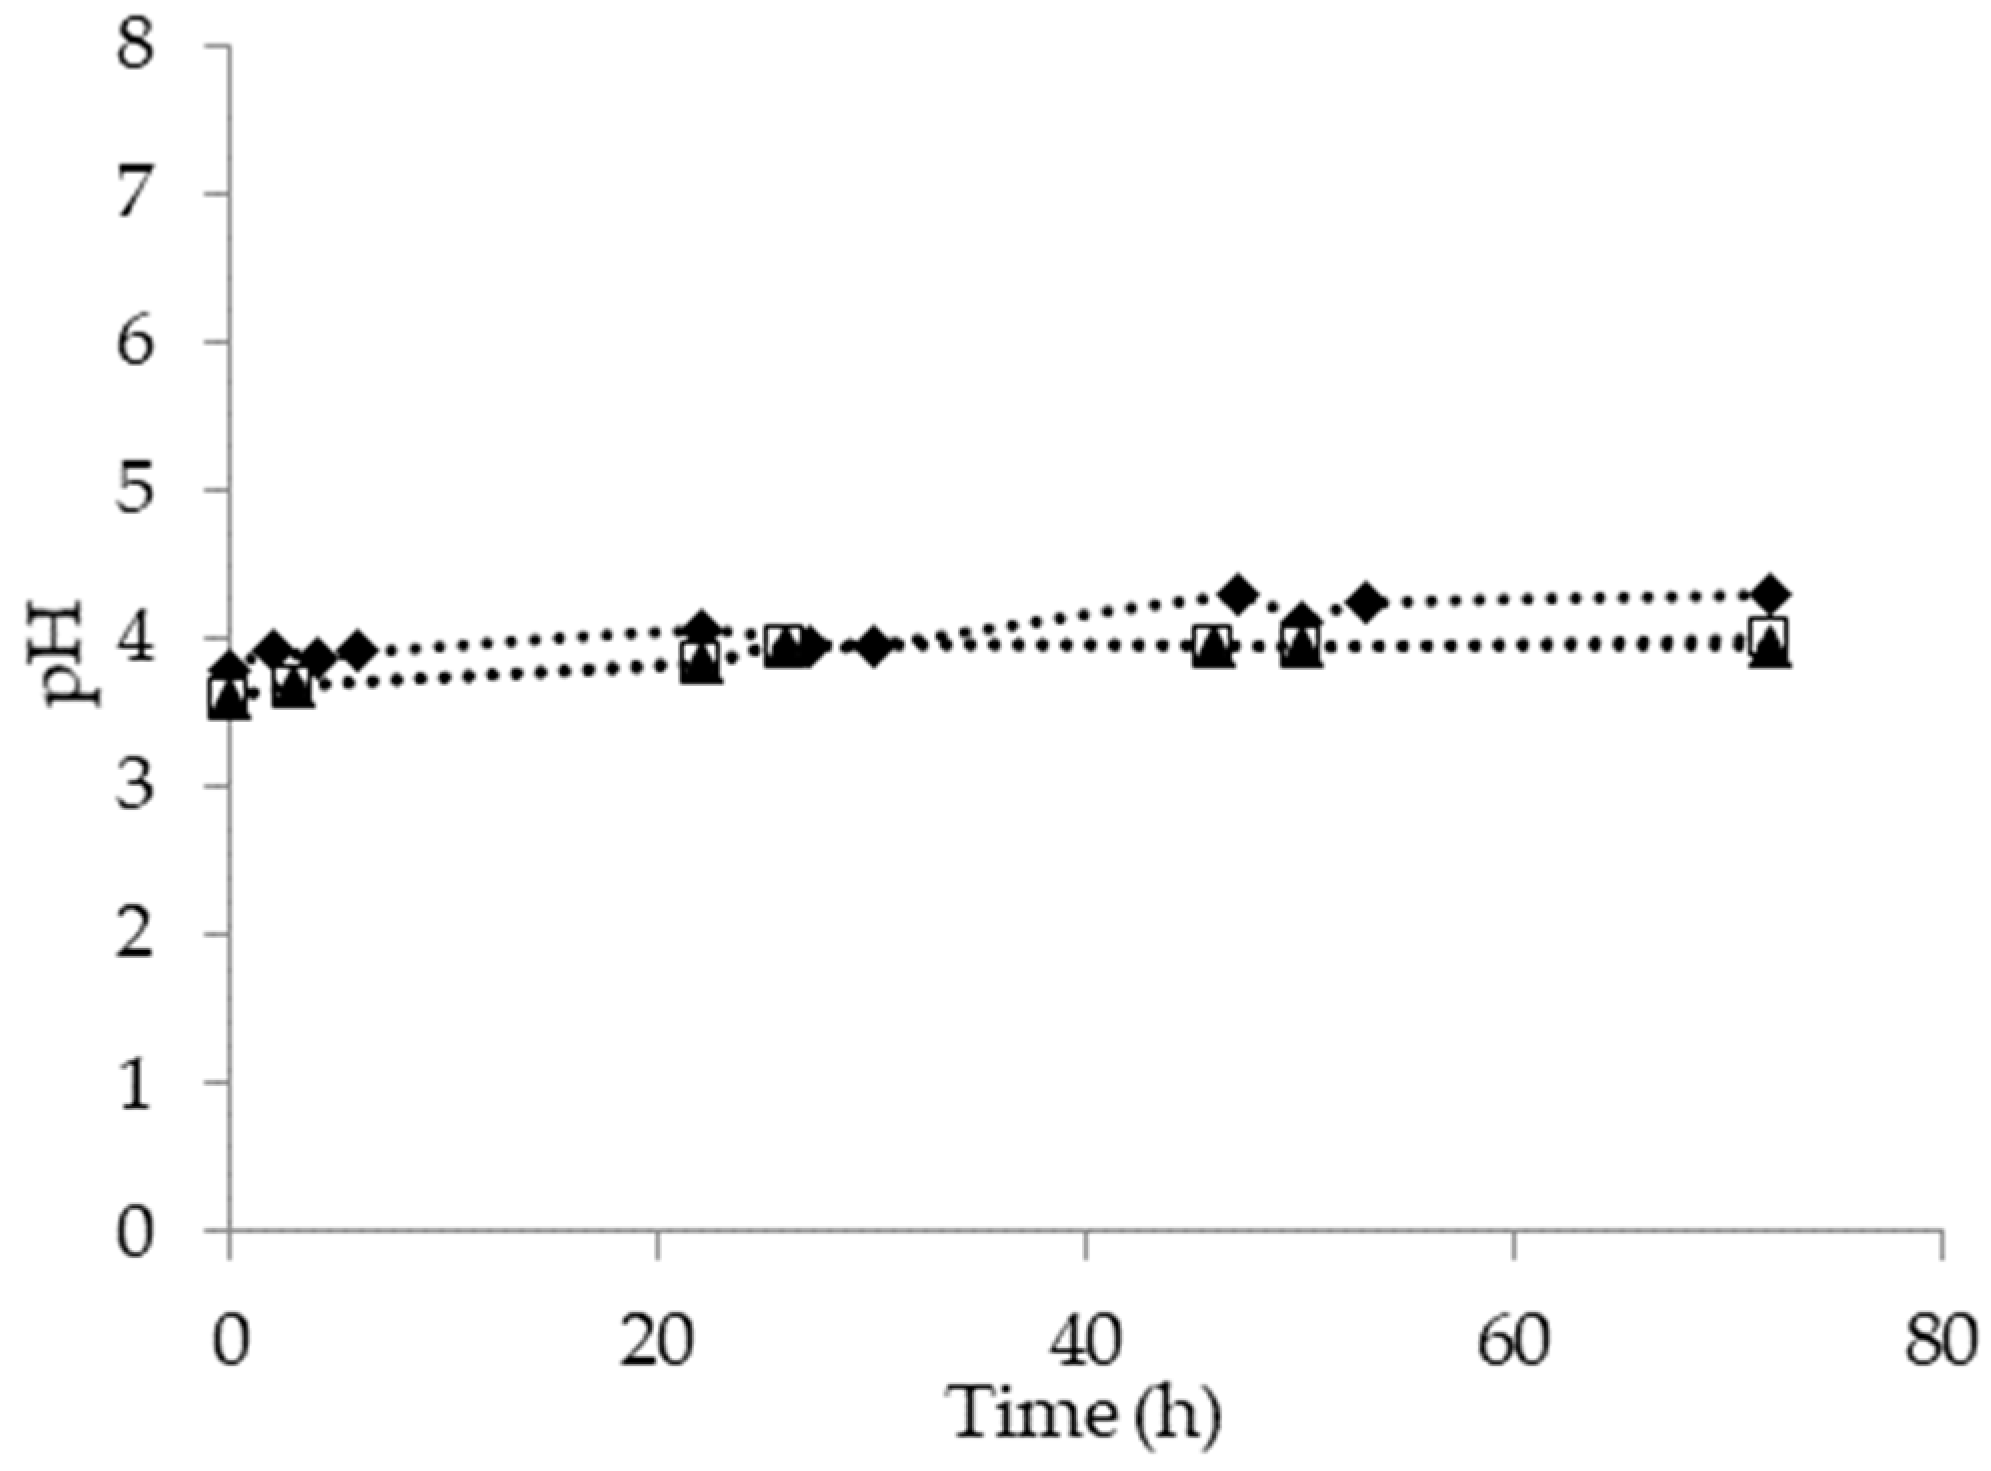
As expected, the TOC and COD removal rate increased when temperature increased. TOC removal was 12.62%, 20.90% and 49.47% for tests performed at 15 °C, 25 °C and 30 °C, respectively, while the COD removal in the same tests was 27.47%, 29.35% and 51.54 %. The mean COD/TOC ratio values after 72 h of treatment in these last tests were 2.54 (±0.27), 2.64 (±0.17) and 2.72 (±0.14) respectively, in accordance with the results discussed above. The results confirm the inhibiting effect of low temperature on microorganisms activity, as generally observed in the aerobic oxidation process [25]. pH values measured in these tests, are reported in Figure 7. Results show that acidic conditions were established during the experiments.
The same tests were performed under controlled pH condition (equal to 7) to evaluate a possible positive effect of neutral pH conditions when temperature is increasing. In the tests at 15 °C and 25 °C neutral pH condition did not affect the organic removals. The TOC removal yield was 10.24% and 19.94% respectively. Conversely, the inhibition due to neutral pH conditions was observed during the test performed at the higher temperature (30 °C) in which a substantial decrease in terms of TOC (30.12%) and COD (39.40 %) was observed.
3.4. Kinetic Analysis
Figure 8 reports the observed first-order kinetic at different initial organic contents as COD.
The substrate (expressed as COD) removal rate of an enzyme-catalyzed reaction is described by Equation (1) according to the model of Michaelis Menten.
where X is the biomass concentration and Vmax is the maximum reaction velocity, Y is the biomass yield coefficient and KM is the Michaelis Menten constant showing the affinity between enzyme and substrate. In the case of a fist-order kinetic (COD concentration much lower than KM), it is possible to rewrite Equation (1), and expressed as Equation (2):
with an apparent kinetic constant, va = (Vmax X)/(KM Y) which has been determined through data fitting with an exponential decay, as depicted in Figure 8. The resulting non-dimensional equation describing completely the experimental data-set, with an average pre-exponential factor va = 0.012 1/h, is reported in Equation (3):
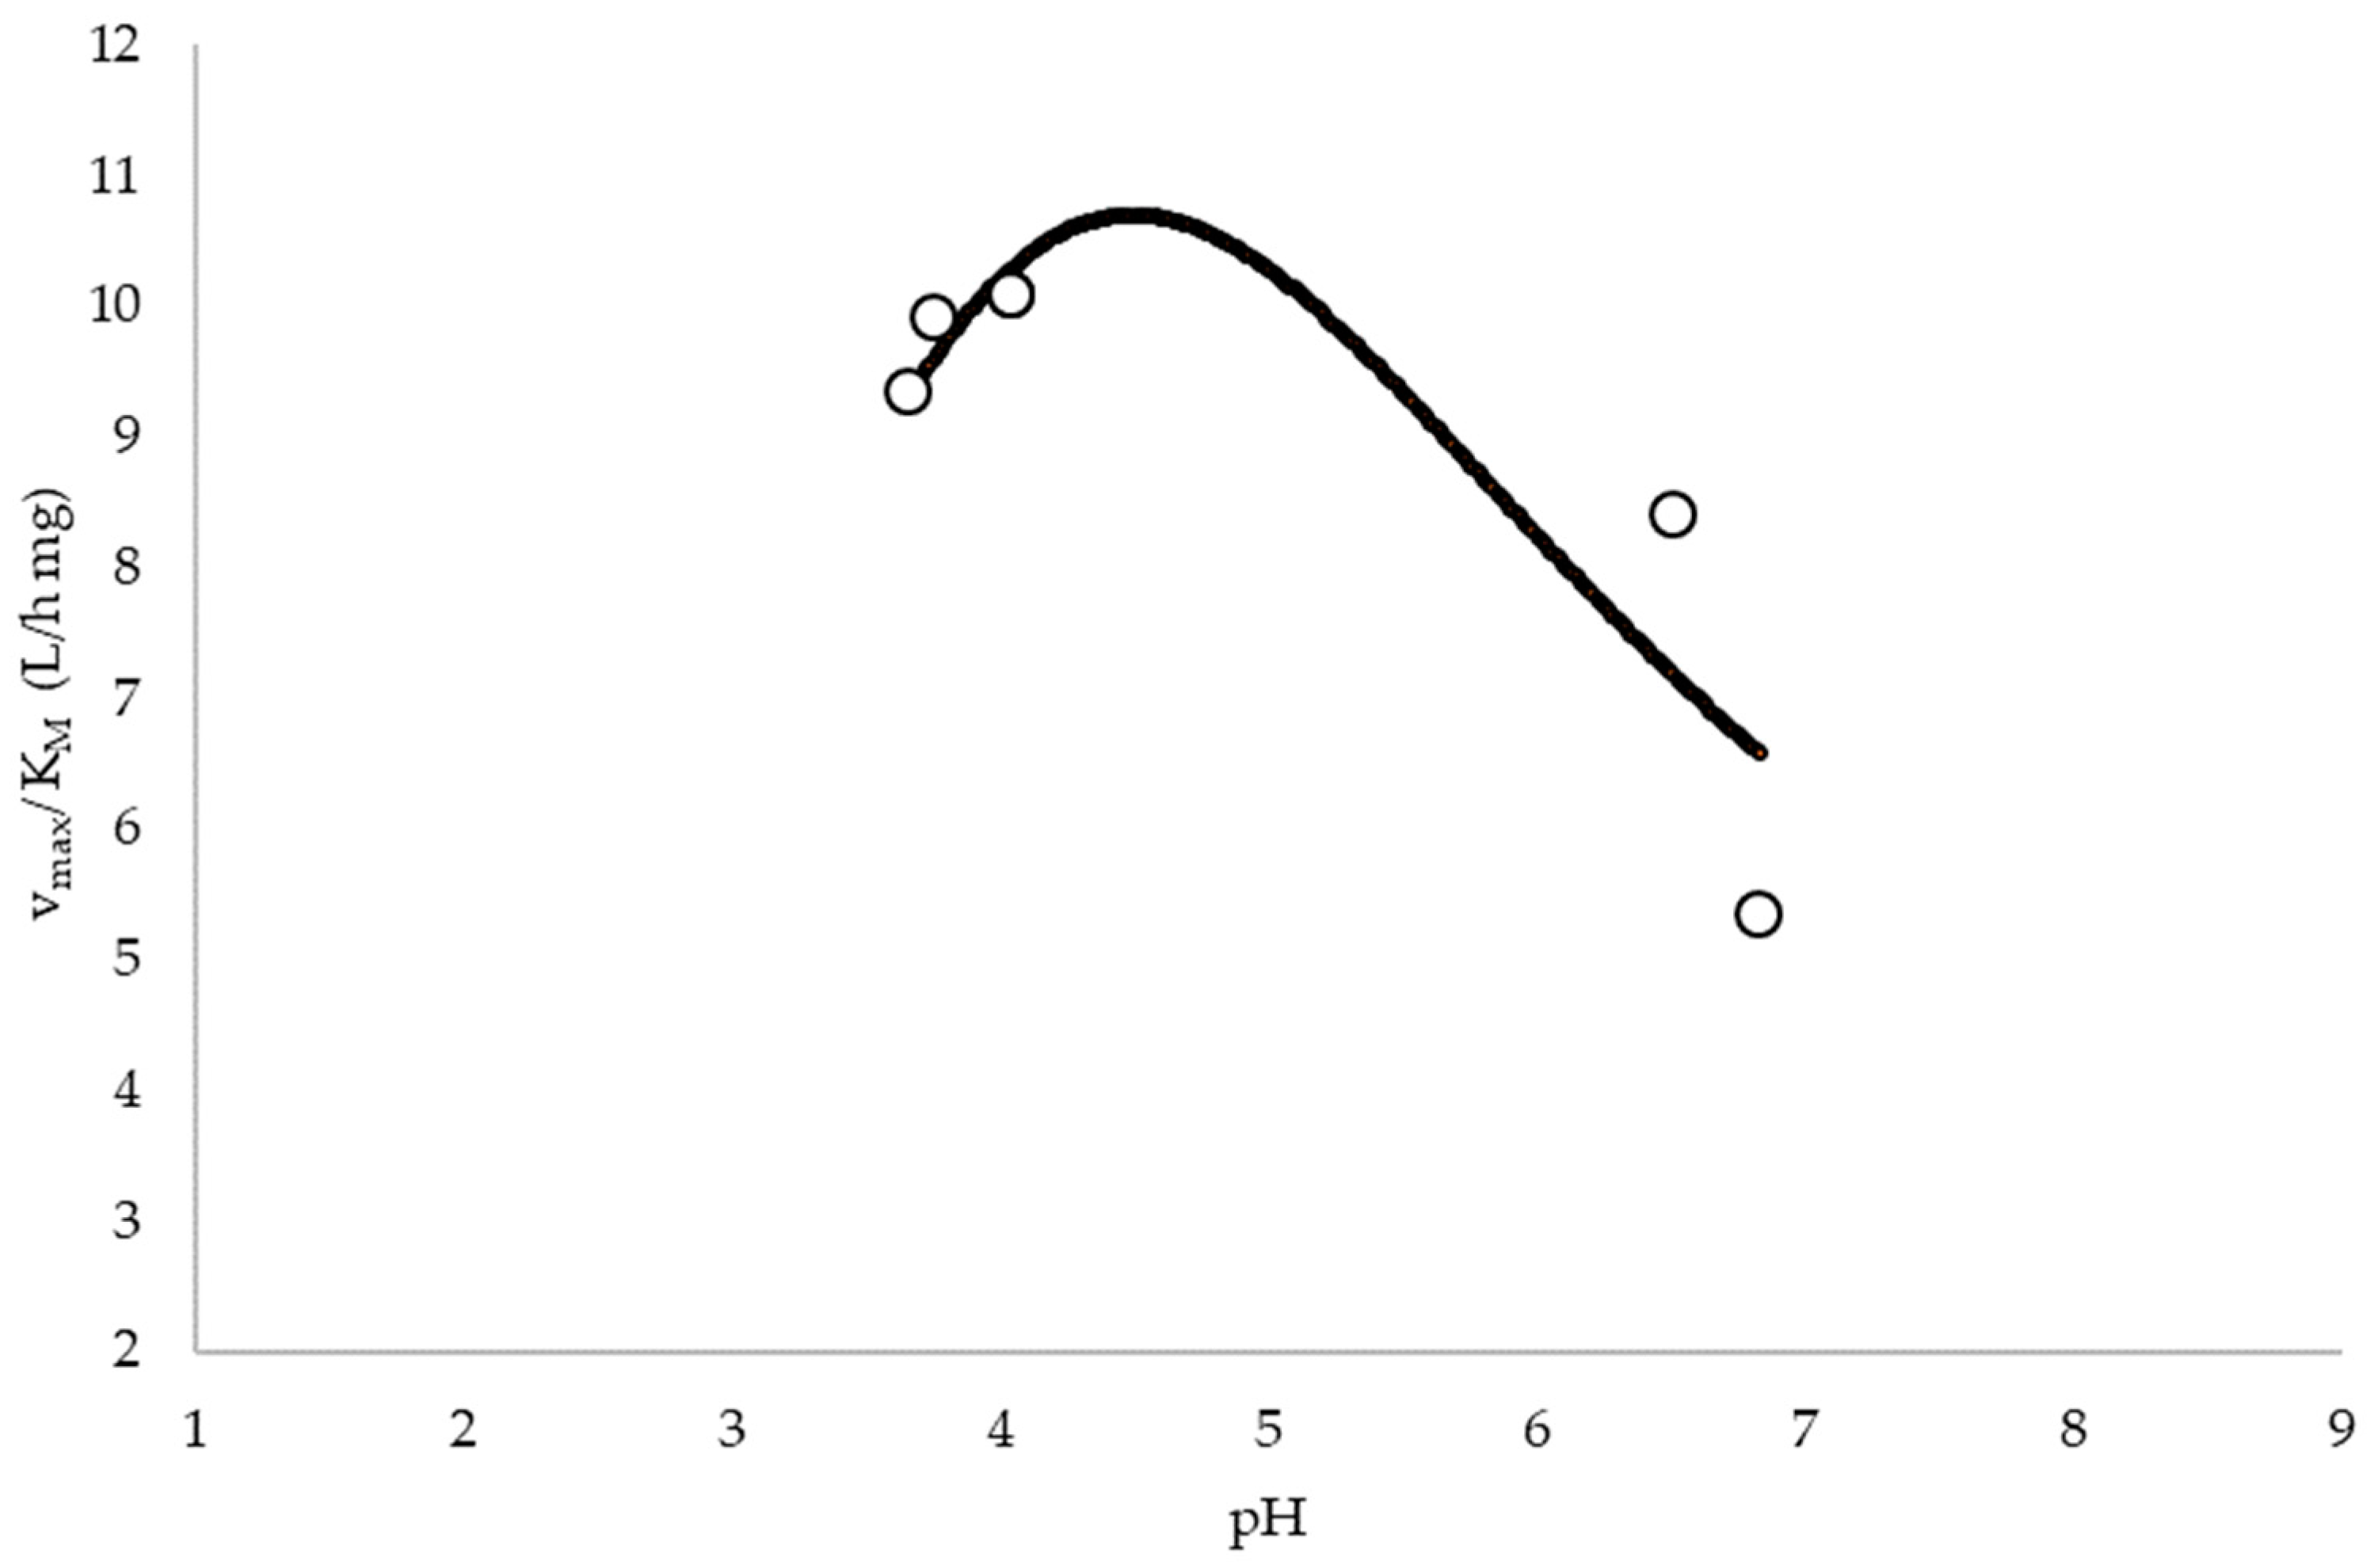
The va values, obtained at different pH values, have been fitted by a least-squares procedure and plotted against the pH in Figure 9.
The activities of many enzymes vary with pH, according to the dissociation of acids and bases, which can modify the overall electrical distribution on active catalysis site, by modifying enzyme catalysis capacity. The plot of (va) vs. (pH) shows an optimal pH condition, that can be described by Equation (4)
where va is the fitted kinetic parameter, veff is the ‘pH-corrected’ parameter, [H+] is the hydrogen-ion concentration and KI and KII are the ions dissociation constants. Similar results obtained for phenolic compounds in another study [26] proved the pH-stability of enzymes and the dissociation pathways in the same optimal pH range of 5–6.
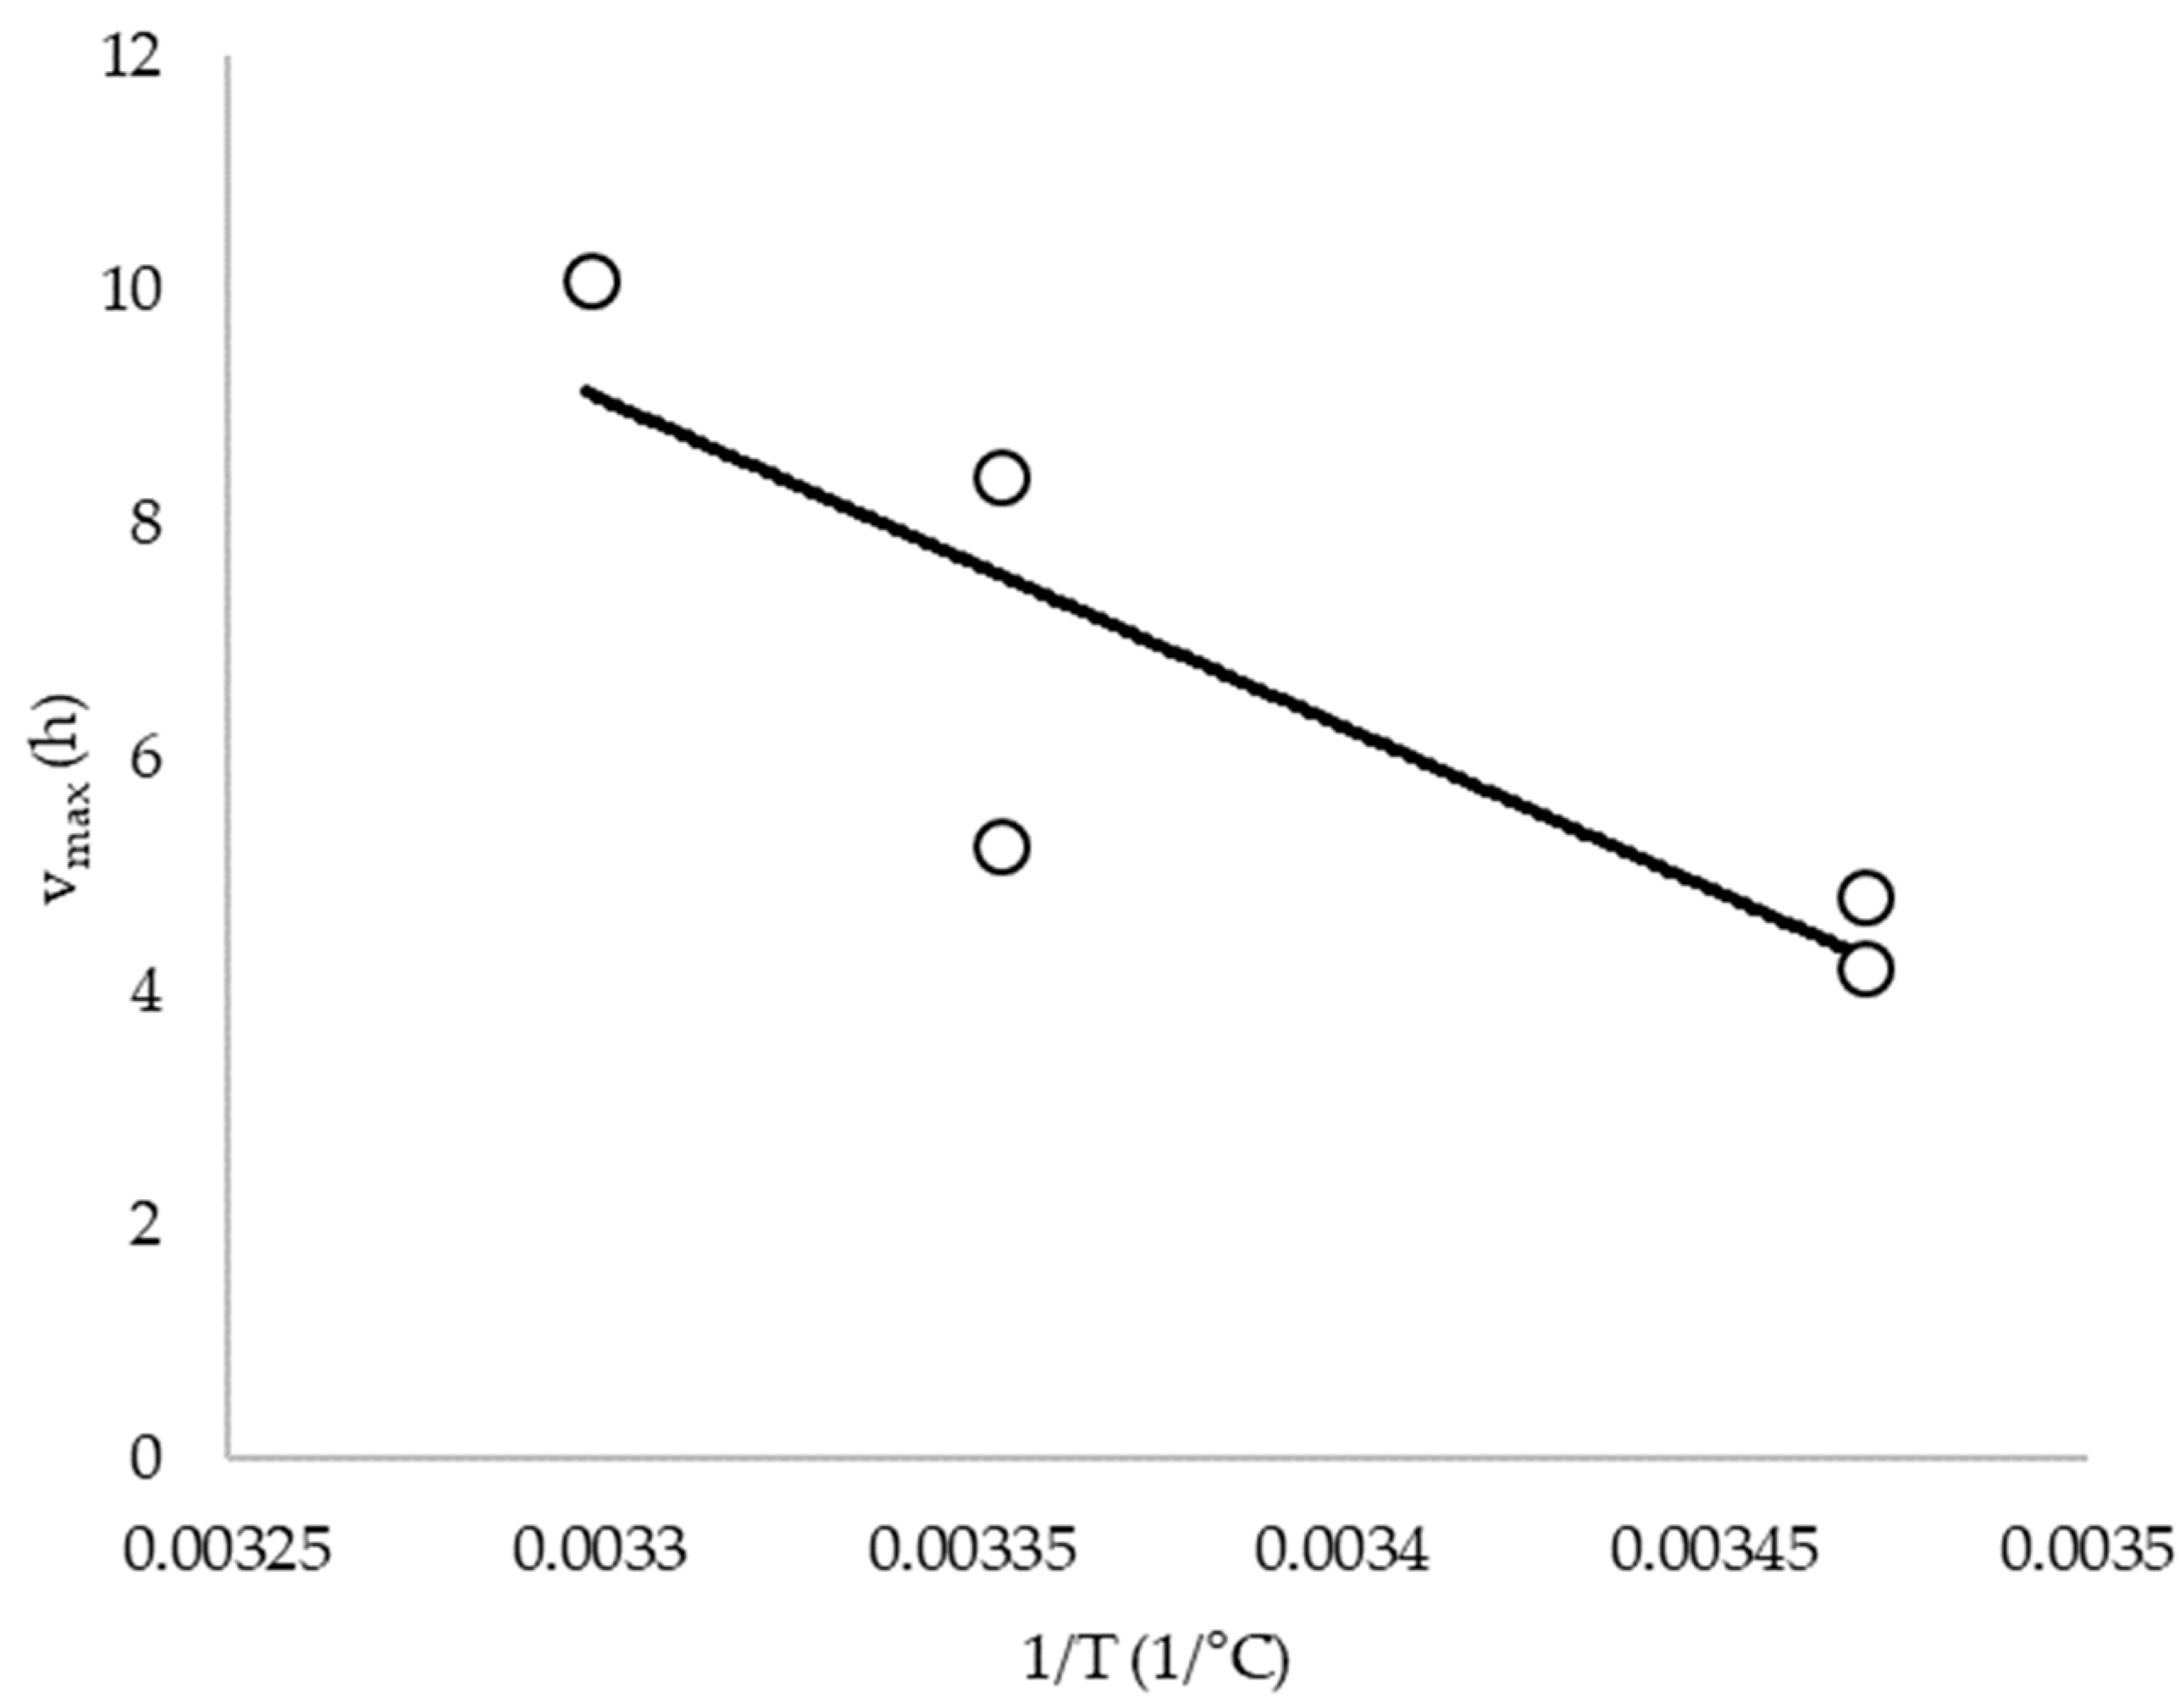
Finally, the temperature effect on kinetic parameters is reported as linear regression of (va) vs. (1/T), as shown in Figure 10.
Equation (5) that best fits the experimental data obtained at pH = 7, is:
va = 101.8 − 2.81 × 10⁴/T
This equation shows that a temperature increases has a positive effect on reaction velocity in the range below the beginning of thermal unfolding of enzyme structure.
4. Conclusions
An aerobic biological process was proposed and tested for the treatment of pyrolysis wastewater. The effect of initial TOC concentration, pH and temperature was investigated. Results show that a single aerobic biological process can be successfully used to induce organic mineralization. These results are promising in view of implementing a simple and cost effective method to reduce the environmental impact of pyrolysis residues, to be applied to small size plant, where byproducts recovery is not economically feasible.
The efficiency of the removal of TOC, after 72 h of treatment, was 55.65%, 49.47% and 53.03% in experiments with initial TOC of 800 mg/L, 1400 mg/L and 2000 mg/L respectively. The COD/TOC ratio was almost constant in all tests and a substrate inhibition on microorganism activity at high TOC initial value (2800 mg/L) was observed. An increase of removal efficiency could be successfully achieved by implementing a double step treatment. Experiments performed by adding the microbial biomass after 72 h showed that a TOC removal of 61.80% after 144 h was obtained and a reduction of COD/TOC from 2.72 to 1.77 was also observed. These results were attributed to the large amount of recalcitrant compounds compared to biological oxidation in the wastewater. A further enhancement of the overall treatment efficiency could be achieved by introducing a pretreatment of chemical oxidation, to increase the biodegradable fraction of the pollutant loading.
Author Contributions
L.D.P., I.B., M.C., P.D.F. and V.P. conceived and designed the experiments; I.B. performed the experiments; I.B. and M.C. analyzed the data; L.D.P. and P.D.F. contributed reagents/materials/analysis tools; L.D.P., I.B., M.C., P.D.F. and V.P wrote the paper.
Conflicts of Interest
The authors declare no conflict of interest.
Symbols Used
| COD | (mg/L) | chemical oxygen demand |
| KM | (mg/L) | semi-saturation constant |
| T | (°C) | temperature |
| T | (h) | time |
| TOC | (mg/L) | total organic carbon |
| V | (1/h) | observed initial rate |
| va | (1/h) | apparent rate |
| veff | (1/h) | effective pH-corrected rate |
| vmax | (1/h) | limiting value of the rate |
| X | (mg/L) | biomass concentration |
References
- Inguanzo, M.; Domínguez, A.; Menéndez, J.A.; Blanco, C.G.; Pis, J.J. On the pyrolysis of sewage sludge: The influence of pyrolysis conditions on solid, liquid and gas fractions. J. Anal. Appl. Pyrol. 2002, 63, 209–222. [Google Scholar] [CrossRef]
- Agrafioti, E.; Bouras, G.; Kalderis, D.; Diamadopoulos, E. Biochar production by sewage sludge pyrolysis. J. Anal. Appl. Pyrol. 2013, 101, 72–78. [Google Scholar] [CrossRef]
- Ioannidou, O.; Zabaniotou, A. Agricultural residues as precursors for activated carbon production—A review. Renew. Sustain. Energy Rev. 2007, 11, 1966–2005. [Google Scholar] [CrossRef]
- Salehin, S.; Aburizaiza, A.S.; Barakat, M.A. Activated carbon from residual oil fly ash for heavy metals removal from aqueous solution. Desalin. Water Treat. 2016, 57, 278–287. [Google Scholar] [CrossRef]
- De Filippis, P.; Di Palma, L.; Petrucci, E.; Scarsella, M.; Verdone, N. Production and characterization of adsorbent materials from sewage sludge by pyrolysis. Chem. Eng. Trans. 2013, 32, 205–210. [Google Scholar]
- Hernández-Montoya, V.; García-Servin, J.; Bueno-López, J.I. Thermal treatments and activation procedures used in the preparation of activated carbons. In Lignocellulosic Precursors Used in the Synthesis of Activated Carbon; Intech: Rijeka, Croatia, 2012; pp. 19–36. [Google Scholar]
- Seggiani, M.; Vitolo, S.; De Filippis, P. Effect of pre-oxidation on the porosity development in a heavy oil fly ash by CO2 activation. Fuel 2005, 84, 1593–1596. [Google Scholar] [CrossRef]
- Guerrero, M.; Ruiz, M.P.; Alzueta, M.U.; Bilbao, R.; Millera, A. Pyrolysis of eucalyptus at different heating rates: Studies of char characterization and oxidative reactivity. J. Anal. Appl. Pyrol. 2005, 74, 307–314. [Google Scholar] [CrossRef]
- Guillén, M.D.; Manzanos, M.J. Study of the volatile composition of an aqueous oak smoke preparation. Food Chem. 2002, 79, 283–292. [Google Scholar] [CrossRef]
- Solantausta, Y.; Beckman, D.; Bridgwater, A.; Diebold, J.; Elliott, D. Assessment of liquefaction and pyrolysis systems. Biomass Bioenergy 1992, 2, 279–297. [Google Scholar] [CrossRef]
- Bubonja-Sonje, M.; Giacometti, J.; Abram, M. Antioxidant and antilisterial activity of olive oil, cocoa and rosemary extract polyphenols. Food Chem. 2011, 127, 1821–1827. [Google Scholar] [CrossRef]
- Mohan, D.; Pittman, C.U., Jr.; Steele, P.H. Pyrolysis of wood/biomass for bio-oil: A critical review. Energy Fuel 2006, 20, 848–889. [Google Scholar] [CrossRef]
- de Caprariis, B.; De Filippis, P.; Hernandez, A.D.; Petrucci, E.; Petrullo, A.; Scarsella, M.; Turchi, M. Pyrolysis wastewater treatment by adsorption on biochars produced by poplar biomass. J. Environ. Manag. 2017, 197, 231–238. [Google Scholar] [CrossRef] [PubMed]
- Capocelli, M.; Joyce, E.; Lancia, A.; Mason, T.J.; Musmarra, D.; Prisciandaro, M. Sonochemical degradation of estradiols: Incidence of ultrasonic frequency. Chem. Eng. J. 2012, 210, 9–17. [Google Scholar] [CrossRef]
- Capocelli, M.; Prisciandaro, M.; Lancia, A.; Musmarra, D. Modeling of cavitation as an advanced wastewater treatment. Desalin. Water Treat. 2013, 51, 1609–1614. [Google Scholar] [CrossRef]
- Mehrjouei, M.; Muller, S.; Moller, D. Treatment of pyrolysis wastewater using heterogeneous advanced oxidation processes. Environ. Prog. Sustain. 2013, 33, 178–183. [Google Scholar] [CrossRef]
- Silva, J.R.O.; Santos, D.S.; Santos, U.R.; Eguiluz, K.I.B.; Salazar-Banda, G.R.; Schneider, J.K.; Krause, L.C.; López, J.A.; Hernández-Macedo, M.L. Electrochemical and/or microbiological treatment of pyrolysis wastewater. Chemosphere 2017, 185, 145–151. [Google Scholar] [CrossRef] [PubMed]
- Musmarra, D.; Prisciandaro, M.; Capocelli, M.; Karatza, D.; Iovino, P.; Canzano, S.; Lancia, A. Degradation of ibuprofen by hydrodynamic cavitation: Reaction pathways and effect of operational parameters. Ultrason. Sonochem. 2016, 29, 76–83. [Google Scholar] [CrossRef]
- Liu, Z.; Xie, W.; Li, D.; Peng, Y.; Li, Z.; Liu, S. Biodegradation of phenol by bacteria strain Acinetobacter Calcoaceticus PA isolated from phenolic wastewater. Int. J. Environ. Res. Public Health 2016, 13, 300. [Google Scholar] [CrossRef]
- Zhou, H.; Wei, C.; Zhang, F.; Liao, J.; Hu, Y.; Wu, H. Energy-saving optimization of coking wastewater treated by aerobic bio-treatment integrating two-stage activated carbon adsorption. J. Clean. Prod. 2018, 175, 467–476. [Google Scholar] [CrossRef]
- Zhu, H.; Han, Y.; Xu, C.; Han, H.; Ma, W. Overview of the state of the art of processes and technical bottlenecks for coal gasification wastewater treatment. Sci. Total. Environ. 2018, 637–638, 1108–1126. [Google Scholar] [CrossRef]
- APHA; AWWA; WPCF. Standard Methods for the Examinations of Water and Wastewater, 17th ed.; American Public Health Association: Washington, DC, USA, 2005. [Google Scholar]
- Ruiz-Ordaz, N.; Hernández-Manzano, E.; Ruiz-Lagúnez, J.C.; Cristiani-Urbina, E.; Galíndez-Mayer, J. Growth kinetic model that describes the inhibitory and lytic effects of phenol on Candida tropicalis yeast. Biotechnol. Prog. 1998, 14, 966–969. [Google Scholar] [CrossRef] [PubMed]
- Cazar, M.E.; Schmeda-Hirschmann, G.; Astudillo, L. Antimicrobial butyrolactone I derivatives from the Ecuadorian soil fungus Aspergillus terreus Thorn. var terreus. World J. Microbiol. Biotechnol. 2005, 21, 1067–1075. [Google Scholar] [CrossRef]
- Narendranath, N.V.; Thomas, K.C.; Ingledew, W.M. Effects of acetic acid and lactic acid on the growth of Saccharomyces cerevisiae in a minimal medium. J. Ind. Microb. Biotechnol. 2001, 26, 171–177. [Google Scholar] [CrossRef]
- Beltran, F.J.; Alvarez, P.M.; Rodriguez, E.M.; Garcia-Araya., J.F.; Rivas, J. Treatment of high strength distillery wastewater (cherry stillage) by integrated aerobic biological oxidation and ozonization. Biotechnol. Prog. 2001, 17, 462–467. [Google Scholar] [CrossRef] [PubMed]
- Rezasoltani, S.; Shayegan, J.; Jalali, S. Effect of pH on aerobic granulation and treatment performance in sequencing batch reactors. Chem. Eng. Technol. 2015, 38, 851–858. [Google Scholar] [CrossRef]
Figure 1.
Total organic carbon (TOC) removal trends during the aerobic treatment of pyrolysis wastewater at 30 °C (TOC initial concentration: (♦) 800 mg/L, (■) 1400 mg/L, (▲) 2000 mg/L and (○) 2800 mg/L).
Figure 1.
Total organic carbon (TOC) removal trends during the aerobic treatment of pyrolysis wastewater at 30 °C (TOC initial concentration: (♦) 800 mg/L, (■) 1400 mg/L, (▲) 2000 mg/L and (○) 2800 mg/L).

Figure 2.
Chemical oxygen demand (COD) removal trends during the aerobic treatment of pyrolysis wastewater at 30 °C (TOC initial concentration: (♦) 800 mg/L, (■) 1400 mg/L, (▲) 2000 mg/L and (○) 2800 mg/L).
Figure 2.
Chemical oxygen demand (COD) removal trends during the aerobic treatment of pyrolysis wastewater at 30 °C (TOC initial concentration: (♦) 800 mg/L, (■) 1400 mg/L, (▲) 2000 mg/L and (○) 2800 mg/L).

Figure 3.
pH evolution during the aerobic treatment of pyrolysis wastewater at 30 °C (TOC initial concentration: (♦) 800 mg/L, (■) 1400 mg/L, (▲) 2000 mg/L and (○) 2800 mg/L).
Figure 3.
pH evolution during the aerobic treatment of pyrolysis wastewater at 30 °C (TOC initial concentration: (♦) 800 mg/L, (■) 1400 mg/L, (▲) 2000 mg/L and (○) 2800 mg/L).

Figure 4.
Aerobic biological with two-reactor system of pyrolysis wastewater with TOC initial value equal to 1400 mg/L at 30 °C.
Figure 4.
Aerobic biological with two-reactor system of pyrolysis wastewater with TOC initial value equal to 1400 mg/L at 30 °C.

Figure 5.
Effect of pH on aerobic biological treatment of pyrolysis wastewater. COD (empty symbols) and TOC (full symbols) at free pH (square) and pH = 7 (rhomboid).
Figure 5.
Effect of pH on aerobic biological treatment of pyrolysis wastewater. COD (empty symbols) and TOC (full symbols) at free pH (square) and pH = 7 (rhomboid).

Figure 6.
Effect of temperature on aerobic biological treatment of pyrolysis wastewater. COD (full symbols) and TOC (empty symbols) at 15 °C (triangle), 25 °C (square) and 30 °C (rhomboid).
Figure 6.
Effect of temperature on aerobic biological treatment of pyrolysis wastewater. COD (full symbols) and TOC (empty symbols) at 15 °C (triangle), 25 °C (square) and 30 °C (rhomboid).

Figure 7.
pH evolution during the aerobic biological treatment of pyrolysis wastewater at 15 °C (triangle), 25 °C (square) and 30 °C (rhomboid).
Figure 7.
pH evolution during the aerobic biological treatment of pyrolysis wastewater at 15 °C (triangle), 25 °C (square) and 30 °C (rhomboid).

Figure 8.
COD vs. time and first order kinetics at different initial concentration (TOC initial concentration: (○) 800 mg/L, (●) 1400 mg/L, (▲) 2000 mg/L and (□) 2800 mg/L).
Figure 8.
COD vs. time and first order kinetics at different initial concentration (TOC initial concentration: (○) 800 mg/L, (●) 1400 mg/L, (▲) 2000 mg/L and (□) 2800 mg/L).

Figure 9.
Effect of pH on the kinetics of COD degradation at TOC0 = 1400 mg/L and T = 30 °C.

Figure 10.
Effect of temperature on the kinetics of COD degradation at TOC0 = 1400 mg/L and pH = 7.


Table 1.
Main physicochemical characteristic of the aqueous phase.
| Parameter | Value | |
| TOC | 82,700 mg/L | |
| pH | 3.2 | |
| List of the soluble organic compounds on dry basis | ||
| Retention Time (min) | Organic Compound | Mass Fraction (%) |
| 1.85 | Acetic acid, methyl ester | 8.65 |
| 1.97 | Acetic acid | 24.49 |
| 1.98 | 2-Butanol | 11.92 |
| 2.22 | 2-Propanone, 1-hydroxy- | 12.48 |
| 2.30 | Propanoic acid | 4.36 |
| 2.42 | 2-Butanone, 3-hydroxy- | 3.64 |
| 2.61 | 2-Butanol, 3-methyl- | 0.72 |
| 2.70 | Butanamide, 3,N-dihydroxy- | 0.44 |
| 2.79 | 1-Hydroxy-2-butanone | 2.63 |
| 2.84 | Butanoic acid | 0.78 |
| 2.89 | Propanal | 2.02 |
| 2.99 | Cyclopentanone | 1.36 |
| 3.05 | 3-Pentanol | 0.84 |
| 3.11 | Butane,2-ethoxy- | 0.64 |
| 3.36 | 2-Cyclopenten-1-one | 3.86 |
| 3.55 | Pentane, 1,3-epoxy-4-methyl- | 0.65 |
| 3.87 | 2-Furanmethanol, tetrahydro- | 0.26 |
| 3.90 | 1,3-Butanediol | 0.62 |
| 4.05 | 2-Cyclopenten-1-one, 2-methyl- | 1.37 |
| 4.09 | Ethanone, 1-(2-furanyl)- | 0.50 |
| 4.12 | Butyrolactone | 3.74 |
| 4.52 | 2(3H)-Furanone, dihydro-5-methyl- | 0.62 |
| 4.57 | 2H-Pyran-2-one, tetrahydro- | 0.43 |
| 4.65 | 2-Cyclopenten-1-one, 3-methyl- | 1.06 |
| 4.81 | Phenol | 1.15 |
| 4.94 | 6-Methyl-3-heptyne | 0.30 |
| 4.98 | Cyclohexanone, 3-methyl-, (R)- | 0.29 |
| 5.00 | 1-Hydroxy-2-pentanone | 0.56 |
| 5.23 | 1,2-Cyclopentanedione, 3-methyl- | 3.10 |
| 5.35 | 2-Cyclopenten-1-one, 2,3-dimethyl | 0.52 |
| 5.48 | 2-Hydroxy-3,5-dimethylcyclopent-2-en-1-one | 1.25 |
| 5.80 | Phenol, 2-methoxy- | 2.46 |
| 6.07 | 2-Cyclopenten-1-one, 3-ethyl-2-hydroxy | 0.50 |
| 6.30 | 4-Isoprpylcyclohexanone | 0.51 |
| 6.74 | Phenol, 2-methoxy-4-methyl- | 1.11 |
© 2019 by the authors. Licensee MDPI, Basel, Switzerland. This article is an open access article distributed under the terms and conditions of the Creative Commons Attribution (CC BY) license (http://creativecommons.org/licenses/by/4.0/).
Share and Cite
MDPI and ACS Style
Di Palma, L.; Bavasso, I.; Capocelli, M.; De Filippis, P.; Piemonte, V. Biological Treatment of Wastewater from Pyrolysis Plant: Effect of Organics Concentration, pH and Temperature. Water 2019, 11, 336. https://doi.org/10.3390/w11020336
AMA Style
Di Palma L, Bavasso I, Capocelli M, De Filippis P, Piemonte V. Biological Treatment of Wastewater from Pyrolysis Plant: Effect of Organics Concentration, pH and Temperature. Water. 2019; 11(2):336. https://doi.org/10.3390/w11020336
Chicago/Turabian StyleDi Palma, Luca, Irene Bavasso, Mauro Capocelli, Paolo De Filippis, and Vincenzo Piemonte. 2019. "Biological Treatment of Wastewater from Pyrolysis Plant: Effect of Organics Concentration, pH and Temperature" Water 11, no. 2: 336. https://doi.org/10.3390/w11020336
Note that from the first issue of 2016, this journal uses article numbers instead of page numbers. See further details here.