Update of Early Warning Indicators of Flash Floods: A Case Study of Hunjiang District, Northeastern China

1
School of Geographic and Environmental Sciences, Tianjin Normal University, Tianjin 300387, China
2
Beijing Seven Trillion Technology Co., Ltd., Beijing 100038, China
3
Lab of Spatial Information Integration, Institute of Remote Sensing and Digital Earth, Chinese Academy of Sciences, Beijing 100101, China
*
Author to whom correspondence should be addressed.
Water 2019, 11(2), 314; https://doi.org/10.3390/w11020314
Submission received: 1 January 2019
/
Revised: 2 February 2019
/
Accepted: 11 February 2019
/
Published: 12 February 2019
(This article belongs to the Special Issue Assessment of Current and Future Vulnerability of Flooding with Hydrologic/Hydraulic Modeling and Remote Sensing Techniques)
Abstract
:The China flash flood investigation and evaluation database (CFFIED) covers important information needed for China’s flash flood warning. This paper uses a statistical induction method, inference formula method and standardized unit hydrograph method to explore its principle, characteristics, and key steps. Then based on the field investigation and the latest data on the flash flood, the Hunjiang District in northeastern China was selected as the research area. Firstly, three typical riverside villages, Xiangmo-1 and Sanchahe-3, Shangqing-4, were screened, and the flash flood warning indicators (e.g., water level, flow rate, critical rainfall) in the CFFIED were updated. Then, the maximum error of the flood peak, estimated by the inference formula method and the water level flow relationship method, is only 10.6%, which indicates that the predicted flood peak flow has high credibility and can check and identify the early warning index; the Manning formula is more accurate in calculating the water level flow relationship. However, the calculated ratio is lower and the roughness is higher, and the flow is smaller under the same water level. Finally, the updated flash flood warning indicators were obtained in the Hunjiang District, which improves the accuracy of the flash flood warning, and provides a reference for updating the early warning indicators in other areas.
1. Introduction
Extreme torrential rains (i.e., high intensity and short duration) are known for triggering devastating flash floods in various regions of the world, especially in small basins (hundreds of square kilometers or less) characterized by complex terrain [1]. Flash floods disasters have the highest mortality rate of flood disasters, accounting for about 85% [2], often causing landslides and mudslides to occur together, thus amplifying potential threats to human life and property [3,4]. They have characteristics different from river floods, especially short-term scales and small spatial scales, which make flash flood warnings more critical [5]. Currently, quantitative prediction of flash floods is a challenge, especially for lead times shorter than 1–3 h. In the US, Europe, and Australia, many deaths occur when people enter or are swept into floodwaters, either in a vehicle or on foot, in part because of the low accuracy of the warnings that prevent them from realizing or misjudging the risk [6,7,8]. Thus, providing more accurate warnings for giving people more time to defend against flash floods is of utmost importance.
To better predict flash flood events and mitigate their impacts, different countries have adopted different defense measures. Since the 1970s, the United States has established a flash flood guidance system (FFGS) [9]. With 40 years of development, it has basically realized real-time monitoring and early warning of flash floods and has become one of the most widely used systems in the world [10,11]. The future direction is a flash flood forecasting system based on a distributed hydrological model [12,13]. Since the 21st century, Japan has basically formed a relatively perfect flash flood disaster prevention system [14]. Since the 1990s, Taiwan has formed a relatively complete monitoring and early warning system, focusing on early warning and evacuation of flash floods. In addition, there are the European flash flood system (EFFS) [15], the Australian ALERT system and the Malaysian GEOREX FLOOD system. However, these systems utilized the return period as the identification method of flash flood disasters. Although they have strong operability, the rivers in mountainous areas change drastically, and the flood return period corresponding to the flat beach flow in the rivers varies greatly. Some studies also indicate that the disaster flow is the biggest source of uncertainty for FFG systems. The China national flood forecasting System (CNFFS) started late and was initially established from 2010 to 2016 [16]. Among them, the comprehensive national investigation and evaluation of flash floods covered an area of 7.56 million km2 and 0.5 million administrative villages with a total population of 900 million [17], mainly including the distribution law and risk zoning, the storm flood law in small watersheds, the early warning indicators, the prediction model, the monitoring and early warning system and the group monitoring and prevention system [18,19]. However, the research and application started relatively late, and the research is still in the exploratory stage. Moreover, the errors in the statistical data of the grassroots are obvious, resulting in insufficient timeliness and inaccurate warnings. Therefore, it is urgent to take reasonable measures to check and verify early warning indicators, thereby improving the accuracy of flash flood monitoring and forecasting.
The early warning and forecasting of the flash flood are mainly embodied in the early warning and forecasting of floods. At first, it mainly focuses on the process of production and convergence, extends to the study of meteorological predictions, and then utilizes the new technologies to improve the warning accuracy, which in turn evolves into modeling and systematization [20]. The early warning indicators widely used are mainly related to rainfall, soil moisture, and the underlying surface, which vary greatly with different regions, and should be further confirmed by expert experience. The real-time flash flood warning methods are mainly based on a distributed hydrological model or adopting dynamic critical rainfall warning methods abroad, which requires special support platform for complex calculation. For one thing, the distributed hydrological model requires a large amount of historical basis data to calibrate parameters. For another, in order to optimize the model’s own structure, it is necessary to develop a more reasonable organizational structure or calculation method to determine the parameters. In China’s early stage, the full experience method was adopted, followed by the semi-empirical and semi-theoretical methods, and then gradually developed into real-time dynamic early warning based on the distributed hydrological model. The common methods are mainly classified into statistical induction method, hydro-hydraulic method, and hydro-model method. Based on the practical feasibility, the statistical induction method and the hydro-hydraulic method can directly derive the critical rainfall from the rainfall data and the flash flood data, which is simple and feasible [21,22]. In short, whichever method is employed, the parameter accuracy is one of the key factors affecting the flash flood warning.
In this paper, the Hunjiang District of Northeast China is taken as a typical study area, and the flash flood warning indicators are checked and verified based on statistical induction and hydrological hydraulic methods. We first explore the principle, characteristics, and applicability of the method, followed by an on-the-spot investigation of recent flash flood events, combined with measured data and existing data from CFFIED, and further examined, identified and updated its early warning indicators after comprehensively determining the verification targets. The main objectives are: (i) to determine the reviewing object of the district comprehensively, (ii) to calculate and analyze the peak flow, disaster flow and total flood volume, (iii) to check and verify the early warning indicators of rainfall, the results of which will form a scientific basis for the flash flood warning service of the information society.
2. Material and Methods
2.1. Study Area
Located in the northeastern part of China, Hunjiang District is a municipal district of Baishan City, Jilin Province. It has 54 administrative villages with a total population of 337,000, a cultivated area of 6183 ha, and a forest coverage rate of 76.6%. It belongs to the continental East Asian monsoon climate, which is long, dry and cold in winter and short, warm and rainy in summer. The average annual temperature is 4.7 °C, followed by the average annual precipitation of 860.1 mm, and the average annual surface evaporation of 1000–1100 mm. The rainfall mainly concentrated in June–August, and the heavy rainfall mostly occurred from mid-July to mid-August, accounting for about 52% of the total annual precipitation. Due to frequent heavy rains, high intensity, short duration and strong seasonality, coupled with the steep slope of the river channel, it is easy to trigger floods. The flash floods in the Lansing area are mainly rainstorms and floods, which coincide with the main flood season (June–August). The four flood disaster records were recorded in 1995, 1998, 2010 and 2018, especially the “7.31” torrential rain flash flood in 2010. The rainfall was concentrated and lasted for a long time, resulting in 11,496 ha of crops being affected, three people dead or missing, and 8178 houses collapsed. Figure 1 shows the location and topographic map of the Hunjiang District.
Hunjiang District is one of the Chinese flash flood prevention counties, with 41 key prevention villages, 69 rainfall stations and three hydrological stations, mainly distributed in the middle area. It established a set of flash flood disaster prevention systems, which realize the real-time linkage of monitoring water and rain, issuing early warning and forecasting, and group monitoring and prevention.
2.2. Methodology
Design flood calculation includes design rainstorm calculation, runoff generation calculation, and convergence calculation. It mainly uses the inference formula method, manning formula method and standardized unit line method for analysis and calculation.
2.2.1. Design Rainstorm Calculation
The flash flood is caused by short-term torrential rains, calculated by combining the rainstorm diminishing index n and the storm formula with the 24-h design rainfall, where n is calculated from the relationship between the average rainfall and the corresponding diachronic point over the years, and the conversion from point rainfall to surface rainfall is calculated using the point reduction factor. The formula for calculating critical rainfall is given in Equation (1).
Suppose there are S rainfall stations in the certain area, and count the rainfall of N times in the T time period. Rtij is the maximum rainfall of the j-th flash flood at the i-th rain station in t period, and the smallest of the N statistical values is initially considered as the critical rainfall, and the calculation formula is as follows:
where is the critical rainfall tentatively, Rtij is the maximum rainfall of the j-th flash flood at the i-th rain station in t period.
(1) Single Station Critical Rainfall Analysis
The single station critical rainfall method refers to determining the critical rainfall according to the initial value of the critical rainfall of each station. When the surface rainfall exceeds , or when there is at least one station in the area where the rain intensity exceeds , flash floods may occur. When the rainfall intensity of each site in the area exceeds , there will be a large number of flash flood events in the area.
(2) Regional Critical Rainfall Method
If flash floods occur in the area (a flash flood occurs in one station), all rainfall stations in the area are counted for their corresponding rainfall process data.
where Rtj is the maximum average rainfall in the corresponding rainfall process of the j-th flash flood in the t period (obtained by moving average), and there are N (one for each disaster) maximum surface average rainfall in each period.
2.2.2. Runoff Generation Calculation
The Hunjiang district is dominated by the accumulation of runoff. The definition of α is shown in Equation (6). The curve of WM~α is plotted, which is the area distribution curve of water storage capacity in the basin. The curve is a single increase curve, which characterizes the spatial heterogeneity of soil water shortage.
where B is a parabolic index, reflecting the spatial heterogeneity of the water storage capacity in the basin. WM is the water storage capacity at a certain point in the basin, WMM is the largest point storage capacity in the basin, f is the basin area when the storage capacity ≤ WM, F is the basin area. The average water storage capacity of the basin is:
The amount of precipitation after deducting the evapotranspiration in the basin is recorded as the net rainfall PE. Corresponding to the initial soil moisture W, the area where the soil moisture has reached the storage capacity is a0, and the maximum point storage capacity corresponding to a0 is α.
As a result, the formula for calculating the flow rate of a river basin is:
2.2.3. Confluence Calculation
(1) Inference Formula Method
Inference formula method is a common method to calculate flood peak discharge from a rainstorm in a small watershed. The method follows three assumptions; (1) the average net rainfall intensity is equal to the convergence duration τ, (2) the net rain intensity is constant both in time and space and, (3) the net rainfall intensity on the watershed is invariable in time and space.
where J is the average aspect ratio drop along the process, m is confluence parameter; Qm is the peak flow under design standards, SP is the rain force of design rainstorm, is the basin confluence time, is the loss parameter and is mainly determined according to local experience, F is the watershed area, and L is the longest runoff confluence path in the watershed.
The parameter m can be determined according to the watershed characteristic factor θ, and the calculation formula of the parameter θ is:
tc is the duration of net rainfall, and the calculation of flood peak runoff coefficient φ is theoretically divided into two parts:
When tc ≥ τ, full confluence occurs:
When tc < τ, partial confluence occurs:
where μ is the comprehensive loss parameter, and the value can be taken as f according to the “User’s Manual for Storm Runoff Chart of Jilin Province”.
The runoff concentration time τ and flood peak discharge Qm can be calculated by introducing the above parameters into the Equations (10) and (11) according to the trial algorithm and graphic method.
(2) Water level-discharge curves
The Manning formula is used to obtain the water level-discharge curve of the control section where the disaster prevention object is located. The calculation formula is as follows:
where Qm is the flow rate in m/s, A is flow area of the section in m2, n is the roughness, R is the hydraulic radius in m, and J is the hydraulic gradient of the river. Refer to HEC-RAS to divide the control section into the left bank, for more details on HEC-RAS, please see Pappenberger et al. (2005) [23]. The discharges of the main channel and the right bank were calculated separately. It is assumed that the surface shear force exists at the interface between the beach and the channel. According to the equilibrium relationship of force and the momentum transport theory of Prandtl, the relationship of shear stress at the interface between the beach and the channel is determined, and then the discharge of the three parts is determined. The calculation formula is as follows:
The formula for calculating the flow rate of the main channel:
The formula for calculating the flow velocity of the left bank:
The formula for calculating the flow velocity of the right bank:
where: , , are main channel flow velocity, left bank flow velocity and right bank flow velocity, respectively, in m/s; , , are the chezy coefficient of the main channel, left bank and right bank, respectively; , are hydraulic the radius of main channel, left bank and the right bank, respectively, in m; is river gradient; is momentum transport coefficient; , , , are model coefficients; , , , , where , are water depth on left bank and right bank, respectively; , , are the wet perimeter of the river channel.
The total flow through the channel is:
where: is the total flow of channel in m3/s; , , are the velocity of the main channel, left shore, and right shore in m/s; , , are effective cross-section area of main cthe hannel, left bank and right bank, respectively, in m2.
Since the water–surface ratio is difficult to measure when the flash flood occurs, this paper mainly determines the water–surface ratio based on the distribution data of the recent flood marks along the way, but should pay attention to the following points:
- (i)
- The water–surface ratio determined by the flood marks of the latest floods should be selected.
- (ii)
- The comprehensive gradient (no sudden change at the bottom of the river) or the partial gradient (sudden change, for example, the gradient of the upstream section of the dam must be the gradient of the upstream water–surface, and the additional gradient caused by the river congestion should be eliminated.
The calculation is usually handled in the following two cases:
(1) When the river is relatively straight, without intermediate scarp and overfall, the bed slope is calculated as follows:
(2) When the river is relatively meandering, with intermediate scarp and overfall, the bed slope is calculated as follows:
where denotes the bed slope; l is river length, ; denotes the bottom elevations of the locations from upstream to downstream; denotes the point spans of the river.
Furthermore, considering that levees often exist at the control section, and under certain conditions, when the water level exceeds a certain height of the main channel, the effective cross-section on the left and right beaches is almost zero. At this time, a “virtual dike” is added to the river bed to ensure the effective area of the cross-section. Through the water level-flow relationship analysis, the design peak flow of the river control section is converted into the corresponding water level, and then the relationship curve of water level and discharge is drawn.
(3) Unit hydrograph method
When analyzing watersheds by unit hydrographs (small watersheds or calculation units), the spatial distribution characteristics of topography and vegetation in watersheds are fully considered. The basic principle is to analyze the unit line by using the time-area relationship of the watershed. The key is to calculate the convergence time of the basin’s each point to reach the basin outlet.
(a) Flow rate velocity
The formula for calculating the slope flow is as follows:
where V is the flow velocity in m/s, S is the slop of the flow direction, i is rainfall intensity, K is flowed velocity coefficient, mainly reflecting the impact of land use characteristics in m/s.
However, the formula for calculating the flow velocity on the slope proposed by SCS does not take into account the hydraulic conditions, i.e., the effect of rainfall on the confluence velocity. So, the equation is modified as follows:
where i is rainfall intensity, in mm/h.
(b) Calculation of concentration time
At any point in the watershed, there is a fixed confluence path to its outlet. The residence time of runoff in each grid is calculated by the following formula:
where is the runoff time in the grid, V is flow speed in m/s, L is the cell length of DEM. Along the confluence path, the following formula can be used to calculate the confluence time of each grid to the outlet of the basin:
where is the convergence time of the runoff in the grid to reach the outlet of the small watershed, and m is the number of grids on the runoff path.
(c) The calculation of unit hydrograph
The probability distribution curve is obtained by statistically calculating the convergence time (the abscissa is the confluence time, and the ordinate is the ratio of the outflow area to the time in the calculation period), and then convert the instantaneous unit line to the time unit line. The conversion formula is:
where is time period of unit hydrograph, h, is unit hydrograph for each period in m3/s, F is watershed area in km2, S(t) is the S curve obtained from the instantaneous unit hydrograph.
Since the calculation of the convergence time and the instantaneous unit line of the watershed does not take into account the regulation and storage of the watershed, it is necessary to perform a linear reservoir adjustment and storage of the time unit line converted by the instantaneous unit line, thereby obtaining a small watershed unit line. The calculation method for storage is:
where uhi is the unit hydrograph of small watershed after storage in m3/s, I is the unit hydrograph of small watershed before storage in m3/s, and c is the storage coefficient.
After obtaining the new unit hydrograph, the surface runoff process can be obtained by convolution calculation with the net rainfall analysis. According to the underground runoff, “isosceles triangle” can be used to generalize. Finally, the design flood process can be obtained by surface runoff accumulation and underground runoff over time.
2.3. Data Sources
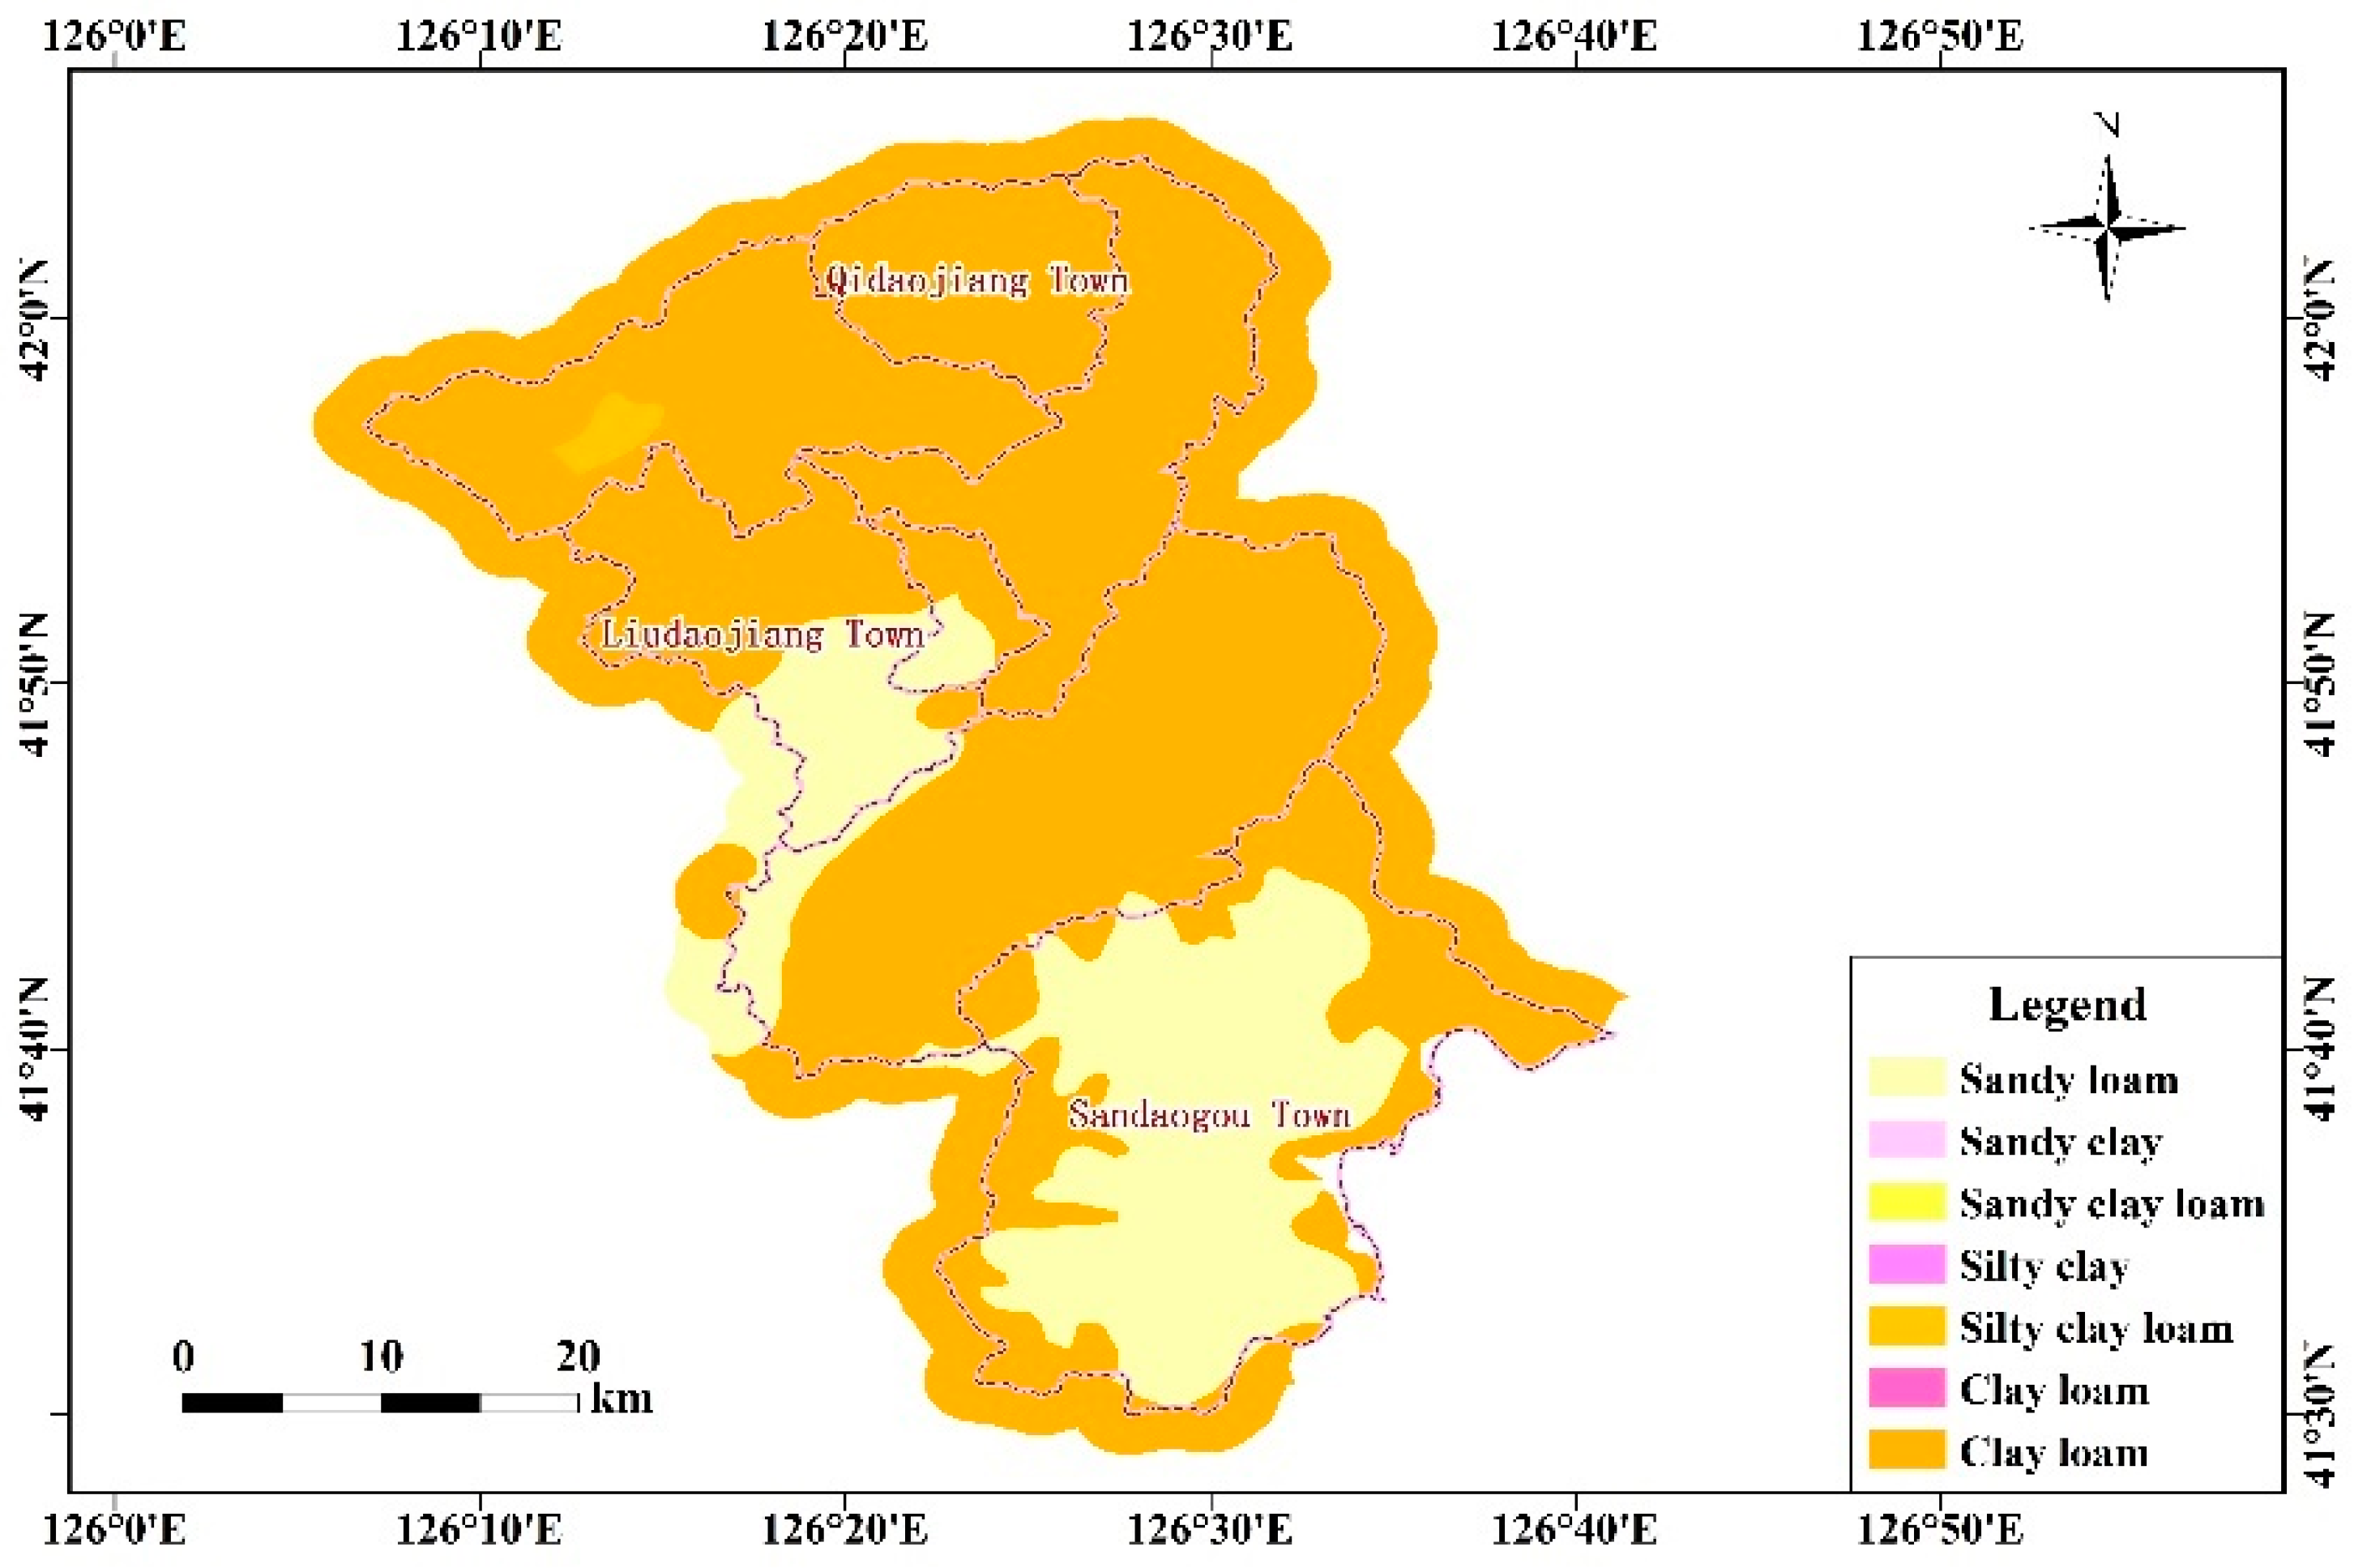
The data mainly came from the CFFIED, including basic data (e.g., underlying surface data, rainfall characteristics data, human activities impact data), field survey data (e.g., basic attribute data of small watershed unit, cross-section data, measured disaster point data, water-related projects) and evaluation data (e.g., analysis of storm and flood regularity in small watershed, water level-discharge relationship, population-elevation relationship, design flood, dangerous area map, etc.). Among them, the working base map data issued by the state mainly include remote sensing image map, Digital Line Graphic (DLG) data, and corresponding unit line data; The data of flash flood station mainly refers to the newly built rainfall station, water level station and hydrological station data in the flash flood prevention project. Using GIS and other software to process the DLG data issued by the country, the basic data of river basin, river, soil texture, land use and vegetation cover in the Hunjiang District were extracted. The completeness, consistency, and reliability of the data were tested. Figure 2 and Figure 3 show the vegetation information and soil conditions of the watershed and collect the attribute data of the watershed, including the code, name, area, perimeter, average slope, and a maximum elevation of the basin. Rainfall data is measured data of long sequences at the rainfall station.
3. Results and Discussion
3.1. Determine Updating Object
Based on the measured data and experience value, the typical villages along the river in Hunjiang District are firstly screened from the recent flash flood data, meteorological and hydrological data, topographic and demographic data. Then the re-checked object is decided on the basis of field investigation.
- (1)
- Meteorological and hydrological data. Due to the flash flood watershed is mostly less than 200 km2, one of the screening conditions is the watershed area is less than 1000 km2 (considering the original disaster prevention objects, hydrometeorological data, and station distribution). Moreover, taking into account the short-duration characteristics of heavy rainfall, and the rapid convergence of the slopes, and the rapid convergence of the river on the slope, both the areas with smaller upstream watersheds and better rainfall data are considered.
- (2)
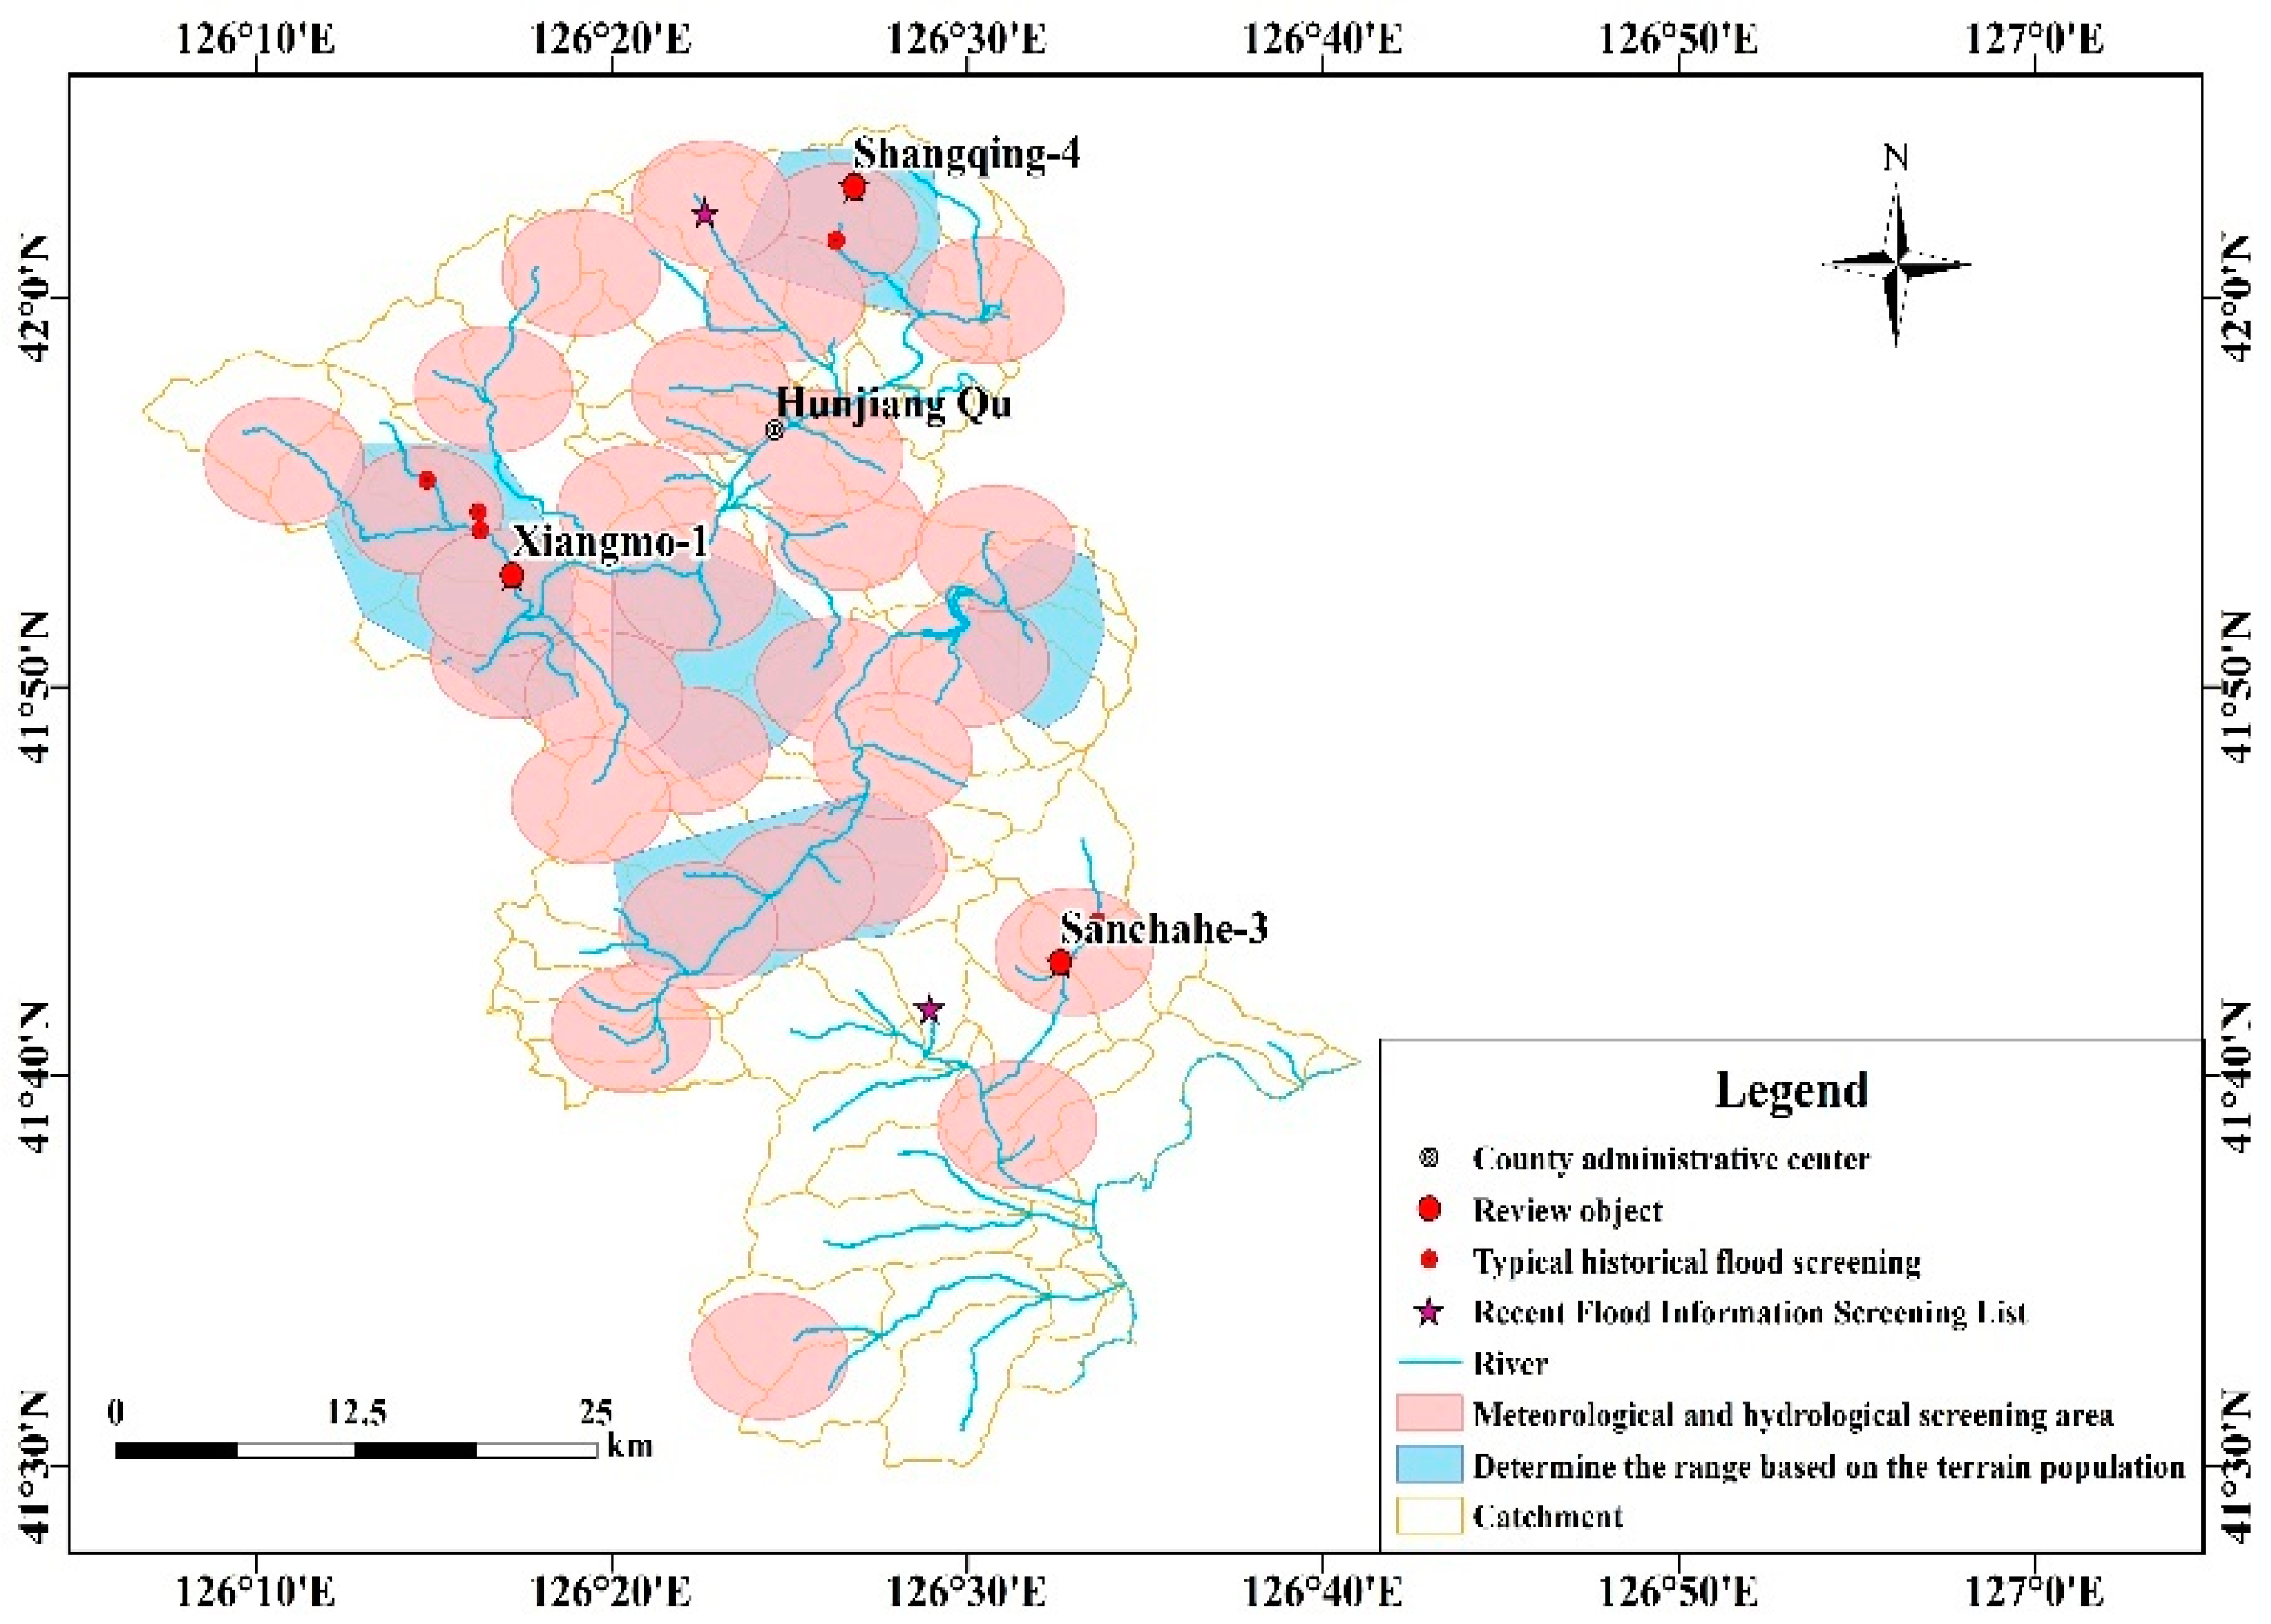
- Typical historical flash flood. Since the convergence time of flash flood is usually less than 12 h, considering the spatial–temporal distribution, frequency, the average value and variation coefficient of heavy rain, the northern Hunjiang district is the key prevention area, which mainly distributes in the central region from west to east. In the northeast hilly area, the upstream is prone to trigger flash flood disasters due to the small catchment area. Combined with the recent flash flood disaster data and expert scoring, Figure 4 is the Distribution map of the review objects in Hunjiang. Table 1 is the watershed attribute information. Among them, Xiangmu-1 and Sanchahe-3 are located in the lower reaches of the river, mainly affected by upstream rainfall, and are typical villages that cause floods due to the fluctuation of river floods.
3.2. Design Flood
The peak discharge was calculated from the flood distribution and the hydraulic characteristics of the river section. When there is no hydrological station in the survey section, the flood level fluctuation process was obtained according to the field investigation or literature verification, and the flow process line was obtained by combining the water level flow relationship of the river section. When there is a hydrological station in the survey section, the two relationships (water level and discharge, flood peak and flood time in each period) have been established to calculate the flood peak flow and the corresponding flood time.
3.2.1. Water Level-Discharge Curves
The flood marks refer to the natural traces left over the river buildings or river banks that mark the flood reaching the highest water level, which is the response of the flood size and disaster situation. The GNSS RTK method, a real-time dynamic positioning measurement method based on global navigation satellite system, was used to collect the data of recent flood trace distribution along the river. We conducted field research on the recent flood mark distribution, adopted the GNSS RTK method to obtain the highest water surface line of each flood, and then determine the maximum water level and water–surface ratio of the historical flood in a given section, or we referred to the longitudinal slope of the river channel, using the comprehensive ratio drop (no abrupt change at the bottom of river) or partial ratio drop (with a sudden change, such as the ratio of the upstream water surface to the upper section of the dam, eliminating the additional ratio caused by the congestion of the river). The roughness was determined by the measured hydrological data, or in the un-gauged area, comprehensively determined by channel morphology and effective section.
Taking Shangqing-4 as an example, the relationship between water level and discharge was obtained by Manning’s formula according to the control section, the updated roughness, and the ratio drop (Figure 5). Obviously, the flood flow from the CFFIED was smaller than that of re-checked results at the same water level. Mainly under the natural conditions, the water–surface ratio was lower than the river bed ratio. Therefore, in the un-gauged area, the river bed ratio will produce a large error, resulting in a large effective water cross section but a small flow velocity, and a jump point in the water level flow relationship curve. The same method was used to obtain the water level and discharge relationship between Xiangmo-1 Village and Sanchahe-3 Village as shown in Table 2, as well as the calculated design peak flow.
3.2.2. Inference Formula
Selecting the 50-year flood process on 23 August 2018, the convergence parameter m is combined with the on-site investigation and expert scoring to determine 0.2, using the inference formula method and the updated parameters to calculate the flood-related information when the historical flood marks occur (Table 3). Obviously, the maximum error between the two methods was only 10.6%, which indicates that the proposed flood peak has high credibility and can be applied to the inspection and review of early warning indicators.
3.3. Early Warning Indicators
The updated critical rainfall was mainly obtained by the method of production and flow analysis and statistical induction. When analyzing the rationality of critical rainfall, the stormwater flood data in the basin can be divided into the following three types; rainstorms and floods data with disasters, rainstorms, and floods with no disasters, and lack of measured storm and flood data. The principles for different types of calculations are as follows: (1) for floods with disasters, the characteristic rainfall during the period (the maximum rainfall in different warning periods before flooding, the antecedent precipitation) was statistically calculated, and then the deviation was used to judge the rationality of critical rainfall; there was no need to calculate if the antecedent precipitation is not considered; (2) For the floods without disasters, the characteristic rainfall is the maximum rainfall during the different periods, the corresponding antecedent precipitation and critical rainfall, and then the rationality of the critical rainfall is also measured by the deviation; (3) for floods with disasters, but lack of measured rainfall data, mainly in similar riverside villages, based on the parameter migration method to calculate the critical rainfall, compared with the critical rainfall measured by the current flood control capacity, hydrology manual, storm map, etc., indirectly to verify the rationality of the critical rainfall. The rationality of the transfer index is mainly based on the analysis and calculation of the multi-field measured rainfall time-cause distribution, and recalculation if it is unreasonable. In addition, the Hunjiang District is a saturated runoff mechanism, which is calculated by the standardized unit line method, and then convolution with the net rain analysis results to obtain the surface runoff process. The underground runoff is generalized as an “isosceles triangle” outflow and then accumulated with the surface runoff period to obtain the design flood process. The calculation formula is as follow:
where PB is percentage bias, %; Pc is critical rainfall, mm; Pe is disaster-causal rainfall, mm.
Generally, when the PB is within 10%, the critical rainfall is considered reasonable. In the actual warning of the Hunjiang District, the critical rainfall is the immediate transfer indicator; the preparatory transfer is based on the comprehensive “reduction” treatment of the immediate transfer time and the flood process line. Table 4 shows the results of the updated critical rainfall indicators. Obviously, that the one-hour warning indicator is unreasonable, but considering that the characteristic rainfall and the critical rainfall are in the same frequency range, the critical rainfall can be considered suitable. Meanwhile, since the recent flood disasters are lesser, the verification of early warning indicators needs to be further verified by analysis of long-term data.
4. Conclusions
Taking Hunjiang District of northeastern China as a typical case, this paper conducts an on-the-spot investigation to collect the recent flash flood event in small watersheds, various monitoring data and historical hydrological data, and carried out the research on the update of flash flood warning indicators. The main conclusions are as follows:
- (1)
- Based on the survey data, such as recent flash flood data, meteorological hydrological data, and topographical population data, the three typical riverside villages of Shangqing-4, Xiangmo-1, and Sanchahe-3 were comprehensively screened by expert scoring method.
- (2)
- Using the inference formula method and the water level-discharge curves respectively, the maximum error of the flood peak is 10.6%, which has high reliability and can be applied to the inspection and verification of early warning indicators. The measurement results along the river section are consistent with the actual measurement results, but the roughness of the main channel and the two banks are high.
- (3)
- The calculation method of the design rainstorm and the relevant parameters of the early warning indicator are reasonable. Both the gradient and the roughness in CFFIED are larger than the measured. When the same water level condition, the peek flow value is smaller than the rechecked value.
The flash flood warning indicator is affected by many factors, with spatial- temporal uncertainty. The current review of early warning indicators is based on recently measured data and does not consider the lack or inaccuracy of measured data. Meanwhile, the flash flood occurrence is regional, limited by the research data and monitoring methods. It is a complex nonlinear problem involving various hydrological processes, rainfall intensity, and soil characteristics. Since there were fewer flash flood events in recent years and given the short-term data, the update results need to be verified and corrected by more detailed information. In conclusion, the update of the rainfall warning indicator is long-term work, which should be revised irregularly according to the actual flood data, which is of great significance for improving the accuracy of flash flood warning.
Author Contributions
All the authors contributed to the conception and development of this manuscript. M.M. carried out the analysis and wrote the paper. J.Z. used the methods for statistical analysis and mapping in the article. Z.W. designed the system framework and developed the project implementation plan. H.S. collected data and drew the study area map. D.W. participated in the results analysis.
Funding
This study was financially supported by the National Natural Science Foundation of China (41173096, 41372373), the innovation team plan of the Tianjin Education Committee (TD13-5073), and National Natural Science Foundation of China (NSFC). General Projects: (Grant No. 41471430).
Acknowledgments
The authors are grateful to the editors and the anonymous reviewers for their insightful comments and suggestions, which helped to improve the manuscript.
Conflicts of Interest
The authors declare no conflict of interest.
References
- Destro, E.; Amponsah, W.; Nikolopoulos, E.I.; Marchi, L.; Marra, F.; Zoccatelli, D.; Borga, M. Coupled prediction of flash flood response and debris flow occurrence: Application on an alpine extreme flood event. J. Hydrol. 2018, 558, 225–237. [Google Scholar] [CrossRef]
- Palik, B.J.; Michener, W.K.; Mitchell, R.J.; Edwards, D. The effects of landform and plant size on mortality and recovery of longleaf pine during a 100-year flood. Écoscience 1999, 6, 255–263. [Google Scholar] [CrossRef]
- French, J.; Ing, R.; von Allen, S.; Wood, R. Mortality from flash floods: A review of national weather service reports, 1969–81. Public Health Rep. 1983, 98, 584. [Google Scholar]
- Jonkman, S.N.; Kelman, I. An analysis of the causes and circumstances of flood disaster deaths. Disasters 2005, 29, 75–97. [Google Scholar] [CrossRef] [PubMed]
- Borga, M.; Stoffel, M.; Marchi, L.; Marra, F.; Jakob, M. Hydrogeomorphic response to extreme rainfall in headwater systems: Flash floods and debris flows. J. Hydrol. 2014, 518, 194–205. [Google Scholar] [CrossRef]
- Gruntfest, E.; Handmer, J. Coping with Flash Floods; Springer Science & Business Media: Dordrecht, The Netherlands, 2001. [Google Scholar]
- Ashley, S.T.; Ashley, W.S. Flood Fatalities in the United States. J. Appl. Meteorol. Climatol. 2008, 47, 805–818. [Google Scholar] [CrossRef] [Green Version]
- Luo, P.; He, B.; Takara, K.; Xiong, Y.E.; Nover, D.; Duan, W.; Fukushi, K. Historical assessment of Chinese and Japanese flood management policies and implications for managing future floods. Environ. Sci. Policy 2015, 48, 265–277. [Google Scholar] [CrossRef] [Green Version]
- Alfieri, L.; Burek, P.; Dutra, E.; Krzeminski, B.; Muraro, D.; Thielen, J.; Pappenberger, F. Glofas—global ensemble streamflow forecasting and flood early warning. Hydrol. Earth Syst. Sci. 2013, 17, 1161–1175. [Google Scholar] [CrossRef]
- Liu, W.C.; Chen, W.B.; Hsu, M.H.; Fu, J.C. Dynamic routing modeling for flash flood forecast in river system. Nat. Hazard. 2010, 52, 519–537. [Google Scholar] [CrossRef]
- Clark, R.A.; Gourley, J.J.; Flamig, Z.L.; Hong, Y.; Clark, E. CONUS-Wide Evaluation of National Weather Service Flash Flood Guidance Products. Weather Forecast. 2014, 29, 377–392. [Google Scholar] [CrossRef]
- Reed, S.; Schaake, J.; Zhang, Z. A distributed hydrologic model and threshold frequency-based method for flash flood forecasting at ungauged locations. J. Hydrol. 2007, 337, 402–420. [Google Scholar] [CrossRef]
- Gourley, J.J.; Hong, Y.; Flamig, Z.L.; Arthur, A.; Clark, R.; Calianno, M.; Ruin, L.; Ortel, T.; Wieczorek, M.E.; Kirstetter, P.-E.; et al. A Unified Flash Flood Database across the United States. Bull. Am. Meteorol. Soc. 2013, 94, 799–805. [Google Scholar] [CrossRef]
- Lee, M. Overview of Debris-Flow Monitoring and Warning System in Taiwan. Res. Soil Water Conserv. 2009, 16, 239–242. [Google Scholar]
- Alfieri, L.; Thielen, J.; Pappenberger, F. Ensemble hydro-meteorological simulation for flash flood early detection in southern Switzerland. J. Hydrol. 2012, 424–425, 143–153. [Google Scholar] [CrossRef]
- Liu, Z. Research and application of mountain flood warning and forecasting technology. Chin. Flood Drought Manag. 2012, 22, 41–45. [Google Scholar]
- Guo, L.; He, B.; Ma, M.; Chang, Q.; Li, Q.; Zhang, K.; Hong, Y. A comprehensive flash flood defense system in China: Overview, achievements, and outlook. Nat. Hazard. 2018, 92, 727–740. [Google Scholar] [CrossRef]
- Guo, L.; Ding, L.; Sun, D.; Liu, C.; He, B.; Liu, R. Key techniques of flash flood disaster prevention in China. J. Hydraul. Eng. 2018, 49, 1123–1136. [Google Scholar]
- Luo, P.; Zhou, M.; Deng, H.; Lyu, J.; Cao, W.; Takara, K.; Nover, D.; Schladow, S.G. Impact of forest maintenance on water shortages: Hydrologic modeling and effects of climate change. Sci. Total Environ. 2018, 615, 1355–1363. [Google Scholar] [CrossRef]
- Luo, P.; He, B.; Duan, W.; Takara, K.; Nover, D. Impact assessment of rainfall scenarios and land-use change on hydrologic response using synthetic Area IDF curves. J. Flood Risk Manag. 2018, 11, S84–S97. [Google Scholar] [CrossRef]
- Liu, C.; Guo, L.; Ye, L.; Zhang, S.; Zhao, Y.; Song, T. A review of advances in China’s flash flood early-warning system. Nat. Hazard. 2018, 92, 619–634. [Google Scholar] [CrossRef]
- Luo, P.; Mu, D.; Xue, H.; Ngo-Duc, T.; Dang-Dinh, K.; Takara, K.; Nover, D.; Schladow, G. Flood inundation assessment for the Hanoi Central Area, Vietnam under historical and extreme rainfall conditions. Sci. Rep. 2018, 8, 12623. [Google Scholar] [CrossRef] [PubMed]
- Pappenberger, F.; Beven, K.; Horritt, M.; Blazkova, S. Uncertainty in the calibration of effective roughness parameters in HEC-RAS using inundation and downstream level observations. J. Hydrol. 2005, 302, 46–69. [Google Scholar] [CrossRef]
Figure 1.
Location and topographic map of the Hunjiang District.

Figure 2.
Land use map of Hunjiang District.

Figure 3.
Soil quality map of Hunjiang District.

Figure 4.
Distribution map of the review objects in Hunjiang.

Figure 5.
Water level flow relationship of Shangqing-4.


Table 1.
Basic information of the riverside villages rechecked.
| Prevention Object | Rainfall Collection Area (km2) | Slope (‰) | Roughness | Design Peak Flow (m3/s) | Runoff Concentration-Time (h) | Peak Flow/104 m3 | Flood Duration (h) | Flood Stage (m) | Cause Disaster (m) | Earling Warning Period (h) | Soil Moisture (%) | ||
|---|---|---|---|---|---|---|---|---|---|---|---|---|---|
| Left Bank | Main Channel | Right Bank | |||||||||||
| Shangqing-4 | 1.2 | 51 | 0.05 | 0.035 | 0.05 | 18.1 | 0.5 | 4.8 | 10 | 728.8 | 728.4 | 1 January | 0.2 Wm |
| Xiangmo-1 | 80.5 | 11 | 0.06 | 0.04 | 0.06 | 280 | 7.4 | 339.3 | 47 | 472.8 | 471.8 | 12 January | 0.5 Wm |
| Sanchahe-3 | 51.4 | 42 | 0.05 | 0.035 | 0.05 | 266.7 | 6.3 | 323.7 | 53 | 477.8 | 477.2 | 6 January | 0.8 Wm |
Table 2.
Review results of water level and flow relationship in Hunjiang District.
| Name of Village | Roughness of the Left Bank | Rroughness of the Right Bank | Roughness of the Main Channel | Slope (‰) | Diagram of Water Level-Flow Relation |
|---|---|---|---|---|---|
| Shangqing-4 | 0.043 | 0.043 | 0.032 | 51 |  |
 | |||||
| Xiangmo-1 | 0.048 | 0.048 | 0.035 | 11 |  |
 | |||||
| Sanchahe-3 | 0.045 | 0.045 | 0.035 | 42 |  |
 | |||||
Table 3.
Design flood for inspection and review objects in Hunjiang District.
| Prevention Object | Confluence Time (h) | Peak Flow (104 m3) | Flood Duration (h) | Flood-Peak Stage (m) | Design Peak Flow (m3/s) | ||
|---|---|---|---|---|---|---|---|
| Inference Formula | Water Level-Flow Relation | PB (%) | |||||
| Shangqing-4 | 0.5 | 4.8 | 10 | 728.75 | 18.1 | 16.19 | 10.6 |
| Xiangmo-1 | 7.4 | 339.3 | 47 | 472.84 | 170.1 | 168.66 | 0.8 |
| Sanchahe-3 | 6.3 | 323.7 | 53 | 477.76 | 266.7 | 274.02 | 2.6 |
Table 4.
The result of reviewing early warning index.
| Reviewing Object | Early Warning Period (h) | Antecedent Precipitation Index (Wm) | Characteristic Rainfall (mm) | Updated Critical Rainfall (mm) | PB (%) | Early Warning Index (mm) | |
|---|---|---|---|---|---|---|---|
| Prepare to Transfer | Transfer Now | ||||||
| Shangqing-4 | 1 | 0.8 | 30 | 26 | 13.3 | 19 | 26 |
| Xiangmo-1 | 1 | 26 | 45 | 15.4 | 32 | 45 | |
| 2 | 28 | 59 | 7.1 | 42 | 59 | ||
| 3 | 34 | 69 | 5.8 | 51 | 69 | ||
| Sanchahe-3 | 1 | 62 | 80 | 29 | 56 | 80 | |
| 2 | 81 | 88 | 8.6 | 62 | 88 | ||
| 3 | 104 | 97 | 6.5 | 69 | 97 | ||
© 2019 by the authors. Licensee MDPI, Basel, Switzerland. This article is an open access article distributed under the terms and conditions of the Creative Commons Attribution (CC BY) license (http://creativecommons.org/licenses/by/4.0/).
Share and Cite
MDPI and ACS Style
Ma, M.; Zhang, J.; Su, H.; Wang, D.; Wang, Z. Update of Early Warning Indicators of Flash Floods: A Case Study of Hunjiang District, Northeastern China. Water 2019, 11, 314. https://doi.org/10.3390/w11020314
AMA Style
Ma M, Zhang J, Su H, Wang D, Wang Z. Update of Early Warning Indicators of Flash Floods: A Case Study of Hunjiang District, Northeastern China. Water. 2019; 11(2):314. https://doi.org/10.3390/w11020314
Chicago/Turabian StyleMa, Meihong, Jingnan Zhang, Huidong Su, Dacheng Wang, and Zhongliang Wang. 2019. "Update of Early Warning Indicators of Flash Floods: A Case Study of Hunjiang District, Northeastern China" Water 11, no. 2: 314. https://doi.org/10.3390/w11020314
Note that from the first issue of 2016, this journal uses article numbers instead of page numbers. See further details here.