Determination of Natural Radionuclides for Water Resources on the West Bank of the Nile River, Assiut Governorate, Egypt


1
Physics Department, Faculty of Science, Assiut University, Assiut 71516, Egypt
2
Geology Department, Faculty of Science, Assiut University, Assiut 71516, Egypt
*
Author to whom correspondence should be addressed.
Water 2019, 11(2), 311; https://doi.org/10.3390/w11020311
Submission received: 20 January 2019
/
Revised: 31 January 2019
/
Accepted: 5 February 2019
/
Published: 12 February 2019
(This article belongs to the Section Water Quality and Contamination)
Abstract
:Estimations of natural radioactivity levels were carried out for water (surface and groundwater) samples collected from the west bank of the Nile River in Assiut Governorate, Egypt. The activity concentrations in the water samples ranged from 19.20 ± 2.40 to 492.26 ± 71.52 mBq/L, from 15.58 ± 2.62 to 351.39 ± 66.13 mBq/L, and from 50.31 ± 5.58 to 2255.03 ± 249.42 mBq/L for 226Ra, 232Th, and 40K, respectively. In this work, the recorded activity concentrations have been organized statistically using a dendrogram cluster and a principal coordinate analysis. In view of the groupings of radionuclide activity, the average annual effective doses through ingestion for adults, children, and infants, despite the responsibility of each explicit radionuclide to the total dose, were assessed and debated. Children had the most important measurement calculations, making them the most regarded mass gathering. All estimations for each different water type, as well as for each individual population group, scored well under the recommended reference value of 0.1 mSv resulting from a one year’s intake of drinking water in accordance with the recommendations of the European Commission (EC) in 1998.
1. Introduction
Natural radioactivity in water has been examined widely in different parts of the world to assess the radiological risks to people in view of using tainted water [1,2,3,4]. Radioactive materials enter explicitly into the body through drinking or as part of advanced lifestyles. They cause health problems as a result of the decay of these radionuclides into the body.
Radium is considered as a highly toxic element in water and requires attention for human health. Two natural radium isotopes are a cause of worry in public water supplies; 226Ra, which is made as a result of the decay of 238U, and 228Ra, which is explicitly created through 232Th decay. Radium propels into groundwater through aquifer solid disintegration, through direct recoil over the liquid–solid limit through its arrangement by its parent radioactive decay in the solid, and moreover through desorption. The movements of radium in water are a component of the geochemical properties of solids in the aquifer. The behavior of radium in the body is similar to that of calcium and a ratable fraction deposited in the bone, which in turn can cause bone and head-sinus cancer [5].
Quantitative and abstract information of the regular radioactivity occurring in waterways and beach front situations are basic, since it concerns the most abundant radionuclide (40K) and other radionuclides liable to cause radiation protection problems under extreme conditions [6]. 40K is discharged into water bodies, adding to the nearness of radioactive segments in drinking water. 40K is the primary radioactive isotope of potassium. It decays explicitly into 40Ca in the ground state through β-emanation (89%) and also to 40Ar in a 1.46 MeV excited state pursued by a prompt 1.46 MeV gamma emission through electron capture (11%) due to water-shake/soil associations.
In the present work, water samples taken from different localities on the west bank of the Nile River in Assiut Governorate, Egypt, were examined to find the activity concentrations of the radionuclides 226Ra, 228Ra, 232Th, and 40K and to compute the radiological dose rates occurring from the use of this water. The annual effective doses, in addition to the cancer risk parameter will be calculated to study the quality of the water under investigation. The results enable the development of distribution maps for such radioelements in the area under investigation.
2. Study Area
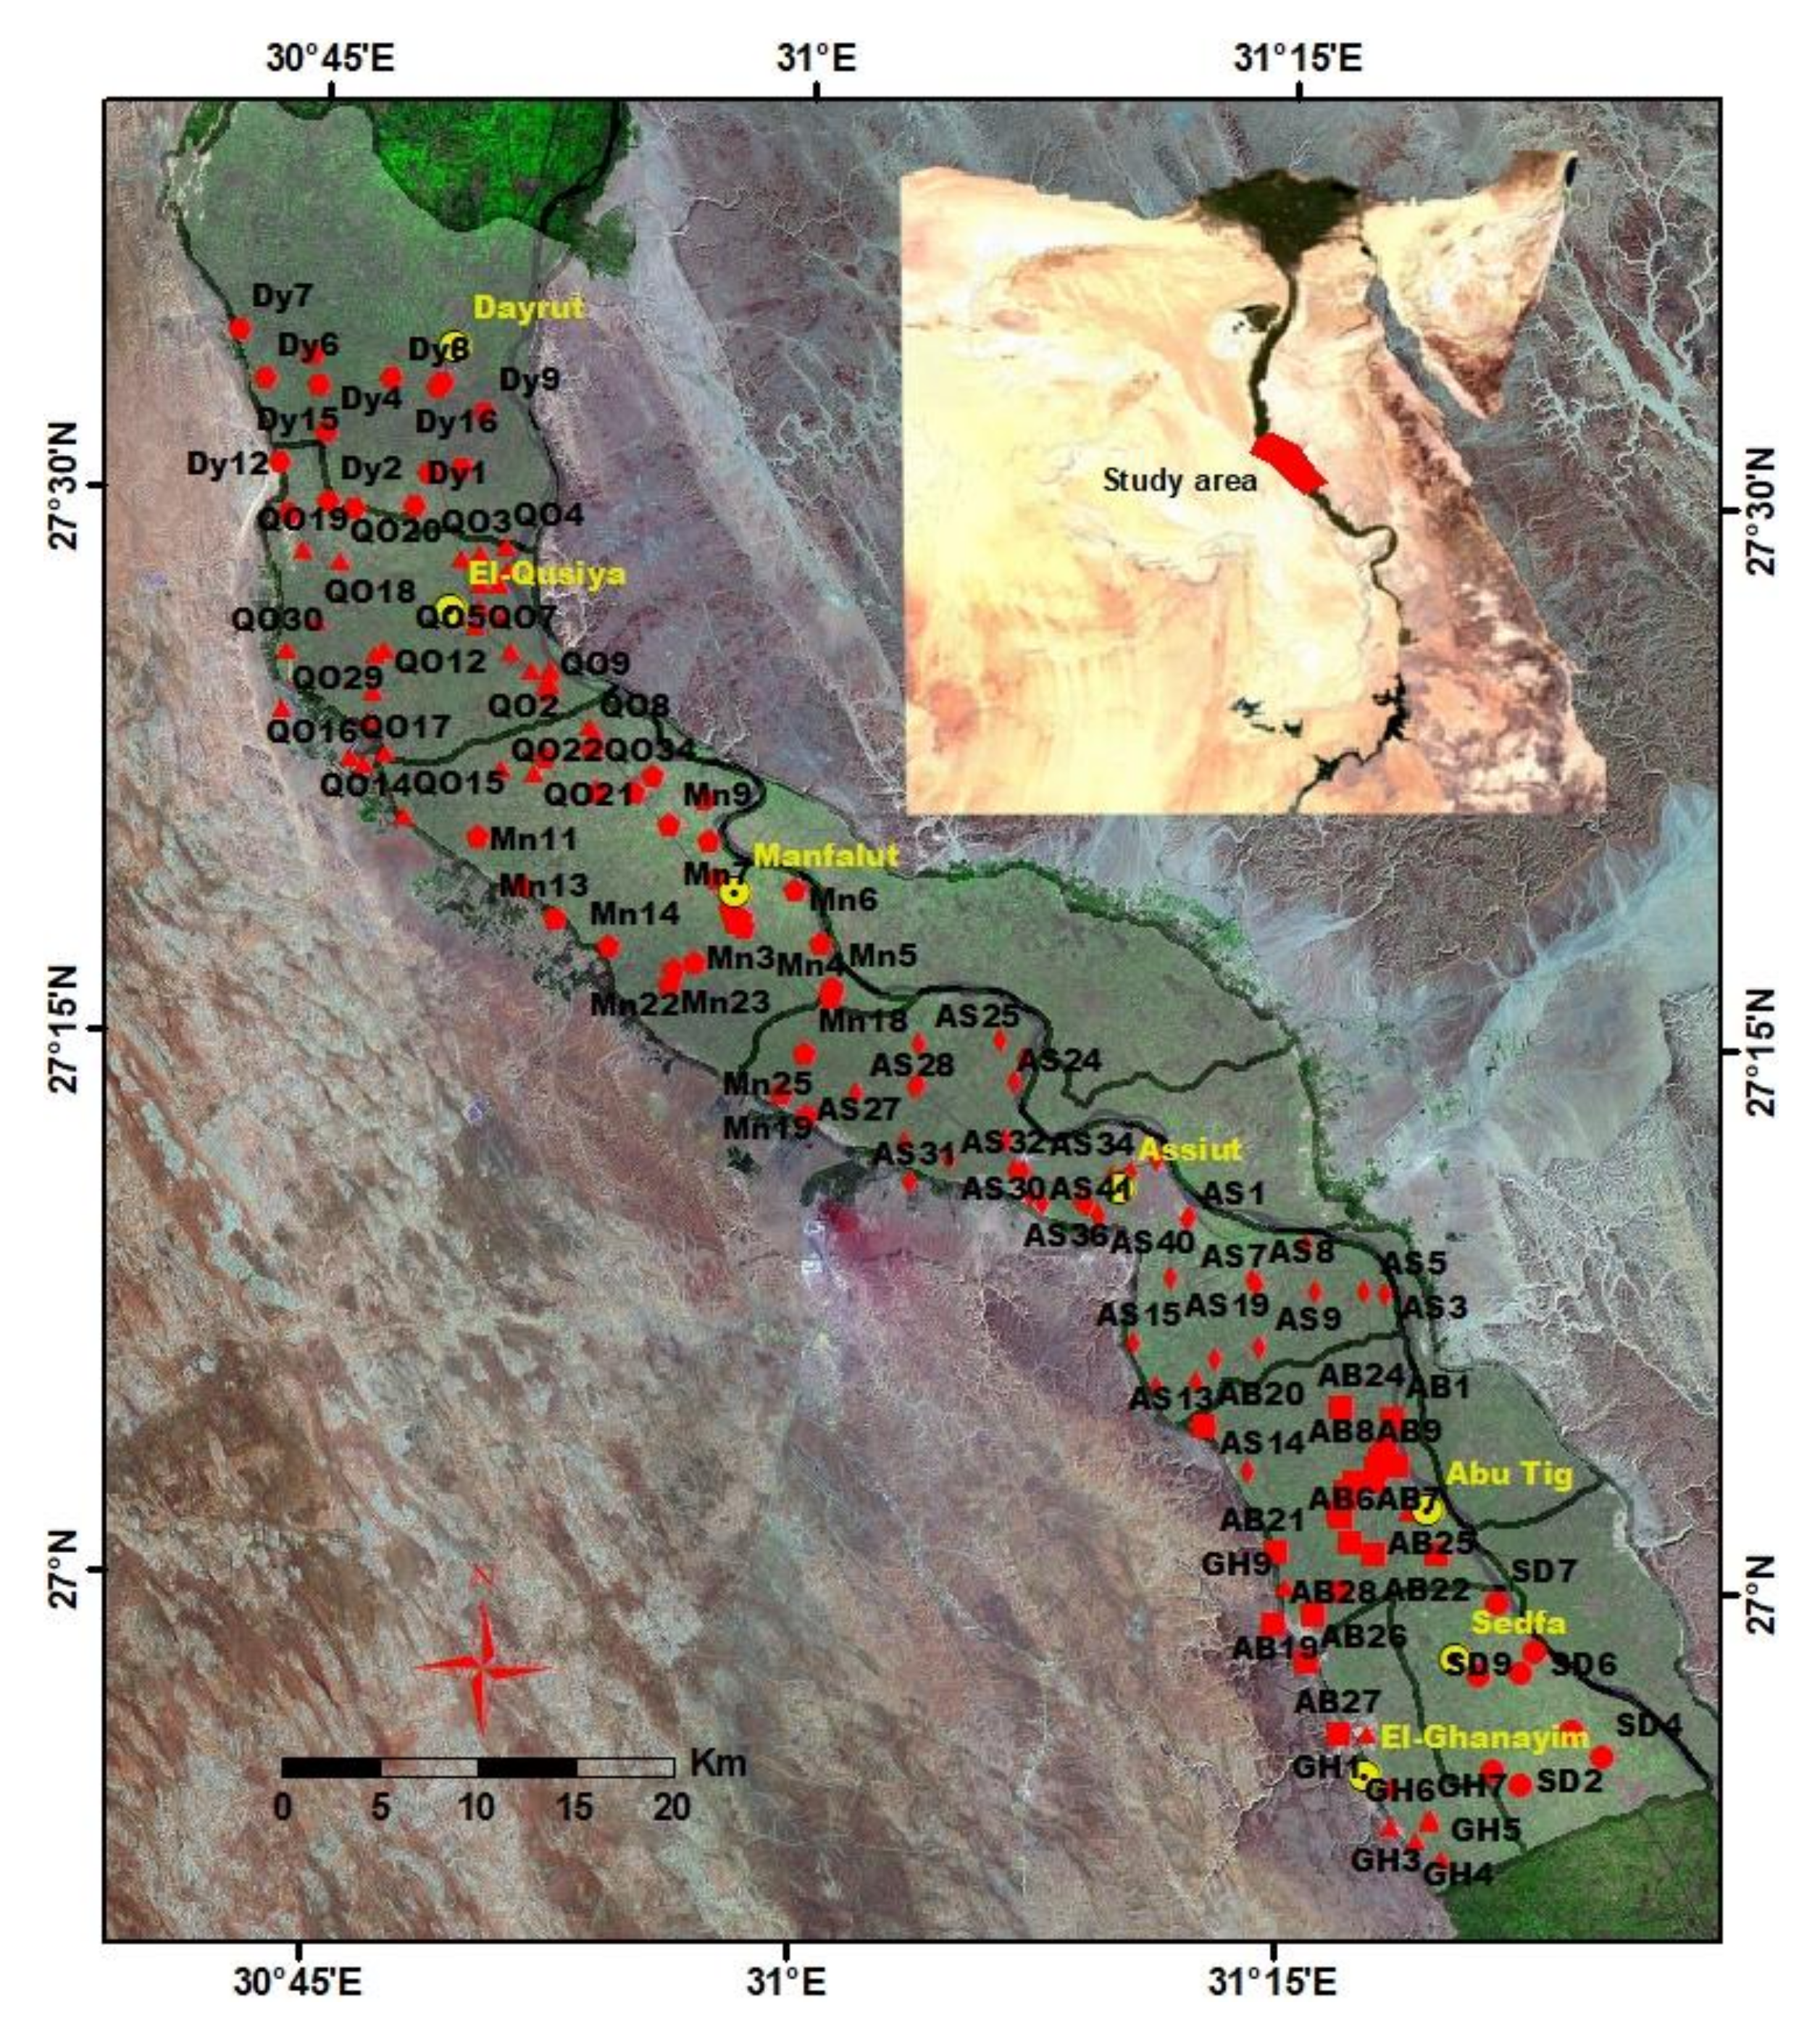
Assiut Governorate is one of the governorates of Egypt that rests on the Nile Valley. It lies about 400 km south of Cairo and extends for about 120 km north–south along the banks of the Nile. It is located between latitudes 26°50′0″ N and 27°37′45″ N and longitudes 30°40′50″ E and 31°31′0″ E (Figure 1). Assiut Governorate is the most populated governorate in Upper Egypt with more than 4.5 million inhabitants [7]. It comprises 11 districts, 52 local administrative units, 235 small villages (most of which depend on groundwater for drinking), and 971 tiny villages (that depend on groundwater, almost shallow private wells, for drinking). This work focuses on the five districts located on the western Nile bank: Dairut, Assiut, Abu Tig, Sedfa, and El-Ghanayim (Figure 1).
The area of interest is part of the Nile Valley of Egypt, where the only source of groundwater is the Quaternary aquifer. The fluctuating water level of the Nile and the irrigation network canals, which dissect the whole area, have a noticeable control on the groundwater conditions [8]. A semiconfined condition is the dominant case for the groundwater in the aquifer, however, when the cap layer (silt and clay) is absent, the aquifer is found under a phreatic condition. The water level of the Nile also affects the regional groundwater flow direction (generally from southeast to northwest) matching the course of the River Nile. The depth to groundwater in the study area ranges from 1 to 5 m, which indicates a direct contact between surface and groundwater [9].
The Quaternary aquifer (50–250 m thick) consists mainly of sands and gravels of high hydraulic conductivity at the bottom and is capped by silt and clay layers [10].
The aquifer in the area of interest is mainly recharged from the surface water bodies in the vicinity, with horizontal flux from the south, and the return flow from intensive irrigation activities. A thick impervious Pliocene clay layer, underlying the aquifer, prevents vertical leakage [11].
3. Materials and Methods
3.1. Samples Collection and Preparation
A total of 83 water samples (surface and groundwater) were collected from the west bank of the Nile River in Assiut Governorate, Egypt. The water samples were gathered in identical (1 liter) polyethylene Marinelli beakers (GA-MA & Associates Inc, USA), which were also used for measurement. Each beaker was consistently filled to the brim and a sealed cap was placed on top, to ensure that it was completely free of air. Acidification to pH ≤ 2, by adding HCl or HNO3, was performed to prevent microorganism growth. The samples were stored in the laboratory for the duration of at least 30 days to allow daughter products to reach a radioactive equilibrium with their parents, 226Ra and 232Th, before the radiometric analysis [12].
3.2. Radioactivity Measurements
All the samples were measured at the nuclear physics laboratory in the physics department at the Faculty of Science in Assiut University using a gamma ray spectrometer with an HPGe model GR4020 setup and a multichannel analyzer of 16,384 channels (Canberra Industries, Inc., USA). The detector had closed-end coaxial Gamma-ray detectors (p-type) made up of high purity germanium (HPGe) in a vertical configuration cooled by liquid nitrogen with the following specifications: resolution (FWHM) ≤ 2.000 keV and ≤ 0.925 keV at 1.33 MeV and 122 keV, respectively, with a relative efficiency of 40%. The germanium crystal was located within a lead shield for the reduction of the environmental background. The detector was shielded in a four-layered chamber with the following specifications: Outer Jacket 9.5 mm (3/8 in.), thick low carbon steel Bulk Shield 10 cm (4 in.), and thick low background lead with Graded Lining 1 mm (0.040 in.) tin and 1.6 mm (0.062 in.) copper [13].
The system was calibrated for both energy and efficiency. The energy calibration was carried out by acquiring a spectrum from radioactive standards of known energies such as 137Cs (662 keV) and 60Co (1332 and 1172 keV). For the efficiency calibration, Canberra’s Geometry Composer was used instead of the standard source [13].
The spectra were analyzed by the computer software program Canberra’s Genie2000 (Canberra Industries, Inc, USA) for the calculation of natural radioactivity.
The radioactivity concentration of 226Ra was determined from the photopeaks of 214Pb (295.22, 351.93 keV) and 214Bi (609.31, 1120.29, 1764.49 keV). The concentration of 232Th was determined from the photopeaks of 228Ac (911.2, 968.97 keV), 212Pb (238.63 keV), and 208Ti (583.19, 2614 keV), while 40K was determined from the 1460.8 keV photopeak.
3.3. Statistical Analysis
The activity values of 226Ra, 232Th, and 40K in the water samples were subjected to the PAST program where the dendrogram cluster analysis was performed. Samples were treated as stands where the application compiles and divides the similar ones, which are similar samples in regard to activity, and divides them into groups. After applying the dendrogram cluster analysis, the principal coordinate analysis (PCoA) was performed, which represents the statistical distribution of the samples in a statistical map which has axes PcoAaxis1 and PcoAaxis2.
Secondly, we used the SPSS program (IBM, USA) where the ANOVA table was ascertained. It contains a factor (F) value that represents the difference coefficient, and the differences were studied between the mean values for each group for 226Ra, 232Th, and 40K. In the ANOVA table, F-values are shown in three forms. The first form, **F-value, implies that there are high contrasts between the groups and is called a high significant difference. The second form, *F-value, implies that there are contrasts between the estimations of the midpoints of the groups and is called a significant difference. The third form, F-value, implies there are no contrasts between the midpoints of the groups shaped and is called a non-significant difference. The F-value gave us an impression of the radiation activity behavior of 226Ra, 232Th, and 40K in water.
3.4. Radiation Dose Estimation
The total annual effective doses were measured for different age groups according to the equation introduced by EPA (Environmental Protection Agency, USA) [14] and by Meltem and Gursel [15], using the data presented in Table 1:
where ED(W) is the total annual effective dose (mSv y−1), A(W) is the radionuclide activity concentration (Bq/L), q(W) is the water consumption rate for a person in one year, which is 150, 350, and 500 L for infants, children, and adults, respectively [16], and CF(W) is the effective dose equivalent conversion factor (mSv Bq−1) (Table 1).
3.5. Cancer Risk Estimation
The radiological risk related to the radium isotope can be evaluated by calculating the life-time cancer risk (R) using the following equation [20]:
where MCL is the maximum contaminant level (Bq/L), RC is the mortality risk coefficient (7.17 × 10⁻⁹ and 2.0 × 10⁻⁸ Bq−1 for 226Ra and 228Ra, respectively) and TWI is the total water intake (2 L d−1 × 365.4 d year−1 × 70 year).
4. Results and Discussion
4.1. Activity Concentrations
The average activity concentrations of the measured radionuclides for the tested drinking water from the investigated areas are recorded in Table 2. The activity concentrations of 226Ra changed from 19.20 ± 2.40 to 492.26 ± 71.52 mBq/L with a mean estimation of 203.60 ± 29.61 mBq/L, from 4.67 ± 1.19 to 550.58 ± 109.56 mBq/L with a mean estimation of 113.42 ± 22.45 mBq/L for 228Ra, from 15.58 ± 2.62 to 351.39 ± 66.13 mBq/L with a mean estimation of 81.40 ± 13.58 mBq/L for 232Th, and 40K concentrations changed from 50.31 ± 5.58 to 2255.03 ± 249.42 mBq/L with a mean estimation 688.48 ± 76.25 mBq/L for the water samples.
Perceptibly, the maximum average activity concentration was found in the Sidfa and El-Ghanayim domains for 226Ra concentrations, the Assiut area for 228Ra focuses, and the Dairut region for 232Th and 40K activity concentrations (Table 2).
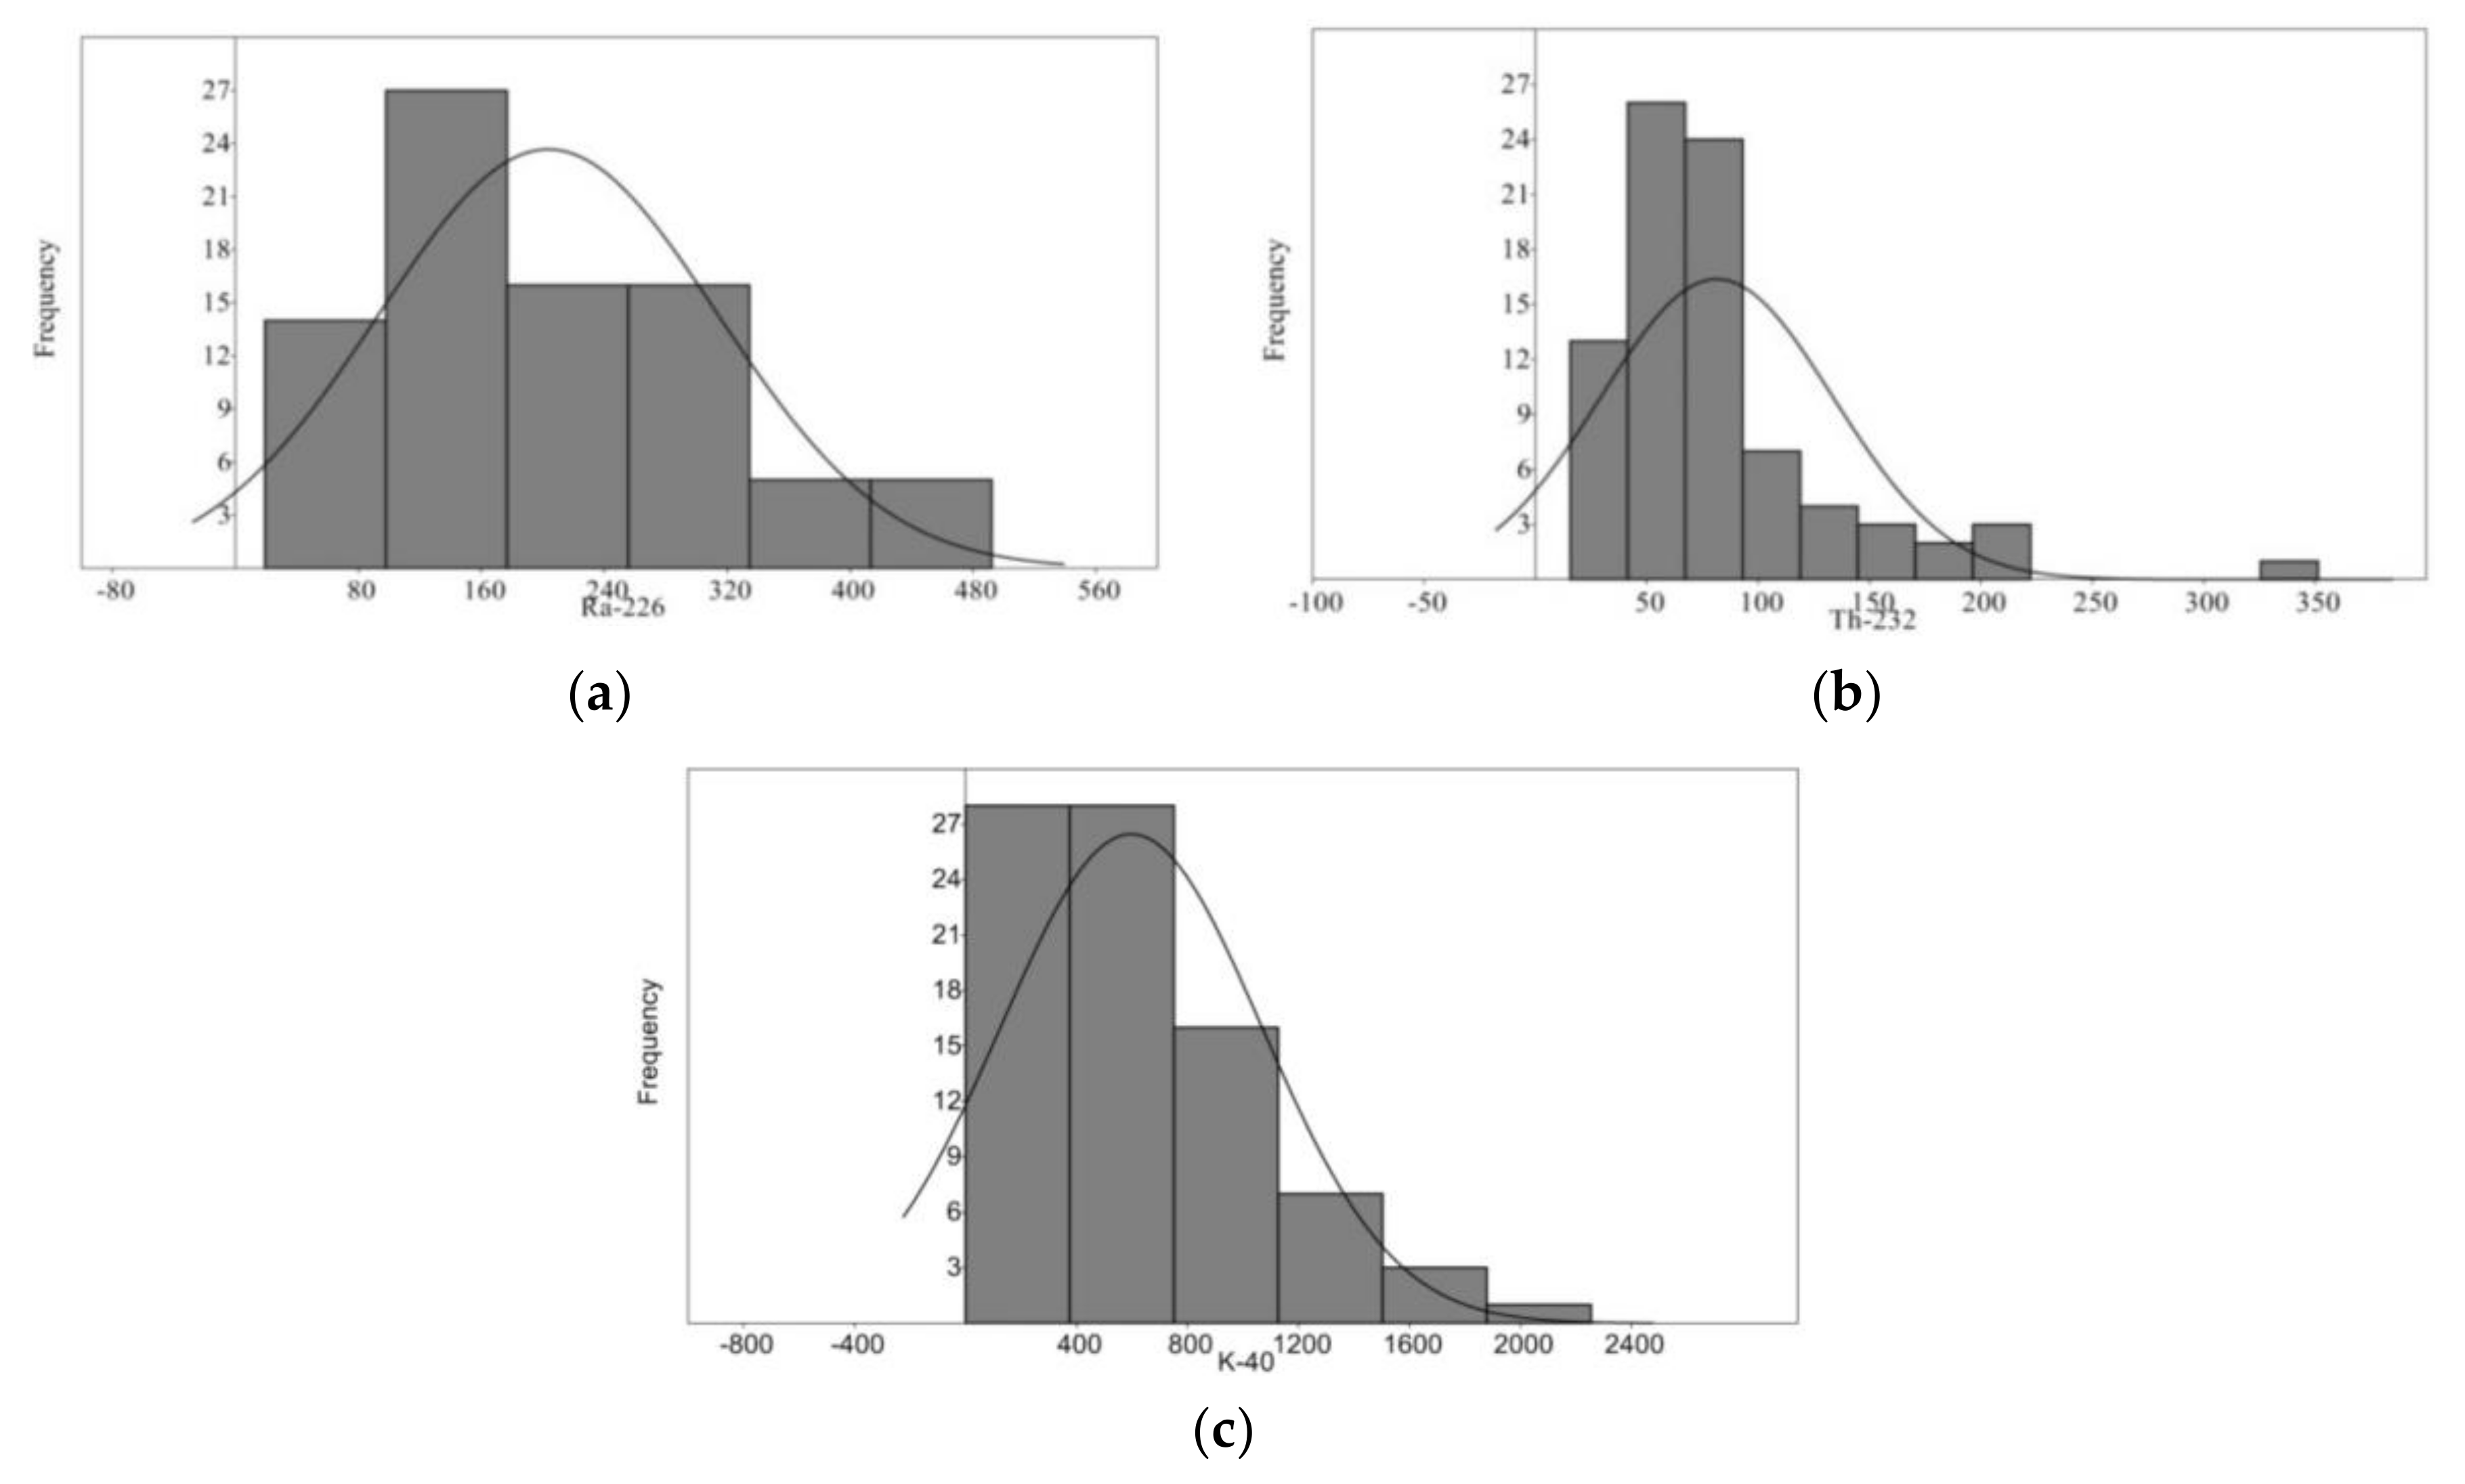
The frequency distribution of 226Ra, 232Th, and 40K activity concentrations were analyzed, and the histograms are given in Figure 2. The highest number of water samples for 226Ra activity concentrations fluctuated between 80 and 200 mBq/L. The most astonishing focuses were in the range between 50 to 100 mBq/L for the 232Th activity concentrations and the 40K activity concentrations are increasingly present in the range between 0 to 800 mBq/L.
4.2. Statistical Analysis
4.2.1. Dendrogram Cluster Analysis
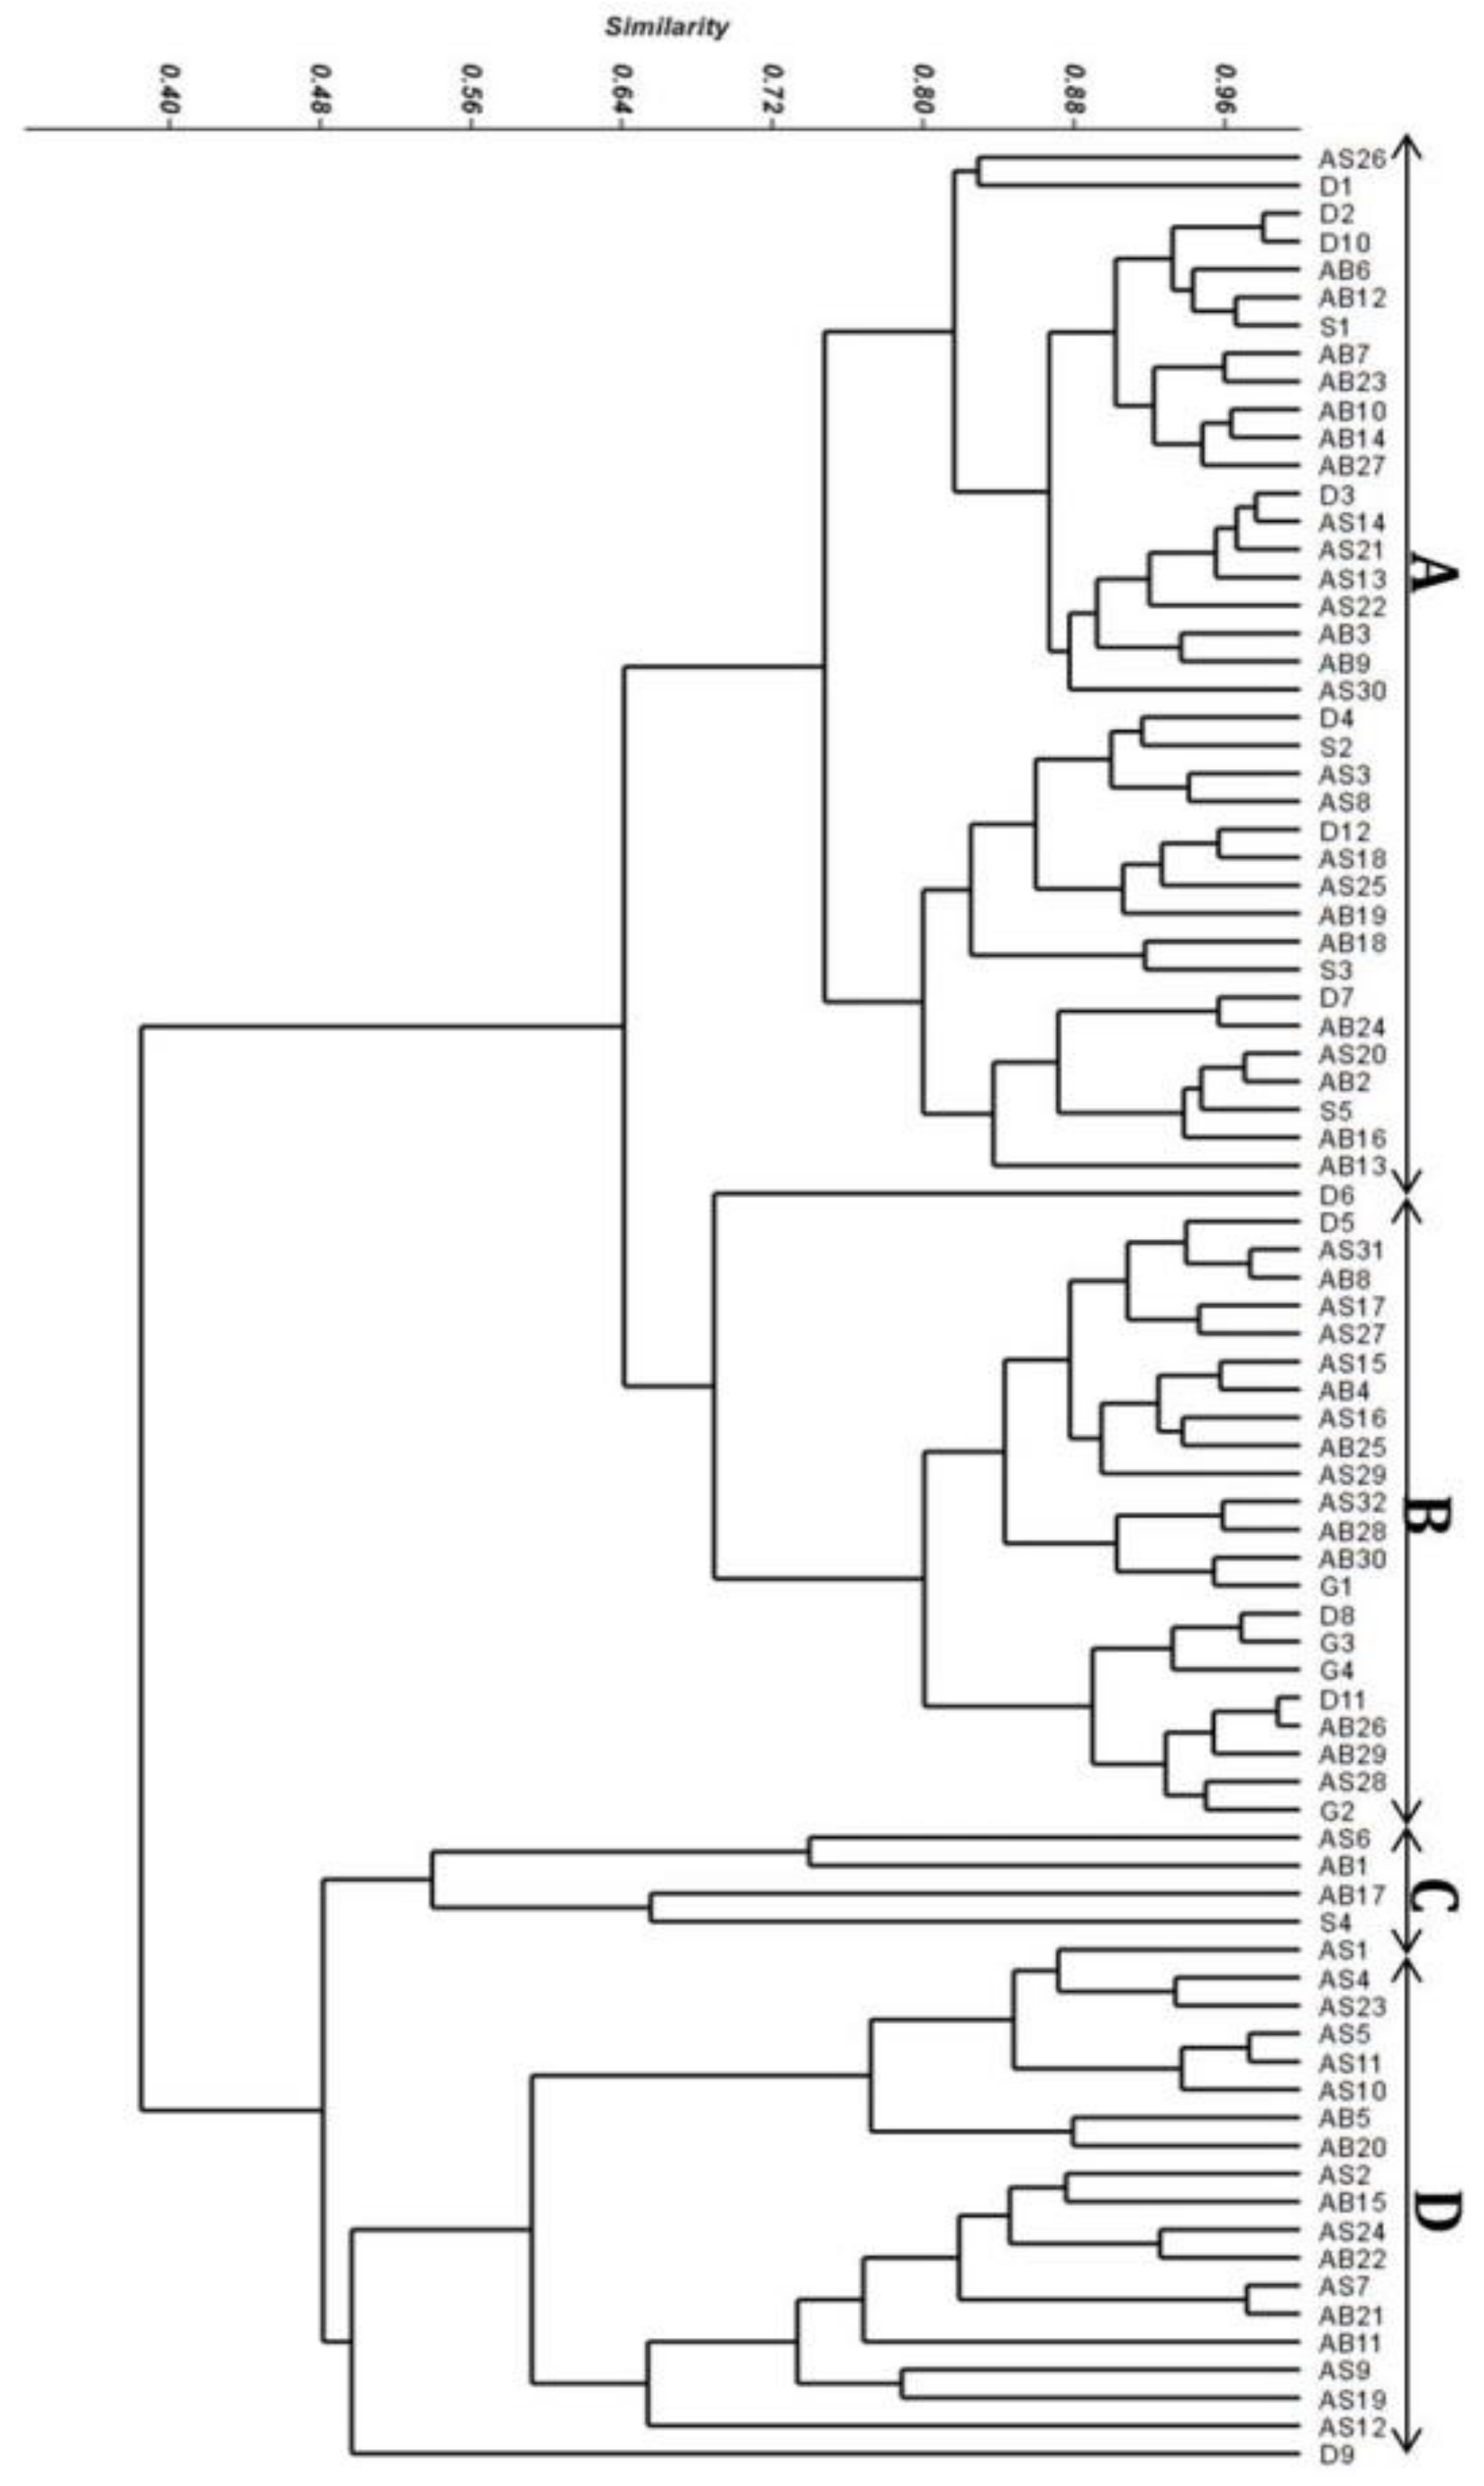
As shown by cluster analysis, the activity concentrations of the measured radionuclides were portrayed into 83 stands and yielded four bunches at level 2 of the chain of significance, as in Figure 3. Gathering A contained 37 stands, with a mean estimation of 173.97 ± 14.22, 69.37 ± 5.93, and 543.35 ± 24.07 for 226Ra, 232Th, and 40K, respectively. Gathering B contained 23 stands, with an average estimation of 294.47 ± 25.06, 94.24 ± 10.56, and 1205.94 ± 70.75 for 226Ra, 232Th, and 40K, respectively. Gathering C included 4 stands, with a mean estimation of 58.52 ± 10.42, 42.14 ± 12.11, and 38.39 ± 24.66 for 226Ra, 232Th, and 40K, respectively. Gathering D contained 19 stands, with an average estimation of 181.83 ± 17.55, 97.57 ± 17.18, and 82.97 ± 19.62 for 226Ra, 232Th, and 40K, respectively (Table 3).
4.2.2. Principal Coordinate Analysis
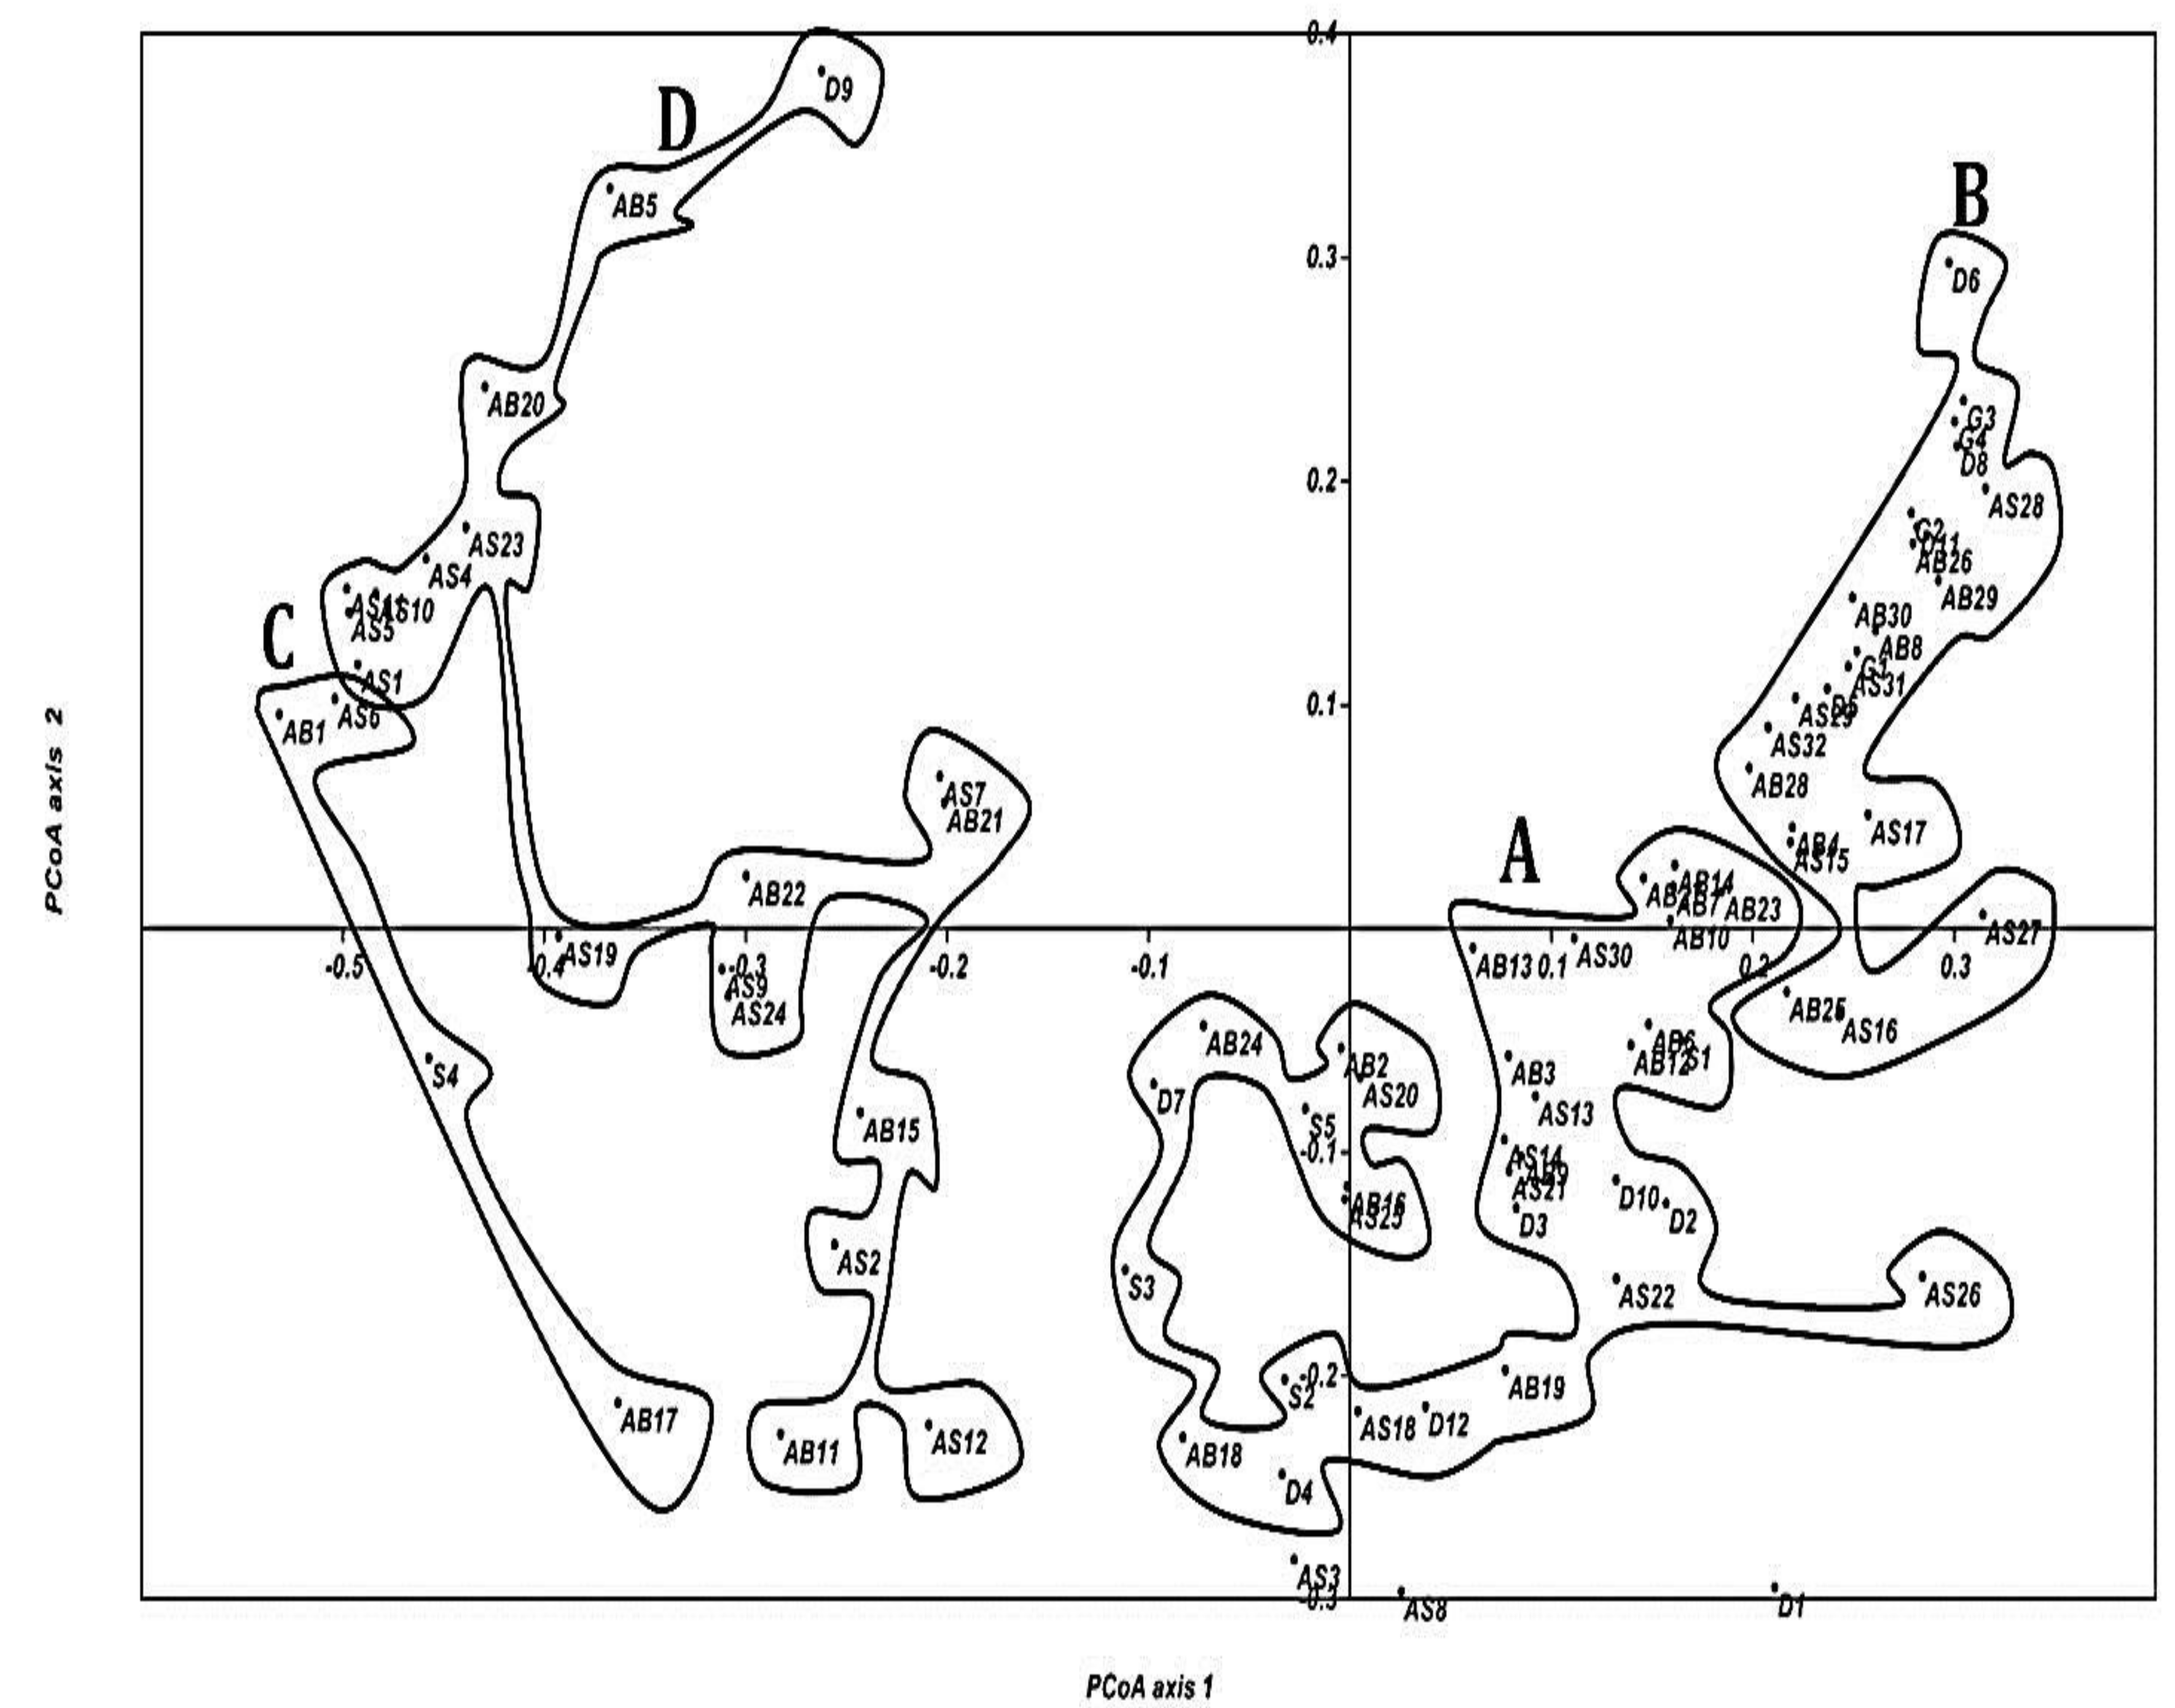
The principal coordinate analysis (PCoA) exhibits tremendous complexities between the four gatherings (Figure 4). They are separated along PCoA hub 1 and PCoA hub 2. Stands of gatherings A and B take the most right 50% of the PCoA hub, while those of gatherings C and D take the other side (the negative piece of hub 1).
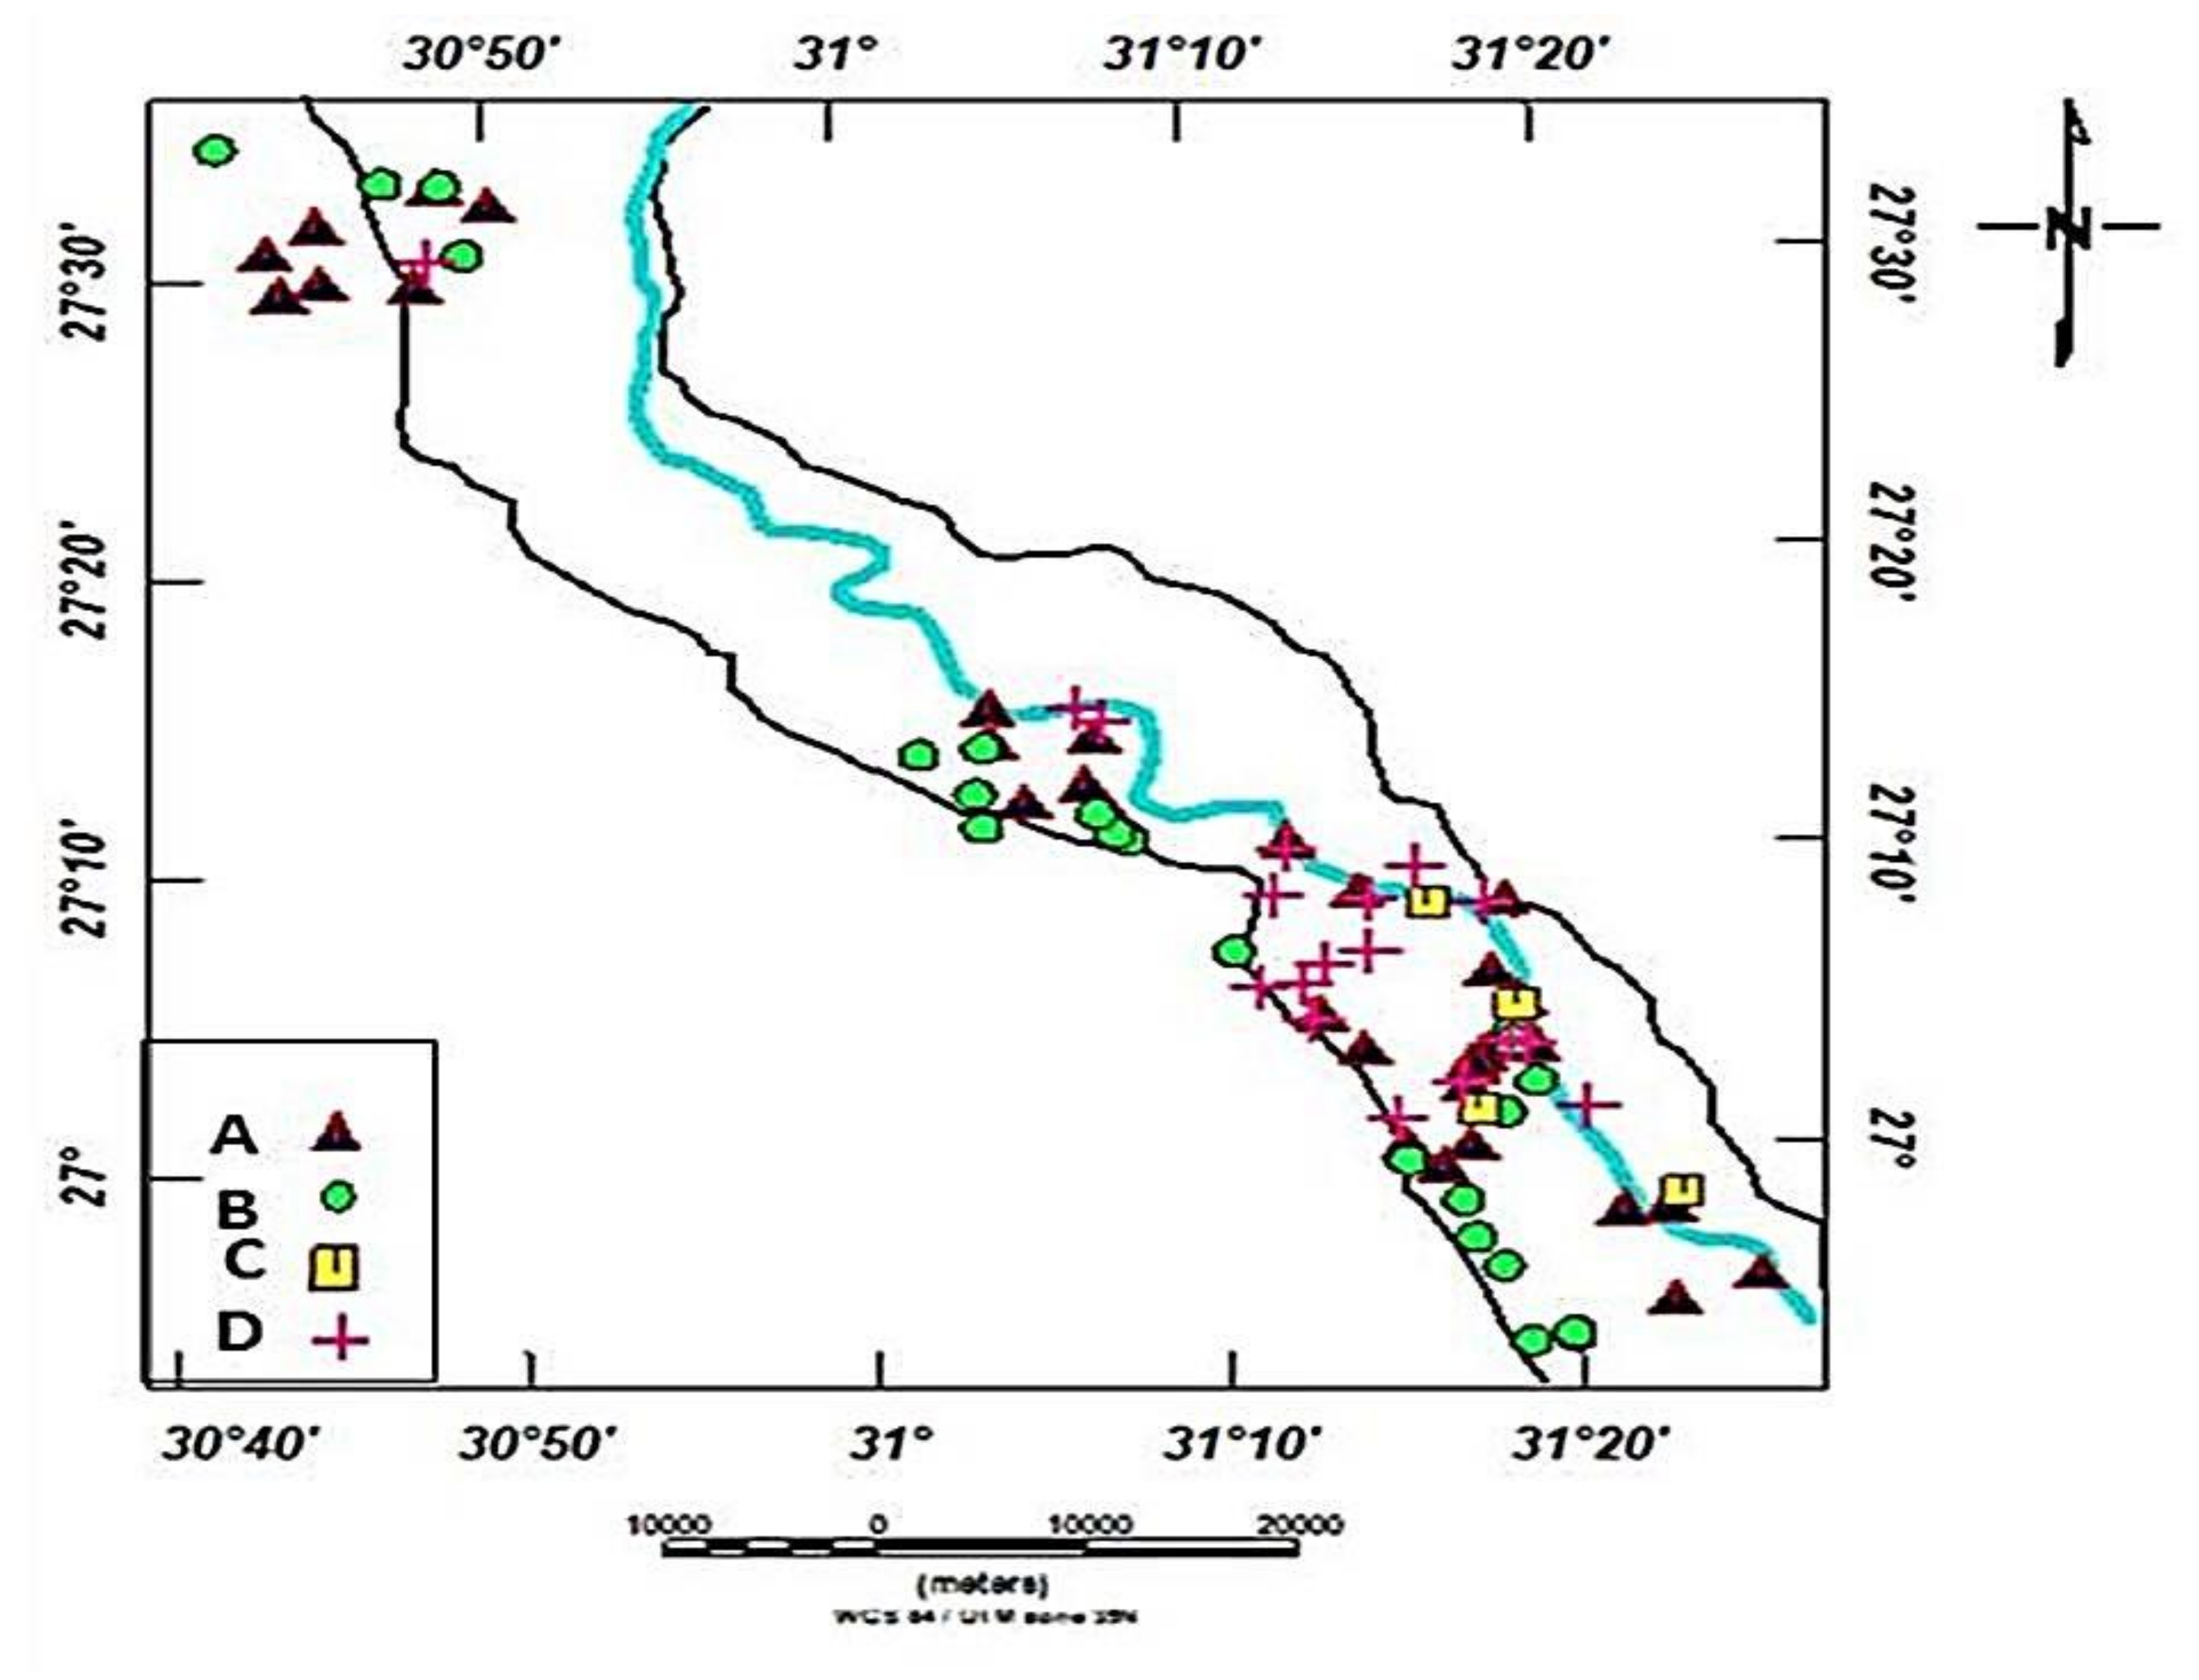
A contour map (Figure 5) illustrates that most stands of gatherings A, B, and D were arranged between latitude 26°55′ and latitude 27°15′ as shown in Figure 6. However, stands of gathering C were arranged between latitude 26°55′ and latitude 27°10′.
As shown in Figure 4 and Figure 5, the gatherings appear within the statistical map to match their order on the map. For example, it is noticed that the groups (A and B) are statistically in the opposition direction of the gatherings (C and D) (Figure 4); in a similar way, for contour, stands of gatherings (A and B) are concentrated in one region as well as the stands of gatherings (C and D) as in (Figure 5). Therefore, there is a statistical and contour match between them.
The ANOVA (Table 3) shows the mean estimations of the examined radionuclides in the Assiut water in the gatherings (A–D), where the most important estimations of the mean are found in gathering B and the slightest of the mean estimations are in gathering C for 226Ra and 40K. The F-value shows that there is an immense difference between the four gatherings for radium and potassium, while there is no significant difference between the four gatherings for the thorium isotope.
4.3. Distribution of Radionuclides in the Study Area
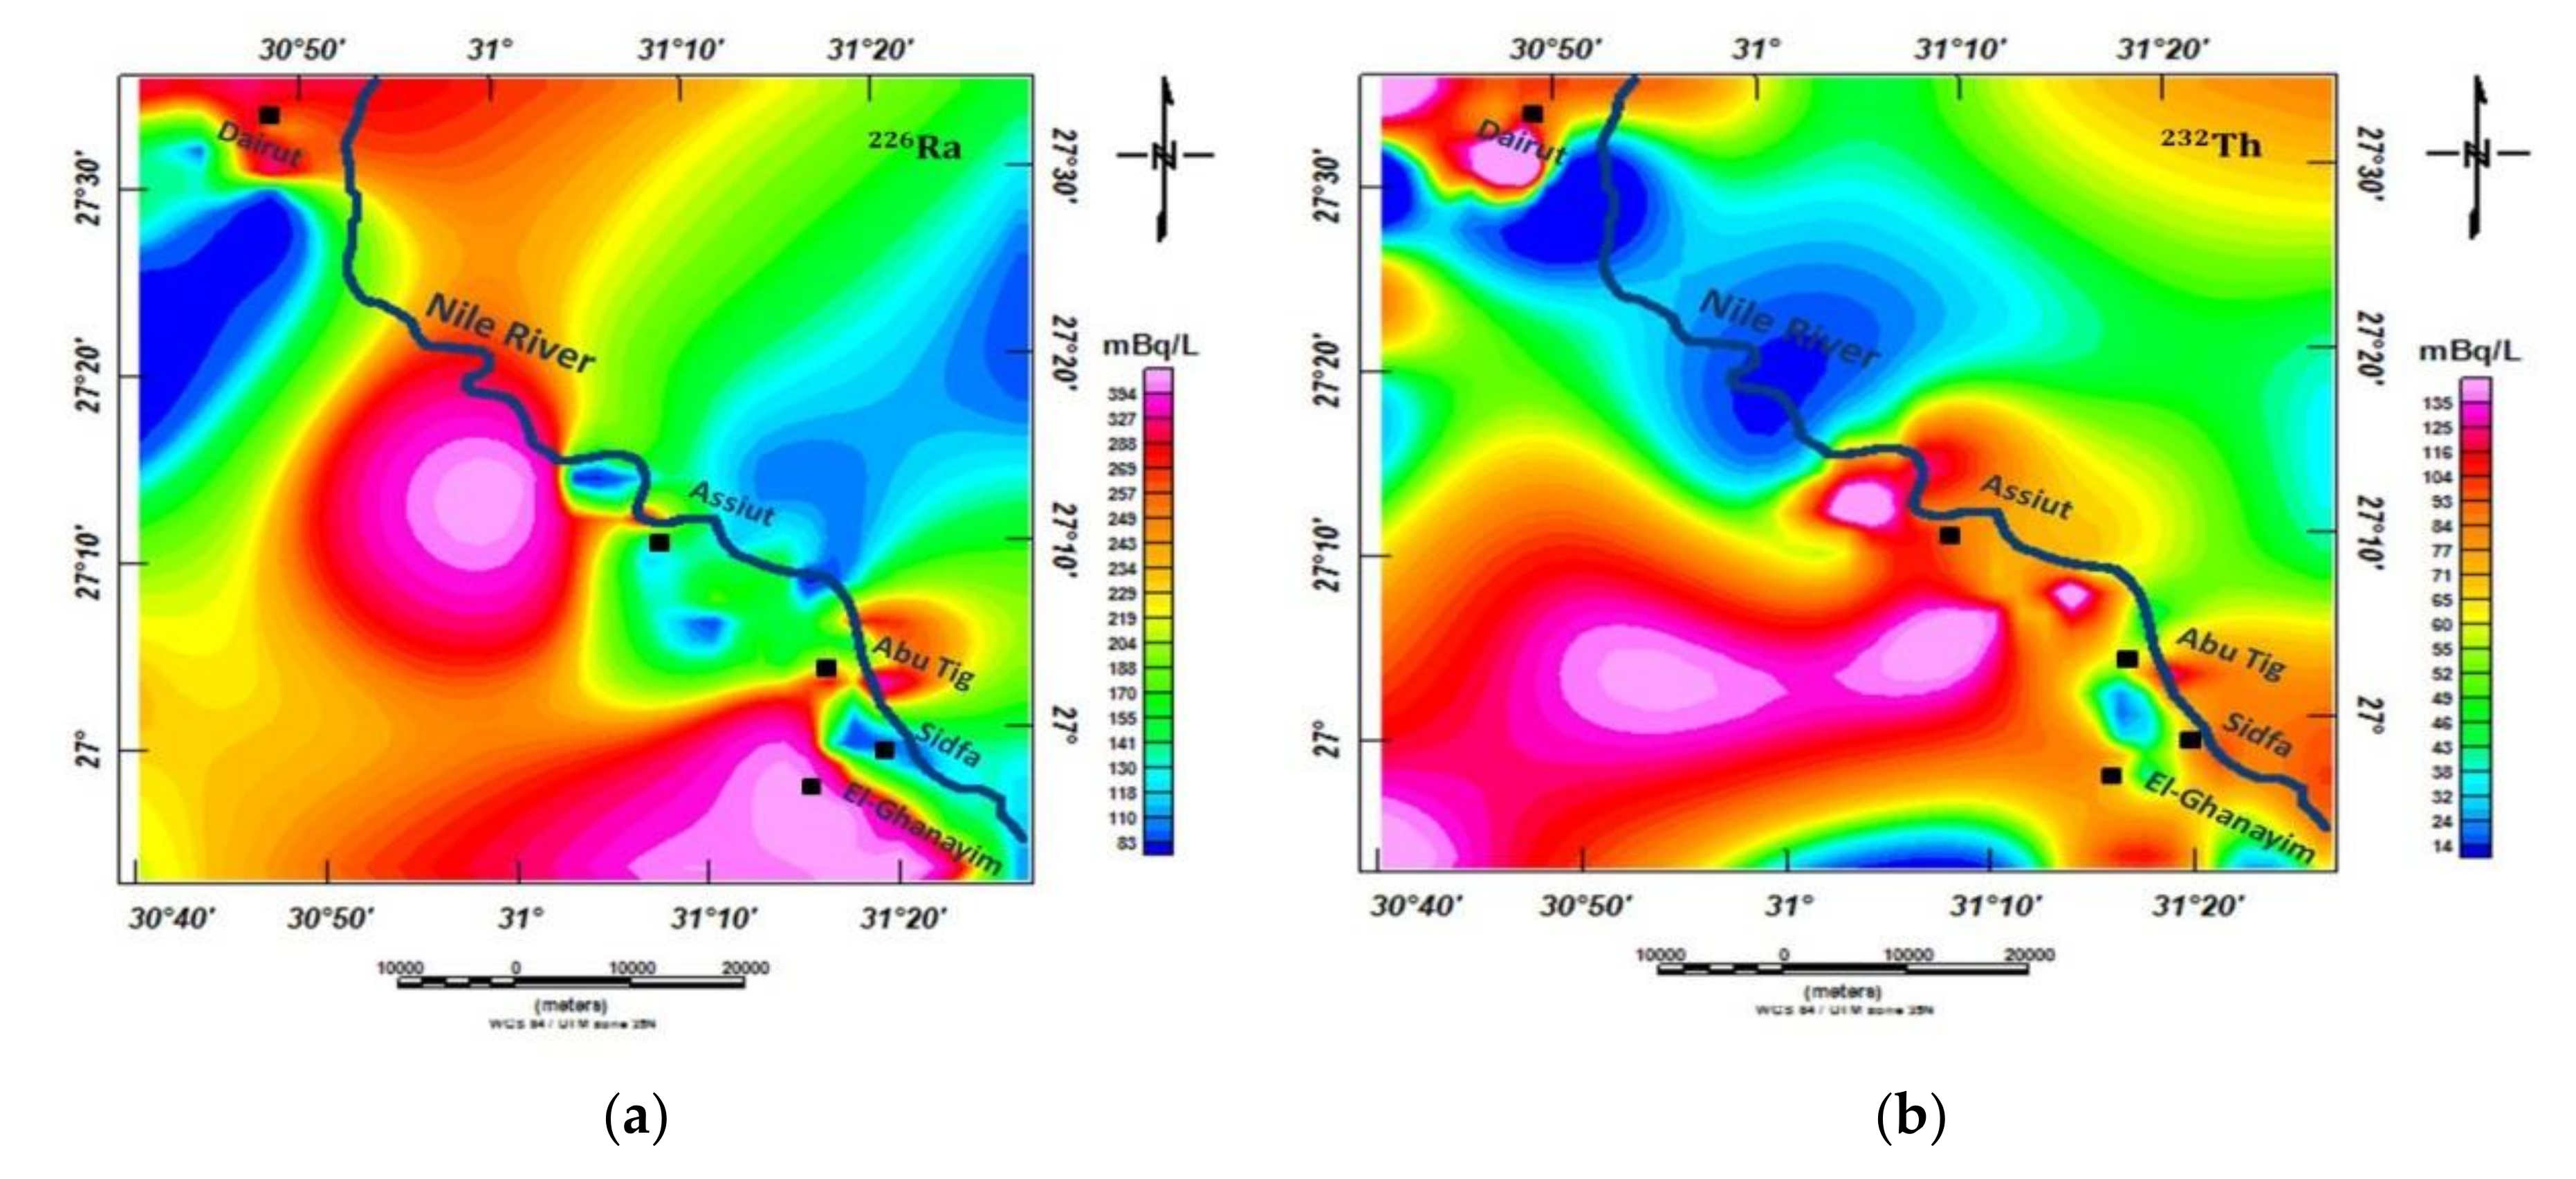
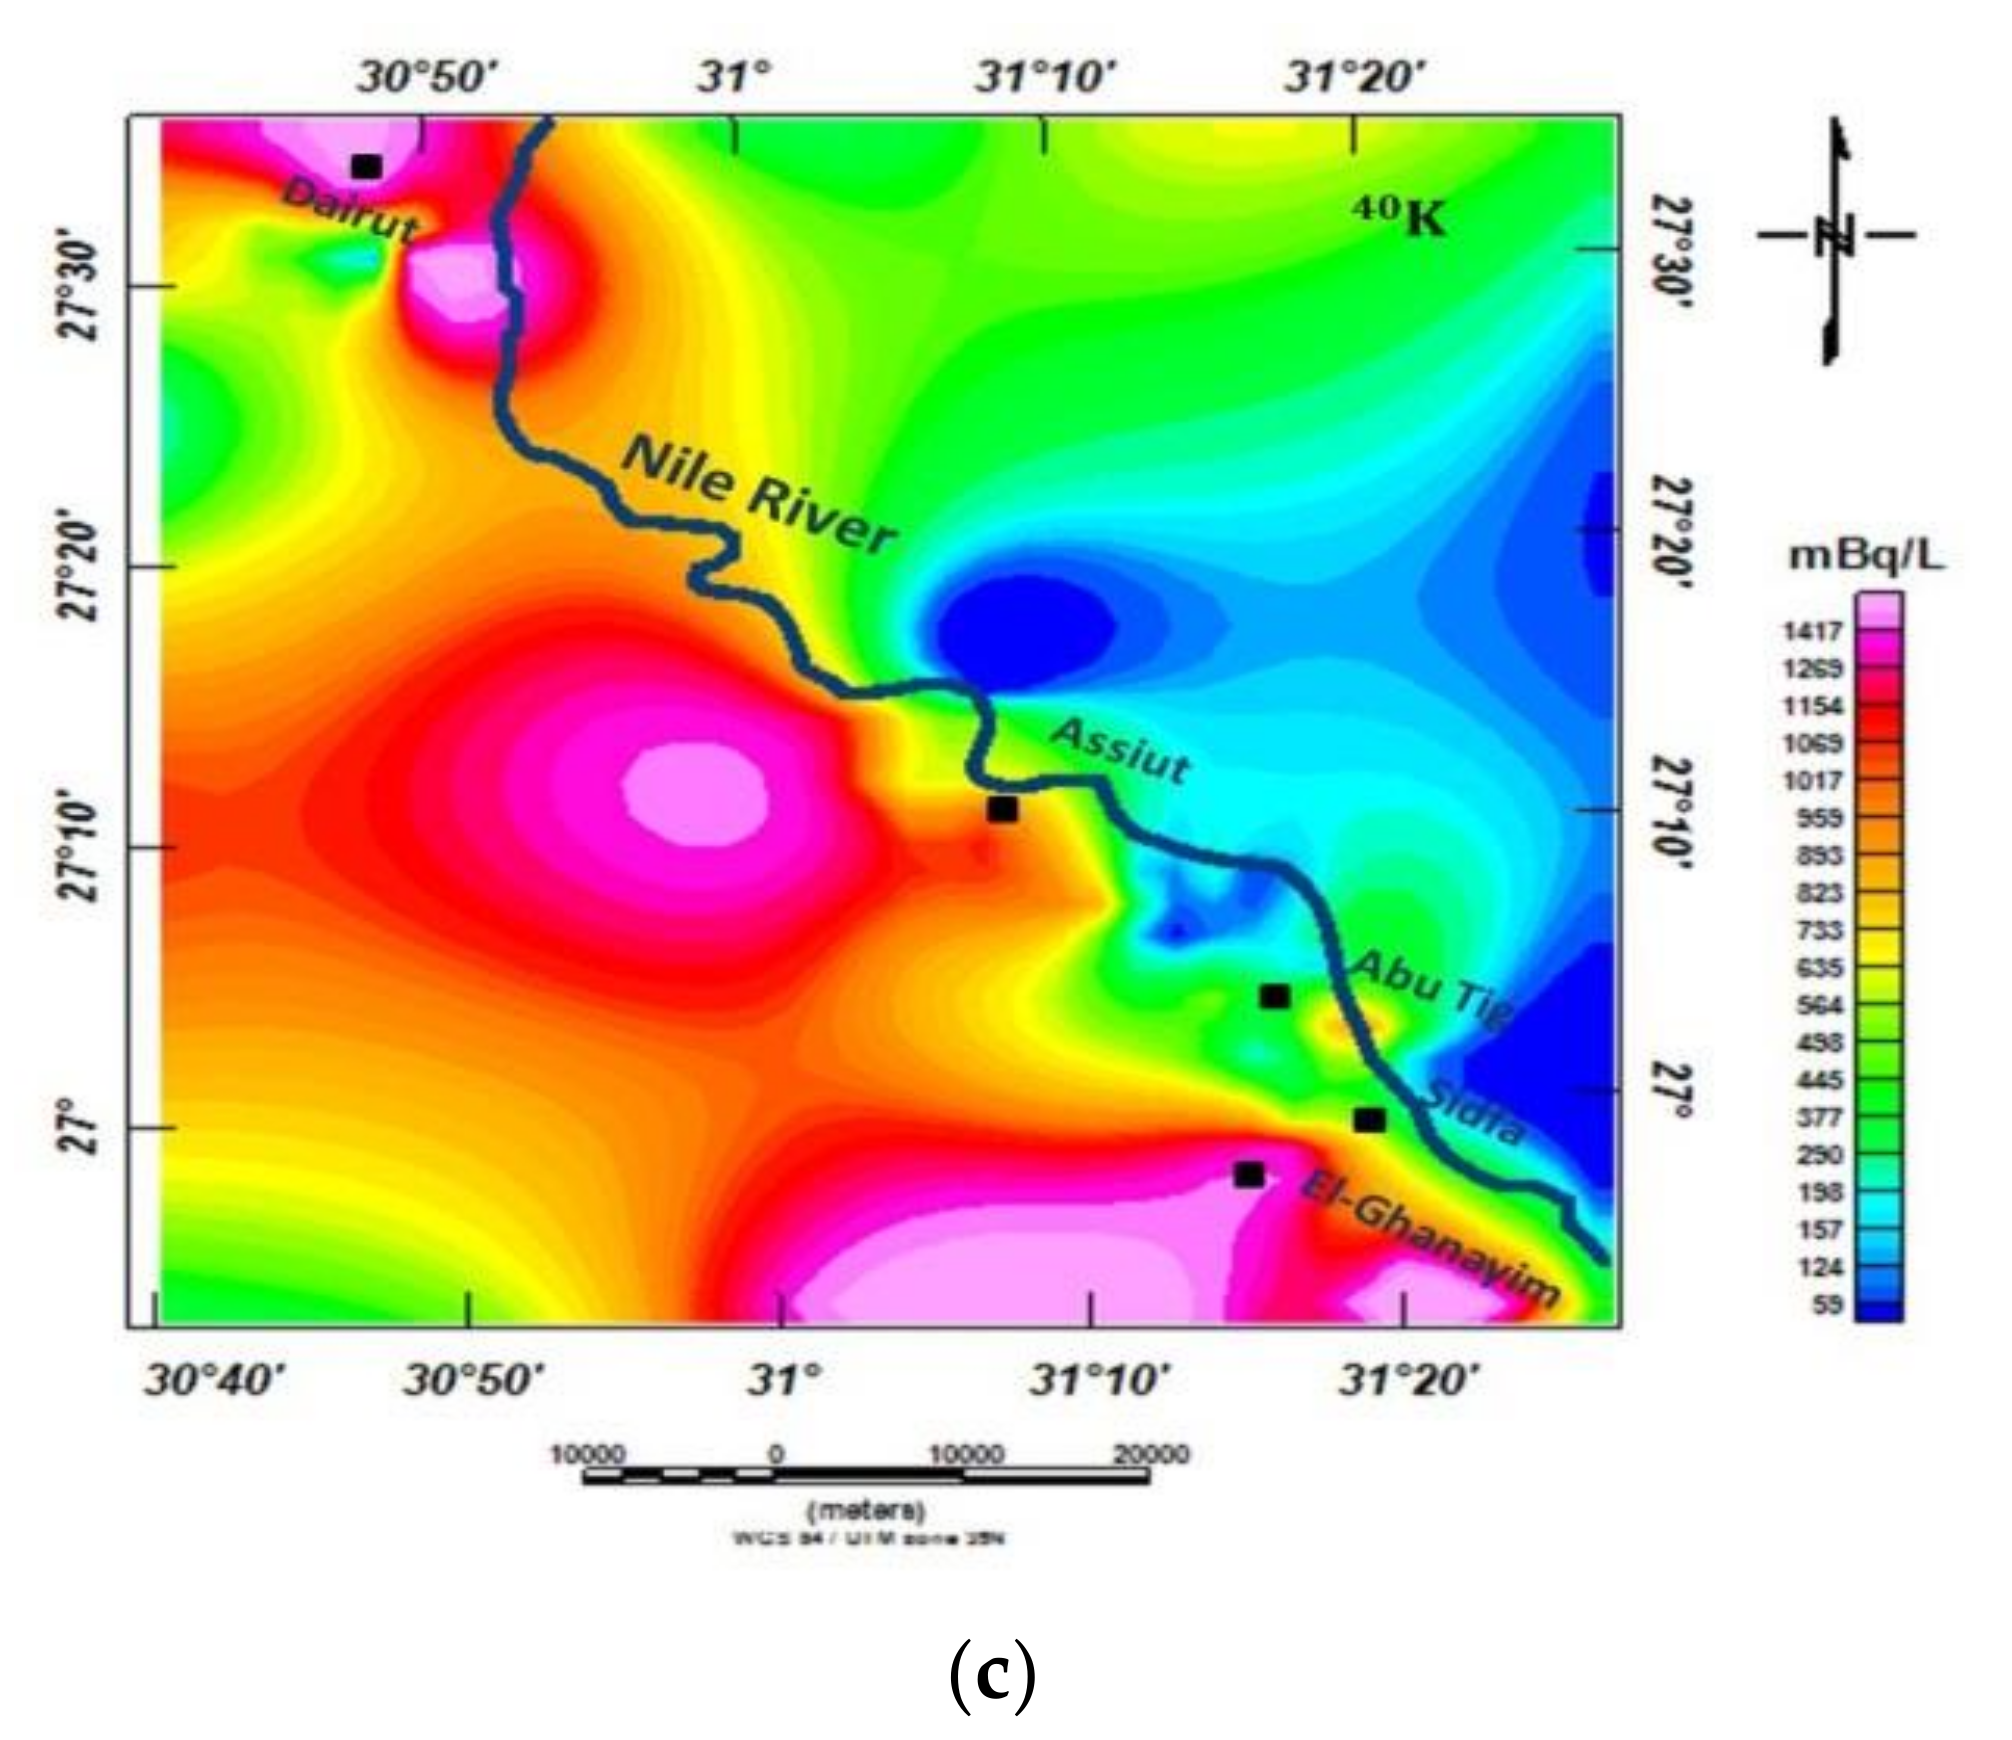
According to the distribution map of 226Ra, 232Th, and 40K for the water samples taken from the west bank of the Nile River in Assiut Governorate, as shown in Figure 6, it was found that there were considerable variations in activity concentrations of 226Ra, 232Th, and 40K, where some regions had high activity concentrations. For example, 226Ra had high activity concentrations in the west of Assiut, in Abu Tig, and around Dairut and El-Ghanayim, as in Figure 6a. 232Th had high activity concentrations southwest of Assiut and south of Dairut, as shown in Figure 6b, and 40K had large values in the west of Assiut and around Dairut and El-Ghanayim, as in Figure 6c. The other regions were characterized by moderate and small values of 226Ra, 232Th, and 40K.
4.4. Total Annual Effective Doses
The total annual effective dose for all water samples changed from 8.17 to 83.69 μSv year−1 with a mean estimation of 38.61 μSv year−1, from 14.30 to 146.65 μSv year−1 with a mean estimation of 68.01 μSvyear−1, and from 13.99 to 127.08 μSvyear−1 with a mean estimation of 58.01 μSv year−1 for infants, children, and adults, respectively. Table 4 shows that doses received by children are higher than those received by infants and adults.
The mean annual effective doses on account of all radionuclides are 38.61, 68.01, and 58.01 μSv year−1 for infants, children, and adults, respectively. These estimations represent about 14.85%, 34.01%, and 58.01% of the proposed reference estimations of 260, 200, and 100 μSv year−1 for 226Ra, 232Th, and 40K, respectively. The doses received in all examination regions by children were higher than those received by infants and adults, and doses received by adults were higher than those consumed by infants.
4.5. Risk Based on the Radium Isotopes
The annual effective doses (mSv year-1) for adults from radium isotopes and the associated cancer risk, due to water consumption in the examined areas of Assiut governorate, were determined. The annual effective dose decided from radium isotopes was changed from 3.9 × 10⁻³ to 100.6 × 10⁻³ mSv year−1 with a mean estimation of 41.6 × 10⁻³ mSv year−1 and from 2.3 × 10⁻³ to 277.3 × 10⁻³ mSv year−1 with a mean estimation of 57.1 × 10⁻³ mSv year−1 for 226Ra and 228Ra, respectively. The united ingestion of 226Ra and 228Ra was, consequently, found to stretch out from 8.4 × 10⁻³ to 345.4 × 10⁻³ mSv year−1 with a mean estimation of 83.6 × 10⁻³ mSv year−1, which is lower than the endorsed reference estimation of 0.1 mSv year−1. Table 5 shows that the maximum estimation of radiological risk for water samples for 226Ra in the Assiut domain is higher than the exchange zones. On the other hand, the maximum estimation of the radiological risk of water samples for 228Ra in the Dairut zone is higher than those in different regions. Regardless, we found that the mean estimation of radiological risk for both 226Ra and 228Ra is acceptable in examination with the reference estimation reached out from 1 × 10⁻⁴ to 1 × 10⁻⁶, which is regarded as an acceptable cancer incidence risk in the notice of data openness for radionuclides in drinking water that was disseminated by USEPA [21].
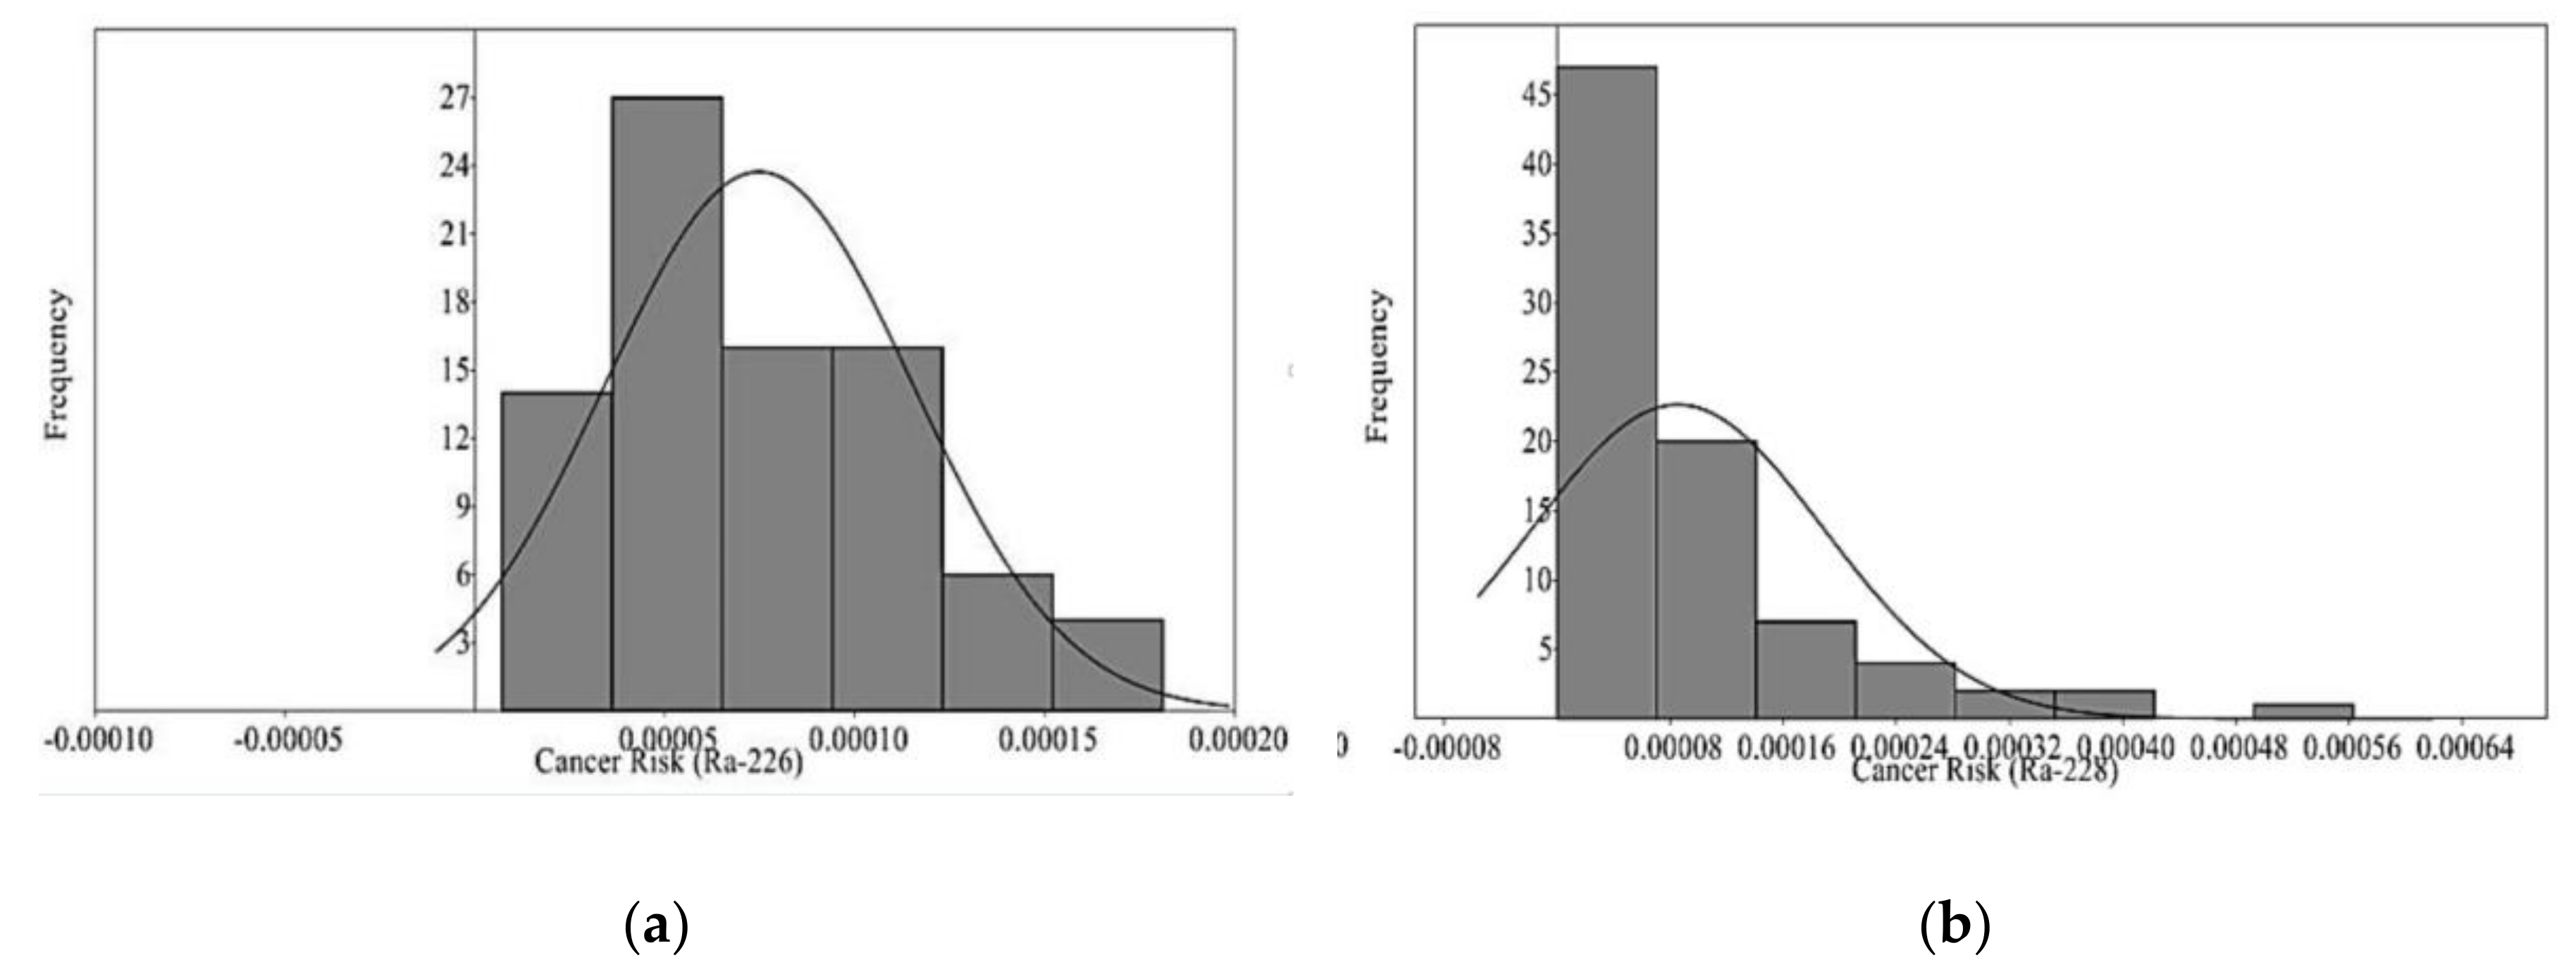
Figure 7 shows the histogram of the cancer risk based on the radium isotopes and shows that the cancer risk ranged from 7.04 × 10⁻⁶ to 1.81 × 10⁻⁴, with an average estimation of 7.47 × 10⁻⁵ for 226Ra and from 4.77 × 10⁻⁶ to 5.63 × 10⁻⁴ with an average estimation of 1.16 × 10⁻⁴ for 228Ra.
4.6. Radionuclides and Physico-Chemical Parameters
In the tested water, the electrical conductivity ranges from 0.20 to 2.01 mS/cm, the total dissolved solids reached out from 0.09 to 1.01 ppt, the pH-esteem extended from 7.21 to 9.02, and the temperatures ranged from 18.2 to 28.1 °C. There was no correlation between the physico-chemical parameters and the radionuclides 226Ra, 232Th, and 40K, where the correlation coefficients (R2) in all cases were below 0.1.
4.7. Comparison with Similar Studies in Other Countries
The estimations of 226Ra, 232Th, and 40K concentrations from the present work are different from those from other countries (Table 6). The activity concentrations of 226Ra and 232Th from the present work are higher than that uncovered in Egypt (Qena and Safaga) [22], Sudan [23], and Ghana [24] and lower than those uncovered in Yemen [12], Nigeria [25], Turkey [26], Brazil [27], and China [28]. The estimations of 40K concentration in this work show up much lower than are reported from other countries.
4.8. Comparison of 226Ra and 228Ra Concentrations in the Study Area and the Corresponding Values in Other Egyptian Cities
The estimations of the annual effective dose and the cancer risk for adults, based on 226Ra and 228Ra concentrations from the present work, appeared differently in relation to those from other Egyptian urban zones, as itemized by Abdellah and Diab [29]. The estimations of the annual effective doses and the cancer risks from the present work are higher than the estimations of annual effective doses and the cancer risks from other Egyptian urban zones, e.g., Cairo, El-Mansoura, Qalyub, Sixth of October, Alexandria, Tanta, Bani Suweif, the Sinai Peninsula, and Siwa Oasis.
5. Conclusions
A total of 83 water samples were assembled from the domain on the west bank of the Nile River in Assiut Governorate, Egypt. The natural radioactivity levels in the water samples were determined using a hyper pure germanium detector (HPGE). The mean activity concentration groupings of 226Ra, 228Ra, 228Th, 232Th, and 40K were 203.60 ± 29.61 mBq/L, 113.42 ± 22.45 mBq/L, 64.39 ± 8.59 mBq/L, 81.40 ± 13.58 mBq/L, and 688.48 ± 76.25 mBq/L for the water samples, respectively. The total annual effective doses and the estimated cancer risk show that the radionuclides under this examination do not pose any significant health risks to the public.
The data obtained in this examination are considered benchmarks, which can be used to survey possible future changes. They should give a better than average example in setting measures for water quality in the country.
Author Contributions
Investigation, G.S. and A.S; Writing—original draft, H.E.-G. and G.S; Review & Editing, H.E.-G. and A.S.
Funding
This research received no external funding.
Acknowledgments
The authors sincerely thank Prof. Dr. A. I. Abd El-Mageed for putting forward the research points of this work and ask our God to be merciful and forgiving for his death.
Conflicts of Interest
The authors declare no conflict of interest.
References
- Benedik, L.; Jeran, Z. Radiological of natural and mineral drinking waters in Slovenia. Radiat. Prot. Dosim. 2012, 151, 306–313. [Google Scholar] [CrossRef] [PubMed]
- Wallner, G.; Jabbar, T. Natural radionuclides in Austrian bottled mineral waters. J. Radioanal. Nucl. Chem. 2010, 286, 329–334. [Google Scholar] [CrossRef]
- Labidi, S.; Mahjoubi, H.; Essafi, F.; Bensalah, R. Natural radioactivity levels in mineral therapeutic and spring waters in Tunisia. Radiat. Phys. Chem. 2010, 79, 1196–1202. [Google Scholar] [CrossRef]
- Othman, I.; Yassine, T. Natural radioactivity of drinking water in the southern and middle parts of Syearia. Environ. Int. 1996, 22, 355–359. [Google Scholar] [CrossRef]
- Ajayi, O.S.; Owolabi, T.P. Determination of natural radioactivity in drinking water in private dug wells in Akure, Southwestern Nigeria. Radiat. Prot. Dosim. 2008, 128, 477–484. [Google Scholar] [CrossRef] [PubMed]
- Chowdhury, M.I.; Alam, M.N.; Hazari, S.K.S. Distribution of radionuclides in the river sediments and coastal soils of Chittagong, Bangladesh and evaluation of the radiation hazard. Appl. Radiat. Isot. 1999, 51, 747–755. [Google Scholar] [CrossRef]
- CAPMAS. Central Agency for Public Mobilization and Statistics of Egypt, Report, 5 April 2017; CAPMAS: Cairo, Egypt, 2017. [Google Scholar]
- Research Institute for Groundwater (RIGW). Hydrogeological Maps of Egypt, Assiut, Scale 1:100,000; Water Research Center, Ministry of Public Works and Water Resources: Cairo, Egypt, 2002.
- Sefelnasr, A.; Senosy, M.; Abd El-Latif, R. Temporal depth-based groundwater quality evaluation for the Quaternary aquifer, Dairut District, Assiut, Egypt. In Proceedings of the 7th International Conference on the Geology of Africa, Assiut, Egypt, 26 November 2013. [Google Scholar]
- Said, R. The Geological Evolution of the River Nile; Springer Verlag: New York, NY, USA, 1981. [Google Scholar]
- Dawoud, M.A.; Ismail, S.S. Saturated and unsaturated River Nile/groundwater aquifer interaction systems in the Nile Valley. Egypt. Arab. J. Geosci. 2013, 6, 2119–2130. [Google Scholar] [CrossRef]
- Abd El-Mageed, A.I.; El-Kamel, A.; Abbady, A.; Harb, S.; Saleh, I.I. Natural radioactivity of ground and hot spring water in some areas in Yemen. Desalination 2011, 231, 28–31. [Google Scholar] [CrossRef]
- Canberra. Germanium Detectors User’s Manual; Canberra Industries, Inc.: Meriden, CT, USA, 2013. [Google Scholar]
- EPA. Cancer Risk Coefficients for Environmental Exposure to Radionuclides, Federal Guidance Report No. 13.1999; U.S. Environmental Protection Agency: Washington, DC, USA, 1999. [Google Scholar]
- Meltem, D.; Gursel, K. Natural radioactivity in various surface waters in Adana, Turkey. Desalination 2010, 261, 126–130. [Google Scholar]
- UN. United Nations Scientific Committee on the Effects of Atomic Radiation (UNSCEAR) Sources and Effects of Ionizing Radiation, Report to the General Assembly; Annex B; United Nations: New York, NY, USA, 2000; ISBN 90-441-1195-7.
- ICRP. Age-Dependent Doses to Members of the Public from Intake of Radionuclides: Part5, Compilation of Ingestion and Inhalation Dose Coefficients, Annals of the ICRP, 26(1), ICRP Publication 72; Pergamon Press: Oxford, UK, 1996. [Google Scholar]
- IAEA. International Basic Safety Standards for Protection against Ionizing Radiation and for the Safety of Radiation Sources, Safety Series 15; International Atomic Energy Agency: Vienna, Austria, 1996. [Google Scholar]
- WHO. Guidelines for Drinking Water Quality: Radiological Aspects. Available online: http: //www.who.int/water_sanitation_health/dwq/gdwq3/en/S.2004 (accessed on 2 December 2018).
- Environmental Protection Agency (EPA). Radon in drinking water health risk reduction and cost analysis. Fed Reg. 1999, 64, 9560–9599. [Google Scholar]
- USEPA. Risk Based Concentration Table; United States Environmental Protection Agency: Philadelphia PA, USA; Washington, DC, USA, 2000. [Google Scholar]
- Ahmed, N.K. Natural radioactivity of ground and drinking water in some areas of Upper Egypt. Turk. J. Eng. Environ. Sci. 2004, 28, 345–354. [Google Scholar]
- Alfatih, A.A.; Isam, S.; Ibrahim, A.; El Din, S.; Siddeeg, M.B.; Hatem, E.; Hajo, I.; Walid, H.; Yousif, E.H. Investigation of natural radioactivity levels in water around Kadugli, Sudan. Appl. Radiat. Isot. 2006, 66, 1650–1653. [Google Scholar]
- Kpeglo, D.O.; Mantero, J.; Darko, E.O.; Emi-Reynolds, G.; Akaho, E.H.K.; Faanu, A.; Garcia-Tenorio, R. Radiological exposure assessment from soil, underground and surface water in communities along the coast of a shallow water offshore oilfield in Ghana. Radiat. Prot. Dosim. 2014, 163, 341–352. [Google Scholar] [CrossRef] [PubMed]
- Agbalagba, E.O.; Onoja, R.A. Evaluation of Natural Radioactivity in Soil, Sediment and Water samples of Niger Delta (Biseni) Flood Plain Lakes, Nigeria. J. Environ. Radioact. 2011, 102, 667–671. [Google Scholar] [CrossRef] [PubMed]
- Altikulac, A.; Turhan, S.; Gumus, H. The natural and artificial radionuclides in drinking water samples and consequent population doses. J. Radiat. Res. Applied Sci. 2015, 8, 578–582. [Google Scholar] [CrossRef]
- Godoy, J.M.; Godoy, M.L. Natural radioactivity in Brazilian groundwater. J. Environ. Radioact. 2006, 85, 71–83. [Google Scholar] [CrossRef] [PubMed]
- Zhuo, W.; Lida, T.; Yang, X. Occurrence of 222Rn, 226Ra, 228Ra and U in groundwater in Fujian Province, China. J. Environ. Radioact. 2001, 53, 111–120. [Google Scholar] [CrossRef]
- Abdellah, W.M.; Diab, H.M. Determination of Natural Radioactivity in Drinking Water and Consequent Dose to Public. Nature and Science 2012, 10, 137–142. [Google Scholar]
Figure 1.
A map showing the location of the study area and the spatial distribution of the drinking water samples within the different districts of Assiut Governorate.
Figure 1.
A map showing the location of the study area and the spatial distribution of the drinking water samples within the different districts of Assiut Governorate.

Figure 2.
The frequency distribution of the activity concentrations of 226Ra (a), 232Th (b), and 40K (c) in water samples, respectively.
Figure 2.
The frequency distribution of the activity concentrations of 226Ra (a), 232Th (b), and 40K (c) in water samples, respectively.

Figure 3.
Dendrogram cluster analysis of the studied 83 stands of Assiut Governorate with the groups (A–D).
Figure 3.
Dendrogram cluster analysis of the studied 83 stands of Assiut Governorate with the groups (A–D).

Figure 4.
Principal coordinate analysis (PCoA) diagram showing the distribution of the 83 stands of Assiut Governorate within their groups.
Figure 4.
Principal coordinate analysis (PCoA) diagram showing the distribution of the 83 stands of Assiut Governorate within their groups.

Figure 5.
The location map of Assiut Governorate showing the stand distribution of the four groups.

Figure 6.
Distribution map of 226Ra (a), 232Th (b), and 40K (c) activity concentrations for water samples, respectively.
Figure 6.
Distribution map of 226Ra (a), 232Th (b), and 40K (c) activity concentrations for water samples, respectively.


Figure 7.
Histogram of the cancer risk results of water consumption for radium-226 (a) and radium-228 (b) in the study area respectively.
Figure 7.
Histogram of the cancer risk results of water consumption for radium-226 (a) and radium-228 (b) in the study area respectively.


Table 1.
The conversion factors (CF (W)) of the relevant radionuclides for different age groups [17,18,19].
| Age Group | 226Ra × 10−7(Sv Bq−1) | 232Th × 10−7(Sv Bq−1) | 40K × 10−9(Sv Bq−1) |
|---|---|---|---|
| Infants | 9.6 | 4.5 | 5 |
| Children | 8 | 2.9 | 5 |
| Adults | 2.8 | 2.3 | 5 |
Table 2.
The ranges and average values of 226Ra, 228Ra, 232Th, and 40K activity concentrations for water samples.
Table 2.
The ranges and average values of 226Ra, 228Ra, 232Th, and 40K activity concentrations for water samples.
| Areas | 226Ra (mBq/L) | ||
|---|---|---|---|
| Minimum | Maximum | Average | |
| Dairut | 23.99 ± 2.99 | 383.46 ± 53.35 | 197.81 ± 28.58 |
| Assiut | 19.20 ± 2.40 | 492.26 ± 71.52 | 164.47 ± 24.14 |
| Abu Tig | 59.04 ± 8.32 | 421.62 ± 58.11 | 231.53 ± 33.45 |
| Sidfa and El-Ghanayim | 46.14 ± 6.86 | 453.27 ± 67.50 | 257.32 ± 37.63 |
| Assiut* | 19.20 ± 2.40 | 492.26 ± 71.52 | 203.60 ± 29.61 |
| 228Ra (mBq/L) | |||
| Dairut | 5.59 ± 0.96 | 550.58 ± 109.56 | 130.15 ± 23.97 |
| Assiut | 7.92 ± 1.30 | 365.99 ± 73.85 | 136.47 ± 26.48 |
| Abu Tig | 4.67 ± 1.19 | 256.78 ± 60.22 | 85.85 ± 19.82 |
| Sidfa and El-Ghanayim | 13.04 ± 2.36 | 122.99 ± 20.57 | 68.47 ± 11.48 |
| Assiut* | 4.67 ± 1.19 | 550.58 ± 109.56 | 113.42 ± 22.45 |
| 232Th (mBq/L) | |||
| Dairut | 22.03 ± 2.93 | 351.39 ± 66.13 | 107.53 ± 17.12 |
| Assiut | 28.12 ± 3.76 | 206.19 ± 46.23 | 94.37 ± 15.95 |
| Abu Tig | 15.58 ± 2.62 | 153.07 ± 33.64 | 58.12 ± 10.36 |
| Sidfa and El-Ghanayim | 55.14 ± 7.41 | 105.99 ± 13.22 | 78.07 ± 11.20 |
| Assiut* | 15.58 ± 2.62 | 351.39 ± 66.13 | 81.40 ± 13.58 |
| 40K (mBq/L) | |||
| Dairut | 308.16 ± 34.18 | 2255.03 ± 249.42 | 913.95 ± 100.95 |
| Assiut | 81.76 ± 9.05 | 1310.50 ± 145.23 | 609.20 ± 67.39 |
| Abu Tig | 103.27 ± 11.48 | 1363.72 ± 150.98 | 624.08 ± 69.29 |
| Sidfa and El-Ghanayim | 50.31 ± 5.58 | 1676.38 ± 185.68 | 826.30 ± 91.57 |
| Assiut* | 50.31 ± 5.58 | 2255.03 ± 249.42 | 688.48 ± 76.25 |
Assiut*: the values obtained from all locations of the study area.
Table 3.
Mean values with ANOVA table for the radioactive components in the groups (A–D) of Assiut Governorate water.
Table 3.
Mean values with ANOVA table for the radioactive components in the groups (A–D) of Assiut Governorate water.
| All Samples | |||||
|---|---|---|---|---|---|
| Group | A | B | C | D | F-Value |
| N | 37 | 23 | 4 | 19 | |
| Ra-226 | 173.97 ± 14.22 | 294.47 ± 25.06 | 58.52 ± 10.42 | 181.83 ± 17.55 | 11.98 ** |
| Th-232 | 69.37 ± 5.93 | 94.24 ± 10.56 | 42.14 ± 12.11 | 97.57 ± 17.18 | 2.59 |
| K-40 | 543.35 ± 24.07 | 1205.94 ± 70.75 | 38.39 ± 24.66 | 82.97 ± 19.62 | 113.96 ** |
** means a large significant difference between the four groups.
Table 4.
The ranges and average estimations of the total annual effective doses for infants, children, and adults for water samples.
Table 4.
The ranges and average estimations of the total annual effective doses for infants, children, and adults for water samples.
| Areas | Minimum | Maximum | Average |
|---|---|---|---|
| Infants (μSv year−1) | |||
| Dairut | 10.39 | 83.69 | 41.02 |
| Assiut | 8.17 | 81.04 | 33.14 |
| Abu Tig | 10.49 | 76.25 | 40.8 |
| Sidfa and El-Ghanayim | 12.12 | 79.75 | 47.53 |
| Assiut* | 8.17 | 83.69 | 38.61 |
| Children (μSv year−1) | |||
| Dairut | 14.3 | 139.07 | 70.11 |
| Assiut | 14.91 | 146.65 | 57.86 |
| Abu Tig | 19.02 | 135.85 | 73.28 |
| Sidfa and El-Ghanayim | 20.91 | 141.15 | 83.73 |
| Assiut* | 14.3 | 146.65 | 68.01 |
| Adults (μSv year−1) | |||
| Dairut | 15.71 | 127.08 | 62.28 |
| Assiut | 13.99 | 111.27 | 51.68 |
| Abu Tig | 15.87 | 114.5 | 59.63 |
| Sidfa and El-Ghanayim | 22.49 | 111.6 | 69.44 |
| Assiut* | 13.99 | 127.08 | 58.01 |
Table 5.
The ranges and average values of annual effective doses (mSv year−1) for adults and the radiological risk of radium isotopes for water samples.
Table 5.
The ranges and average values of annual effective doses (mSv year−1) for adults and the radiological risk of radium isotopes for water samples.
| Area | Annual Effective Dose × 10−3 (mSv year−1) | Radiological Risk × 10−4 | ||||
|---|---|---|---|---|---|---|
| 226Ra | 226Ra | |||||
| Min | Max | Average | Min | Max | Average | |
| Dairut | 4.9 | 78.4 | 40.4 | 8.8 × 10⁻² | 1.41 | 0.726 |
| Assiut | 4 | 101 | 34 | 7.04 × 10⁻² | 1.81 | 0.603 |
| Abu Tig | 12 | 86 | 47 | 0.217 | 1.55 | 0.849 |
| Sidfa and El-Ghanayim | 9 | 93 | 53 | 0.133 | 1.26 | 0.701 |
| Assiut* | 3.9 | 100.6 | 41.6 | 7.04 × 10⁻² | 1.81 | 0.747 |
| 228Ra | 228Ra | |||||
| Dairut | 2.8 | 277.3 | 65.6 | 5.72 × 10⁻² | 5.63 | 1.33 |
| Assiut | 4 | 184 | 69 | 8.10 × 10⁻² | 3.74 | 1.40 |
| Abu Tig | 2 | 129 | 46.7 | 4.77 × 10⁻² | 2.63 | 0.878 |
| Sidfa and El-Ghanayim | 7 | 62 | 34 | 0.169 | 1.66 | 0.944 |
| Assiut* | 2.3 | 277.3 | 57.1 | 4.77 × 10⁻² | 5.63 | 1.16 |
Table 6.
The activity concentration in Bql−1 of water samples in the present investigation in comparison with other countries.
Table 6.
The activity concentration in Bql−1 of water samples in the present investigation in comparison with other countries.
| Country | Activity Concentration in Bq/L | Water type | Ref | ||
|---|---|---|---|---|---|
| 226Ra | 232Th | 40K | |||
| Assiut (Dairut) | Mean 0.197 | Mean 0.107 | Mean 0.836 | Drinking water | Present work |
| Assiut (Assiut) | Mean 0.164 | Mean 0.094 | Mean 0.600 | Drinking water | |
| Assiut (AbuTig) | Mean 0.232 | Mean 0.058 | Mean 0.677 | Drinking Water | |
| Assiut (Sidfa and El-Ghanayim) | Mean 0.257 | Mean 0.078 | Mean 0.826 | Drinking Water | |
| Assiut* | Mean 0.204 | Mean 0.081 | Mean 0.693 | Drinking Water | |
| Egypt (Qena) | Mean 0.08 | Mean 0.04 | Groundwater | [22] | |
| Egypt (Safaga) | Mean 0.1 | Mean 0.05 | Groundwater | ||
| Yemen (Ass-Alh) | 2.01–6.55 | 1.07–2.93 | Groundwater | [12] | |
| Yemen (Juban) | 2.25–3.45 | 0.3–1.43 | 26.73–43.7 | Groundwater | |
| Sudan | 0.007–0.014 | 0.001–0.039 | Groundwater | [23] | |
| Brazil | 0.01–3.79 | Groundwater | [27] | ||
| China | Max 0.93 | Groundwater | [28] | ||
| Turkey | 0.419 | 0.806 | Drinking Water | [26] | |
| Ghana | Mean 0.0137 | Mean 0.0012 | Surface water | [24] | |
| Nigeria | Mean 12 | Mean 12 | Mean 97 | Lakes surface water | [25] |
© 2019 by the authors. Licensee MDPI, Basel, Switzerland. This article is an open access article distributed under the terms and conditions of the Creative Commons Attribution (CC BY) license (http://creativecommons.org/licenses/by/4.0/).
Share and Cite
MDPI and ACS Style
El-Gamal, H.; Sefelnasr, A.; Salaheldin, G. Determination of Natural Radionuclides for Water Resources on the West Bank of the Nile River, Assiut Governorate, Egypt. Water 2019, 11, 311. https://doi.org/10.3390/w11020311
AMA Style
El-Gamal H, Sefelnasr A, Salaheldin G. Determination of Natural Radionuclides for Water Resources on the West Bank of the Nile River, Assiut Governorate, Egypt. Water. 2019; 11(2):311. https://doi.org/10.3390/w11020311
Chicago/Turabian StyleEl-Gamal, Hany, Ahmed Sefelnasr, and Ghada Salaheldin. 2019. "Determination of Natural Radionuclides for Water Resources on the West Bank of the Nile River, Assiut Governorate, Egypt" Water 11, no. 2: 311. https://doi.org/10.3390/w11020311
Note that from the first issue of 2016, this journal uses article numbers instead of page numbers. See further details here.