Article

Potential of Shrubs, Shore Vegetation and Macrophytes of a Lake to Function as a Phytogeochemical Barrier against Biogenic Substances of Various Origin

by
Artur Serafin
1,
Joanna Sender
2 and
Urszula Bronowicka-Mielniczuk
3,*
1
Department of Environmental Engineering and Geodesy, University of Life Sciences in Lublin, Leszczyńskiego 7, 20-069 Lublin, Poland
2
Department of Hydrobiology and Protection of Ecosystems, University of Life Sciences in Lublin, Dobrzańskiego 37, 20-262 Lublin, Poland
3
Department of Applied Mathematics and Computer Science, University of Life Sciences in Lublin, Głęboka 28, 20-612 Lublin, Poland
*
Author to whom correspondence should be addressed.
Water 2019, 11(2), 290; https://doi.org/10.3390/w11020290
Submission received: 9 January 2019 / Revised: 30 January 2019 / Accepted: 31 January 2019 / Published: 7 February 2019

Abstract

:
The objective of this study was to perform a comprehensive botanical analysis of shore and littoral vegetation of a model mesotrophic lake and investigate their effectiveness as a phytogeochemical barrier against biogens of various origin. A lake catchment was characterised by natural (forests) as well as anthropogenic land use (extensive agriculture and stationary and unorganised recreation), generating a determined variability in the load of biogenic substances to lake waters. High potential effectiveness of the phytogeochemical barriers of the analysed phytocoenoses in the assimilation of biogenic substances was found to be particularly related to: species richness, diversity of life forms, presence of specific groups and species of plants and width of the buffer zone. This situation results from the natural properties of the habitat and the modifying effect of anthropogenic transformations in the catchment, affecting the biocoenotic composition of the shore and littoral vegetation of the lake, and therefore shaping the structure of its buffer zones. The morphometric parameters and hydrological conditions of the catchment, combined with variable human pressure and modified by the effectiveness of ecotone biogeochemical barriers, contribute to the mesotrophic limnological status of the lake.

1. Introduction

Allochtonic matter is supplied from a catchment area together with precipitation and surface or subsurface runoff through hydraulic connections, enriching a lake in organic substances [1,2,3,4]. The system of the lake itself develops a mutually regulating mechanism based on close relationships between the biocoenosis and its internal interactions and the biotope, which represents elements of the nonliving environment [2,5].
The most important element of limnological status classification is the trophic status of lakes, which describes their abundance in biogenic substances [6]. The level of fertility of a lake is particularly determined by its hydrology and morphometry. The amounts of contaminants supplied to the lake are especially determined by the surface area of the catchment, natural environmental features and land use [7,8,9,10]. Agricultural areas subject to chemisation and mechanisation of production in reference to the typology of soils and hydrological interactions constitute the basic source of biogenic substances for water bodies [11,12,13]. Moreover, intensive, industrialised agriculture also changes the landscape structure (fragmentation of natural habitats) and chemism of the environment (use of fertilisers and plant protection products). It is mentioned as the primary factor in global assessments of the causes of impoverishment of the environment [14,15].
The development of tourism and stationary and unorganised recreation is largely related to both the attractiveness of a given place, particularly determined by environmental and landscape values, and the level of development of tourist and recreation infrastructure. It should be emphasised, however, that a supply of even small amounts of biogenic substances affects water quality and can destabilise the basic components of the lake biocoenosis, i.e., the shore vegetation, macrophytes of the littoral or water invertebrates [10,16,17,18,19]. Therefore, tourism remains in a close relationship with the natural environment and causes its unfavourable transformations [20,21].
The load of biogenic substances is also indirectly determined by modifications regulating water relations in a catchment area. Melioration measures in the form of regulating river channels, digging melioration ditches and incorporation of lakes in, and exclusion of lakes from, the outflow network result in profound changes in the balance of biogenic substances supplied to water bodies [22].
Shrubs, shore vegetation and lake macrophytes constitute a complex system. It is the last barrier capable of capturing biogenic substances of various origin generated from different land uses in the lake catchment, and is described as the phytogeochemical barrier. The majority of papers discussing the issue of biogeochemical barriers focus on the role of waterholes or field tree stands in the development of the balance of biogenic substances in the agricultural landscape [15,23,24,25,26,27], and to a somewhat lower degree typical water ecosystems [28,29,30,31]. Nonetheless, the botanical state of the flora adjacent to the shore and littoral vegetation communities, biocoenotic transformations and anthropogenic conditions in riparian buffer zones can provide preliminary information on environmental pollutants entering water ecosystems. Such data, combined with the analysis of biological indicators of water eutrophication, provide a more comprehensive insight into the functioning of the land–water system without the need for costly analyses of physical-chemical properties of ground and lake waters.
For the mesotrophic Lake Piaseczno, the objective was to analyse the potential of plant communities along the shore and littoral zone (macrophytes) to function as a phytogeochemical barrier in reference to the biogenic loads generated from different land uses in the lake catchment and its productivity measured by biological water indicators.

2. Study Area

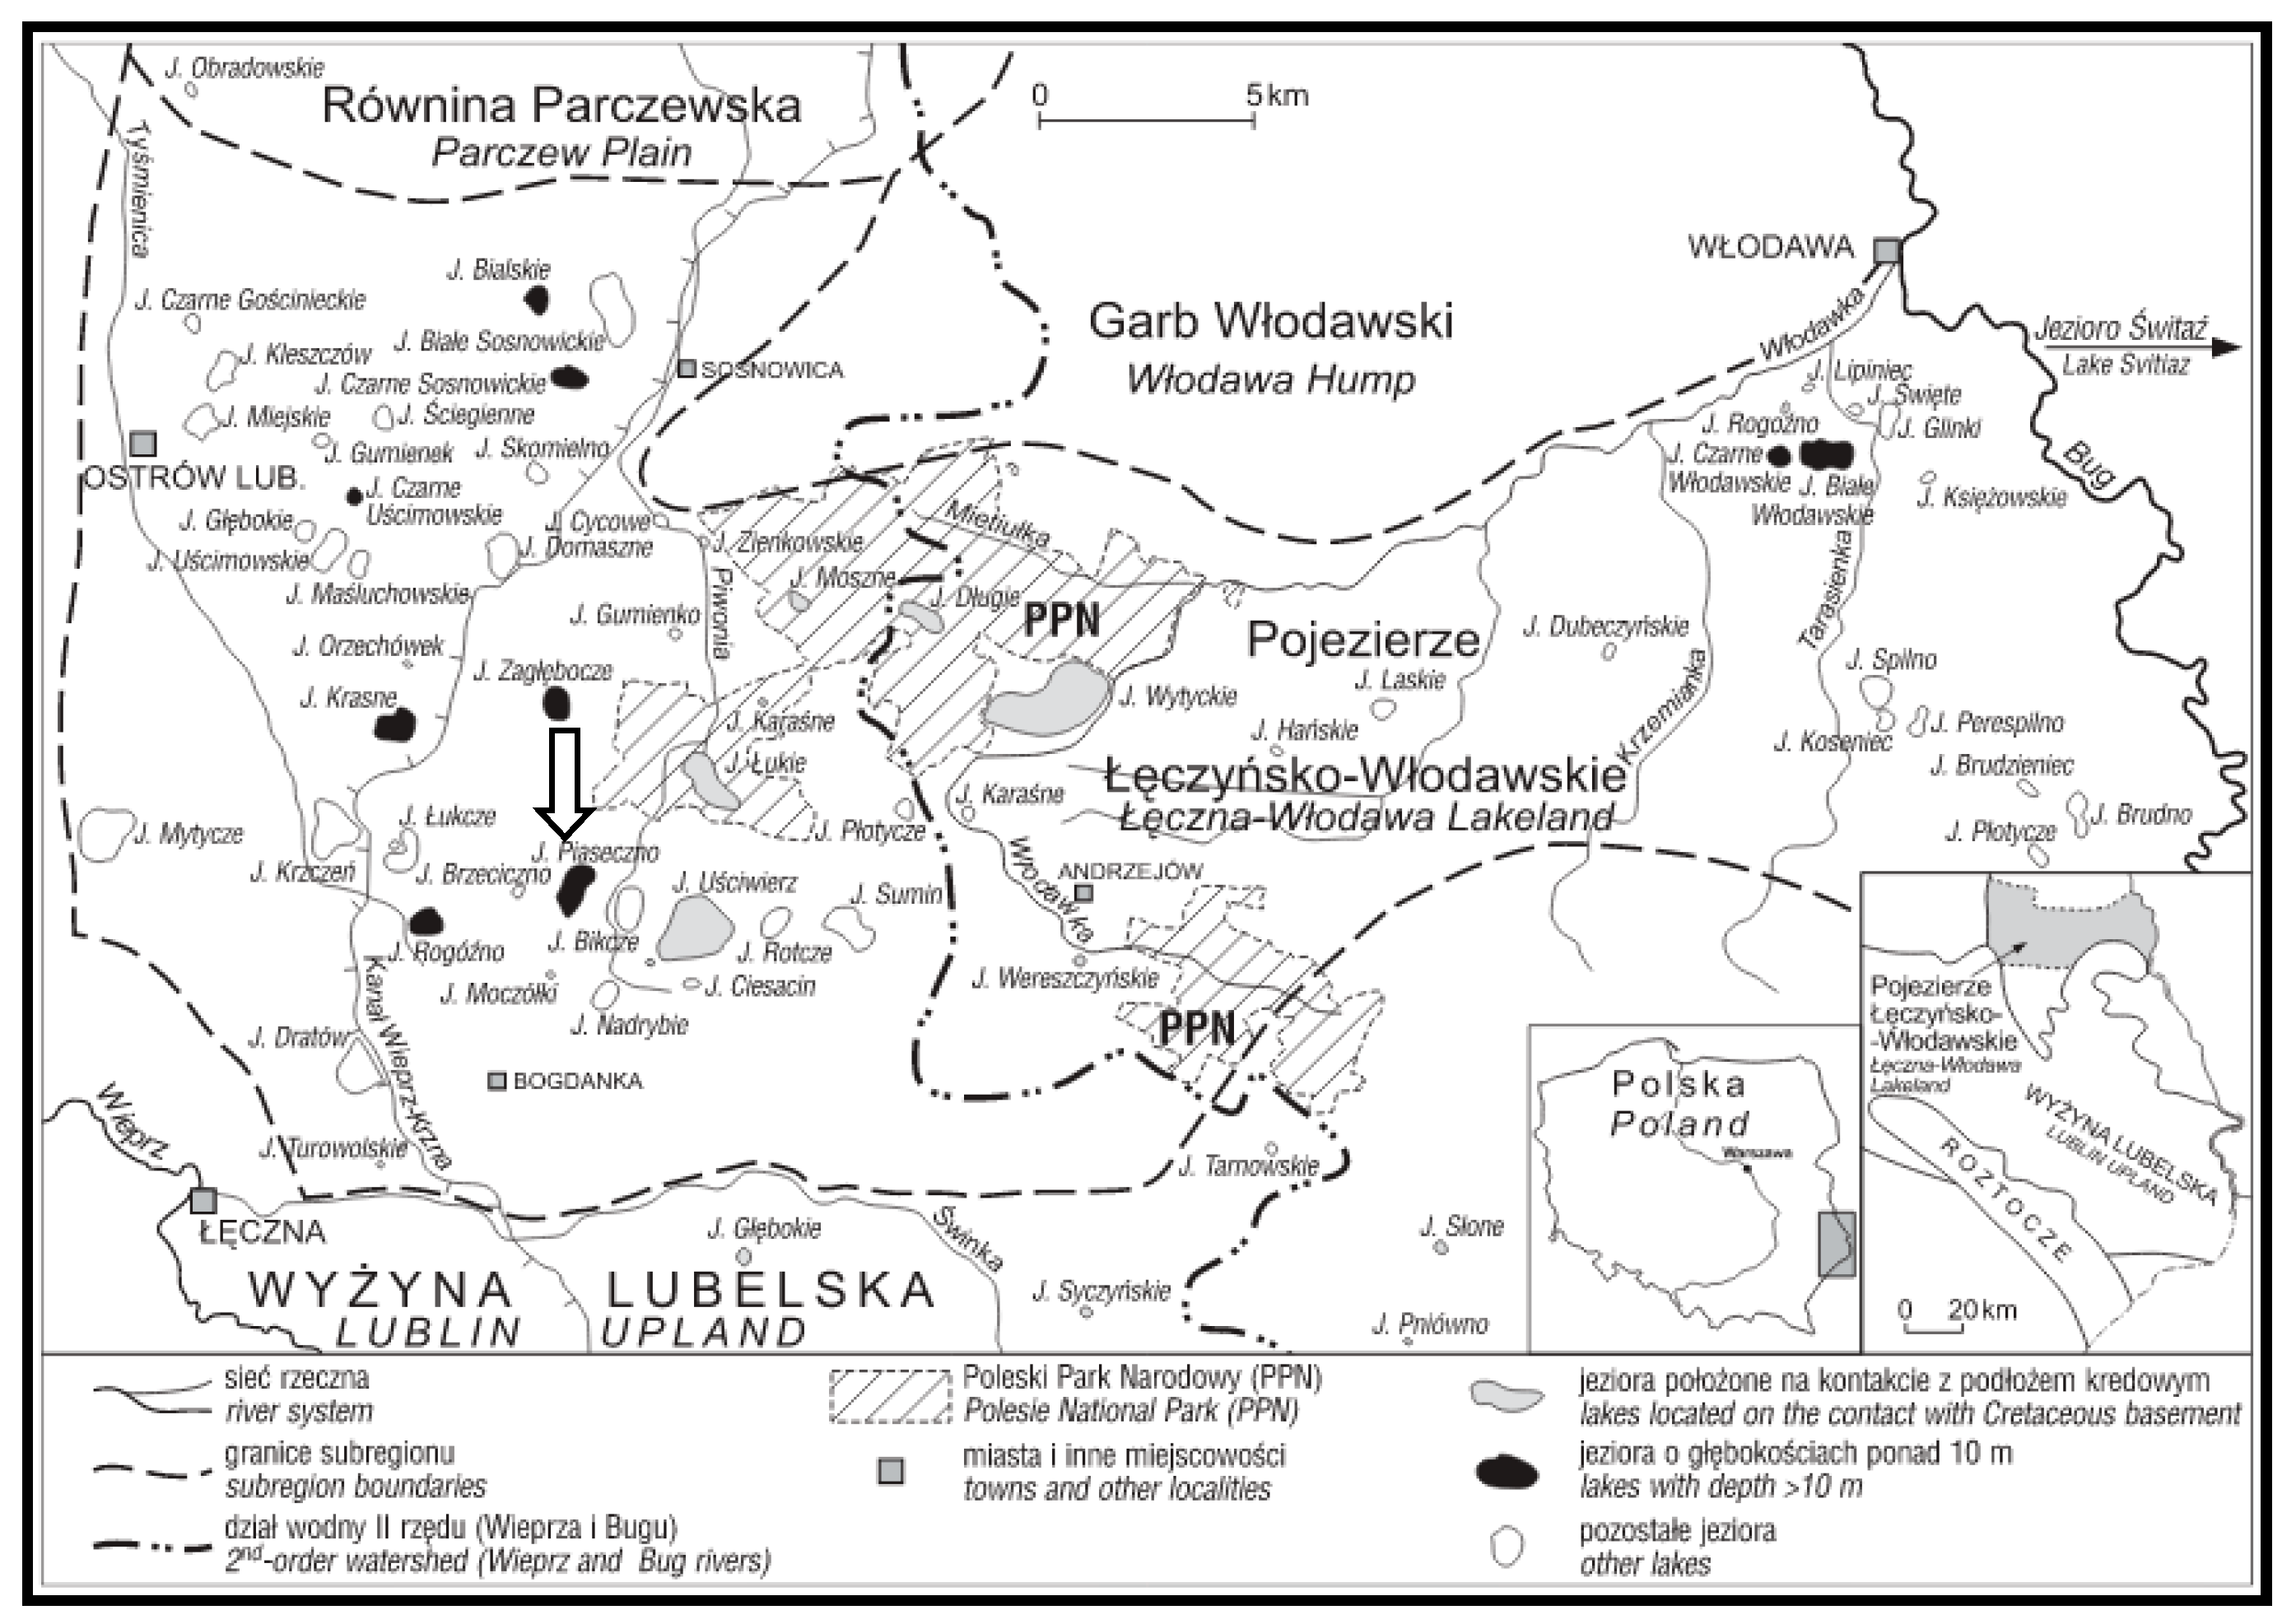
In the administrative division of Poland, Lake Piaseczno (51°23′03″ N; 23°01′46″ E) is located in the centre of the Lublin Voivodeship, in the northern part of the Łęczna Poviat, in the Ludwin Commune, within the physiographic unit of the Łęczna-Włodawa Lake District included in the macroregion of Polesie Podlaskie (East Poland) (Figure 1).
In the hydrographic division, Lake Piaseczno is included in the catchment of the Wieprz River, in the upper part of the catchment of the Piwonia Południowa River. The river originates in the vicinity of the lake, and has no surface connection with it. Therefore, its catchment is described as a surface-closed-drainage catchment [33].
Lake Piaseczno is classified as a very deep lake, with a maximum depth of 38.8 m and a high water volume (10.67 million m3). It is a dimictic lake in the bradymictic type, and, in terms of trophic status, it is mesotrophic (Table 1).
Catchment morphology is one of the elements that determines a lake’s hydrological conditions and land use structure. The catchment of Lake Piaseczno is not physiographically differentiated from the remaining area of the Lake District.
The area is dominated by very gentle undulating plains of a higher accumulation horizon, with an indistinctly marked watershed, evidently contrasting with the lake basin landform with steep slopes. This determines rarely occurring surface runoff, which is related to the presence of very permeable formations and the ecological structure of the catchment [33].
The lake has no inflows or outflows. It is primarily fed by precipitation waters supplying allochthonic substances from the catchment with surface runoff. In the summer period, it is subject to complete thermal stratification.
Part of the area around the lake constitutes a sandy beach that alternates with shore vegetation and shrubs dominated by Salix cinerea and Betula pubescens. To the north and south, the lake is adjacent to a mixed forest, and in its northwestern fragment it neighbours on formerly active swamps and peatlands separated by a relatively narrow transitional zone [34,35,36].
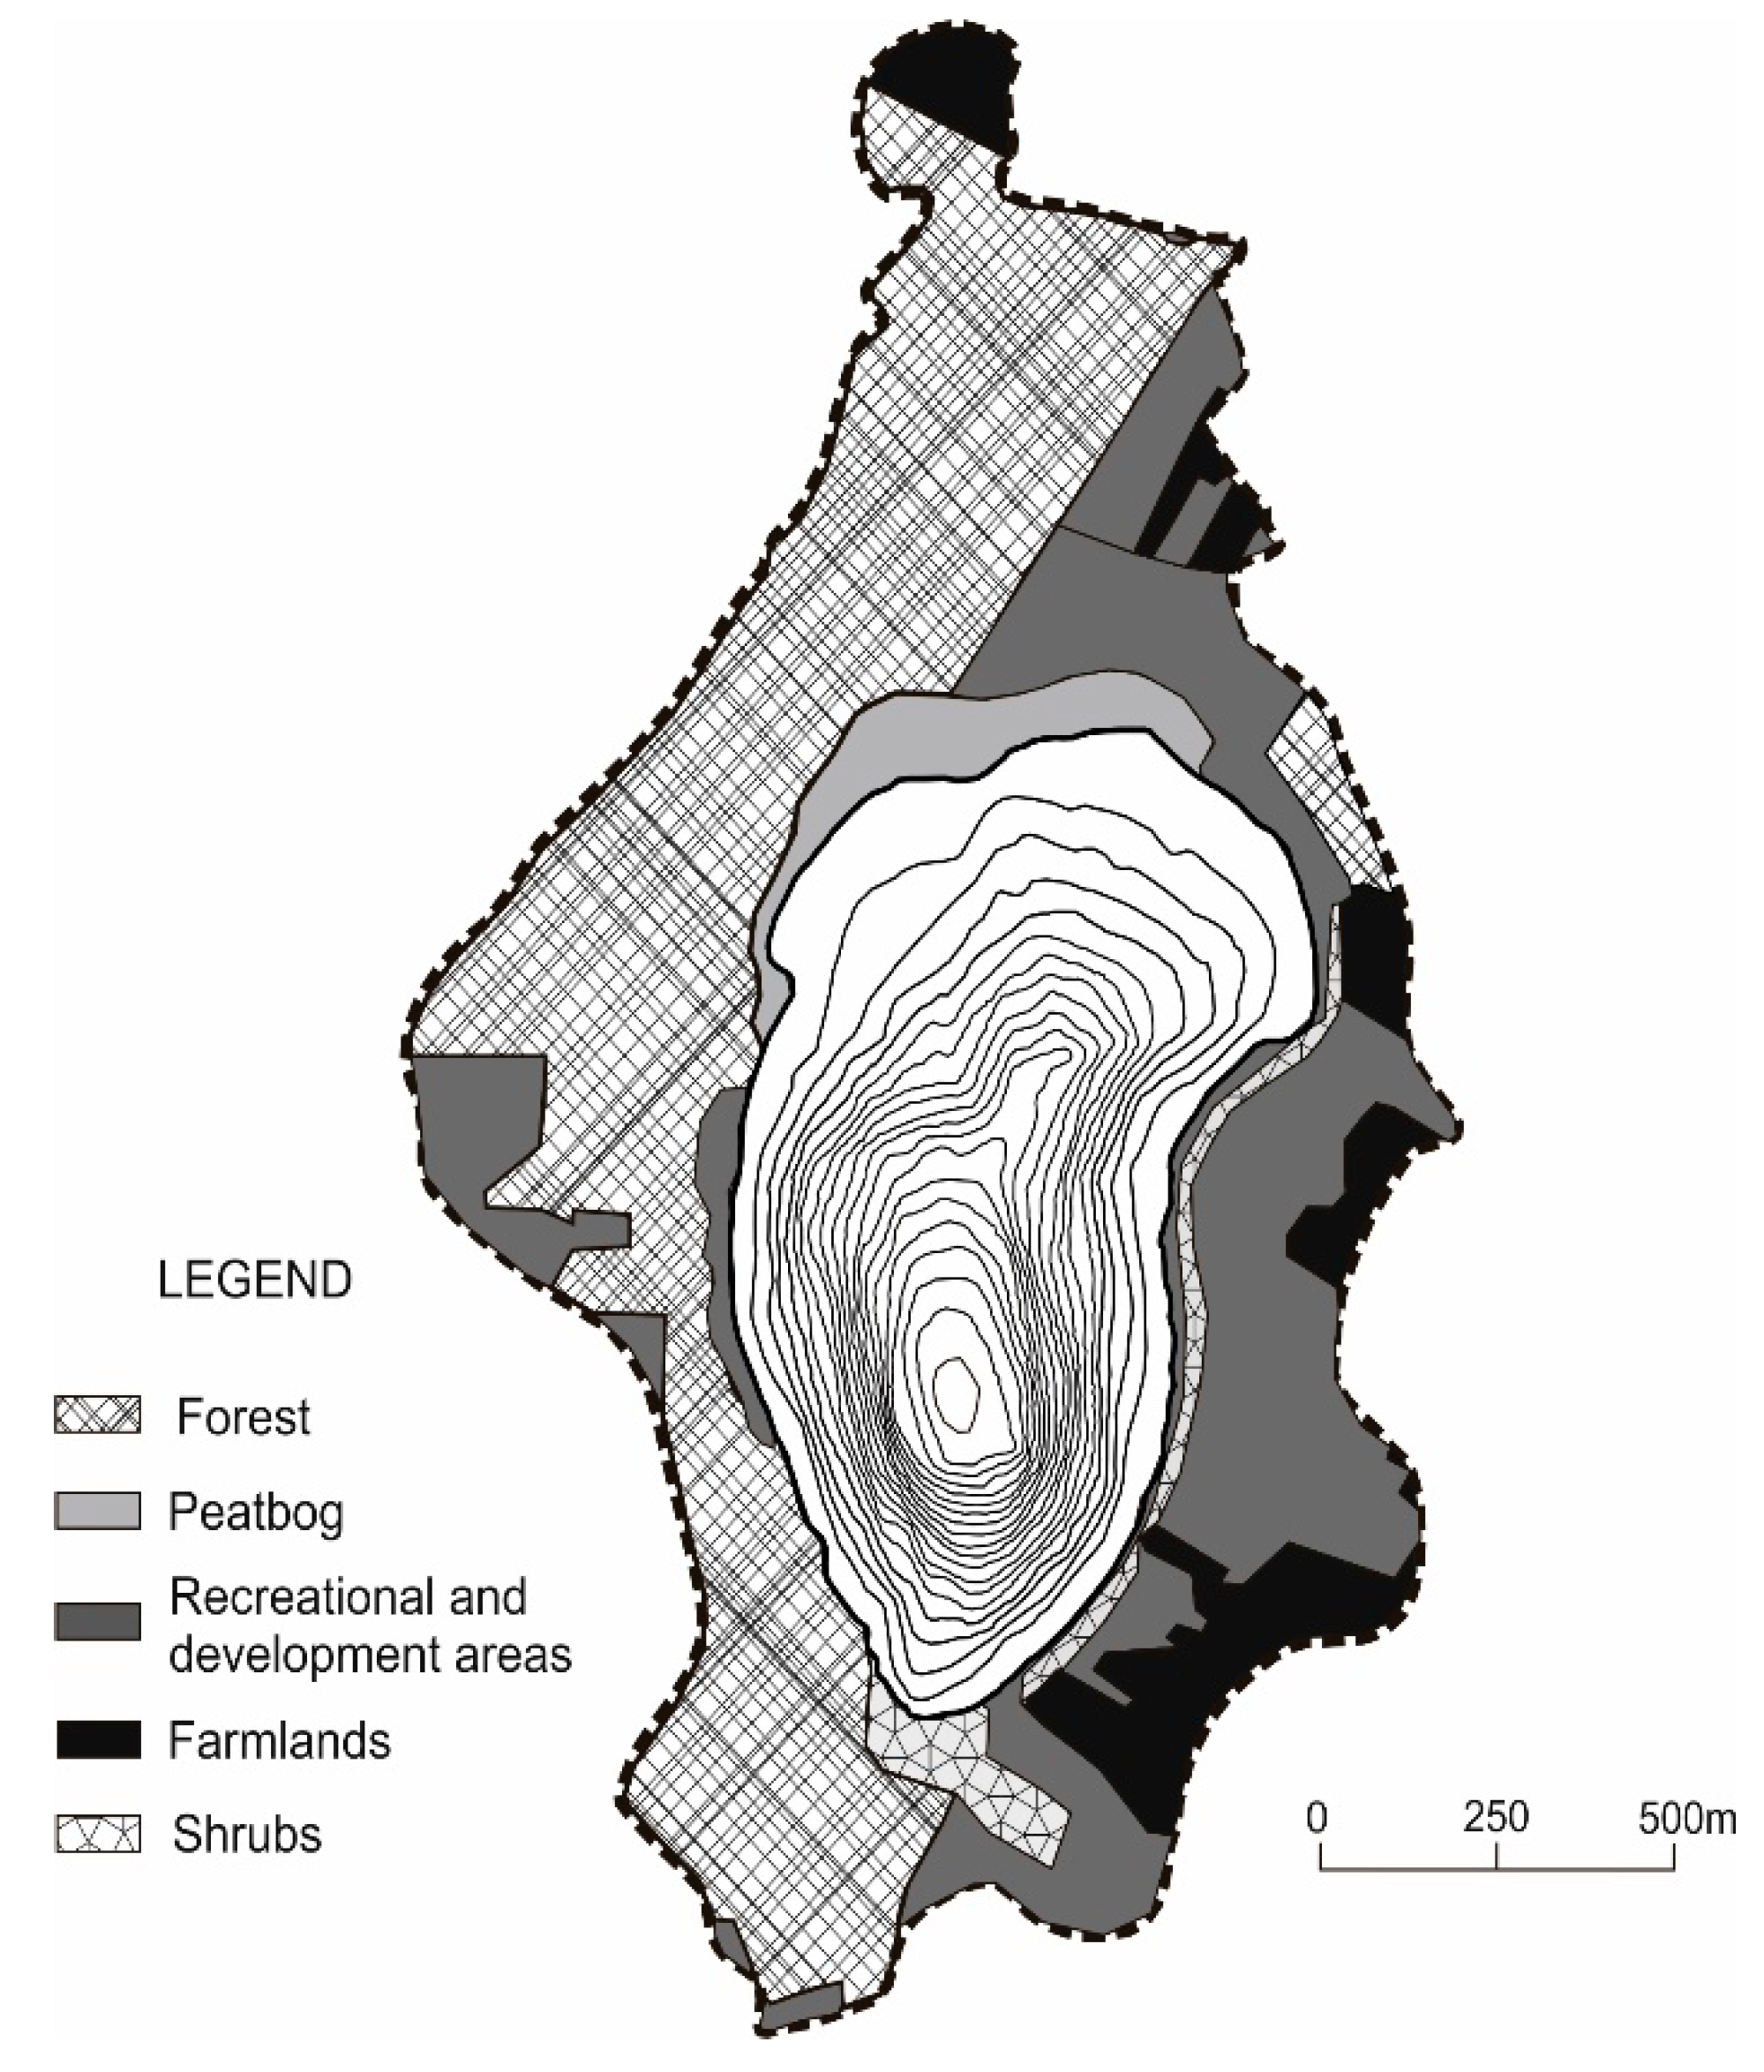
Morphological, landscape and habitat properties, as well as anthropogenic activity, determine the diversity of land use in the catchment of Lake Piaseczno (Figure 2, Table 2).
This largely affects the state of its surroundings, resulting in the current recreation–agricultural–forest character of the lake catchment (natural forms, extensively cultivated arable land and recreational building development (numerous cottages and two holiday resorts)). Based on the above, the lake catchment was divided into sectors with a growing share of investment land related to stationary recreation (Table 2).
Pursuant to general guidelines for the use, protection and reclamation of lakes, and based on the categories of susceptibility to degradation and classes of water cleanliness [37], Lake Piaseczno is included as a lake with good natural conditions, where the use and preservation of the current state of the lake should be in accordance with the rules for the protection of particularly valuable water resources [13].

3. Material and Methods

The research on the shore vegetation of Lake Piaseczno was conducted in 2015 and 2018, in spring, summer and autumn, several times in each season. The plant species composition was determined in the shore belt of the lake, depending on the topographic conditions, with a width of approximately 10 m and along the entire shoreline of approximately 3800 m (38,000 m2). The research was conducted in stages by designating sections with a length of 50 m corresponding to the range of particular sectors of the catchment (length of the shoreline in sectors (m): peatbog–forest–recreational (PFR): 799; recreational (R): 607; recreational–agricultural (RA): 1098; and forest–recreational (FR): 1288). Botanical analyses were focused on a multidimensional analysis of the species composition of the flora in the study area. Species were identified by means of the Rutkowski’s key [39], and the botanical nomenclature was adopted after Mirek et al. [40]. The identified species were ascribed to different life forms according to Raunkieaer [41,42], syntaxonomic groups [41] and historical-geographic groups. This permitted the calculation of the following indicators of anthropogenic transformations in the flora [43,44]:
  • Total synanthropisation
    WS-c = Ap + A Sp + A × 100 %
  • Total anthropophytisation
    WAn-c = A Sp + A × 100 %
  • Total apophytisation
    WAp-c = Ap Sp + A × 100 %
    where Ap denotes apophytes (taxa of synanthropic plants of local origin that constitute part of the native flora and occur in anthropogenic habitats developed as a result of human activity); Sp denotes spontaneophytes (taxa developed in or imported into a given area that are able to function with no human interference and exist in nature) plus apophytes; and A denotes anthropophytes (taxa developed in a given area as a result of human pressure, taxa imported into a given area by man, and species surviving at sites under constant human pressure).
The Jaccard’s species similarity coefficient of the shore flora of Lake Piaseczno was also calculated in 2015 and 2018 [45]. The species composition was also referred to index numbers of higher plants (moisture, acidity, trophic status, content of organic matter and granulometric composition of the soil [42]) for the purpose of ascribing species with preferences for particular habitat properties. Shore vegetation was treated as a complex phytocoenotic system that interacts with the catchment and lake and is often transformed anthropogenically [46]. Therefore, no analyses concerning the syntaxonomic classification of plant communities were performed. The identified species were only described as characteristic of a given phytosociological unit.
Statistical analyses were carried out in the R environment for statistical computing v. 3.5.1 [47] with the vegan v. 2.5–3 library [48]. Based on the Jaccard’s species similarity coefficient of the phytocoenoses, a classification analysis was performed as a measure of distance with the application of the average linkage classification algorithm (UPGMA). The obtained classification results are presented graphically in the form of dendrograms, and in a more complex form as a combination of dendrograms and a heatmap.
The research on macrophytes of Lake Piaseczno was conducted in 2007 and 2018 in July in four transects that correspond to sectors of the dominant land use in the catchment: PRF, R, RA and FR. The littoral zone was analysed from the shoreline to the maximum range of occurrence of macrophytes. The research covered all groups of macrophytes: emerging (EM), submerged (SM), floating (FM) and pleuston (PM). Their species composition was determined—with nomenclature after Matuszkiewicz [49]—as well as the density of emerging macrophytes and their range of occurrence, biomass and dominance in biomass in particular groups [38,50].
The productivity of the littoral of Lake Piaseczno was analysed based on the biological lake water trophy indicators gross primary production of phytoplankton, chlorophyll a concentration and calculated Carlson’s trophic state indices (TSIChl-a and TSISD). The analyses were implemented in the summer season of 2015 and 2018 (two terms one month apart in each season) in the littoral zone adjacent to particular sectors of the catchment. Study sites were designated in the centre of the shoreline of each sector at a distance of approximately −10 m from the shore, depending on the bottom slope inclination, to obtain sample immersion to a depth of approximately 0.75 m. For sectors 2 and 3, due to their homogeneity, one study site was designated on their arbitrary boundary. The limnological status of Lake Piaseczno was determined based on the same research conducted in the deepest place in the lake (38.8 m) in the peatogenic zone (depths of 0.75 m and 2.5 m). The study results were averaged for the analysed profile and study season. Gross primary production of phytoplankton was measured by means of the aerobic method [51]. The concentration of dissolved oxygen in water was determined by means of the Winkler iodometric titration method [52]. The amount of released oxygen for subsequent study terms was converted to amounts of carbon assimilated from 1 m2 per hour (mg Cass·m−2·h−1), assuming that 1 g of released oxygen corresponds to 0.312 g of assimilated carbon [53]. The obtained results after conversion to mgCass·m−2·d−1 (assuming that d = 12 h) described the level of trophy of lake waters (according to [2] and [54]). Concentration of chlorophyll a, the most important photosynthetic pigment, was analysed by means of the spectrophotometric method [55] and expressed in mg Chl.a·m−2. Based on chlorophyll a concentration values expressed in μg Chl.a·dm−3, TSI CHLa was calculated [56]:
TSI CHLa = 9.81 ln(Chl) + 30.6.
The research on biological trophic status indicators was supplemented by measurements of the basic physical-chemical water properties, i.e., electrolytic conductivity (μS·cm−1), reaction (pH), and oxygen concentration in mg O2·dm−3, by means of a certified field meter (HI 9811-5) or titration methods (oxygen concentration: control samples for gross primary production of phytoplankton). Based on measurements of Secchi visibility (m), which determines water transparency in the pelagial zone, the TSI SD was calculated [56]:
TSI SD = 60 − 14.41 ln(SD).
The obtained study results were analysed with unitary coefficients of export of surface loads of biogenic substances from catchment areas under different land uses according to Soszka [10]: 1 ha of arable fields in the lake’s catchment generates 9 kg N and 0.3 kg P; 1 ha of meadows and pastures 3 kg N and 0.2 kg P; 1 ha of forests 1.5 kg N and 0.1 kg P; and loose building development (the equivalent of recreational plots) 9 kg N and 0.3 kg P (kg·ha−1·year−1). The above nutrient values, generated by different types of catchment management, were calculated in relation to the surface area and parameters of the Piaseczno Lake catchment. The potential amount of biogens from beach and bathing area recreation was also determined, with the assumption that each tourist in the shore zone of the lake generates 1 g N·day−1 [57] and 0.457 g P·day−1 [58] and the calculated index of physical carrying capacity (PCC), which describes the maximum number of persons in the shore zone of a lake participating in recreation with no harm to its ecosystem, is 5683.2 person per day [21].

4. Results

A total of 235 species of vascular plants (233 species in 2015 and 225 species in 2018) from 56 families, representing four botanic classes, were indentified in plant communities of shores of Lake Piaseczno in 2015 and 2018. In class MAGNOLIOPSIDA, the highest species richness concerned families Asteraceae (25 species); Rosaceae (17 species); Plantaginaceae (11 species); Lamiaceae (11 species); and Cariophyllaceae and Salicaceae (10 species each). In class LILIOPSIDA, the highest species richness concerned Poaceae (26 species) and Cyperaceae (19 species). The remaining families in all classes were represented much less abundantly (compare Table 3).
The tree, shrub and small tree vegetation included 35 species from 10 families belonging to two botanical classes. The most abundant representation concerned families Salicaceae (10 species) and Rosaceae (8 species), and the least abundant representation concerned families Adoxaceae, Oleaceae, Sapindaceae and Pinaceae (1 species each).
For both study years, the sector with the highest number of species was the recreational–agricultural sector (RA, 138 species in 2015 and 135 species in 2018). In 2015, the lowest number of species was identified in the recreational sector (R, 115 species), and in 2018 in the forest–recreational sector (FR, 109 species), where an almost 7% decrease in the number of species was recorded in comparison to the previous study year (Table 3). The occurrence of 29 species permanently present in all sectors for both study seasons was determined: Achillea millefolium, Bidens tripartita, Eupatorium cannabinum, Hieracium pilosella, Hieracium murorum, Tussilago farfara, Myosotis palustris, Stellaria graminea, Calluna vulgaris, Lotus corniculatus, Mentha arvensis, Prunella vulgaris, Rumex acetosa, Rumex acetosella, Ranunculus flammula, Potentilla erecta, Galium plaustre, Urtica dioica, Alisma plantago-aquatica, Carex flava, Juncus conglomeratus, Agrostis capillaris and Holcus lanatus, and among tree and shrub vegetation: Quercus robur, Populus tremula, Salix aurita, Salix cinerea, Salix pentandra and Pinus sylvestris. A total of 59 species of plants occurring in only one study sector was also identified. The highest number of such species occurred in the peatbog–forest–recreational sector (PFR, 27 species) and forest–recreational sector (FR, 24 species). The remaining study sectors showed less varied character: recreational–agricultural sector (RA, four species); recreational sector (R, zero species). Part of a species occurring in only one sector was found in only one study year, namely 2015 (FR: Aegopodium podagraria, Mycelis muralis, Knautia arvensis, Scirpus sylvaticus, Bromus hordeaceus, Festuca altissima; PFR: Vicia angustifolia, Polygonum lapathifolium, Rumex crispus, Carex riparia, Carex rostrata; RA: Chelidonium majus); and in 2018, only Capsella bursa-pastoris in FR and Cerastium holostenoides in RA (Table 3).
In terms of life forms according to Raunkieaer, for both study years, plant communities of shore sectors of Lake Piaseczno were dominated by hemicryptophytes (H), reaching almost a 60% contribution. Geophytes (G) and terophytes (T) showed more than a 14% share in phytocoenoses. Hydrophytes and helophytes (Hy) reached 11%, megaphanerophytes (M) and nanophanerophytes (N) 7–8%, and green chamaephytes (C) and woody chamaephytes (Ch) showed a maximum of several percent participation in the shore communities of Piaseczno. Low representation also concerned lianas (li, two species) and semi-parasites (pp, one species) (Table 4). In the phytosociological context, sector PFR was dominated by plant species from the classes Molinio-Arrhenatheretea, Oxycocco-Sphagnetea, Phragmitetea and Scheuzerio-Caricetea nigrae; sectors R and RA were dominated by plant species from the classes Phragmitetea and Molinio-Arrhenatheretea; and sector FR was dominated by plant species from the classes Phragmitetea, Querco roboris-Pinetum and Nardo-Callunetea. Species typical of the designated classes co-occurred, with a considerable number of accompanying species supplementing the composition of the plant communities.
The Jaccard’s species similarity coefficient for the studied phytocoenoses in shore sectors of Lake Piaseczno in 2015 varied from 0.26 (R–FR) to 0.84 (R–RA), and in 2018 from 0.26 (R–FR) to 0.76 (R–RA), for both study seasons, which usually oscillated around 0.3 (Table 5). This suggests diversity of flora within the study sectors in spite of the typological similarity of habitats. In the comparison of the study sectors in the 2015 and 2018 summer seasons, the Jaccard’s similarity coefficient oscillated between 0.81 (FR–FR) and 0.91 (PFR–PFR), suggesting insignificant changes in the species composition of plants (Table 5, Figure 3b).
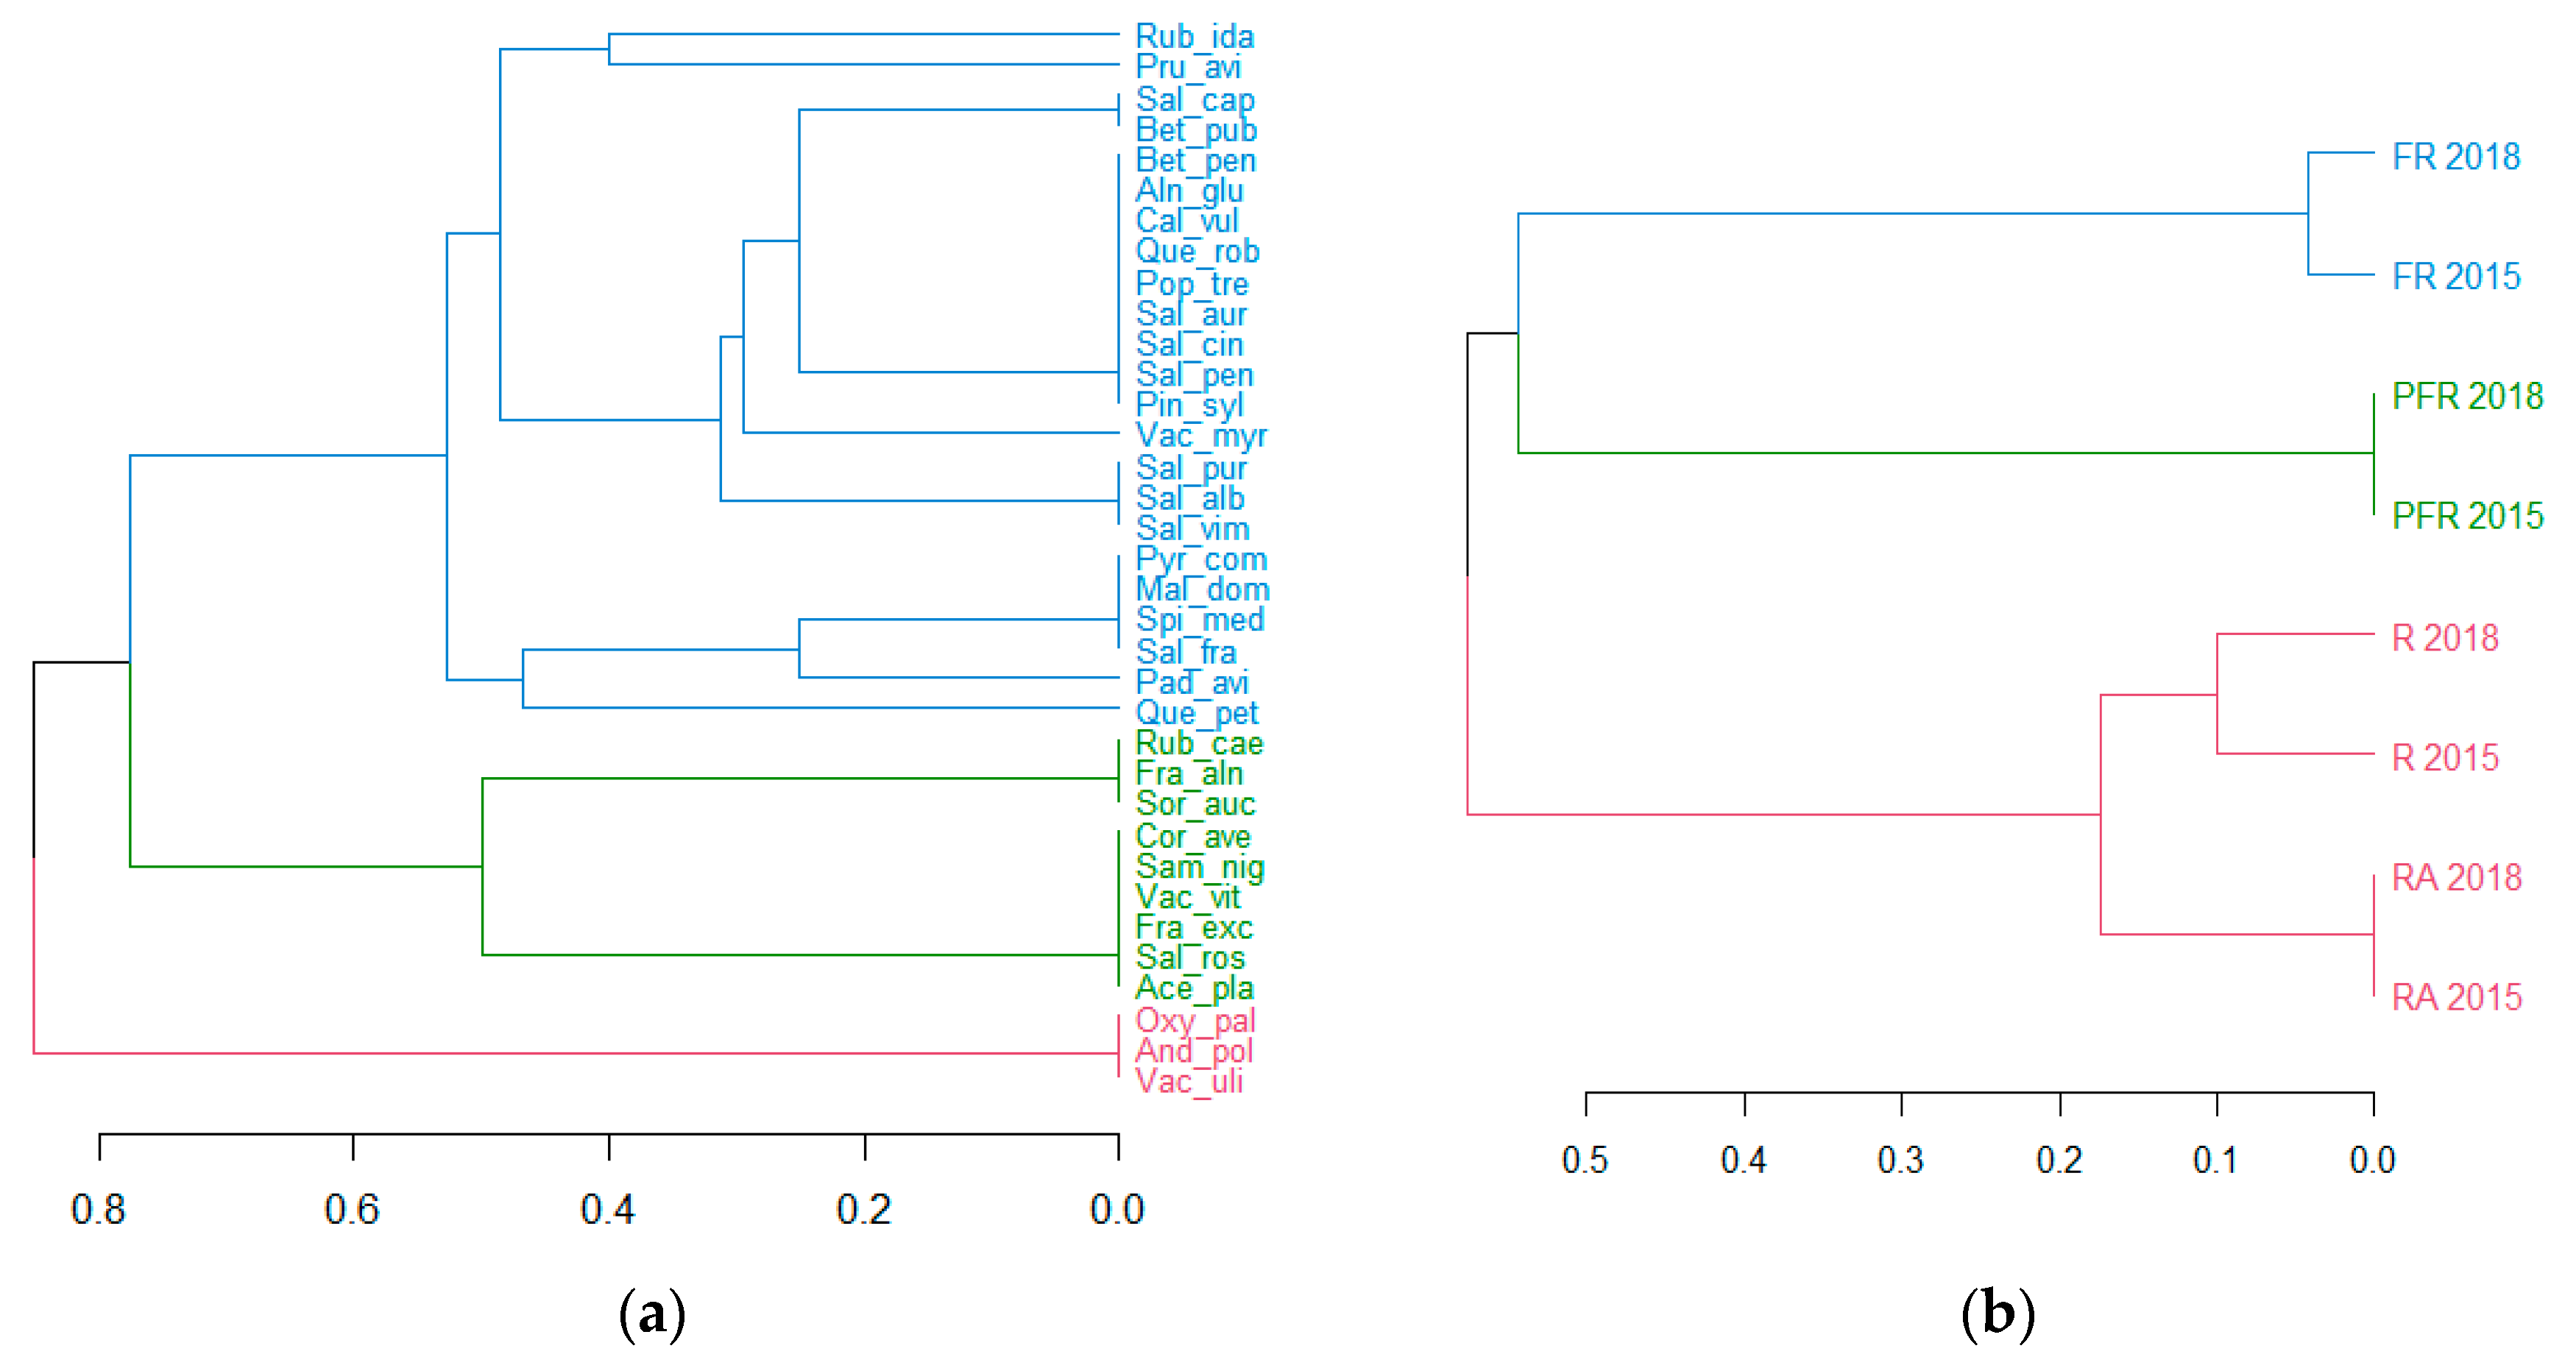
In the case of tree and shrub vegetation, somewhat more complete information was provided by a hierarchical classification analysis with the Jaccard’s coefficient as the similarity measure, which was performed both for plant species and for shore sectors of Lake Piaseczno (Figure 3a,b). At the first stage, it permitted the designation of three more or less-diverse groups of plant species, characterised by a higher measure of co-occurrence in the phytosociological context, belonging to five groups: Oxycocco-Sphagnetea, Scheuzcherio-Caricetea fuscae, Betuletum pubescentis, Salicetum pentandro-cinereae and Querco-Piceetum.
Group I includes Rubus idaeus, Prunus avium, Salix caprea, Betula pubescens, Betula pendula, Alnus glutinosa, Calluna vulgaris, Quercus robur, Populus tremula, Salix aurita, Salix cinerea, Salix pentandra, Pinus sylvestris, Vaccinium myrtillus, Salix purpurea, Salix alba, Salix viminalis, Pyrus communis, Malus domestica, Spiraea media, Salix fragilis, Padus avium and Quercus petraea (Figure 3a). In phytosociological terms, Group I shows considerable diversity, including species from peatland communities: Oxycocco-Sphagnetea (five species) and Scheuzcherio-Caricetea fuscae (three species); from shrub communities: Betuletum pubescentis and Salicetum pentandro-cinereae (three species each); and from the forest community: Querco-Piceetum (one species). The group included a high number of species occurring in different shore sectors of Lake Piaseczno in low numbers (often single individuals) with variable and other phytosociological affinity (13 species).
Group II includes Rubus caesius, Frangula alnus, Sorbus aucuparia, Corylus avellana, Sambucus nigra, Vaccinium vitis-idaea, Fraxinus excelsior, Salix rosmarinifolia and Acer platanoides (Figure 3a). The species show similarly diverse phytosociological affinity (Oxycocco-Sphagnetea, one species; Scheuzcherio-Caricetea fuscae, one species; Salicetum pentandro-cinereae, two species; Querco-Piceetum, three species; other, four species).
The small group III includes Oxycoccus palustris, Andromeda polifonia and Vaccinium uliginosum (Figure 3a), and was particularly related to the communities Oxycocco-Sphagnetea (two species) and Scheuzcherio-Caricetea fuscae (one species).
The hierarchical classification of shore sectors of Lake Piaseczno in terms of species also permitted the determination of a lack of considerable difference in tree and shrub communities for subsequent study years and the determination of the typological similarity for sectors R and RA (Figure 3b).
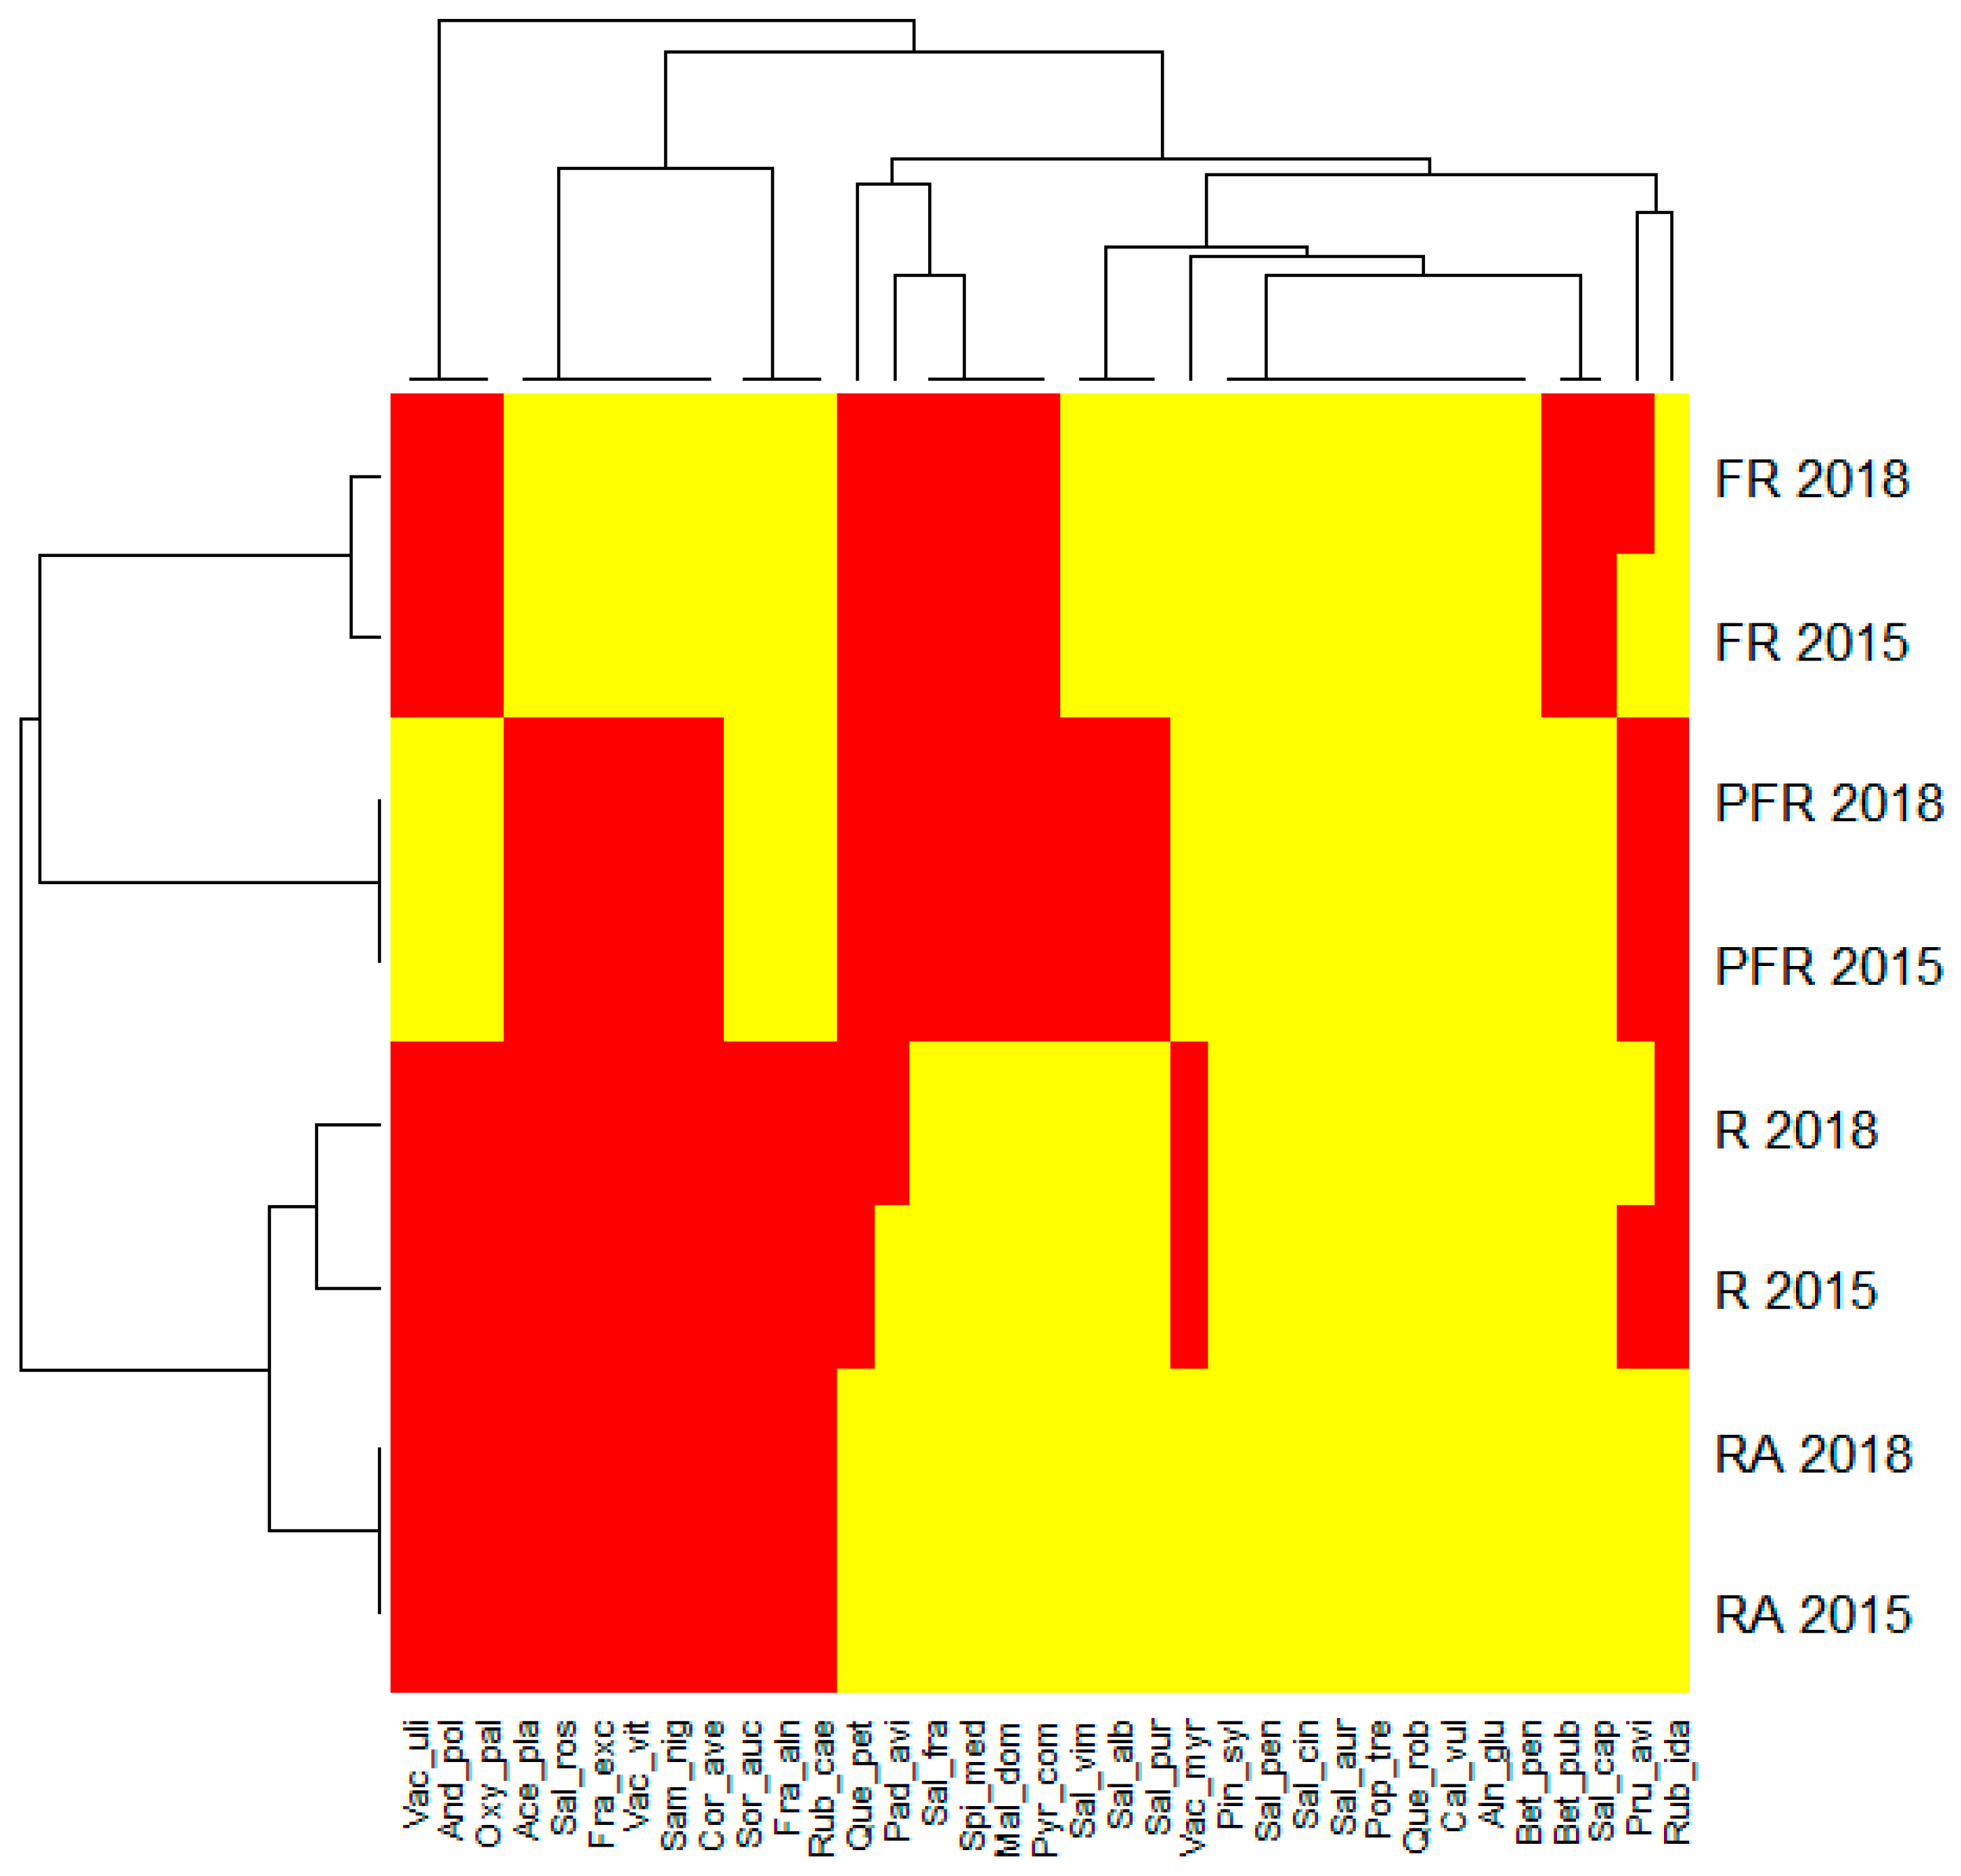
An analysis of the heatmap that ascribed the frequency of co-occurrence of the identified tree and shrub species to the phytocoenoses of the study sectors in subsequent years revealed several other patterns (Figure 4). For example, more than 54% of tree and shrub species were found in the sectors RA and R, and slightly more than 25% of these species occurred in all sectors in both years of research. Three species (Andromeda polifolia, Oxycoccus palustris and Vaccinium uliginosum) occurred only in sector PFR, two species (Betula pubescens and Salix caprea) were absent only in sector FR in both study seasons, and one species (Vaccinium myrtillus) was absent only in sector R in the same period (compare Figure 4).
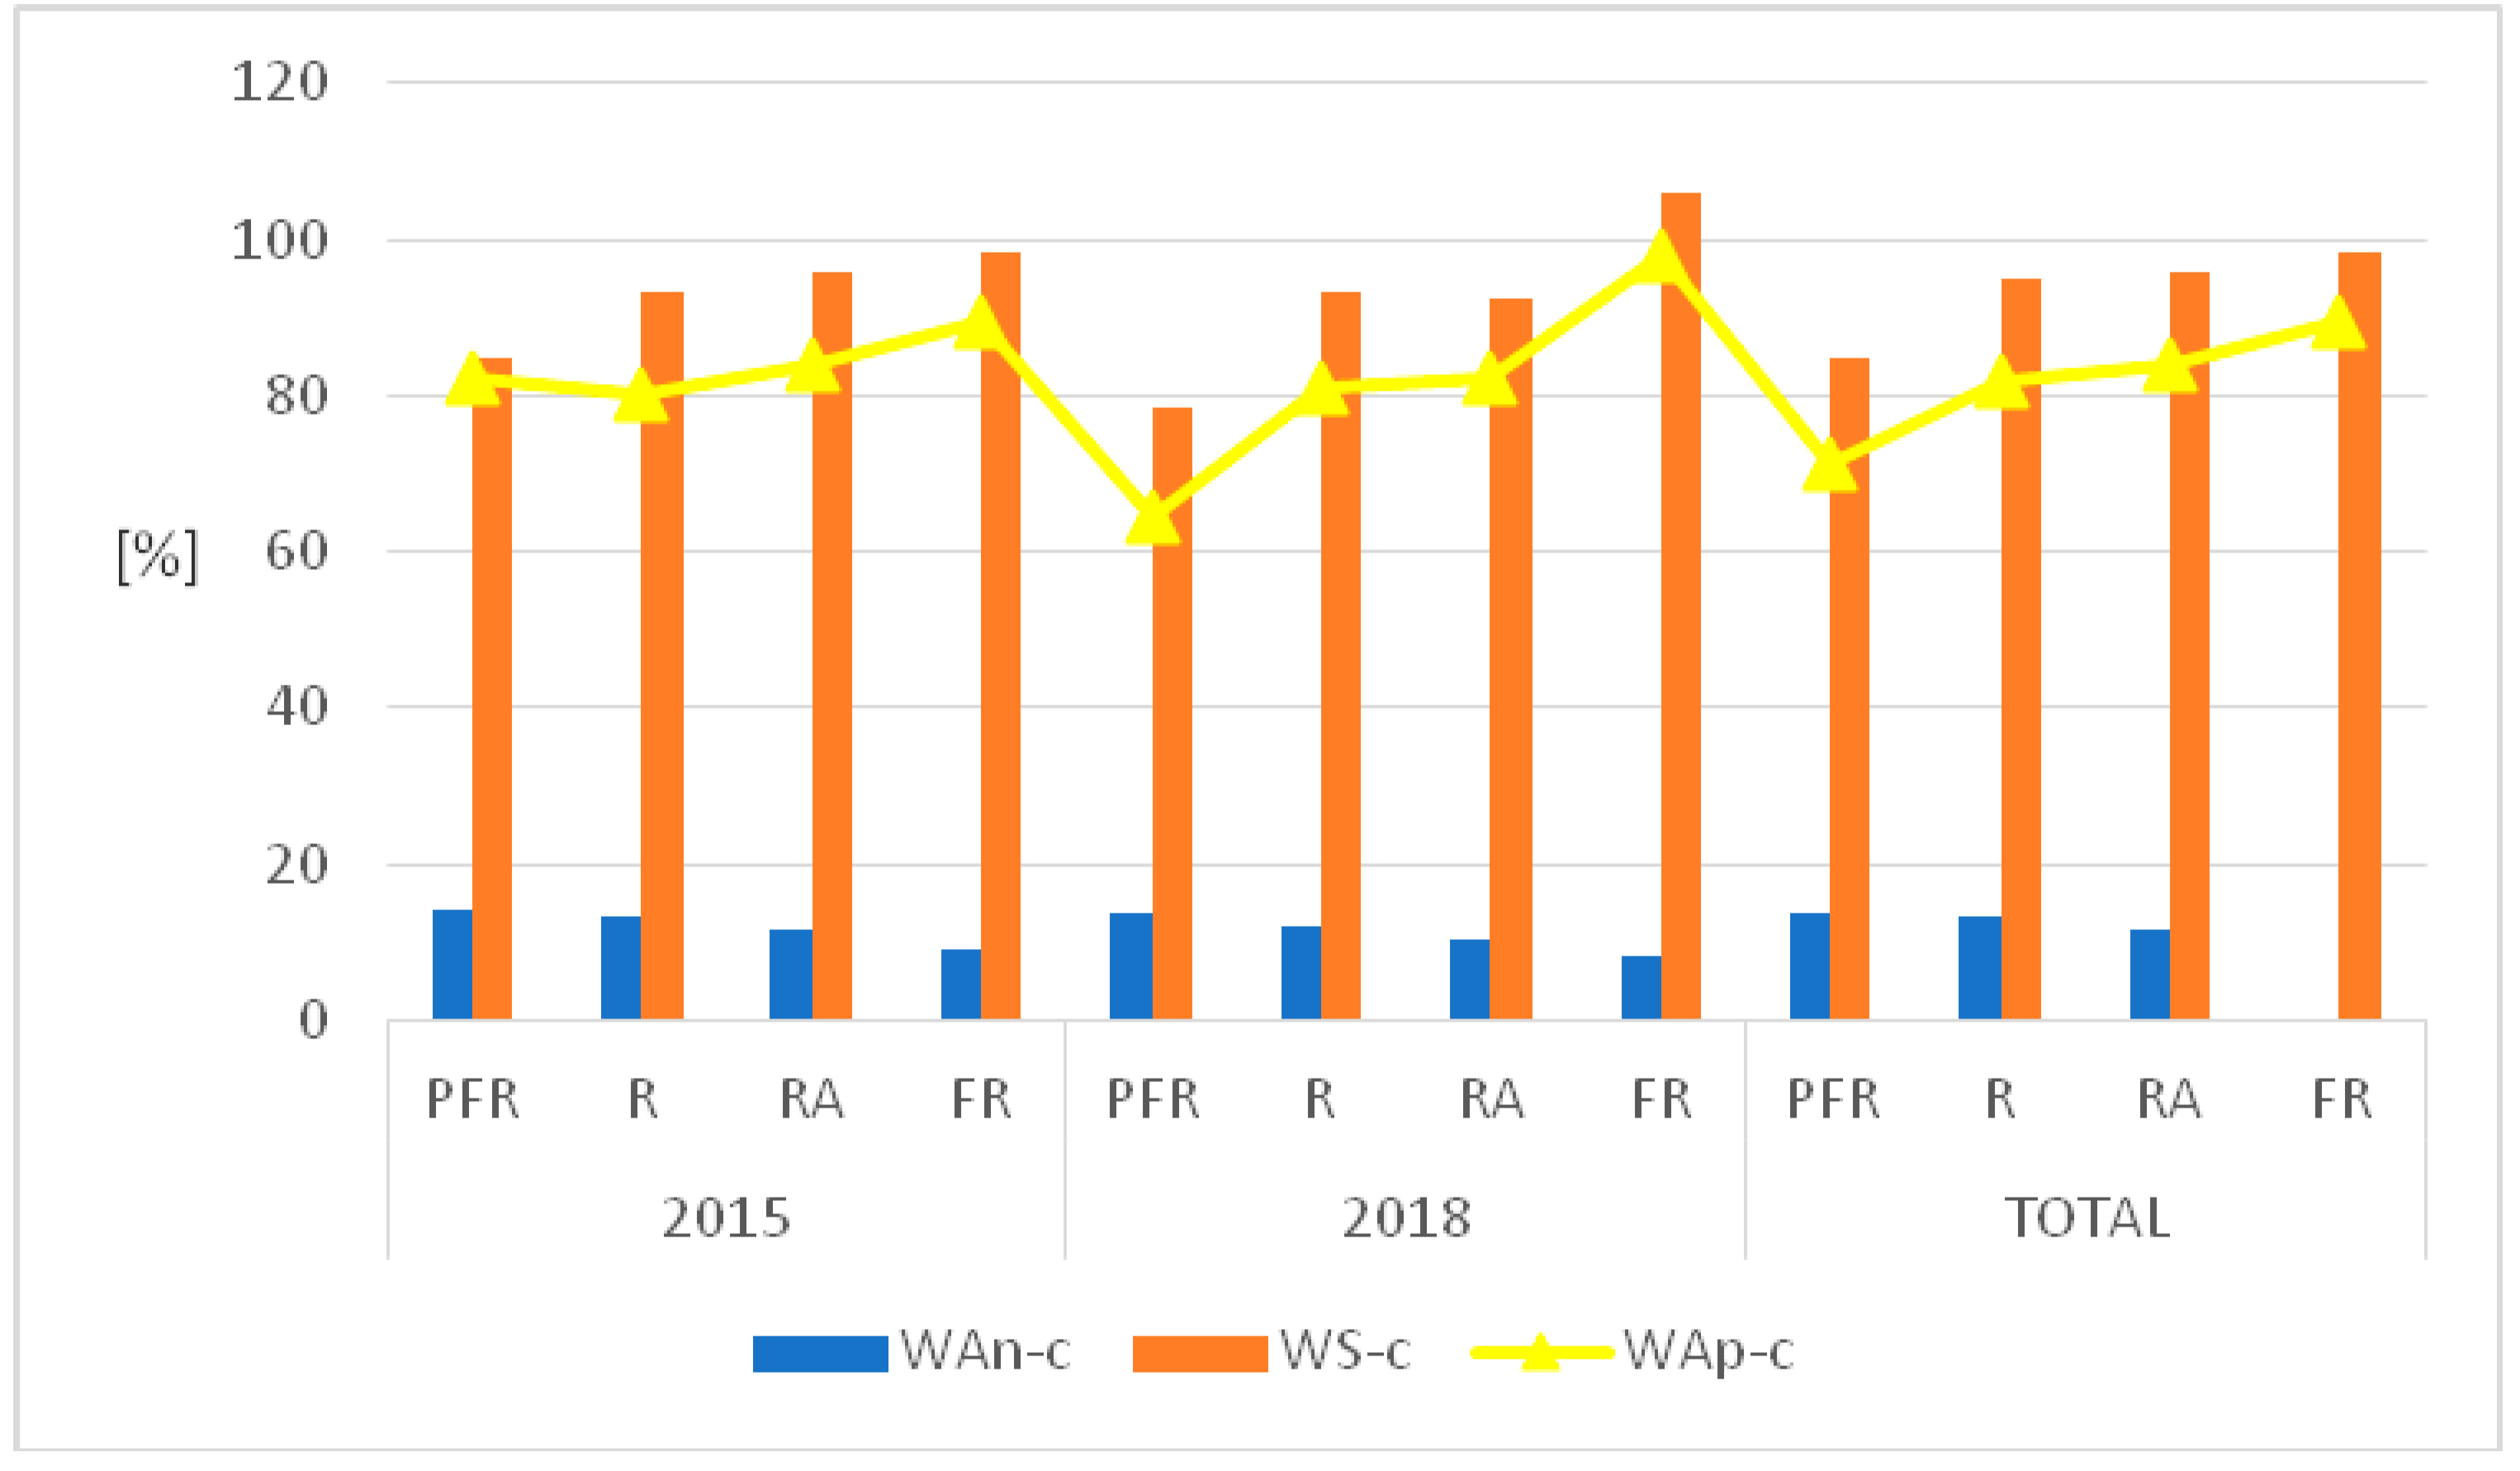
The classification of shore species of Lake Piaseczno that were identified in 2015 and 2018 in terms of historical-geographic range showed that spontaneophytes (Sp) constituted the majority in the studied phytocoenoses (45.9%, 108 species). Apophytes (Ap) reached a 38.7% contribution (91 species). The remaining groups, classified as antropophytes (A) (archeophytes (Arch, 10 species), kenophytes (Ken, 6 species) and diaphytes (0 species)), were represented in a very scarce degree or not at all. It is worth mentioning that 20 of the identified species showed unidentified historical-geographic affinity. The above classification permitted the calculation of indicators of antropogenic transformations in the flora of the entire shore of Lake Piaseczno in 2015 and 2018, which were analysed both together and separately (changes concerned only 2018): total synanthropisation (WS-c) equalled 86.29% (2018, 85.71%); total apophytisation (WAp-c) equalled 73.38% (2018, 72.26%); and total anthropophytisation (WAn-c) reached 12.9% (2018, 13.44%).
The values of indicators of anthropogenic transformations in the flora of the shore of Lake Piaseczno, when divided into sectors, were similar (Figure 5). The lowest values of WS-c in both study seasons were recorded for sector PFR (2015, 84.61%; 2018, 78.46%; total, 84.84%), and the highest for sector FR (2015, 98.21%; 2018, 106%; total, 98.21%). The values of WAn-c showed the opposite pattern. The lowest values of the indicator were determined for both study years in the case of sector FR (2015, 8.92%; 2018, 8.0%; total, 8.92%), and the highest in sector PFR (2015, 14.03%; 2018, 13.84%; total, 13.63%). For WAp-c, the extreme values were variable: in 2015 for sector R (80.0%); in 2018 for sector PFR (64.61%); and, in the case of the joint analysis of both years (total), for sector PFR (71.21%) (Figure 5).
The classification of the identified plant species to selected index numbers of higher plants, describing their habitat preferences, shows that the primary component of the shores of the analysed lake was comprised of plants that are characteristic of fresh and moist soils. In terms of trophic status, they prefer habitats that are moderately abundant in nutrients and eutrophic components and occur on moderately acidic and neutral soils, loamy–sandy or sandy, with higher than average permeability. In terms of content of organic matter, habitats of the shore flora of Piaseczno Lake had mineral-humus and organogenic soils that were related to the peatbog areas (compare Table 6). Based on the selected parameters in the analysed sectors of the lake shore, a high contribution (in majority exceeding 50%) was reached by stenobionts with a relatively narrow range of ecological tolerance (Table 6).
A total of 37 plant species was identified in the plant communities of the littoral (macrophytes) in all sectors of Lake Piaseczno in 2007 and 2018 (23 species in 2007 and 35 species in 2018). They belonged to 24 families from 5 botanical classes. The highest representation concerned class LILIOPSIDA (24 species, 12 families), and the lowest representation concerned classes EQISETOPSIDA, POLIPODIOPSIDA and BRYOPSIDA (one species and one family each). In class MAGNOLIOPSIDA, the family with the highest number of species was Lamiaceae (three species), and in class LILIOPSIDA, the families with the highest number of species were Characeae (five species), Cyperaceae (five species) and Potamogetonaceae (three species). The remaining families in both classes had scarce representation (one species each) (Table 7).
The majority of the identified plant species belonged to the group of emerging macrophytes (EM, 22 species). Twelve species were included in the submerged macrophytes (SM) group, two species (Lemna minor, Utricularia vulgaris) belonged to the group of pleuston macrophytes (PM), and only one species (Nymphea alba) represented the group of floating macrophytes (FM) (Table 7).
For both study seasons, the sector with the highest number of species was the peatbog–forest–recreational sector (PFR, 19 species (2007) and 26 species (2018)). The lowest number of species was found in the recreational–agricultural (RA) sector and the forest–recreational (FR) sector (9 species (2007) and 14 species (2018), respectively). The occurrence of four species (Utricularia vulgaris, Ceratophyllum demersum, Myriophyllum alternifolium and Phragmites australis) permanently occurring in all sectors of the littoral of Lake Piaseczno was determined for both study seasons.
In 2007 and 2018, part of a species occurred in only one study sector: PFR (Myosotis palustis, Scutelaria galericulata, Lythrum salicaria, Nymphea alba, Rumex hydrolapathum, Lysymachia thyrsiflora, Potamogetom praelongus and Thelypteris palustris) and FR (Nitella flexilis). Part of a species was found in one sector in one study year (2018): PFR (Calla palustris, Carex pseudocyperus, Carex vesicaria, Iris pseudacorus and Equisetum fluviatile); R (Galium palustre); and FR (Fontinalis antypyretica) (Table 7).
The calculated Jaccard’s species similarity coefficient for the analysed littoral phytocoenoses in sectors of Lake Piaseczno in 2007 varied from 0.36 (PFR–RA) to 0.63 (RA–FR) and in 2018 from 0.26 (PFR–FR) to 0.64 (RA–FR), suggesting diversity of flora within the study sectors.
In the case of the mutual comparison of the species composition of flora of the lake’s littoral in 2007 and 2018, the Jaccard’s coefficient values were in a range from 0.53 (RA–RA) to 0.88 (FR–FR), suggesting more considerable transformations in the species composition of plants (Table 8).
The distribution and biomass of macrophytes occurring in the phytolittoral of Lake Piaseczno were evidently variable in particular study sectors. The highest species diversity occurred in sector PFR, particularly among emerging macrophytes. They reached the greatest range (1.4 m of depth), density (52 ind·m−2) and biomass values here (Table 9). The lowest values of the analysed properties of macrophytes occurred in sector RA, with the exception of the biomass of submerged macrophytes, which varied from 216.9 g·m−2 to 270.9 g·m−2 in the sector. The general pattern observed in all of the analysed sectors involved high values of one group of macrophytes, and lower values of the other. If emerging macrophytes reached higher biomass values, submerged macrophytes automatically showed a lower value. A well-developed reed belt may limit the supply of biogenic substances to the depths of the lake and, therefore, the development of the occurring macrophytes. The width of the reed belt is, on the one hand, determined by the morphometric parameters of the lake, and, on the other hand, by the amount of supplied biogenic substances from the buffer zone. The widest reed belt—of more than 100 m—occurred in sector PFR and was approximately 40 m in sector R. The biomass of this group of macrophytes was high (Table 9). Therefore, a higher than average external supply of biogens presumably occurs here from this form of land use in the zone.
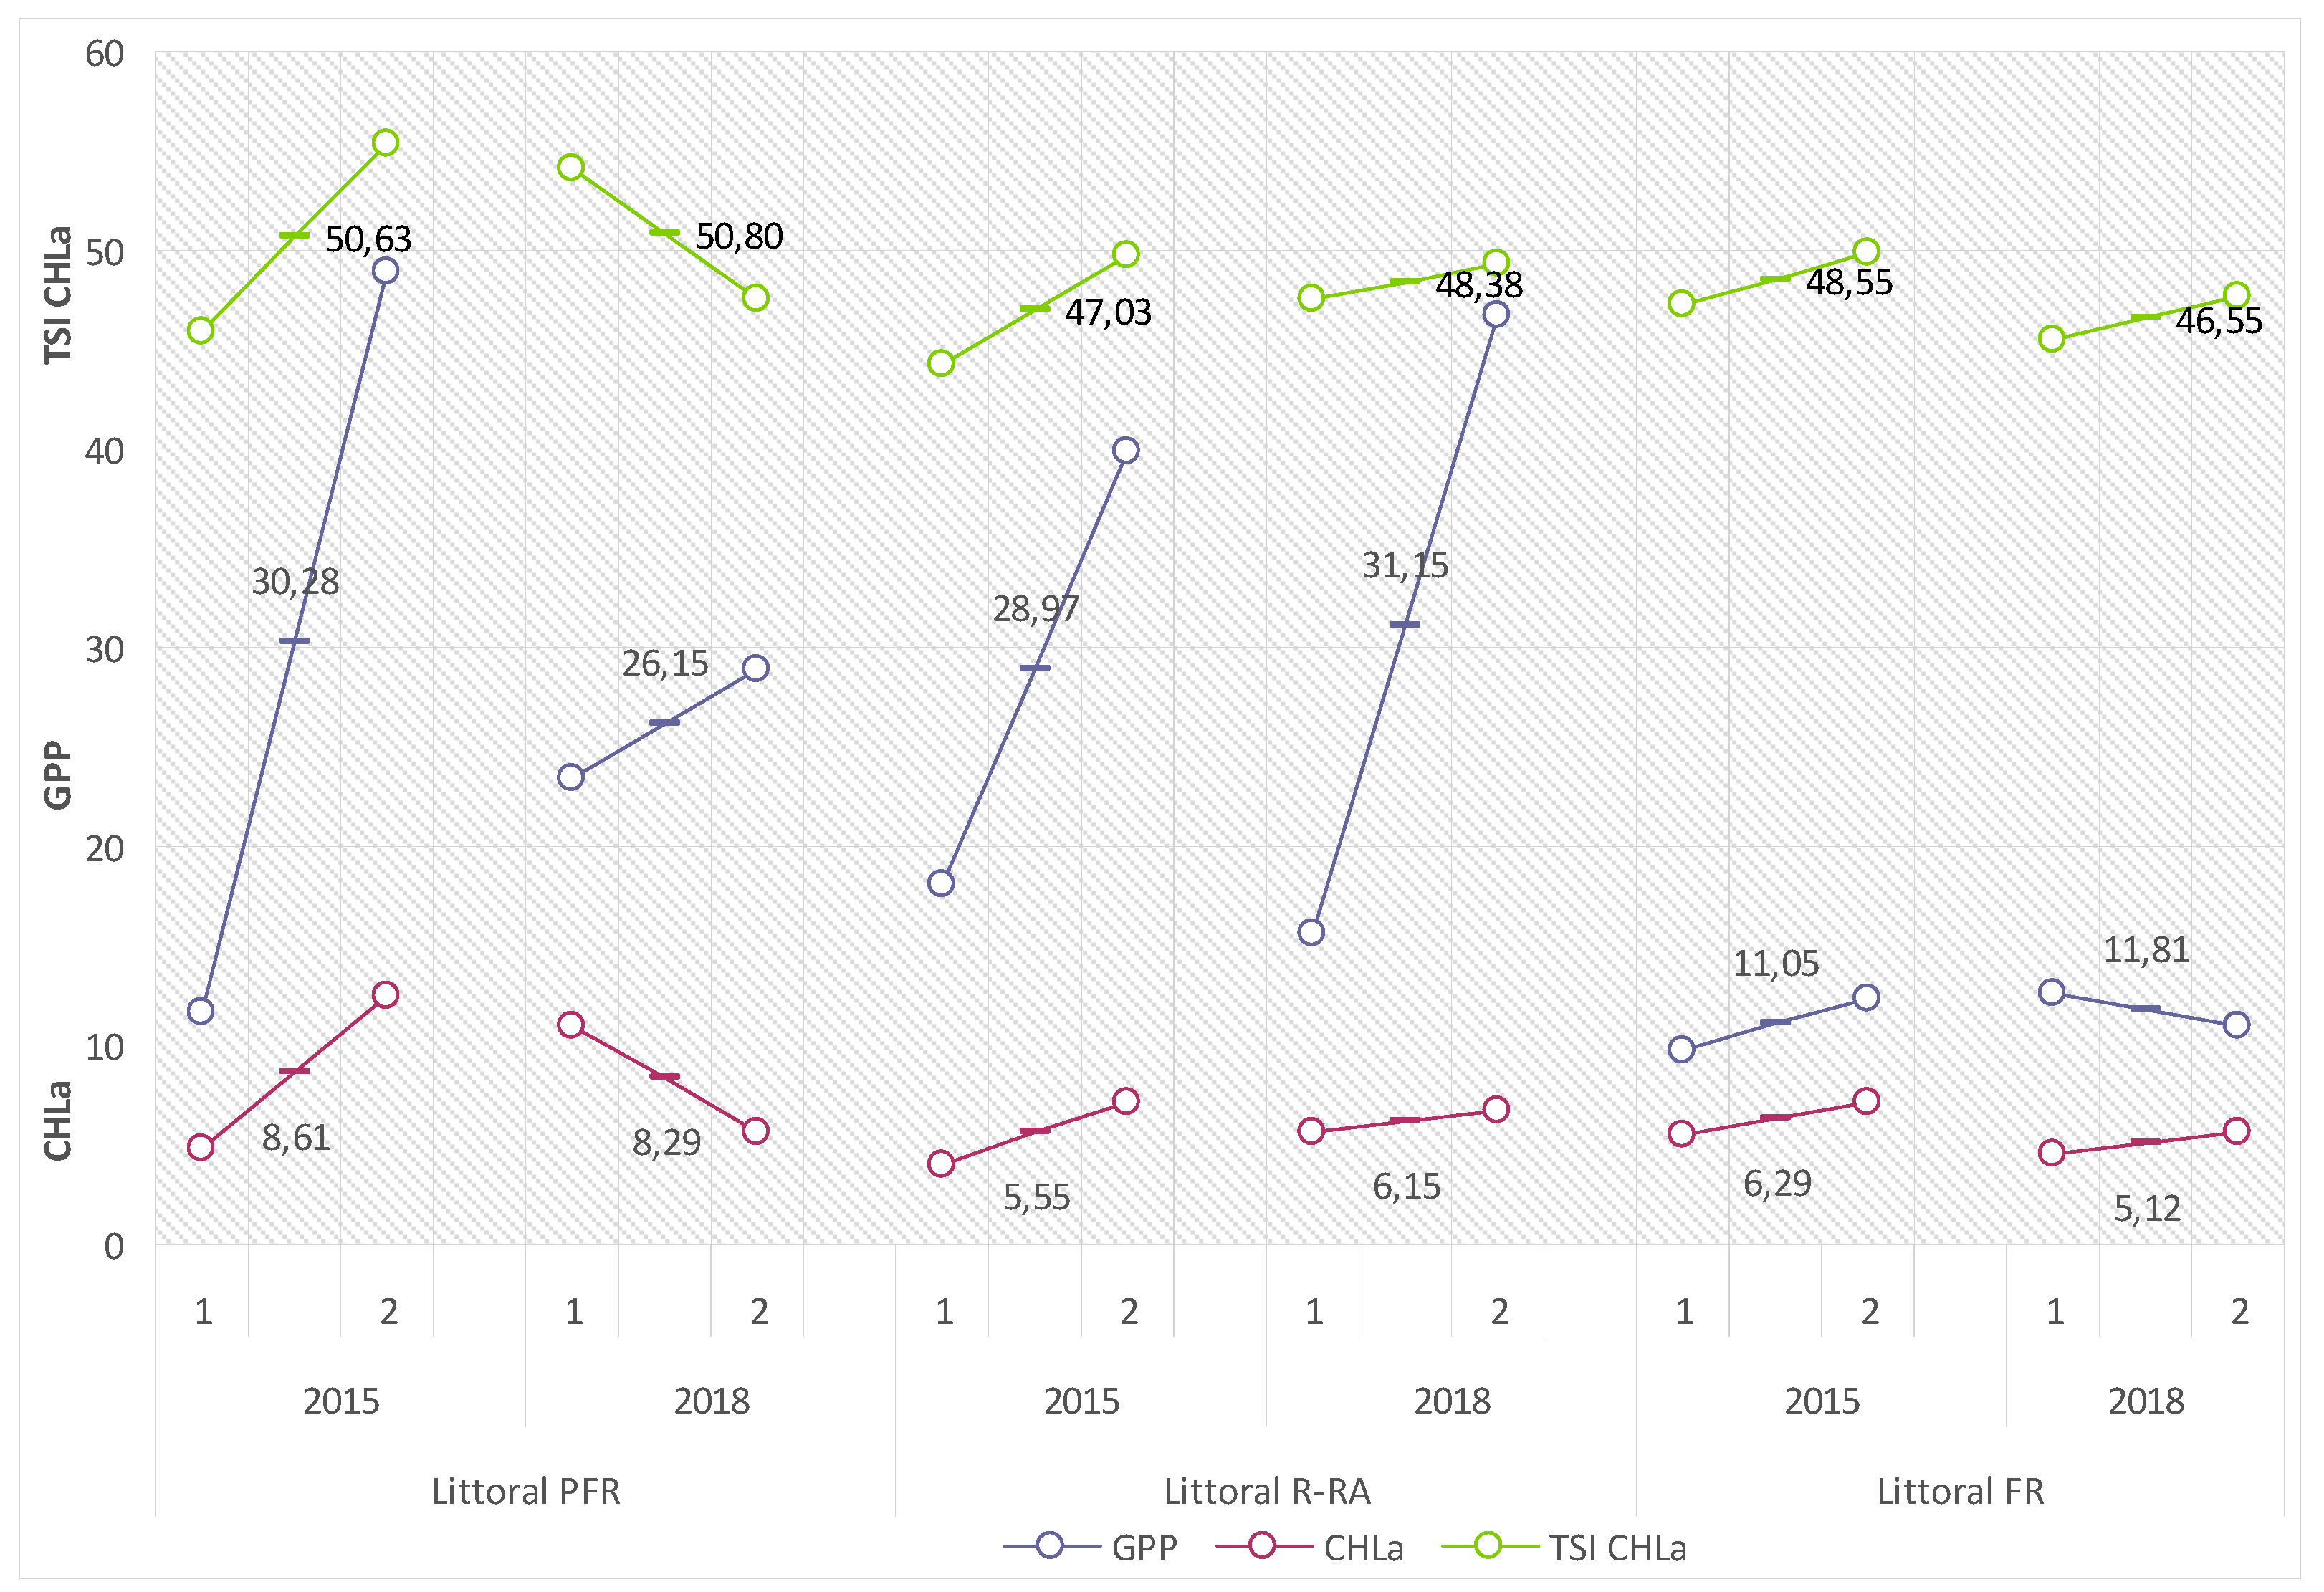
The productivity of the littoral of Lake Piaseczno in the 2015 and 2018 summer seasons, measured with values of biological indicators of water trophy, suggested the intensification of its eutrophication in different ways. This could be related to the diverse dynamics of the internal metabolism of the lake, and—in the modifying effect on biogeochemical buffer zones of the shores and littoral of the lake—variable amounts and rates of supply of biogenic substances from the catchment.
Gross primary production of phytoplankton (GPP) in the 2015 summer season adopted a range of average values from 11.05 (FR) to 30.28 (PFR) mg Cass·m−2·h−1 (132.6–363.4 mg Cass·m−2·d−1), and in 2018 from 11.88 (FR) to 31.15 (R-RA) mg Cass·m−2·h−1 (142.6–373.8 mg Cass·m−2·d−1) (Figure 6).
Chlorophyll a concentrations (CHLa) showed a somewhat lower variability. In the 2015 summer season, the mean values of the factor varied from 5.55 (R–RA) to 8.61 (PFR) mg Chl.a·m−2, and in 2018 from 5.12 (FR) to 8.29 (PFR) mg Chl.a·m−2. They contributed to the adequate variability of values of the calculated Carlson’s Trophic State Index (TSI CHLa): 47.03 (R–RA) and 50.63 (PFR) for the 2015 summer season and 46.55 (FR) and 50.8 (PFR) for the 2018 summer season (compare Figure 6).
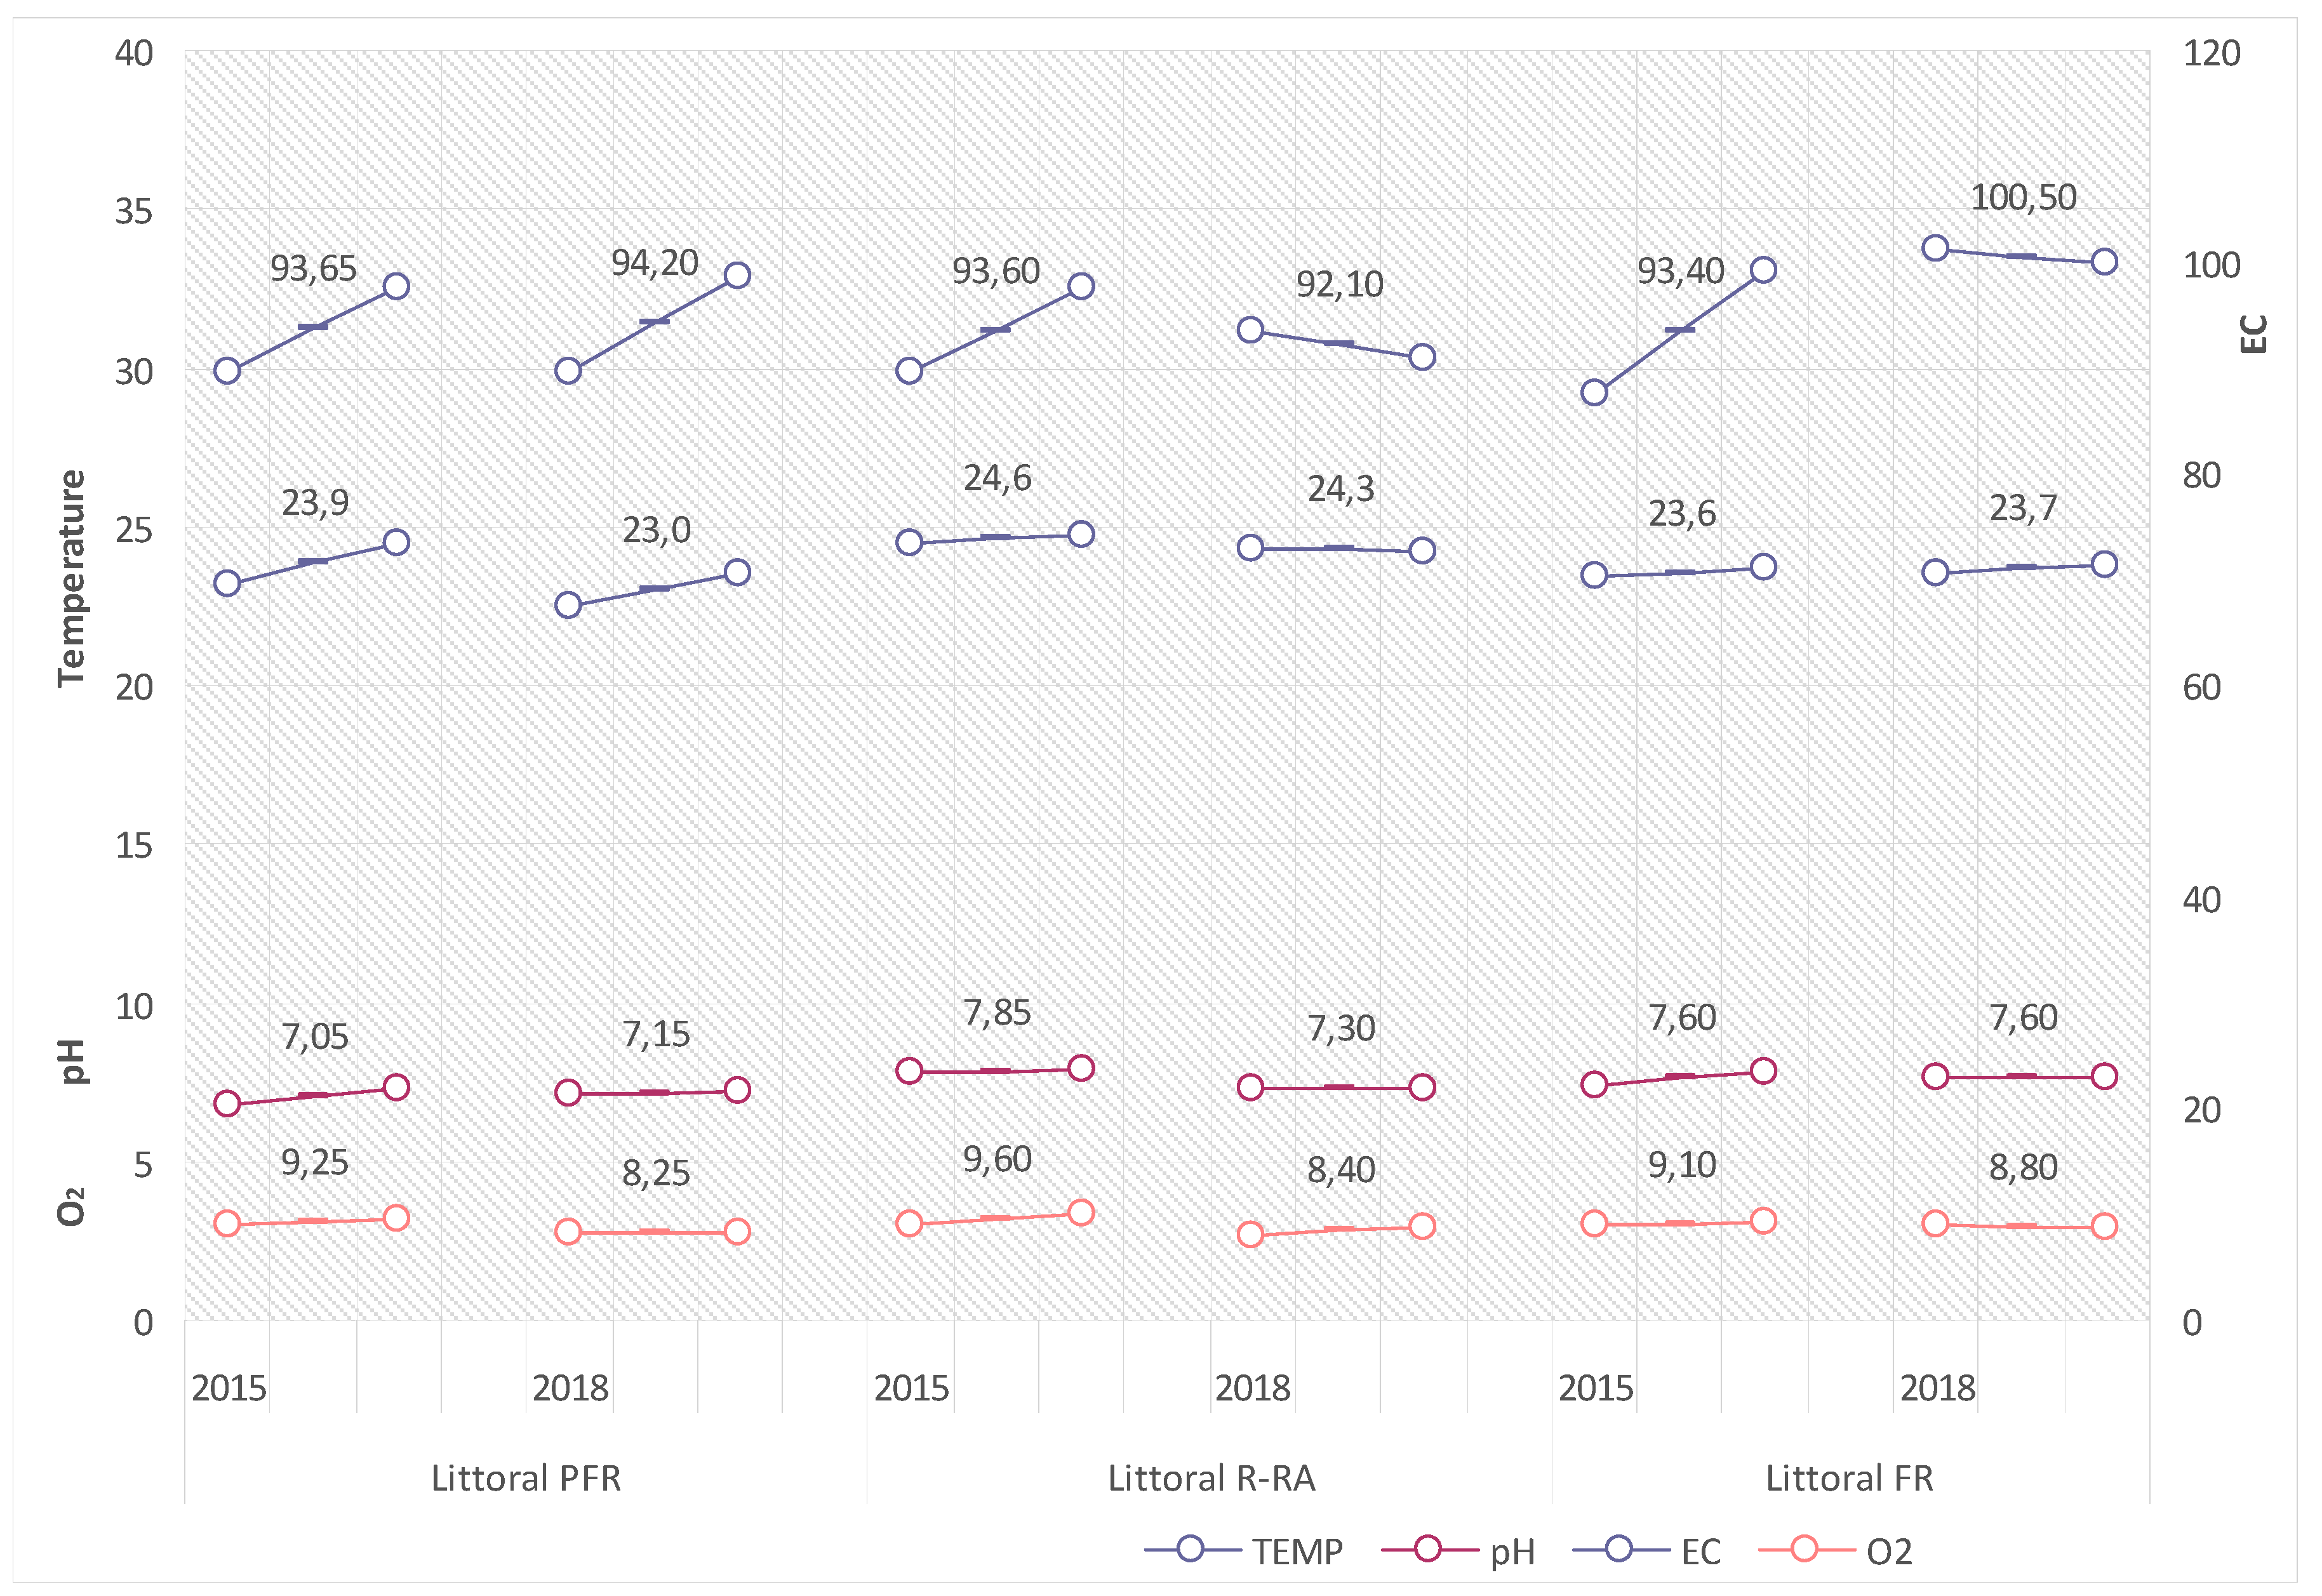
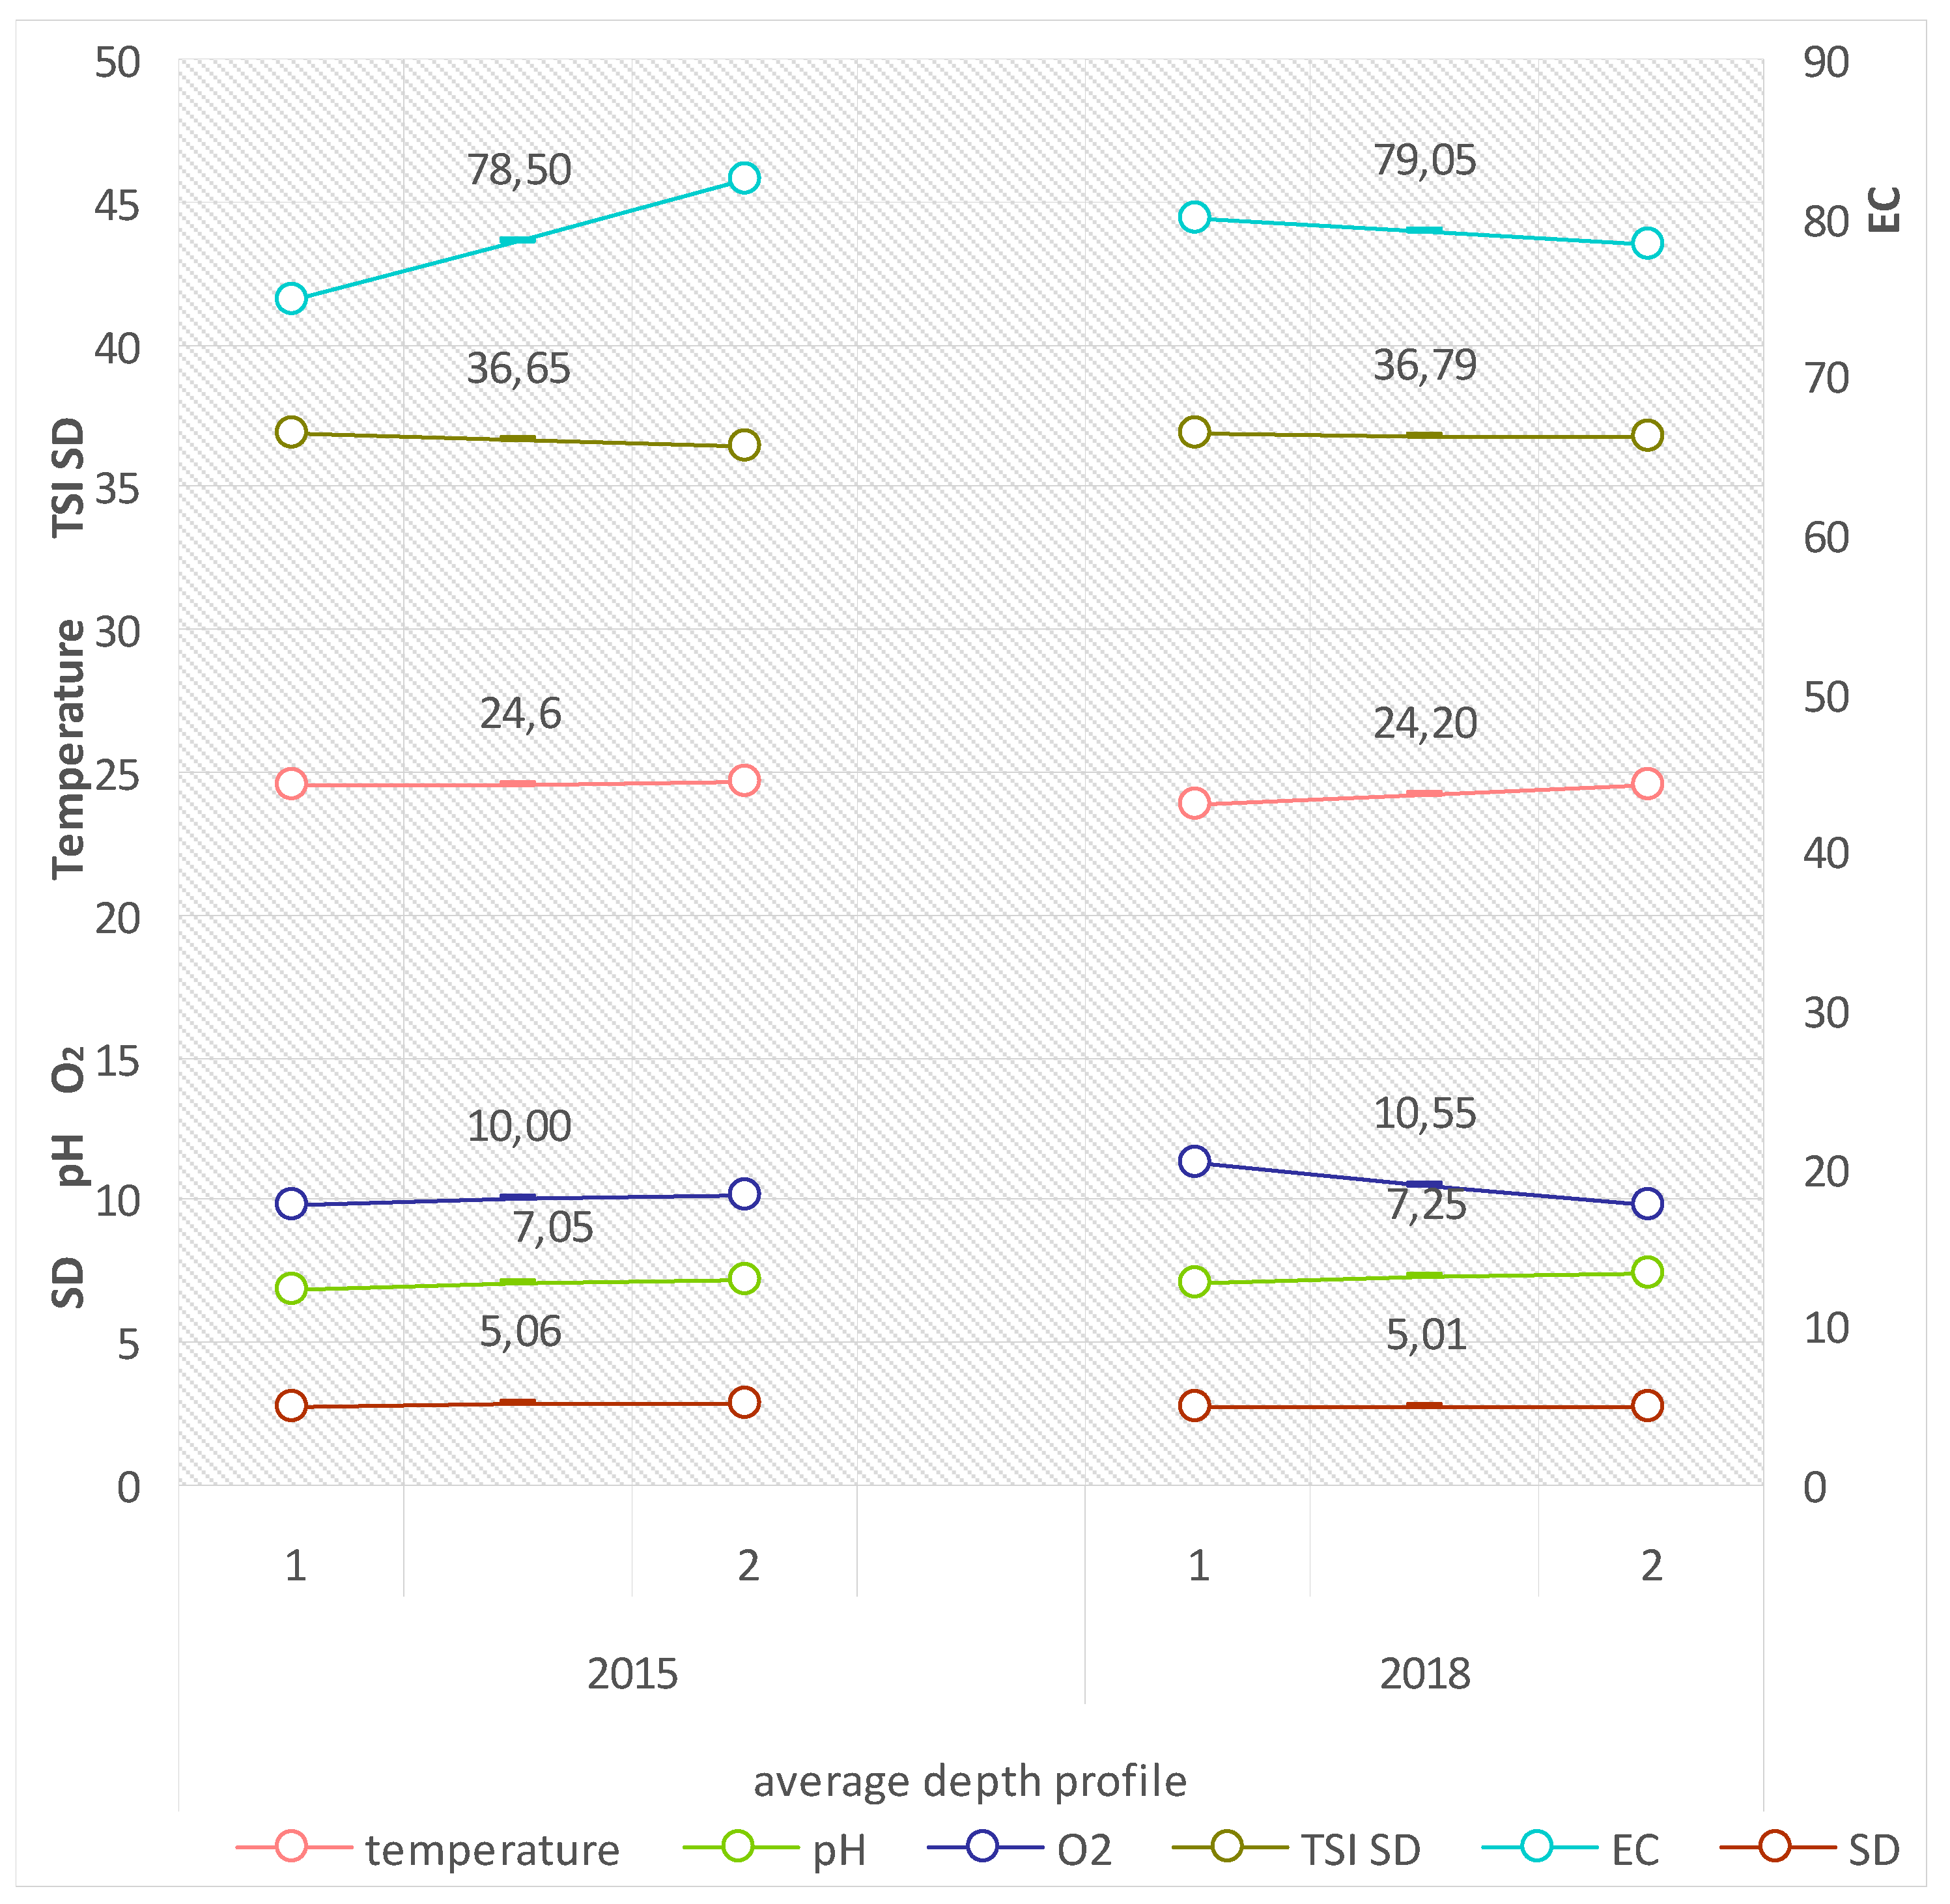
The values of the analysed physical-chemical properties of littoral waters in the period showed low variability, adopting ranges that are typical of waters with low intensity in the eutrophication process. Reaction (pH) in the 2015 and 2018 summer seasons varied from 7.05 to 7.85, the electrolytic conductivity (EC) from 92.1 to 100.5 µS·cm1, the oxygen concentration (O2) from 8.25 to 9.60 mg O2·dm3, and water temperature from 23.0 to 24.6 °C (compare Figure 7).
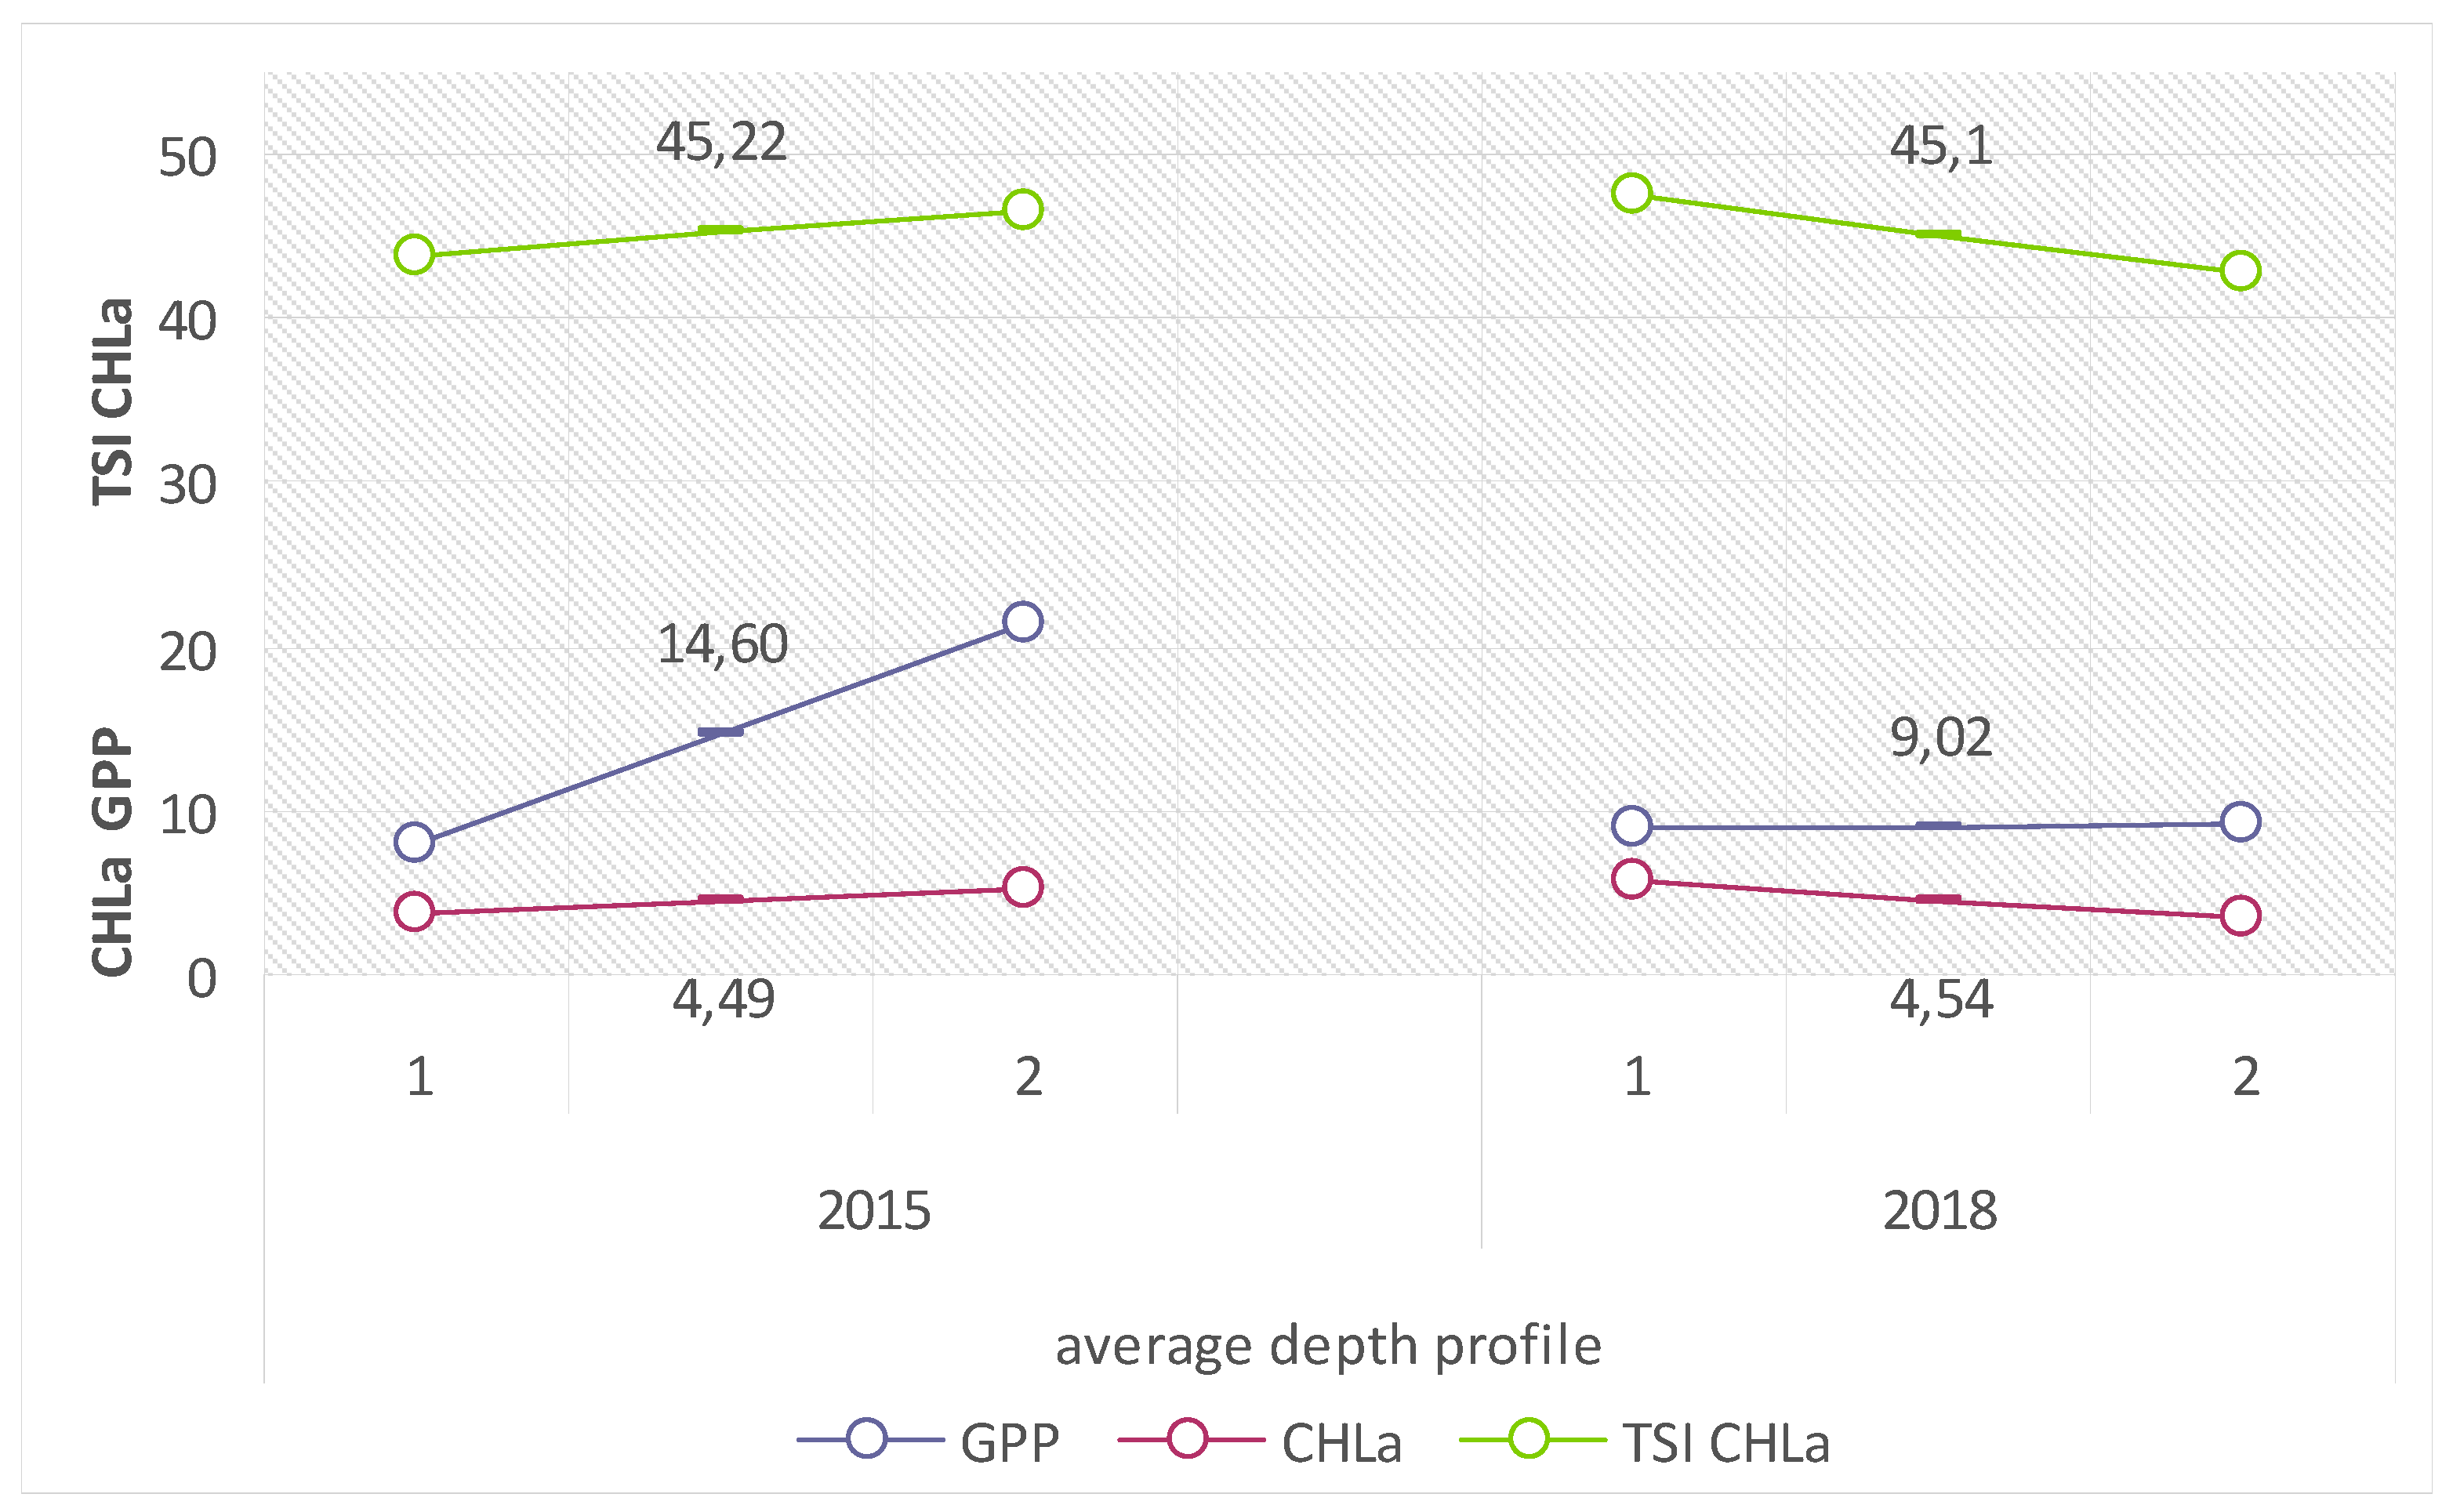
Due to the intensification of metabolic processes related to the direct contact with the catchment, the lake’s littoral is not a competent location for the analysis of the limnological status of the entire lake. The appropriate place for such analyses is the trophogenic zone of the pelagial of Lake Piaseczno, for which the mean values of biological trophic indices in the 2015 and 2018 summer seasons were as follows: GPP: from 9.02 (2018) to 14.6 (2015) mg Cass·m−2·h−1 (translating into: 108.24–175.2 mg Cass·m−2·d−1); CHLa: from 4.49 (2015) to 4.54 (2018) mg Chl.a·m−2 (which translated into similar values of the calculated indicator); and TSI CHLa: from 45.1 (2018) to 45.22 (2015) (Figure 8).
Research supplementing the values of the physical-chemical properties of the pelagial waters in Lake Piaseczno also showed no considerable differences for both study seasons, and were in ranges that are typical of water bodies with a poor trophic status, as additionally suggested by the value of the indicator TSI SD being <40 (compare Figure 9).
The limnological status of a water body is determined by the quantity and quality of allochthonic substances that are supplied from the catchment, depending on the character of the occurring ecosystems and their anthropogenic transformations. An analysis of the unitary coefficients of the export of surface loads of biogenic substances from the catchment area of Lake Piaseczno with variable forms of land use showed that the load of biogenic substances generated annually to the lake is 1151.1 kg N and 42.49 kg P. The highest contribution in the balance of biogens is reached by recreational areas and loose rural building development: 689.4 kg N and 22.98 kg P·year−1. Due to their phytogeochemical property of the bioretention of biogenic substances, forests, tree stands and shrubs generate relatively small amounts of N and P (123.57 and 8.24 kg·year−1, respectively). Currently, extensively used arable land introduces approximately 338.13 kg N and 11.27 kg P·year−1 to the lake waters annually.
Tourism and unorganised recreation related to beaches and bathing areas generate variable amounts of biogenic substances, depending on the number of persons participating in recreation in the shore zone, which in turn depends on appropriate weather conditions and the day of the week (weekday or weekend, [20,21]). Based on the adopted methodical assumptions, it was determined that the maximum amount of biogenic substances from this type of human pressure could potentially reach approximately 170.49 kg N·year−1 and 77.91 kg P·year−1 (arbitrarily assuming 30 days in a year with the maximum pressure of beach tourism, which is currently doubtful due to the decreasing number of tourists).

5. Discussion

5.1. Role of the Flora of Buffer Zones in the Bioretention of Environmental Pollutants

Transitional zones between different types of ecosystems (ecotones) with considerable species diversity and diversity of life forms of plants constitute a perfect biogeochemical barrier for different types of natural and anthropogenic pollutants [15,23,27,29,30,31,59,60].
In the case of areas with water ecosystems, ecotones are frequently treated as so-called buffer zones that effectively provide physical, chemical and biological protection to water bodies or streams against natural and anthropogenic pollutants from surface and subsurface runoff [31,61]. Biogenic substances are retained, absorbed, abiotically adsorbed, consumed or biologically transformed by plants and micro-organisms [62].
Plants as bioretention organisms can retain from 10 to 50% of biogens that build their biomass. The rest is physically and chemically bound by other components of a given ecosystem, e.g., through accumulation in the near-surface soil layer [63]. Flora additionally develop an interactive system with soil and the micro-organic edaphon (biofilm) that stimulates many biochemical processes [15,28,29,31,60]. In the case of shores of water bodies, plant buffer zones additionally stabilise the shoreline, preventing water erosion of the shores. They reduce runoffs and improve the structure of soils [31,64,65,66].
The ability of buffer zones to absorb nutrients also depends on the soil structure, the inclination of the slope and the hydrological and meteorological conditions [67]. The width of the zone is important, in accordance with the assumption that with increasing width the effectiveness of bioresorption of nutrients also increases [67,68]. In the case of the shores of Lake Piaseczno, the mean width of buffer zones related to particular topographic conditions and the recreational infrastructure oscillated at around 10 m. An exceptionally important factor that determines the efficiency of phytogeochemical barriers, however, is their species diversity, which is also related to the diversity of life forms [15,23,67].
Buffer zones in lake catchments that constitute a mosaic of trees, shrubs, perennials and grasses show an approximately 6-times higher efficiency in phosphorus bioretention than catchments with a uniform type of vegetation [23]. Depending on species diversity, such zones are capable of bioaccumulation from the catchment area from 1.4 to 344 kg of nitrogen per hectare [26].
An admixture of grasses with an intensive fibrous root system considerably increases the efficiency of biogeochemical barriers, although in the case of the purposeful development of such zones they require mowing at the end of the vegetative season [69]. Among grasses, nitrophilic Phragmites australis, a common species with low ecological requirements, although indicative of the intensification of eutrophication of ecosystems, substantially contributes to the efficiency of the buffer zones, also capturing considerable amounts of heavy metals, e.g., zinc, or pesticides, e.g., metachlor from the environment [70]. Metachlor is even more effectively assimilated by Typha latifolia. Its assimilation from the environment is >88% [71].
A similar higher contribution of plants from the family Fabaceae is determined in phytocoenoses. They are capable of forming dense vegetation patches, are characterised by a long lifecycle, and have the ability to intensively bioassimilate nutrients throughout the vegetative season. They have a fibrous root system that helps to reduce the movement of surface runoff into a lake [61].
Tree and shrub species are of particular importance to the functioning of buffer zones because they considerably reduce loads of biogenic substances. It is particularly evident in the transitional zones between arable land and water ecosystems. A buffer zone with a width of 16 m and an admixture of such flora, with a contribution from grasses, can even assimilate 94% N and 91% P from the environment [64]. It is worth emphasising that with age and biomass growth, tree species increase their bioassimilation capacity [72].
The effective functioning of buffer zones of the shore flora of a lake should, therefore, cover diverse flora and their habitat preferences and tolerance for the variable hydrological conditions that occur in catchments of water bodies [31].
Macrophytes of the littoral, which constitute a deeper zone of the biogeochemical barrier, also have a positive effect on the ecological state of water bodies. The most important benefits include competition for phytoplankton in absorbing biogens that are accumulated in plants for a considerably longer time (measured in years) than phytoplankton (measured in days), a haven for zooplankton and other invertebrates feeding on filtered seston, and feeding, hiding and reproduction grounds for invertebrates. Macrophytes are also involved in the intensive process of matter circulation and participate in the oxygenation and solidification of bottom sediments by developing a compact structure on the bottom. Macrophytes in larger clusters fulfil the role of a buffer that protects waters from runoff of harmful compounds, and some species produce metabolites, some of which have the ability to hinder the development of plankton [50,73,74,75].
The amounts of biogens that plants are able to absorb and incorporate into their mass depend, in particular, on their species, rate of growth, range of ecological tolerance and general condition. Abiotic factors, such as temperature, concentration of particular ions, reaction (pH) and interactions between elements, are also important, as are biotic factors, such as competition, pathogens and herbivores [76].
In the littoral zone, the greatest amounts of nitrogen are incorporated into the tissues of Glyceria maxima, the greatest amounts of phosphorus and potassium are incorporated into the tissues of Acorus calamus, and the greatest amounts of sodium are incorporated into the tissues of Typha latifolia. The lowest amounts of nitrogen are incorporated into the tissues of Schoenoplectus lacustris, and the lowest amounts of phosphorus, potassium and sodium are incorporated into the tissues of Phragmites australis [77].
The accumulation of elements in plants does not occur in a continuous way. The period of retention of accumulated elements in a plant depends on its phenological cycle and the impact of abiotic and biotic factors. Macrophytes have the ability to release different compounds, but in very small amounts. The highest amounts of biogenic elements are accumulated by macrophytes in the beginning of the vegetation period. At the end of the period and after its termination, plants return the main biogen load to the environment. The longest vegetation period in the climatic zone of Poland concerns Typha latifolia and Phragmites australis, as well as Glyceria maxima and Schoenoplectus lacustris. The duration of the vegetation period can, however, be modified by climatic factors, and can have different courses in different years [76].
Macrophytes also have the ability to actively (selectively) absorb heavy metals. The most actively absorbed heavy metals are usually those that are necessary for the development of a given plant (e.g., copper and zinc). Other factors that determine their uptake include the form in which they occur in the environment (degree of oxygenation, type of chemical compound in which they occur) and whether they belong to a type of metal that shows synergistic (intensifying the uptake of other metals) or antagonistic properties (the hindering uptake of other metals). This is exemplified by copper; its higher than average amount in plant tissues reduces the content of iron and manganese. Heavy metals absorption also depends on environmental factors (such as content of mineral and organic suspension in water and bottom sediments, temperature of the environment and pH values) and on the phenological cycle (perennial species accumulate a greater amount of heavy metals than annual species) [76,77].

5.2. Abiotic Environmental Properties That Develop Habitats of Lake Shore Vegetation

The catchment of Lake Piaseczno in the Łęczna-Włodawa Lake District is a model example of surface-closed-drainage terrain. It determines the alimentation of the lake from surface and subsurface runoff from atmospheric precipitation. Considering the continental character of the climate of the central part of East Poland, with a prevalence of evapotranspiration over a relatively low atmospheric precipitation total (550 mm annually based on research from meteorological stations in Bezek, Włodawa) and a relatively small, although sometimes very intensive alimentation in summer months [78], the shore vegetation is exposed to strong pressure from transformations of the hydrological conditions of the habitats it covers.
The vicinity of Lake Piaseczno is characterised by considerably worse soils than the majority of catchments of other lakes in the Łęczna-Włodawa Lake District. Podzolic soils, developed from loose and weakly loamy sands, are prevalent here, and include soils in bonitation classes from IVa to VI and soils of rye complexes, particularly the weak and weakest complexes [22,79]. They are soils with low natural fertility, a low pH and low sorption properties [11,22]. Soils with such properties promote the seepage of precipitation waters down the soil profile and their penetration into groundwaters. The result is the washing out of fertiliser components that are supplied to the soil, and their runoff via groundwaters to the lake, potentially substantially contributing to the intensification of eutrophication processes in its waters [11].
Therefore, the land use structure in the catchment, or its abiotic parameters, including the hydrological specificity in relation to the habitat conditions of the shore and littoral of Lake Piaseczno, determines a group of conditions for the development of diverse phytocoenoses. Their species composition is modified by tourist penetration into the shores and recreational use of beaches and bathing areas.

5.3. Botanical Analyses of the Vegetation of the Lake’s Shore and Littoral

Despite the substantial impact of agriculture, tourism and stationary and unorganised recreation on the high environmental–landscape values of Lake Piaseczno [13,21], the shore vegetation showed considerable species diversity, which was additionally related to the diversity of the life forms of plants: a total of 235 species of vascular plants were identified (233 species in 2015 and 225 species in 2018) from 56 families, representing four botanic classes. Its species composition, however, was found to not be subject to considerable transformations during the different study periods, as suggested by floristic research on a part of the shore of Lake Piaseczno from 2003 and 2010 [13], and this holistic research on the flora on the shore of Lake Piaseczno, divided into sectors, which is supported by high values of the Jaccard’s species similarity coefficient (0.81–0.91). The species diversity, however, concerned comparisons of particular sectors of shores, where values of the coefficient were in a range of 0.26–0.84, suggesting a lack of habitat homogenisation and a variable effect of human pressure on the botanical status of the shores. In terms of the number of species, in 2015 and 2018, annual and biennial herbaceous plants were, in particular, predominant, as well as perennials, shrub vegetation and trees from the families Asteraceae, Rosaceae, Plantaginaceae, Lamiaceae, Cariophyllaceae, Salicaceae, Poaceae and Cyperaceae. This suggests that a good species combination increased the effectiveness of the buffer zones of the shores of Lake Piaseczno. In terms of species diversity, the highest diversity concerned the recreational–agricultural sector (RA), which reached >58% of all identified plant species. The lowest diversity, depending on the study year, concerned the small recreational sector (R), which reached approximately 50% (in 2015) of all identified plant species, and the forest–recreational sector (FR), which reached approximately 46.5% of all identified plant species. The aforementioned sectors are at a stage of intensive transformation of land use that is in favour of the development of investment forms related to stationary recreation [13,38].
In such conditions, flora respond to the progressing anthropogenic pressure from the catchment with changes in the range of existing plant communities and the development of new combinations of species that do not occur naturally: anthropogenic communities [46].
In the case of the shores of Lake Piaseczno in the 2015 and 2018 seasons, the species composition in the historical-geographic context suggested anthropogenic transformations in the flora, which probably also had consequences for the phytosociological classification of phytocoenoses. Plant communities, depending on the sector, were dominated by mixtures of species from the assemblages Molinio-Arrhenatheretea, Oxycocco-Sphagnetea, Phragmitetea, Scheuzerio-Caricetea nigrae, Querco roboris-Pinetum and Nardo-Callunetea, which was possible to determine without considering the affinity of phytocoenoses to particular syntaxonomic units. Although the shore sectors of the lake were dominated by naturally existing spontaneophytes (Sp), a relatively high number of synantropic antropophytes (Ap), occurring in anthropogenic habitats, and a share of antropophytes with different classifications (A), contributed to the high values of the coefficient of total synantropisation of flora (WS-c), which oscillated at around 86%. The observations are confirmed by the high values of the coefficient of the apophytisation of flora (approximately 73%) and the coefficient of the antropophytisation of flora (approximately 13%). Such data suggest the occurrence of habitats appropriate for native flora species, but also a transition of native species from natural to anthropogenic habitats, shaped by different land uses and land management in the catchment.
Despite transformations in the species composition suggesting human pressure, the developing phytocoenoses, although less natural, constitute a reactive and efficient barrier for biogenic substances of various origin, particularly considering that their potential is given by different life forms of plants [15,67]. In such terms, the shore zone of Lake Piaseczno is characterised by the occurrence of strongly diverse life forms of plants, which, according to Raunkieaer, include hemicryptophytes (H), geophytes (G), terophytes (T), hydrophytes and helophytes (Hy), megaphanerophytes (M), nanophanerophytes (N), green chamephytes (C), woody chamephytes (Ch), lianas (li) and semi-parasites (pp). In the case of the predominance of hemicryptophytes (60%), a significant, in the context of the functioning of buffer zones, 7–8% contribution of megaphanerophytes (M) and nanophanerophytes (N) was observed to occur in trees and shrubs, although usually in a low number of species and individuals, in all sectors of the shores of Lake Piaseczno (more than 25% of the species occurred in all shore sectors of Lake Piaseczno). In taxonomic terms, tree, shrub and small tree vegetation included 35 species from 10 families (particularly Salicaceae and Rosaceae) related to two botanical classes. The species in different sectors of the catchment are characteristic of phytosociological peatbog communities, shrub communities and forest communities, developing a biocoenotically diverse mosaic. It is worth mentioning that more than 54% of the tree and shrub species with a variable number of individuals was located in the recreational–agricultural (RA) and recreational (R) sectors, which are characterised by considerable pressure from investment recreational areas (holiday cottages). The presence of such life forms of plants improves the efficiency of buffer zones in the bioretention of biogenic substances, and additionally increases the content of humic substances in the soil and contributes to the improvement of its structure and an increase in its retention capacity [80]. It is also worth emphasising that the application of relevant biocoenotic admixtures, considering a higher degree of vegetation for the purpose of obtaining buffer zones that are optimally efficient in the bioretention of nutrients, is the basic method for obtaining intentional ecohydrological transformations in catchments of water bodies and streams [23,81].
The habitat preferences of plant species of the lake shore related to the index numbers of higher plants [42] suggested properties of habitats that are typical of wetland ecosystems (fresh and moist soils). They were exposed to runoffs of biogenic substances from the catchment (habitats moderately abundant in nutrients and eutrophic components, moderately acidic or neutral, with loamy–sandy or sandy soils with higher permeability). Part of the species of the flora of the shore zone suggested the occurrence of mineral-humus and organogenic soils related to peatbog areas. In spite of the variable hydrological conditions, a substantial contribution (in majority exceeding 50%), based on different habitat properties, was reached by stenobionts with a relatively narrow range of ecological tolerance.
The species diversity, the diversity of forms and the mosaic occurrence of trees and shrubs, often developing in anthropogenic combinations on the shores of Lake Piaseczno, contribute to the high buffer potential of the communities.
The macrophyte vegetation of the littoral of Lake Piaseczno was characterised by relatively high species diversity (37 plant species (23 species in 2007 and 35 species in 2018) from 24 families, representing five botanical classes) that enhanced their function as deeper buffer zones for biogenic substances supplied from the catchment. The presence of species that are valuable in terms of a buffer function for different substances subject to redistribution in the environment was determined, namely Typha latifolia, Phragmites australis (in all sectors) and Schoenoplectus lacustris. The majority of the identified plant species belonged to the group of emerging macrophytes, almost half of them were submerged macrophytes, and the other groups had scarce representation. In reference to the sectors of the catchment, the highest diversity occurred in the case of the littoral adjacent to the peatbog–forest–recreational sector (PFR), which was characterised by the effect of both natural forms (forests) and those related to the development of the infrastructure for holiday cottages and the impact of the degrading transitional bog. Emerging macrophytes were predominant here, reaching a higher range, density and biomass, with lower values for submerged macrophytes (an inversely proportional correlation between these groups for all study sectors). This contributed to the development of the widest reed belt (more than 100 m in width), considerably increasing the buffer potential for biogenic substances of various origin [68].
A somewhat lower species diversity was found in the recreational–agricultural sector (RA) and the forest–recreational sector (FR), which are devoid of the impact of peatbog areas. The littoral flora was, therefore, characterised by more considerable transformations in reference to different sectors of the catchment, as suggested by the low values of the Jaccard’s species similarity coefficient (a range of 0.26–0.64). The high temporal scale of the study (11 years) also permitted the determination of considerable transformations of the species composition of the littoral of the analysed sectors towards each other (following Jaccard, within the range of 0.53–0.88%), probably related to the anthropogenic impact of different types of land use in the catchment, which have been recorded since the 1990s [82]. Nonetheless, the botanical properties of littoral macrophytes in reference to the width of the reed zone contribute to their high potential as phytogeochemical barriers for biogens supplied from the catchment.

5.4. Assessment of the Limnological Status of Lake Piaseczno

The effectiveness of the buffer zones of the shores and littoral of Lake Piaseczno, modified by the abiotic properties of the environment, regulates the supply of biogenic substances from the catchment by affecting the limnological status of its waters. Due to the dynamics of metabolic processes in the littoral zone, the values of biological indicators of water trophic status are not authoritative, but can point to differences in the rate of eutrophication in sectors with the prevalence of various types of land use.
In the 2015 and 2018 summer seasons, the values of biological indicators of the trophic status of the littoral waters adopted ranges that correspond to waters on the boundary of mesotrophy and eutrophy [2,54].
The highest values of gross primary production of phytoplankton were recorded for sector PFR, with diverse forms of impact on the lake ecosystem, and for the jointly analysed sectors R–RA, with the intensively developing infrastructure for recreational areas and the further impact of increasingly extensive agriculture. For sector PFR, the relatively high values of the chlorophyll a concentration contributed to the Carlson Trophic Index value, which constitutes a threshold for water mesotrophy (TSI CHLa > 50), being exceeded. This suggested the intensification of processes related to eutrophication in the zone. The physical-chemical water properties in the period, however, showed low variability for the littoral in all sectors of the catchment, and rather suggested their poor trophic status [2,54].
The supply of allochtonic substances from the catchment after partial bioretention by subsequent buffer zones of the shores and littoral of the lake determines the trophic status for the pelagial zone, and therefore for the entire lake, constituting a medium for its internal metabolism. In the 2015 and 2018 summer seasons, the low values of all biological indicators of the trophic status of the pelagial suggested mesotrophy, as additionally confirmed by the values of physical-chemical properties of its waters [2,54], and the low value of the Carlson’s Trophic State Index (TSI SD <40).
No increase in the supply of biogenic substances from different sectors of the catchment was determined above the compensation capacity of its buffer zone, potentially contributing to the intensification of eutrophication and, therefore, a change in the limnological status of the lake. Such changes, however, have already been recorded in different study periods. In the 1980s and 1990s, the values of the biological indicators of water trophy in the pelagial of Lake Piaseczno showed high amplitudes over the year [83,84], which were sufficient to determine the destabilisation of the processes of biocoenotic homeostasis related to the intensification of eutrophication processes [85].

5.5. Unitary Coefficients of the Export of Surface Loads of Biogenic Substances from the Catchment Area

Natural forms of land use in the catchment, and the types of its anthropogenic transformations, affect the quantity and quality of allochtonic substances that are supplied to a lake, and therefore the intensity of the feeding of the internal metabolism of the lake.
Calculations of unitary coefficients of the export of surface loads of biogenic substances from the catchment [10] show that the highest contribution to the balance of biogens was reached by recreational areas together with loose rural building development, agriculture and potentially—often underestimated in these terms—tourism and beach and bathing area recreation.
The intensification of changes in land use in the catchment towards the development of private areas of recreational investments in all sectors of the catchment increases the pressure of biogens related to this type of activity. A lack of a systemic water supply and sewage management solution contributes to the situation [86].
Pressure on lake waters is favoured by permeable soils that have developed on sands, which determine the washing of nutrients from the soil and the ease of their surface underground runoff [11].
Changes in the preferences of tourists concerning the places and type of recreation, in comparison to the 1990s [87], have produced a successive decrease in the number of tourists staying on the beaches of the lakes in the Lake District [21,22]. This, however, has resulted in a lack of a considerable effect of this type of activity on the balance of biogens in the catchment area. The relatively high, although decreasing, contribution of natural forms to the lake’s catchment (forests) enhances the bioretention of biogenic substances, and generates their low contribution to the balance of biogens in Piaseczno Lake.

6. Summary

In areas with high environmental and landscape values, such as Lake Piaseczno and its vicinity, agriculture, stationary and unorganised recreation and tourism cause substantial transformations of the natural flora of the lake shores and littoral. Changes concerning the abiotic properties of the environment cause biocoenotic effects that result in deformations of natural phytocoenoses, which contribute to the expansion of synanthropic species and alien (in geographic terms [88]) apophytes and antropophytes as well as changes in the species composition of macrophytes and the range of the reed zone of the lake. On the other hand, such modified phytocoenoses, particularly in the zone of the ecotone of the land and water ecosystem, due to their species diversity, which is based on the mosaic of species from peatbog, shrub, forest and water communities, and the diversity of life forms of the flora, can potentially constitute a highly effective barrier against biogens of various origin. In the case of the model Lake Piaseczno with a catchment with natural and diverse anthropogenic forms of land use, characterised by atmospheric surface alimentation that favours easy dispersion of the supplied biogenic substances, it is of particular importance. It contributes to the long-term maintenance of the good quality of the lake waters, which determines the cleanliness classes I and II, and, together with a complex of environmental factors, a low category of susceptibility of a lake to degradation.

7. Conclusions

  • The specificity of the occurrence of natural forms and various anthropogenic forms of land use in the lake’s catchment, in combination with its abiotic properties, affects the amount of biogenic substances potentially supplied to its waters.
  • Buffer zones that function as phytogeochemical barriers in the shore zone and littoral of the lake play an important role in the bioretention of nutrients, heavy metals, pesticides and other environmental pollutants.
  • The high potential effectiveness of the phytogeochemical barrier of the shore and littoral zone of the lake in the bioresorption of nutrients is primarily related to the species richness of the flora, the diversity of life forms, the presence of specific plant species and the width of the buffer zone.
  • The character of anthropogenic transformations in the catchment affects the biocoenotic composition of the shore and littoral vegetation of the lake, and therefore shapes the structure of its buffer zones.
  • The morphometric parameters and hydrological conditions of the catchment, in combination with a diverse land use structure and modified by the effectiveness of biogeochemical barriers of the shore and littoral zones, determine the limnological status of the lake.

Author Contributions

Conceptualization, A.S.; Data curation, A.S. and J.S.; Formal analysis, A.S., J.S. and U.B.-M.; Investigation, A.S.; Methodology, A.S. and J.S.; Software, U.B.-M.; Supervision, A.S.; Visualization, J.S. and U.B.-M.; Writing—original draft, A.S. and J.S.; Writing—review & editing, A.S., J.S. and U.B.-M.

Funding

This research received no external founding.

Acknowledgments

We would like to thank Janusz Galek, MA and students of the University of Life Science in Lublin for technical support.

Conflicts of Interest

The authors declare no conflict of interest.

References

  1. Gutry-Korycka, M. Zlewnia jako geosystem dynamiczny. In Funkcjonowanie Geoekosystemów Zlewni Rzecznych; Kostrzewski, A., Bogucki, W., Eds.; Bogucki: Poznań, Poland, 1999; pp. 17–32. [Google Scholar]
  2. Wetzel, R.G. Limnology: Lake and River Ecosystems; Gulf Professional Publishing: London, UK; Los Angeles, CA, USA; Tokyo, Japan, 2001. [Google Scholar]
  3. Saunders, D.L.; Kalff, J. Nitrogen retention in wetlands, lakes and rivers. Hydrobiologia 2001, 443, 205–212. [Google Scholar] [CrossRef]
  4. Søndergaard, M.; Jensen, J.P.; Jeppesen, E. Role of sediment and internal loading of phosphorus in shallow lakes. Hydrobiologia 2003, 506, 135–145. [Google Scholar] [CrossRef]
  5. Lampert, W.; Sommer, U. Ekologia wód Śródlądowych; PWN: Warszawa, Poland, 1996. [Google Scholar]
  6. Kawecka, B.; Eloranta, P.V. Zarys Ekologii Glonów wód Słodkich i Środowisk Lądowych; PWN: Warszawa, Poland, 1994. [Google Scholar]
  7. Bajkiewicz-Grabowska, E. Ocena naturalnej podatności jezior na degradację i rola zlewni w tym procesie. Wiadomości Ekologiczne 1987, 33, 279–288. [Google Scholar]
  8. Lossow, K. Znaczenie jezior w krajobrazie młodoglacjalnym Pojezierza Mazurskiego. Zesz. Probl. Post. Nauk Rol. 1996, 431, 47–57. [Google Scholar]
  9. Grochowska, J.; Gawrońska, H. Impact of anthropogenic pressure on aquatic conditions in Lake Track in Olsztyn. Arch. Environ. Prot. 2005, 31, 85–94. [Google Scholar]
  10. Soszka, H. Założenia projektu dotyczącego ograniczeń w korzystaniu z wód jezior i użytkowaniu ich zlewni. In Ochrona i Rekultywacja Jezior; Wiśniewski, R., Ed.; Polskie Zrzeszenie Inżynierów i Techników Sanitarnych Oddział w Toruniu: Toruń, Poland, 2010; pp. 115–127. [Google Scholar]
  11. Misztal, M.; Smal, H.; Górniak, A. Ground water inflow of nutrients to the lake from differently utilized catchments. Water Res. 1992, 26, 1237–1242. [Google Scholar] [CrossRef]
  12. Kajak, Z. Eutrofizacja Jezior; PWN: Warszawa, Poland, 1998. [Google Scholar]
  13. Serafin, A.; Pogorzelec, M. Changes in the flora of the eastern and southern shore area of lake Piaseczno in the years 2003–2010. Acta Agrobot. 2011, 64, 141–150. [Google Scholar] [CrossRef]
  14. Tilman, D.; Fargione, J.; Wolff, B.; D’Antonio, C.; Dobson, A.; Howarth, R.; Swackhamer, D. Forecasting agriculturally driven global environmental change. Science 2001, 292, 281–284. [Google Scholar] [CrossRef]
  15. Kujawa, K.; Kras, M.; Kujawa, A.; Nyka, M.; Bohdan, A. Znaczenie Drzew i Krzewów na Terenach Nieleśnych. Czy Wolno Nam Liberalizować Zasady Wycinki Drzew i Krzewów; Wyd. Instytut Środowiska Rolniczego i Leśnego PAN: Poznań, Poland, 2017; pp. 1–24. [Google Scholar]
  16. Vollenweider, R.A. Scientific Fundamentals of the Eutrophication of Lakes and Flowing Waters, with Particular Reference to Nitrogen and Phosphorus as Factors in Eutrophication; OECD: Paris, France, 1970. [Google Scholar]
  17. Hadwen, W.L.; Bunn, S.E.; Arthington, A.H.; Mosisch, T.D. Within-lake detection of the effects of tourist activities in the littoral zone of oligotrophic dune lakes. Aquat. Ecosyst. Health Manag. 2005, 8, 159–173. [Google Scholar] [CrossRef]
  18. Ławniczak, A.E.; Zbierska, J.; Andrzejewska, B. Bilans biogenów jeziora Tomickiego. Rocz. Ochr. Środ. 2010, 12, 861–878. [Google Scholar]
  19. Shortreed, K.S.; Stockner, J.G. Effect of nutrient additions on lower trophic levels of an oligotrophic lake with a seasonal deep chlorophyll maximum. Can. J. Fish. Aquat. Sci. 1990, 47, 262–273. [Google Scholar] [CrossRef]
  20. Serafin, A.; Banach, B.; Szczurowska, A.; Czernaś, K. Estimation of potential loads of contaminants generated by beach tourism on lake Zagłębocze in two summer seasons, 2008 and 2010. Teka Kom. Ochr. Kszt. Środ. Przyr. 2014, 11, 180–189. [Google Scholar]
  21. Serafin, A.; Pogorzelec, M.; Czernaś, K. Estimation of potential load of eutrophicating compounds of recreational origin penetrating into the mesotrophic lake Piaseczno and of the tourist capacity of the lake in the summer seasons of 2008 and 2010. Teka Kom. Ochr. Kszt. Środ. Przyr. 2014, 11, 190–200. [Google Scholar]
  22. Wilgat, T.; Michalczyk, Z.; Turczyński, M.; Wojciechowski, K.H. Jeziora łęczyńsko—Włodawskie. Stud. Ośrod. Dok. Fizjogr. 1991, 19, 23–140. [Google Scholar]
  23. Ryszkowski, L.; Bartoszewicz, A.; Kędziora, A. Management of matter fluxes by biogeochemical barriers at the agricultural landscape level. Landsc. Ecol. 1999, 14, 479–492. [Google Scholar] [CrossRef]
  24. Koc, J. Ekologiczne znaczenie ochrony i renaturyzacji oczek wodnych. In Renaturyzacja Obiektów Przyrodniczych—Aspekty Ekologiczne i Gospodarcze; Michalczyk, Z., Ed.; Wydawnictwo UMCS: Lublin, Poland, 2000; pp. 123–130. [Google Scholar]
  25. Spychaj-Fabisiak, E.; Murawska, A.; Janowiak, B. Wpływ czynników antropogenicznych na wymywanie związków azotu mineralnego z gleb. Zesz. Probl. Post. Nauk Rol. 2001, 476, 311–317. [Google Scholar]
  26. Koc, J.; Szyperek, U. Skuteczność barier biogeochemicznych w ograniczaniu spływu azotu w środowisku rolniczym. Ann. UMCS Sec. E 2004, 59, 93–100. [Google Scholar]
  27. Vodyanitskii, Y.N.; Shoba, S.A. Biogeochemical Barriers for Soil and Groundwater Bioremediation. Mosc. Univ. Soil Sci. Bull. 2016, 71, 89–100. [Google Scholar] [CrossRef]
  28. Błaszczyk, M.K. Samooczyszczanie się zbiorników wodnych. In Mikrobiologia Środowisk; Wyd. Naukowe PWN: Warszawa, Poland, 2010; pp. 244–246. [Google Scholar]
  29. Carluer, N.; Tournebize, J.; Gouy, V.; Margoum, C.; Vincent, B.; Gril, J.J. Role of buffer zones in controlling pesticides fluxes to surfance waters. Procedia Environ. Sci. 2011, 9, 21–26. [Google Scholar] [CrossRef]
  30. Caracciolo, D.; Nato, L.V.; Istanbulluoglu, E.; Fatichi, S.; Zohu, X. Climate change and ecotone boundaries: Insights from a celluar automata ecohydrology model in a Mediterranean catchment with topography controlled vegetation patterns. Adv. Water Resour. 2014, 73, 159–175. [Google Scholar] [CrossRef]
  31. Łaskawiec, E. The role of biogeochemical barriers in protecting aquatic ecosystems against pollution in agricultural environment. Folia Biol. Oecol. 2015, 11, 9–15. [Google Scholar] [CrossRef]
  32. Janiec, B. Geneza mis jeziornych Pojezierza Łęczyńsko-Włodawskiego: Hipotezy, a rzeczywistość rozwoju krasu węglanowego. Prz. Geol. 2014, 62, 257–266. [Google Scholar]
  33. Harasimiuk, M.; Michalczyk, Z.; Turczyńskiego, M. (Eds.) Jeziora Łęczyńsko-Włodawskie. Monografia Przyrodnicza; Biblioteka Monitoringu Środowiska. Wyd. UMCS: Lublin, Poland, 1998. [Google Scholar]
  34. Radwan, S.; Jarzynowa, B.; Kowalczyk, C.; Kowalik, W.; Popiołek, B.; Wojciechowska, W.; Zwolski, W. Stosunki biocenotyczne w jeziorach Pojezierza Łęczyńsko-Włodawskiego. Idee Ekologiczne Seria Szkice 1994, 5, 9–16. [Google Scholar]
  35. Ligęza, S.; Smal, H.; Misztal, M. Zmienność wybranych parametrów fizykochemicznych wód gruntowych torfowiska i przyległego litoralu jeziora Piaseczno (Pojezierze Łęczyńsko-Włodawskie). Acta Agrophys. 2003, 3, 465–470. [Google Scholar]
  36. Serafin, A. Phytoplankton productivity in the pelagic zone Lake Piaseczno in the evaluation of its trophic state in the summer seasons of 2005–2007. Teka Kom. Ochr. Kszt. Środ. Przyr. 2009, 6, 304–310. [Google Scholar]
  37. Kudelska, D.; Cydzik, D.; Soszka, H. Wytyczne Monitoringu Podstawowego Jezior; PIOŚ: Warszawa, Poland, 1994. [Google Scholar]
  38. Sender, J.; Demetraki-Paleolog, A.; Kolejko, M.; Klimczak, M.; Kaczorowska, A. Direction of hydrobotanic changes of mesotrophic lake (East Poland). Teka Kom. Ochr. Kszt. Środ. Przyr. 2017, 14, 103–111. [Google Scholar]
  39. Rutkowski, B. Klucz do Oznaczania Roślin Naczyniowych Polski Niżowej; Państwowe Wydawnictwo Naukowe: Warszawa, Poland, 2001. [Google Scholar]
  40. Mirek, Z.; Piękoś-Mirkowa, H.; Zając, A.; Zając, M. Flowering Plants and Pteridophytes of Poland. A Checklist; W. Szafer Institute of Botany, Polish Academy of Science: Kraków, Poland, 2002. [Google Scholar]
  41. Fijałkowski, D. Flora Roślin Naczyniowych Lubelszczyzny; Lubelskie Towarzystwo Naukowe, Pol Maps: Lublin, Poland, 1994. [Google Scholar]
  42. Zarzycki, K.; Trzcińska–Tacik, H.; Różański, W.; Szeląg, Z.; Wołek, J.; Korzeniak, U. Ecological Indicator Values of Vascular Plants of Poland; W. Szafer Institute of Botany, Polish Academy of Science: Kraków, Poland, 2002. [Google Scholar]
  43. Chmiel, J. Flora Roślin Naczyniowych Wschodniej Części Pojezierza Gnieźnieńskiego i jej Antropogeniczne Przeobrażenia w Wieku XIX i XX. Część I; Atlas Rozmieszczenia Roślin, Sorus: Poznań, Poland, 1993. [Google Scholar]
  44. Chmiel, J. Flora Roślin Naczyniowych Wschodniej Części Pojezierza Gnieźnieńskiego i jej Antropogeniczne Przeobrażenia w Wieku XIX i XX. Część II; Atlas Rozmieszczenia Roślin; Sorus: Poznań, Poland, 1993. [Google Scholar]
  45. Wysocki, C.; Sikorski, P. Fitosocjologia Stosowana; Wyd. SGGW: Warszawa, Poland, 2002. [Google Scholar]
  46. Kornaś, J. Oddziaływanie człowieka na florę: Mechanizmy i konsekwencje. Wiad. Bot. 1981, 25, 165–182. [Google Scholar]
  47. R Core Team. R: A Language and Environment for Statistical Computing; R Foundation for Statistical Computing: Vienna, Austria, 2018. [Google Scholar]
  48. Oksanen, J.; Blanchet, F.G.; Friendly, M. Vegan: Community Ecology Package. R Package Version 2.5-2. 2018. Available online: https://cran.r-project.org/package=vegan (accessed on 17 December 2018).
  49. Matuszkiewicz, W. Guide for the Determination of Plant Communities in Poland; PWN: Warszawa, Poland, 2013. [Google Scholar]
  50. Szmeja, J. Przewodnik do Badań Roślinności Wodnej; Wyd. Uniwersytetu Gdańskiego: Gdańsk, Poland, 2006; p. 412. [Google Scholar]
  51. Vollenweider, R.A. A Manual Methods for Measuring Primary Production in Aquatic Environments; IBP Handbook: Oxford, UK; Edinburgh, UK, 1969. [Google Scholar]
  52. Hermanowicz, W.; Dojlido, J.; Dożańska, W.; Koziorowski, B.; Zerbe, J. Fizyczno-Chemiczne Badanie Wody i Ścieków; Arkady: Warszawa, Poland, 1999. [Google Scholar]
  53. Strickland, J.D.H. Measuring the production of marine phytoplankton. Bull. Fish. Res. Bd. Can. 1960, 125, 1–182. [Google Scholar]
  54. Kajak, Z. Hydrobiologia. Ekosystemy wód Śródlądowych; Wyd. UW: Białystok, Poland, 1994. [Google Scholar]
  55. Nusch, A.E. Comparison of different methods for chlorophyll and phaeopigment determination. Arch. Hydrobiol. Beith. Ergebn. Limn. 1980, 14, 14–36. [Google Scholar]
  56. Carlson, R.E. A trophic state index for lakes. Limnol. Oceanogr. 1977, 22, 361–369. [Google Scholar] [CrossRef]
  57. Prędota, M. Doświadczenia Polski w Zakresie Nadzoru nad Basenami. Materiały Szkoleniowe w Ramach Projektu Współpracy Bliźniaczej PL/2005/IB/EN/03 z Modułu: Rozszerzenie Nadzoru Sanitarnego w Dziedzinie Jakości Wody; PSSE: Lublin, Poland, 2007. [Google Scholar]
  58. Szyper, H.; Zaniewska, H. Zagospodarowanie turystyczne na obszarach pojeziernych. In Ochrona jezior. Seria: Ochrona Środowiska Naturalnego; Cichomska-Sikorska, K., Ed.; Wyd. Epoka: Lublin, Poland, 1984; pp. 75–104. [Google Scholar]
  59. Helman, M. Zastosowanie systemów hydrofitowych do porządkowania gospodarki wodno-ściekowej w gminie. Metody oczyszczania ścieków. In Ogólnopolskie Towarzystwo Zagospodarowywania Odpadów “3R”, Kraków; Towarzystwo na Rzecz Ziemi: Andrychów, Polska, 1998. [Google Scholar]
  60. Izydorczyk, K.; Frątczak, W.; Drobniewska, A.; Cichowicz, E.; Michalska-Hejduk, D.; Gross, R.; Zalewski, M. A biogeochemical barrier to enhance a buffer zone for reducing diffuse phosphorus pollution—Preliminary result. Ecohydrol. Hydrobiol. 2013, 13, 104–112. [Google Scholar] [CrossRef]
  61. Wasilewski, Z. Dobór gatunków traw i roślin bobowatych na strefy buforowe oraz zasady ich zakładania i pielęgnowania. Woda-Środowisko-Obszary Wiejskie 2012, 12, 219–227. [Google Scholar]
  62. Bis, B.; Krauze, K.; Bednarek, A.; Zalewski, M. Ekologiczne podstawy renaturyzacji rzek pod kontem redukcji transportu biopierwiastków do zbiorników zaporowych i wód przybrzeżnych. In Zastosowanie Biotechnologii Ekosystemowych do Poprawy Jakości Wód; Zalewski, M., Wiśniewski, R.J., Eds.; Zeszyty Naukowe Komitetu Człowiek i Środowisko: Dziekanów Leśny, Poland, 1997; Volume 18, pp. 137–155. [Google Scholar]
  63. Krauze, K. Ecotones: How to diminish nutrient transport from lanscapes. In Integrated Watershed Management—Ecohydrology & Phytotechnology Manual; Zalewski, W., Ed.; UNESCO: Paris, France, 2004; pp. 158–163. [Google Scholar]
  64. Blanco-Canqui, H.; Lal, R. Buffer strips. In Principles of Soil Conservation and Management; Springer: Amsterdam, The Netherlands, 2008; pp. 223–257. [Google Scholar]
  65. Sahu, M.; Gu, R.R. Modeling the effects of riparian buffer zone and contur strips on stream water quality. Ecol. Eng. 2009, 35, 1167–1177. [Google Scholar] [CrossRef]
  66. Sohel, S.J.; Ullah, H. Ecohydrology: A framework for overcoming the environmental impacts of shrimp aquaculture on the costal zone of Bangladesh. Ocean Coast. Manag. 2012, 63, 67–78. [Google Scholar] [CrossRef]
  67. Jørgensen, S.E.; Mioduszewski, W.; Zdanowicz, A.; Thornton, J.A.; Bocian, J. Application of Phytotechnologies and Freshwater Ecosystem Management. In Guidelines for the Integrated management of the Watershed—Phytotechnology and Ecohydrology; Zalewski, M., Ed.; UNEP Freshwater Management Series; UNEP: Nairobi, Kenya, 2002; Volume 5, pp. 69–112. [Google Scholar]
  68. Petersen, R.C.; Petersen, L.B.M.; Lacoursiere, J. A bulding—Bloc model for stream restoration. In Water, Engineering and Landscape. Water Control and Landscape Transformation on the Modern Period; Boon, P., Calow, P., Petts, G.E., Eds.; Belhaven Press: London, UK, 1992; pp. 188–208. [Google Scholar]
  69. Lemkowska, B.; Sowiński, P.; Pożarski, K. Zmiany warunków glebowo-troficznych rezerwatu Ustnik jako element zagrożeń jegofunkcji przyrodnicznych. Woda-Środowisko-Obszary Wiejskie 2010, 10, 73–87. [Google Scholar]
  70. Bonanno, G.; Giudice, R.L. Heavy metal bioaccumulation by the orgaus of Phragmites australis (common reed) and their potential use as contamination indicators. Ecol. Indic. 2010, 10, 639–645. [Google Scholar] [CrossRef]
  71. Vymazal, J.; Břazinová, T. The use of constructed wetlands for removal of pesticides from agricultural runoff and drainage: A review. Environ. Int. 2015, 75, 11–20. [Google Scholar] [CrossRef]
  72. Fortier, J.; Truax, B.; Gagnou, D.; Lambert, F. Biomass carbon, nitrogen and phosphorus stock in hybrid poplar buffers, herbaceous buffers and natural woodlots in the riparian zone on agricultural land. J. Environ. Manag. 2015, 154, 333–345. [Google Scholar] [CrossRef]
  73. Gołdyn, R.; Joniak, T.; Kowalczewska-Madura, K.; Kozak, A. Trophic state of a lowland reservoir during 10 years after restoration. Hydrobiologia 2003, 506–509, 759–765. [Google Scholar] [CrossRef]
  74. Pieczyńska, E. Rola makrofitów w kształtowaniu trofii jezior. Wiadomości Ekologiczne 1988, 34, 375–404. [Google Scholar]
  75. Pełechaty, M.; Pronin, E. Rola roślinności wodnej i szuwarowej w funkcjonowaniu jezior i ocenie stanu ich wód. Stud. Lim. Tel. 2015, 9, 25–34. [Google Scholar]
  76. Obarska-Pempkowiak, H.; Gajewska, M.; Wojciechowska, E. Hydrofitowe Oczyszczanie wód i Ścieków; Państwowe Wydawnictwo Naukowe: Warszawa, Poland, 2010. [Google Scholar]
  77. Ozimek, T.; Renman, G. Rola Helofitów w Oczyszczalniach Hydrobotanicznych. II Międzynarodowa Konferencja Naukowo-Techniczna; Akademia Rolnicza w Poznaniu: Poznań, Poland, 1996; pp. 109–118. [Google Scholar]
  78. Warakomski, W. Charakterystyka klimatyczna Pojezierza Łęczyńsko-Włodawskiego. In Jeziora Łęczyńsko-Włodawskie. Monografia Przyrodnicza; Harasimiuk, M., Michalczyk, Z., Turczyński, M., Eds.; Biblioteka Monitoringu Środowiska, UMCS: Lublin, Poland, 1998; pp. 21–34. [Google Scholar]
  79. Radwan, S. Ochrona Ekosystemуw Wodnych w Poleskim Parku Narodowym i jego Otulinie; AR Lublin; TWWP: Lublin, Poland, 1995; pp. 1–131. [Google Scholar]
  80. Jaskulska, R.; Hoppe-Wawrzyniak, A. Właściwości fizykochemiczne i wodne gleb płowych pól uprawnych i sąsiadujących z nimi zadrzewień śródpolnych. J. Res. Appl. Agric. Eng. 2013, 58, 235–239. [Google Scholar]
  81. Maksimenko, S.Y.; Zemskaya, T.I.; Pavolova, O.N.; Ivanov, V.G.; Buryukhaer, S.P. Microbial community of the water column of the Selenga river-lake Baikal biogeochemical barierr. Microbiology 2008, 77, 587–594. [Google Scholar] [CrossRef]
  82. Ciecierska, H.; Radwan, S. Zróżnicowanie fitocenotyczne litoralu jezior Pojezierza Łęczyńsko-Włodawskiego. In Problemy Ochrony i Użytkowania Obszarów Wiejskich o Dużych Walorach Przyrodniczych; UMCS: Lublin, Poland, 2000; pp. 71–85. [Google Scholar]
  83. Wojciechowski, I.; Czernaś, K.; Krupa, D. Biotic values of the lakes of the Polesie National Park and its buffer zone as well as their conditions. In The Conservation of Aquatic Ecosystems in the Polesie National Park and Its Buffer Zone; Radwan, S., Ed.; Wyd. TWWP: Lublin, Poland, 1995; pp. 38–45. [Google Scholar]
  84. Czernaś, K.; Serafin, A. Changes in phytoplankton productivity in the pelagic zone of the mesotrophic Piaseczno Lake in 1987–1989 and 2001–2003. Oceanol. Hydrobiol. Stud. 2007, 36, 1–4. [Google Scholar]
  85. Burchardt, L. Instability or hypertrophy. Var. Evol. 1993, 2, 93–101. [Google Scholar]
  86. Krukowska, R. Pojezierze Łęczyńsko-Włodawskie—Funkcja turystyczna regionu. Folia Tour. 2009, 21, 165–184. [Google Scholar]
  87. Chmielewski, T.J. System Planowania Przestrzennego Harmonizującego Przyrodę i Gospodarkę. T.1; Wyd. Politechnika Lubelska: Lublin, Poland, 2001. [Google Scholar]
  88. Fabiszewski, J.; Kwiatkowski, P. Gatunki inwazyjne we florze roślin naczyniowych Sudetów. Ann. Siles. 2001, 31, 123–128. [Google Scholar]
Figure 1. The location of Lake Piaseczno (white arrow) in the Łęczna-Włodawa Lake District. Adapted from [32].
Water 11 00290 g001
Figure 2. The land use structure in the catchment of Lake Piaseczno in 2010. Adapted from [38].
Water 11 00290 g002
Figure 3. A dendrogram of hierarchical classification for tree and shrub species (a) and their similarity for shore sectors of the lake in 2015 and 2018 (b) based on Jaccard’s coefficient and the average linkage method. Species composition of tree and shrub vegetation: Acer platanoides, Alnus glutinosa, Andromeda polifolia, Betula pendula, Betula pubescens, Calluna vulgaris, Corylus avellana, Frangula alnus, Fraxinus excelsior, Malus domestica, Oxycoccus palustris, Padus avium, Pinus sylvestris, Populus tremula, Prunus avium, Pyrus communis, Quercus petraea, Quercus robur, Rubus caesius, Rubus idaeus, Salix alba, Salix aurita, Salix caprea, Salix cinerea, Salix fragilis, Salix pentandra, Salix purpurea, Salix rosmarinifolia, Salix viminalis, Sambucus nigra, Sorbus aucuparia, Spiraea media, Vaccinium myrtillus, Vaccinium uliginosum and Vaccinium vitis-idaea.
Water 11 00290 g003
Figure 4. A dendrogram and a heatmap of the hierarchical cluster analysis of 35 species and four sectors in 2015 and 2018 based on Jaccard’s coefficient and the average linkage method (the presence of a given species in the phytocoenoses is marked with yellow colour, and its absence with red colour).
Water 11 00290 g004
Figure 5. The values of indicators of antropogenic transformations in the flora of shore sectors of Lake Piaseczno in 2015 and 2018. WAn-c, total anthropophytisation; WS-c, total synanthropisation; WAp-c, total apophytisation.
Water 11 00290 g005
Figure 6. Mean values with ranges of biological indicators of the trophic status of waters of the littoral in sectors of the catchment of Lake Piaseczno in the 2015 and 2018 summer seasons: GPP, Gross Primary Production (mg Cass·m−2·h−1); CHLa, chlorophyll a concentration (mg Chl.a·m−2); TSI CHLa, Carlson’s Trophic State Index.
Water 11 00290 g006
Figure 7. Mean values with ranges of physical-chemical properties of littoral waters of sectors of the Lake Piaseczno catchment in the 2015 and 2018 summer seasons: O2, oxygen concentration (mg O2·dm−3); temperature (°C); EC, electrolytic conductivity (µS·cm−1); pH, reaction.
Water 11 00290 g007
Figure 8. Mean values with ranges of biological indicators of the trophic status of pelagial waters in Lake Piaseczno in the 2015 and 2018 summer seasons. GPP, Gross Primary Production (mg Cass·m−2·h−1); CHLa, chlorophyll a concentration (mg Chl.a·m−2); TSI CHLa, Carlson’s Trophic State Index.
Water 11 00290 g008
Figure 9. Mean values with ranges of physical-chemical properties of waters of the pelagial in Lake Piaseczno in the 2015 and 2018 summer seasons. O2, oxygen concentration (mg O2·dm−3); temperature (°C); EC, electrolytic conductivity (µS·cm−1); pH, reaction; SD, water transparency (Secchi Disc visibility) (m); TSI SD, Carlson’s Trophic State Index.
Water 11 00290 g009
Table 1. The morphometric parameters of Lake Piaseczno on the background of its bathymetric plan (a.s.l., above sea level) [33].
Water 11 00290 i001Absolute HeightSurface Area
170.6 (m a.s.l.)84.7 (ha)
LengthMax. Width
1464 (m)819 (m)
Shape IndexLength of Shoreline
0.43788 (m)
Shoreline DevelopmentMean Bottom Inclination
1.164°50′
Max. DepthMean Depth
38.8 (m)12.6 (m)
Depth IndexVolume
0.3210,674 (thousand m3)
Type of MixingTrophic Status
bradymixionmesotrophy
Table 2. The surface area and land use structure in the catchment of Lake Piaseczno in 2010 (adapted from [38]), and its division into sectors: 1, peatbog–forest–recreational (PFR); 2, recreational (R); 3, recreational–agricultural (RA); 4, forest–recreational (FR).
Water 11 00290 i002LakeLake Density Ratio
83.2 (ha)3.4
Schindler’s RatioForests
0.378.1 (ha, 27.42%)
Arable LandShrubs, Tree Stands
82.15 (ha, 28.8%)4.28 (ha, 1.52%)
Recreational Areas, Rural Building DevelopmentArable Land,Meadows, Pastures
76.6 (ha, 26.9%)37.57 (ha, 13.19%)
Water BodiesSwamps
0.31 (ha, 0.11%)6.2 (ha, 2.17%)
TOTAL = 284.9 (ha, 100%)
Table 3. The species composition of the shore vegetation of Lake Piaseczno in 2015 and 2018 (PFR, R, RA, and FR: catchment sectors; +: species present in the sector).
CLASSMAGNOLIOPSIDA20152018
SectorsSectors
FamiliesSpeciesPFRRRAFRPFRRRAFR
AdoxaceaeSambucus nigra + +
ApiaceaeAegopodium podagraria +
Anthriscus sylvestris + ++
Berula erecta ++ ++
Hydrocotyle vulgaris+ +
Oenanthe aquatica+ +
Peucedanum palustre+++ + +
Sium latifolium ++ ++
ApocynaceaeVincetoxium hirundinaria ++ ++
AsteraceaeAchillea millefolium++++++++
Arctium lappa + ++
Artemisia vulgaris+ ++ +
Bellis perennis + ++
Bidens tripartita++++++++
Chamomilla recutita+
Cirsium arvense ++ +
Cirsium palustre+ +
Conyza canadensis+ +
Erigeron annuus ++ ++
Eupatorium cannabinum++++++++
Gnaphalium sylvaticum +
Gnaphalium uliginosum+ +
Hieracium caespitosum ++ ++
Hieracium pilosella++++++++
Hieracium murorum++++++++
Hieracium umbellatum +
Lapsana communis + ++
Leontodon hispidus+ +
Matricaria maritima ++ ++
Mycelis muralis +
Solidago virgaurea+ ++ +
Tanacetum vulgare ++ +
Taraxacum officinale+ ++ +
Tussilago farfara++++++++
BalsaminaceaeImpatiens parviflora + +
BetulaceaeAlnus glutinosa++++++++
Betula pendula++++++++
Betula pubescens+++ +++
Corylus avellana + +
BoraginaceaeMyosotis arvensis ++ ++
Myosotis palustris++++++++
Myosotis sylvatica + ++
BrassicaceaeCapsella bursa-pastoris +
Erisimum cheiranthoides ++ ++
Rorippa palustris+ +
Rorippa amphibia++++++ +
Erophila verna +++ ++
CalastraceaeEuonymus europaeus ++ +
CampanulaceaeCampanula patula+ ++
Campanula rotundifolia ++ +
Phyteuma orbiculare ++ +
CaryophyllaceaeCerastium arvense ++ ++
Cerastium holostenoides +
Dianthus superbus + ++
Melandrium album+++ +++
Scleranthus annuus ++ ++
Spergula morisonii ++ +
Stellaria media +++ +++
Stellaria graminea++++++++
Stellaria palustris+ + +
Stellaria uliginosa+ ++
ChenopodiaceaeCheneopodium album + ++
ConvolvulaceaeConvolvulus arvensis ++ ++
DroseraceaeDrosera rotundifolia+ +
DipsacaceaeKnautia arvensis +
EricaceaeAndromeda polifolia+ +
Calluna vulgaris++++++++
Oxycoccus palustris+ +
Vaccinium myrtillus+ +++ ++
Vaccinium uliginosum+ +
Vaccinium vitis-idaea + +
FabaceaeLotus corniculatus++++++++
Lotus uliginosus+ +
Lupinus polyphyllus + +
Trifolium campestre +++ ++
Trifolium pratense ++ +++
Trifolium repens+++ +++
Vicia angustifolia+
Vicia hirsuta ++ +
Vicia tetrasperma ++ +++
FagaceaeQuercus petraea + +
Quercus robur++++++++
GeraniaceaeGeranium palustre+ ++ +
Geranium robertianum+ + +
Geranium sylvaticum+ ++ +
HypericaceaeHypericum perforatum+ ++ ++
Hypericum tetrapterum++++ +++
JuglandaceaeJuglans regia + ++
LamiaceaeAjuga reptans + +
Galeopsis tetrahit ++ +
Glechoma hederacea+ +
Lamium purpureum + ++
Lycopus europaeus+++ +++
Mentha aquatica+ +
Mentha arvensis++++++++
Prunella vulgaris++++++++
Scutellaria galericulata+++ +++
Stachys palustris+ ++
Stachys sylvatica ++ +
LythraceaeLythrum salicaria+ + +++
MenyanthaceaeMenyanthes trifoliata+ +
OleaceaeFraxinus excelsior + +
OnagraceaeChamaenerion angustifolium+ ++ +
Epilobium hirsutum+ +
Epilobium palustre+++ + +
Epilobium roseum + +
PapaveraceaeChelidonium majus +
PlantaginaceaePlantag major+++ ++++
Plantago lanceolata+++ +++
Veronica chamaedrys+ ++
Veronica officinalis+ +++ ++
Veronica prostrata ++ +
Veronica scutellata+ ++ +
PolygonaceaePolygonum amphibium+ + +
Polygonum aviculare + +
Polygonum lapathifolium +
Polygonum persicaria +++ + +
Rumex acetosa++++++++
Rumex acetosella++++++++
Rumex crispus +
Rumex conglomeratus+ + +
Rumex hydrolapathum+ ++ +
PrimulaceaeAnagallis arvensis ++ +
Lysimachia thyrsiflora+++ +++
Lysimachia vulgaris+++ +++
Trientalis europaea + +
RanunculaceaeRanunculus acris+ ++
Ranunculus flammula++++++++
Ranunculus repens+ +
RhamnaceaeFrangula alnus+ ++ +
RosaceaeComarum palustre+ +
Filipendula ulmaria+ ++ +
Fragaria vesca ++ ++
Geum urbanum + +
Malus domestica ++ ++
Padus avium ++ +
Potentilla anserina +++ +++
Potentilla collina ++ ++
Potentilla erecta++++++++
Potentilla reptans + +
Prunus avium ++ ++
Pyrus communis ++ ++
Rubus caesius+ ++ +
Rubus idaeus ++ ++
Sanguisorba officinalis+ +
Sorbus aucuparia+ ++ +
Spirae media ++ ++
RubiaceaeGalium aparine ++ +++
Galium mollugo ++ +
Galium palustre++++++++
Galium sylvaticum + +
Galium uliginosum+ +
SalicaceaePopulus tremula++++++++
Salix alba +++ +++
Salix aurita++++++++
Salix caprea+++ +++
Salix cinerea++++++++
Salix fragilis ++ ++
Salix pentandra++++++++
Salix purpurea +++ +++
Salix rosmarinifolia + +
Salix viminalis +++ +++
SapindaceaeAcer platanoides + +
ScheuchzeriaceaeTriglochin palustre+ + +
ScrophulariaceaeLinaria vulgaris+ ++ +
Melampyrum pratense + +
Rhinanthus serotinus ++ ++
Scrophularia nadosa ++ +
SolanaceaeSolanum dulcamara + +
UlmaceaeUlmus minor + +
UrticaceaeUrtica dioica++++++++
ValerianaceaeValeriana officinalis+ +
ViolaceaeViola reichenbachiana ++ ++
Viola tricolor ++ ++
CLASSLILIOPSIDA20152018
SectorsSectors
FamiliesSpeciesPFRRRAFRPFRRRAFR
AlismataceaeAlisma plantago-aquatica++++++++
AraceaeCalla palustris+ +
AsparagaceaeMaianthemum bifolium + +
Convallaria majalis + +
CyperaceaeCarex acutiformis ++ ++
Carex echinata+ ++
Carex elata+
Carex flava++++++++
Carex lasiocarpa+
Carex limosa+++ +++
Carex nigra + ++
Carex panicea+ ++
Carex paniculata ++ ++
Carex pseudocyperus+ ++ +
Carex riparia+
Carex rostrata+
Eleocharis palustris+++ +++
Eriophorum angustifolium+ +
Eriophorum vaginatum+ +
Isolepis setacea ++ +
Rhynchospora alba+++ +++
Schoenoplectus lacustris+++ +++
Scirpus sylvaticus +
IridaceaeIris pseudacorus+ + +
JuncaceaeJuncus articulatus+ ++++++
Juncus bufonius+++++ ++
Juncus conglomeratus++++++++
Juncus effusus+++ +++
Luzula campestris ++ ++
Luzula multiflora+++ + +
PoaceaeAgropyron repens ++ ++
Agrostis capillaris++++++++
Anthoxanthum odoratum +++ +++
Bromus hordeaceus +
Calamagrostis arundinacea ++ ++
Calamagrostis canescens+++ +++
Calamagrostis epigeios + ++
Corynephorus canescens ++ ++
Cynosurus cristatus ++ ++
Dactylis glomerata ++ +
Deschampsia caespitosa+++ +++
Festuca altissima +
Festuca rubra ++ ++
Hierohloë odorata ++ ++
Holcus lanatus++++++++
Lolium perenne +++ +++
Molinia caerulea ++ ++
Nardus stricta +++ +++
Phalaris arundinacea ++ ++
Phleum pratense ++ ++
Phragmites australis+++ +++
Poa angustifolia ++ ++
Poa annua+ + +
SparganiaceaeSparganium emersum+ +
TyphaceaeTypha latifolia+++ +++
CLASSEQIUSETOPSIDA20152018
SectorsSectors
FamiliesSpeciesPFRRRAFRPFRRRAFR
EquisetaceaeEquisetum fluviatile ++ +
Equisetum palustre+ +
CLASSPOLIPODIOPSIDA20152018
SectorsSectors
FamiliesSpeciesPFRRRAFRPFRRRAFR
DennstaedtiaceaePteridium aquilinum ++ ++
DryopteridaceaeDryopteris filix-mas+++ +++
ThelypteridaceaeThelypteris palustris+ +
CLASSCONIFEROPSIDA20152018
SectorsSectors
FamiliesSpeciesPFRRRAFRPFRRRAFR
PinaceaePinus sylvestris++++++++
RAZEM56132115138117126112135109
233225
Table 4. Proportions of different plant life forms in the flora of the studied sectors of Lake Piaseczno in 2015 and 2018. M, megaphanerophytes (trees generally growing to a height of more than 5 m); N, nanophanerophytes (shrubs and small trees from 0.5 to 5 m in height); Ch, woody chamaephytes (buds >25 cm above ground); C, herbaceous chamaephytes (buds <25 cm above ground); H, hemicryptophytes (buds at ground level); G, geophytes (buds in soil); T, therophytes (annuals); Hy, hydrophytes and helophytes (buds in water); li, lianas (plants rooted in soil that require support); pp, semi-parasites; and ua, species of undetermined affinity.
Life Forms20152018
Number of SpeciesProportion (%)Number of SpeciesProportion (%)
M177.29177.55
N187.72188
Ch7373.11
C31.2841.77
H13959.6513359.11
G3414.593314.66
T3414.593214.22
Hy2611.152511.11
li20.8520.88
pp10.4210.44
ua10.4210.44
TOTAL282120.96273121.29
Species occurred233100225100
Table 5. The Jaccard’s species similarity coefficient for shore sectors of Lake Piaseczno in 2015 and 2018 (extreme values are marked with colours: yellow, min; orange, max).
20152018
PFR–RR–RARA–FRPFR–RR–RARA–FR
0.310.840.280.290.760.32
PFR–RAR–FR PFR–RAR–FR
0.320.26 0.320.26
PFR–FR PFR–FR
0.36 0.37
TOTAL
PFR–PFRR–RRA–RAFR–FR
0.910.850.890.81
Table 6. The percentage shares of plant species with different habitat requirements in the flora (based on Zarzycki et al. 2002 [42]) of the study area in 2015 and 2018 (extreme values are marked with colours: yellow, min; orange, max).
Selected IndicatorsEcological Indicator ValuesStenobionts
123456
W: soil moisture value015.3159.5737.8732.765.9552.34
Tr: trophy value2.5515.7454.8962.975.53055.74
R: soil(water) acidity(pH) value3.412.3437.8776.5932.76048.51
D: soil granulometric value1.714.8983.440.4228.93043.4
H: organic matter content value7.2375.7435.3100081.7
Table 7. The species composition of macrophytes of the littoral of Lake Piaseczno in 2007 and 2018 (EM, emerging macrophytes; SM, submerged macrophytes; FM, floating macrophytes; PM, pleuston macrophytes).
CLASSMAGNOLIOPSIDA20072018Group
SectorsSectors
FamiliesSpeciesPFRRRAFRPFRRRAFR
AsteraceaeBidens tripartita ++ EM
BoraginaceaeMyosotis palustris+ + EM
LamiaceaeLycopus europaeus++ ++ EM
Mentha aquatica + EM
Scutellaria galericulata+ + EM
LentibulariaceaeUtricularia vulgaris++++++++PM
LythraceaeLythrum salicaria+ + EM
NymphaeaceaeNymphea alba+ + FM
PlantaginaceaeRumex hydrolapathum+ + EM
PrimulaceaeLysymachia thyrsiflora+ + EM
RubiaceaeGalium palustre + EM
CLASSLILIOPSIDA20072018Group
SectorsSectors
FamiliesSpeciesPFRRRAFRPFRRRAFR
AlismataceaeAlisma plantago-aquatica++ ++ EM
AraceaeCalla palustris + EM
Lemna minor +++PM
CeratophyllaceaeCeratophyllum demersum++++++++SM
CharaceaeChara fragilis ++++SM
Chara delicatula++ SM
Chara globularis+ ++ SM
Nitella flexilis + +SM
Nitellopsis obtusae ++++SM
CyperaceaeCarex pseudocyperus + EM
Carex vesicaria + EM
Elocharis palustris +++ +++EM
Schoenoplectus lacustris ++ EM
Scirpus sylvaticus ++EM
HoloragaceaeMyriophyllum alternifolium++++++++SM
HydrocharitaceaeElodea canadensis+ +++ ++SM
IridaceaeIris pseudacorus + EM
JuncaceaeJuncus articulatus ++ ++ EM
PoaceaePhragmites australis++++++++EM
PotamogetonaceaePotamogeton crispus +++SM
Potamogeton lucens+ ++ +SM
Potamogeton praelongus+ + SM
TyphaceaeTypha angustifolia+++ +++ EM
CLASSEQIUSETOPSIDA20072018Group
SectorsSectors
FamiliesSpeciesPFRRRAFRPFRRRAFR
EquisetaceaeEquisetum fluviatile + EM
CLASSPOLIPODIOPSIDA20072018Group
SectorsSectors
FamiliesSpeciesPFRRRAFRPFRRRAFR
ThelypteridaceaeThelypteris palustris+ + EM
CLASSBRYOPSIDA20072018Group
SectorsSectors
FamiliesSpeciesPFRRRAFRPFRRRAFR
FontinalaceaeFontinalis antipyretica +SM
TOTAL37191099261614144
Table 8. The Jaccard’s species similarity coefficient values for macrophytes for sectors of the littoral of Lake Piaseczno in 2007 and 2018 (extreme values are marked with colours: yellow, min; orange, max).
20072018
PFR–RR–RARA–FRPFR–RR–RARA–FR
0.380.580.630.330.620.64
PFR–RAR–FR PFR–RAR–FR
0.360.38 0.30.45
PFR–FR PFR–FR
0.38 0.26
2007–2018
PFR–PFRR–RRA–RAFR–FR
0.60.60.530.88
Table 9. The characteristics of particular groups of macrophytes of the littoral of Lake Piaseczno (EM, emerging macrophytes; SM, submerged macrophytes; FM, floating macrophytes; PM, pleuston macrophytes; Ph. aust., Phragmites australis, Ch. frag., Chara fragilis, Myr. alter., Myriophyllum alternifolium, Elod. can., Elodea canadensis).
Properties of Groups of Macrophytes of the LittoralSectors
PFRRRAFR
20072018200720182007201820072018
Emerging Macrophytes (EM)
Number of species717483533
Range: depth (m)1.31.41.21.21.21.31.31.3
Density (ind·m−2)4852505320243037
Biomass of emerging macrophytes (g·m−2)312345.2202.423784.896.579.5107
Species dominant in biomassPh. aust.Ph. aust.Ph. aust.Ph. aust.Ph. aust.Ph. aust.Ph. aust.Ph. aust.
Submerged Macrophytes (SM)
Number of species57757689
Range: depth (m)6.26.756.15.36.55.25.5
Biomass of emerging macrophytes (g·m−2)67.3108.699.8298.9216.4270.9208.2214.3
Species dominant in biomassCh. frag.Ch. frag.Myr. alter.Myr. alter.Myr. alter.Myr. alter.Elod. can.Myr. alter.
Number of species of the remaining groups (PM+ FM)01 + 1727222
Width of the reed belt (m)88102.11539.7210.858.59.03

