Constructing the Ecological Security Pattern for Sponge City: A Case Study in Zhengzhou, China


1
State Key Laboratory of Urban and Regional Ecology, Research Center for Eco-Environmental Sciences, Chinese Academy of Sciences, Beijing 100085, China
2
College of Resources and Environment, University of Chinese Academy of Sciences, Beijing 100049, China
*
Author to whom correspondence should be addressed.
Water 2019, 11(2), 284; https://doi.org/10.3390/w11020284
Submission received: 20 December 2018
/
Revised: 28 January 2019
/
Accepted: 2 February 2019
/
Published: 6 February 2019
(This article belongs to the Section Water Resources Management, Policy and Governance)
Abstract
:Waterlogging is becoming a severe and universal phenomenon in China, so the construction of sponge cities is proposed to address urban water problems abiding by the overall principles of ecological priority and low-impact development. The ecological security pattern (ESP) is an effective way to balance rapid urbanization and ecological protection. Taking Zhengzhou as an example, this study, performed a geographic information system (GIS) modeling, which constructed a targeted ESP for the construction of a sponge city based on comprehensive analysis of multi-factor water ecological sensitivity. Compared to previous studies of ESP, some improvements were made in the identification method of ecological sources, corridors, and nodes. By analyzing the ESP, the study divided the whole city into different construction zone. Through different protection and planning strategies for these areas, the integration and connectivity of the ecological sources can be improved, and thus, urban ecological security can be improved. The ESP for sponge city is a relatively more systematic and scientific way to guide the construction of a sponge city, and can be used for reference to other cities in the process of sponge city construction.
1. Introduction
With the advance of rapid urbanization, natural landscapes were replaced mainly by impervious surfaces [1], which induced numerous ecological and environmental issues. As a result, the capacity of surfaces for floodwater discharge and storage was reduced significantly. The original processes of the natural water cycle, such as rainfall interception, infiltration, and evaporation, were hampered, which caused a series of urban flood management issues: Frequent flooding, water environment deterioration, and serious water shortages [2,3,4]. The urban waterlogging brought about by these water problems is a systematic and integrated problem, and a comprehensive solution is needed [5,6].
The limitations of any single structural flood-control technology are becoming gradually recognized around the world. It became increasingly important for flood control and disaster reduction to rationally plan regional water networks, such as rivers and lakes, that can fully perform the hydrological regulatory functions of natural ecosystems [6,7]. The United States was one of the earliest countries to implement rain flood regulation, and has imposed the “flood detention on the spot” policy for all new development zones since the 1980s [8]. The best management practice (BMP) system [9,10], low-impact development (LID) system [11,12] and green infrastructure (GI) [13] were presented purposing to control runoff at the source by natural hydrological methods with the help of landscape elements on site [14]. Britain later developed “sustainable urban drainage systems (SUDS)” based on LID system in the late 1980s [15]. In the 1990s, Australia and Canada established the water sensitive urban design (WSUD) system with the whole urban water cycle as the core [16,17]. The utilization of urban rainwater in China started relatively later. In April 2012, the concept of the “sponge city” was first proposed in China to address urban water problems, abiding by the overall principles of ecological priority and low-impact development [18]. Unlike relating term “sponge” to the adsorption of a city’s population [19], the term “sponge city” describes a city with good “elasticity” in adapting to environmental change and disasters for water, where rainwater can be absorbed, stored, permeated, and purified when it rains and be released when needed. In November 2014, the Ministry of Housing and Urban-Rural Development of China issued the “Technical guidelines for the construction of sponge city rainwater system with LID (for Trial Implementation)” (hereinafter referred to as “Guidelines”) [20]. The Guidelines formally put forward the concept of the construction of a sponge city and set up 16 pilot cities for sponge city construction. Since then, China began to carry out multidimensional exploration of the related construction of a sponge city at the national and urban scales and research on the sponge city theory accelerated rapidly [21,22,23,24]. With the deepening of theoretical research, an increasing number of scholars [25] began to explore the practices of constructing a sponge city. However, most of those practices focused on the technical details of districts, blocks, communities, and pavements, and have a lack of comprehensive consideration of a whole urban system, let alone macro systems [26]. Meanwhile, several scholars [27,28] gradually focused on how to protect natural elements with the capacity of storing water and restore damaged freshwater systems. These scholars also believe that the construction of a sponge city needs to focus on the spatial pattern of the freshwater system in the region or the watershed at the macro scale, that is, focus on an analysis of the overall ecological security pattern (ESP) [5].
ESP represents an effective way of protecting ecological security and is becoming increasingly important in reconciling rapid urbanization with ecological protection in urban planning. ESP is composed of certain key parts of landscape, and their positions and spatial connections. Through the construction of an ESP, ecological functions can be ensured to embody with the least possible land use and the most effective outcomes [29]. Since the 1990s, the concept of ESP gradually emerged and attracted widespread attention, and great deal of research on theory, methods, construction indicators, and ways of implementation were carried out [30,31,32]. There are also corresponding ecological security patterns proposed for freshwater ecosystems. Due to the characteristics of flow and circulation of freshwater ecosystems, the influencing factors of ecosystem health are not only the water itself, but also land use and the various types of landscape elements in watersheds, so water-oriented ESP is considered to be an important approach for effectively solving regional water security problems. However, current research on water-oriented ESP is lacking.
ESP is widely defined as the specific pattern comprising the vital ecological components, patches, and corridors of an ecosystem with critical significance in controlling the ecological processes, protecting the structures and functions of the ecosystem, and controlling regional ecological and environmental problems [29]. ESP construction is an important approach for protecting urban ecological security and achieving urban sustainable development [33,34,35,36], and the “source-corridor-node” approach became the basic mode of construction for a regional ESP in recent years [37,38].
In the “source-corridor-node” approach, source refers to the key habitat patches and plays a decisive role in regional ecological process and function. The source identification is the foundation of the ESP, and it is performed primarily in two ways: One is the direct selection of the core area of a nature reserve and other important ecological land; the other is to build a comprehensive evaluation index system based on ecological sensitivity or importance. The corridor refers to the belt area that has important connectivity to the ecological network system of material, energy, and information flow and is especially important for providing passage for animal migration [39]. The minimum cumulative resistance (MCR) model originated from the research of species’ diffusion processes [40], but the application of MCR is not limited owing to its simple data structure, fast algorithms, and visual results [41]. In recent years, MCR became the main method for identifying an ecological corridor, and the proper setting of the resistance surface is critical for accurate identification of the corridor. Taking source size, distance, and the features of the landscape interface into consideration, this model calculates the cost of species moving from the source to the destination and then collects the lowest resistance of the adjacent two “sources” and the most accessible low-resistance channel as the connected corridors between different safe ecological sources. The node generally refers to the important strategic regions that affect ecological security, such as intersections of corridors.
The most commonly used method for constructing the “source-corridor-node” mode is based on the cost-distance spatial analysis method [42] using geographic information system (GIS), and this approach was used for numerous urban planning applications in many cities [33]. In this study, we took Zhengzhou as an example, explored how to construct the ESP for sponge city based on GIS modeling, combined with insights from previous research on the theory and practice of sponge cities, and expected to provide a way for constructing a water-oriented ESP.
2. Materials and Methods
2.1. Study Area
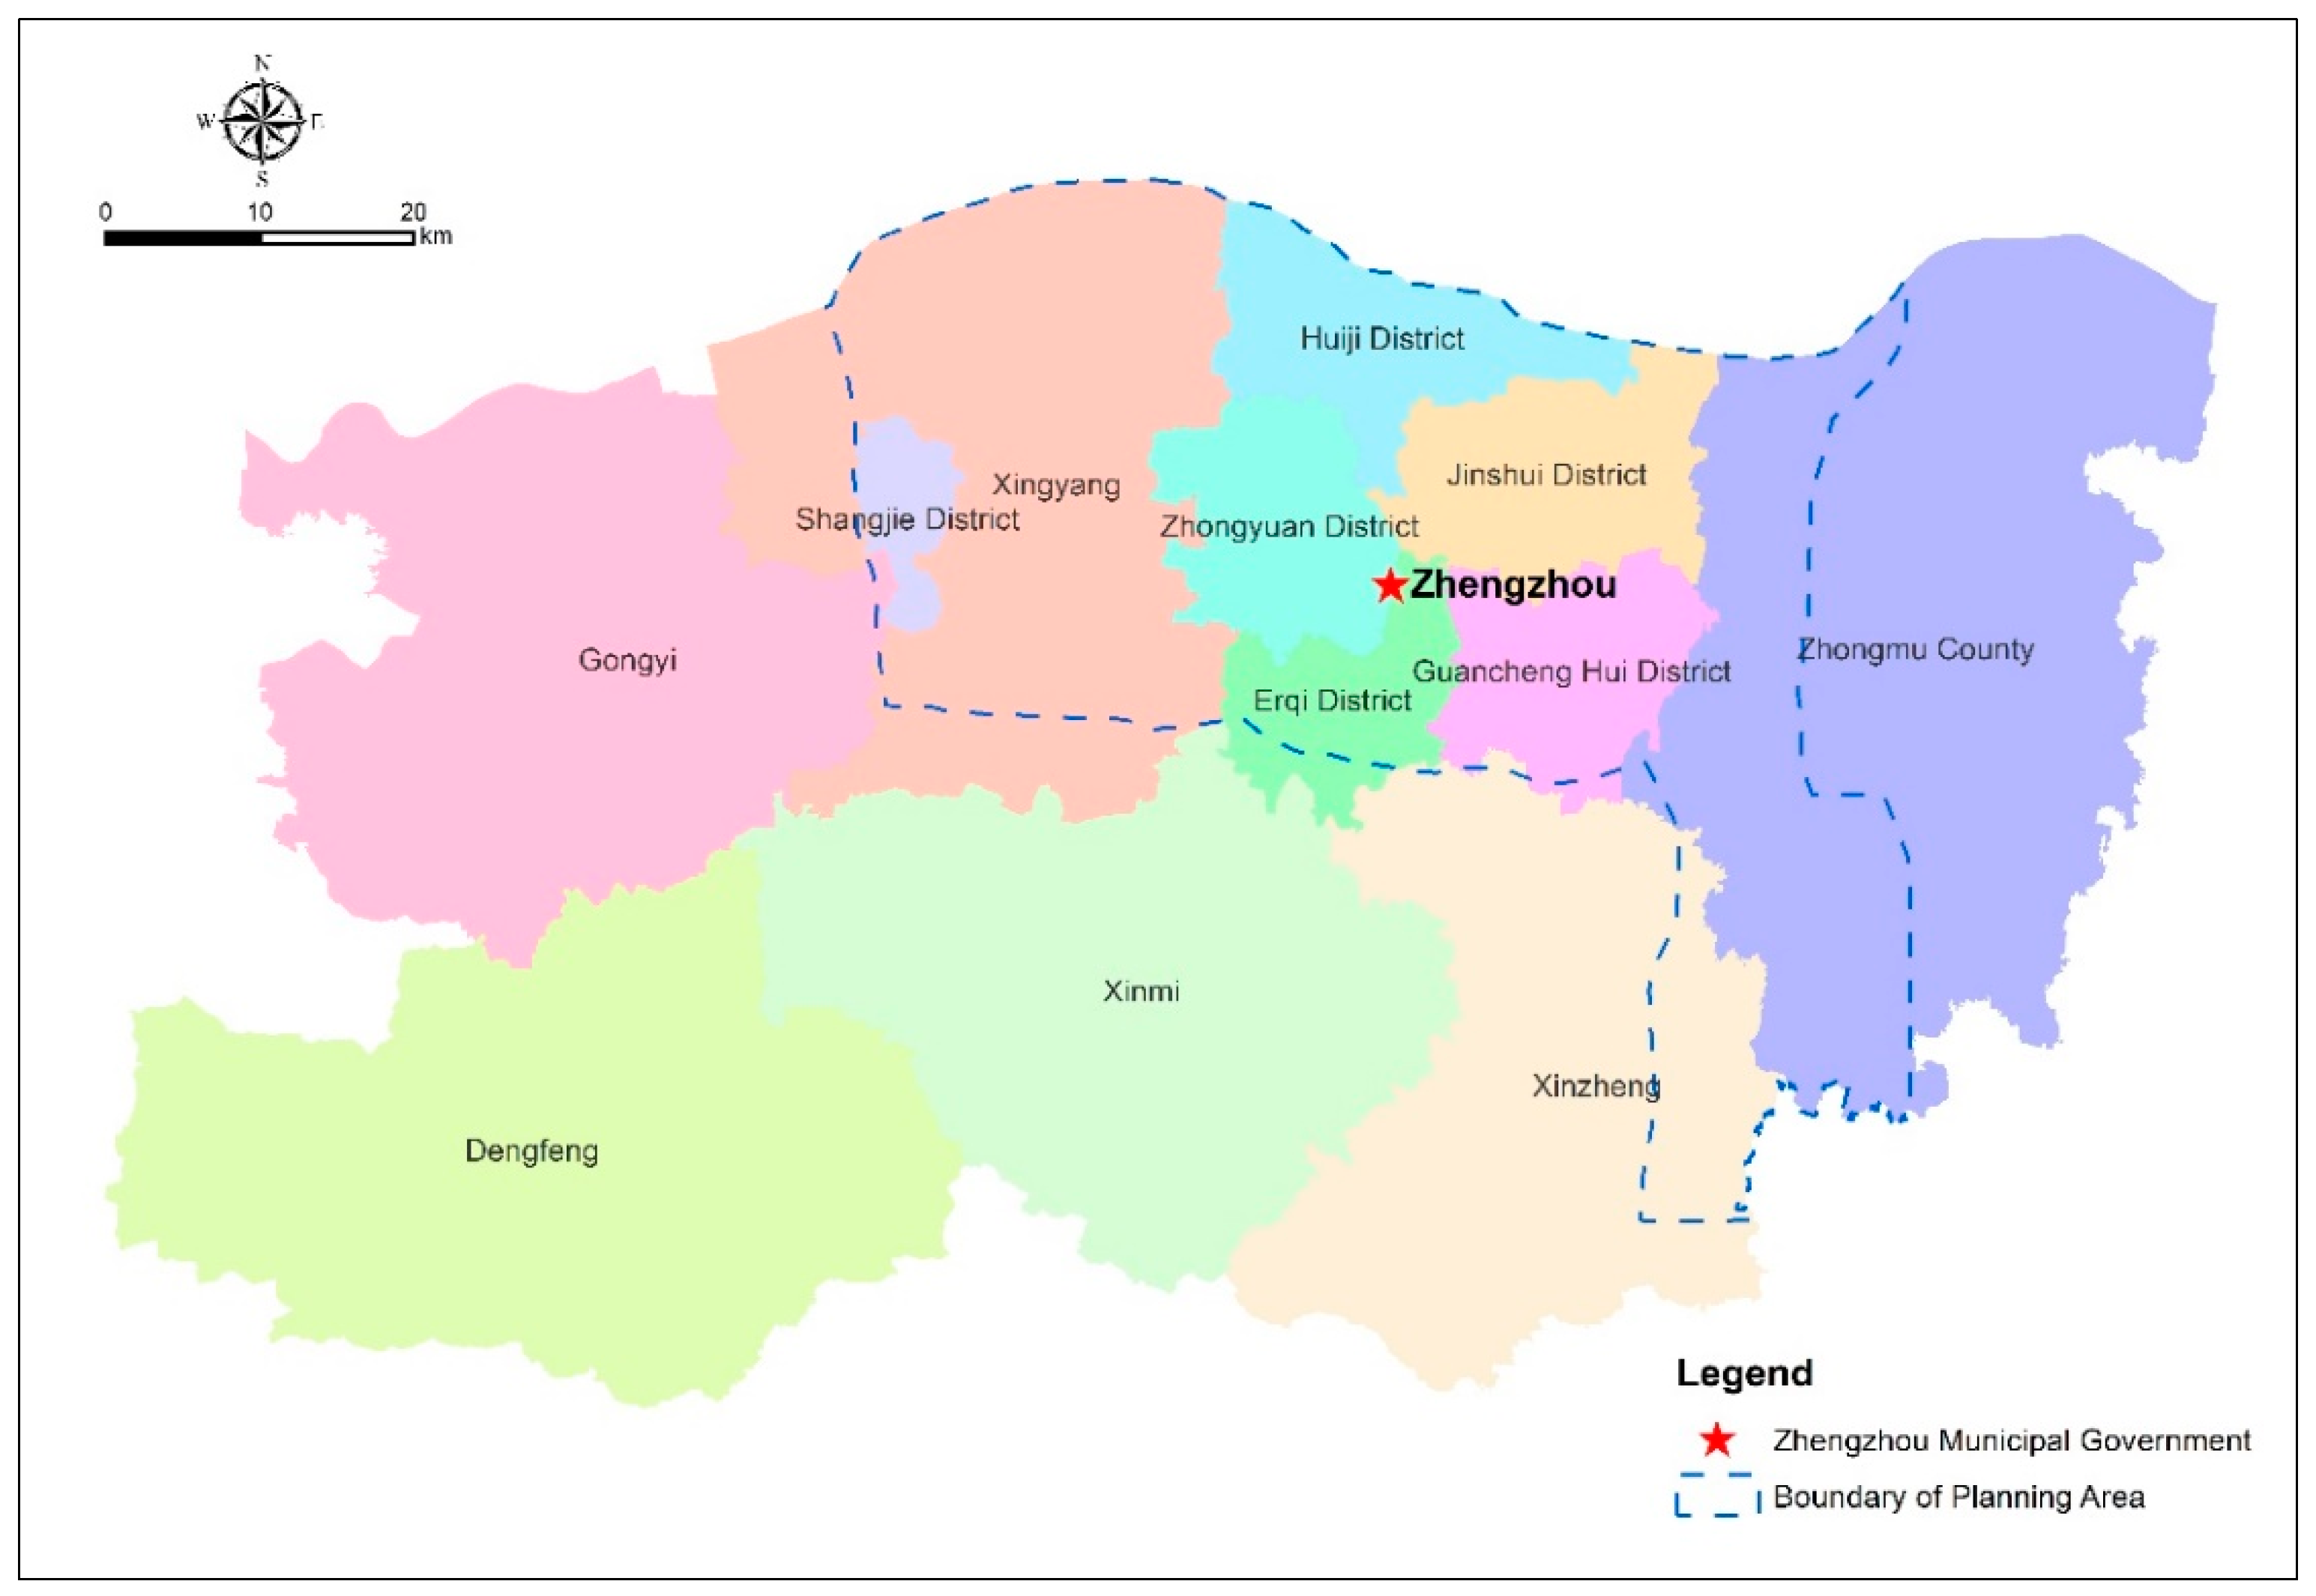
Zhengzhou is the capital of Henan Province, one of China’s eight ancient capitals. The city is located between east longitude 112°42′–114°14′ and north latitude 34°16′–34°58′ and has jurisdiction over six municipal districts, five county-level cities and one county. The total area of Zhengzhou is 7446.3 km2. Zhengzhou is located in the southern part of the North China Plain and crosses China’s second and third geomorphic steps. The southwestern Song Mountain belongs to the second-level geomorphic front edge, whereas the eastern plains belong to the third level of landforms with low hilly terrain [43]. The city locates in a temperate continental monsoon climate zone with four distinct seasons and its average annual precipitation is 641 mm, 74% of which falls during July to September. The average annual sunshine hour is 2400 h and the average annual temperature is 14 °C. The soil type contains moisture soil, cinnamon soil, and brown soil. The distribution of rainfall in Zhengzhou is uneven and the city has a large population and scarce water resources. In addition, the proportion of impermeable surfaces has increased due to rapid urbanization and the corresponding drainage facilities are not yet complete. As a result, when Zhengzhou experiences heavy rains, waterlogging becomes severe, and numerous security problems arise [44].
The municipal government believes that the construction of a sponge city is an effective way to solve water shortage and waterlogging in Zhengzhou. In June 2016, according to the provincial government document “views on promoting the implementation of the sponge city”, Zhengzhou outlined a planning area of 2351.5 km2 for sponge city construction (Figure 1). Our study sets the entire city of Zhengzhou as the research area, building a GIS-based modeling to construct an ESP for a sponge city, and providing sponge planning area construction guidance according to the security pattern.
2.2. Approaches to Build ESP for Sponge City
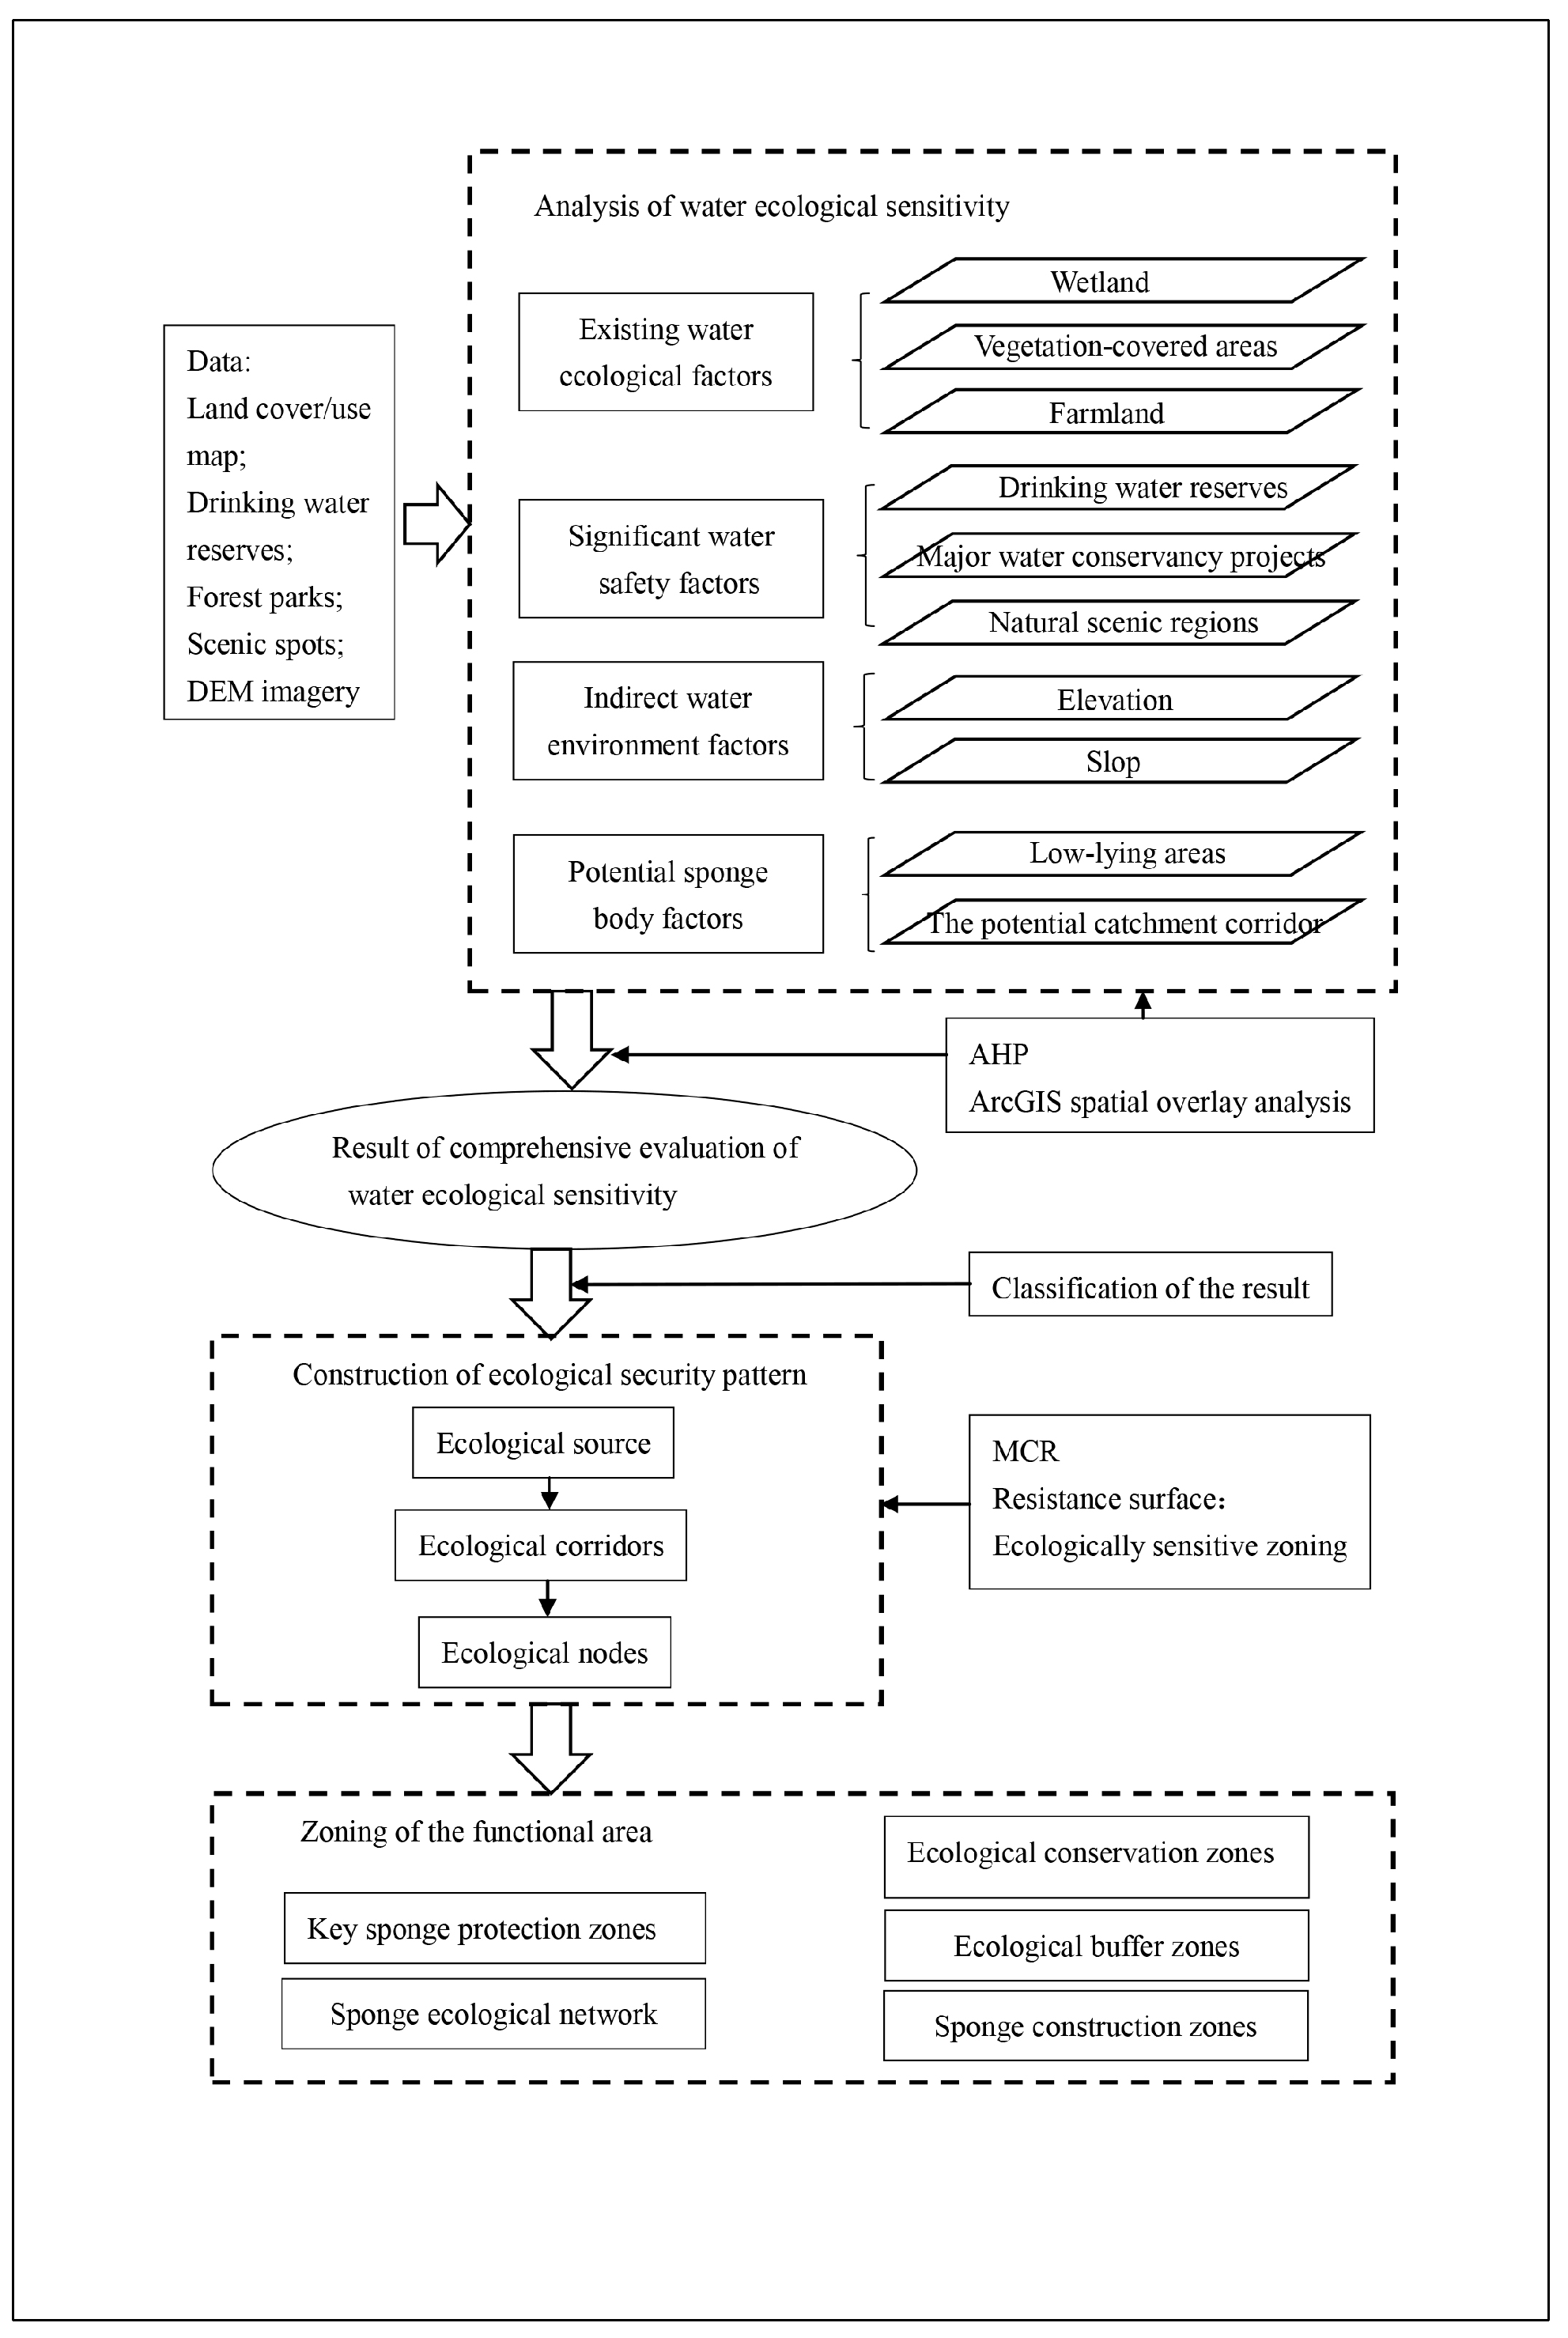
The “Guidelines” require in the overall planning of the sponge city that the land layout should minimize the area of impervious surfaces, protect the ecological sensitive areas, and identify the key construction area [26]. The technical route in this study for developing the ESP for a sponge city was divided into three steps: (1) Using analytic hierarchy process (AHP) to analyze water ecological sensitivity; (2) Using GIS and MCR model to construct the ESP; (3) Zoning the functional area. A flowchart for the construction of the ESP for sponge city is shown in Figure 2. The concrete realizing process is described in the following chapters.
2.3. Analysis of Water Ecological Sensitivity
The main purpose of water ecological sensitivity analysis is to elucidate the ecological background related to an urban water environment, to extract the ecological source, and to set a resistance value based on the analysis results. AHP is a comprehensive evaluation method combining qualitative and quantitative analyses and can provide a scientific basis for selecting the best scheme through a multilevel analysis of a decomposed complex problem [45]. The procedure for using AHP is generally divided into five steps: (1) Modeling the problem as a hierarchy; (2) Establishing priorities among the elements; (3) Synthesizing the judgements to get a set of overall priorities for the hierarchy; (4) Checking the consistency of the judgements; (5) Making decision based on the results of the first four steps [46].
As shown in the dotted box in the upper right corner of Figure 2, this study constructed a comprehensive evaluation index system of water ecological sensitivity using AHP. The AHP model contains a target layer, a criterion layer, and an index layer. The target is to analyze water ecological sensitivity. First, we built four classification rules for the criterion layer: Existing water ecological factors, significant water safety factors, indirect water environment factors, and potential sponge body factors. Then, the index layer comes to: Existing water ecological factors, which primarily contain all types of wetlands, such as rivers and lakes, located in and around the city, and vegetation-covered areas and farmland [6]. Significant water safety factors include major water conservancy projects, drinking water reserves, and natural scenic regions, which are directly related to the lives of urban residents. Indirect water environment factors cover the environmental factors related to urban water ecology indirectly, including elevation and slope. Potential sponge body factors are the potential catchment corridors and low-lying areas generated by digital elevation model (DEM) data, which are generally highly susceptible to waterlogging.
2.3.1. Hierarchical Model and Weight Calculation
Based on the situation of Zhengzhou, the Delphi method was used to score the importance of each factor. The Delphi method is a structured decision support method and can obtain relatively objective information through independent and repeated subjective judgment of multiple experts in the information collection process [47].
The significant water safety factors were thought to be the most important factors, while the existing water ecological factors were considered somewhat less important. The indirect water environment factors were thought to be slightly more important than the potential sponge body factors. Based on the result of Delphi method, the criterion layer judgment matrix was constructed using AHP [45]:
the consistency of the judgments was checked (CR(A) = 0.037, CR refers to the consistency ratio of a matrix. A comparison matrix is said to be consistent if CR < 0.1) [45], and the weights were obtained using Matlab (version R2016a, MathWorks, Natick, USA): Weight of existing water ecology factors is 0.2746; weight of significant water safety factors is 0.5753; weight of indirect water environment factors is 0.0911; weight of potential sponge body factors is 0.0589. The algorithms of index layer were similar, and the results showed that all the judgment matrixes of single layers were satisfactory (existing water ecological factors: CR = 0.0212 < 0.1; significant water safety factors: CR = 0.0158 < 0.1). The aforementioned calculation programs were repeated to obtain the single-layer importance sorting and the weights, as shown in Table 1.
Consistency test for the total hierarchical model was performed then, with CR = 0.0229 < 0.1, which represents that decisions can be made based on the weight of Table 1.
2.3.2. Integrated Overlay Analysis Based on GIS
The comprehensive analysis of ecological sensitivity mainly used the GIS spatial superposition analysis technique to synthesize the spatial layers of each factor [48]. The software platform was ArcGIS (version 10.2, ESRI, Redlands, USA), and the specific formula applied is as follows:
where is the ecological sensitivity composite index, is the ecological sensitivity grade value of factor i, and is the ecological sensitivity weight of factor i.
2.4. Construction of ESP
2.4.1. Identification of Ecological Source
The ecological sources should be identified through the result of the water eco-sensitivity comprehensive evaluation. In the analysis of the ESP for a sponge city, the ecological source mainly refers to an area that is highly sensitive (more fragile to human activities and environmental change) to the regional water ecology and important to the overall security of the regional ecology. Therefore, we identified a region whose sensitivity was approximately at the top 25% [49] of the total area as the ecological source. Due to the large number and fragmentation of patches, we sought to set up the minimum area threshold according to the quantity of patches and their total area ratio with different minimum area thresholds to balance the number and the total area of patches.
2.4.2. Extraction of Ecological Corridor by MCR Model and Ecological nodes
The ecological corridor areas in our study were extracted using MCR model. Its basic formula is as follows:
where is the minimum cumulative resistance value; is the spatial distance of the species from the source to the landscape unit ; is the resistance value of the landscape unit ; and is the positive correlation between the minimum cumulative resistance and the ecological process.
The ecological nodes were determined according to the corridors, and these constituted the ecological network with the corridor [50].
3. Results
3.1. Individual Layers of Factors Evaluation of Water Ecological Sensitivity
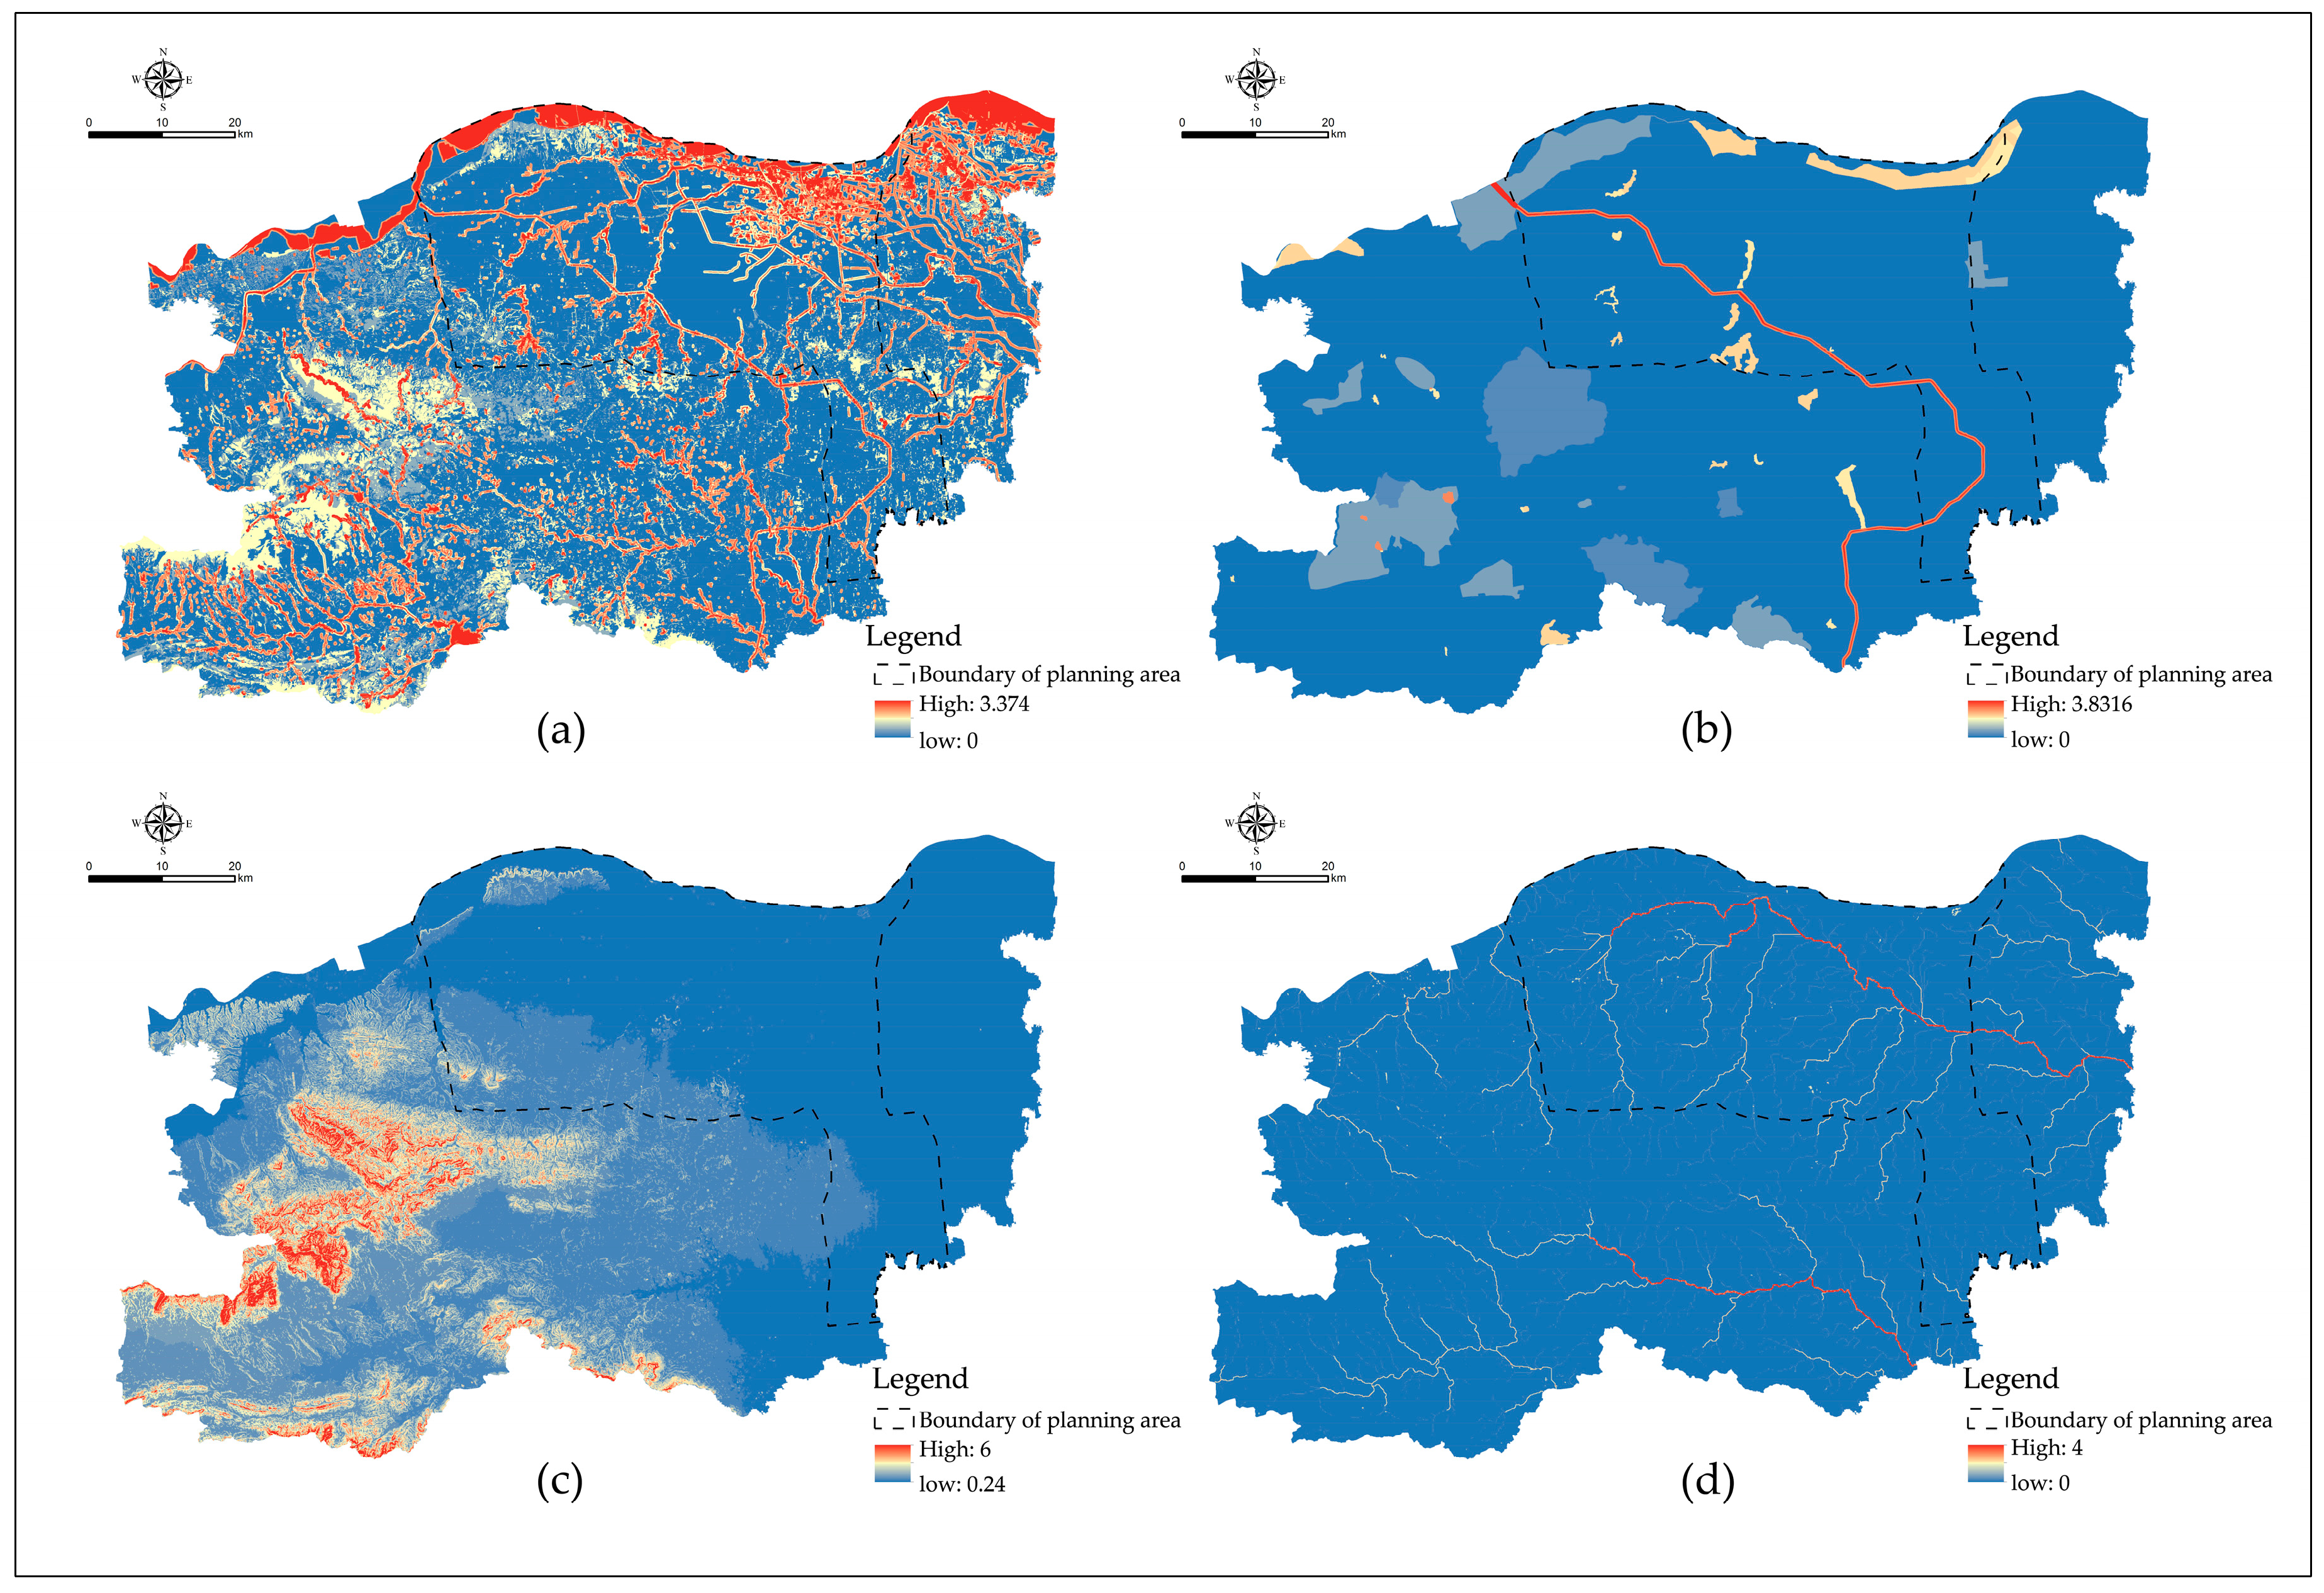
According to data from the Second National Land Survey of Zhengzhou, existing water ecological factors and significant water safety factors were extracted. The corresponding ecological sensitivity grade was set up based on influence on the construction of the sponge city. The results of sensitivity evaluation of existing water ecological factors and significant water safety factors are shown in Figure 3a,b, respectively.
Based on the terrain characteristics, the higher elevation and steeply sloped areas were identified by DEM data. The sensitivity grades of the elevation [51] and slope [52] factors in Zhengzhou were obtained by referring to previous research. Integrating the weights in Table 1, the result of sensitivity evaluation is shown in Figure 3c.
It is required in the “Guidelines” to make full use of urban low-lying areas for sponge city development [26]. The catchment basin and flow network generated through ArcGIS are the main means for constructing a surface hydrological analysis model [53]. The hydrology tool set in the ArcGIS spatial analyst module was used to extract the regional runoff model, the sink, the flow direction, the confluence, and the river network. Then, the Strahler classification method was used to analyze the river network grade. The Strahler classification method is the most common stream ordering method and can be implemented in GIS [54]. Finally, the different tributary grades of the potential catchment corridor and different depths of the low-lying areas [55] were given different sensitivities. The result of sensitivity evaluation is shown in Figure 3d.
3.2. Comprehensive Evaluation of Water Ecological Sensitivity
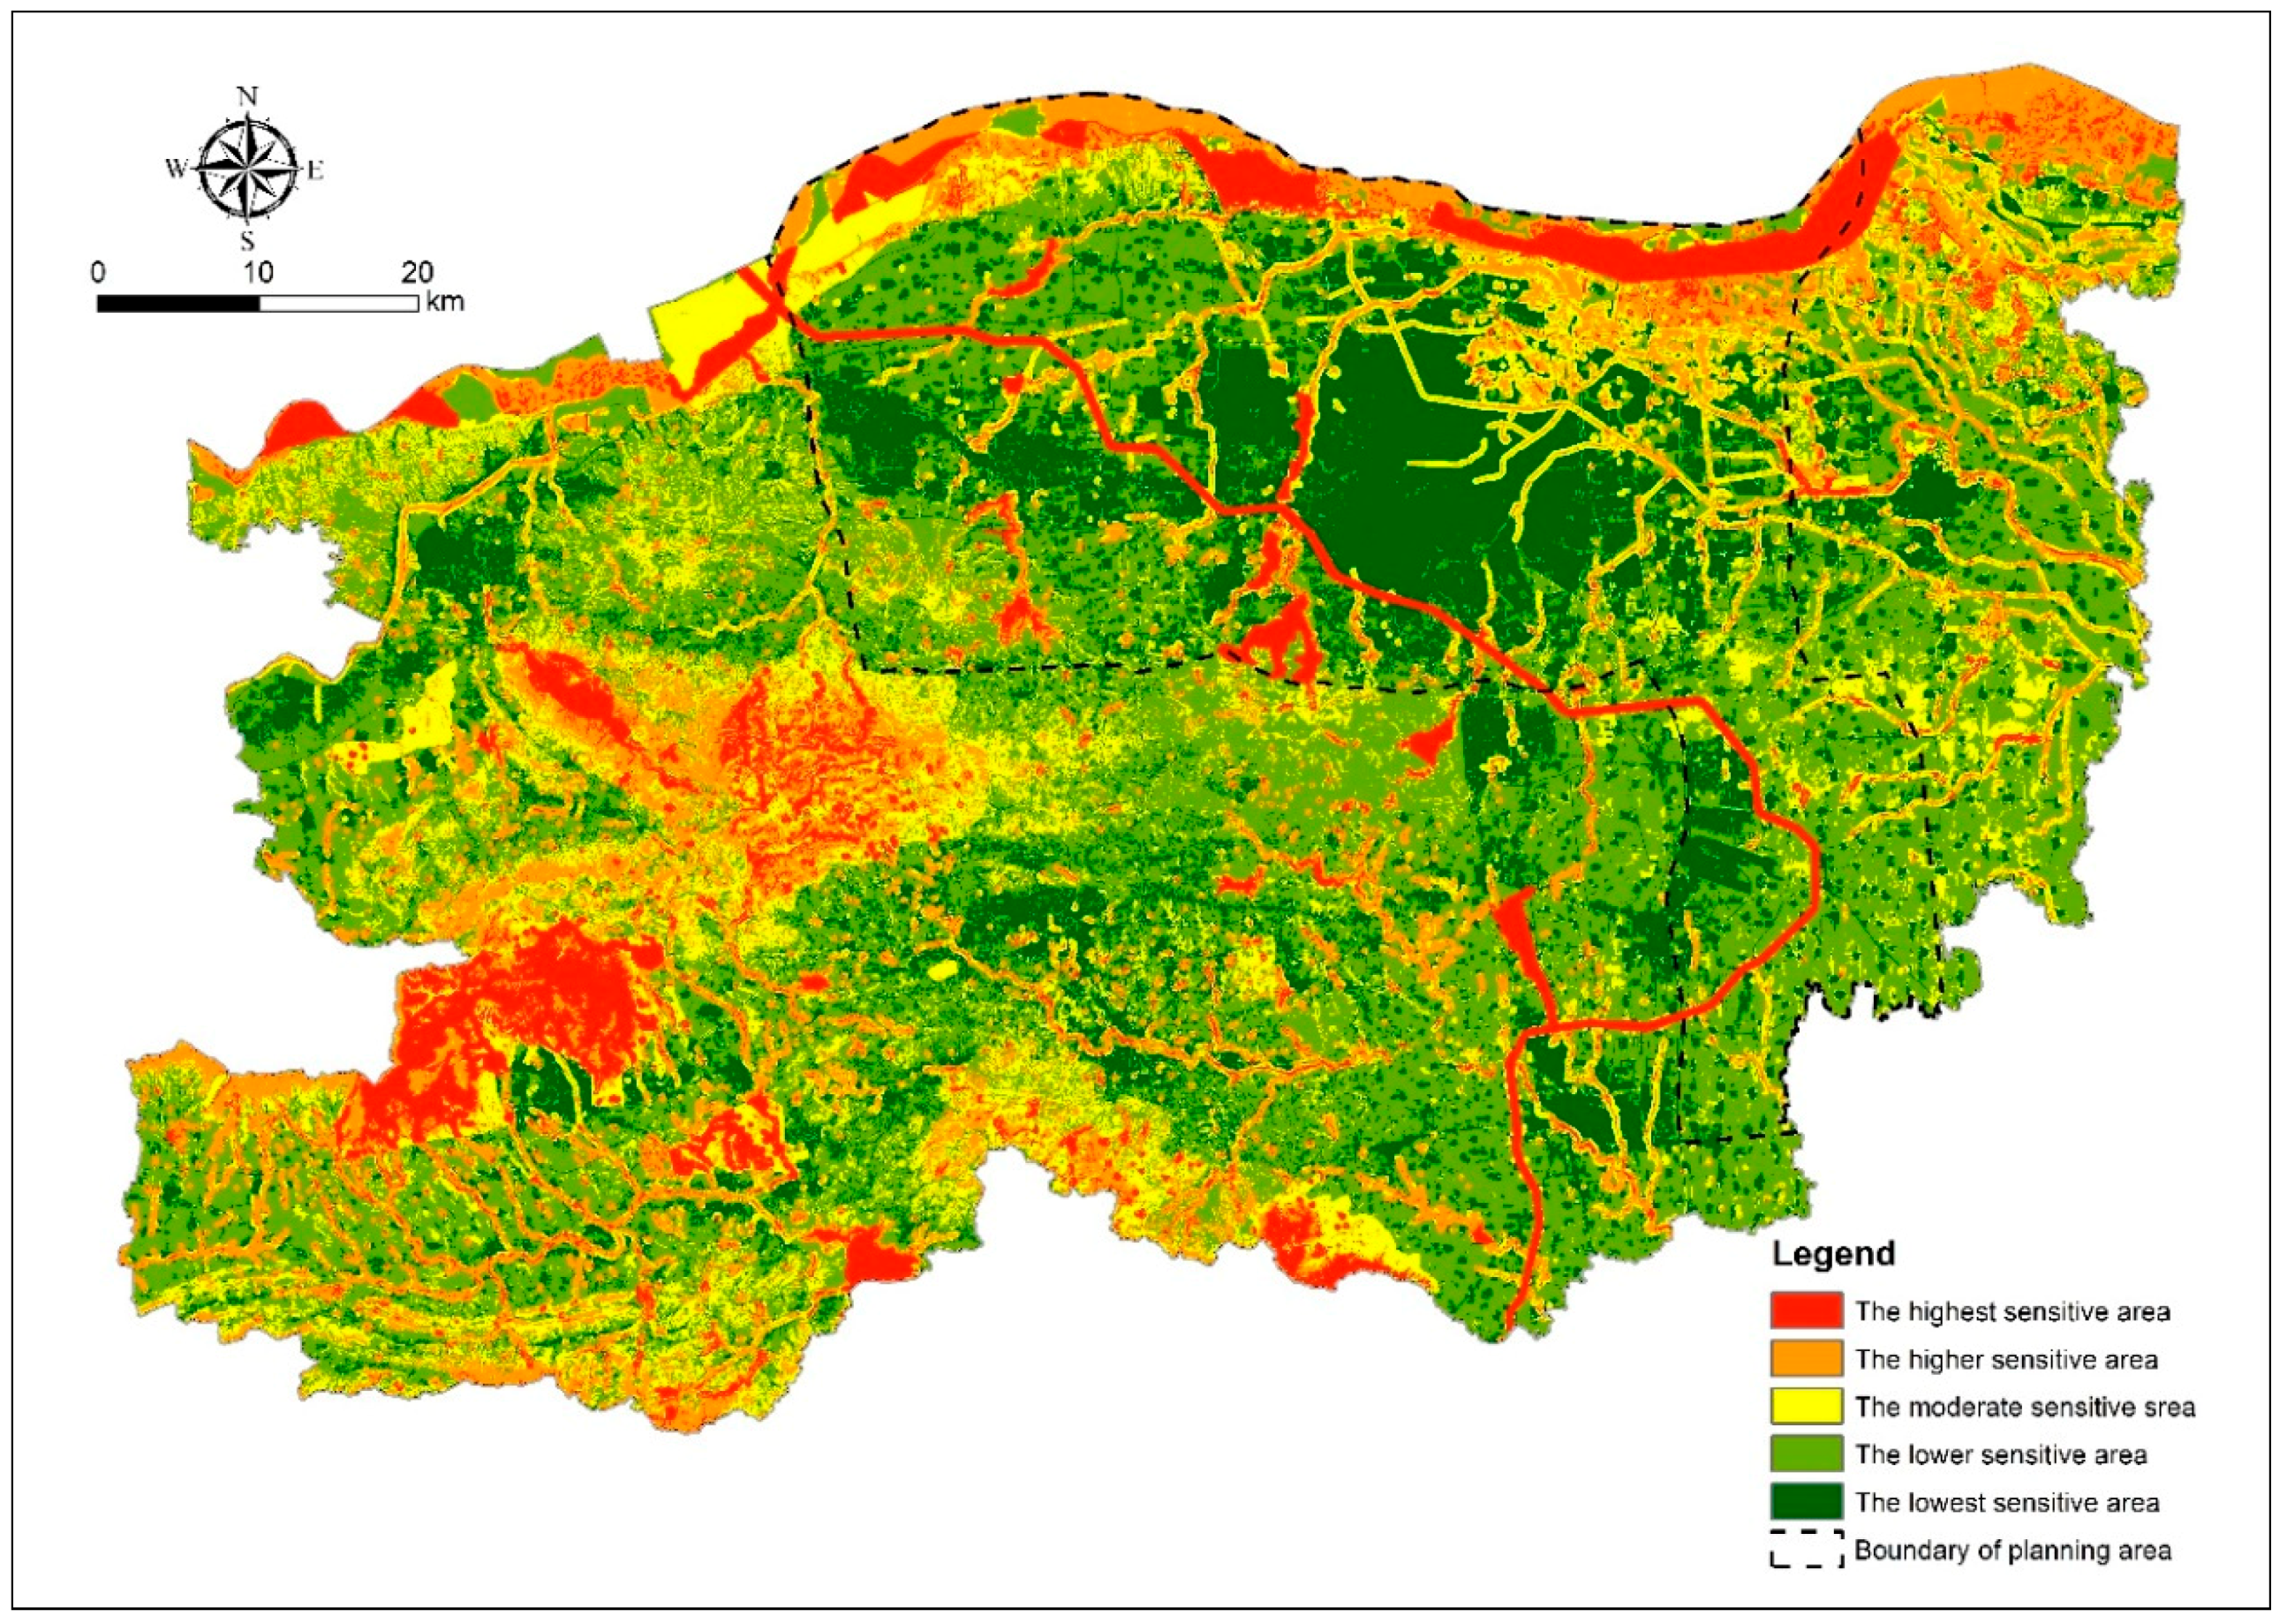
According to the actual situation of the city of Zhengzhou, a hierarchical system of ecological sensitivity in sponge city construction was established. In the case of ecological sensitivity classification, national natural scenic regions covered with vegetation were considered to have the highest ecological sensitivity, and areas without the selected ecological sensitivity factor were considered to have the lowest sensitivity. Therefore, the threshold of the most sensitive area was 0.8996, whereas the threshold of the least sensitive area was 0.1206. The other three areas were divided based on the equal-break method. The use of this partitioning method is helpful in reflecting the spatial uniformity of the “sponge” in different areas of the city. The specific classification is shown in Table 2.
3.3. ESP for The Sponge City
3.3.1. Recognition of Ecological Sources, Corridors, and Nodes
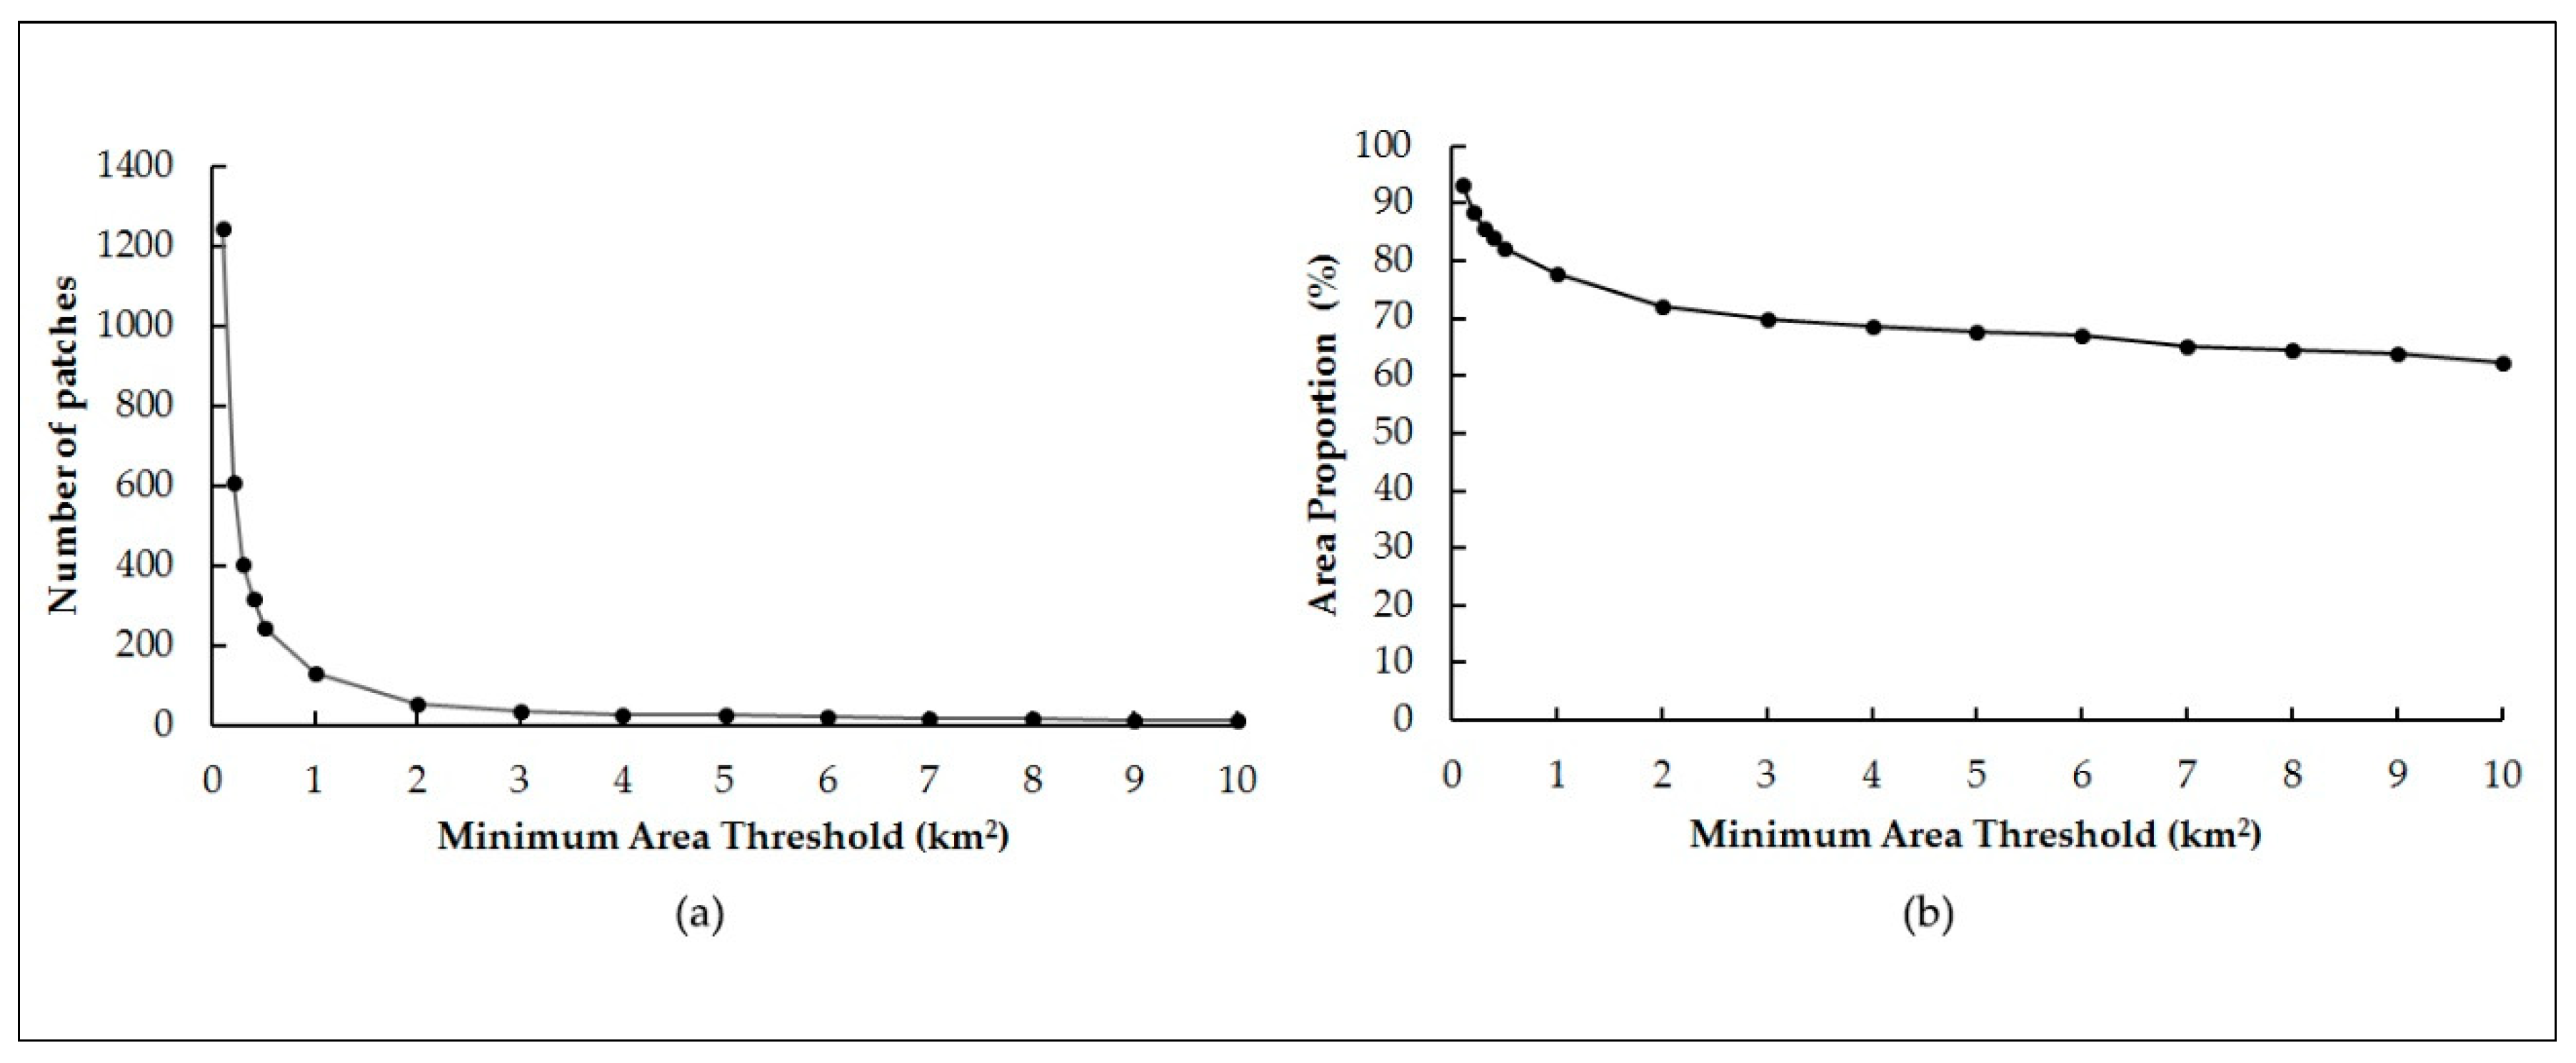
The highest and higher sensitivity areas account for 24.22% of the total area, which were regarded as ecological sources and needed to be carefully conserved and restored during the construction of the sponge city. As shown in Figure 5a,b, both the quantity of patches in the ecological area and their proportion in the selected total area decrease with increasing minimum area threshold. The rate of decrease slows down when the minimum area threshold exceeds 1 km2 and tends to be stable after the minimum area threshold reaches 2 km2. When the minimum area threshold is set to 2 km2, the patches number no more than 100, but the area of ecological land remains greater than 70% (72.27%) of the total selected area. This indicates that, although the number of patches removed is large, the total area they occupied was small, and their influence on the overall pattern of the ecological source was minimal. Therefore, 2 km2 is our determined minimum area threshold, as the rate of decrease slowed beyond this point. The final number of sources identified is 53, and the total area is 1323.67 km2. The distribution of the 53 sources is shown in Figure 6.
Therefore, our study adopted the results of a comprehensive evaluation of water ecological sensitivity to establish the resistance surface. The corridor is required to connect the sources as much as possible, thus setting the highest sensitivity and higher sensitivity regions with the lowest resistance value. The other areas were divided into five grades according to their sensitivity values from high to low. The higher a region’s sensitivity value, the more ecological protection or repair it needs, and thus the lower the resistance value. The specific resistance values are shown in Table 4.
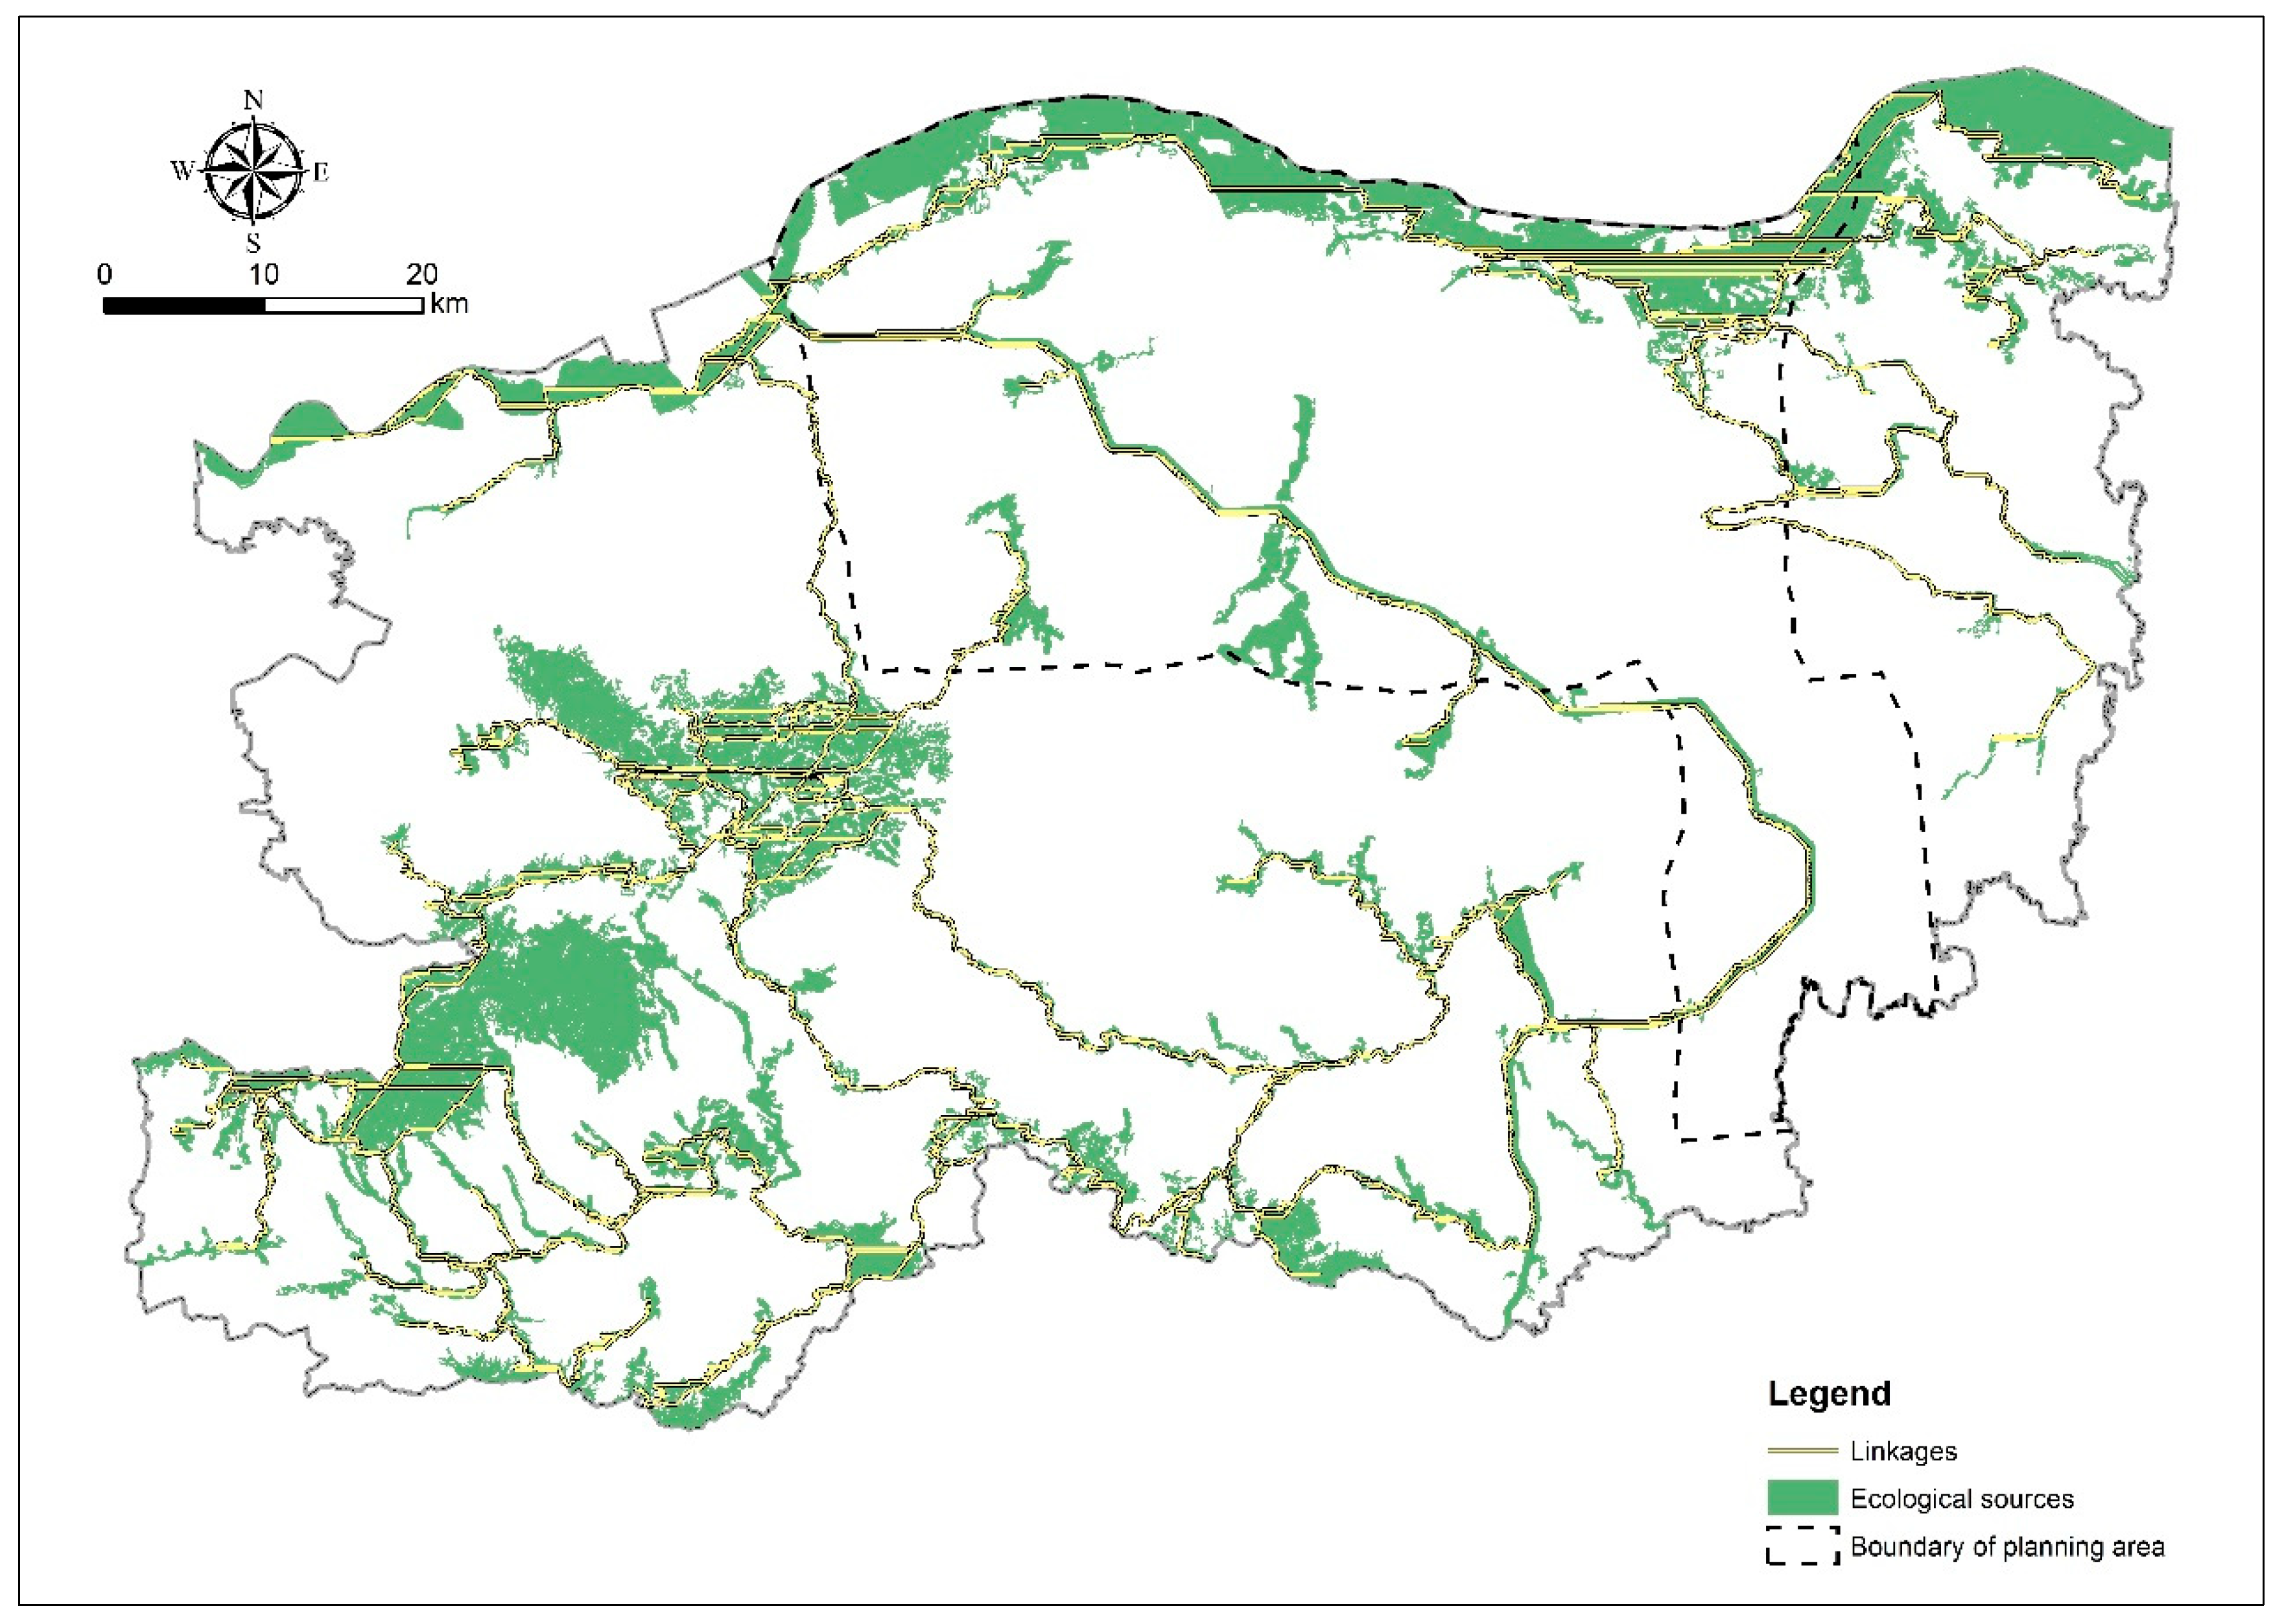
Then the sources were analyzed to generate the cost-distance surface based on the resistance cost surface through the ArcGIS iterator. Further, path analysis was then used to obtain the linkages of least resistance between the sources. As shown in Figure 6, there are a large number of linkages to some sources, indicating that these sources are important ecological corridors connected to other sources. These sources are mainly distributed in three regions: The wetland zone along the Yellow River in the north, the South-to-North Water Diversion Canal ecological zone, and the southwest Mountain-stream corridors.
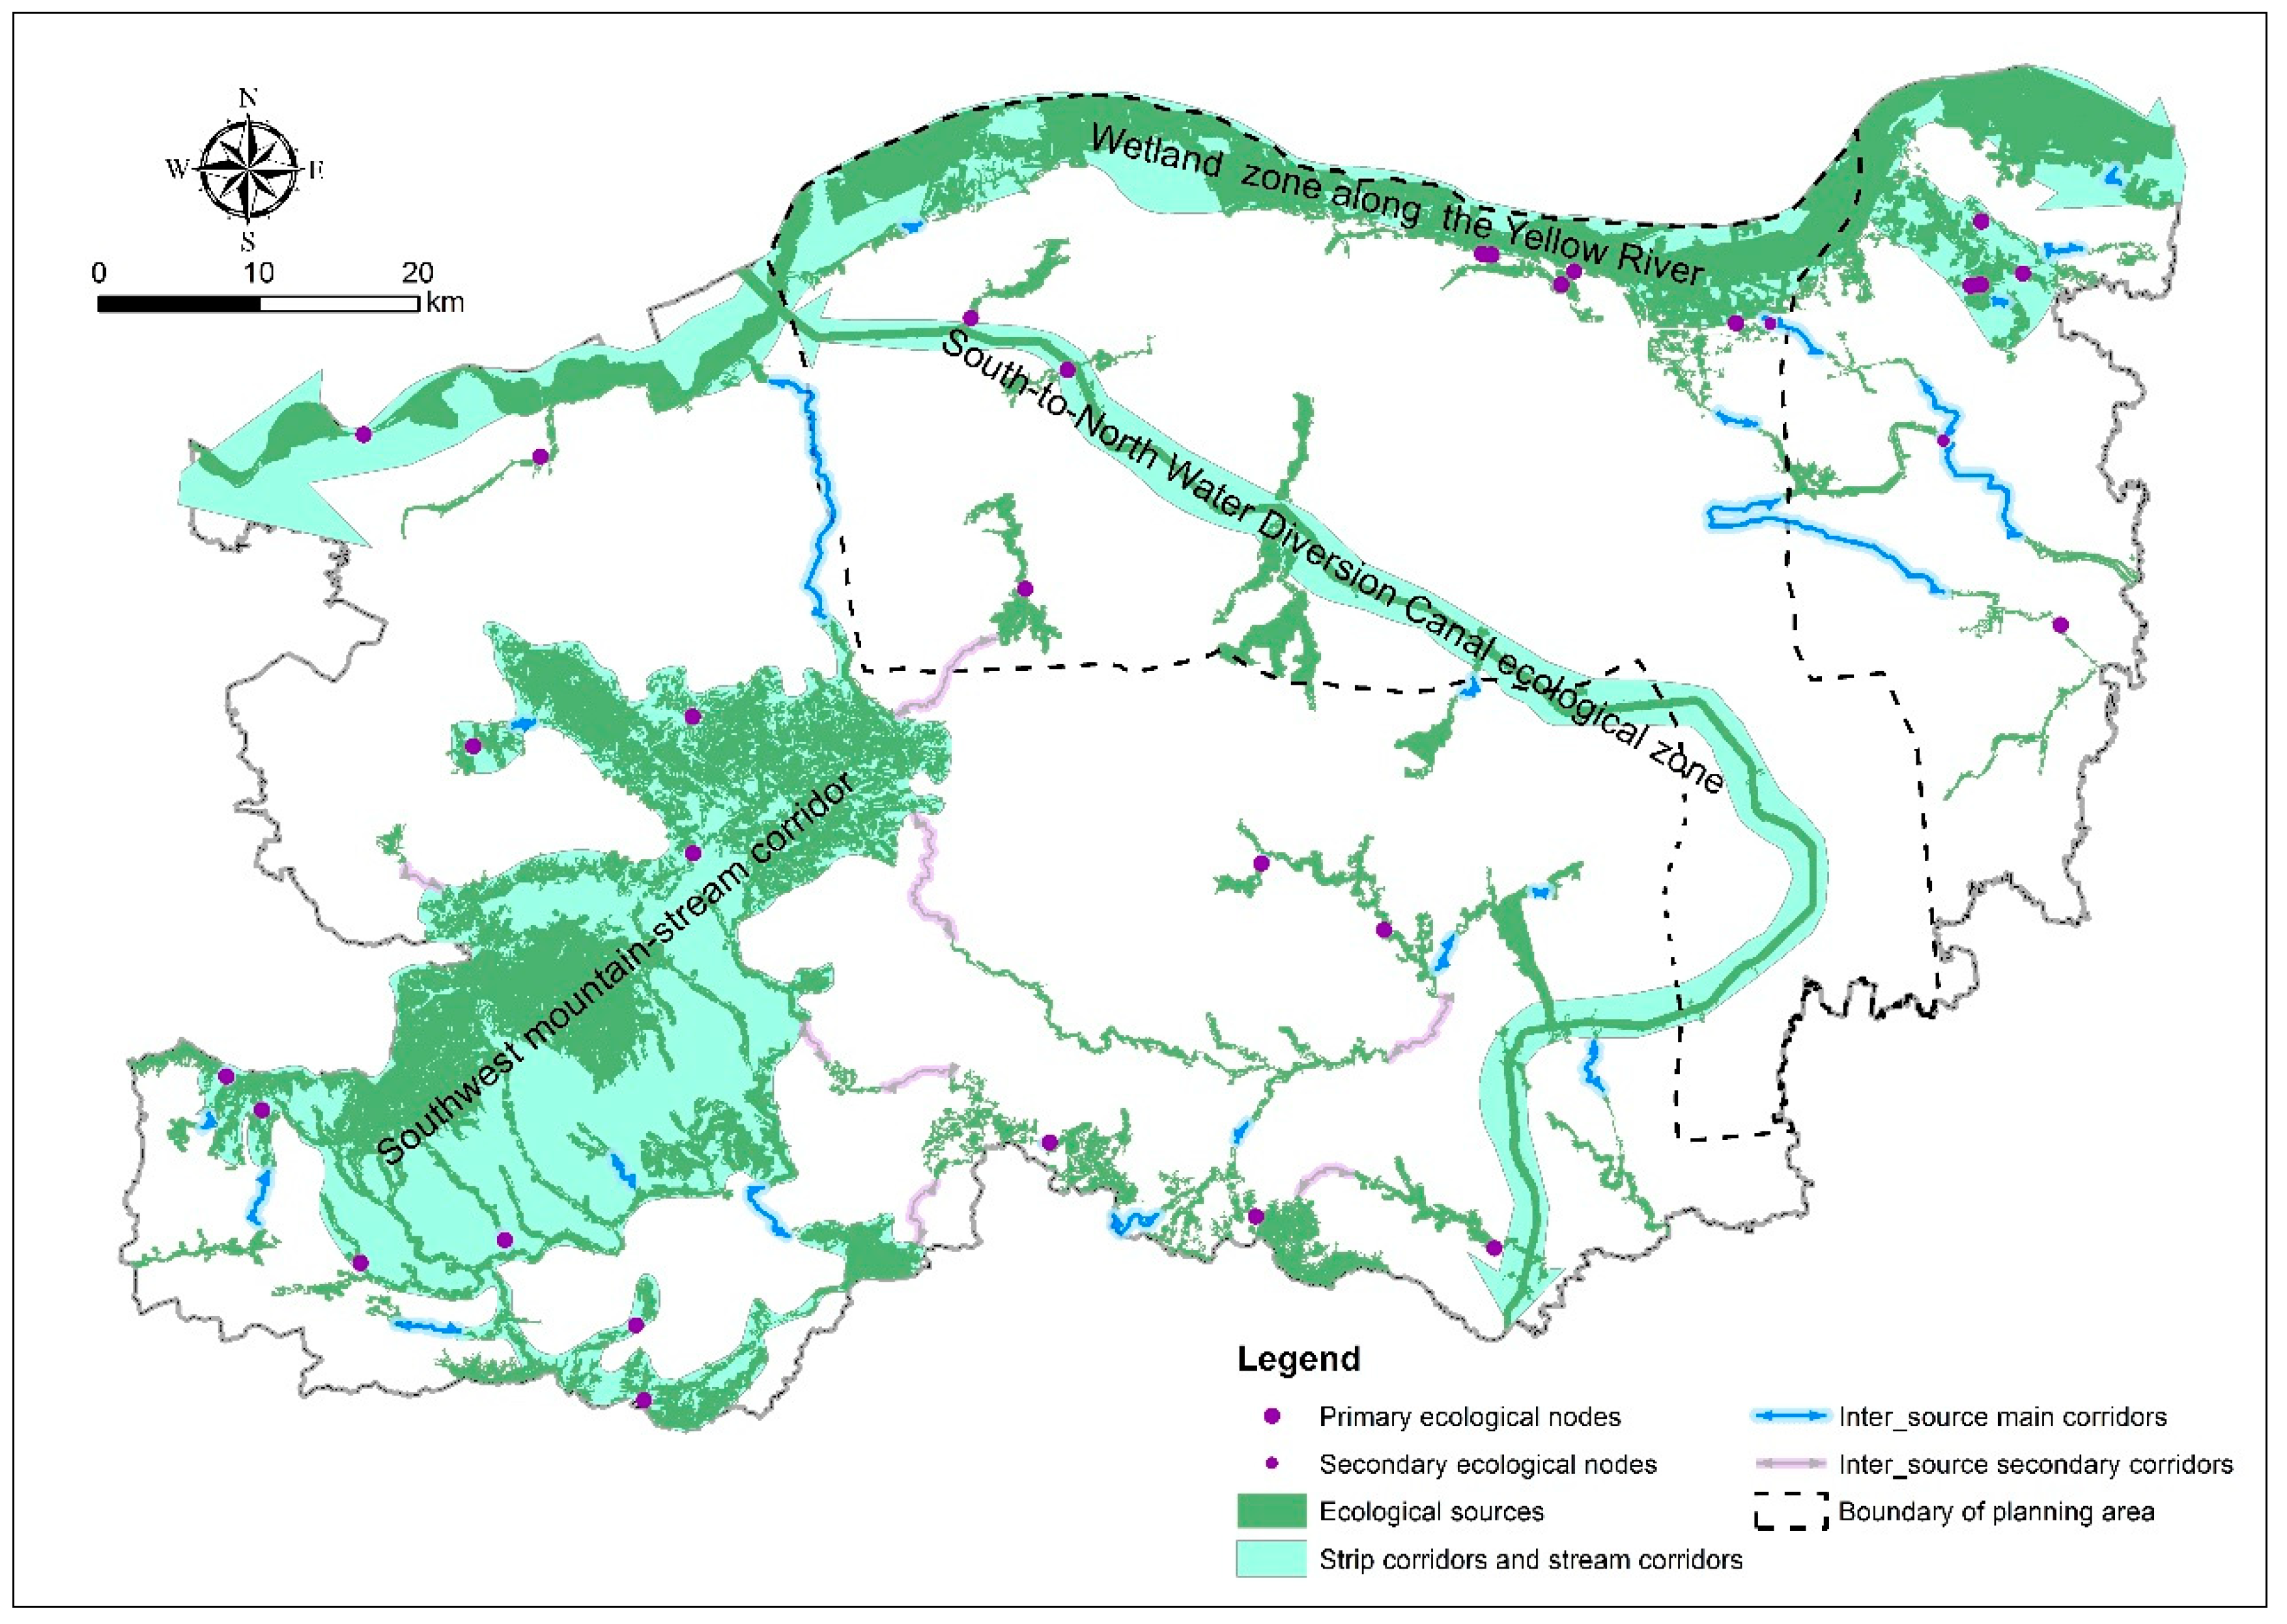
After removing the linkages in the source area, the analysis result was further extracted according to the distance between the sources. The result showed a total corridor length of 18.56 km. These corridors were divided into the main corridor (with smaller resistance value) and a secondary corridor (with larger resistance value) based on the resistance value, as shown in Figure 7.
The important intersections of corridors are the ecological nodes. These ecological nodes were divided into two grades: The primary ecological nodes and the secondary nodes. Primary ecological nodes refer to the middle point of the corridors where the length of the corridor is less than 1 km and the resistance value of the corridor is small, and secondary ecological nodes means intersection of corridors between sources. The total number of nodes is 31, and the distribution is shown in Figure 7.
3.3.2. ESP for Zhengzhou
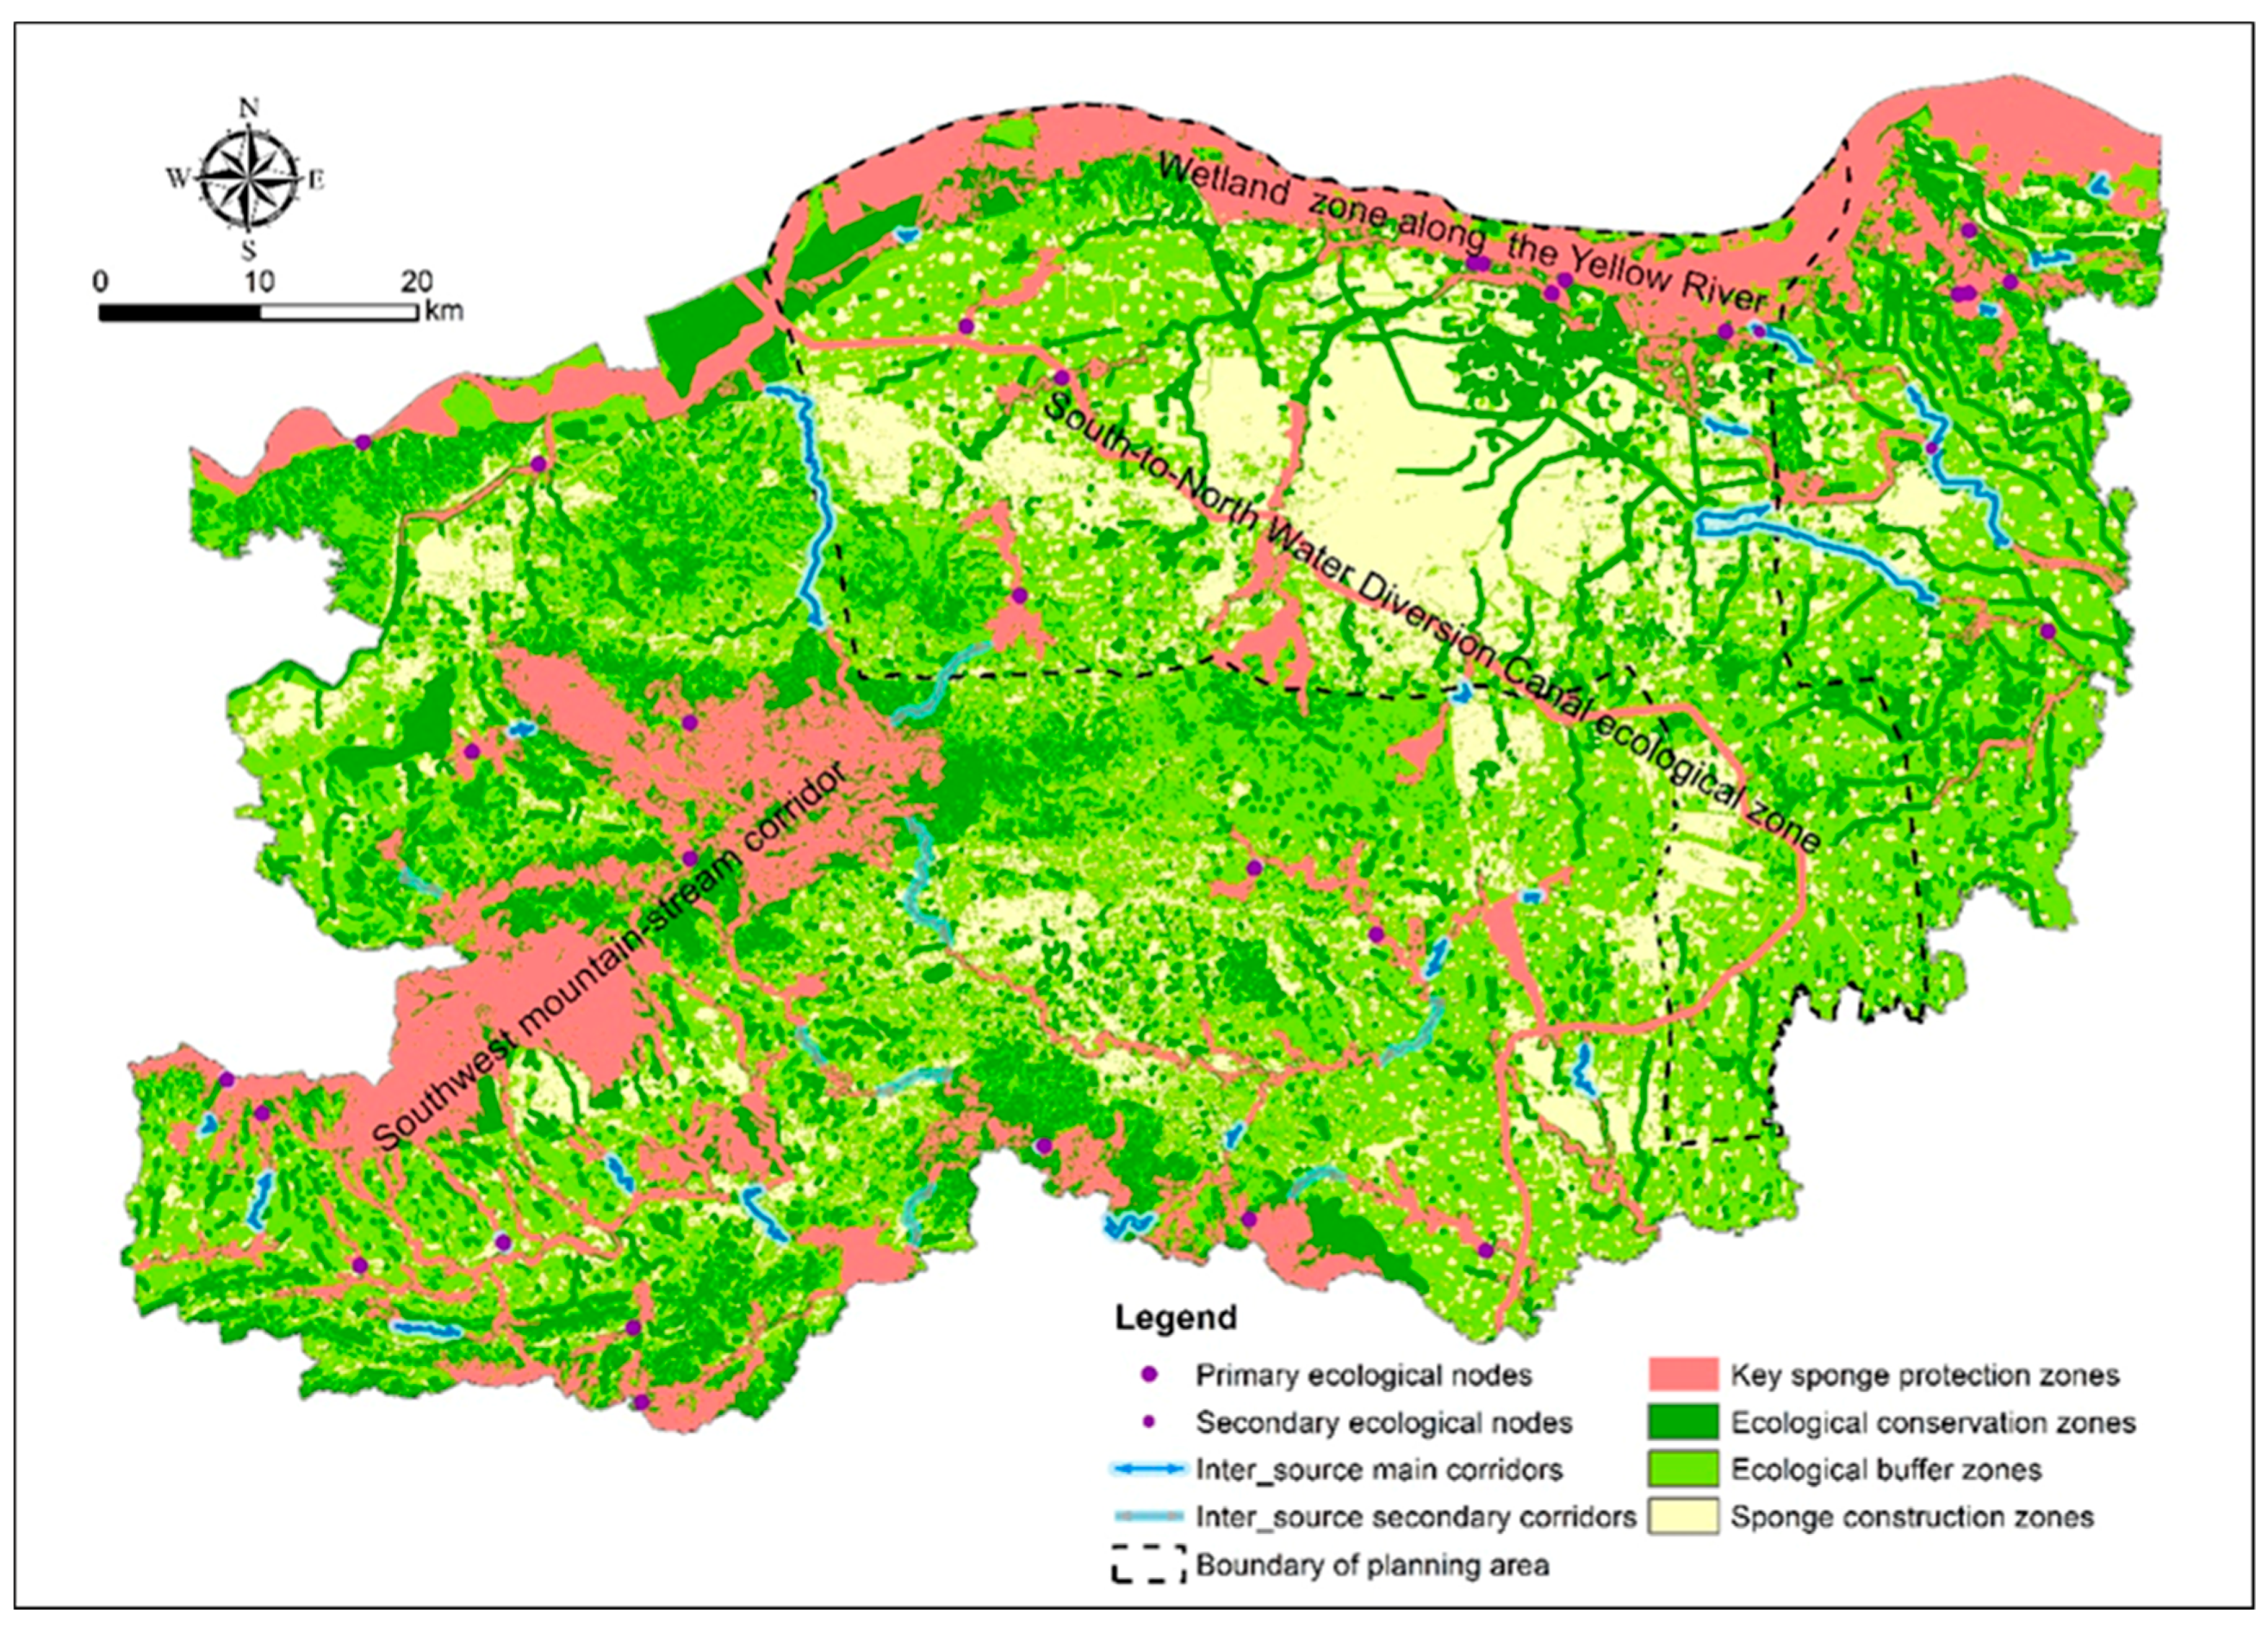
Based on the aforementioned analysis, our study puts forth the ESP for construction of the sponge city in Zhengzhou from the perspective of the integrity of the urban ecosystem (Figure 8). The pattern includes the key sponge protection zones (sources), the sponge ecological network (corridors-nodes), the ecological conservation zones (moderate sensitivity area), the ecological buffer zones (lower sensitivity area), and the sponge construction zones (lowest sensitivity area). Different ESP components have different characteristics, which should be treated differently in the construction of the sponge city.
4. Discussion
4.1. Zoning the Functional Areas for the Sponge City with Targeted Suggestions
Researchers have different focuses on zoning functional areas of sponge city [56,57], but they did not consider the issue from the perspective of the integrity of the urban ecosystem. The sponge city is a strategy for integrated urban water management to construct benign interactions between the social-economic system and the urban water cycle [58]. According to the interpretation of the guidelines, one of the purposes of sponge city planning is to clarify the sponge city construction strategy and delimit the sponge city construction subareas [20]. Thus, our study divided the whole city into different construction zones (Figure 8) and put forth the planning and construction guidelines for each zone based on our analysis of the ESP and the demands of sponge city construction of Zhengzhou. Specific suggestions are as follows:
The rivers in the city not only provides water for the river landscape, but also has other functions, such as the source of urban water supply and discharging drainage [59]. The existing individual river, lake, and other sponge nodes form the water-based ecological network with multiple water source protections and with hydrodynamic characteristics [60], which will help maximize the capacity of water storage and drainage of sponge bodies and improve the urban aquatic ecosystem service function. The plan proposed herein recommends a citywide network of connected open spaces, from regional parks to greenways and canals, which could improve overall floodwater retention and groundwater recharge.
Construction should be prohibited in the key sponge protection zones in Figure 8. The Yellow River riparian wetland should be targeted for protection of the ecosystem functions and repairing of water resources for conservation [61] to improve its flood control capacity and enhance its water storage function.
The ecological conservation zones are rich in forest resources and biodiversity and are also the source of the river, sharing an important water conservation function [62]. Effective conservation of these areas is important for maintaining water resources in Zhengzhou. Natural forest protection projects should be implemented in the mountain areas and forest parks to establish an ecological forest system. It is important to actively clean up the mountain and reduce pollutant load in the small watershed. Development and construction should be prohibited to ensure the continued functions of water conservation and supply in the ecological conservation area.
The ecological buffer zones provide a transitional zone between the ecological conservation area and the urban construction area and play a protective role for the important sponge bodies by preventing the degradation of ecological conservation areas caused by the urban expansion [63]. Thus, protection of the ecological buffers should be properly strengthened [64] in the construction of the sponge city in Zhengzhou to prevent the disorderly occupation of the ecological corridor and curb the disorderly spread of built-up areas as much as possible.
Sponge construction zones usually face a series of ecological problems, including urban waterlogging, decline of groundwater levels, and groundwater pollution [5]. In the process of developing sponge construction zones, it is important to devise a relatively safe planning strategy. Attention should be paid to the development of a low-impact system of rainfall management, it’s confirmed that green infrastructure (e.g., a green roof, permeable pavement, vegetated swale) can reduce the risk of flooding [65]. Moreover, urban green spaces and freshwater ecosystems should be put fully to use to perform the functions of “sponge bodies,” such as accumulation, infiltration, purification, and release [21,22,23,24]. In the case of rain, rainwater can be absorbed through the construction of “absorption, storage, infiltration, and purification” systems [19], which are used to replenish groundwater during droughts and to regulate water circulation. Through a reasonable plan in the sponge construction zones, damage to the original ecological environment of the city can be minimized and rainwater resources can be used more effectively, thus greatly alleviating urban waterlogging and water shortage issues [25,26,27,28].
4.2. Discussion on Technical Methods for Modeling the ESP of the Sponge City
Many studies on ESP explored a comprehensive security pattern integrating geological hazards, drinking water protection, flood control, air pollution prevention, biodiversity, farmland, and other factors [33,49,66]. In this study, we mainly focused on regional water security issues. In the process of constructing ESP for sponge city, more attention was paid to water, land use, and various types of landscape elements in watersheds. The technical improvements and advantages of our model are mainly concluded in the following aspects:
4.2.1. Constructing Ecological Sensitivity Evaluation by AHP and Delphi Method
The AHP method is widely used to assess geological risk, sustainability, landslide sensitivity, and other directions [67,68,69]. In this study, AHP [66] and Delphi method is used to construct the comprehensive evaluation results of water sensitivity, instead of adopting the nature reserve directly or using the equal weight method to extract the source area. It more closely meets the requirements of sponge city construction: The aim of building a sponge city is not only to solve a single type of water safety problem, but also to clarify the important components, spatial locations, and interrelationships of existing freshwater systems [59]. Moreover, it is not reasonable to adopt the equal-weight method in the comprehensive evaluation of ecological sensitivity, which may ignore the interrelations and influences of each index [39]. The use of AHP and Delphi method can more reasonably reflect the ecological sensitivity of the different factors and can obtain different weights according to different cities. However, it should be pointed out that the modeling results are highly sensitive to the weights applied [70], and the weights depend entirely on the perceptions and priorities of evaluators [71], so knowledge of local geology is critical to ensure the rational weights.
4.2.2. Identification of the Ecological Source
Previous studies to identify ecological sources were mainly based on the richness of biodiversity and the importance of ecosystem services [38,72]. In the process of constructing ESP for sponge city, the highest and higher sensitivity areas are regarded as ecological sources and need to be carefully conserved and restored during the construction of the sponge city. Both the number of patches in the ecological area and their proportion in the selected total area should be considered when determining the ecological source. With a proper minimum area threshold of the ecological source, a great number of source patches can be removed [49], while the total area they occupied was small, and their influence on the overall pattern of the ecological source was minimal.
4.2.3. Hierarchical Setting of the Ecological Resistance Surface
In previous studies, the establishment of ecological corridors was intended to reflect the resistance encountered in the process of species migration. Thus, scholars usually set the resistance value based on regional land use types to establish the basic resistance surface [73]. However, the method is so subjective that it ignores local spatial differences [74]. For the analysis of an ESP for the sponge city, ecological corridors are mainly used to reflect and enhance the connectivity of each ecological source, so the hierarchical setting of the ecological resistance surface should be carefully considered to effectively extract the ecological corridors.
5. Conclusions
Taking Zhengzhou as an example, this study performed a GIS modeling to construct a targeted ESP for sponge cities. Based on comprehensive analysis of multifactor water ecological sensitivity, the key sources, corridors and nodes are determined. The results showed that the number of ecological sources identified was 53, with a total area of 1321.72 km2; the total ecological corridor length was 18.56 km; the number of ecological nodes is 31. They are mainly distributed in the wetland zone along the Yellow River located in the north of Zhengzhou, the South-to-North Water Diversion Canal ecological zone, and the southwest mountain-steam corridor. It is relatively a more systematic and scientific way to guide the construction of a sponge city and can also be used for reference to other cities in China.
In the process of sponge city construction, urban planners and managers should solidify the overall ESP of the city and take full advantage of the surrounding natural ecological elements for internal accumulation, natural infiltration, and purification. Large natural sponges, such as mountains, wetlands, and large green areas, should be given priority for protection planning. Furthermore, the main river systems, green belts, and other ecological corridors should be effectively connected to ensure urban ecological security and sustainable development.
However, due to lack of data, the analysis of some factors related to the sponge bodies, such as the spatial distribution of rainfall and groundwater level distribution, is not yet adequate. Moreover, because of the resolution of the spatial data, the urban green space analysis is not detailed enough and should be improved in follow-up studies.
Author Contributions
R.D., X.Z., and H.L. conceived the general idea of the paper. H.L. and X.Z. designed the methodology and the model. All authors analyzed and discussed the results. R.D. and X.Z. wrote this paper. X.Z. and H.L. revised this paper.
Funding
This research was funded by The National Key Research and Development Program of China (No. 2016YFC0503605).
Conflicts of Interest
The authors declare no conflict of interest.
References
- Su, S.L.; Xiao, R.; Jiang, Z.L.; Zhang, Y. Characterizing landscape pattern and ecosystem service value changes for urbanization impacts at an eco-regional scale. Appl. Geogr. 2012, 34, 295–305. [Google Scholar]
- Ahiablame, L.M.; Engel, B.A.; Chaubey, I. Effectiveness of Low Impact Development Practices: Literature Review and Suggestions for Future Research. Water Air Soil Pollut. 2012, 223, 4253–4273. [Google Scholar] [CrossRef]
- Tan, P.Y.; Hamid, A.R.B. Urban ecological research in Singapore and its relevance to the advancement of urban ecology and sustainability. Landsc. Urban Plan. 2014, 125, 271–289. [Google Scholar] [CrossRef]
- Wu, J.G.; Xiang, W.N.; Zhao, J.Z. Urban ecology in China: Historical developments and future directions. Landsc. Urban Plan. 2014, 125, 222–233. [Google Scholar] [CrossRef]
- Yu, K.; Li, D.; Yuan, H.; Fu, W.; Qiao, Q.; Wang, S. “Sponge city”: Theory and practice. Plan. Stud. 2015, 39, 26–36. [Google Scholar]
- Shao, W.W.; Zhang, H.X.; Liu, J.H.; Yang, G.Y.; Chen, X.D.; Yang, Z.Y.; Huang, H. Data integration and its application in the sponge city construction of China. Procedia Eng. 2016, 154, 779–786. [Google Scholar] [CrossRef]
- Peng, J.; Zhao, H.; Liu, Y.; Du, Y. Progress and conceptual framework of regional water security pattern construction. Acta Ecol. Sin. 2016, 36, 3137–3145. [Google Scholar]
- Changnon, S.A., Jr.; Ackermann, W.C.; White, G.F.; Ivens, J.L.; Caulfield, H.P., Jr.; Drabek, T.; Landsberg, H.E.; Linsley, R.K.; Marzolf, G.R.; Milliman, J.W. A Plan for Research on Floods and Their Mitigation in the United States; Illinois State Water Survey: Champaign, IL, USA, 1983. [Google Scholar]
- Fletcher, T.D.; Shuster, W.; Hunt, W.F.; Ashley, R.; Butler, D.; Arthur, S.; Trowsdale, S.; Barraud, S.; Semadeni-Davies, A.; Bertrand-Krajewski, J.L.; et al. SUDS, LID, BMPs, WSUD and more—The evolution and application of terminology surrounding urban drainage. Urban Water J. 2015, 12, 525–542. [Google Scholar] [CrossRef]
- Miklas, S. Best Management Practice: A Sustainable Urban Drainage System Management Case Study. Water Int. 2006, 31, 310–319. [Google Scholar]
- Bedan, E.S.; Clausen, J.C. Stormwater Runoff Quality and Quantity From Traditional and Low Impact Development Watersheds(1). J. Am. Water Resour. Assoc. 2009, 45, 998–1008. [Google Scholar] [CrossRef]
- Dietz, M.E. Low impact development practices: A review of current research and recommendations for future directions. Water Air Soil Pollut. 2007, 186, 351–363. [Google Scholar] [CrossRef]
- Walmsley, A. Greenways: Multiplying and diversifying in the 21st century. Landsc. Urban Plan. 2006, 76, 252–290. [Google Scholar] [CrossRef]
- Roy, A.H.; Wenger, S.J.; Fletcher, T.D.; Walsh, C.J.; Ladson, A.R.; Shuster, W.D.; Thurston, H.W.; Brown, R.R. Impediments and solutions to sustainable, watershed-scale urban stormwater management: Lessons from Australia and the United States. Environ. Manag. 2008, 42, 344–359. [Google Scholar] [CrossRef]
- Spillett, P.; Evans, S.; Colquhoun, K. International perspective on BMPs/SUDS: UK—Sustainable stormwater management in the UK. In Proceedings of the World Water and Environmental Resources Congress, Anchorage, AK, USA, 15–19 May 2005; pp. 1–12. [Google Scholar]
- Lloyd, S.D.; Wong, T.H.F.; Chesterfield, C.J. Water Sensitive Urban Design: A Stormwater Management Perspective; CRC for Catchment Hydrology, CanPrint: Victoria, Australia, 2002. [Google Scholar]
- Wong, T.H.F. Water sensitive urban design—The journey thus far. Aust. J. Water Resour. 2006, 10, 213–222. [Google Scholar] [CrossRef]
- Summary of Four International Experiences for Sponge City Construction. Available online: http://www.cjw.gov.cn/zjzx/jhzh/31991.html (accessed on 24 April 2018).
- Liu, C.; Zhang, Y.; Wang, Z.; Wang, Y.; Bai, P. The LID Pattern for Maintaining Virtuous Water Cycle in Urbanized Area: A Preliminary Study of Planning and Techniques for Sponge City. J. Nat. Resour. 2016, 31, 719–731. [Google Scholar]
- Ministry of Housing Urban-Rural Construction of People’s Republic of China. Technical Guide for Sponge City Construction-Construction of Rain Water System for Low Impact Development; Mohurd: Beijing, China, 2014; pp. 1–88.
- Zhang, S.H.; Pan, B.Z. An urban storm-inundation simulation method based on GIS. J. Hydrol. 2014, 517, 260–268. [Google Scholar] [CrossRef]
- Che, W.; Wu, Y.; Yang, Z.; Yan, P.; Zhao, Y. Explanation of Sponge City Development Technical Guide: Rational Building of Urban Stormwater Detention and Retention System. China Water Wastewater 2015, 31, 13. [Google Scholar]
- Wang, G.; Chen, J.; Zhao, C.; Zhou, X.; Deng, X. Exploration of the causality between area changes of green spaces and waterlogging frequency in Beijing. Phys. Chem. Earth 2017, 101, 172–177. [Google Scholar] [CrossRef]
- Li, H.; Ding, L.Q.; Ren, M.L.; Li, C.Z.; Wang, H. Sponge City Construction in China: A Survey of the Challenges and Opportunities. Water 2017, 9, 17. [Google Scholar] [CrossRef]
- Ma, H.; Zhou, D.; Kang, C.; Wang, J. Sponge City Planning Theory And Zhuhai’s Practice. Planners 2016, 32, 29–34. [Google Scholar]
- Ling, Z.; Zhai, G.; He, Z. Summary of Sponge City Theory and Practice. In Proceedings of the 2015 China City Planning Annual Meeting, Guiyang, China, 17–22 October 2015. [Google Scholar]
- Han, X.; Zhao, Y. “Sponge” Development in Sponge City Construction. J. Earth Sci. Environ. 2016, 38, 708–714. [Google Scholar]
- Xia, J.; Zhang, Y.Y.; Xiong, L.H.; He, S.; Wang, L.F.; Yu, Z.B. Opportunities and challenges of the Sponge City construction related to urban water issues in China. Sci. China-Earth Sci. 2017, 60, 652–658. [Google Scholar] [CrossRef]
- Yu, K. Security patterns and surface model in landscape ecological planning. Landsc. Urban Plan. 1996, 36, 1–17. [Google Scholar] [CrossRef]
- Jiansheng, W.U.; Zhang, L.; Jian, P.; Zhe, F.; Liu, H.; Shengbin, H.E. The integrated recognition of the source area of the urban ecological security pattern in Shenzhen. Acta Ecol. Sin. 2013, 33, 4125–4133. [Google Scholar] [CrossRef]
- Gong, J.Z.; Liu, Y.S.; Xia, B.C.; Zhao, G.W. Urban ecological security assessment and forecasting, based on a cellular automata model: A case study of Guangzhou, China. Ecol. Model. 2009, 220, 3612–3620. [Google Scholar] [CrossRef]
- Solovjova, N.V. Synthesis of ecosystemic and ecoscreening modelling in solving problems of ecological safety. Ecol. Model. 1999, 124, 1–10. [Google Scholar] [CrossRef]
- Su, Y.X.; Chen, X.Z.; Liao, J.S.; Zhang, H.O.; Wang, C.J.; Ye, Y.Y.; Wang, Y. Modeling the optimal ecological security pattern for guiding the urban constructed land expansions. Urban For. Urban Green. 2016, 19, 35–46. [Google Scholar] [CrossRef]
- Li, Z.; Xu, L. Evaluation indicators for urban ecological security based on ecological network analysis. Procedia Environ. Sci. 2010, 2, 1393–1399. [Google Scholar] [CrossRef]
- Su, Y.; Zhang Hong, o.; Chen, X.; Huang, G.; Ye, Y.; Wu, Q.; Huang, N.; Kuang, Y. The ecological security patterns and construction land expansion simulation in Gaoming. Acta Ecol. Sin. 2013, 33, 1524–1534. [Google Scholar]
- Chen, X.; Peng, J.; Liu, Y.; Yang, Y.; Li, G. Constructing ecological security patterns in Yunfu city based on the framework of importance-sensitivity-connectivity. Geogr. Res. 2017, 36, 471–484. [Google Scholar]
- Klar, N.; Herrmann, M.; Henning-Hahn, M.; Pott-Dorfer, B.; Hofer, H.; Kramer-Schadt, S. Between ecological theory and planning practice: (Re-) Connecting forest patches for the wildcat in Lower Saxony, Germany. Landsc. Urban Plan. 2012, 105, 376–384. [Google Scholar] [CrossRef]
- Teng, M.J.; Wu, C.G.; Zhou, Z.X.; Lord, E.; Zheng, Z.M. Multipurpose greenway planning for changing cities: A framework integrating priorities and a least-cost path model. Landsc. Urban Plan. 2011, 103, 1–14. [Google Scholar] [CrossRef]
- Peng, J.; Zhao, H.; Yanxu, L.; Jiansheng, W. Research progress and prospect on regional ecological security pattern construction. Geogr. Res. 2017, 36, 407–419. [Google Scholar]
- Knaapen, J.P.; Scheffer, M.; Harms, B. Estimating habitat isolation in landscape planning. Landsc. Urban Plan. 1992, 23, 1–16. [Google Scholar] [CrossRef]
- Li, F.; Ye, Y.P.; Song, B.W.; Wang, R.S. Evaluation of urban suitable ecological land based on the minimum cumulative resistance model: A case study from Changzhou, China. Ecol. Model. 2015, 318, 194–203. [Google Scholar] [CrossRef]
- Yu, K. Ecological Security Patterns in Landscapes and GIS Application. Ann. Gis 1995, 1, 88–102. [Google Scholar] [CrossRef]
- Mu, B.; Mayer, A.L.; He, R.Z.; Tian, G.H. Land use dynamics and policy implications in Central China: A case study of Zhengzhou. Cities 2016, 58, 39–49. [Google Scholar] [CrossRef]
- Chen, K.; He, R.; Liang, T.; Tian, G. Optimization Approach of Urban Green Space Based on Concept of Sponge City. Bull. Soil Water Conserv. 2016, 36, 258–264. [Google Scholar]
- Saaty, T.L. Decision making with the analytic hierarchy process. Int. J. Serv. Sci. 2008, 1, 83–98. [Google Scholar] [CrossRef]
- Saaty, T.L. Decision Making for Leaders: The Analytic Hierarchy Process for Decisions in a Complex World; RWS Publications: Pittsburgh, PA, USA, 1990. [Google Scholar]
- Linstone, H.A.; Turoff, M. The Delphi Method; Addison-Wesley: Reading, MA, USA, 1975. [Google Scholar]
- Dong, R.C.; Liu, X.; Liu, M.L.; Feng, Q.Y.; Su, X.D.; Wu, G. Landsenses ecological planning for the Xianghe Segment of China’s Grand Canal. Int. J. Sustain. Dev. World Ecol. 2016, 23, 298–304. [Google Scholar] [CrossRef]
- Peng, J.; Guo, X.; Hu, Y.; Liu, Y. Constructing ecological security patterns in mountain areas based on geological disaster sensitivity: A case study in Yuxi City, Yunnan Province, China. Chin. J. Appl. Ecol. 2017, 28, 627–635. [Google Scholar]
- Hu, D.; Zong, Y.; Xu, W. Research on the Construction of Landscape Ecological Security Pattern in the New Urban Region Development based on Ecology Network Analysis. Urban Dev. Stud. 2011, 6, 37–43. [Google Scholar]
- Mu, B.; Li, H.; Yao, E.; He, R.; Tian, G. Dynamic changes of urban-rural landscape spatial pattern indifferent topographic features in Zhengzhou City. J. Henan Agric. Univ. 2016, 50, 789–798. [Google Scholar]
- Zhou, C.; Cheng, W.; Qian, J.; Li, B.; Zhang, B. Research on the Classification System of Digital Land Geomorphology of 1:100,000 in China. J. Eco-Inf. Sci. 2009, 11, 707–724. [Google Scholar]
- Devantier, B.A.; Feldman, A.D. Review of GIS Applications in Hydrologic Modeling. J. Water Resour. Plan. Manag. 1993, 119, 246–261. [Google Scholar] [CrossRef]
- Gleyzer, A.; Denisyuk, M.; Rimmer, A.; Salingar, Y. A fast recursive GIS algorithm for computing strahler stream order in braided and nonbraided networks. J. Am. Water Resour. Assoc. 2010, 40, 10. [Google Scholar] [CrossRef]
- Li, B.; Pan, B.; Han, J. Basic Terrestrial Geomorphological Types in China and Their Circumscriptions. Quat. Sci. 2008, 28, 535–543. [Google Scholar]
- Zhao, Y.-B.; Yang, M.-Z.; Ni, H.-G. An emergy-GIS method of selecting areas for sponge-like urban reconstruction. J. Hydrol. 2018, 564, 640–650. [Google Scholar] [CrossRef]
- Zhang, J.; Fu, D.; Wang, Y.; Singh, R.P. Detailed sponge city planning based on hierarchical fuzzy decision-making: A case study on Yangchen Lake. Water 2017, 9, 903. [Google Scholar] [CrossRef]
- Wang, H.; Mei, C.; Liu, J.H.; Shao, W.W. A new strategy for integrated urban water management in China: Sponge city. Sci. China Technol. Sci. 2018, 61, 317–329. [Google Scholar] [CrossRef]
- Yang, T.; Liu, J.; Chen, Q. Assessment of plain river ecosystem function based on improved gray system model and analytic hierarchy process for the Fuyang River, Haihe River Basin, China. Ecol. Model. 2013, 268, 37–47. [Google Scholar] [CrossRef]
- Yu, Q.; Jiang, Q.O.; Yang, D.; Yue, D.; Ma, H.; Huang, Y.; Zhang, Q.; Fang, M. Incorporating Temporal and Spatial Variations of Groundwater into the Construction of a Water-Based Ecological Network: A Case Study in Denko County. Water 2017, 9, 864. [Google Scholar] [CrossRef]
- He, X.; Hörmann, G.; Strehmel, A.; Guo, H.; Fohrer, N. Natural and anthropogenic causes of vegetation changes in riparian wetlands along the lower reaches of the Yellow River, China. Wetlands 2015, 35, 391–399. [Google Scholar] [CrossRef]
- Song, X.; Yan, C.; Xie, J.; Li, S. Assessment of changes in the area of the water conservation forest in the Qilian Mountains of China’s Gansu province, and the effects on water conservation. Environ. Earth Sci. 2012, 66, 2441–2448. [Google Scholar] [CrossRef]
- Benítez, G.; Pérez-Vázquez, A.; Nava-Tablada, M.; Equihua, M.; Álvarez-Palacios, J.L. Urban expansion and the environmental effects of informal settlements on the outskirts of Xalapa city, Veracruz, Mexico. Environ. Urban. 2012, 24, 149–166. [Google Scholar] [CrossRef]
- Nguyen, T.T.; Ngo, H.H.; Guo, W.; Wang, X.C.; Ren, N.; Li, G.; Ding, J.; Liang, H. Implementation of a specific urban water management-Sponge City. Sci. Total Environ. 2019, 652, 147–162. [Google Scholar] [CrossRef]
- Mei, C.; Liu, J.H.; Wang, H.; Yang, Z.Y.; Ding, X.Y.; Shao, W.W. Integrated assessments of green infrastructure for flood mitigation to support robust decision-making for sponge city construction in an urbanized watershed. Sci. Total Environ. 2018, 639, 1394–1407. [Google Scholar] [CrossRef]
- Liu, S.; Wang, D.; Li, H.; Li, W.; Wu, W.; Zhu, Y. The Ecological Security Pattern and Its Constraint on Urban Expansion of a Black Soil Farming Area in Northeast China. ISPRS Int. J. Geo-Inf. 2017, 6, 263. [Google Scholar] [CrossRef]
- Lyu, H.-M.; Shen, J.S.; Arulrajah, A. Assessment of geohazards and preventative countermeasures using AHP incorporated with GIS in Lanzhou, China. Sustainability 2018, 10, 304. [Google Scholar] [CrossRef]
- Cinelli, M.; Coles, S.R.; Kirwan, K. Analysis of the potentials of multi criteria decision analysis methods to conduct sustainability assessment. Ecol. Indic. 2014, 46, 138–148. [Google Scholar] [CrossRef]
- Pourghasemi, H.; Moradi, H.; Aghda, S.F. Landslide susceptibility mapping by binary logistic regression, analytical hierarchy process, and statistical index models and assessment of their performances. Nat. Hazards 2013, 69, 749–779. [Google Scholar] [CrossRef]
- Van der Merwe, J.H. GIS-aided land evaluation and decision-making for regulating urban expansion: A South African case study. GeoJournal 1997, 43, 135–151. [Google Scholar] [CrossRef]
- Dai, F.; Lee, C.; Zhang, X. GIS-based geo-environmental evaluation for urban land-use planning: A case study. Eng. Geol. 2001, 61, 257–271. [Google Scholar] [CrossRef]
- Peng, J.; Yang, Y.; Liu, Y.; Du, Y.; Meersmans, J.; Qiu, S. Linking ecosystem services and circuit theory to identify ecological security patterns. Sci. Total Environ. 2018, 644, 781–790. [Google Scholar] [CrossRef] [PubMed]
- Pan, J.; Liu, X. Assessment of landscape ecological security and optimization of landscape pattern based on spatial principal component analysis and resistance model in arid inland area: A case study of Ganzhou District, Zhangye City, Northwest China. Chin. J. Appl. Ecol. 2015, 26, 3126–3136. [Google Scholar]
- Peng, J.; Zhao, H.; Liu, Y. Urban ecological corridors construction: A review. Acta Ecol. Sin. 2017, 37, 23–30. [Google Scholar] [CrossRef]
Figure 1.
Zhengzhou administrative districts and the sponge city construction planning area.

Figure 2.
Flowchart for the construction of the ecological security pattern (ESP) for the sponge city.
Figure 2.
Flowchart for the construction of the ecological security pattern (ESP) for the sponge city.

Figure 3.
Individual layers of factors evaluation of water ecological sensitivity: (a) Sensitivity evaluation of existing water ecological factors; (b) Sensitivity evaluation of significant water safety factors; (c) Sensitivity evaluation of indirect water environment factors; (d) Sensitivity evaluation of potential sponge body factors.

Figure 4.
Comprehensive ecological sensitive area in Zhengzhou.

Figure 5.
Influence of the threshold setting of the area of ecological source: (a) Correspondence between the minimum area threshold and the number of patches; (b) Correspondence between the minimum area threshold and area proportion.
Figure 5.
Influence of the threshold setting of the area of ecological source: (a) Correspondence between the minimum area threshold and the number of patches; (b) Correspondence between the minimum area threshold and area proportion.

Figure 6.
Distribution of the ecological sources and linkages between sources.

Figure 7.
Distribution of the ecological corridors and ecological nodes.

Figure 8.
ESP for Zhengzhou.


Table 1.
Comprehensive evaluation index system of water ecological sensitivity for the sponge city.
| Target Layer | Criterion Layer | Index Layer |
|---|---|---|
| water ecological sensitivity for the sponge city | existing water ecological factors (0.2746) | wetland (0.5695) |
| vegetation-covered areas (0.3331) | ||
| farmland (0.0974) | ||
| significant water safety factors (0.5753) | drinking water reserves (0.3196) | |
| major water conservancy projects (0.5584) | ||
| natural scenic regions (0.1220) | ||
| indirect water environment factors (0.0911) | elevation (0.4000) | |
| slop (0.6000) | ||
| potential sponge body factors (0.0589) | potential catchment corridor (0.5000) | |
| low-lying areas (0.5000) |
Table 2.
Classification system of ecological sensitive areas in Zhengzhou.
| Ranks of Ecological Sensitivity | Range of Ecological Sensitivity Index |
|---|---|
| highest sensitivity area | ≥0.8996 |
| higher sensitivity area | 0.6399–0.8996 |
| moderate sensitivity area | 0.3802–0.6399 |
| lower sensitivity area | 0.1206–0.3802 |
| lowest sensitivity area | <0.1206 |
Table 3.
Statistics on the sizes of ecological sensitive areas and their main distributions.
| Ranks of Ecological Sensitive Areas | Area (km2) | Proportion (%) | Main Distribution |
|---|---|---|---|
| highest sensitivity area | 697.97 | 9.22 | Yellow River wetland areas, the protection zones of the South-to-North Water Diversion Project, and source protection zones. |
| higher sensitivity area | 1135.33 | 15.00 | river systems and high mountainous covered with vegetation. |
| moderate sensitivity area | 1363.30 | 18.02 | buffer zones around the river and hills covered with vegetation. 1 |
| lower sensitivity area | 2968.31 | 39.21 | farmland. |
| lowest sensitivity area | 1402.00 | 18.53 | construction land. |
1 Buffer zones around the river refers to the area not more than 200 m away from rivers.
Table 4.
Resistance values of the resistance surface in Zhengzhou.
| Ranks of Ecological Sensitivity | Ecological Sensitive Zoning | Resistance Value |
|---|---|---|
| ≥0.6399 | highest and higher sensitivity area | 0 |
| 0.5101–0.6399 | more moderate sensitivity area | 10 |
| 0.3802–0.5101 | less moderate sensitivity area | 20 |
| 0.2504–0.3802 | little lower sensitivity area | 30 |
| 0.1206–0.2504 | much lower sensitivity area | 40 |
| <0.1206 | lowest sensitivity area | 50 |
© 2019 by the authors. Licensee MDPI, Basel, Switzerland. This article is an open access article distributed under the terms and conditions of the Creative Commons Attribution (CC BY) license (http://creativecommons.org/licenses/by/4.0/).
Share and Cite
MDPI and ACS Style
Dong, R.; Zhang, X.; Li, H. Constructing the Ecological Security Pattern for Sponge City: A Case Study in Zhengzhou, China. Water 2019, 11, 284. https://doi.org/10.3390/w11020284
AMA Style
Dong R, Zhang X, Li H. Constructing the Ecological Security Pattern for Sponge City: A Case Study in Zhengzhou, China. Water. 2019; 11(2):284. https://doi.org/10.3390/w11020284
Chicago/Turabian StyleDong, Rencai, Xueqi Zhang, and Huanhuan Li. 2019. "Constructing the Ecological Security Pattern for Sponge City: A Case Study in Zhengzhou, China" Water 11, no. 2: 284. https://doi.org/10.3390/w11020284
Note that from the first issue of 2016, this journal uses article numbers instead of page numbers. See further details here.