Change in Extreme Precipitation over North Korea Using Multiple Climate Change Scenarios

1
K-Water Research Institute, Water Resources Research Center, 34045 Daejeon, Korea
2
Ministry of Environment, Han River Flood Control Office, 06501 Seoul, Korea
3
Department of Civil & Architectural Engineering, Seokyeong University, 02713 Seoul, Korea
*
Author to whom correspondence should be addressed.
Water 2019, 11(2), 270; https://doi.org/10.3390/w11020270
Submission received: 2 December 2018
/
Revised: 28 January 2019
/
Accepted: 1 February 2019
/
Published: 4 February 2019
(This article belongs to the Section Hydrology)
Abstract
:Although the magnitude and frequency of extreme events on the global scale are expected to change because of changes in the hydrological cycle under climate change, little quantitative assessment of future extreme precipitation in North Korea has been attempted. Therefore, this study projected the changes in extreme precipitation in North Korea by applying downscaling to GCMs forced by Representative Concentration Pathway (RCP) Scenarios 4.5 and 8.5, preserving the long-term trend of climate change projection. Employing climate change scenario ensembles of RCP8.5, the precipitation level of the 20-year return period in the reference period of 1980–2005 increased to 21.1 years for the future period 2011–2040, decreased to 16.2 years for 2041–2070, and decreased to 8.8 years for 2071–2100. Extreme precipitation was expected to occur often in the future. In addition, an increase in extreme precipitation at the border of North and South Korea is expected, and it is concluded that a joint response for the Imjin River, a river shared by North and South Korea, is needed.
1. Introduction
Owing to climate change, heavy precipitation events associated with mesoscale convective processes frequently occur during the summer monsoon in East Asia [1,2,3]. Like other countries, North Korea is expected to experience extreme precipitation changes because of climate change. Generally, investigations based on the nonstationarity of observational data or using climate change scenarios have been employed to assess the impacts of climate change. In order to investigate hydrometeorological variables of South and North Korea, Kim et al. [4] analyzed daily precipitation data of North Korea from 1983 to 2007 and of South Korea for the 35-year period from 1973 to 2007. This study identified a striking trend of decreasing summer precipitation across North Korea. In South Korea, by contrast, the trend was the opposite. Sung et al. [5] assessed meteorological hazards based on trends in precipitation characteristics for the Korean Peninsula. From their results, North Korea’s annual maximum daily precipitation (AMDP) showed an increasing trend at four sites and a decrease at three sites.
Studies based on downscaled data under climate change scenarios have projected an increase in precipitation [6]. Boo et al. [7] found that the northern region of the Korean Peninsula will experience remarkable increases in the amounts of precipitation compared to the southern region based on the MM5 regional climate model (RCM). Hong and Ahn [8] investigated regional precipitation changes using the WRF3.4 RCM with high resolution driven by the GCM (HadGEM2-AO) under representative concentration pathways (RCPs). The intensity of extreme precipitation was projected to increase by at least 22% (38%) under RCP4.5 (RCP8.5) in the late 21st century (2071–2100). Cha et al. [6] simulated an increase in summer precipitation over the Korean Peninsula. There were some differences in the rates of change in summer precipitation among these RCP experiments. However, these studies employed a single RCM with high resolution, and they focused not on North Korea but on the Korean Peninsula. In addition, cooperation between South Korea and North Korea is being actively promoted, and it is necessary for climate change research to be supported in North Korea, which has fewer research results than South Korea.
Although climate change scenarios have been widely used for impact assessment of extreme events in the future, there are limitations: GCMs have large uncertainties because of their low resolution. Therefore, in order to perform impact assessments for extreme climate events, it is necessary to quantify the uncertainty due to differences in dynamic system, grid size, and parameterization and physicalization processes and to produce climate scenarios at local scales with appropriate downscaling. To quantify the uncertainty among climate change scenarios, many studies recommend the use of multiple models [9,10,11,12,13].
Climate change scenarios downscaled by dynamical or statistical methods are also used to estimate the exceedance probabilities of future extreme events. Statistical downscaling makes it possible to perform a quantitative comparison with observational data through bias correction using the observations, and it is easy to convert them into high-resolution data. However, as this technique does not consider climate system changes, attempts have been made to combine it with dynamic downscaling [14,15,16,17,18]. Burger et al. [16] proposed detrended quantile mapping (DQM), which is a statistical downscaling technique that can maintain the simulated long-term trends in the climate model. Eum and Cannon [18] proposed quantile delta mapping (QDM), which reflects the difference between simulated current and future climatic data to the observed data [12,13].
Regional climate downscaling has an important role to play in that it provides projections with much greater detail and a more accurate representation of localized extreme events. Projects of RCM ensembles, including the North American Regional Climate Change Assessment Program (NARCCAP) [19] and the Coordinated Regional Climate Downscaling Experiment (CORDEX) [20], are used to evaluate and improve regional climate downscaling models and techniques. These projects have quantified the uncertainty by employing multimodel ensembles (MMEs) through global partnerships. In addition, climate model outputs have shown considerable systematic biases compared with observations [19,21], physical parameterizations [22], and cascade uncertainties from boundary forcing by GCMs in regional climate models [23,24].
Therefore, in this study, we applied downscaling while preserving the long-term trend of 25 GCMs based on the RCP4.5 and RCP8.5 scenarios, projected the change in extreme precipitation—the 20-year return value for annual maximum daily precipitation—over North Korea, and estimated the uncertainty with confidence intervals. North Korea occupies 62.9% of the 8117.5 km2 area of the Imjin River Basin, and the part of the Imjin River Basin located in South Korea is sensitive to extreme precipitation occurring in the upper basin. In particular, an increase in the upstream flow of the Imjin River causes direct damage to the downstream area. In 2009, because of a release of the Hwanggang Dam, flood damage occurred in the downstream area of the Imjin River, in the territory of South Korea. Therefore, we also investigated changes in extreme precipitation focusing on the Imjin River basin.
2. Materials and Methods
2.1. Overview of Procedure
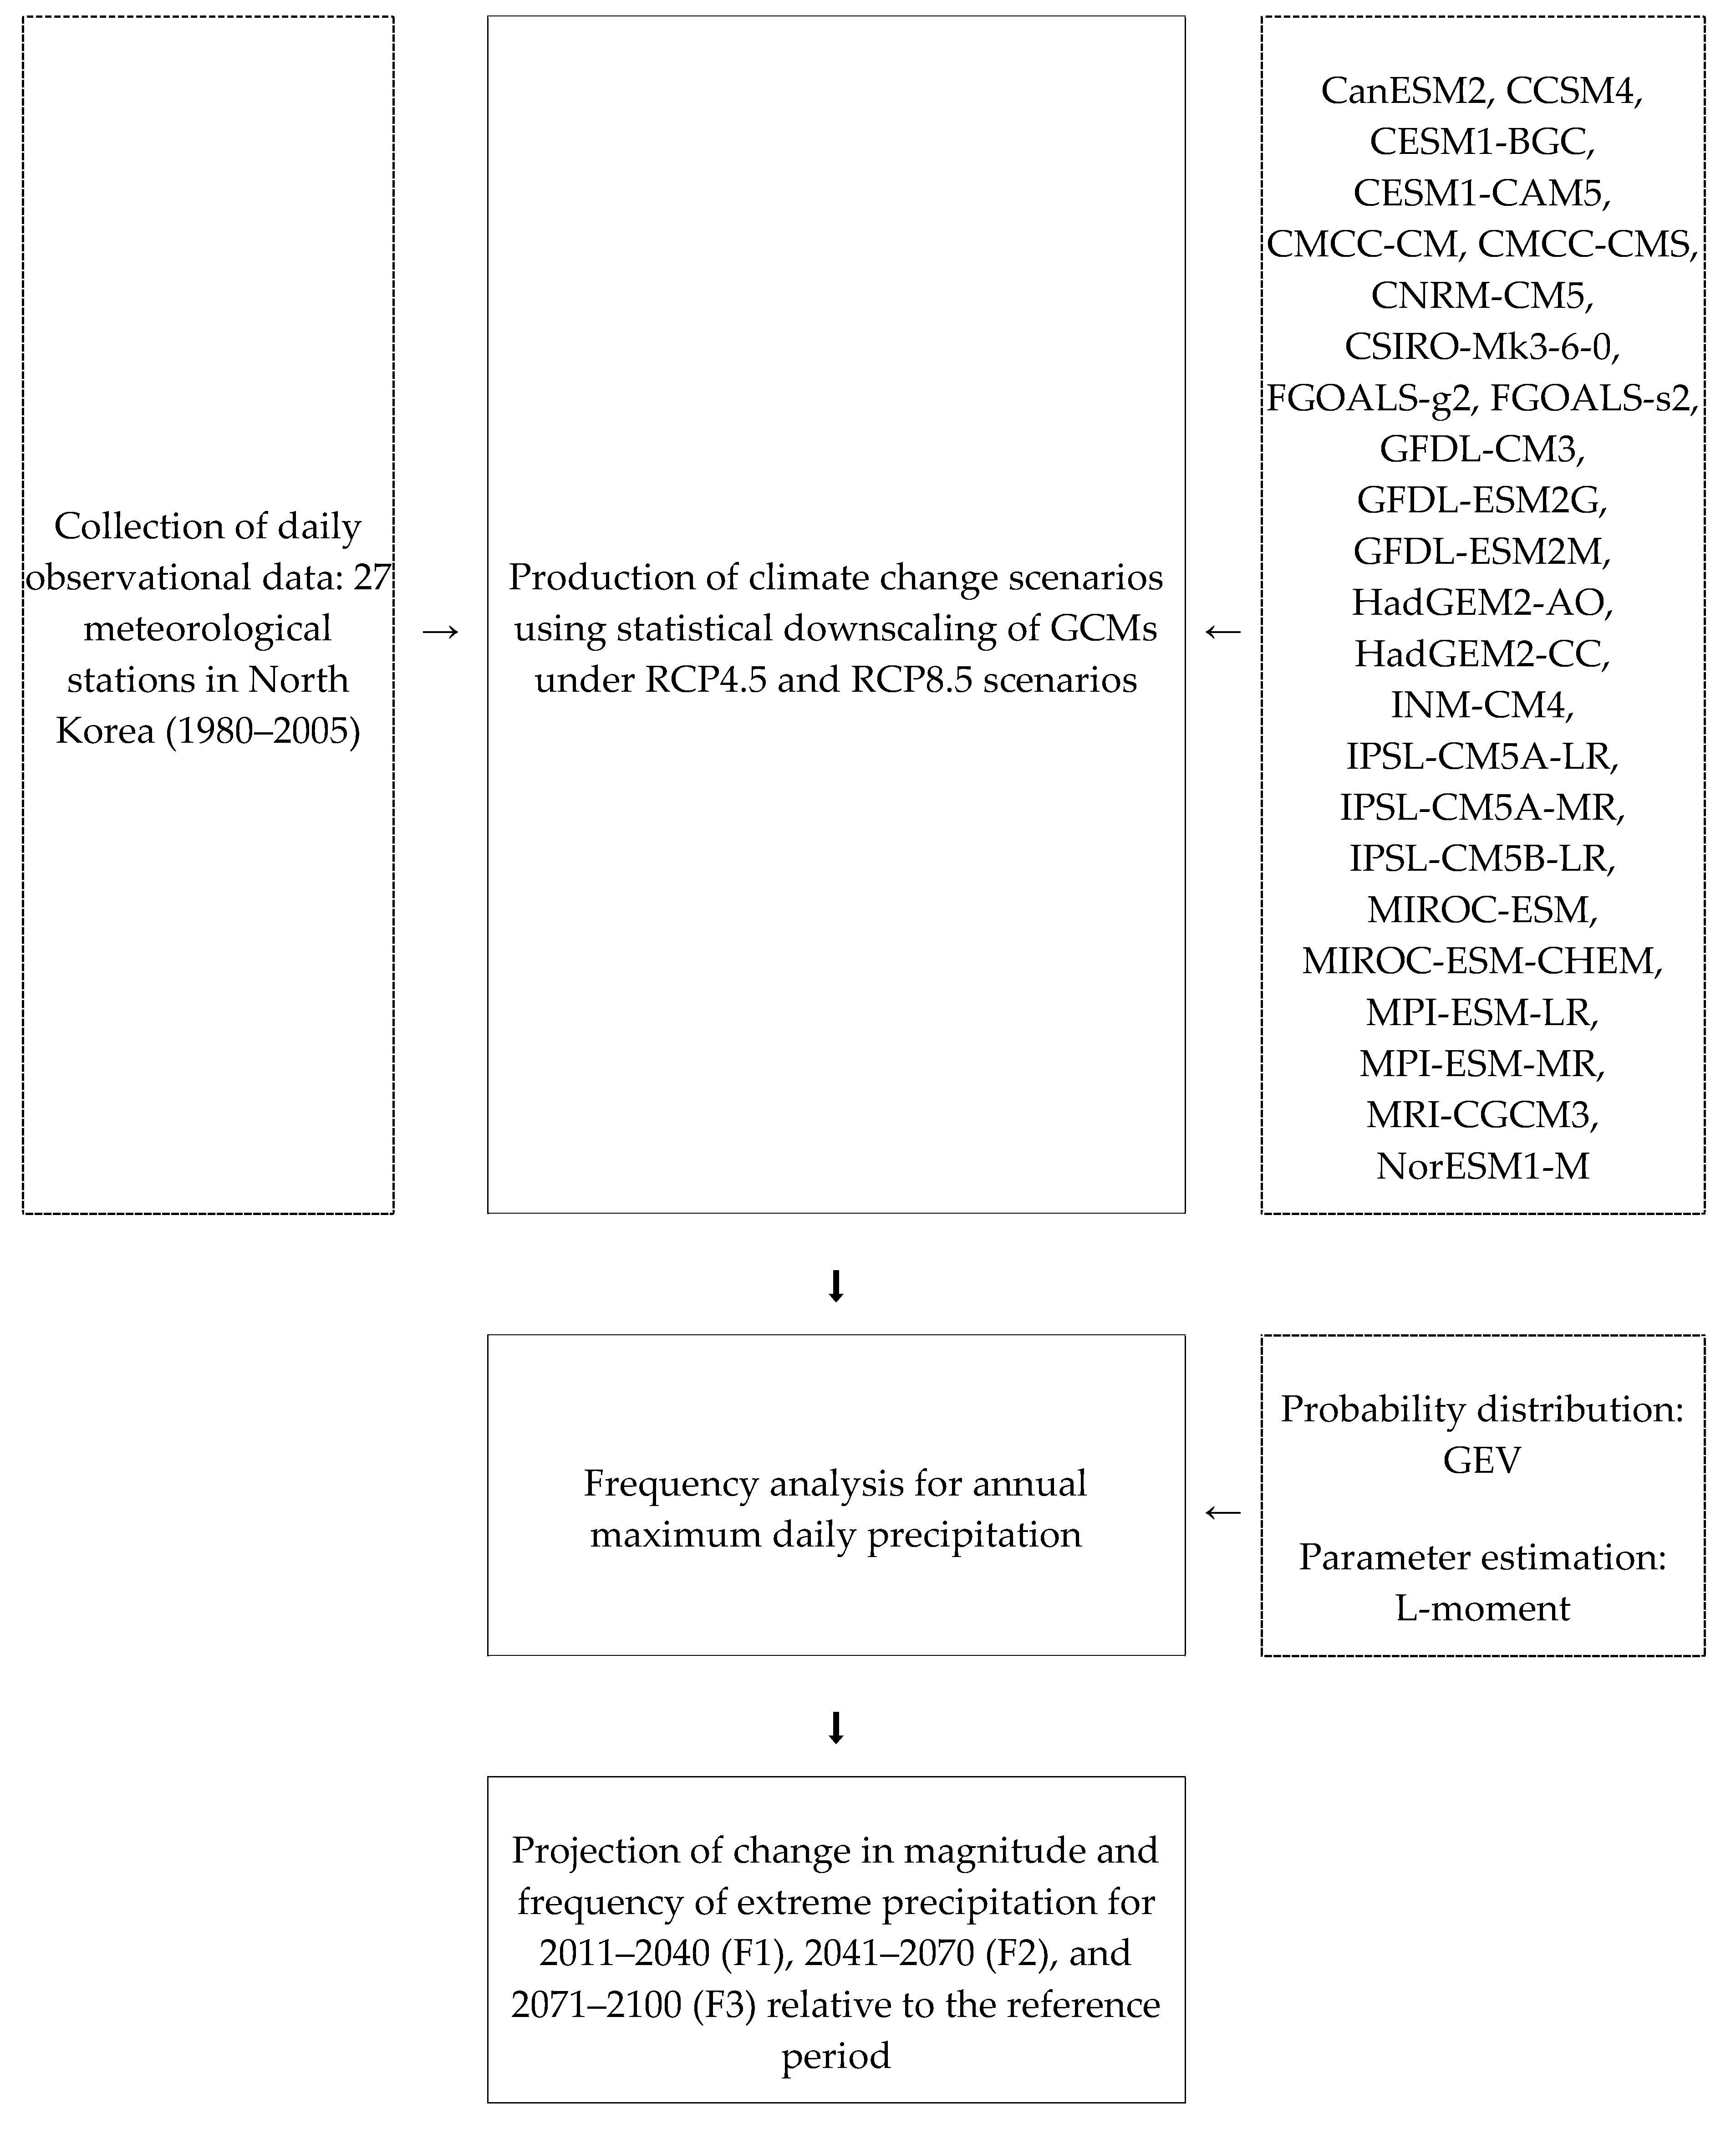
In this study, we combined results from multiple models to project changes in return period and amount of extreme precipitation in North Korea (Figure 1). Employing the daily precipitation results from 25 climate projections of the Coupled Model Intercomparison Project Phase 5 (CMIP5) [25] downscaled by statistical downscaling methods, we collected the AMDP data for North Korea. Then, we estimated the frequency and magnitude of extreme precipitation using the generalized extreme value (GEV) distribution for the reference period (1980–2005) and three 30-year future periods: 2011–2040 (Future1: F1), 2041–2070 (Future2: F2), and 2071–2100 (Future3: F3).
2.2. Study Area
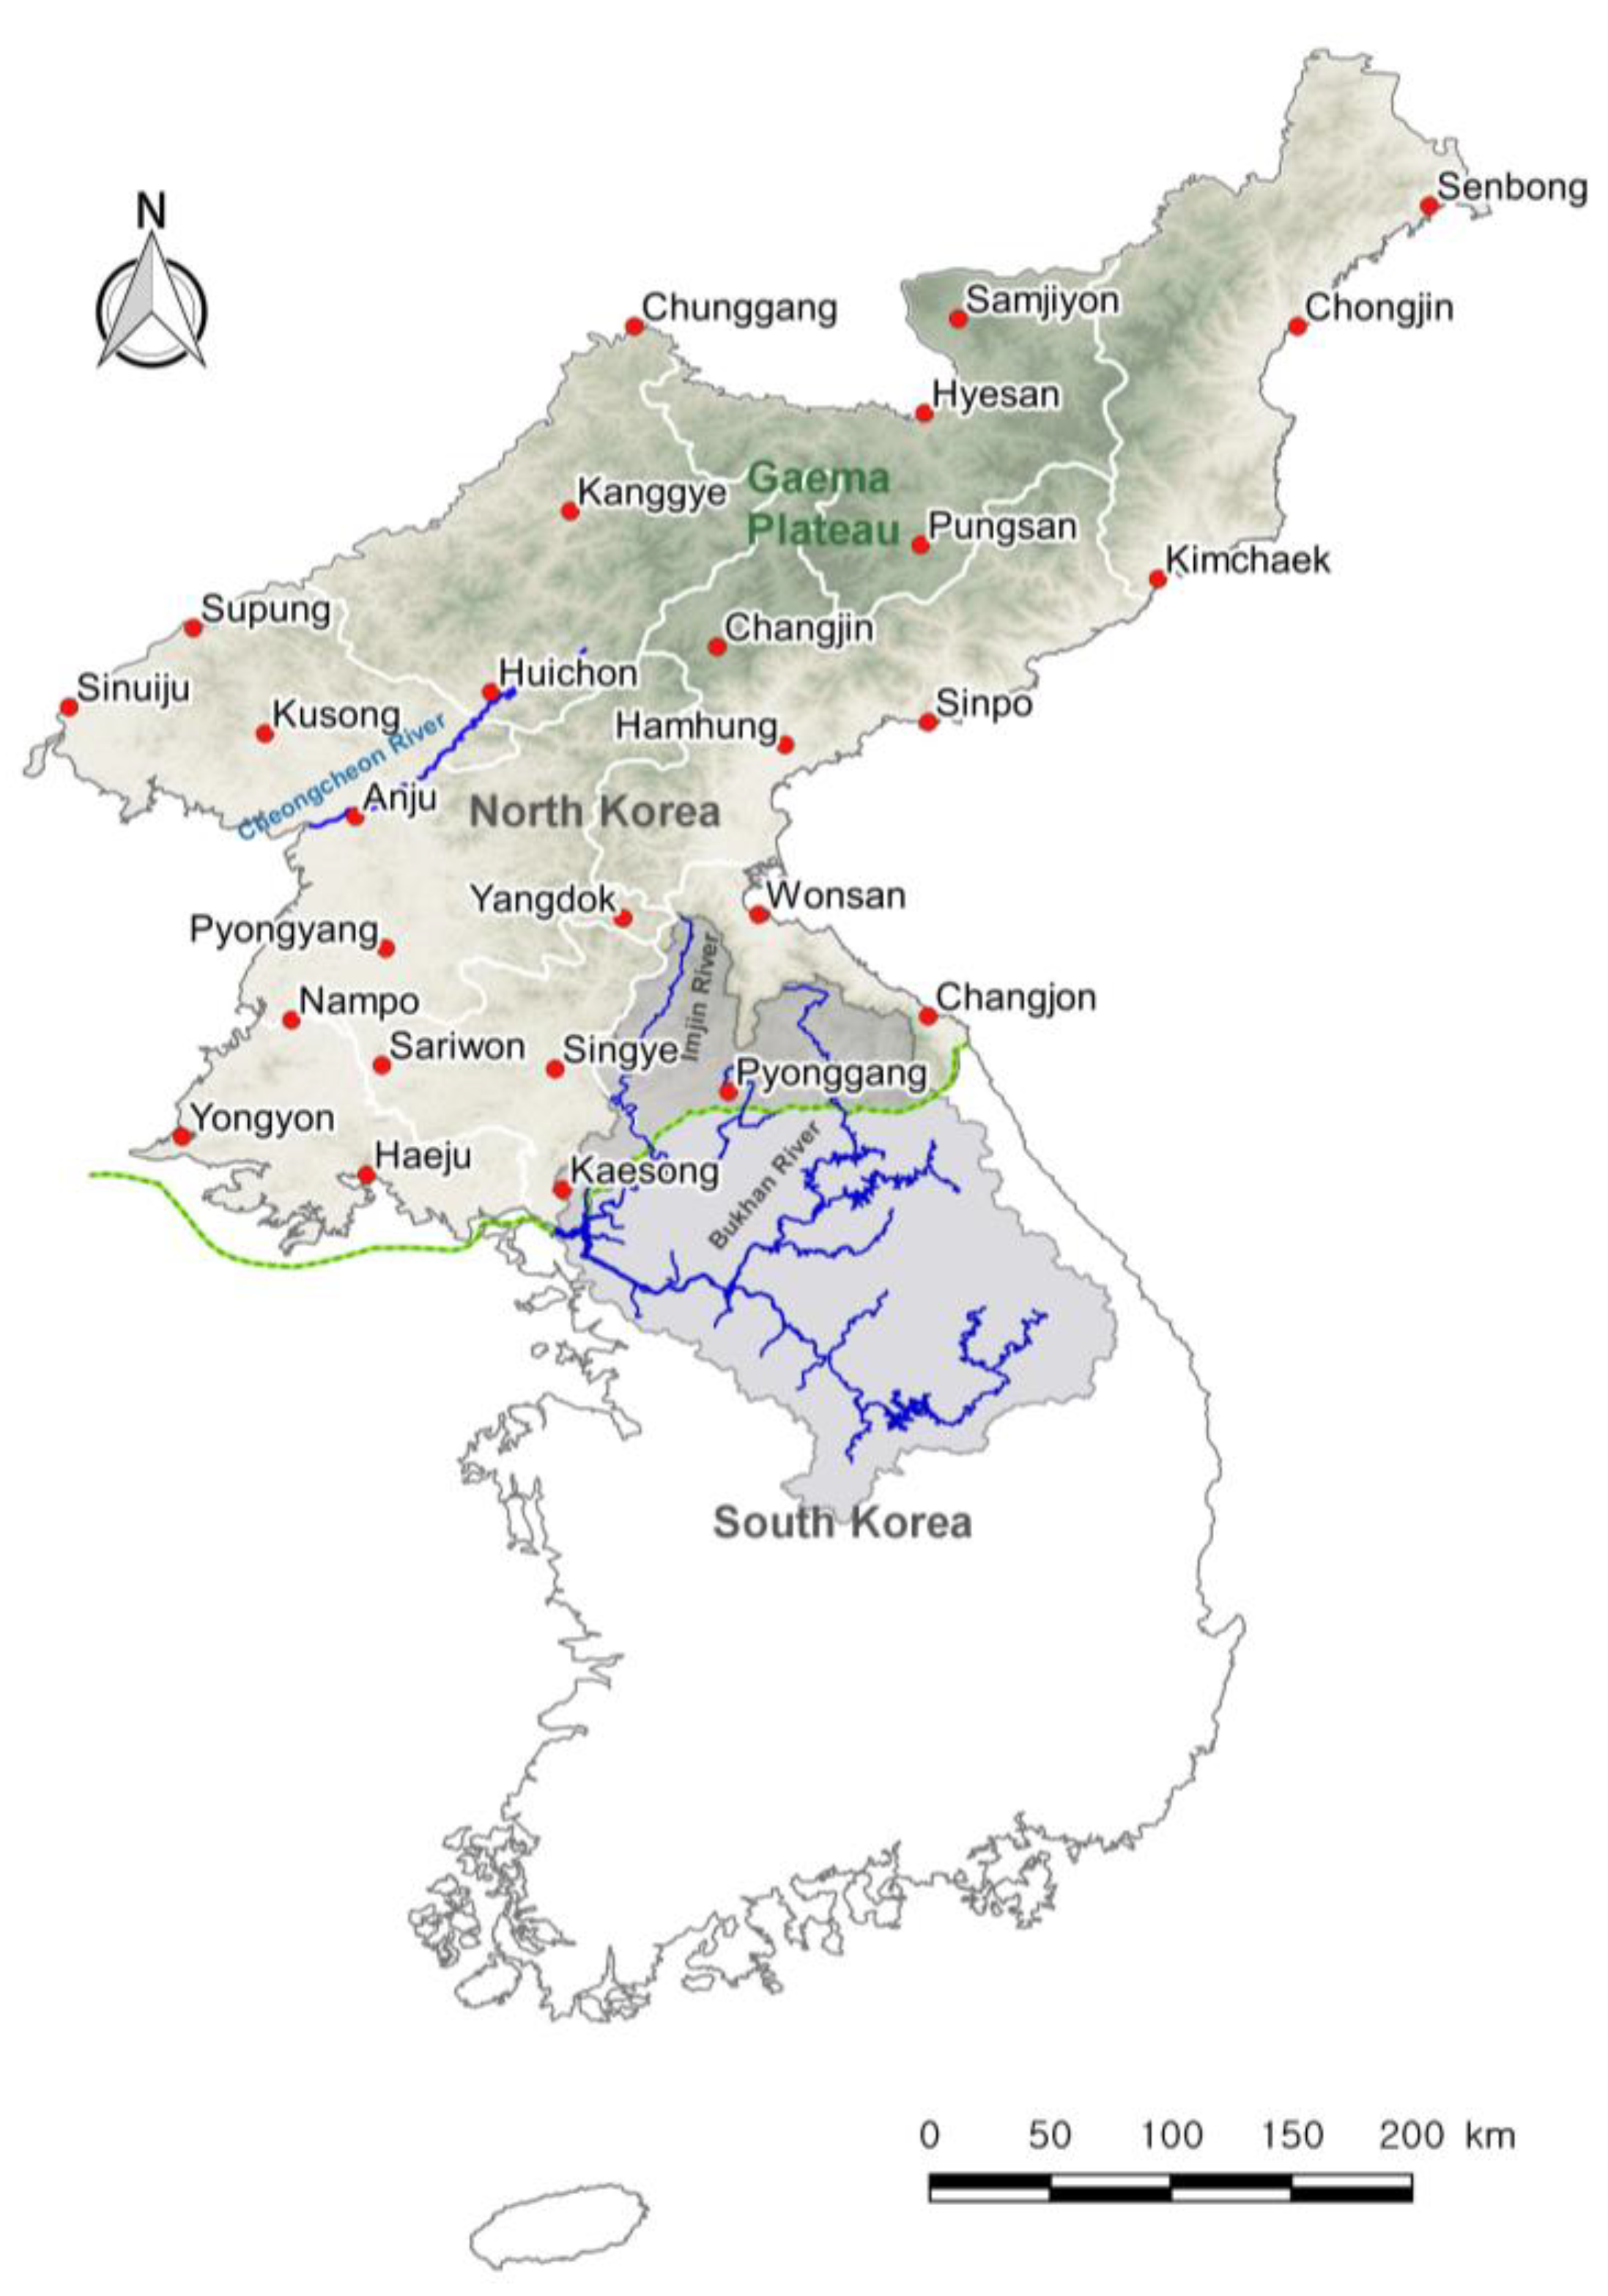
North Korea is the part that lies north of the Military Demarcation Line (MDL) established by the armistice agreement of July 1953. Its area is 123,138 km2, which is 55.1% of the total area of the Korean Peninsula—223,477 km2 (Figure 2). More than 80% of the country is mountainous, and rugged mountains higher than 2000 m are widely distributed. South and North Korea share the Bukhan and Imjin rivers on the MDL boundary. Since 2000, the downstream river flows have decreased owing to the construction of dams in the upper reaches, and in 2009, flood damage occurred at downstream rivers in South Korea because of the release of Hwanggang Dam, located on the Imjin River, North Korea. As North Korea has high seasonal variability in climate, 49% of the annual precipitation of 900.8–440.7 mm is concentrated in July and August, and precipitation is relatively low in winter and spring.
2.3. Climate Change Scenarios
Because of the considerable uncertainty in climate projections, caused by different dynamic systems, grid sizes, and parameterizations of the physical processes, many studies have focused on quantifying the uncertainty of climate change scenarios in climate change impact assessments (Sung et al. [12]). For quantifying the uncertainty in climate change scenarios, many studies recommend the multimodel ensemble [9,10,11,12,13]; this leads to the problem of selecting appropriate scenarios [26,27]. Many studies suggest that scenarios should be weighted appropriately for the ensemble results [28,29,30]. However, the Intergovernmental Panel on Climate Change (IPCC) adopted a “one model, one vote” interpretation of Coupled Model Intercomparison Project Phase 3 (CMIP3) and CMIP5 projections in its fourth and fifth assessment reports, respectively [31,32]. Our research enables the exploration of a range of future climate changes at the local scale using all climate scenarios as suggested in the IPCC AR5 and AR3.
In this study, 25 GCMs were downscaled to a local scale for 27 local meteorological sites in North Korea (Table 1). In CMIP5, we used the RCP4.5 and RCP8.5 scenarios. The RCPs describe four pathways: a stringent mitigation scenario (RCP2.6), two intermediate scenarios (RCP4.5 and RCP6.0), and one scenario with very high GHG emissions (RCP8.5). The radiative forcing of RCP8.5, RCP6.0, RCP4.5, and RCP2.6 corresponds to approximately 3.6%, 2.5%, 1.9%, and 1.1%, respectively, of the incident solar radiation (238 W/m2) [33]. Using climate projections at the grid points of each GCM, we applied statistical downscaling methods to downscale to the weather stations in the study area (Figure 2; Table 2).
The Asia Pacific Economic Cooperation Climate Center (APCC) Integrated Modeling Solution (AIMS) produced downscaled climate projection data for South Korea using two bias-corrected spatial disaggregation (BCSD) methods [13]. These are the simple quantile method (SQM) and spatial disaggregation with quantile delta mapping (SD-QDM) [18], which can preserve the long-term temporal trends in climate. This study used the downscaled future projections of daily precipitation and temperature of 25 GCMs of the CMIP5 for RCP4.5 and RCP8.5 at 27 meteorological stations of North Korea (Figure 2) provided by AIMS.
The downscaling method used in this research is SD-QDM, which is applied to preserve GCM-driven long-term trends. SD-QDM combines the daily BCSD methods [14], referred to as quantile mapping (QM) and QDM. Cannon et al. [17] proposed quantile delta mapping (QDM), designed to preserve absolute or relative changes in all of the quantiles. The QDM algorithm performs two steps: first, relative changes in all quantiles between the current and future periods are calculated and model values are bias-corrected based on observations made through quantile mapping and second, the model-projected relative changes in each quantile are superimposed on the bias-corrected model outputs [17].
We formulated empirical cumulative distribution functions (CDFs) with daily climate data within a moving window to reflect the seasonality of the area. Eum and Cannon [18] tested various moving window sizes, e.g., 15, 30, 90, and 180 days, to investigate the effects of the moving window size on extreme climate indices. Their study showed that a 15-day moving window better reflected the seasonality of the climate index for South Korea. Therefore, this study employed the same moving window size (15 days).
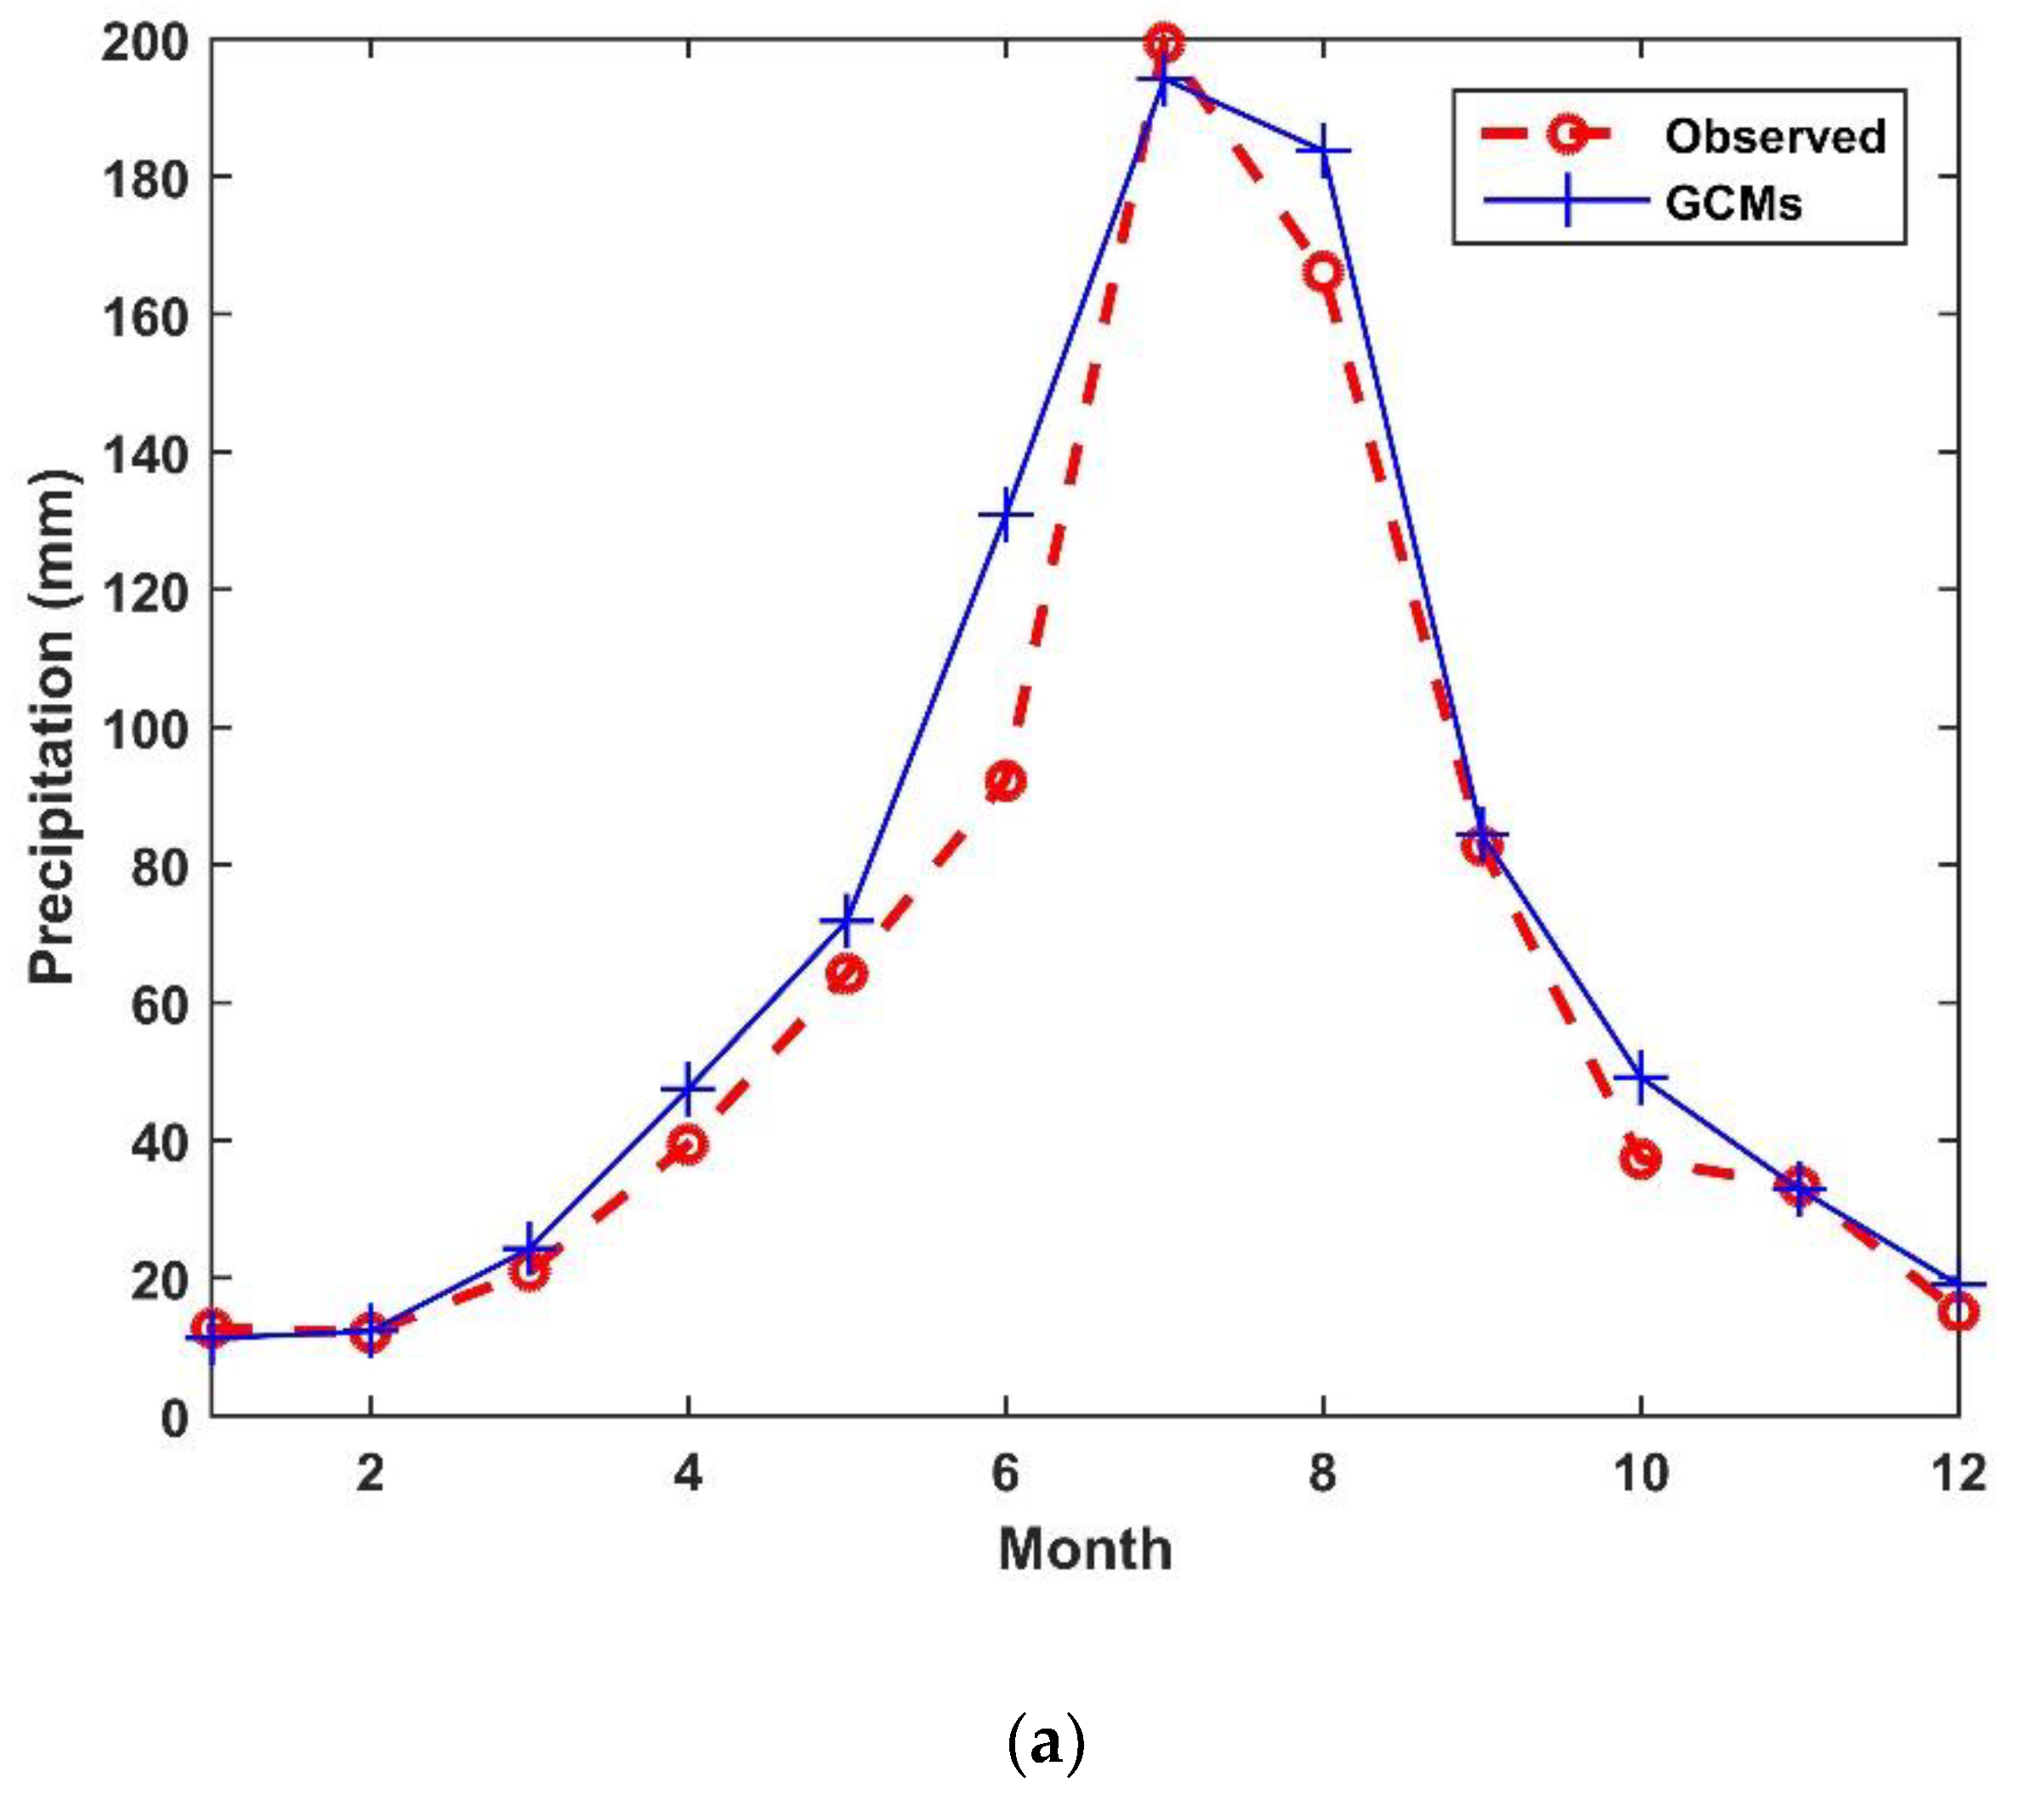
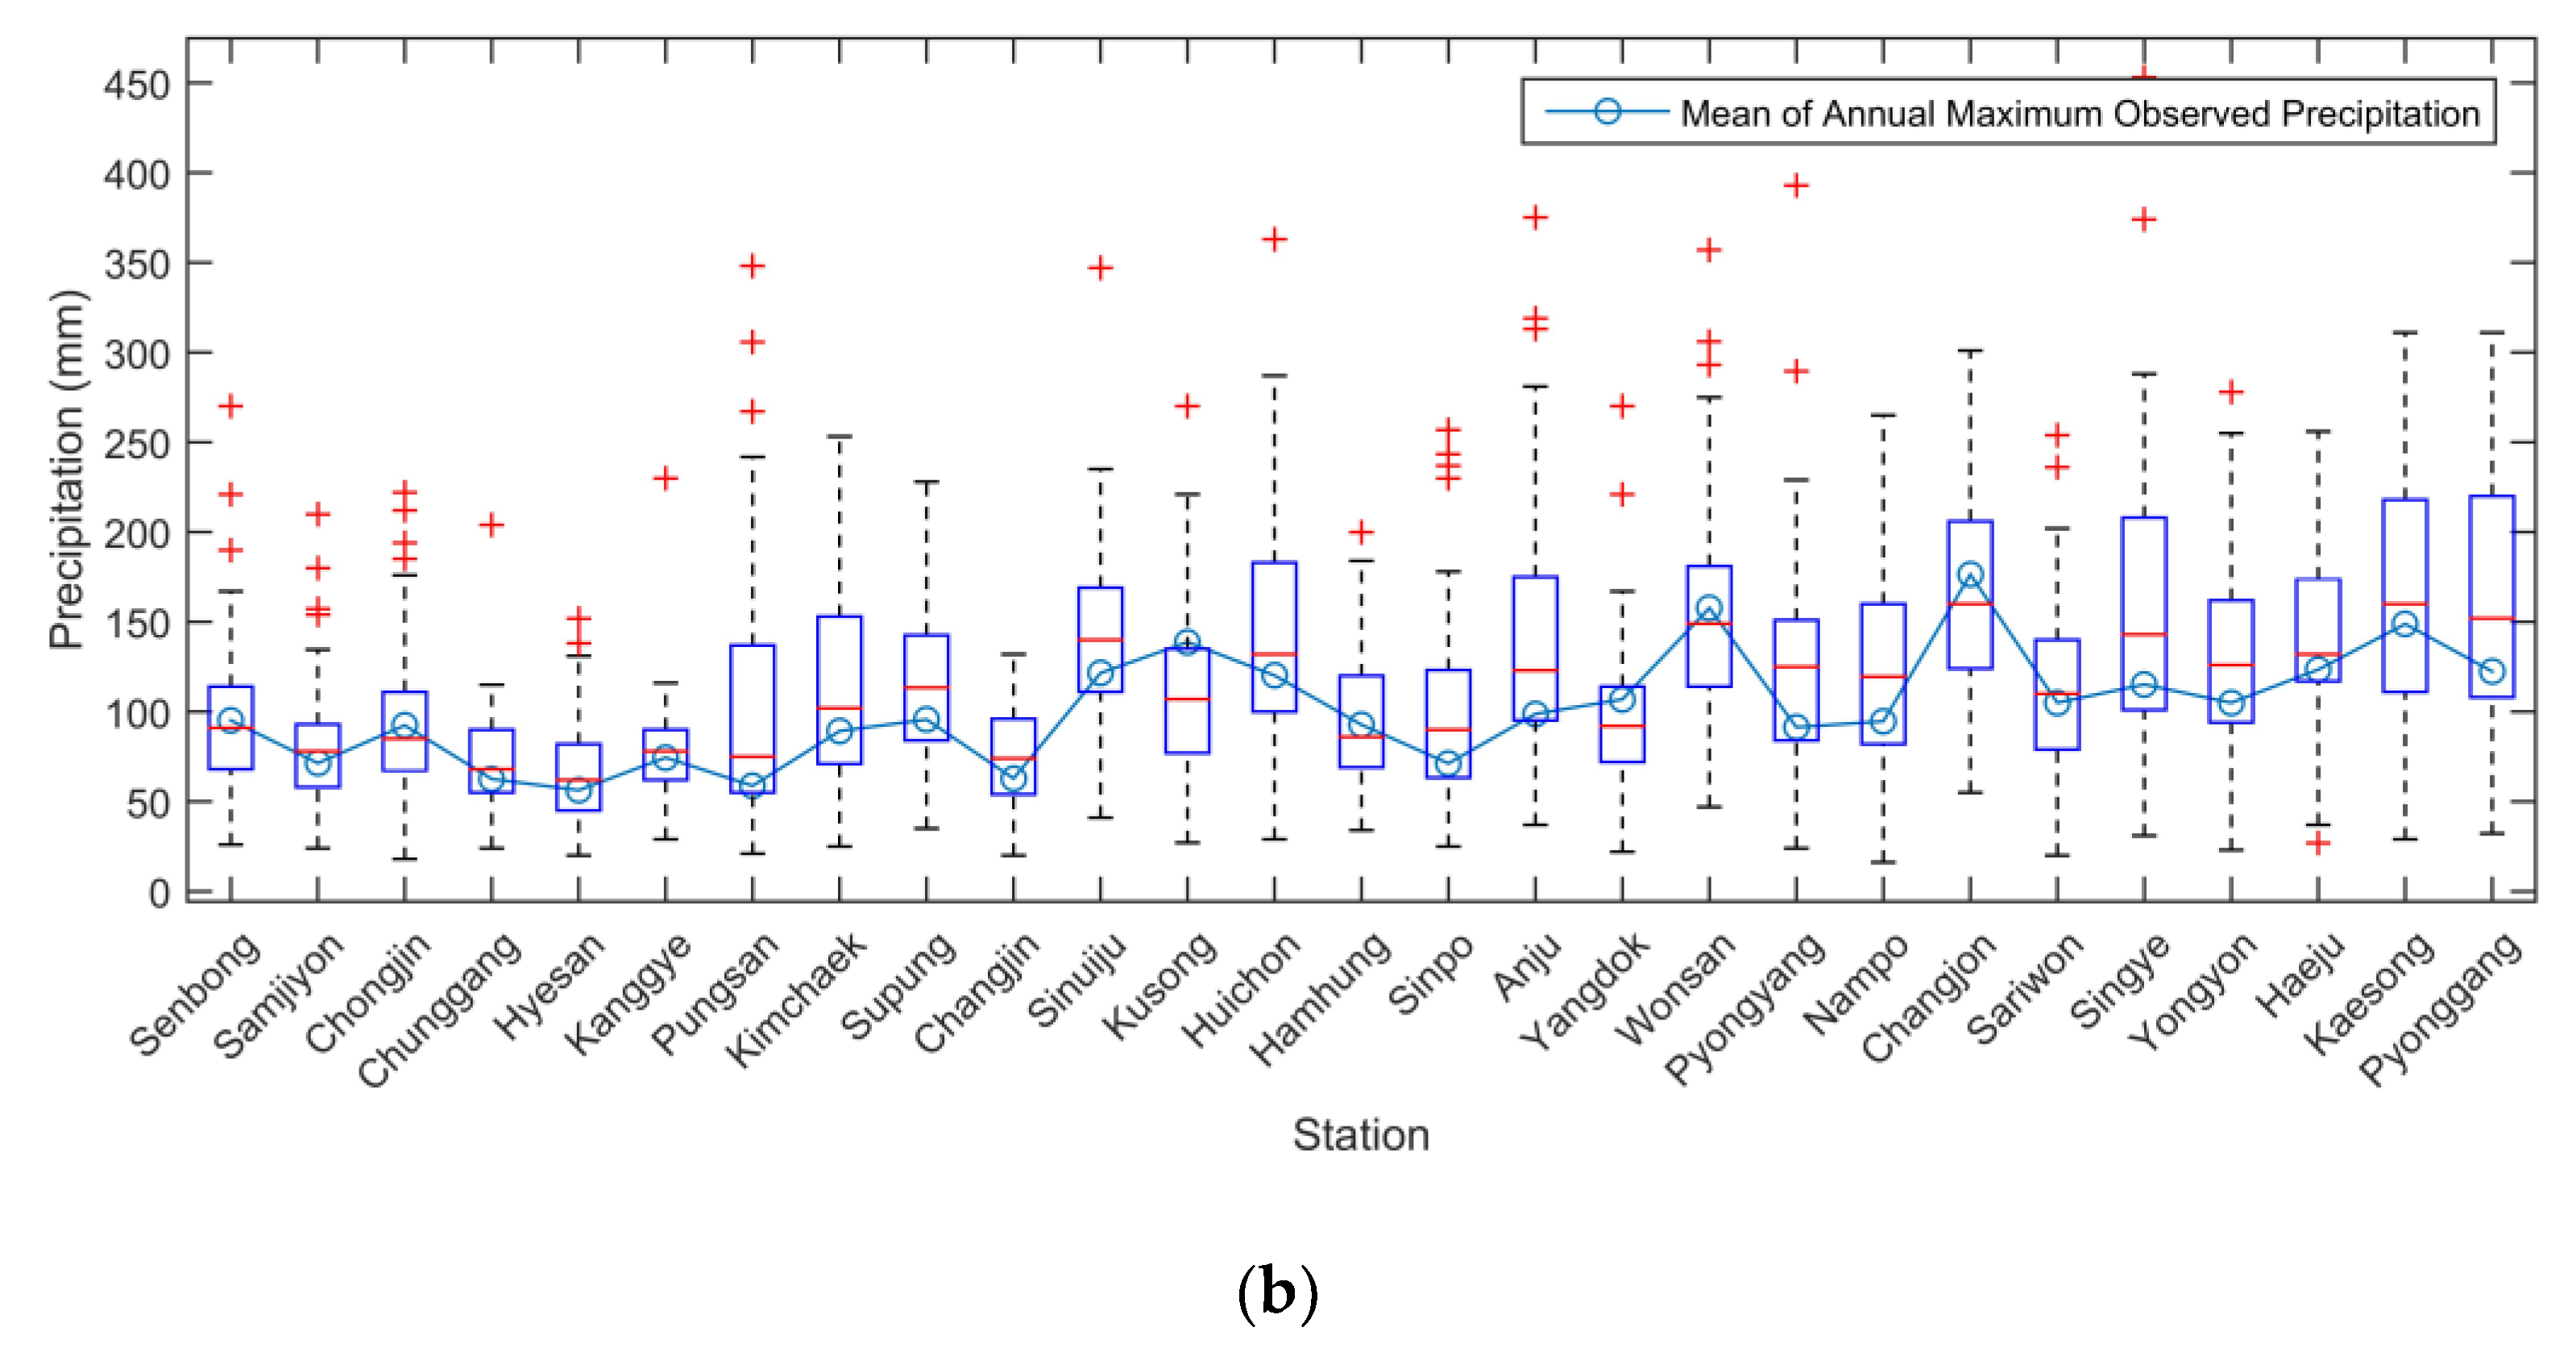
We compared the observed precipitation with simulated precipitation from the 25 GCMs to determine how well GCMs are able to simulate the observed climatology and variability for 1980–2005. Figure 3a shows a comparison of monthly precipitation averages for North Korea. The observed precipitation generally lies within the spread of the averages from the 25 GCMs, with considerably similar monthly variability in most months. Observed and simulated AMDP from the average of the 25 GCMs at local scales were calculated; these are shown in Figure 3b. The range of each box plot represents the variability among the GCMs, indicating observations that lie within the 25th- and 75th-percentile boundaries of the GCMs. We confirmed that the climatologies captured by the models are in good agreement with the observations.
2.4. Generalized Extreme Value
The GEV distribution has been widely used to describe hydrometeorological extreme variables [34,35,36]. The CDF, which estimates the non-exceedance probability, can be estimated by Equation (1), and its solution is estimated using Equation (2) [37]:
where , , and are location, scale, and shape parameters, respectively. Because the GEV has for , the distribution has a thicker right-hand tail for . We used the GEV Type II distribution. The L-moment provides greater reliability because it is less sensitive to outliers, and for smaller samples, the method of L-Moments calculates more accurate parameters than the method of moments (MOM) [38]. Therefore, we employed the L-moment method to estimate the parameters. Klein Tank et al. [39] suggested the 20-year event for evaluating the magnitude and frequency of rare events that lie far in the tails of the probability distribution of weather variables. As the target, we selected AMDP under a 20-year return period.
3. Results
3.1. Change in Extreme Precipitation Amount in the Future Period
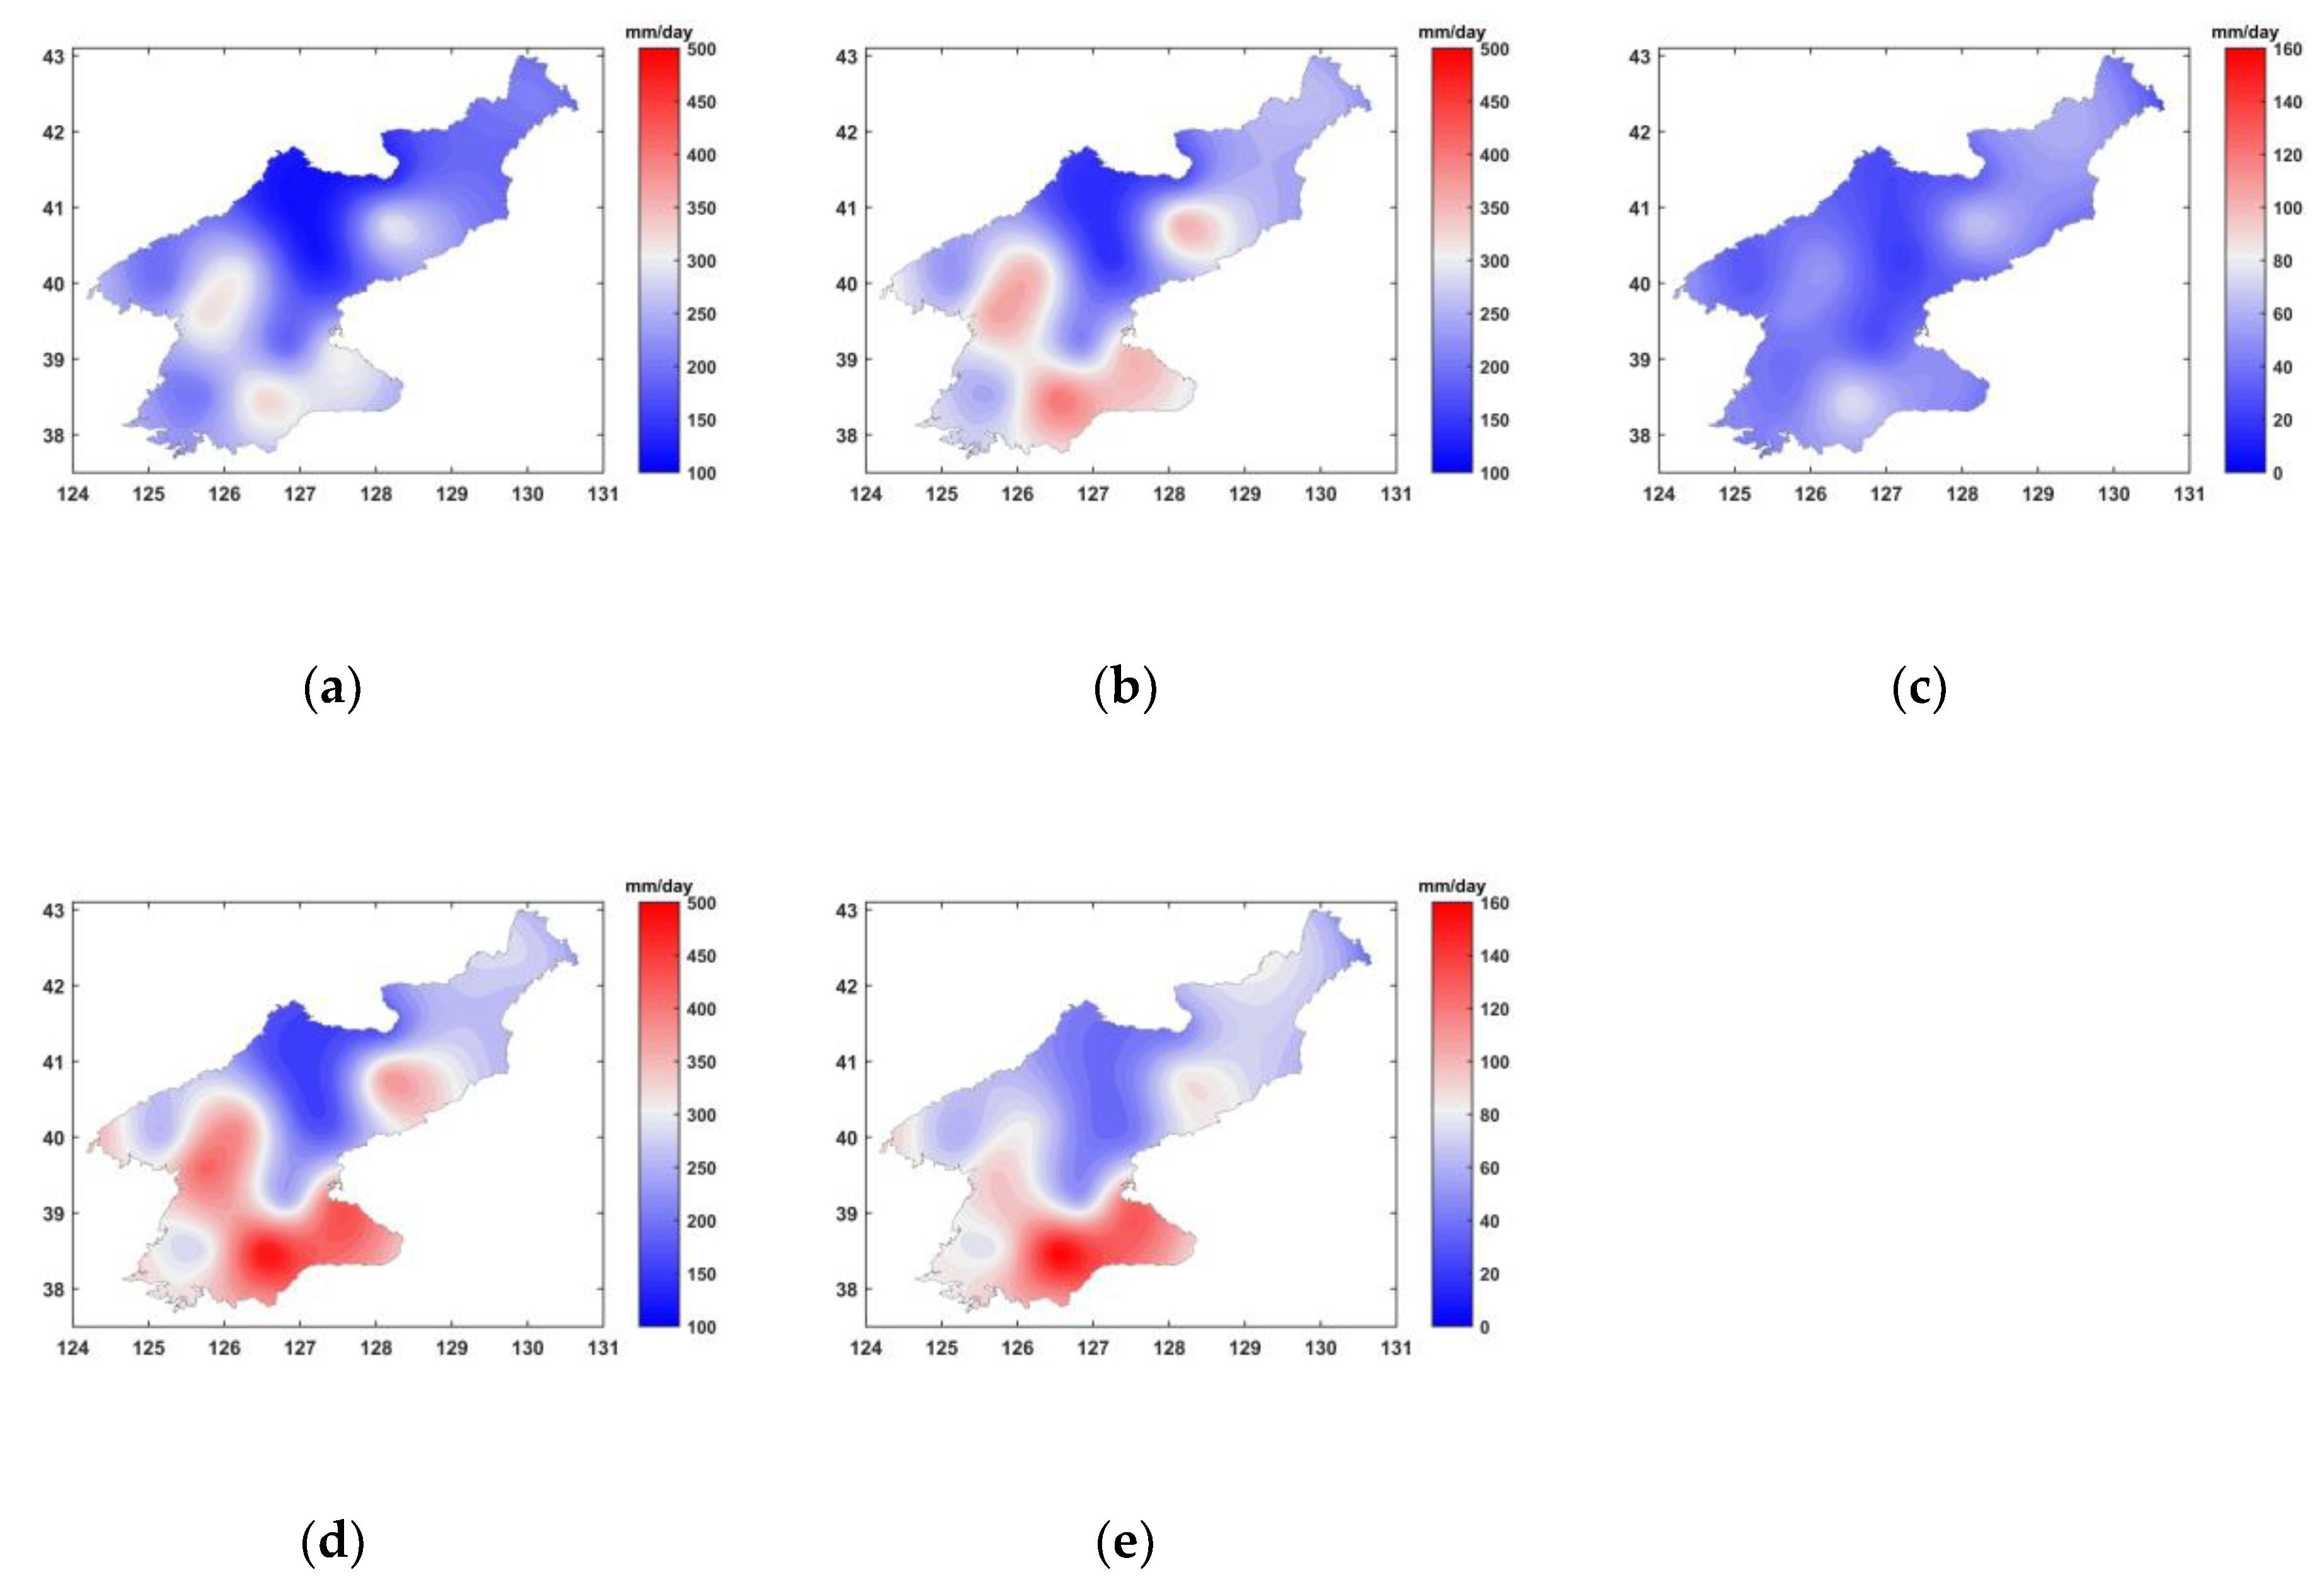
The spatial distributions of the 20-year precipitation averaged over 25 GCMs are shown in Figure 4; they are interpolated results of the mean of the model for each station. These identify the regional variation in extreme precipitation during the reference period (Figure 4a) and future periods based on RCP4.5 and RCP8.5 (Figure 4b,d, respectively). Figure 4c,e shows the difference between F3 and the reference period. Spatial distributions under RCP4.5 and RCP8.5 in the F3 period are very similar, projecting that the 20-year precipitation in the southern region including Changjon of East Sea, and in the central region including Anju and Huichon, will increase. In particular, the region including the Anju and Huichon stations, at the middle and upstream parts of the Cheongcheon River, is an area of high precipitation because of a topographic effect. In F3 under RCP8.5, the precipitation in the southern region of North Korea and the middle and upstream parts of the Cheongcheon River was projected to be higher than under RCP4.5, representing an increase of more than 150 mm compared with the reference period (Figure 4d). As a result of comparing regional averages in each future with the reference period, 20-year frequency precipitation was projected to increase as much as 43.4 mm under RCP4.5 (Figure 4c) and 80.7 mm under RCP8.5 (Figure 4e) in F3 in comparison with the reference period. The increase in the regional mean of 20-year precipitation was larger for RCP8.5 than for RCP4.5.
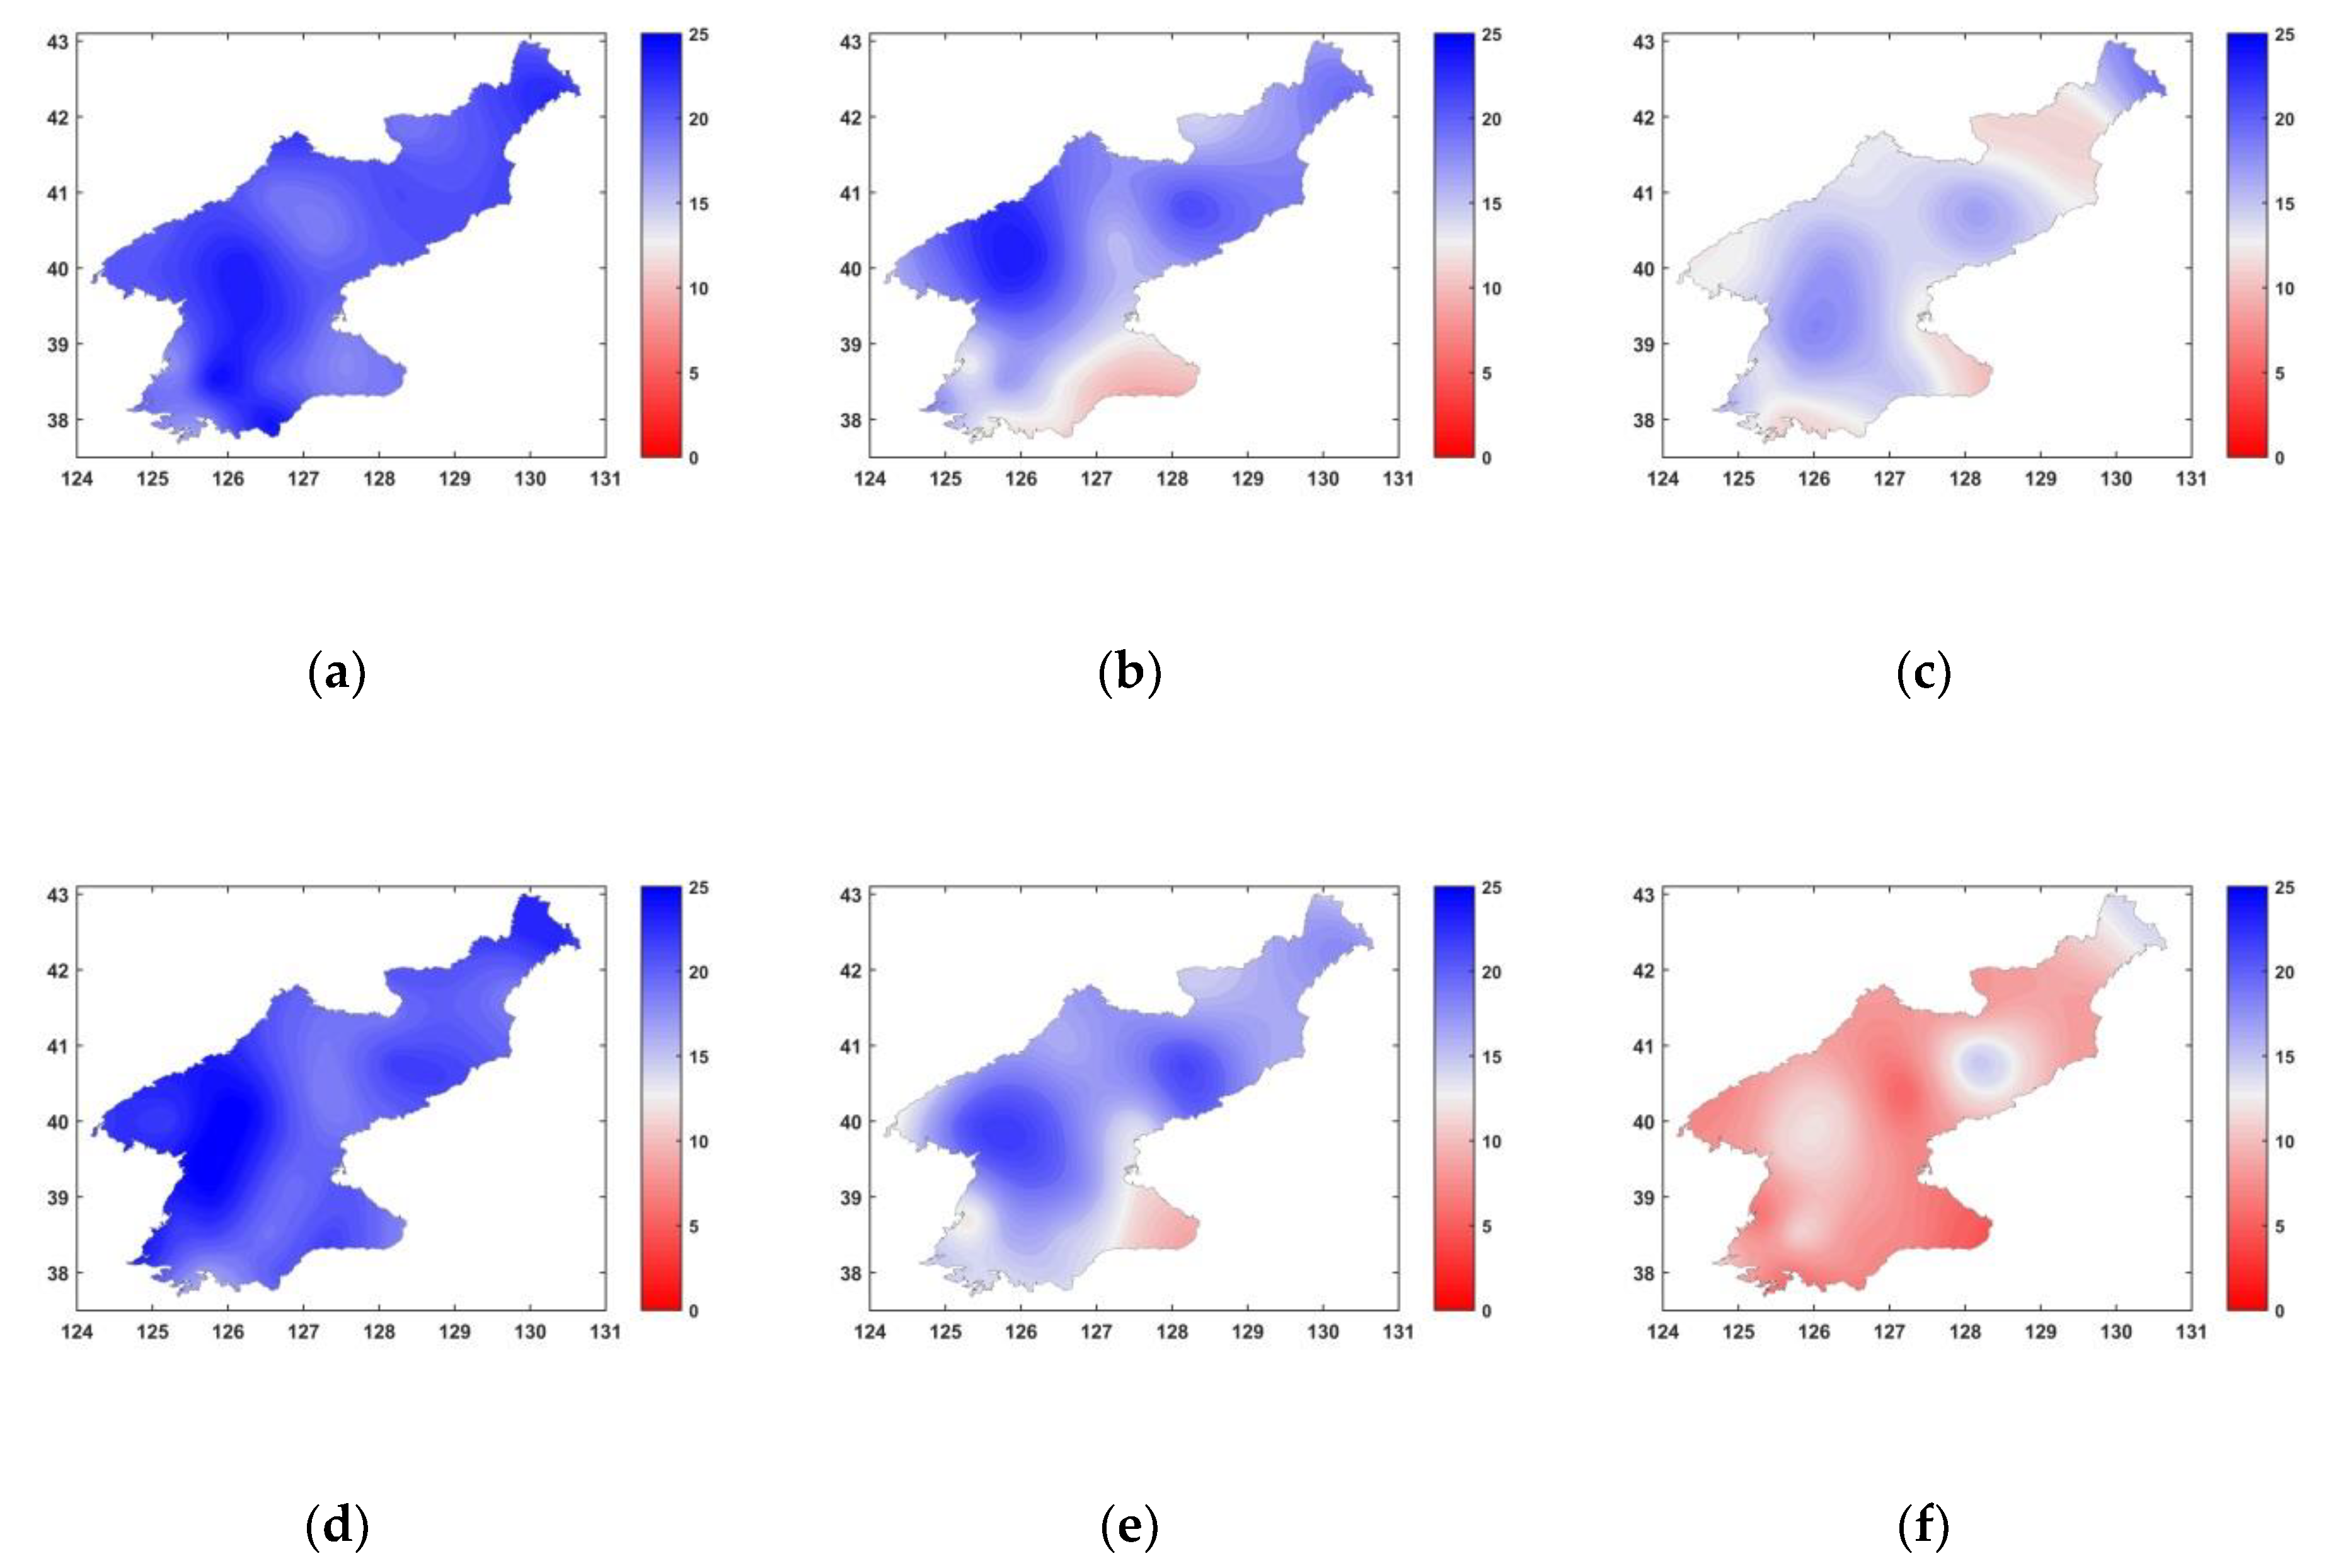
An increase in 20-year precipitation was identified toward F3, and this increase was clearer under RCP8.5 than under RCP4.5. Levels of precipitation occurring every 20 years were expected to occur more frequently in the future, and the frequency changes in the future for 20-year precipitation were investigated (Figure 5). First, in F1, the return periods under the RCPs increased slightly compared with the reference period; they were projected to be 20.7 years (RCP4.5) and 21.1 years (RCP8.5) (Figure 5a,d, respectively; Table 2). In F2, the return periods were shorter than 20 years; they were projected to be 16.9 years (RCP4.5) and 16.2 years (RCP8.5) (Figure 5b,e, respectively; Table 3). This decrease in the return period was prominent in the southern region of North Korea near the MDL. In F3, under RCP8.5, the return period was projected to be extremely short in all areas except Gaema Plateau—8.8 years—and under RCP4.5, it was projected to be 14.1 years (Figure 5f and Table 3, respectively).
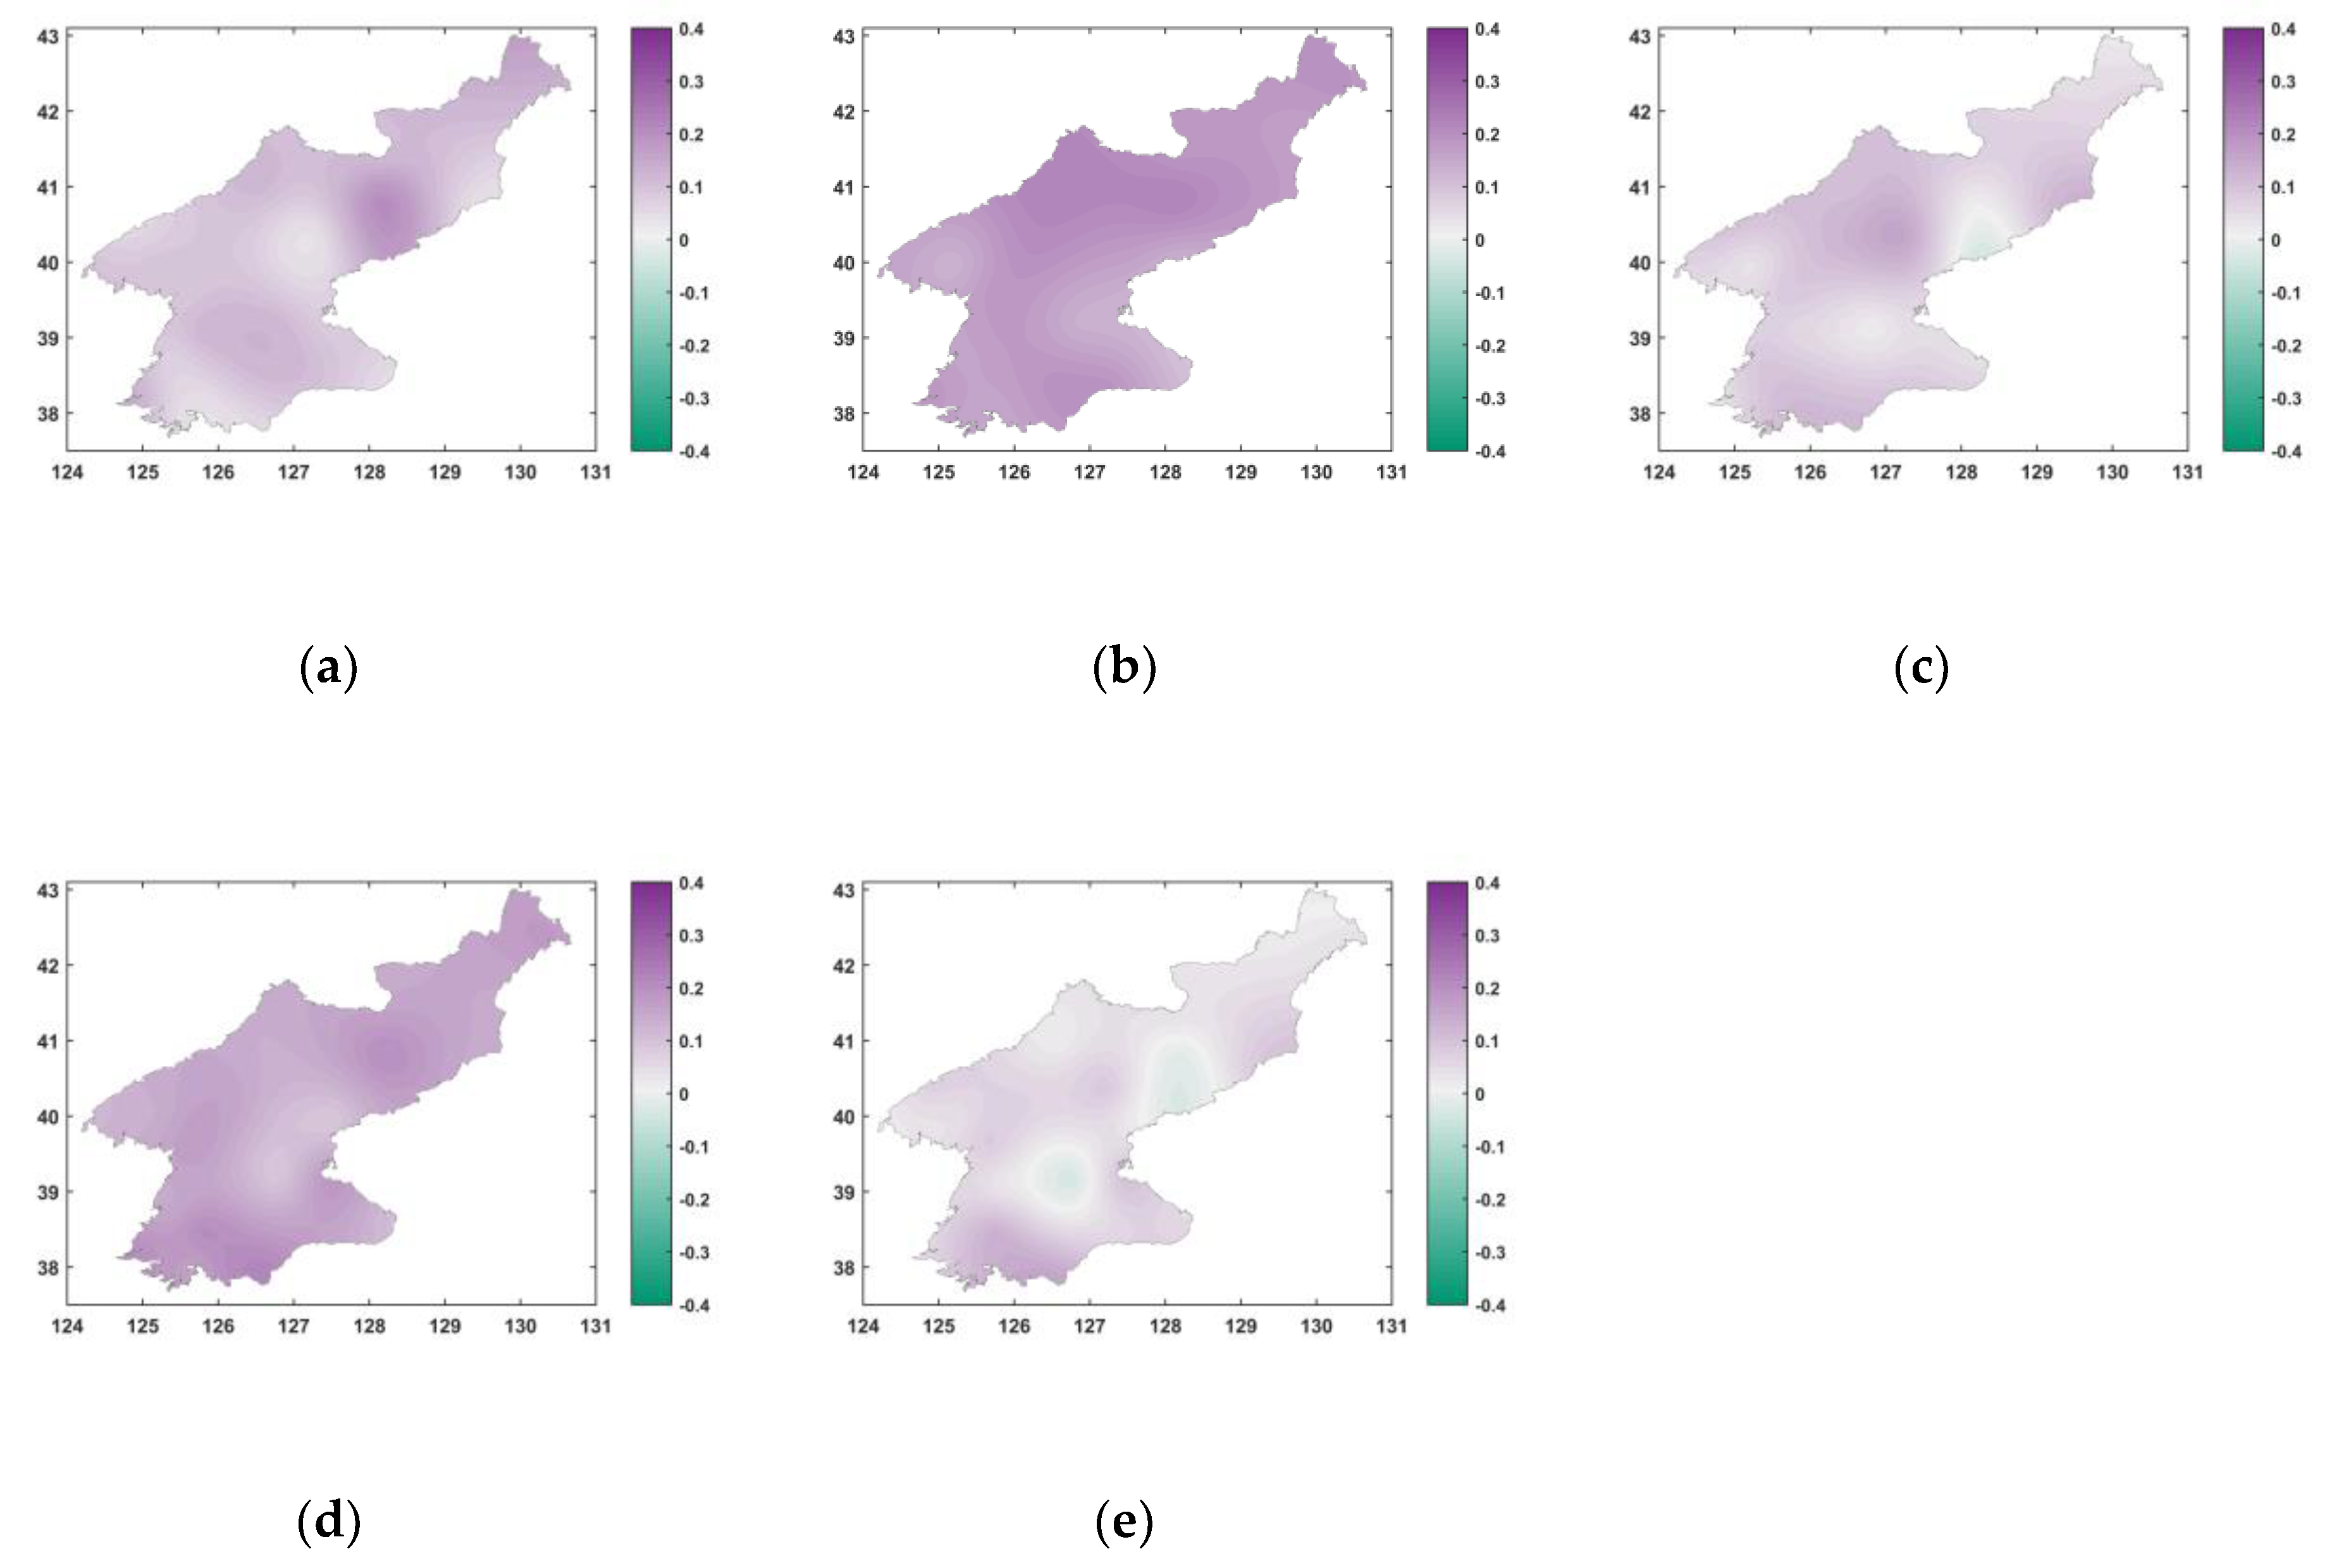
The coefficient of variation (CV) was calculated from the average values of the 20-year precipitation of 25 GCMs at the station scale; thus, it represents the variation relative to the mean of the 20-year precipitation among the climate change scenarios. The CV can be used to assess the variability for groups with different means, and we calculated this metric to compare the distribution of 20-year precipitation derived from the 25 GCMs for each period (Figure 6). There was a slight nonstationarity in the spatial distribution of the CV. The area of large CV was broader in F3 than in the reference; this indicates that the variation in climate projections may contribute considerably to the distribution of 20-year precipitation in the future. The spatially averaged CV was projected to increase slightly (by 0.077 (RCP4.5) and 0.057 (RCP8.5)) in F3 compared with the reference period. The 20-year frequency precipitation increased by as much as 43.4 mm (RCP4.5) and 80.7 mm (RCP8.5) on average, but the standard deviation compared with the average increase is less under RCP8.5 than under RCP4.5. Under RCP8.5, the 20-year frequency precipitation was projected to be evenly distributed around the mean, whereas RCP4.5 projects a large variation around the mean.
3.2. Change in Probability Distribution in the Future Period
It was projected that extreme precipitation in North Korea will increase in average and variance as time goes forward. As shown in Figure 4, the 20-year precipitation increased over time; in the areas where precipitation was larger than other areas in the reference period, future precipitation was expected to increase; the 20-year precipitation in the reference period occurred more frequently in the future (Figure 5). The increase in the CV of 20-year precipitation according to the projections provided by the 25 GCMs has widened over time (Figure 6). This trend was confirmed by the change in the probability distribution. Figure 7 shows the parameter values and return period of the GEV distribution for the extreme precipitation of present and future climates of the 25 models.
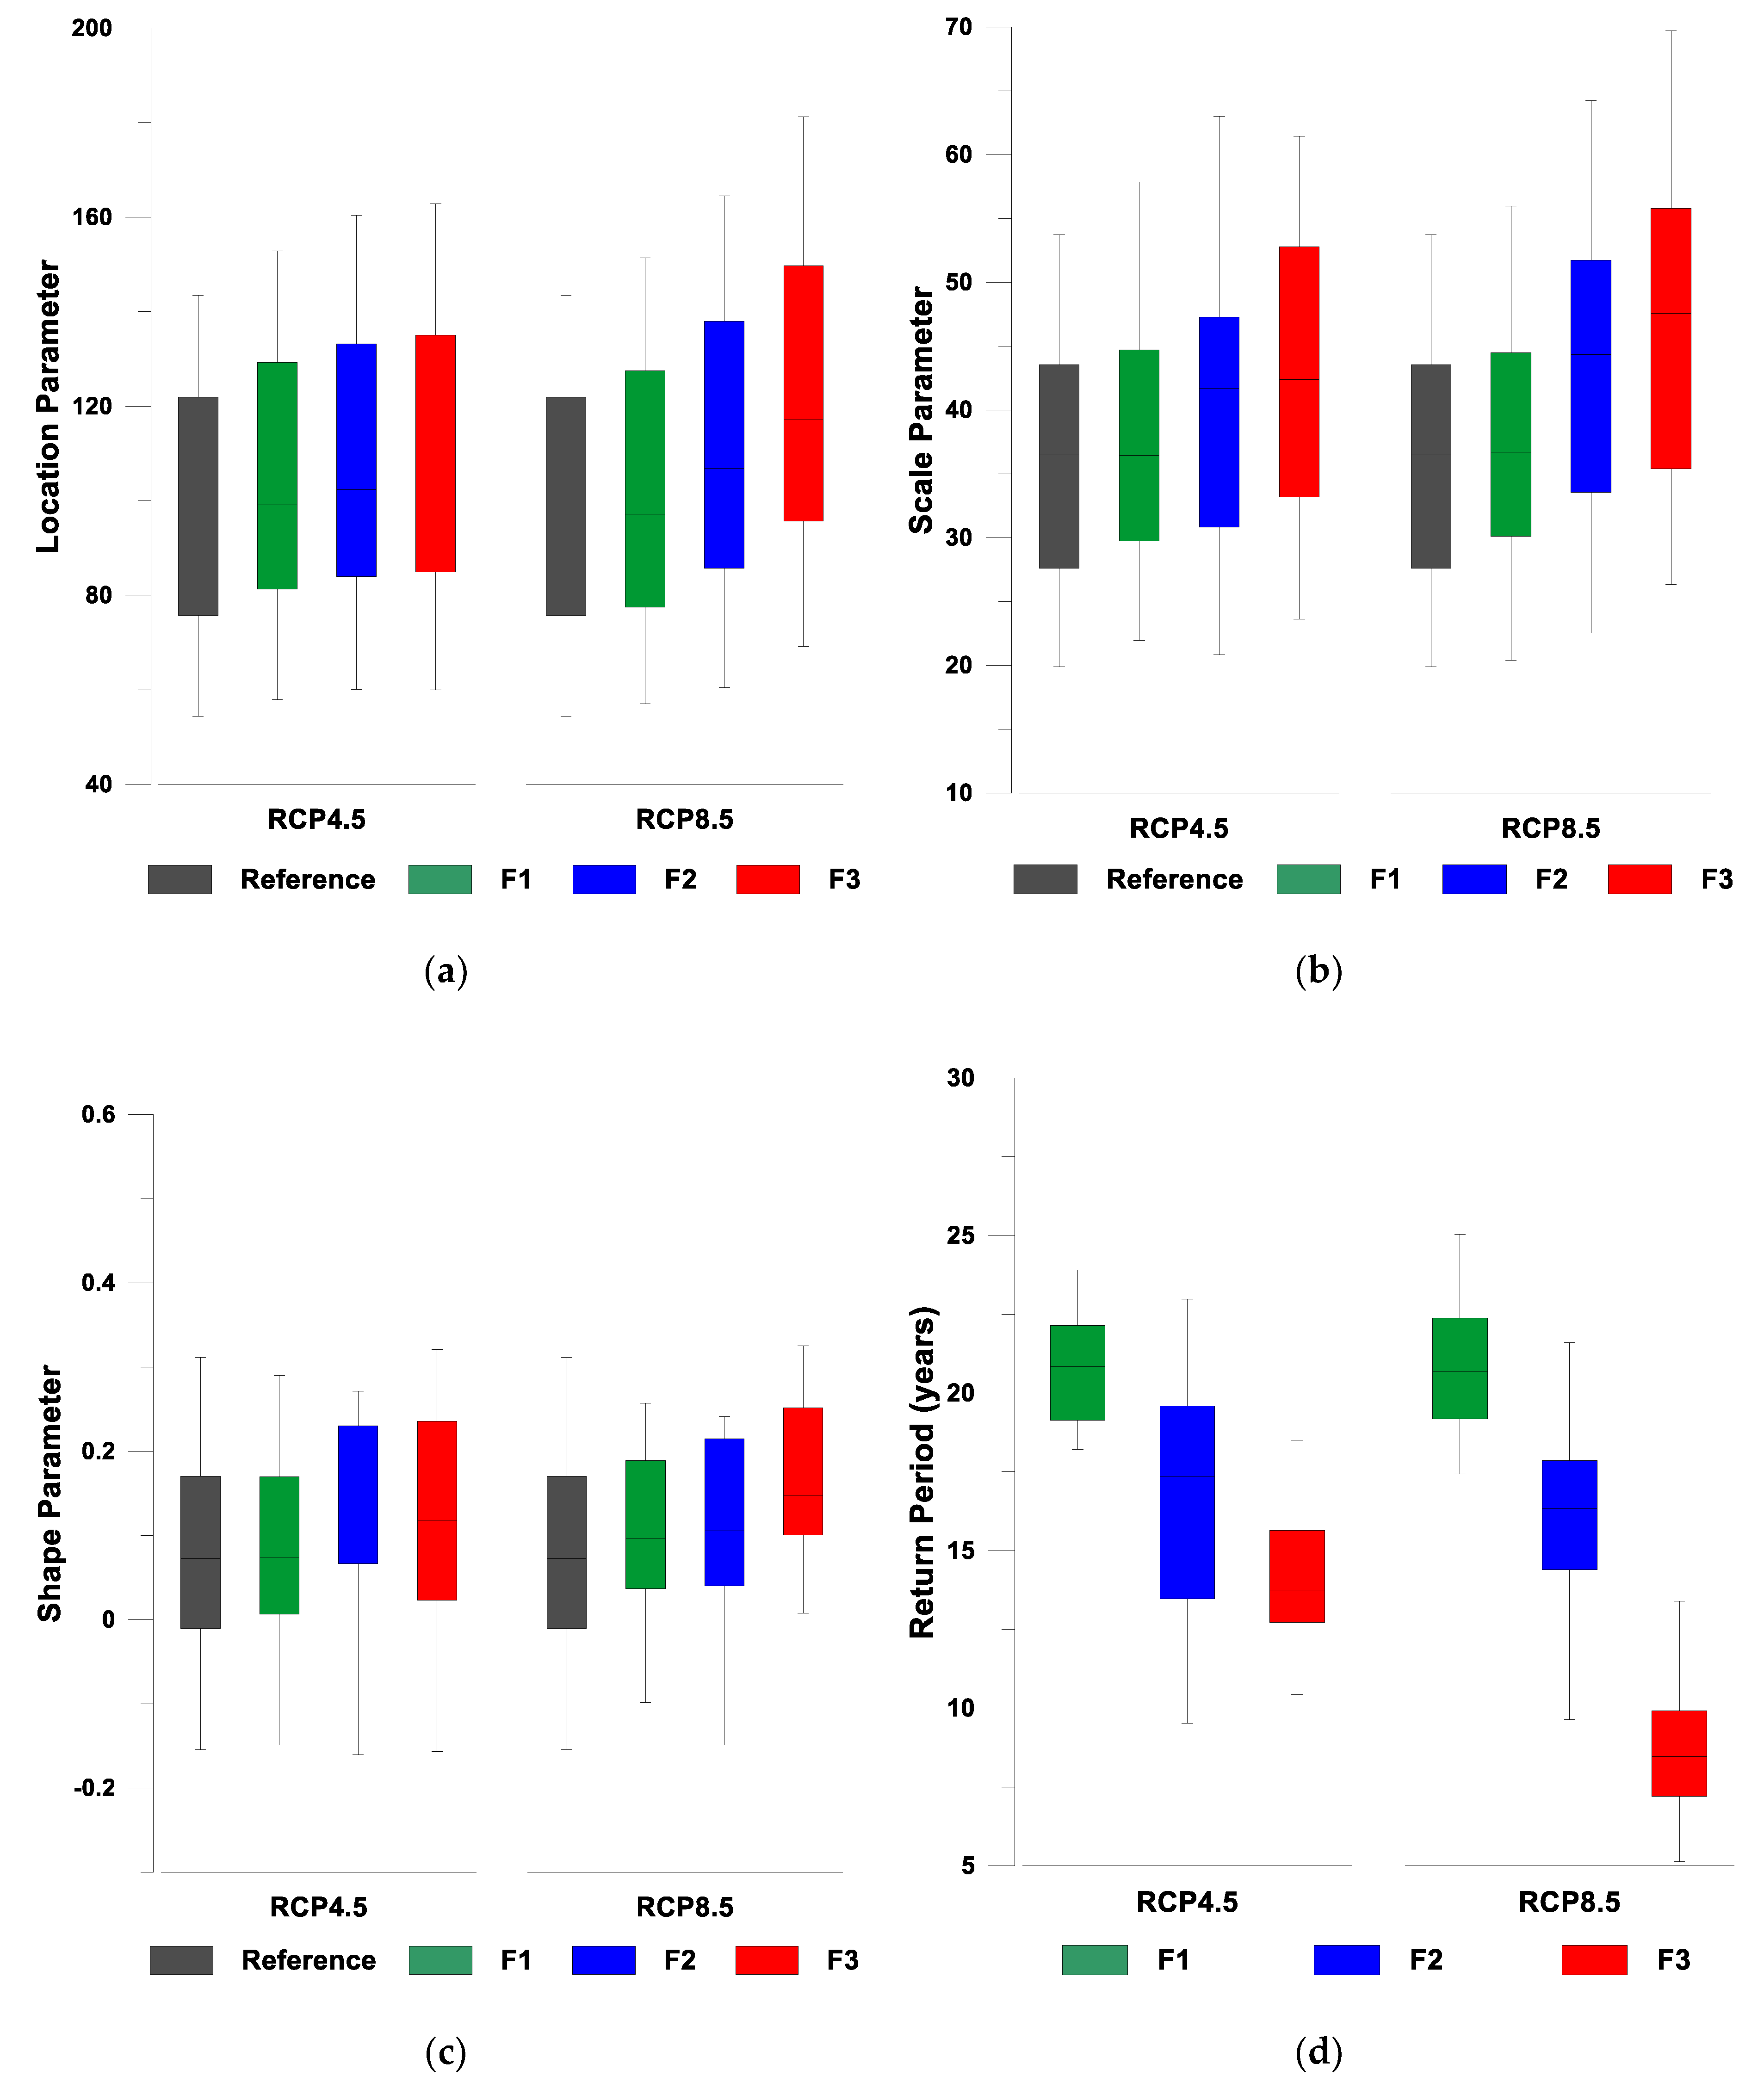
Under RCP4.5 and RCP8.5, the location parameter increased linearly (Figure 7a), and the scale parameter also increased in the future (Figure 7b), but there was less difference between the reference period and F1 than F2 or F3. The shape parameter became smaller overall as time progressed (Figure 7c); this indicates that the right tail of the GEV probability density function (PDF) becomes thicker in the future, and the occurrence of extreme precipitation becomes more frequent. The return period was projected to be relatively frequent in the future, having values of 16.1 years (F1), 11.4 years (F2), and 7.1 years (F3) under RCP8.5.
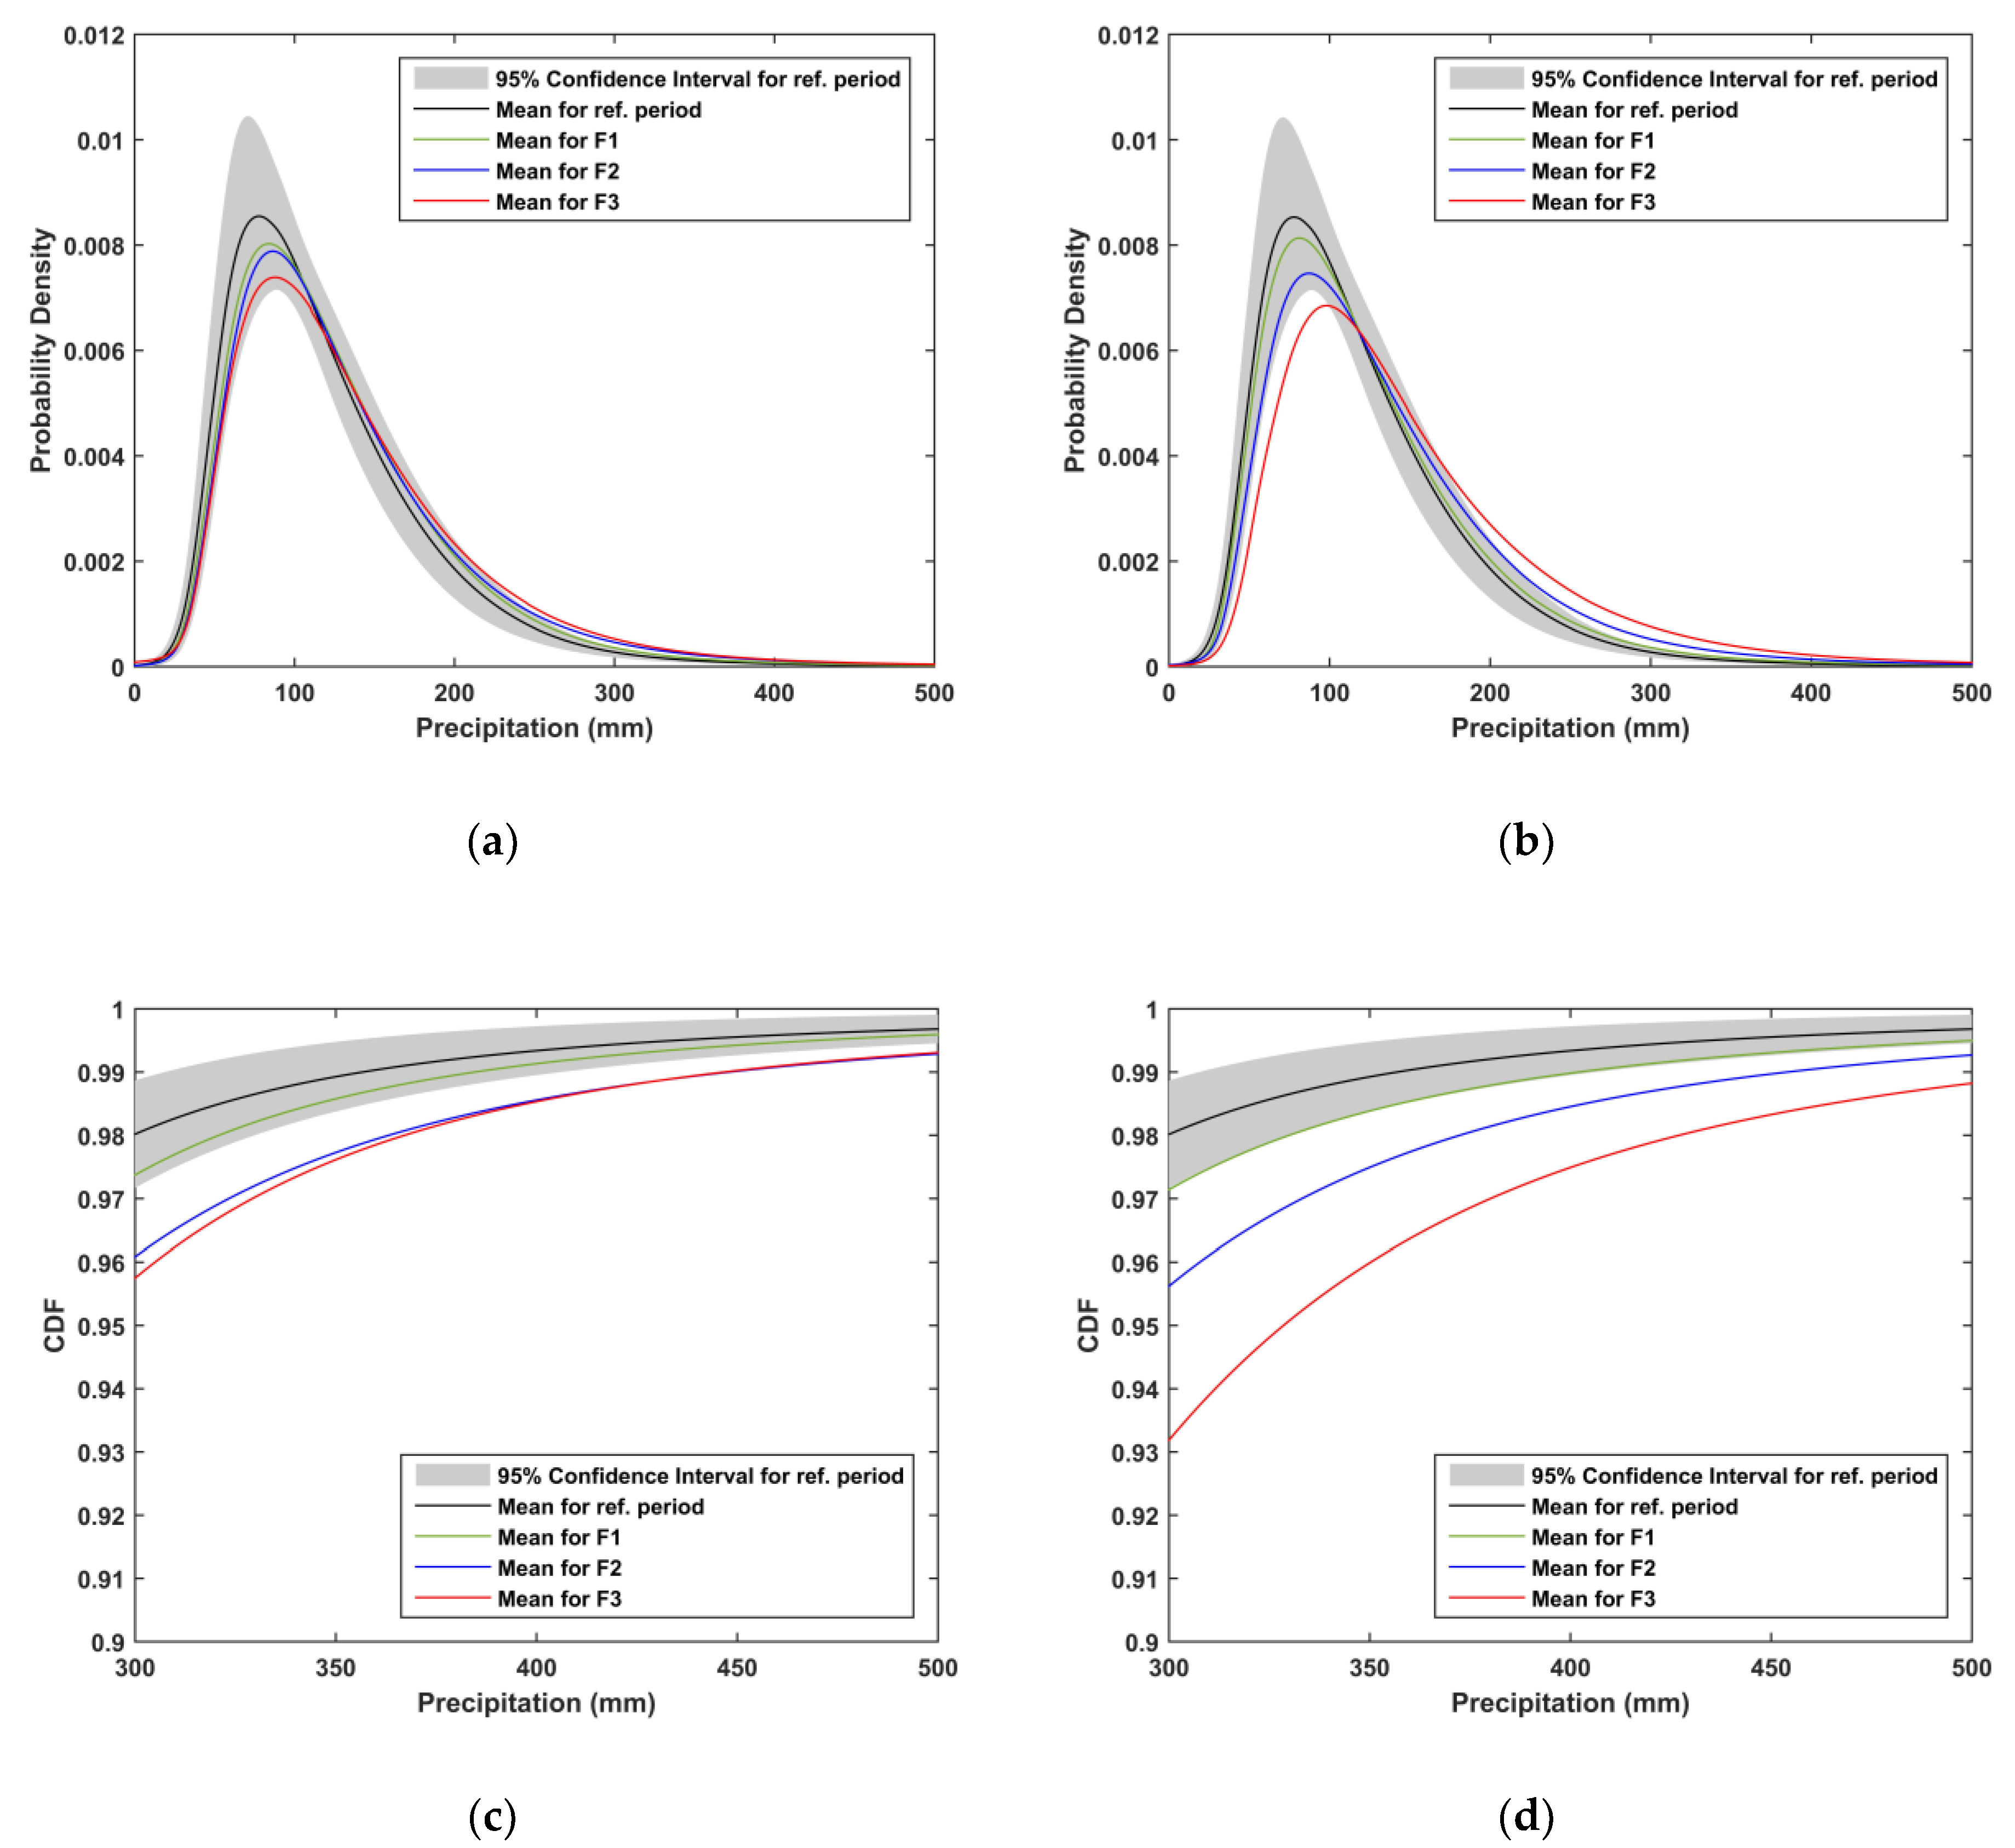
Changes in GEV PDFs and CDFs of the reference and future climates are analyzed in Figure 8. The black lines and gray bands are the means and confidence intervals (95%), respectively, of the PDFs under the reference climate. The confidence interval corresponds to the upper 95% and 5% limits of the 25 GCMs. Figure 8a,b presents the movement of GEV PDFs in the future relative to the reference climate; the green, blue, and red lines indicate the PDFs for F1, F2, and F3, respectively. Under RCP4.5 and RCP8.5, and the PDFs shifted to the right and the right tail thickened over time because of the increase in location and scale parameters and the decrease in shape parameter. In addition, we found that the CDFs of the future periods under RCP4.5 and RCP8.5 (Figure 8c,d) are located outside the 95% confidence interval of the CDF for the reference period, which means there is a significant difference in CDFs between the reference and future periods with the exception of F1. Therefore, an aggressive strategy by North Korea to respond to extreme precipitation resulting from climate change will be required.
3.3. Change in Extreme Precipitation at Shared River Basin
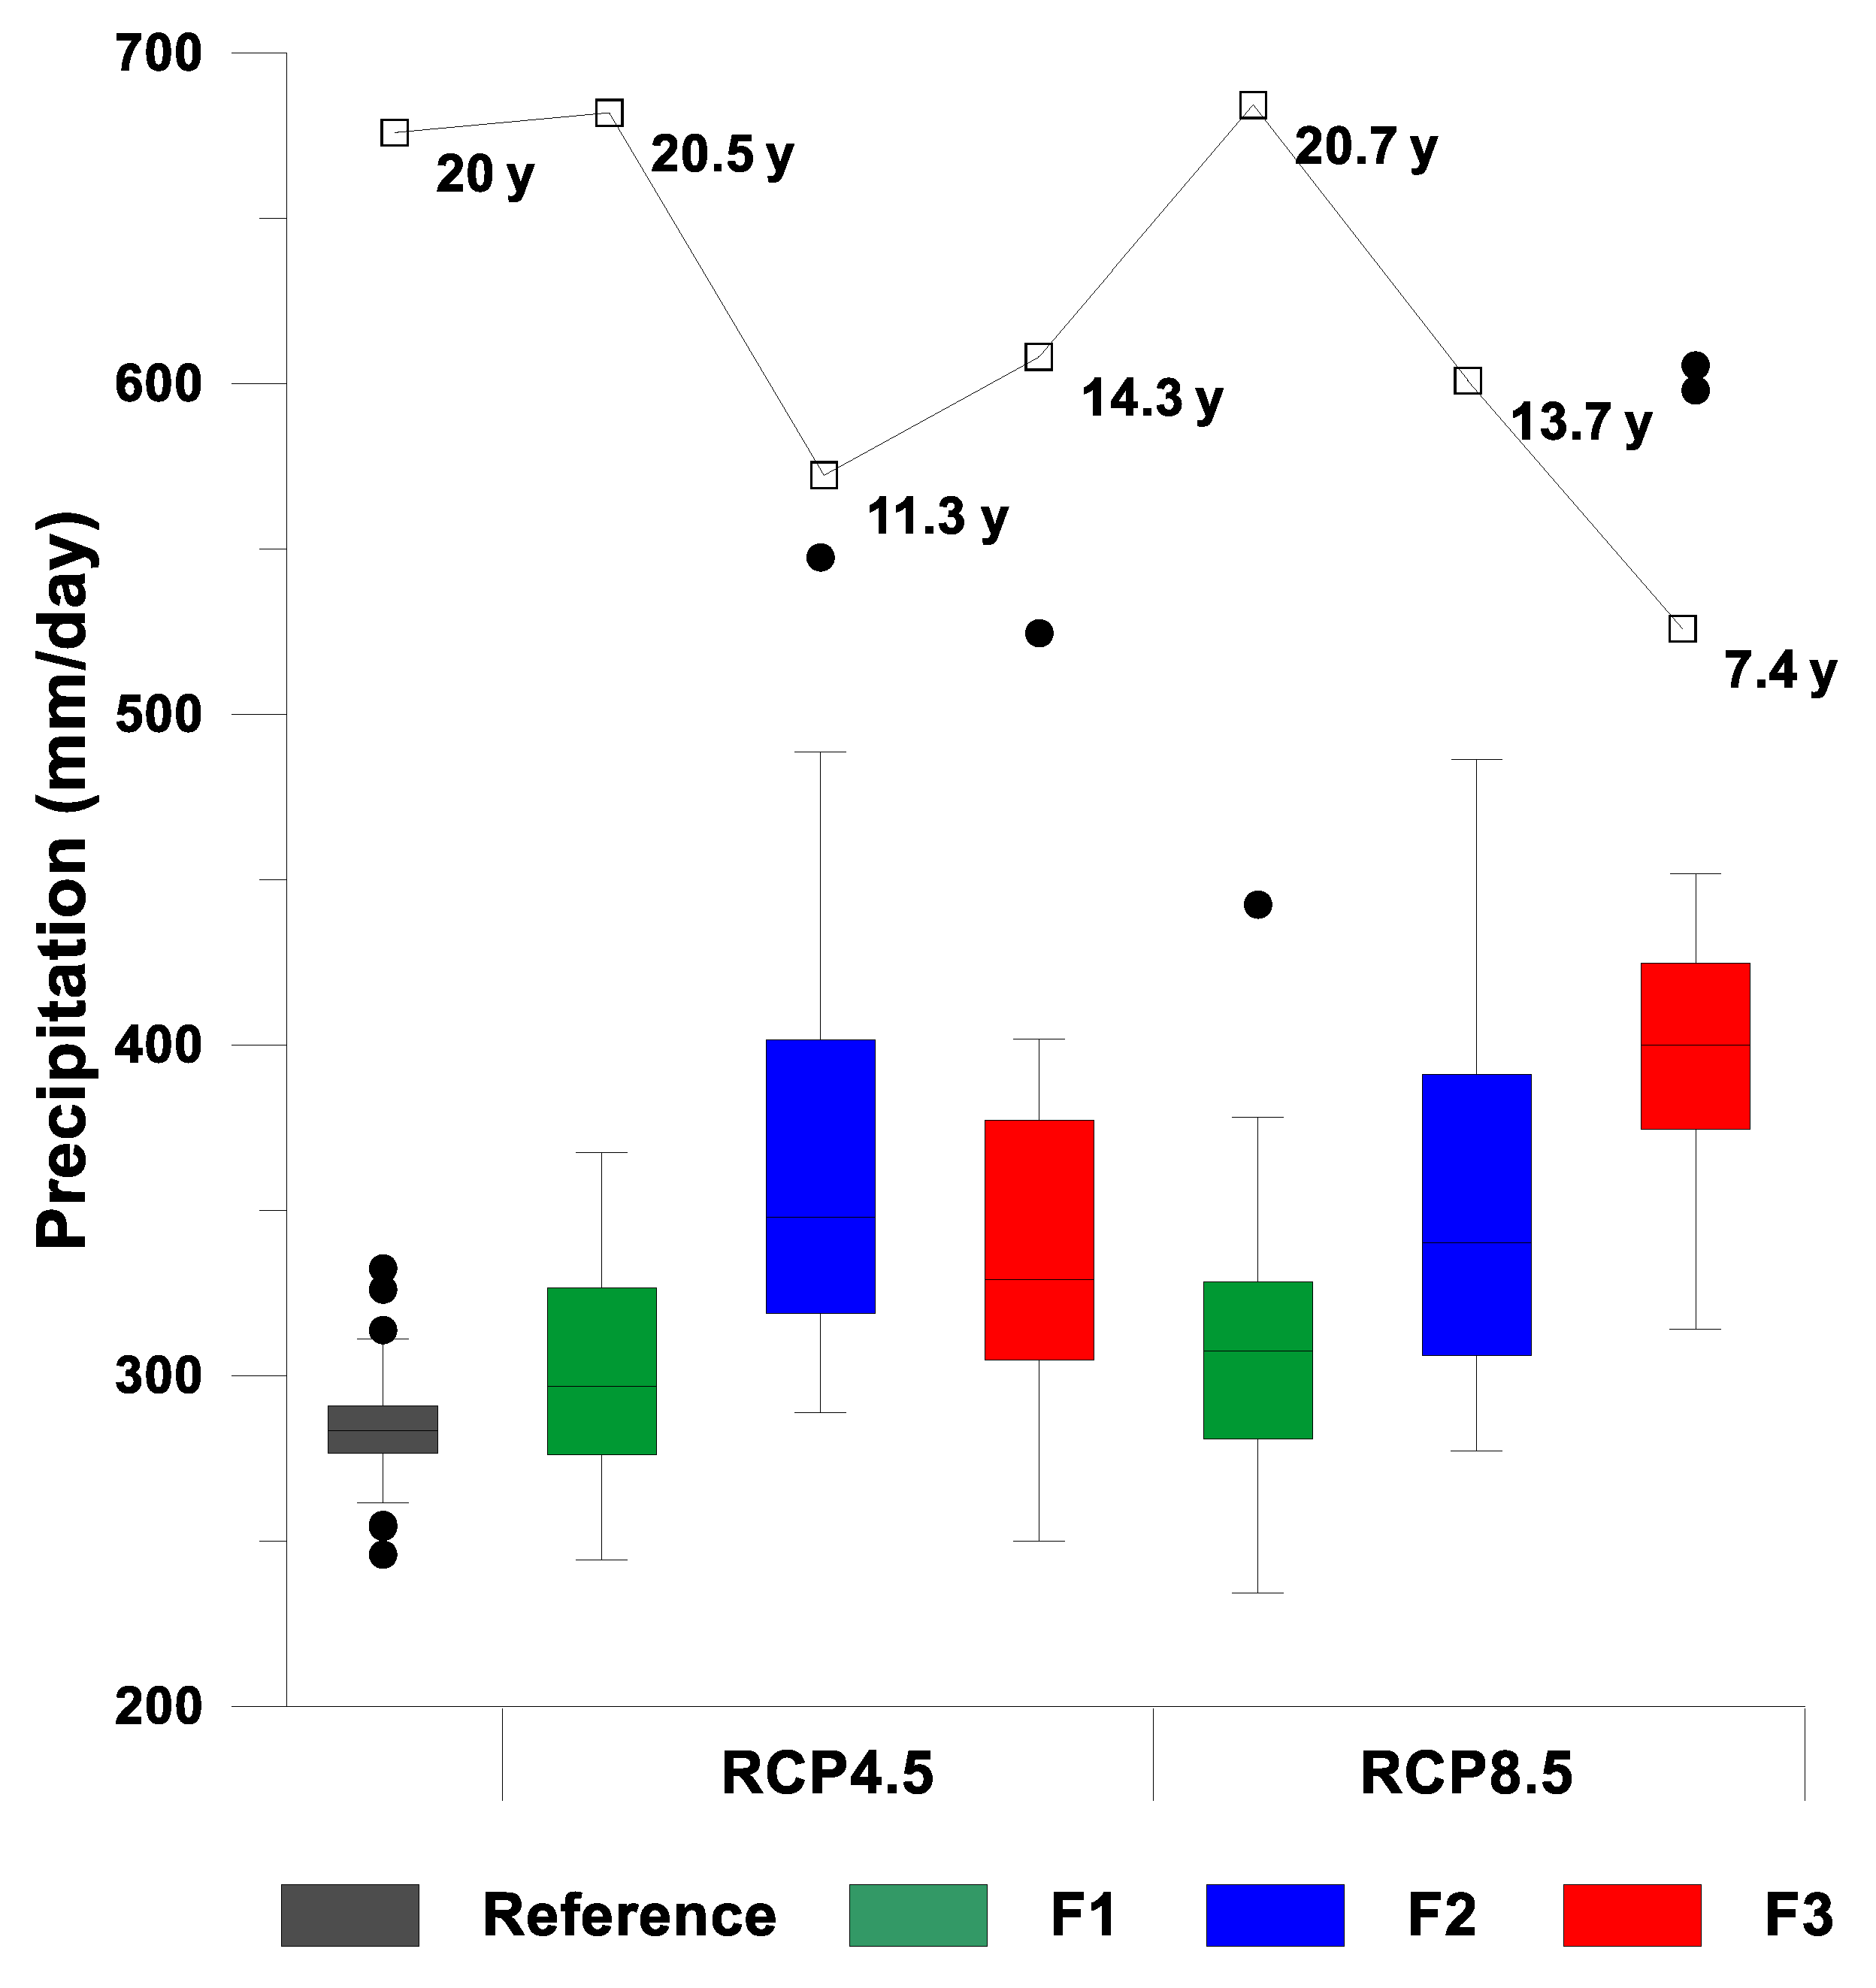
The mean of the 20-year precipitation in the reference period of the Imjin River basin, which was calculated using the Thiessen method [40] for five stations, was 285.4 mm/day. In F1 and F2, RCP4.5 and RCP8.5 were similar, so the 20-year precipitation in F1 was projected to increase by less than 10%, and that in F2 was projected to increase by less than 30%. On the other hand, the precipitation in F3 under RCP8.5 was 410.0 mm/day, which was projected to increase by 43.6% compared to the reference period (Figure 9). Of the 25 GCMs, the lowest precipitation was observed with CNRM-CM5, but the value was 313.9 mm/day, which is higher than that in the reference period.
The change in frequency of AMDP was also projected. The return period for the Imjin River Basin in the reference period increased slightly in F1. In F2, the return period was the lowest (11.3 years) under RCP4.5, and it was projected to be the shortest (7.4 years) under RCP8.5 in F3. The return period for North Korea was 8.8 years in F3 (Figure 5), but the decreasing trend was more evident in the Imjin River basin than in other regions. The Imjin River basin was found to be subject to greater threats of extreme precipitation than other regions owing to the effects of climate change.
4. Discussion
North Korea’s temperature has risen by 1.9 °C—this is the second highest increase in the world over the past 100 years. North Korea ranked seventh globally in the Global Climate Risk Index 2013 [41] and second in the Global Climate Risk Index 2009 [42]. In order to reduce greenhouse gas emissions, North Korea ratified the Paris Agreement in August 2016 and submitted an Intended Nationally Determined Contribution (INDC), which aimed to reduce greenhouse gas emissions. However, climate change impact assessment using the climate change scenarios is insufficient. Therefore, this study projected changes in extreme precipitation in North Korea using the MME and downscaling methods that preserve long-term trends in the climate models.
A comparison of regional averages in each future relative to the reference period showed that precipitation with a 20-year return period was projected to be 43.4 mm higher than in the reference period under RCP4.5, and 80.7 mm under RCP8.5, an even greater increase. Spatially, the AMDP in the southern region of North Korea and the middle and upstream parts of Cheongcheon River was much higher than in other regions. As the GEV PDF moves to the right because of the increase in extreme precipitation compared to the reference period as time progresses, the 20-year precipitation of the reference period occurs more frequently in the future, and as a result, the return period in the future was projected to 21.1, 16.2, and 8.8 years in F1, F2, and F3, respectively, under RCP8.5 and 20.7, 16.9, and 14.1 years, respectively, under RCP4.5. As the CDFs for F2 and F3 are outside the 95% confidence interval of the 25 model CDFs for the reference period, limitations on countermeasures against climate change to date have been expected. To confirm the spatial variability of the 20-year precipitation, the CV was calculated, and the CV for the future periods was confirmed to be larger than that for the reference period. It can be expected that regional precipitation variability will increase in future periods.
The variability among scenarios is small at sites where the CV is small relative to the other sites, which means the scenarios are more likely to occur at these sites. The increase in extreme precipitation was expected under RCP4.5 and RCP8.5, and the area-averaged CVs in RCP4.5 and RCP8.5 were 0.18 and 0.16, respectively. The CVs at Pyongyang and Changjon, near South Korea, were 0.17 and 0.10, respectively, in RCP4.5, and 0.15 and 0.12, respectively, in RCP8.5. Therefore, countermeasures for climate change will be particularly urgent for these sites relative to other regions.
Sung et al. [13] projected extreme precipitation in South Korea based on RCP4.5. Those results show that the 20-year return period of precipitation events during a reference period (1980–2005) corresponds to a 16.6-year for 2011–2040, a 14.1-year for 2041–2070, and a 12.8-year for 2071–2100, indicating that extreme AMDP values may occur more frequently in the future. The corresponding 20-year return periods for North Korea are 20.7-year, 16.9-year, and 14.1-year, respectively, which means that even if greenhouse gases are reduced, the increase in South Korea’s extreme precipitation is greater than that of North Korea, and active countermeasures will be required.
An increase in AMDP at the border of North and South Korea (the mid-latitude region of the Korean Peninsula) was strongly predicted. The rivers shared by South Korea and North Korea are the Imjin and Bukhan rivers; the upstream parts of these rivers are located in North Korea, and the downstream parts are located in South Korea. In the past, flood damage occurred in the downstream part of the Imjin River because of the release of the upstream dam. In the Imjin River Basin, the 20-year precipitation under RCP8.5 in F3 was projected to be 410.0 mm/day, an increase of 43.6% compared to the reference period, and the 20-year return period in the reference period was projected to be a 7.4-year, which is less than the average for North Korea, an 8.8-year. In other words, the shared river, the Imjin River Basin, will experience a greater change in the magnitude and frequency of future extreme precipitation events than other regions in North Korea. The extreme precipitation events have been caused mainly by mid-latitude cyclones approaching the Korean Peninsula, along with the enhanced Changma front by supplying water vapor to the East China Sea. Lee et al. [43] indicated that these synoptic-scale features under current conditions are similar to those of future extreme events, using HadGEM3-RA simulations. Lee et al. [44] examined future changes in precipitation over Northeast Asia and Korea using five RCM simulations and indicated that extreme precipitation events are mainly associated with the southwest-to-northeast evolution of large-scale low-pressure systems in both current and future climates. A joint response against climate change by South and North Korea will be required in order to decrease the risk of an increase in extreme precipitation in the future for the above reasons. In this region, it is necessary to install multipurpose dams or flood control dams to effectively prevent summer floods and to reduce downstream flood damage. In particular, when a new dam is required to be installed, the results of an impact assessment can be utilized for the selection of potential sites. Another possibility is to revisit the design standard of the existing dams by considering an increase in the flood load.
Author Contributions
Conceptualization, J.H.S.; Formal Analysis, J.H.S. and M.K.; Investigation, J.H.S. and M.K.; Data Curation, J.H.S.; Writing—Original Draft Preparation, J.H.S.; Writing—Review and Editing, J.H.S., J.A., and M.K.
Funding
This research was funded by the Korea Environmental Industry & Technology Institute (KEITI) grant funded by the Ministry of Environment grant number Grant 18AWMP-B083066-05.
Conflicts of Interest
The authors declare no conflicts of interest.
Abbreviations
| Reference period | 1980–2005 |
| F1 | Future1 (2011–2040) |
| F2 | Future2 (2041–2070) |
| F3 | Future3 (2071–2100) |
| RCP | Representative concentration pathway |
| AMDP | Annual maximum daily precipitation |
| DQM | Detrended quantile mapping |
| QDM | Quantile delta mapping |
| SD-QDM | Spatial disaggregation/quantile delta mapping |
| MMEs | Multimodel ensembles |
| NARCCAP | North American regional climate change assessment program |
| CORDEX | Coordinated regional climate downscaling experiment |
| CMIP | Coupled model intercomparison project |
| MLD | Military demarcation line |
| IPCC | Intergovernmental panel on climate change |
| CV | Coefficient of variation |
References
- Lee, D.-K.; Cha, D.-H.; Kang, H.-S. Regional climate simulation of the 1998 summer flood over East Asia. J. Meteorol. Soc. Jpn. 2004, 82, 1735–1753. [Google Scholar] [CrossRef]
- Kang, H.-S.; Cha, D.-H.; Lee, D.-K. Evaluation of the mesoscale model/land surface model (MM5/LSM) coupled model for East Asian summer monsoon simulations. J. Geophys. Res. 2005, 110, D10105. [Google Scholar] [CrossRef]
- Hong, S.-Y.; Lee, J.-W. Assessment of the WRF model in reproducing a flash-flood heavy rainfall event over Korea. Atmos. Res. 2009, 93, 818–831. [Google Scholar] [CrossRef]
- Kim, Y.; Kang, B.; Adams, J.M. Opposite trends in summer precipitation in South and North Korea. Int. J. Climatol. 2011, 32, 2311–2319. [Google Scholar] [CrossRef]
- Sung, J.H.; Chung, E.-S.; Kim, Y.; Lee, B.-R. Meteorological hazard assessment based on trends and abrupt changes in rainfall characteristics on the Korean peninsula. Theor. Appl. Climatol. 2017, 127, 305–326. [Google Scholar] [CrossRef]
- Cha, D.-H.; Lee, D.-K.; Jin, C.-S.; Kim, G.; Choi, Y.; Suh, M.-S.; Ahn, J.-B.; Hong, S.-Y.; Min, S.-K.; Park, S.-C.; et al. Future changes in summer precipitation in regional climate simulations over the Korean Peninsula forced by multi-RCP scenarios of HadGEM2-AO. Asia-Pac. J. Atmos. Sci. 2016, 52, 139–149. [Google Scholar] [CrossRef]
- Boo, K.-O.; Kwon, W.-T.; Baek, H.-J. Change of extreme events of temperature and precipitation over Korea using regional projection of future climate change. Geophys. Res. Lett. 2006, 33, L01701. [Google Scholar] [CrossRef]
- Hong, J.Y.; Ahn, J.-B. Changes of early summer precipitation in the Korean Peninsula and nearby regions based on RCP simulations. J. Clim. 2015, 28, 3557–3578. [Google Scholar] [CrossRef]
- Räisänen, J.; Palmer, T.N. A probability and decision-model analysis of a multimodel ensemble of climate change simulations. J. Clim. 2001, 14, 3212–3226. [Google Scholar] [CrossRef]
- Rajagopalan, B.; Lall, U.; Zebiak, S.E. Categorical climate forecasts through regularization and optimal combination of multiple GCM ensembles. Mon. Weather Rev. 2002, 130, 1792–1811. [Google Scholar] [CrossRef]
- Raftery, A.E.; Gneiting, T.; Balabdaoui, F.; Polakowski, M. Using Bayesian model averaging to calibrate forecast ensembles. Mon. Weather Rev. 2005, 133, 1155–1174. [Google Scholar] [CrossRef]
- Sung, J.H.; Eum, H.-I.; Park, J.; Cho, J. Assessment of climate change impacts on extreme precipitation events: Applications of CMIP5 climate projections statistically downscaled over South Korea. Adv. Meteorol. 2018, 2018, 4720523. [Google Scholar] [CrossRef]
- Sung, J.H.; Chung, E.-S.; Shahid, S. Reliability–Resiliency–Vulnerability approach for drought analysis in South Korea using 28 GCMs. Sustainability 2018, 10, 3043. [Google Scholar] [CrossRef]
- Wood, A.W.; Leung, L.R.; Sridhar, V.; Lettenmaier, D.P. Hydrologic implications of dynamical and statistical approaches to downscaling climate model outputs. Clim. Chang. 2004, 62, 189–216. [Google Scholar] [CrossRef]
- Abatzoglou, J.T.; Brown, T.J. A comparison of statistical downscaling methods suited for wildfire applications. Int. J. Clim. 2012, 32, 772–780. [Google Scholar] [CrossRef]
- Bürger, G.; Sobie, S.R.; Cannon, A.J.; Werner, A.T.; Murdock, T.Q. Downscaling extremes: An intercomparison of multiple methods for future climate. J. Clim. 2013, 26, 3429–3449. [Google Scholar] [CrossRef]
- Cannon, A.J.; Sobie, S.R.; Murdock, T.Q. Bias correction of GCM precipitation by quantile mapping: How well do methods preserve changes in quantiles and extremes? J. Clim. 2015, 28, 6938–6959. [Google Scholar] [CrossRef]
- Eum, H.-I.; Cannon, A.J. Intercomparison of projected changes in climate extremes for South Korea: Application of trend preserving statistical downscaling methods to the CMIP5 ensemble. Int. J. Clim. 2017, 37, 3381–3397. [Google Scholar] [CrossRef]
- Mearns, L.O.; Arritt, R.; Biner, S.; Bukovsky, M.S.; McGinnis, S.; Sain, S.; Caya, D.; Correia, J., Jr.; Flory, D.; Gutowski, W.; et al. The North American regional climate change assessment program: Overview of phase I results. Bull. Am. Meteorol. Soc. 2012, 93, 1337–1362. [Google Scholar] [CrossRef]
- Whitehall, K.; Mattmann, C.; Waliser, D.; Kim, J.; Goodale, C.; Hart, A.; Ramirez, P.; Zimdars, P.; Crichton, D.; Jenkins, G.; et al. Building Model Evaluation and Decision Support Capacity for CORDEX. WMO Bull. 2012, 61, 29–34. [Google Scholar]
- Sillmann, J.; Kharin, V.V.; Zhang, X.; Zwiers, F.W.; Bronaugh, D. Climate extremes indices in the CMIP5 multimodel ensemble: Part 1. Model evaluation in the present climate. J. Geophys. Res. Atmos. 2013, 118, 1716–1733. [Google Scholar] [CrossRef]
- Mizuta, R.; Oouchi, K.; Yoshimura, H.; Noda, A.; Katayama, K.; Yukimoto, S.; Hosaka, M.; Kusunoki, S.; Kawai, H.; Nakagawa, M. 20-km-mesh global climate simulations using JMA-GSM model-Mean climate states. J. Meteorol. Soc. Jpn. 2006, 84, 165–185. [Google Scholar] [CrossRef]
- Hristensen, J.H.; Carter, T.; Rummukainen, M.; Amanatidis, G. Evaluating the performance and utility of regional climate models in climate change research: Reducing uncertainties in climate change projections—The PRUDENCE approach. J. Clim. Chang. 2007, 81 (Suppl. 1), 1–6. [Google Scholar] [CrossRef]
- Déqué, M.; Rowell, D.P.; Lüthi, D.; Giorgi, F.; Christensen, J.H.; Rockel, B.; Jacob, D.; Kjellström, E.; de Castro, M.; van den Hurk, B. An intercomparison of regional climate simulations for Europe: Assessing uncertainties in model projections. Clim. Chang. 2007, 81, 53–70. [Google Scholar] [CrossRef]
- Taylor, K.E.; Stouffer, R.J.; Meehl, G.A. An Overview of CMIP5 and the Experiment Design. Bull. Am. Meteorol. Soc. 2012, 93, 485–498. [Google Scholar] [CrossRef]
- Seo, S.B.; Kim, Y.-O.; Kim, Y.; Eum, H.-I. Selecting climate change scenarios for regional hydrologic impact studies based on climate extremes indices. Clim. Dyn. 2018. [Google Scholar] [CrossRef]
- Seo, S.B.; Kim, Y.-O. Impact of Spatial Aggregation Level of Climate Indicators on a National-Level Selection for Representative Climate Change Scenarios. Sustainability 2018, 10, 2409. [Google Scholar] [CrossRef]
- Tebaldi, C.; Sanso, B. Joint projections of temperature and precipitation change from multiple climate models: A hierarchical Bayesian approach. J. R. Stat. Soc. Ser. A (Stat. Soc.) 2009, 172, 83–106. [Google Scholar] [CrossRef]
- Watterson, I.G.; Whetton, P.H. Distributions of decadal means of temperature and precipitation change under global warming. J. Geophys. Res. Atmos. 2011, 116. [Google Scholar] [CrossRef]
- Brown, C.; Brown, E.; Murray-Rust, D.; Cojocaru, G.; Savin, C.; Rounsevell, M. Analysing uncertainties in climate change impact assessment across sectors and scenarios. Clim. Chang. 2015, 128, 293–306. [Google Scholar] [CrossRef]
- IPCC. Climate change 2007: Impacts, adaptation and vulnerability. In Working Group II Contribution to the Fourth Assessment Report of the IPCC; Cambridge University Press: Cambridge, UK, 2007; Volume 4. [Google Scholar]
- IPCC. Climate change 2013: The physical science basis. In Working Group I Contribution to the Fifth Assessment Report of the Intergovernmental Panel on Climate Change; Cambridge University Press: Cambridge, UK, 2014. [Google Scholar]
- IPCC. Climate change 2014: Synthesis report. In Contribution of Working Groups I. II and III to the Fifth Assessment Report of the Intergovernmental Panel on Climate Change; IPCC: Geneva, Switzerland, 2014. [Google Scholar]
- Katz, R.W.; Parlange, M.B.; Naveau, P. Statistics of extremes in hydrology. Adv. Water Resour. 2002, 25, 1287–1304. [Google Scholar] [CrossRef]
- Kharin, V.V.; Zwiers, F.W. Estimating extremes in transient climate change simulations. J. Clim. 2005, 18, 1156–1173. [Google Scholar] [CrossRef]
- Kharin, V.V.; Zwiers, F.W.; Zhang, X. Intercomparison of near-surface temperature and precipitation extremes in AMIP-2 simulations, reanalyses, and observations. J. Clim. 2005, 18, 5201–5223. [Google Scholar] [CrossRef]
- Stedinger, J.R.; Vogel, R.M.; Foufoula-Georgiou, E. Frequency analysis of extreme events. In Handbook of Hydrology; Maidment, D.R., Ed.; McGraw-Hill: New York, NY, USA, 1993; Chapter 18. [Google Scholar]
- Madsen, H.; Rasmussen, P.F.; Rosbjerg, D. Comparison of annualmaximum series and partial duration series methods for modeling extreme hydrologic events, 1, At-site modeling. Water Resour. Res. 1997, 33, 747–758. [Google Scholar]
- Klein Tank, A.M.G.; Zwiers, F.W.; Zhang, X. Guidelines on Analysis of Extremes in a Changing Climate in Support of Informed Decisions for Adaptation; Climate Data and Monitoring WCDMP-No. 72, WMO-TD No. 1500; World Meteorological Organization: Geneva, Switzerland, 2009. [Google Scholar]
- Brassel, K.E.; Reif, D. A procedure to generate Thiessen polygons. Geogr. Anal. 1979, 11, 289–303. [Google Scholar] [CrossRef]
- Harmeling, S.; Eckstein, D. Global Climate Risk Index 2013; Germanwatch: Bonn, Germany, 2012; ISBN 978-3-943704-04-4. [Google Scholar]
- Harmeling, S. Global Climate Risk Index 2009; Germanwatch: Bonn, Germany, 2008; ISBN 978-3-939846-45-1. [Google Scholar]
- Lee, H.; Moon, B.-K.; Wie, J. Future extreme temperature and precipitation mechanisms over the Korean peninsula using a regional climate model simulation. J. Korean Earth Sci. Soc. 2018, 39, 327–341. [Google Scholar] [CrossRef]
- Lee, D.; Min, S.-K.; Jin, J.; Lee, J.-W.; Cha, D.-H.; Suh, M.-S.; Joh, M. Thermodynamic and dynamic contributions to future changes in summer precipitation over Northeast Asia and Korea: A multi-RCM study. Clim. Dyn. 2017, 49, 4121–4139. [Google Scholar] [CrossRef]
Figure 1.
Procedure for the study.

Figure 2.
Map showing study area and meteorological stations in North Korea along with rivers shared between South and North Korea.
Figure 2.
Map showing study area and meteorological stations in North Korea along with rivers shared between South and North Korea.

Figure 3.
Comparison of the observed precipitation with simulated precipitation from 25 GCMs. (a) Monthly precipitation and (b) annual maximum daily precipitation (AMDP) at local scale.
Figure 3.
Comparison of the observed precipitation with simulated precipitation from 25 GCMs. (a) Monthly precipitation and (b) annual maximum daily precipitation (AMDP) at local scale.


Figure 4.
Change in 20-year precipitation (mm) for 25 CMIP5 GCMs for the reference period (Ref), F3, and the difference between F3 and Ref. (a) Ref, (b) F3 under RCP4.5, (c) F3 under RCP4.5 minus Ref, (d) F3 under RCP8.5, and (e) F3 under RCP8.5 minus Ref.
Figure 4.
Change in 20-year precipitation (mm) for 25 CMIP5 GCMs for the reference period (Ref), F3, and the difference between F3 and Ref. (a) Ref, (b) F3 under RCP4.5, (c) F3 under RCP4.5 minus Ref, (d) F3 under RCP8.5, and (e) F3 under RCP8.5 minus Ref.

Figure 5.
Change in 20-year return period (years) of AMDP for 25 CMIP5 GCMs for the F1, F2, and F3 periods under RCP4.5 and RCP8.5. (a) F1 under RCP4.5, (b) F2 under RCP4.5, (c) F3 under RCP4.5, (d) F1 under RCP8.5, (e) F2 under RCP8.5, and (f) F3 under RCP8.5.
Figure 5.
Change in 20-year return period (years) of AMDP for 25 CMIP5 GCMs for the F1, F2, and F3 periods under RCP4.5 and RCP8.5. (a) F1 under RCP4.5, (b) F2 under RCP4.5, (c) F3 under RCP4.5, (d) F1 under RCP8.5, (e) F2 under RCP8.5, and (f) F3 under RCP8.5.

Figure 6.
Coefficient of variation of 20-year return value of AMDP for 25 CMIP5 GCMs for Ref, F3, and the difference between F3 and Ref. (a) Ref, (b) F3 under RCP4.5, (c) F3 under RCP4.5 minus Ref, (d) F3 under RCP8.5, and (e) F3 under RCP8.5 minus Ref.
Figure 6.
Coefficient of variation of 20-year return value of AMDP for 25 CMIP5 GCMs for Ref, F3, and the difference between F3 and Ref. (a) Ref, (b) F3 under RCP4.5, (c) F3 under RCP4.5 minus Ref, (d) F3 under RCP8.5, and (e) F3 under RCP8.5 minus Ref.

Figure 7.
Box plots of (a) location parameter, (b) scale parameter, and (c) shape parameter of generalized extreme value (GEV) distribution for CMIP5 precipitation, and (d) future change in 20-year precipitation of reference climate.
Figure 7.
Box plots of (a) location parameter, (b) scale parameter, and (c) shape parameter of generalized extreme value (GEV) distribution for CMIP5 precipitation, and (d) future change in 20-year precipitation of reference climate.

Figure 8.
GEV probability density functions for (a) RCP4.5 and (b) RCP8.5, and zoomed cumulative distribution functions (CDFs) for extremes for (c) RCP4.5 and (d) RCP8.5.
Figure 8.
GEV probability density functions for (a) RCP4.5 and (b) RCP8.5, and zoomed cumulative distribution functions (CDFs) for extremes for (c) RCP4.5 and (d) RCP8.5.

Figure 9.
Change in 20-year precipitation and return period in Imjin River Basin.


Table 1.
The 25 GCMs of the Coupled Model Intercomparison Project Phase 5 (CMIP5) used in this study.
Table 1.
The 25 GCMs of the Coupled Model Intercomparison Project Phase 5 (CMIP5) used in this study.
| No. | GCM | Resolution (Degrees) | Institution |
|---|---|---|---|
| 1 | CanESM2 | 2.813 × 2.791 | Canadian Centre for Climate Modelling and Analysis |
| 2 | CCSM4 | 1.250 × 0.942 | National Center for Atmospheric Research, USA |
| 3 | CESM1-BGC | 1.250 × 0.942 | |
| 4 | CESM1-CAM5 | 1.250 × 0.942 | |
| 5 | CMCC-CM | 0.750 × 0.748 | Centro Euro-Mediterraneo sui Cambiamenti Climatici (Euro-Mediterranean Center on Climate Change) |
| 6 | CMCC-CMS | 1.875 × 1.865 | |
| 7 | CNRM-CM5 | 1.406 × 1.401 | Centre National de Recherches Météorologiques, France |
| 8 | CSIRO-Mk3-6-0 | 1.875 × 1.865 | Commonwealth Scientific and Industrial Research Organisation and Queensland Climate Change Centre of Excellence |
| 9 | FGOALS-g2 | 2.791 × 2.813 | The National Key Laboratory of Numerical Modeling for Atmospheric Sciences and Geophysical Fluid Dynamics, Institute of Atmospheric Physics and Chinese Academy of Sciences |
| 10 | FGOALS-s2 | 2.813 × 1.659 | |
| 11 | GFDL-CM3 | 2.500 × 2.000 | Geophysical Fluid Dynamics Laboratory, NOAA |
| 12 | GFDL-ESM2G | 2.000 × 2.023 | |
| 13 | GFDL-ESM2M | 2.500 × 2.023 | |
| 14 | HadGEM2-AO | 1.875 × 1.250 | Met Office Hadley Centre for Climate Change, UK |
| 15 | HadGEM2-CC | 1.875 × 1.250 | |
| 16 | INM-CM4 | 2.000 × 1.500 | Institute of Numerical Mathematics, Russia |
| 17 | IPSL-CM5A-LR | 3.750 × 1.895 | Institute Pierre Simon Laplace, France |
| 18 | IPSL-CM5A-MR | 2.500 × 1.268 | |
| 19 | IPSL-CM5B-LR | 3.750 × 1.895 | |
| 20 | MIROC-ESM | 2.813 × 2.791 | Japan Agency for Marine-Earth Science and Technology |
| 21 | MIROC-ESM-CHEM | 2.813 × 2.791 | |
| 22 | MPI-ESM-LR | 1.875 × 1.865 | Max Planck Institute for Meteorology, Germany |
| 23 | MPI-ESM-MR | 1.875 × 1.865 | |
| 24 | MRI-CGCM3 | 1.125 × 1.122 | Meteorological Research Institute, Japan |
| 25 | NorESM1-M | 2.500 × 1.895 | Norwegian Climate Centre |
Table 2.
Weather observation sites in North Korea.
| Site Name | Latitude | Longitude | First Year of Observation |
|---|---|---|---|
| Senbong | 42°19′ N | 130°24′ E | 1973 |
| Samjiyon | 41°49′ N | 128°19′ E | 1981 |
| Chongjin | 41°47′ N | 129°49′ E | 1973 |
| Chunggang | 41°47′ N | 126°53′ E | 1973 |
| Hyesan | 41°24′ N | 128°10′ E | 1973 |
| Kanggye | 40°58′ N | 126°36′ E | 1973 |
| Pungsan | 40°49′ N | 128°09′ E | 1981 |
| Kimchaek | 40°40′ N | 129°12′ E | 1973 |
| Supung | 40°27′ N | 124°56′ E | 1981 |
| Changjin | 40°22′ N | 127°15′ E | 1981 |
| Sinuiju | 40°06′ N | 124°23′ E | 1973 |
| Kusong | 39°59′ N | 125°15′ E | 1981 |
| Huichon | 40°10′ N | 126°15′ E | 1981 |
| Hamhung | 39°56′ N | 127°33′ E | 1973 |
| Sinpo | 40°02′ N | 128°11′ E | 1981 |
| Anju | 39°37′ N | 125°39′ E | 1981 |
| Yangdok | 39°10′ N | 126°50′ E | 1981 |
| Wonsan | 39°11′ N | 127°26′ E | 1973 |
| Pyongyang | 39°02′ N | 125°47′ E | 1973 |
| Nampo | 38°43′ N | 125°22′ E | 1981 |
| Changjon | 38°44′ N | 128°11′ E | 1981 |
| Sariwon | 38°31′ N | 125°46′ E | 1973 |
| Singye | 38°30′ N | 126°32′ E | 1981 |
| Yongyon | 38°12′ N | 124°53′ E | 1981 |
| Haeju | 38°02′ N | 125°42′ E | 1973 |
| Kaesong | 37°58′ N | 126°34′ E | 1973 |
| Pyonggang | 38°24′ N | 127°18′ E | 1981 |
Table 3.
Future change in 20-year return period.
| F1 | F2 | F3 | ||||
| RCP4.5 | RCP8.5 | RCP4.5 | RCP8.5 | RCP4.5 | RCP8.5 | |
| 20.7 | 21.1 | 16.9 | 16.2 | 14.1 | 8.8 | |
| Standard Deviation | 1.67 | 2.02 | 3.43 | 2.97 | 2.01 | 2.22 |
© 2019 by the authors. Licensee MDPI, Basel, Switzerland. This article is an open access article distributed under the terms and conditions of the Creative Commons Attribution (CC BY) license (http://creativecommons.org/licenses/by/4.0/).
Share and Cite
MDPI and ACS Style
Kwon, M.; Sung, J.H.; Ahn, J. Change in Extreme Precipitation over North Korea Using Multiple Climate Change Scenarios. Water 2019, 11, 270. https://doi.org/10.3390/w11020270
AMA Style
Kwon M, Sung JH, Ahn J. Change in Extreme Precipitation over North Korea Using Multiple Climate Change Scenarios. Water. 2019; 11(2):270. https://doi.org/10.3390/w11020270
Chicago/Turabian StyleKwon, Minsung, Jang Hyun Sung, and Jaehyun Ahn. 2019. "Change in Extreme Precipitation over North Korea Using Multiple Climate Change Scenarios" Water 11, no. 2: 270. https://doi.org/10.3390/w11020270
Note that from the first issue of 2016, this journal uses article numbers instead of page numbers. See further details here.