The Future of Drought in the Southeastern U.S.: Projections from Downscaled CMIP5 Models

Department of Geography, University of Alabama, 204 Farrah Hall, P.O. Box 870322, Tuscaloosa, AL 35487-0322, USA
*
Author to whom correspondence should be addressed.
Water 2019, 11(2), 259; https://doi.org/10.3390/w11020259
Submission received: 27 December 2018
/
Revised: 28 January 2019
/
Accepted: 29 January 2019
/
Published: 2 February 2019
(This article belongs to the Special Issue Extreme Floods and Droughts under Future Climate Scenarios)
Abstract
:After being repeatedly struck by droughts in the last few decades, water managers and stakeholders in the Southeast U.S. dread the future extremes that climate change might cause. In this study, the length of future dry periods is assessed using a sub-ensemble of downscaled CMIP5 climate models, which are proven to perform well in precipitation estimations. The length of a dry spell with a twenty-year return period is estimated for the cold and warm seasons for two time periods; 2020–2059 and 2060–2099, and considering two emission scenarios: RCP 4.5 and 8.5. The estimates are then compared with historical dry spells and differences in length and geospatial distribution analyzed. Based on the findings of this paper, little change can be expected in dry spell length during the warm season. Greater changes are to be expected in the cold season in the southern half of Florida, where dry spells are expected to be up to twenty days shorter, while dry spells in Alabama, Mississippi and Tennessee are predicted to be up to twenty days longer. The changes predicted by the models are positively associated with emission trajectory and future time period.
1. Introduction
The Southeast United States (hereafter referred to as “the Southeast”) is a region traditionally subject to abundant precipitation and water resources, brought by local convection and tropical cyclones during the warm season, and cold fronts during the cool season [1]. In recent decades, the region has been subject to multiple droughts (1986–1988, 1998–2002, 2007–2008, 2016). These droughts typically don’t last as long as droughts experienced in the Southwest United States, but they have proved to be highly detrimental to the regional environment, economy, and political situation [2,3,4]. Some of the region’s hydroclimatological variability has been attributed to large-scale atmospheric drivers or teleconnections, such as El Niño-Southern Oscillation, the Atlantic Multidecadal Oscillation and the North Atlantic Oscillation [5,6,7,8,9,10] and more recently, baroclinic instabilities over the oceans [11]. However, due to the severity and frequency of recent droughts there is a need among water managers and policy makers to look beyond the seasonal forecasts, afforded by teleconnections, to what the future holds for the Southeast over the longer term.
The IPCC [12] predicts that the annual precipitation amounts for the Southeast might increase by up to 20% by year 2035, while evaporation rates are expected to increase by up to 5%, but does not specifically mention dry spells. However, many models do project drier conditions in the far southwest of the Southeast region and wetter conditions in the far northeast of the region [13]. The U.S. National Climate Assessment finds with a high degree of certainty that both extreme wetness and dryness are projected to increase across the U.S. by the end of this century. The report finds that annual maximum precipitation will increase by up to 30% across much of the U.S. and length of consecutive dry days will increase by up to 30%, particularly in the southern U.S. [1]. Estimates of the length of the longest annual consecutive dry period are expected to increase by up to five days in the Southeast, while there are no significant trends observed in the number of heavy rain days [14].
Previous work has found increased future lengths of Consecutive Dry Days (CDD) in many regions of the world based on projections from multi-model CMIP5 ensembles [14,15]. However, relatively little change in consecutive dry days has been projected for the Southeast U.S. [15]. These studies have also suggested that increases in consecutive dry days coincide with increased precipitation intensity. For example, small decreases in future wet day probability have been found in the Southeast during December, January, February and June, July, August with the largest reductions occurring in coastal areas and peninsular Florida [15]. These findings were accompanied by projections of increased daily intensity of precipitation. These projected changes suggest longer periods of dry weather punctuated by more intense precipitation events. The findings are consistent with those of another study [16] that reported upward trends in the frequency and intensity of observed intense precipitation events across the Southeast associated with more frequent northward intrusion of moist tropical air masses, particularly in summer months.
Analyses of paleodata has shown that in the Southeast the last century has been among the wettest periods in the historic record, dating back a few centuries [1,17,18]. Yet regional water managers have expressed concerns about what’s perceived as drier-than average conditions prevailing during the last few decades and they worry about what future climate conditions will bring. Although there is variability across future projections of hydroclimate in the Southeast, the projections are generally moderate compared to many midlatitude regions around the globe that are expected to face more extreme climatic conditions as a result of climate change. Hence, studies investigating the impact of climate change in the Southeast have been limited.
Here, seasonal projections of 20-year return period lengths of consecutive dry days are examined from an ensemble of downscaled global climate models and compared with historical observations. The ensemble of downscaled models is comprised of those selected from a suite of 32 models, based on performance in simulation of observed consecutive dry spells, identified in an earlier study by the authors [19]. This is essentially a weighted ensemble approach [20,21,22,23] which removes the influence of under-performing models. Adding to the novelty of the methods presented here is the use of the relatively new downscaling technique of localized constructed analogs (LOCA) [24].
2. Materials and Methods
2.1. Data
Thirty-two LOCA downscaled (1/16°) spatial resolution Global Climate Models from the World Climate Research Program’s (WCRP) Coupled Model Intercomparison Project phase 5 (CMIP5) were downloaded from the Downscaled CMIP3 and CMIP5 Climate and Hydrology Projections archive, (http://gdo-dcp.ucllnl.org/downscaled_cmip_projections/dcpInterface.html). Future LOCA downscaled runs of these models are subdivided into the near future (2020–2059) and future (2060–2099). LOCA is distinct from other constructed analog techniques in that it finds a single best match analog day for each point instead of using weighted sums and thus gives a better estimation of extremes [24]. Each of the 32 models has one LOCA ensemble member. Two representative concentration pathways (RCPs) are used to represent different greenhouse gas (GHG) emissions trajectories: rapid GHG emission growth RCP 8.5 (8.5 W/m2 radiative forcing, ~1370 ppm CO2), medium GHG emission growth with stabilization RCP 4.5 (4.5 W/m2 radiative forcing, ~650 ppm CO2) [25].
Observed precipitation data is a gridded dataset which is a subset of an interpolation of observed precipitation data from 20,000 National Oceanic and Atmospheric Administration (NOAA) Cooperative Observer Network (COOP) stations, and part of the North American Land Data Assimilation System Variable Infiltration Capacity simulations over North America (http://www.colorado.edu/lab/livneh/data) [26,27,28,29]. These daily data (1950–2005) have the same temporal and spatial resolution as the LOCA data and are used for historical comparison. Climatic regions within the United States can be defined in numerous ways that vary with the scope of the analysis [1,8,30,31]. In this paper the Southeast is defined as the southern states east of the Mississippi river and includes Alabama, Florida, Georgia, Mississippi, North Carolina, South Carolina and Tennessee (Figure 1). The results are presented by climate division (nClimDiv, provided by NOAA) within the Southeast. A dry day is defined according to the definition of no measurable precipitation, as a day with less than 3 mm of precipitation [1,19,32].
These data are divided into two seasons based on agricultural growing dates. The warm season is defined as April–October, while the cold season constitutes the months of November–March. These seasons are based on the U.S. Department of Agriculture’s data on planting and harvesting dates of field crops in the region [33]. A severe dry spell during the warm season could be detrimental for agriculture and the environment, while a cool season drought limits the possibilities for recharge and storage of water in both natural and anthropogenic reservoirs.
2.2. Model Evaluation
The performance of all 32 LOCA downscaled CMIP5 models in simulation of observed counts of CDD were evaluated using probability density function comparisons by way of the Perkins skill scores [34] of the distribution of dry days as well as the upper tail (extreme-based) of the distribution. The Keellings significance test was used to assess the significance of the Perkins skill scores [30]. These methods, as applied to assessment of the 32 LOCA downscaled model simulations of CDD in the Southeast and resulting model performance are fully described in previous work [19]. Here we only examine future runs of the top five best performing models as identified in each season (Table 1) [19]. The skill scores of all 32 models averaged across all climate divisions ranged between 0.91 and 0.93. Model performance was heterogeneous across the region, but models generally performed better in the cold season than in the warm season.
The Generalized Extreme Value (GEV) distribution is used to estimate return periods of lengths of dry spells between observations and models [35,36,37]. The GEV is utilized as it makes no a priori assumptions regarding the form of the extreme value distribution [38]. Here we estimate the GEV parameters with the method of maximum likelihood using the extRemes package in R. The cumulative distribution function of the GEV is given by:
where x is the value of a random variable i.e., number of CDD, μ is the location parameter (central tendency), σ is the scale parameter (variance), and ξ is the shape parameter (skew) [39]. Future return periods are estimated using the fitted GEV for the ensemble of the best performing models, as identified by the skill score measures [19], in each future period (2020–2059, 2060–2099) and for each RCP (RCP 4.5, RCP 8.5). Future CDD return period estimates are then compared to the observation return periods.
3. Results
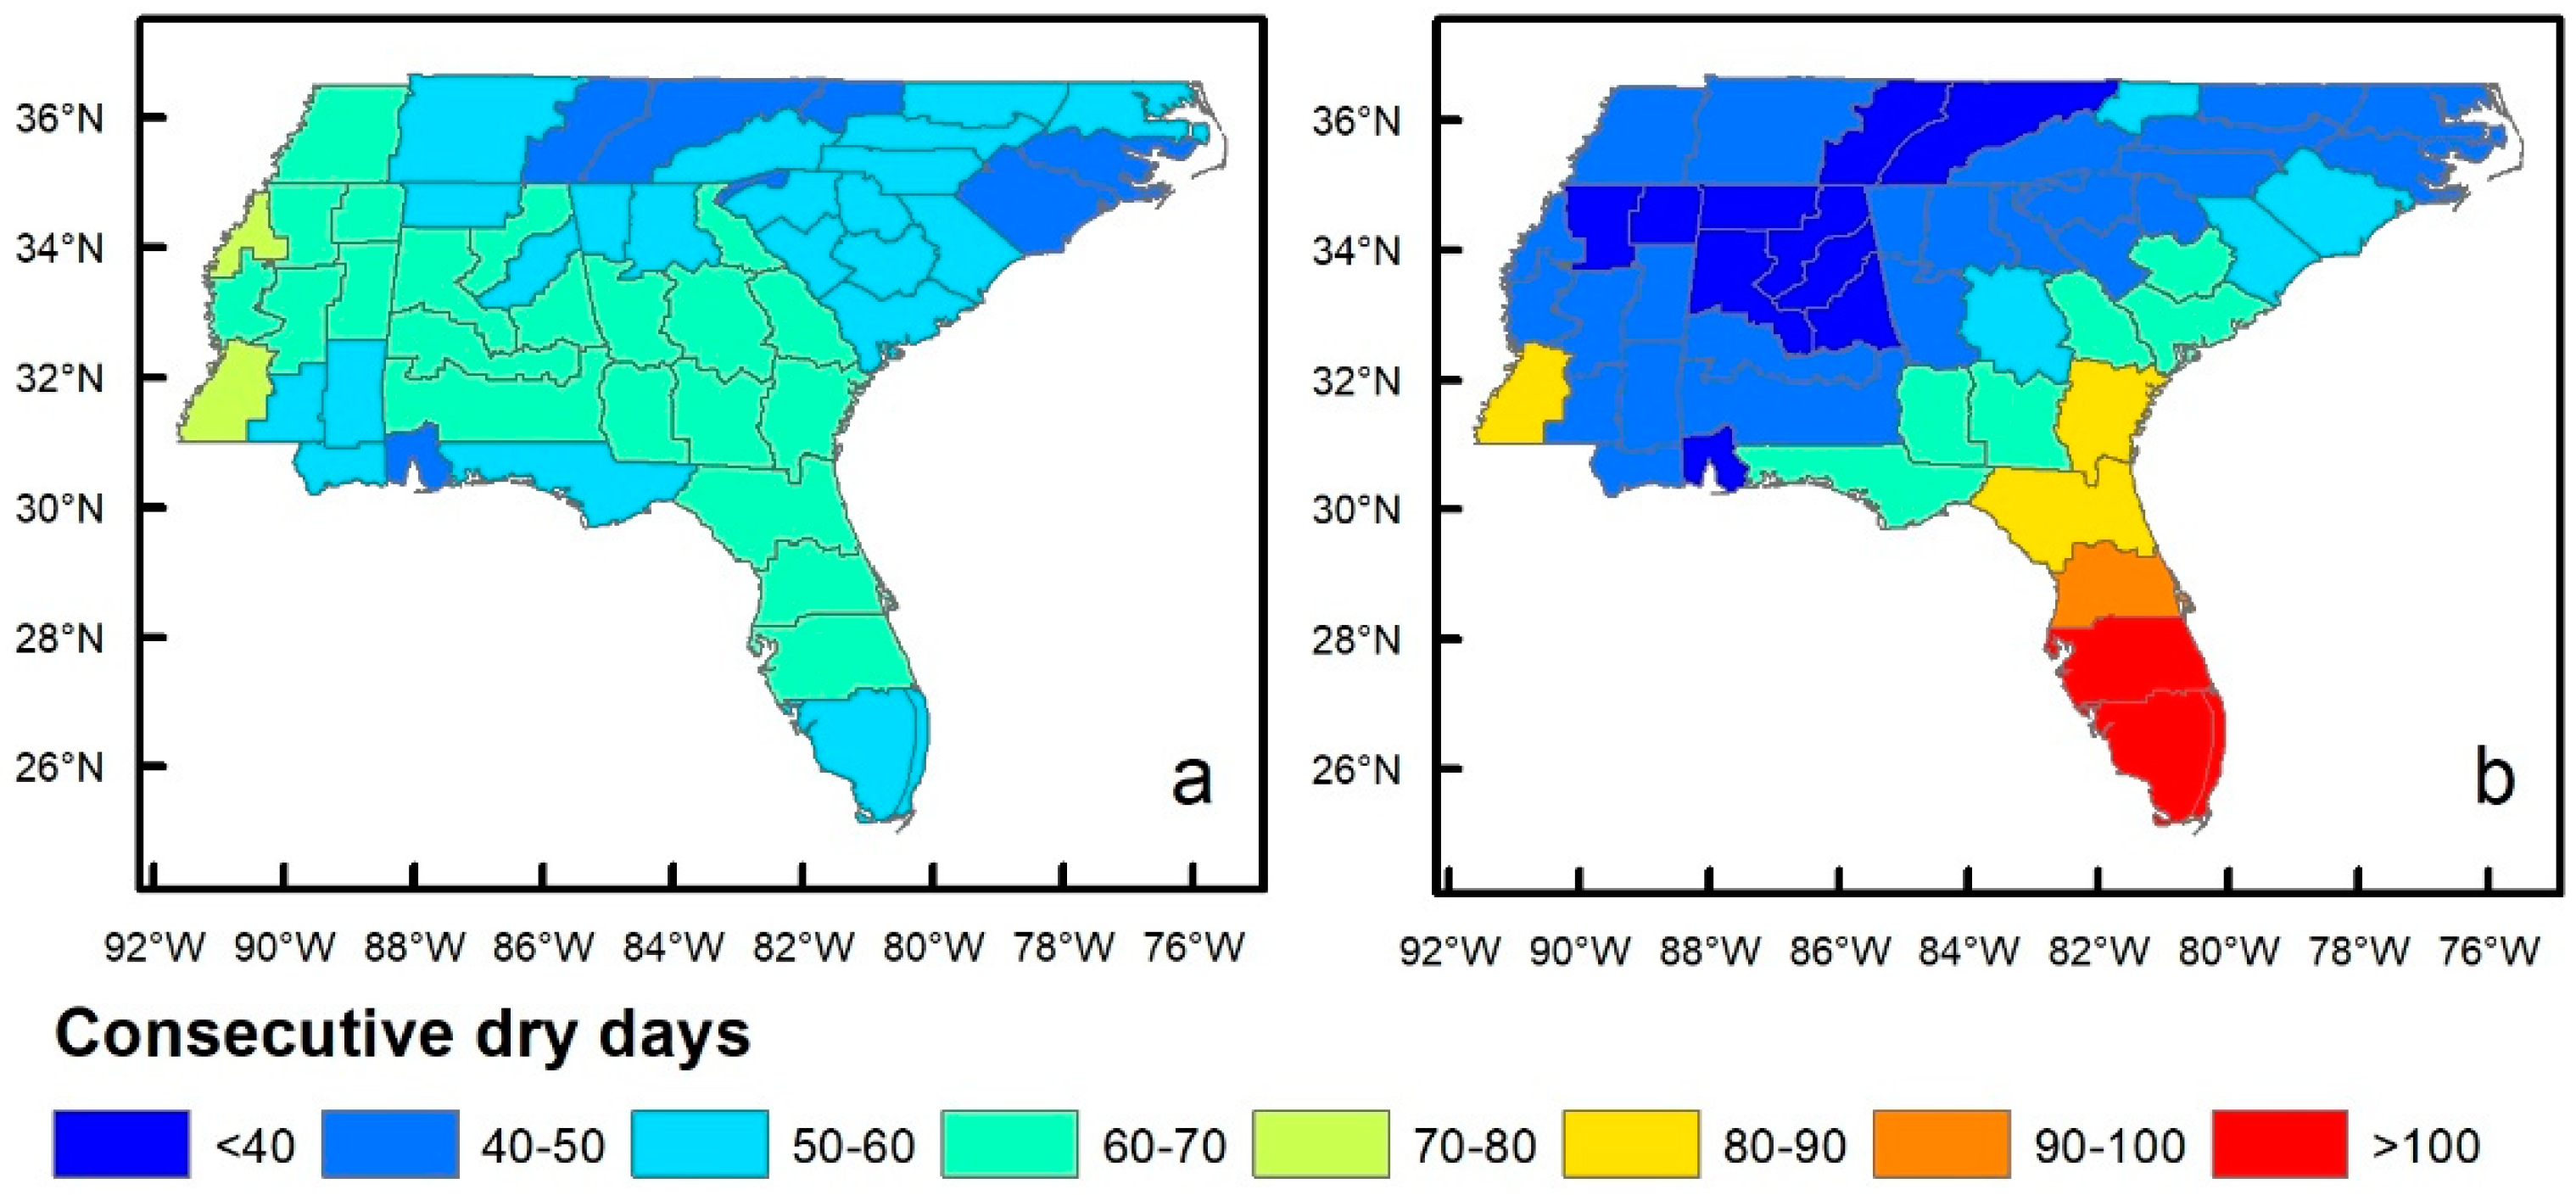
Figure 1 shows the length of observed (1950–2005) 20-year recurring CDD for the warm season (Figure 1a) and cold season (Figure 1b). Warm season precipitation in the Southeast is generally frequent and originates from local convection as well as tropical cyclones. The observational record shows that the 20-year CDD for the warm season is up to 70 days. The cold season (Figure 1b) shows a North–South gradient in the length of dry spells. Precipitation during this time of the year mainly originates from cold fronts moving south over the continent, which translates to 20-year CDD of less than 40 days in the northern parts of the study area during the cold season, while farther south 100 plus CDD are observed.
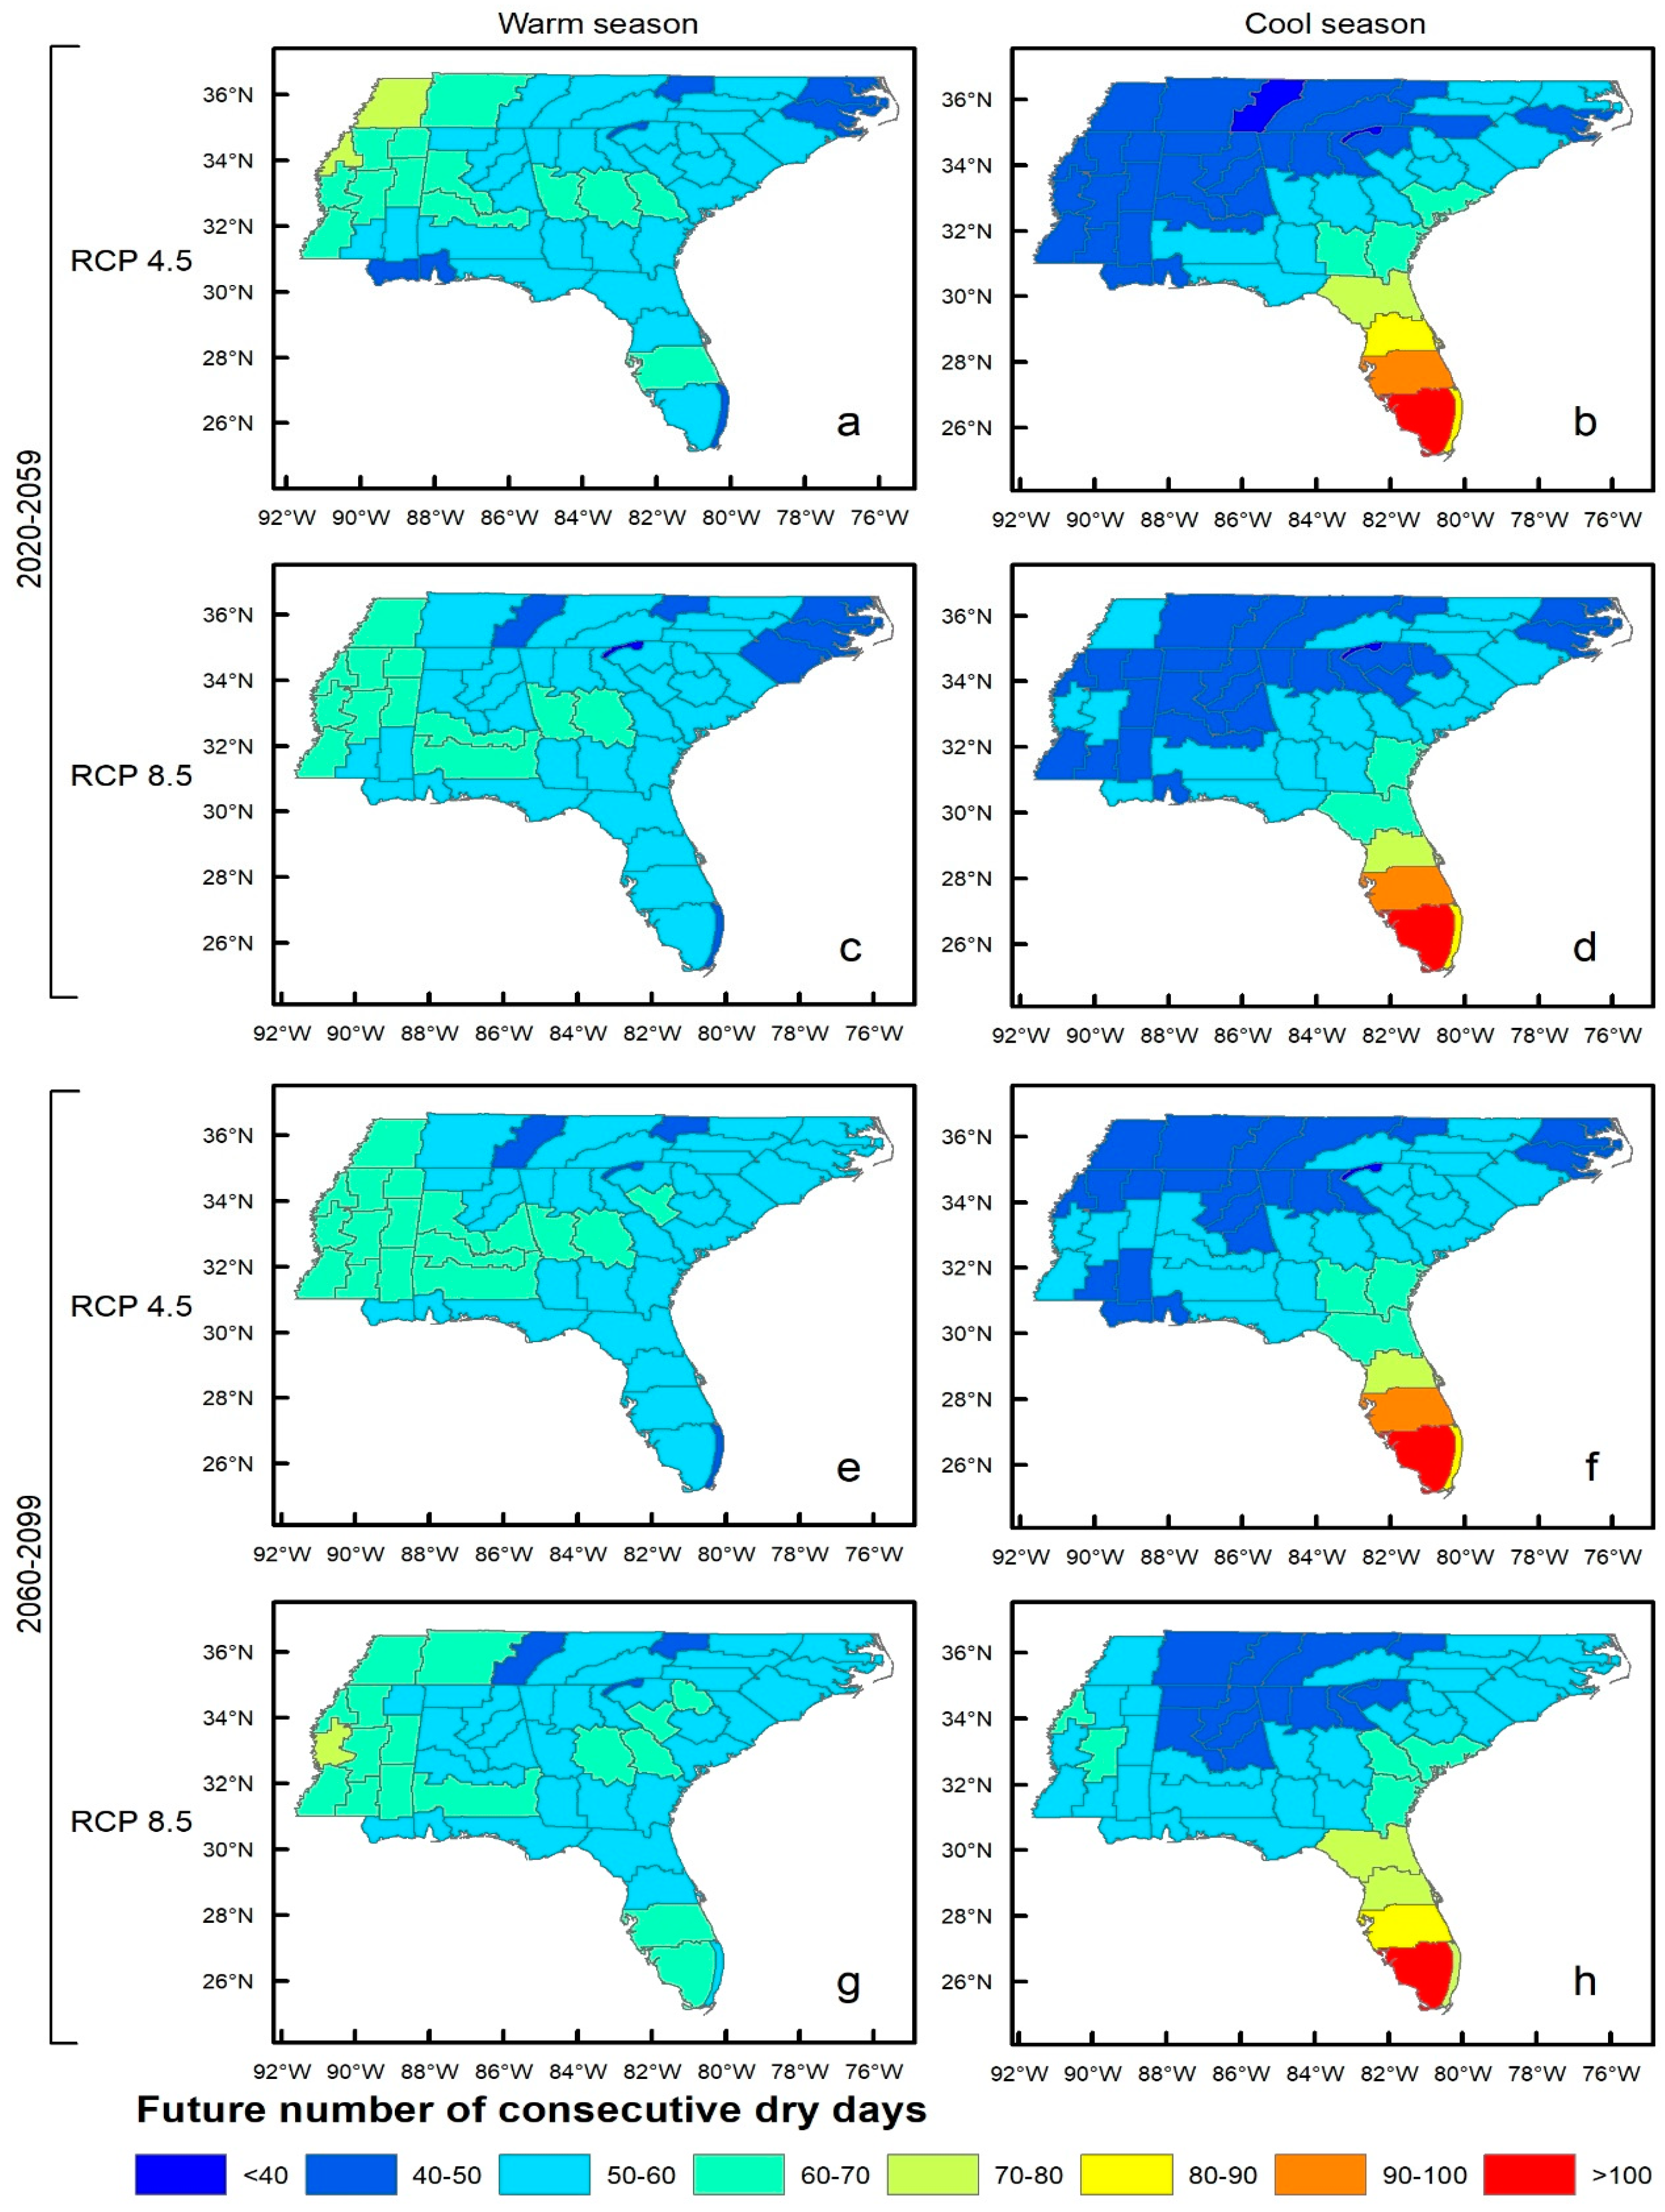
Figure 2 shows the length of a 20-year return CDD, as estimated by the best performing CMIP5 models [19]. Visually comparing with Figure 1 (observations), Figure 2 shows generally similar spatial patterns of lengths of CDD 20-year return periods indicating that the models capture the spatial dynamics involved in physical processes responsible for CDD.
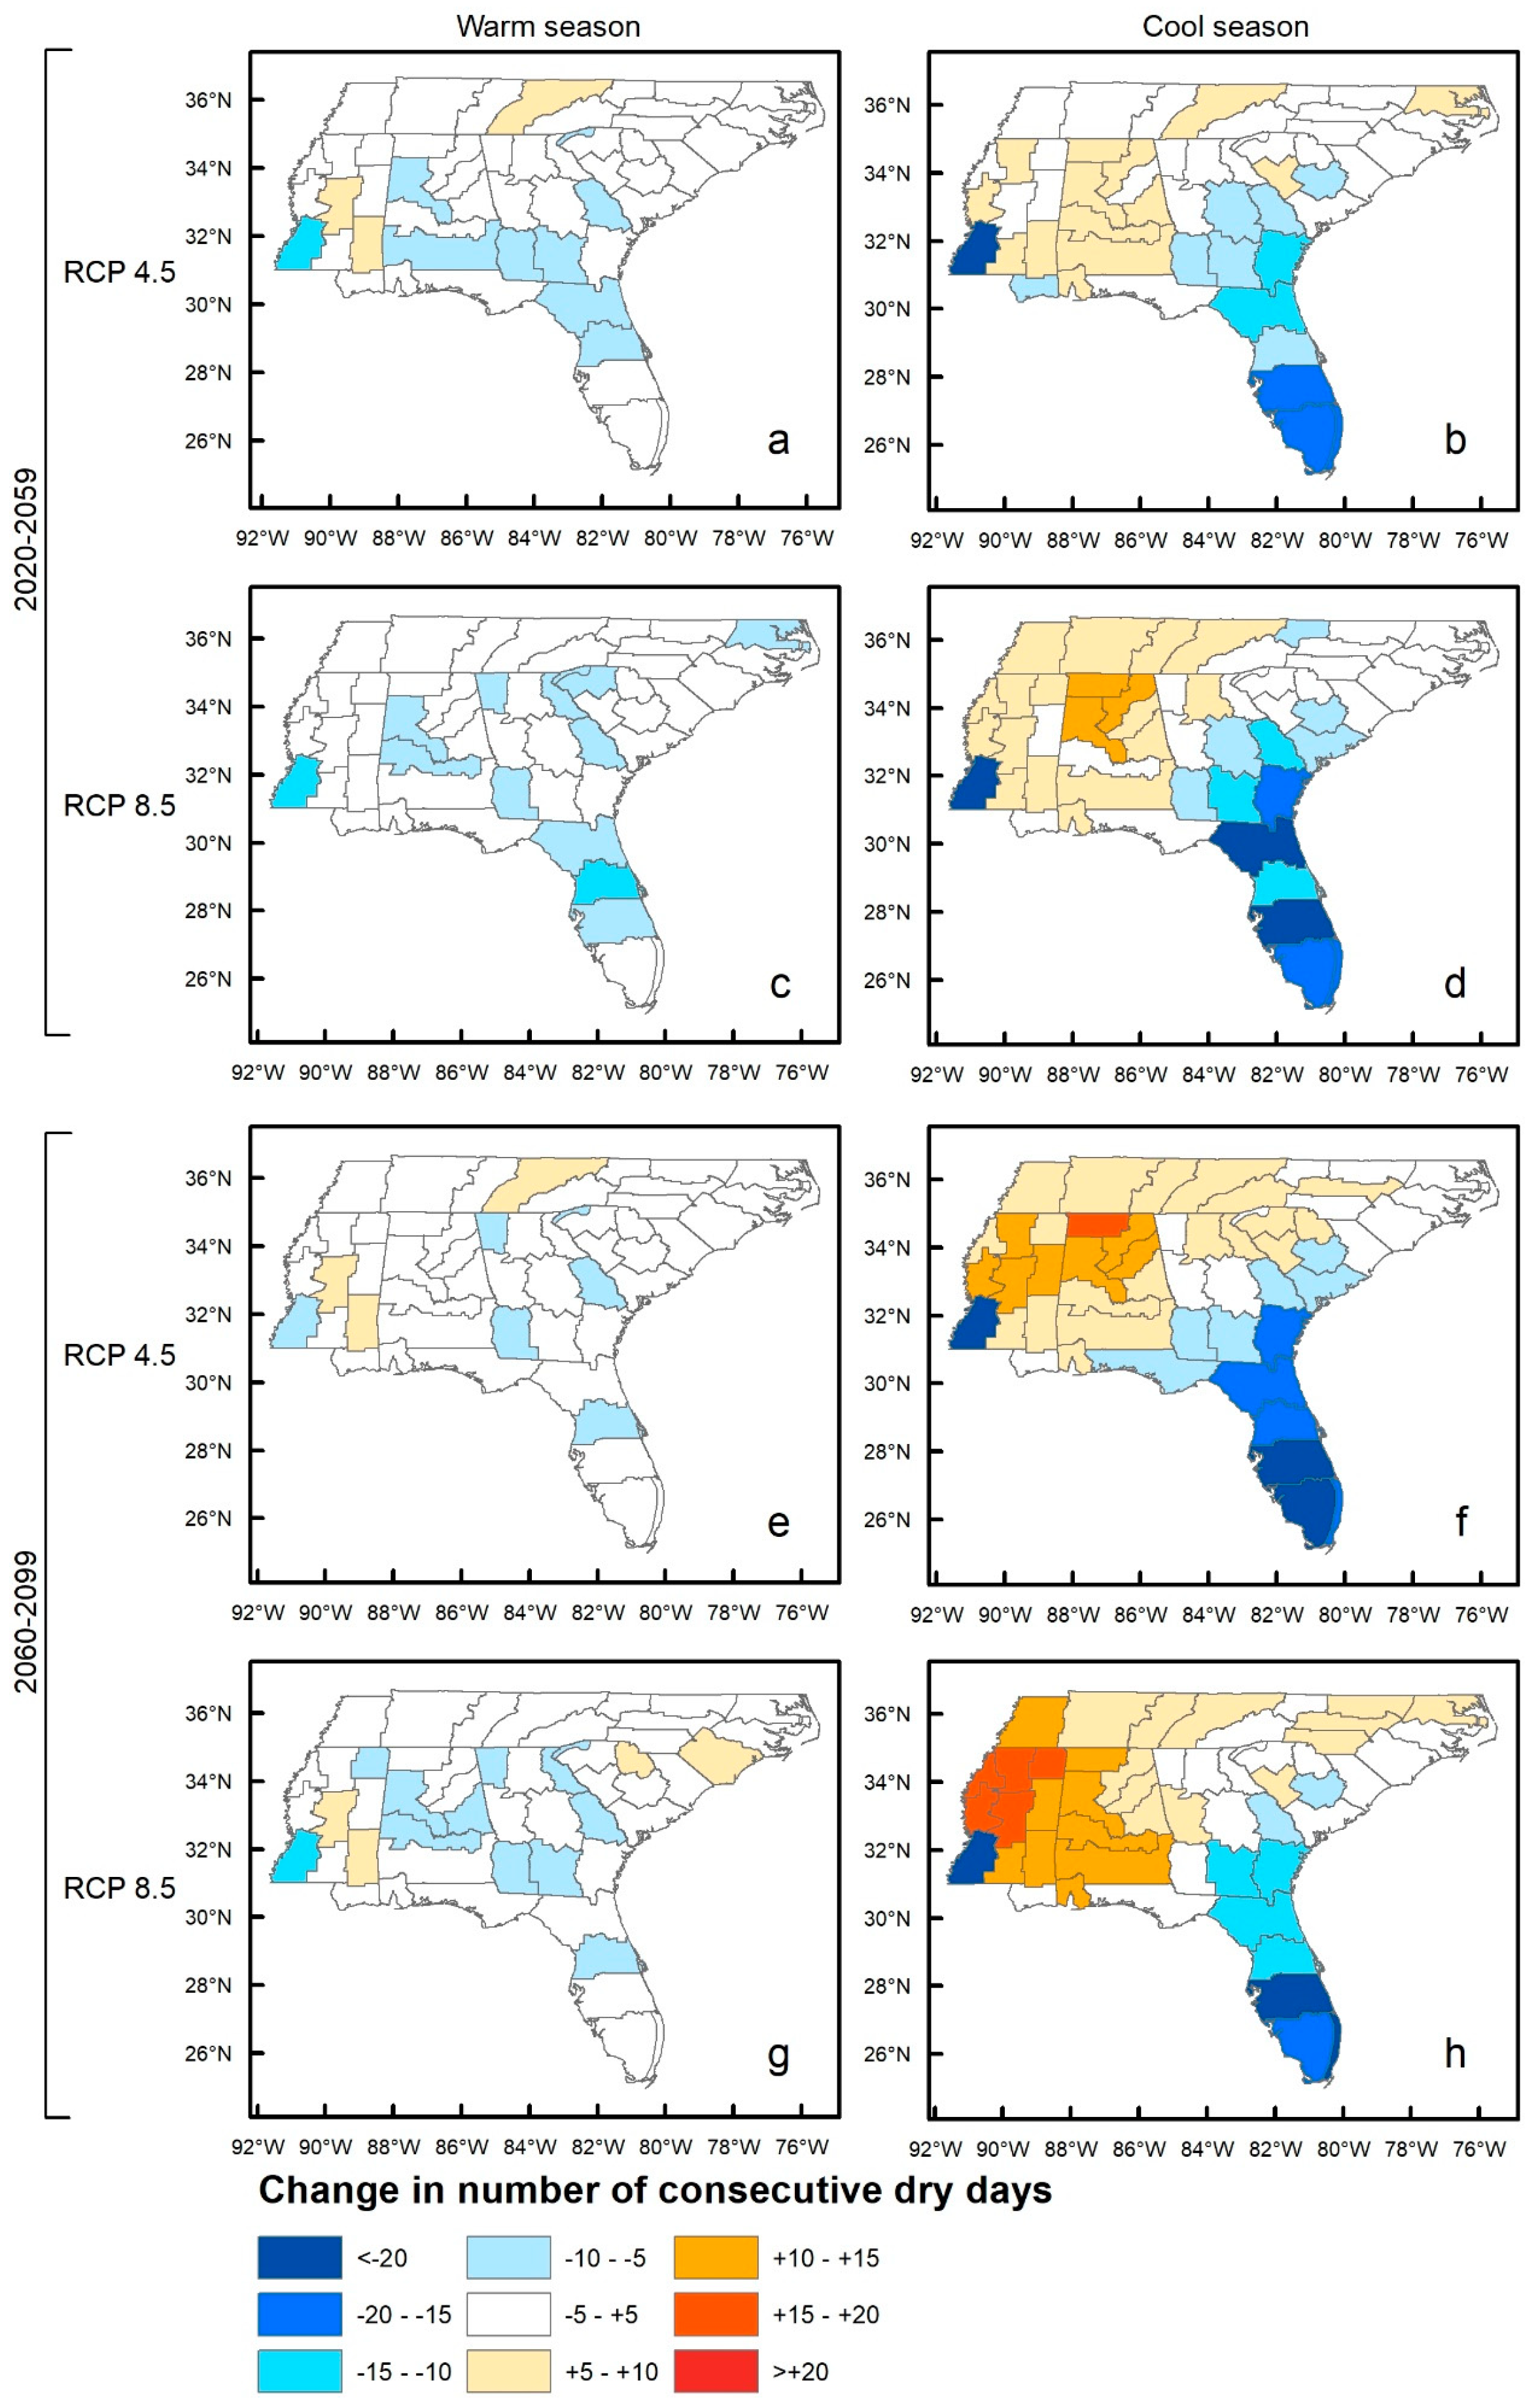
Figure 3 shows the absolute difference between the observed (1950–2005) length of a 20-year CDD and the future outlooks. Figure 3 illustrates that summertime dry spells (left column of maps) will exhibit little change throughout the region with few of the climate divisions exhibiting a change in excess of ±5 days in length of CDD. However, there is a reduction in 20-year return values by 5–10 days in approximately 25% of the climate divisions during the near future period under the high emissions scenario. The winter season (right column of Figure 3) shows greater change and a more distinct geographical pattern. There is an increase in the length of 20-year return CDD by up to 20 days in more northern and continental locations and reductions of 20 days or more in more coastal locations, especially peninsular Florida. These changes are apparent across both future periods and both emissions scenarios, but they are more pronounced in the later period and under the higher RCP 8.5.
The southwestern-most climate division of Mississippi shows a spatially homogeneous behavior in Figure 2, but one climate division with significantly different future outlooks than surrounding climate divisions appears in Figure 3. The explanation for this is an extreme drought that struck southern Mississippi in the 1950s [40,41]. This drought can also be seen in Figure 1 where the same climate division stands out as having a considerably longer 20-year CDD than surrounding climate divisions. This results in a large difference between the length of the historical and modelled future 20-year CDD. It should also be noted that when calculating the length of 20-year historical CDD in each climate division, the maximum observed values were used. This value might represent an outlier within the climate division. As the focus of this paper is on extreme CDD, this was viewed as a preferential method to averaging the CDD values within each climate division.
4. Discussion and Conclusions
As a continuation of the authors’ earlier work [19], this paper analyses meteorological drought from the perspective of consecutive dry days (days receiving less than 3 mm precipitation). The authors recognize that the nature of a drought can be multifaceted, and there can be multiple factors involved in the development of a drought, such as water use by humans, and high temperatures, leading to high water losses through evaporation and reductions in soil moisture. As has been pointed out, while consecutive dry days represent the lower tail of the precipitation distribution and are indicative of meteorological drought they should be interpreted in combination with other precipitation or drought indicators [14,42]. Thus, further work is required on how other drought indicators may change in the Southeast and how these indicators may combine with the projected changes in CDD, presented here, to increase future drought severity.
Our previous work, and that of others, has found that the CMIP5 models analyzed here can replicate the spatial patterns and magnitudes of consecutive dry days well [14,19]. However, precipitation is generally not well represented in models, particularly extremes of precipitation in the southern U.S., likely as a result of the varied physical processes responsible for precipitation formation in the region and the underestimation of tropical cyclone numbers [43]. The discrepancy between the generally poor estimation of extreme precipitation versus good estimation of CDD in the southern U.S. is likely explained by the scale of processes involved. CDD are most likely caused by larger spatial scale processes than extreme precipitation events, which are more likely the consequence of localized or mixed processes and thus more difficult for models to resolve [14]. Further work is needed to assess the possible drivers of the results presented here which are likely a combination of changes in atmospheric moisture and circulation.
In this paper, we have presented projections of extreme CDD lengths across the Southeast using a small ensemble of high performing models. These models have been downscaled to a fine spatial resolution using a technique that has been shown to preserve rather than dilute extreme values. The projections are divided into warm and cold seasons based on agricultural growing dates as to isolate seasons subject to differing societal concerns and changes in CDD are presented for two future periods, in order to differentiate between near term versus long term impacts, and for two emissions trajectories to aid in decision making. Projected CDD exhibit little change during the warm season, but during the cold season there is an increase of up to 20 days in length of 20-year return CDD in more northern and continental locations and reductions of 20 days or more in coastal locations.
The projection of greatest increase of CDD in more northern and continental locations is concerning as these areas of the Southeast coincide with locations of the largest reservoirs in the region. These surface reservoirs are regionally significant sources of drinking water and irrigation and are essential for hydropower production, which is the primary form of renewable electricity generation in the Southeast. The seasonality of the projected increase in CDD is also of concern as wildfires are generally more likely to occur during the cold season. Drought risk is likely to increase in the future throughout the region given projections of increased temperatures and rates of evapotranspiration as a result of climate change [1,44]. It is, therefore, likely that the projected increases in CDD will place further water resource stress on the Southeast.
Author Contributions
Conceptualization, J.E. and D.K., methodology, D.K.; validation, J.E. and D.K., visualization J.E. Both authors contributed equally to the writing and editing of the manuscript.
Funding
This research received no external funding.
Acknowledgments
The authors gratefully acknowledge use of the resources of the Alabama Water Institute at The University of Alabama. Further the authors acknowledge the WCRP’s Working Group on Coupled Modelling, which is responsible for CMIP, and thanks to the climate modelling groups for producing and making available their model output. For CMIP, the US Department of Energy’s PCMDI provides coordinating support and led development of software infrastructure in partnership with Global Organization for Earth System Science Portals. The authors also greatly appreciate the work of DCHP in their downscaling effort and for making available the LOCA downscaled model output and Ben Livneh’s hydrometeorology data set.
Conflicts of Interest
The authors declare no conflict of interest.
References
- Kunkel, K.E.; Stevens, L.E.; Stevens, S.E.; Sun, L.; Anssen, E.; Wuebbles, D.; Redmond, K.T.; Dobson, J.G. Regional Climate Trends and Scenarios for the U.S. National Climate Assessment. NOAA Tech. Rep. NESDIS 2013, 142–146, 103. [Google Scholar]
- Yuhas, E.; Daniels, T. The US freshwater supply shortage: Experiences with desalination as part of the solution. J. Environ. Plan. Manag. 2006, 49, 571–585. [Google Scholar] [CrossRef]
- Manuel, J. Drought in the Southeast: Lessons for Water Management. Environ. Health Perspect. 2008, 116, A168–A171. [Google Scholar] [CrossRef] [PubMed]
- Price, K. Thirsty City: Politics, Greed, and the Making of Atlanta’s Water Crisis by Skye Borden. Southeast. Geogr. 2017, 57, 322–326. [Google Scholar] [CrossRef]
- Ropelewski, C.F.; Halpert, M.S. Global and Regional Scale Precipitation Patterns Associated with the El Nino Southern Oscillation. Mon. Weather Rev. 1987, 115, 1606–1626. [Google Scholar] [CrossRef]
- Dracup, J.A.; Kahya, E. The relationships between U.S. streamflow and La Nina Events. Water Resour. Res. 1994, 30, 2133–2141. [Google Scholar] [CrossRef]
- Enfield, D.B.; Mestas-Nunez, A.M.; Trimble, P.J. The Atlantic Multidecadal Oscillation and its relation to rainfall and river flows in the continental U.S. Geophys. Res. Lett. 2001, 28, 2077–2080. [Google Scholar] [CrossRef]
- Ortegren, J.T.; Knapp, P.A.; Maxwell, J.T.; Tyminski, W.P.; Soulé, P.T. Ocean-Atmosphere Influences on Low-Frequency Warm-Season Drought Variability in the Gulf Coast and Southeastern United States. J. Appl. Meteorol. Climatol. 2011, 50, 1177–1186. [Google Scholar] [CrossRef]
- Labosier, C.; Quiring, S. Hydroclimatology of the Southeastern USA. Clim. Res. 2013, 57, 157–171. [Google Scholar] [CrossRef]
- Engström, J.; Waylen, P. Drivers of long-term precipitation and runoff variability in the southeastern USA. Theor. Appl. Climatol. 2018, 131, 1133–1146. [Google Scholar] [CrossRef]
- Pinault, J.-L. Regions Subject to Rainfall Oscillation in the 5–10 Year Band. Climate 2018, 6, 2. [Google Scholar] [CrossRef]
- IPCC. IPCC Climate Change 2014: Synthesis Report; IPCC: Geneva, Switzerland, 2014. [Google Scholar]
- Carter, L.M.; Jones, J.W.; Berry, L.; Burkett, V.; Murley, J.F.; Obeysekera, J.; Schramm, P.J.; Wear, D. Chapter 17: Southeast and the Caribbean. In Climate Change Impacts in the United States: The Third National Climate Assessment; U.S. Global Change Research Program; U.S. Government Printing Office: Washington, DC, USA, 2014; pp. 396–417. [Google Scholar]
- Sillmann, J.; Kharin, V.V.; Zwiers, F.W.; Zhang, X.; Bronaugh, D. Climate extremes indices in the CMIP5 multimodel ensemble: Part 2. Future climate projections. J. Geophys. Res. Atmos. 2013, 118, 2473–2493. [Google Scholar] [CrossRef] [Green Version]
- Schoof, J.T. High-resolution projections of 21st century daily precipitation for the contiguous U.S. J. Geophys. Res. 2015, 120, 3029–3042. [Google Scholar] [CrossRef]
- Skeeter, W.J.; Senkbeil, J.C.; Keellings, D.J. Spatial and temporal changes in the frequency and magnitude of intense precipitation events in the southeastern United States. Int. J. Climatol. 2018. [Google Scholar] [CrossRef]
- Seager, R.; Tzanova, A.; Nakamura, J. Drought in the Southeastern United States: Causes, Variability over the Last Millennium, and the Potential for Future Hydroclimate Change. J. Clim. 2009, 22, 5021–5045. [Google Scholar] [CrossRef]
- Pederson, N.; Bell, A.R.; Knight, T.A.; Leland, C.; Malcomb, N.; Anchukaitis, K.J.; Tackett, K.; Scheff, J.; Brice, A.; Catron, B.; et al. A long-term perspective on a modern drought in the American Southeast. Environ. Res. Lett. 2012, 7, 14034. [Google Scholar] [CrossRef] [Green Version]
- Engström, J.; Keellings, D. Drought in the Southeastern USA: An assessment of downscaled CMIP5 models. Clim. Res. 2018, 74, 251–262. [Google Scholar] [CrossRef]
- Knutti, R. The end of model democracy? Clim. Chang. 2010, 102, 395–404. [Google Scholar] [CrossRef]
- Räisänen, J.; Palmer, T.N. A probability and decision-model analysis of a multimodel ensemble of climate change simulations. J. Clim. 2001, 14, 3212–3226. [Google Scholar] [CrossRef]
- Sánchez, E.; Romera, R.; Gaertner, M.A.; Gallardo, C.; Castro, M. A weighting proposal for an ensemble of regional climate models over Europe driven by 1961–2000 ERA40 based on monthly precipitation probability density functions. Atmos. Sci. Lett. 2009, 10, 241–248. [Google Scholar] [CrossRef]
- Sun, F.; Roderick, M.L.; Lim, W.H.; Farquhar, G.D. Hydroclimatic projections for the Murray-Darling Basin based on an ensemble derived from Intergovernmental Panel on Climate Change AR4 climate models. Water Resour. Res. 2011, 47. [Google Scholar] [CrossRef] [Green Version]
- Pierce, D.W.; Cayan, D.R.; Thrasher, B.L. Statistical Downscaling Using Localized Constructed Analogs (LOCA). J. Hydrometeorol. 2014, 15, 2558–2585. [Google Scholar] [CrossRef]
- Van Vuuren, D.P.; Edmonds, J.; Kainuma, M.; Riahi, K.; Thomson, A.; Hibbard, K.; Hurtt, G.C.; Kram, T.; Krey, V.; Lamarque, J.F.; et al. The representative concentration pathways: An overview. Clim. Chang. 2011, 109, 5–31. [Google Scholar] [CrossRef]
- Shepard, D.S. Computer Mapping: The SYMAP Interpolation Algorithm. In Spatial Statistics and Models; Springer: Dordrecht, The Netherlands, 1984; ISBN 978-90-481-8385-2. [Google Scholar]
- Widmann, M.; Bretherton, C.S. Validation of Mesoscale Precipitation in the NCEP Reanalysis Using a New Gridcell Dataset for the Northwestern United States. J. Clim. 2000, 13, 1936–1950. [Google Scholar] [CrossRef]
- Maurer, E.P.; Wood, A.W.; Adam, J.C.; Lettenmaier, D.P.; Nijssen, B.; Maurer, E.P.; Wood, A.W.; Adam, J.C.; Lettenmaier, D.P.; Nijssen, B. A Long-Term Hydrologically Based Dataset of Land Surface Fluxes and States for the Conterminous United States. J. Clim. 2002, 15, 3237–3251. [Google Scholar] [CrossRef]
- Livneh, B.; Bohn, T.J.; Pierce, D.W.; Munoz-Arriola, F.; Nijssen, B.; Vose, R.; Cayan, D.R.; Brekke, L. A spatially comprehensive, hydrometeorological data set for Mexico, the U.S., and Southern Canada 1950–2013. Sci. Data 2015, 2, 150042. [Google Scholar] [CrossRef] [Green Version]
- Keellings, D. Evaluation of downscaled CMIP5 model skill in simulating daily maximum temperature over the southeastern United States. Int. J. Climatol. 2016, 36, 4172–4180. [Google Scholar] [CrossRef]
- Engström, J.; Waylen, P. The changing hydroclimatology of Southeastern U.S. J. Hydrol. 2017, 548, 16–23. [Google Scholar] [CrossRef]
- Wilks, D. Statistical Methods in the Atmospheric Sciences; Elsevier Inc.: Amsterdam, The Netherlands, 2011; ISBN 9781849733403. [Google Scholar]
- US Department of Agriculture National Agricultural Statistics Service. Field Crops Usual Planting and Harvesting Dates. 2010. Available online: http://usda.mannlib.cornell.edu/usda/current/planting/planting-10-29-2010.pdf (accessed on 8 February 2017).
- Perkins, S.E.; Pitman, A.J.; Sisson, S.A. Systematic differences in future 20 year temperature extremes in AR4 model projections over Australia as a function of model skill. Int. J. Climatol. 2013, 33, 1153–1167. [Google Scholar] [CrossRef]
- Zwiers, F.W.; Kharin, V.V. Changes in the extremes of the climate simulated by CGC GCM2 under CO2 doubling. J. Clim. 1998, 11, 2200–2222. [Google Scholar] [CrossRef]
- Kharin, V.V.; Zwiers, F.W.; Zhang, X. Intercomparison of Near-Surface Temperature and Precipitation Extremes in AMIP-2 Simulations, Reanalyses, and Observations. J. Clim. 2005, 18, 5201–5223. [Google Scholar] [CrossRef]
- Waylen, P.; Keellings, D.; Qiu, Y. Climate and health in Florida: Changes in risks of annual maximum temperatures in the second half of the twentieth century. Appl. Geogr. 2012, 33, 73–81. [Google Scholar] [CrossRef]
- Jenkinson, A. The frequency distribution of annual maximum (and minimum) values of meteorological elements. Q. J. R. Meteorol. Soc. 1955, 87, 158–171. [Google Scholar] [CrossRef]
- Coles, S. An Introduction to Statistical Modeling of Extreme Values; Springer: London, UK, 2001; ISBN 1-85233-459-2. [Google Scholar]
- Harvey, E.J. Records of wells in the alluvium in northwestern Mississippi. Miss. Board Water Comm. Bull. 1956, 56, 130. [Google Scholar]
- Paulson, R. National Water Summary 1988–1989: Hydrologic Events and Floods and Droughts; United States Geological Survey Water-Supply Paper: Reston, VA, USA, 1991.
- Orlowsky, B.; Seneviratne, S.I. Global changes in extreme events: Regional and seasonal dimension. Clim. Chang. 2012, 110, 669–696. [Google Scholar] [CrossRef]
- Sheffield, J.; Barrett, A.P.; Colle, B.; Fernando, D.N.; Fu, R.; Geil, K.L.; Hu, Q.; Kinter, J.; Kumar, S.; Langenbrunner, B.; et al. North American Climate in CMIP5 experiments. Part I: Evaluation of historical simulations of continental and regional climatology. J. Clim. 2013, 26, 9209–9245. [Google Scholar] [CrossRef]
- Sobolowski, S.; Pavelsky, T. Evaluation of present and future North American Regional Climate Change Assessment Program (NARCCAP) regional climate simulations over the southeast United States. J. Geophys. Res. Atmos. 2012, 117, D01101. [Google Scholar] [CrossRef]
Figure 1.
Observed (1950–2005) lengths of 20-year return period consecutive dry days. For warm season (a) and cold season (b).
Figure 1.
Observed (1950–2005) lengths of 20-year return period consecutive dry days. For warm season (a) and cold season (b).

Figure 2.
Modeled future length of 20-year return period consecutive dry days. Warm season estimates are shown in (a,c,e,g), and cold season estimates are shown in (b,d,f,h). Future period and RCP scenario are indicated on the left.
Figure 2.
Modeled future length of 20-year return period consecutive dry days. Warm season estimates are shown in (a,c,e,g), and cold season estimates are shown in (b,d,f,h). Future period and RCP scenario are indicated on the left.

Figure 3.
Absolute changes in length of 20-year return period consecutive dry days in modeled future periods versus observations. Warm season estimates are shown in (a,c,e,g), and cold season estimates are shown in (b,d,f,h). Future period and RCP scenario are indicated on the left.
Figure 3.
Absolute changes in length of 20-year return period consecutive dry days in modeled future periods versus observations. Warm season estimates are shown in (a,c,e,g), and cold season estimates are shown in (b,d,f,h). Future period and RCP scenario are indicated on the left.


Table 1.
List of CMIP5 models evaluated in each season. Top five models of 32 as identified by application of skill scores (averaged across all climate divisions) [19].
Table 1.
List of CMIP5 models evaluated in each season. Top five models of 32 as identified by application of skill scores (averaged across all climate divisions) [19].
| Season | Model Name | Affiliation | Country | Skill |
|---|---|---|---|---|
| Warm Season | ACCESS1-3 | CSIRO (Commonwealth Scientific and Industrial Research Organization, Australia), and BOM (Bureau of Meteorology, Australia) | Australia | 0.92 |
| GISS-E2-H GISS-E2-R | NASA Goddard Institute for Space Studies | United States | 0.93 | |
| MIROC5 | Atmosphere and Ocean Research Institute (The University of Tokyo), National Institute for Environmental Studies, and Japan Agency for Marine-Earth Science and Technology | Japan | 0.93 | |
| MRI-CGCM3 | Meteorological Research Institute | Japan | 0.92 | |
| Cold Season | CanESM2 | Canadian Centre for Climate Modeling and Analysis | Canada | 0.93 |
| CESM1-CAM5 | National Science Foundation, Department of Energy, National Center for Atmospheric Research | United States | 0.92 | |
| inmcm4 | Institute for Numerical Mathematics | Russia | 0.92 | |
| IPSL-CM5A-LR IPSL-CM5A-MR | Institute Pierre-Simon Laplace | France | 0.92 |
© 2019 by the authors. Licensee MDPI, Basel, Switzerland. This article is an open access article distributed under the terms and conditions of the Creative Commons Attribution (CC BY) license (http://creativecommons.org/licenses/by/4.0/).
Share and Cite
MDPI and ACS Style
Keellings, D.; Engström, J. The Future of Drought in the Southeastern U.S.: Projections from Downscaled CMIP5 Models. Water 2019, 11, 259. https://doi.org/10.3390/w11020259
AMA Style
Keellings D, Engström J. The Future of Drought in the Southeastern U.S.: Projections from Downscaled CMIP5 Models. Water. 2019; 11(2):259. https://doi.org/10.3390/w11020259
Chicago/Turabian StyleKeellings, David, and Johanna Engström. 2019. "The Future of Drought in the Southeastern U.S.: Projections from Downscaled CMIP5 Models" Water 11, no. 2: 259. https://doi.org/10.3390/w11020259
Note that from the first issue of 2016, this journal uses article numbers instead of page numbers. See further details here.