Article

Remote Image Capture System to Improve Aerial Supervision for Precision Irrigation in Agriculture

by
Antonio Mateo-Aroca
1,
Ginés García-Mateos
2,*,
Antonio Ruiz-Canales
3,
José María Molina-García-Pardo
4 and
José Miguel Molina-Martínez
5
1
Electronic Engineering Department, Technical University of Cartagena, 30203 Cartagena, Spain
2
Computer Science and Systems Department, University of Murcia, 30100 Murcia, Spain
3
Engineering Department, Miguel Hernandez University of Elche, 03312 Orihuela, Alicante, Spain
4
Information Technologies and Communications Department, Technical University of Cartagena, 30203 Cartagena, Spain
5
Food Engineering and Agricultural Equipment Department, Technical University of Cartagena, 30203 Cartagena, Spain
*
Author to whom correspondence should be addressed.
Water 2019, 11(2), 255; https://doi.org/10.3390/w11020255
Submission received: 25 December 2018 / Revised: 28 January 2019 / Accepted: 29 January 2019 / Published: 1 February 2019
(This article belongs to the Section Hydrology)

Abstract

:
Due to the limitations of drones and satellites to obtain aerial images of the crops in real time, the time to flight delay, the problems caused by adverse weather conditions and other issues, the use of fixed cameras placed on the regions of interest is essential to get closer, periodic and on-demand images. Water management in agriculture is one of the most important applications of these images. Top view images of a crop can be processed for determining the percentage of green cover (PGC), and 2D images from different viewing angles can be applied for obtaining 3D models of the crops. In both cases, the obtained data can be managed for calculating several parameters such as crop evapotranspiration, water demand, detection of water deficit and indicators about solute transport of fertilizers in the plant. For this purpose, a remote image capture system has been developed for an application in lettuce crops. The system consists of several capture nodes and a local processing base station which includes image processing algorithms to obtain key features for decision-making in irrigation and harvesting strategies. Placing multiple image capture nodes allows obtaining different observation zones that are representative of the entire crop. The nodes have been designed to have autonomous power supply and wireless connection with the base station. This station carries out irrigation and harvesting decisions using the results of the processing of the images captured by the nodes and the information of other local sensors. The wireless connection is made using the ZigBee communication architecture, supported by XBee hardware. The two main benefits of this choice are its low energy consumption and the long range of the connection.

1. Introduction

Developing sustainable systems for water management is one of the main research challenges in agricultural engineering [1]. Applying new tools and methodologies is necessary to increase the efficiency in using water by the crop and maintaining production levels [2]. The region of Murcia, Spain, is one of the most productive zones of agricultural products in its context. However, it is a water-deficit area with annual rainfall between 150 mm and 350 mm; availability and efficiency in water use are critical factors in this region. Thus, the development of new methods for water management and estimation of irrigation requirements of the crops is particularly important.
Traditionally, irrigation decisions are done by farmers, who estimate the requirements based on historic values of the reference and crop evapotranspiration (ETo and ETc, respectively). At most, it is done by estimating the current water consumption of the crop based on information offered by agrometeorological stations near the field. The management of the crop growth is an essential task that is done manually by the farmers. This know-how is tried to be replicated in the automatic monitoring systems using different parameters of the crops.
Precision agriculture applies geospatial technology (such as remote sensing, GPS and GIS) to monitor the fields. Currently, high-resolution satellite imagery is very frequently applied to study changes in crop and soil. However, the prohibitive cost and limited availability of these resources encourage the development of alternative or complementary systems for agricultural applications. This way, images captured with drones and, in general, unmanned aerial vehicles (UAVs), have proved to be a feasible solution because of their high temporal and spatial resolution, reduced operational cost, and high flexibility in inflight programming. UAVs ground stations provide user interfaces including flight control, planning and image acquisition [3,4].
Some authors have defined precision irrigation as “the accurate and precise application of water to meet the specific requirements of individual management units or plants and minimize the adverse environmental impact” [5]. To achieve this goal, new technologies have to be developed to create “an irrigation system that knows what to do, knows how to do it, knows what it has done, and learns from what it has done” [6]. For this purpose, using images of crop areas has proved to be adequate to estimate parameters such as the crop coefficient, Kc, and the evapotranspiration, ET [7,8].
The lack of water resources has led to the development of automatic systems to evaluate and establish criteria to achieve savings in water consumption. The combination of information technology in sensor networks and in field stations [9,10] is very beneficial for water management, allowing for an optimal control and monitoring in the use of water [11,12,13]. One of the specific techniques for managing the water in the crop and in the soil is the use of images [14]. The images of the green cover of the crop or the canopy give an idea of the amount of water the crop is losing by evapotranspiration [15]. The percentage of the green cover of the crop (PGC) is related to the crop evaporation model [16]. In this sense, the top view images of a crop can be processed for determining the PGC, which is then used for computing the crop coefficient, Kc, and then the crop evapotranspiration, ETc. For example, in the case of lettuce crops, the effective diameter of the plants can be estimated accurately [8], from which the root depth, plant height and ETc are computed.
In order to improve the evapotranspiration model of a crop, a 3D model can also be obtained [17]. In this case, the 2D images from several viewing angles can be integrated for obtaining 3D models of the crop. In both cases (2D and 3D models), the obtained data can be managed for calculating several parameters, such as water demand, detection of water deficit and indicators about solute transport of fertilizers in the plant [18]. Moreover, the images of the soil can be processed to obtain several parameters related to soil water management (such as soil moisture and detection of fertilizers) [19].
Image surveillance systems can be based on static cameras or aerial capture using drones or satellites. In any case, regular crop sampling is necessary to obtain robust and reliable systems. Remote sensing has the advantage of providing information of bigger areas in longer time periods [20]. These facts permit the farmers to analyze the change in crop growth over time. Moreover, remote sensing information combined with measurements obtained in situ is essential to make more timely and accurate decisions [20]. More recently, the technology related to big data and Internet of Things (IoT) has also been incorporated into the agricultural engineering domain; an interesting review of these applications can be found in [21].

1.1. Limitations of UAVs in Precision Agriculture Applications

Despite their great advantages, there are also some recognized technical difficulties related to drones and UAVs, like the engine power, the short duration of the flights, the maintenance of flying altitude, the stability in turbulence and conditions of wind, the self-shadowing depending on the orientation of the sun and the current altitude, the existence of particles in the surrounding area, and the variations in lighting because of the clouds [3,22]. Reliability is yet another concern for UAV applications [22]. Payload weight is another important matter which limits the selection of the cameras for UAVs. It is generally around 20–30% of the global weight of the vehicle [23], thus influencing the camera that can be installed.
Accordingly, different low-cost cameras have been analyzed for agricultural applications due to their low weight [24]. However, there are other identified problems with this kinds of cameras, such as the small optical quality, the zoom and the focus [23]. Issues arising from aviation regulations [22,25] can also be serious obstacles to the use of UAVs in agriculture. For example, as a part of the flying permission, in order to cover the risks of causing damages to buildings, livestock or even humans, an insurance is necessary. This kind of requisites are considered as the major impediments for their use in practice [26]. Besides, the UAVs must always be in the view of the operator, who also needs to have a pilot license. Thus, a flying team is necessary to operate the UAV, thus increasing the total cost.

1.2. Wireless Sensor Networks in Agriculture and Food Industry

The implementation of wireless sensor networks (WSNs) in precision agriculture enables increasing efficiency, profitability and productivity, and at the same time reducing possible impacts on the environment and wildlife. WSNs powered by batteries include different types of components: sensors, processors and radio frequency (RF) modules. The motes or sensor nodes have wireless connectivity to transmit the obtained data to a coordinator node or base station either directly or through a gateway. The real-time information obtained in the field provides a useful base for the managers to define the adequate strategies. This way, the decisions are not taken based on supposed typical conditions, which could not be realistic, but on real and updated data.
The use of WSN technologies depends on the propagation of radio signals in practical environments, being difficult because of shadowing of the signal, multipath propagation and attenuation. In agriculture, radio frequency (RF) must face problems due to the placement of nodes for a large coverage and adequate link quality over the crop canopies. WSN must operate in different conditions like vineyards and orchards, in flat land or abrupt areas, and in all weather conditions, all of which affect radio performance [27]. In these cases, the link power budget depends on the state of the crop and the land, as well as other frequent factors such as node spacing and the height of the antenna [28]. Normally, a received level of the signal between 10 dB and 20 dB over the sensitive limit of the receiver is a convenient rate for the link budget [28].
The proportion of messages lost or packet reception rate is also vital in WSN development and must be measured for any application. In accordance with the operating environment, an important signal loss may occur at some frequencies, especially when radio nodes need line-of-sight for optimum performance, being 2.4 GHz less robust than 900 MHz. Looking for better results, an alternative could be putting intermediates nodes, thus allowing peer-to-peer connection to the base node. Another option can be testing other frequencies, such as 916 MHz or 868 MHz, which are used in some nodes commercially available, or developing nodes with higher RF power which are able to reach longer distances. Additionally, connectivity ca be improved using directional antennas and optimizing the orientation of the antenna, its shape and configuration [29]. Other authors have focused in the development of autonomous image acquisition modules, such as the interesting work presented in [30], where a thermal-RGB color space capture module is described with WiFi and Ethernet connectivity.
The weather is especially important in agricultural applications, since it affects the signal loss due to atmospheric conditions [28]. Outdoor use should consider the consequences of moisture due to humidity and precipitation. Some authors have analyzed the propagation of radio signals in potato fields using 433 MHz nodes, finding that the propagation of better in wet weather [31]. Moreover, rain and high humidity produced bigger signal strength in the receiver. Nevertheless, experiments using 868 MHz and 916 MHz nodes indicated the reverse results; the gateway only received 60% of sent messages when the relative humidity along the day was high. This ratio can grow to more than 70% in the driest day [32].
Ambient temperature also affects the performance of the motes. Low temperature has an undesirable effect in the life of the node battery; tests in cooling chambers at diverse conditions proved that battery has a shorter life at low temperature. For instance, for 2.4 GHz ZigBee nodes, the battery life at 0 °C is reduced by half in relation to its life at 20 °C [33]. Finally, crop canopy has also been proved to influence the signal. It has been observed that signal strength and attenuation depend on the line-of-sight losses and heights less than the Fresnel zone radius [34].

1.3. ZigBee Wireless Protocol for Precision Agriculture

The communication among nodes in a WSN allows for the integration of varied sensors types from the simplest (e.g., pressure, humidity and temperature) into the most complex ones (e.g., GPS location, micro-radars, tracking and image capture), thus allowing them to screen a wide area to obtain detailed information of the crops [35]. For this purpose, ZigBee, Bluetooth and WiFi wireless protocols, GPRS/3G/4G technology and Long Range Radio (LoRa) protocol are some of the communication technologies suitable for precision agriculture. Different works have compared these standards according to different parameters such as the communication range, power consumption, bandwidth speed, cost, system complexity, and other aspects [36].
Among them, Zigbee has been adopted as the ideal wireless protocol for many agricultural applications due to its lower power consumption, the high number of nodes allowed (more than 65,000), its high reliability and low duty cycle [36,37,38]. The low duty cycle is important in domains as water quality management, watering supervision, and control of fertilizers and pesticides, requiring a frequent update of the information [39]. For this purpose, the ZigBee wireless protocol has been used for preserving energy by switching between the sleep and active states. Therefore, energy use is diminished and battery life of the motes is stretched. Some important aspects to investigate before applying ZigBee are the effects of signal strength on the spacing of the nodes, the height of the antenna in the base station and the leaf density. For example, in [40], different tests were performed in palm orchards to evaluate a model of the signal propagation using the received signal strength meter of the ZigBee protocol. They found that the wireless channel propagation model has to be adjusted before deploying the motes in the orchards to achieve the robust signal strength. ZigBee is also being used in smart beehives [41], orange orchards [42], automation in irrigation [43], and greenhouse monitoring systems [44], among many other applications.
This paper describes the design, development and implementation of a remote image capture system controlled by a central processing coordinator node. The system includes a web-based application for accessing the information obtained from the capture nodes and measurement stations installed in the farm. It can be integrated with watering equipment, such as furrow and surface irrigation, different types of crop and production scales. It is designed to offer agronomists and owners updated and detailed information of the state of the crop, the weather conditions and the watering system, so better decisions can be taken to solve possible problems. The proposed structure contains multiple image capture nodes to get many observation zones representative of the entire area of plantation. They have autonomous power supply and wireless connection with the central unit, which takes the irrigation and harvesting decisions using the results of processing the images and other local sensors. This research opens the possibility for the development of a completely autonomous irrigation decision system, which is still an open problem. On the other hand, one of the objectives of the proposed system is to provide a technological tool that enhances the generation of irrigation specialists, giving them as much information as possible about the processes in the farm or field. This way, agricultural engineering schools could have powerful but inexpensive tools for the education of their students.

2. Materials and Methods

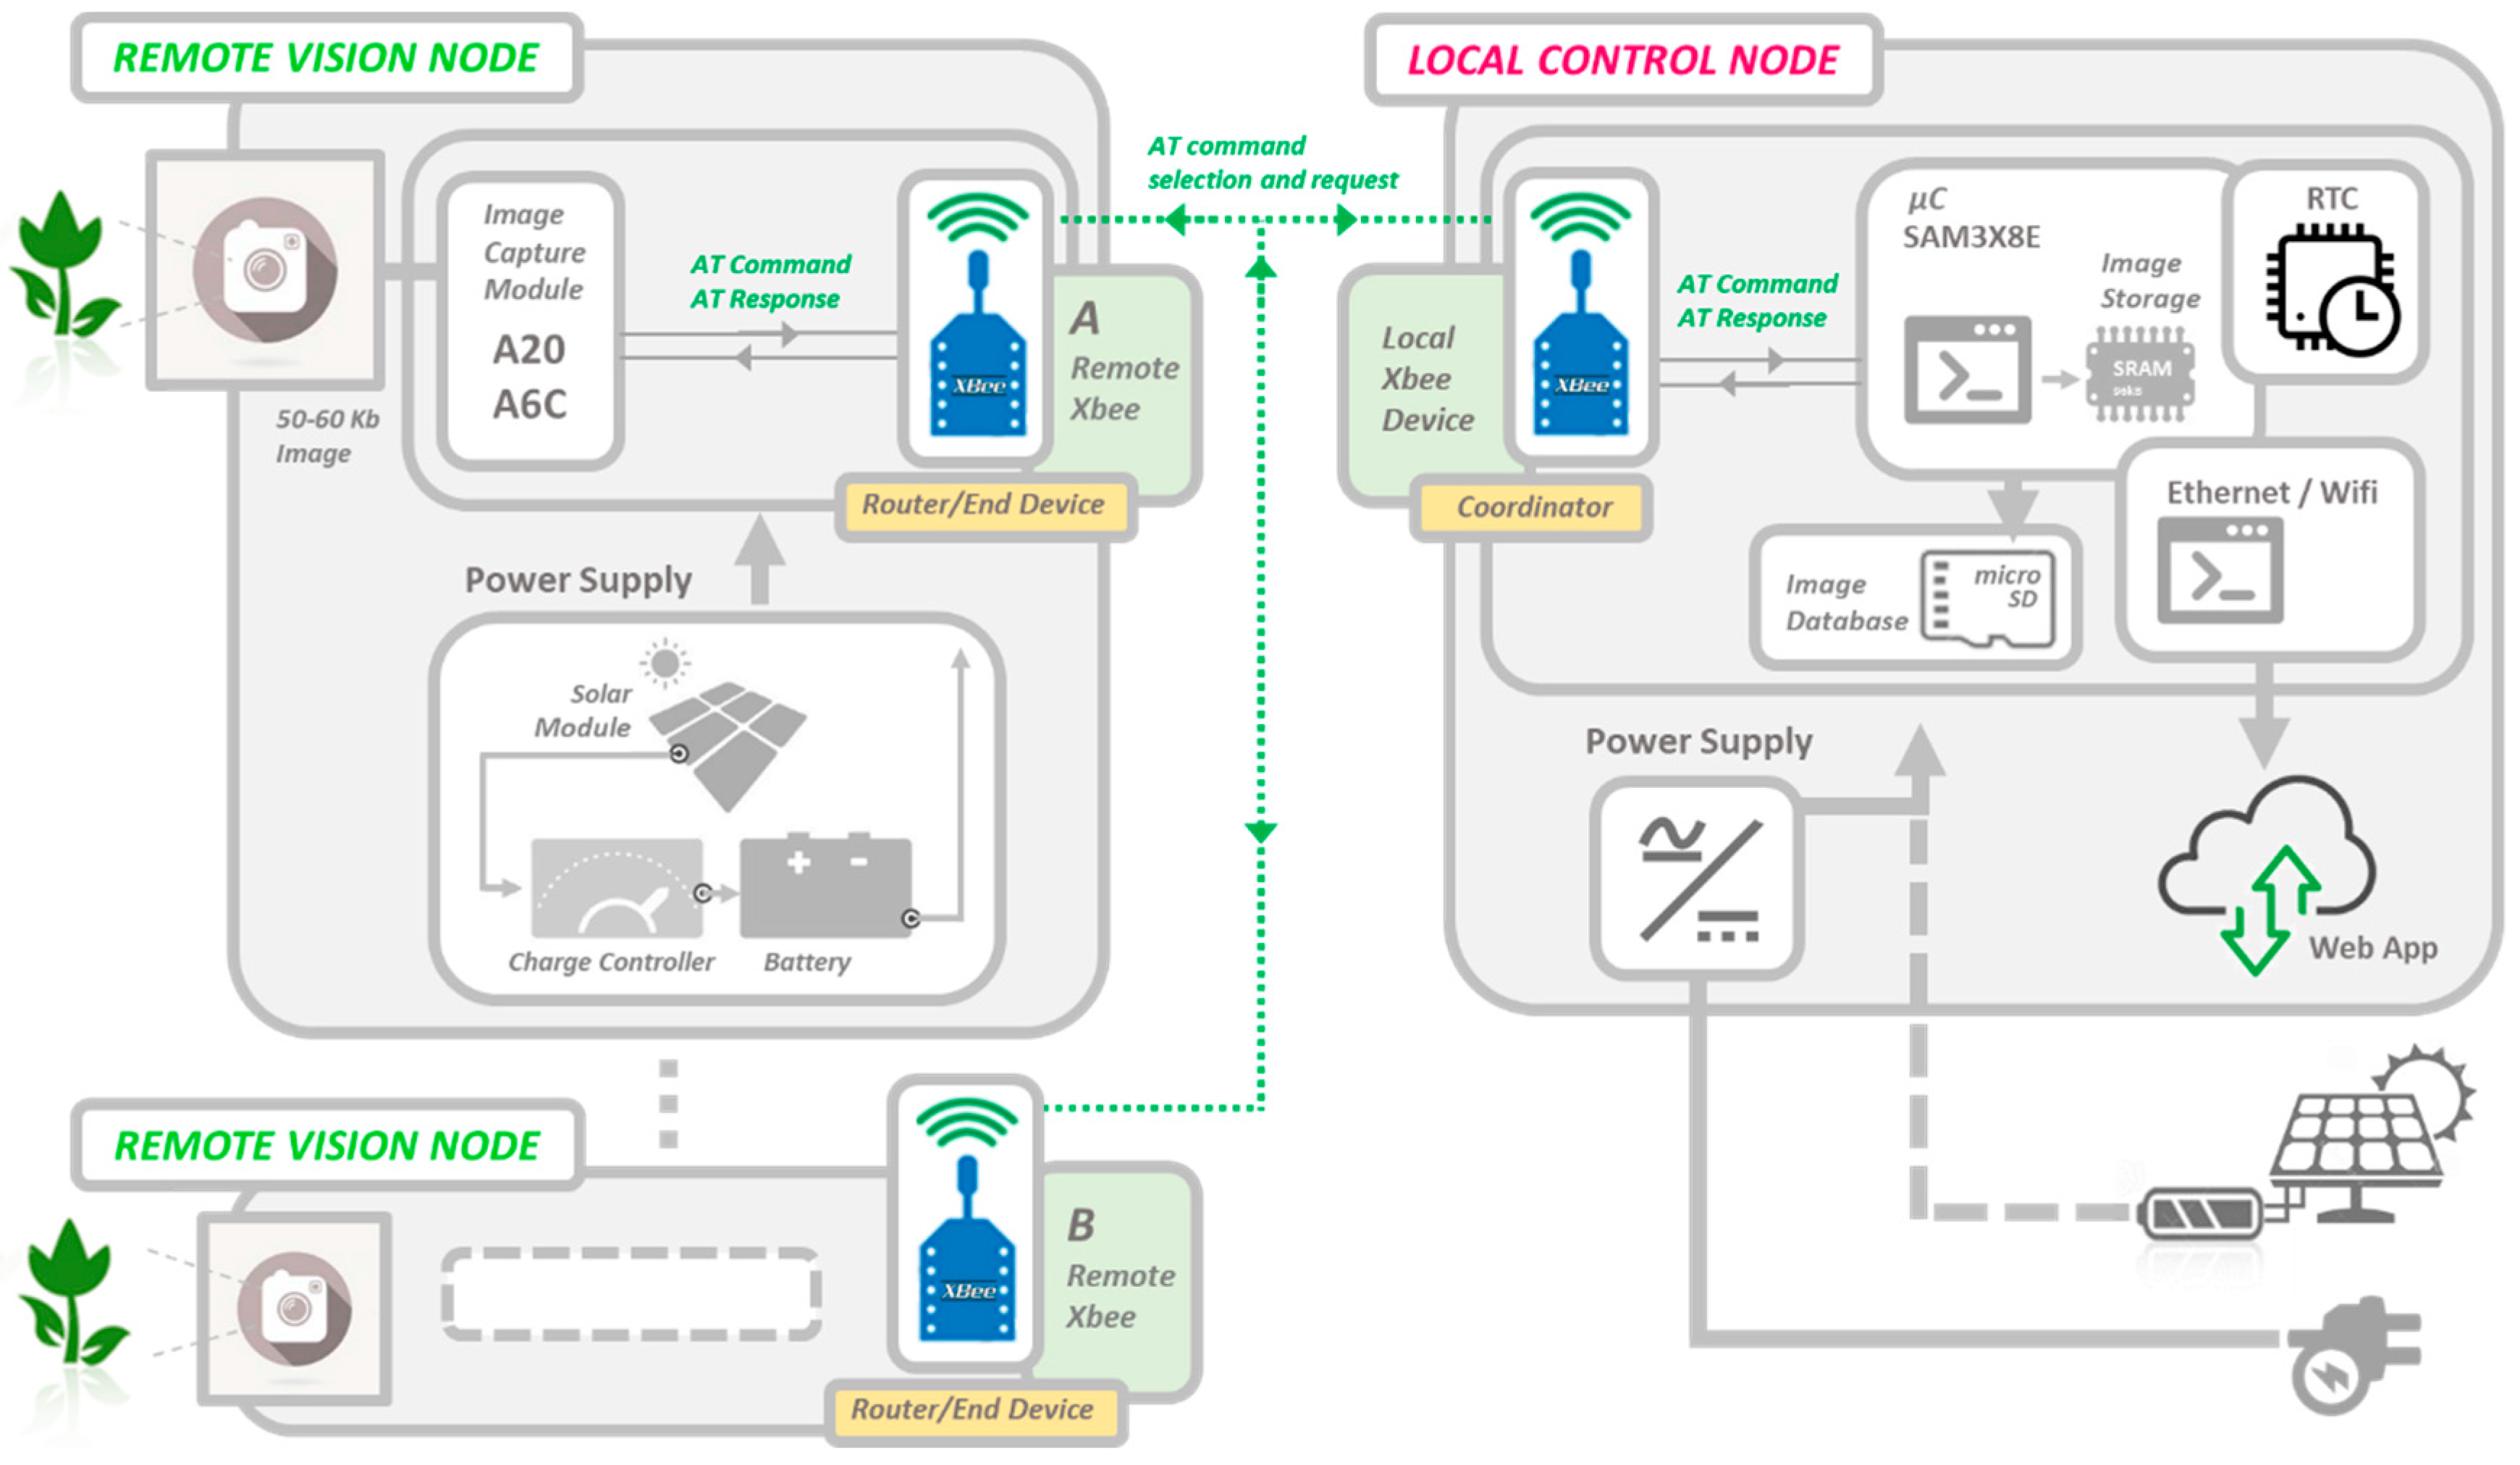
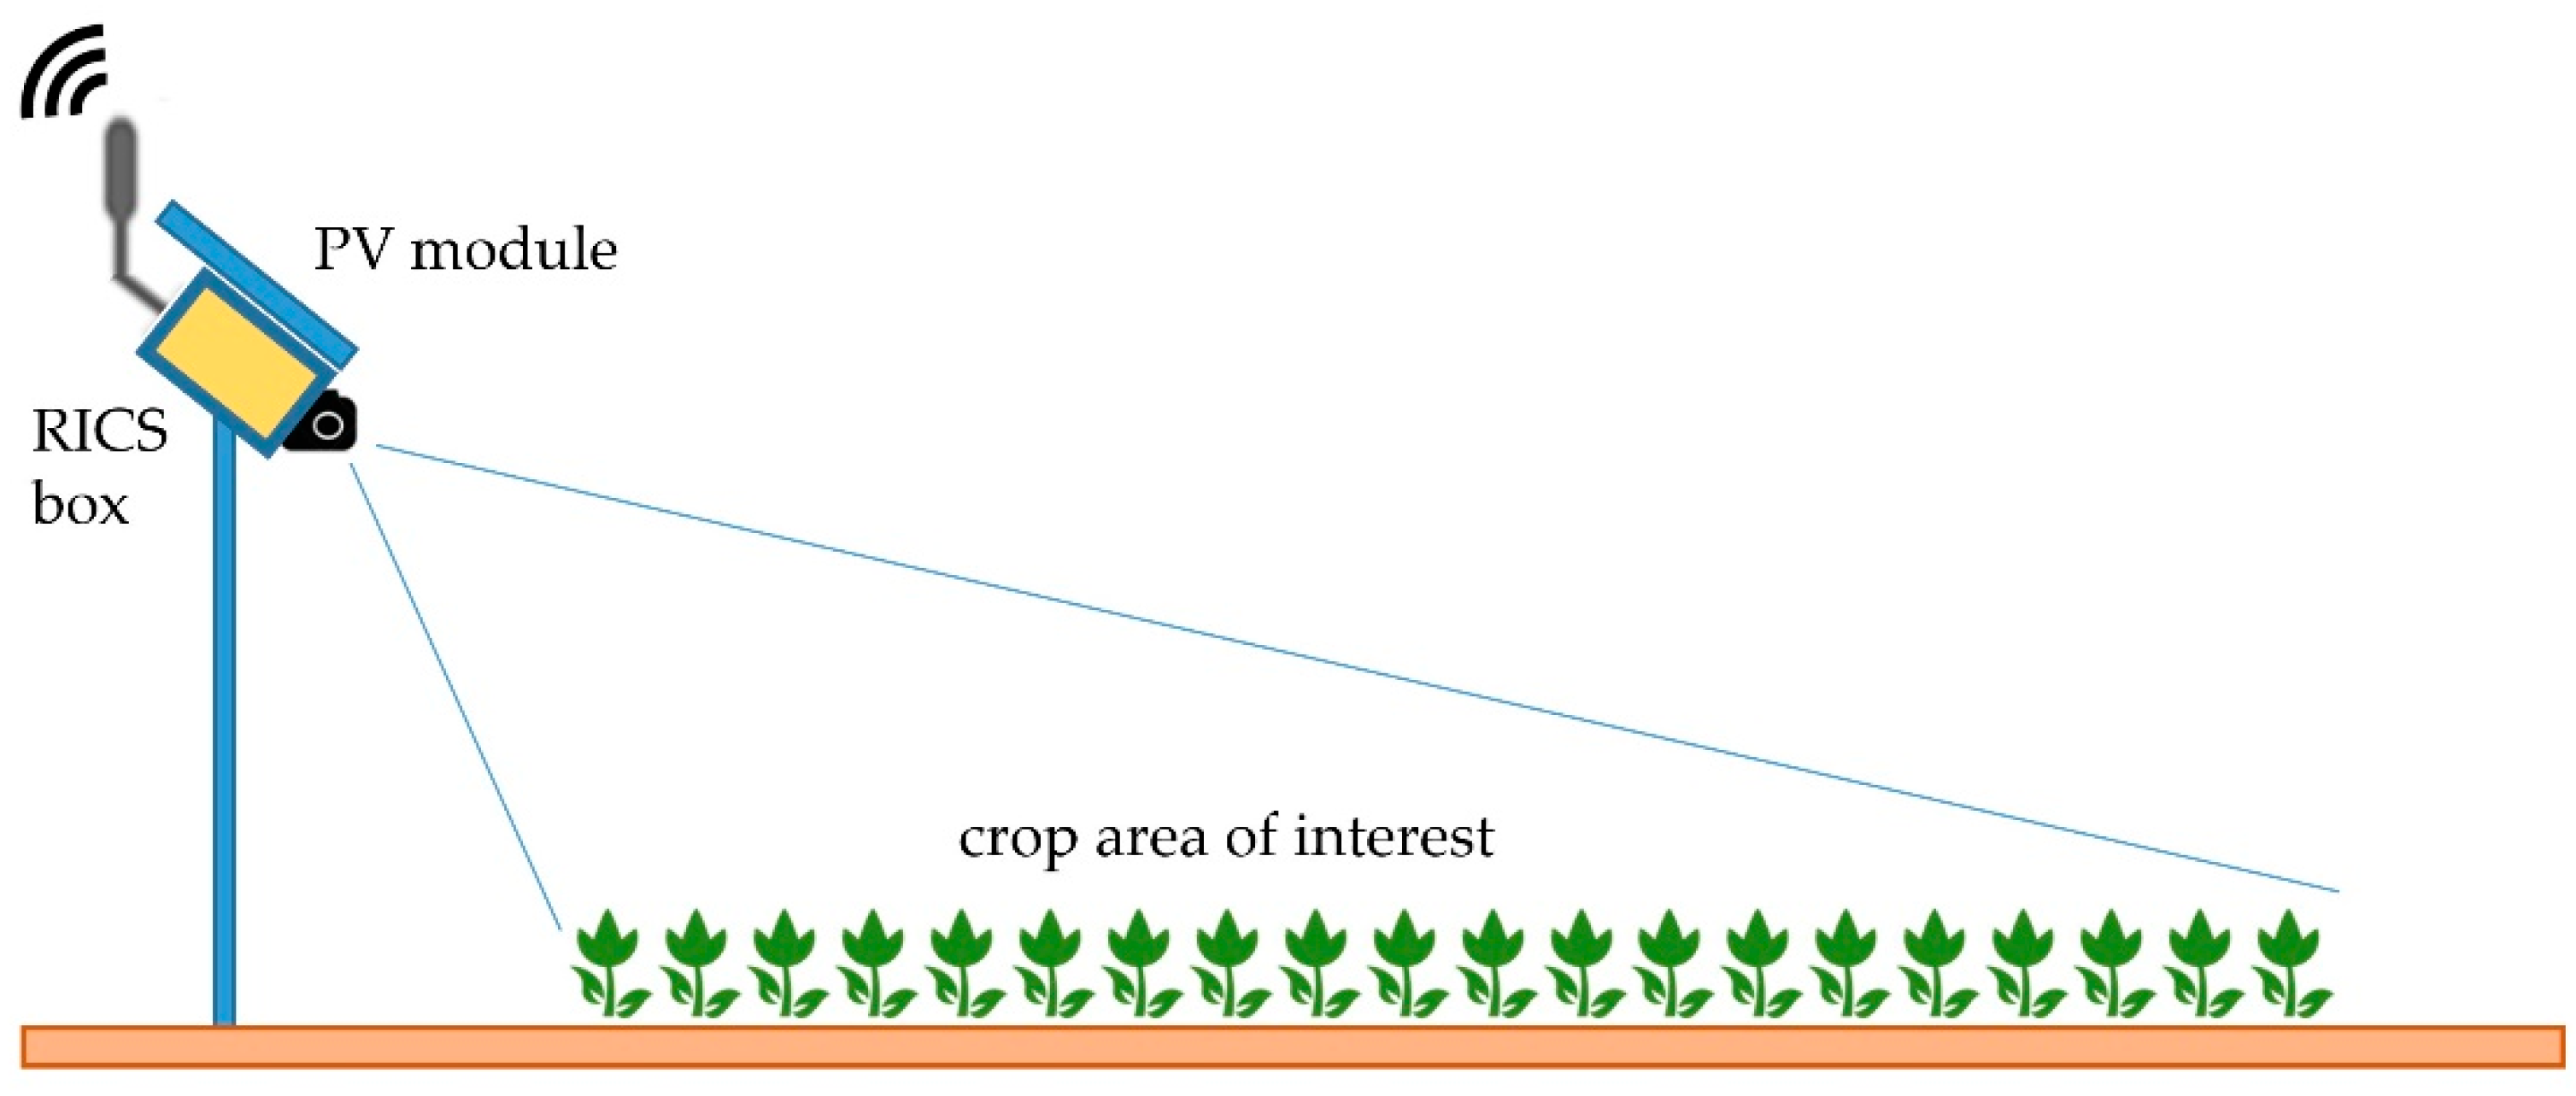
2.1. Description of the Remote Image Capture System (RICS)

The main objective of the development of the RICS is to create a device that captures images of the region of interest (ROI) of lettuce crops. This RICS is implemented as a remote node that is wirelessly linked with a local coordinator node that processes the captured images. An embedded processor architecture implemented in the local coordinator node, and a cloud server running a web application take control of the whole system [45]. Besides, the system obtains additional information from different sensors installed in wireless nodes, actuators and connection devices. All of them operate together to gather, process and display to the local and remote users all the information related to the performance of the precision agriculture tasks.
Thanks to the visual monitoring of the crops, periodically capturing images of the ROIs and analyzing them to determine the growth of the plants, it is possible to obtain an estimate of the percentage of vegetation cover, which can be defined as the fraction of land covered by the crop canopy of the plants [46].
Figure 1 presents a global view of main elements of the proposed system. The remote vision nodes or RICS act as autonomous devices capturing images with their own control logic and power supply. They are connected to the local control node via XBee. This control node performs image storage, processing and transfer to a web server in the cloud. The web server has the Internet access, allowing the clients or remote users to monitor and manage the system.
The RICS nodes are installed in different measurement stations, located in specific zones of the crop. An outline of the installation of the node in the crop is shown in Figure 2. The RICS box that contains all the electronics is located on a mast fixed to the ground at a height of 1.5 m and with an inclination of 30° with respect to the horizontal plane. This configuration defines a visual field of the camera, as can be observed in Figure 3. The fixing hardware of the RICS box allows modifying the inclination to change the visual field and therefore the observation area of the crop. The selection of the different sample plots in the crop and the viewing angle determine the portion of the plot that is monitored. They have to be fixed by the human expert considering the specific characteristics of the crop.
The remote RICS node stations consist of an A20 or A6C (Ai-Thinker Co. Ltd., Shenzhen, Guangdong, China) camera module (both can be used in the system, since they are compatible) with GPRS and WiFi communication capabilities, a ZigBee radio device for wireless data communication, a power unit (composed of a solar panel, a charger and a battery), as shown in Figure 4. Since the RICS node is the main element of the proposed system, the next sections describe in detail the design and implementation of these nodes.

2.1.1. Communication Module of the RICS Node

The communication module is based on a low-power XBee 868LP ZigBee module (Digi International Inc., Minnetonka, MN, USA). It is configured as a transmission gateway of the images captured by the image module of the A20/A6C subsystem. This device also enables the measuring nodes to be part of the wireless network, by sharing the same connection. To cover extensive distances from the local to the remote nodes, and to reduce the effect of signal attenuation caused by the vegetation, which is higher in fruit crops [47], wireless networks that operate in lower frequency bands should be used [4]. The nodes contain 2 dBi omnidirectional antennas to reach distances in outdoor/line-of-sight range up to 800 m, and with 12 dBi five-element Yagi antennas to allow for distances up to 1500 m. These maximum distances were tested in the experimentation described in Section 3.
It should be noted that the configuration of the XBee node in ZigBee AT mode makes it possible to dispense with the implementation of a microcontroller in the structure of the remote node, since the requests of the coordinator node are transferred transparently by the XBee module and processed by the images capture module A20/A6C. As a disadvantage, the coordinating system must make a modification in the configuration of the local XBee communication module by adjusting the appropriate link address (i.e., the DL register: destination address) to the remote node with which it is desired to establish a communication link. This task does not involve significant delays or drawbacks since the configuration time is only a few seconds.

2.1.2. Image Capture Module of the RICS Node

There are many commercially available camera modules that are highly compatible with systems based on the Arduino platform (Arduino, Ivrea, Italy). These capture modules have different specifications in terms of image resolution, connection type, output format, connectivity, etc. To maintain compatibility with the ZigBee communication system, an important feature is to use a camera where the transmission of image information is in UART (Universal Asynchronous Receiver-Transmitter) serial format, and controllable with AT-type commands, a system that shares the Digi XBee communication platform used in this development.
Related to the size of the camera module, there are solutions for the Arduino and tiny devices such as ArduCam (ArduCam, China), although it cannot be connected directly to the Arduino and need several connections. On the other hand, the A20/A6C module has the same camera (OV7670) but it is smaller and needs just two connections for the Arduino, RX/TX. Besides, this camera module can be configured with different resolutions (VGA, Quarter-VGA and Quarter-QVGA) and allows configuring different parameters such as flash mode, night vision, image quality, image rotation, exposure, brightness, white balance and contrast. The cost of the module is also an important aspect to consider, since other solutions that have been considered offer a smaller size, better resolution and better GPRS, but are much more expensive.
The transmission system and the coding of control instructions in the A20/A6C system make it possible to avoid using a software to save images from the camera. This would require a coordinating module to implement the reception and compression of the images, which would be a hard bottleneck in the development of the system. Another interesting feature of this A20/A6C module is that it has WiFi and GPRS communication, which uses the same communication/control AT protocol to allow connecting the system to a WiFi or GPRS data network for sending information.

2.1.3. Solar Power Supply of the RICS Node

An important constraint of capture nodes is their reduced power capacity. Different energy-efficient methods have been proposed in existing works to deal with the power battery problem of the motes. For example, energy harvesting techniques has been introduced as a way to recover energy. Some of these methods include solar panels, mechanical vibration, wireless power transfer (WPT), kinetic and wind energy [48]. These mechanisms allow obtaining rechargeable nodes that are able to operate uninterruptedly for longer periods. Solar energy using photovoltaic systems have been used in agricultural applications of the WSNs [49]. Solar panels offer an excellent solution to guarantee the operation of the agricultural monitoring system [50]. Solar cells have been previously used in some studies to provide long-term power to sensor motes in agronomy. For example, an irrigation system is developed in [51] based on the ZigBee wireless protocol and powered by rechargeable batteries and solar panels.
The direct current (DC) power system of the RICS node consists of a pair of 1.5 W photovoltaic solar panels (in total 3 W), connected to a Sunny Buddy module (SparkFun Electronics, Boulder, CO, USA), with a maximum power point tracking (MPPT) system which provides an efficient management of the energy coming from the solar panels, as well as an adequate management of the battery charge based on the LT3652 chip (Analog Devices Inc., Norwood, MA, USA). The photovoltaic panels use polycrystalline silicon with a size of 15 cm × 15 cm, and have a maximum power point voltage of 6 V and a maximum power point current of 0.25 A. The battery used in the remote node has been dimensioned to achieve the appropriate days of autonomy considering the meteorology and the average rate of cloudy days at the installation place. According to the measurements and calculations of energy needs, approximately 2000 mAh are required for 7 days of autonomy, i.e., 7 days with null radiation. The selected battery will be of Li-ION technology since it provides the best energy performance. The work load is considered with power on and in automatic standby mode during 24 h at a capture rate of 1 image per hour. In the case of intensive use of image capture on demand, the consumption of energy can be increased in a timely manner. However, in the typical use, a rate of 1 image per day should be enough to monitor crop canopy due to its slow growth rate.
If this happens, the local control node will take into account this increase of energy consumption. Thus, it will reduce image captures at the following time intervals to allow for recovery of the energy stored in the battery in case of solar radiation deficit. The typical consumption pattern of the remote node in image capture mode at intervals of one hour is depicted in Figure 5.
The wireless communication modules (XBee 868LP) and the image capture processor in low-power/sleep mode will be configured to achieve the maximum efficiency in the management of the energy of the remote nodes. The functional tests performed showed consumption data in the different operations with the values presented in Table 1.
In relation to the amount of energy available in the batteries of a remote system to capture images, and from the point of view of the use of drones, essential maintenance tasks and recharges are needed to maintain their operability. In addition to the necessary infrastructure to perform this process, it cannot be done automatically without human operators. A problem in this energy supply can cause an accident and endanger the material and human elements nearby, as well as the structure of the drone itself. However, the proposed solution can operate continuously for very long periods of time.

2.2. Description of the Base Station Coordinator Node

The base station coordinator node, or local control node, consists of different components: an Arduino DUE platform (Arduino, Ivrea, Italy) based on the microcontroller Atmel SAM3X8E (Microchip Technology Inc., Chandler, AZ, USA), an Ethernet/WiFi module for the connectivity with the SCADA (Supervisory Control And Data Acquisition) web-based application, a ZigBee radio device XBee 868LP for low-power-consumption wireless data communication, and a real-time clock module RTC DS3231 (Maxim Integrated, San José, CA, USA) to implement timestamps to image data files, and a microSD card memory module to store the received images in a database. The capacity of the card is 4 Gb (although other cards can be used), allowing storing around 52,000 images at an average size of 80 Kb. The assembly of all these elements can be seen in Figure 6.
The coordinator node can be connected via USB to a PC with a serial terminal application where control commands, responses and data received can be monitored to check the system procedure and analyze failures. Depending on the operating mode, the microprocessor captures an image either periodically or on demand, analyzes the integrity, processes the information, controls the communication modules, and receives commands and sends information to the server.
The system is configured so that all the remote nodes perform a measurement every hour. These measurements are synchronized and locally stored. The frequency of this process can be configured by the user. These tasks do not demand high computational requirements, but it is essential to use a robust PC and an uninterruptible power supply to ensure nonstop operation.

2.2.1. Real-Time Clock (RTC) Module of the Base Station

In the development of systems for precision agriculture, it is fundamental to consider the temporal reference in which the information of the sensors is obtained, to establish the fertigation strategies in an appropriate way. Without such information, precision irrigation would be impossible. For this purpose, the coordinator module incorporates an RTC module DS3231, which is connected to the Arduino DUE platform that manages the set through communication signals using the I2C bus. To safeguard the operation of the RTC, it has a backup battery apart from the general power supply of the control module.
The information received from the RTC module is used to create a timestamp system. This timestamp is incorporated in two ways: in the properties of the image file, and in the name assigned to the file. Some problems have to be solved regarding the number of characters in the name of the file, since it is limited to 8 characters due to the file structure of the hardware of the RTC module.

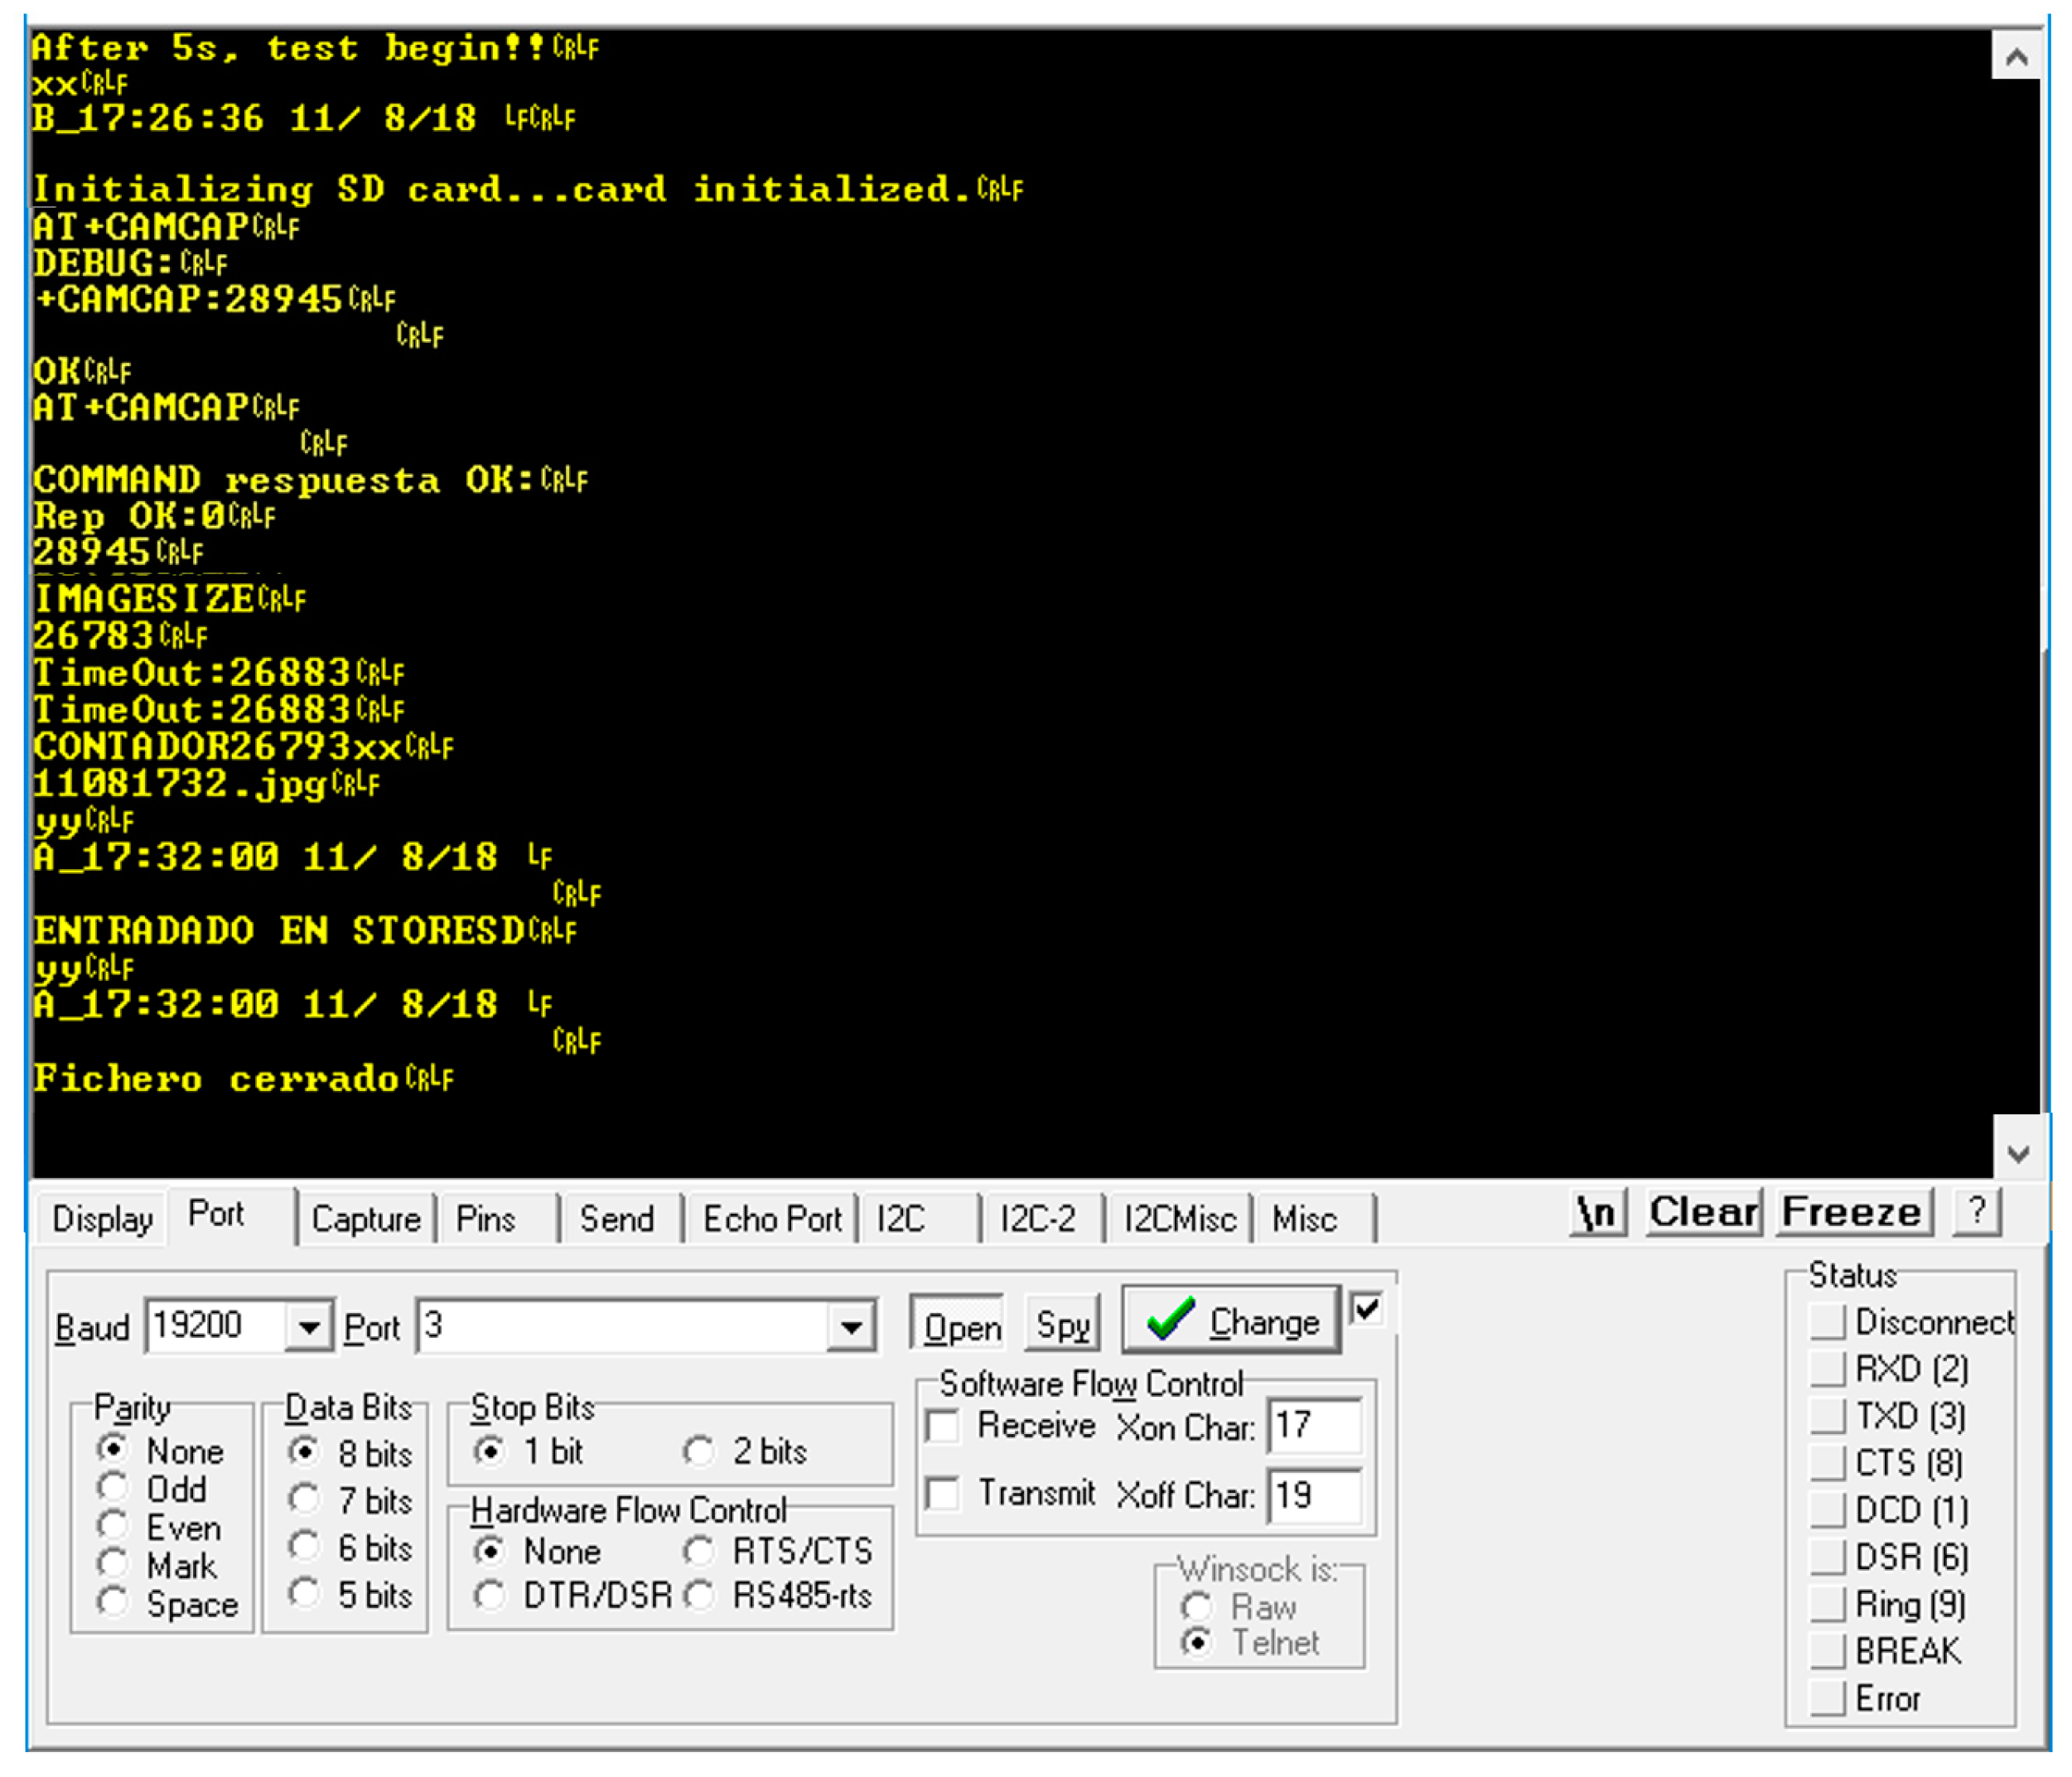
2.2.2. Control and Verification Console

The coordinator node can be connected to a PC via USB or through a serial communication. This way, a human operator can verify the correct working of the system and intervene in the system if necessary. As presented in Figure 7, the PC runs a console application showing the messages that the coordinator module generates for each task. The messages sent to the remote nodes can correspond to the tasks, either generated from the web application or automatically generated for the periodical tasks implemented in the processor of the Arduino DUE system.
The console shown in Figure 7 is a RealTerm serial terminal. This is a terminal program for engineers specially designed for capturing, controlling and debugging binary and other complex data streams. It is a free software development available in the SourceForge (SourceForge Media, La Jolla, CA, USA) open source community. In our case, it is used as a debugging tool to monitor the communication between the RICSs and the local control node.

2.2.3. Communication Module XBee 868LP of the Base Station

The module XBee 868LP that is an important part of the base station node. It is configured in coordination mode through the appropriate programming by sequence of AT commands generated from the microprocessor, and is responsible for implementing the wireless transmission of image data. More specifically, the sequence of steps executed in the request and reception of the images is depicted in Figure 8.
The configuration in AT transparent mode allows obtaining the data stream of the captured image in JPEG format, avoiding the need for a later compression. In this way, the image file is available in a readable format immediately after capture and transmission. Additionally, the XBee configuration in AT mode improves the transmission speed due to the direct transfer of the image data stream.

2.2.4. Embedded Microcontroller SAM3X8E

The embedded microcontroller SAM3X8E is integrated into the Arduino DUE platform so that connectivity to use the I2C and SPI (Serial Peripheral Interface) communication resources is provided for the connection of the RTC and microSD modules, in addition to having several UART ports for serial communication, as in the case of the connectivity of the XBee 868LP device. The tasks performed by the microcontroller in the coordinator node are:
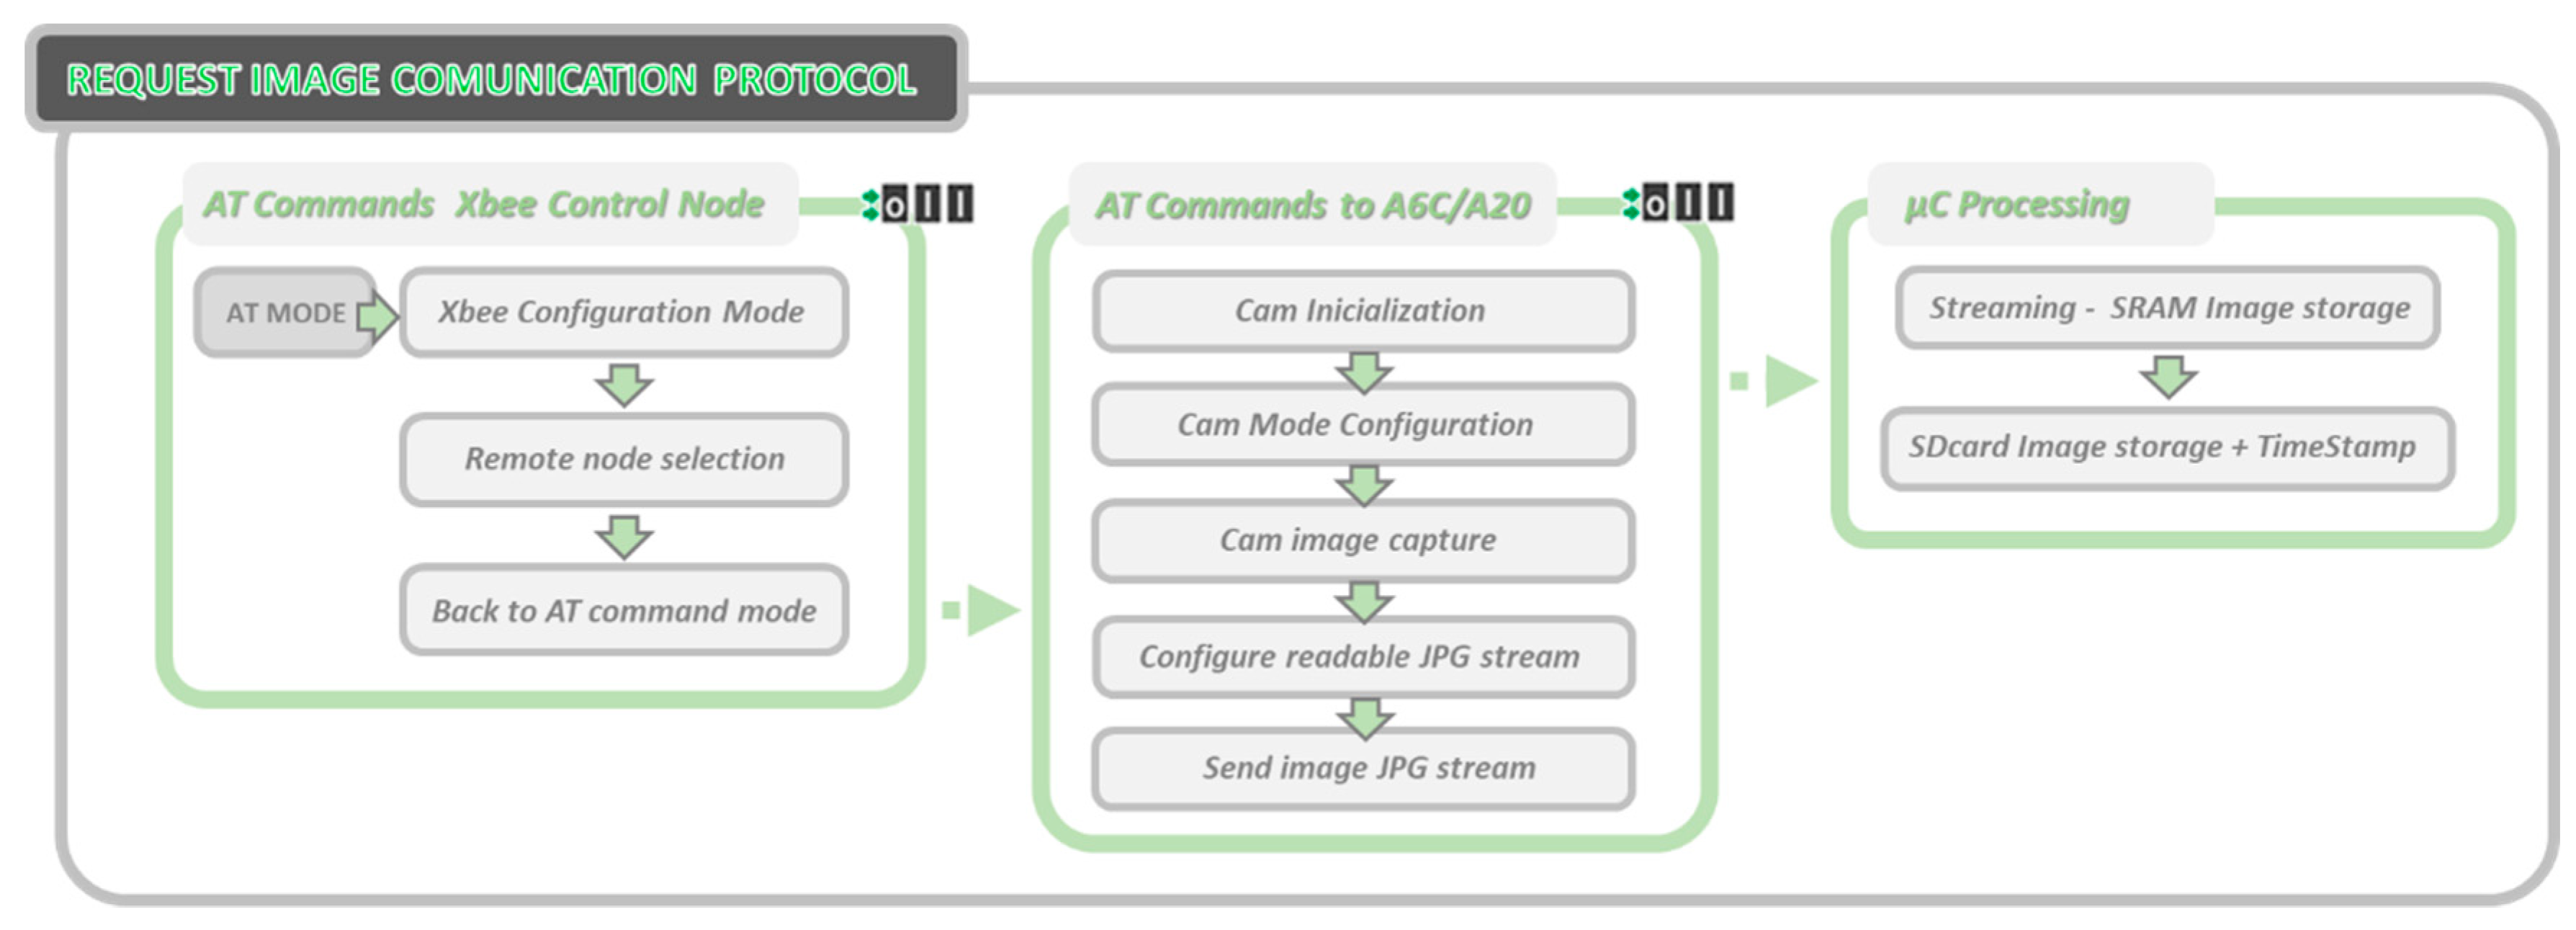
  • Selecting the RICS node that has to take an image using live, timed or on-demand mode. This selection is done by the configuration of the XBee module of the local coordinator node with the adequate address of the remote XBee module.
  • Sending the adequate set of AT instructions to the A20/A6C module to get a fully readable image format without need of data edition. With this feature, an improvement in the data transmission speed is achieved.
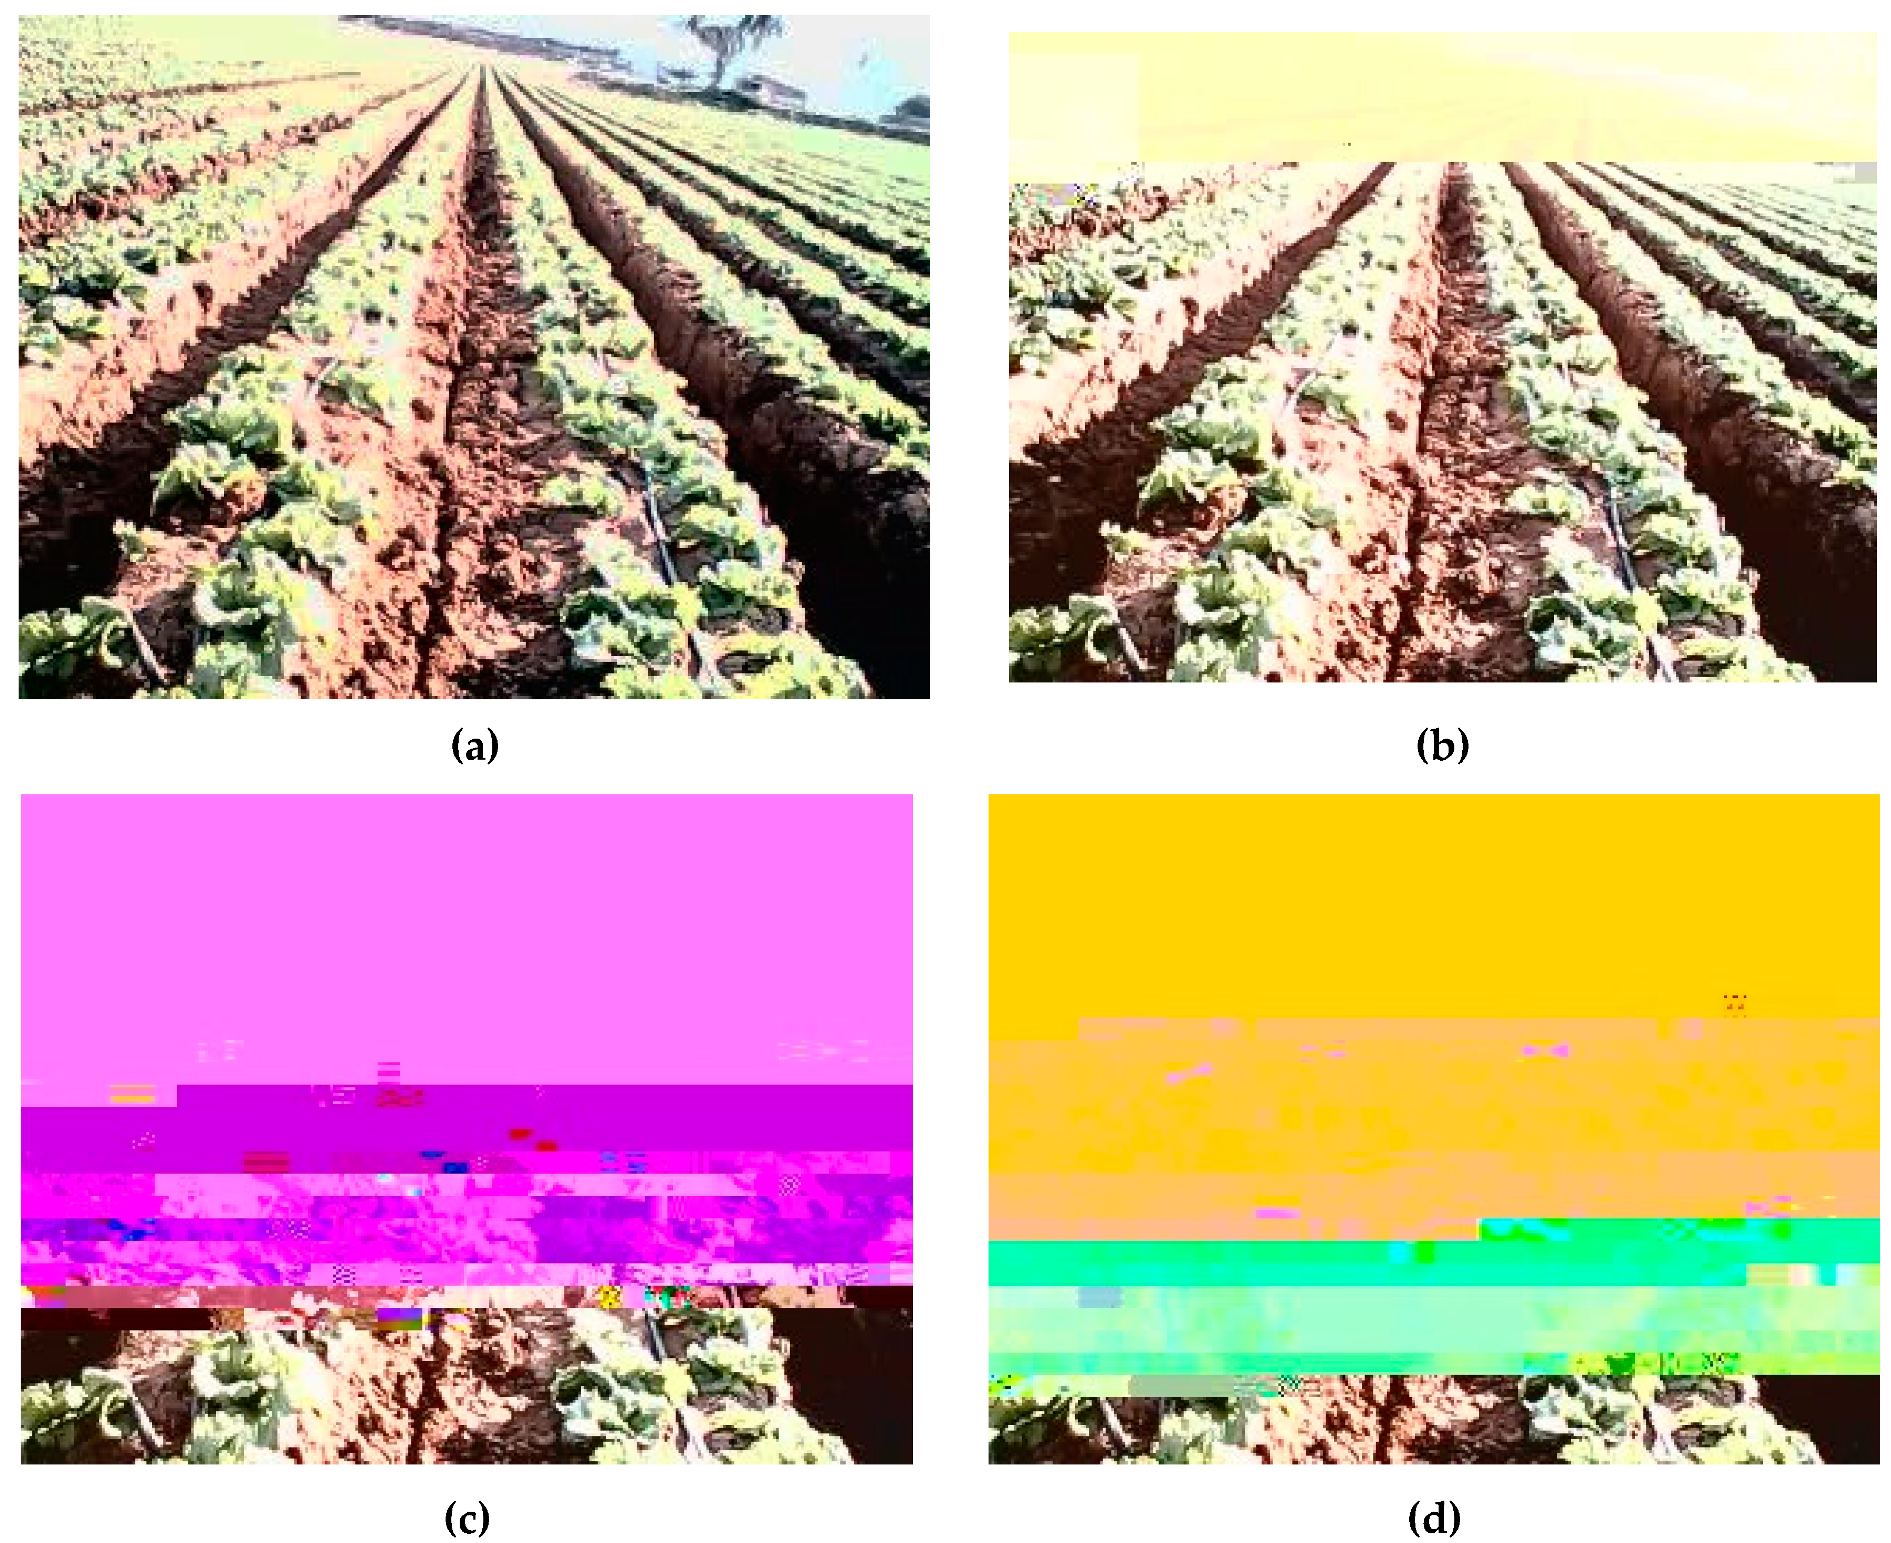
  • Checking the integrity of the received image and, in case of errors in the image data, launching a new capture to obtain an image without data losses.
  • Storing the image in a database, formatted with timestamp data to get a set of temporal readable images. In this way, the web control and monitoring system can make requests for any image in the database. The database is stored in a first-level SRAM (Static RAM) memory for quick access and in removable media storage (microSD).
  • Setting the image capture to the time interval mode, configurable by the control node, to get the information required for irrigation, fertilization or harvesting decisions.
  • Processing and transmission of the image received by HTML-POST on the remote server that links to the web application that contains the SCADA system [45].
The selection of the RICS node by the local coordinator node is done by modifying a record in its XBee hardware module. The development of the image transmission system makes use of the AT communication mode of the XBee hardware instead of the API mode. The purpose is to increase the transmission speed and to simplify the transmission process of the image. In this way, in the reception of the data stream, the complete image is obtained with an adequate header and end-of-file format that would allow reading it without the need of editing in hexadecimal format to restore its correct format (as usually happens in these transmission systems). The final purpose is to directly transmit the image point-to-point between the coordinator and remote nodes, without the need of splitting the images into small packages. In addition, through the appropriate order, the microcontroller can also transfer on demand the image received via USB to a PC, in case the coordinator system is connected to it. In case the API mode is used, the images should be split into blocks of 255 bytes; an image between 35–50 Kbytes would be split into 140–200 packages, thus requiring 120–150 s.

3. Results and Discussion

The system described in Section 2 has been implemented in a prototype model which includes several remote nodes, the local coordinator node and the web application in the cloud. Figure 9 shows a global view of an RICS node in the field and a captured sample image. In this case, the application corresponds to a lettuce crop of variety Little Gem in the field of Cartagena, Spain.
The selection of the Arduino DUE platform presents several advantages, in addition to its processing capabilities and connection buses available. An important aspect is the internal memory size of the microcontroller, which allows storing up to two images of VGA size (640 × 480) in JPEG format.

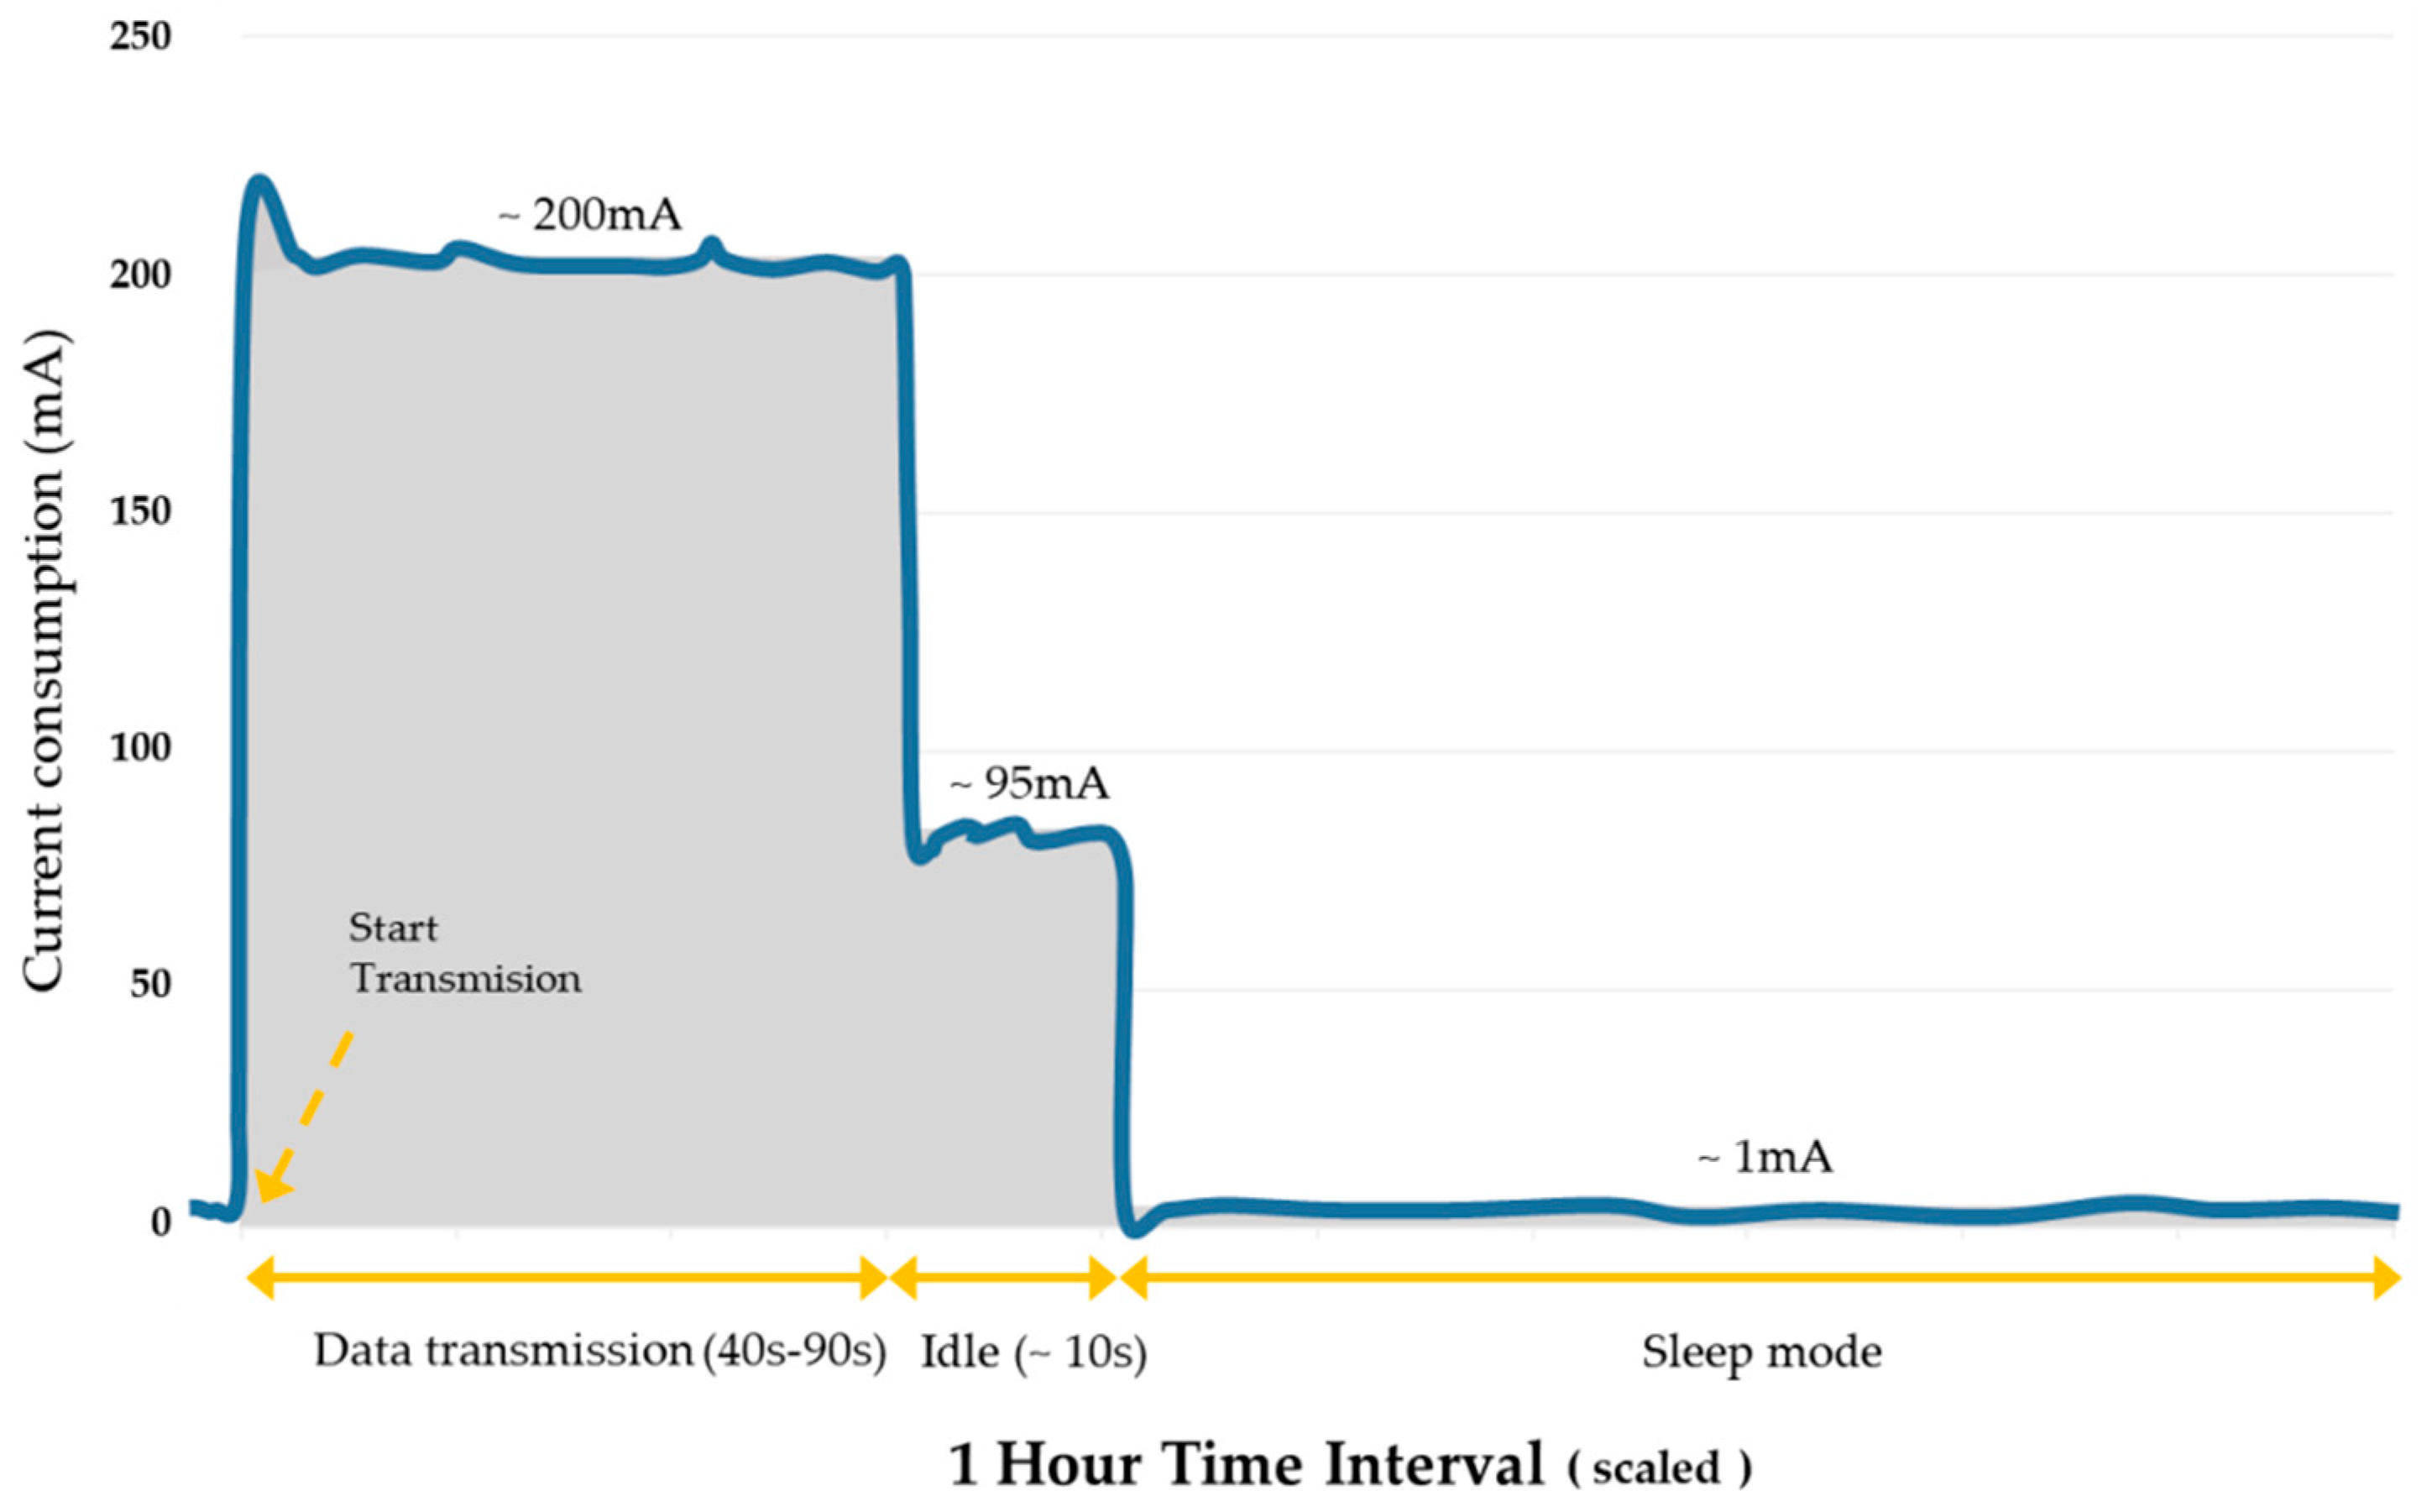
3.1. Experiments on the Data Transmission Speed

In order to achieve a reliable wireless link with the minimum data loss, the remote and local nodes have been tested by transferring images at different speeds. Therefore, XBee and A20/A6C modules were configured with the available transfer rates (in bit per second, bps), and tested with the goal of obtaining the fastest communication speed without data loss. As an example, Figure 10 shows some of the in-lab images received in these tests. In this case, the files transmitted are VGA images of 640 × 480 pixels.
In general, it was observed that higher speed rates produce more errors in the transmission, being unacceptable for values above 38,400 bps. A bandwidth of 28,800 bps was acceptable in some cases, but produced errors in other tests, as in Figure 10c. The maximum speed allowed for a robust transmission was 19,200 bps. In consequence, as the result of this experiment, the remote and local nodes are set to 19,200 bps to ensure a high reliability in error-free data transmission at the target distances between local and remote nodes. For this speed, the estimated time to transmit an image between 35 and 50 Kbytes (which is the typical size at VGA resolution) is 15–22 s; hence, the system can capture a maximum of 163 images per hour.

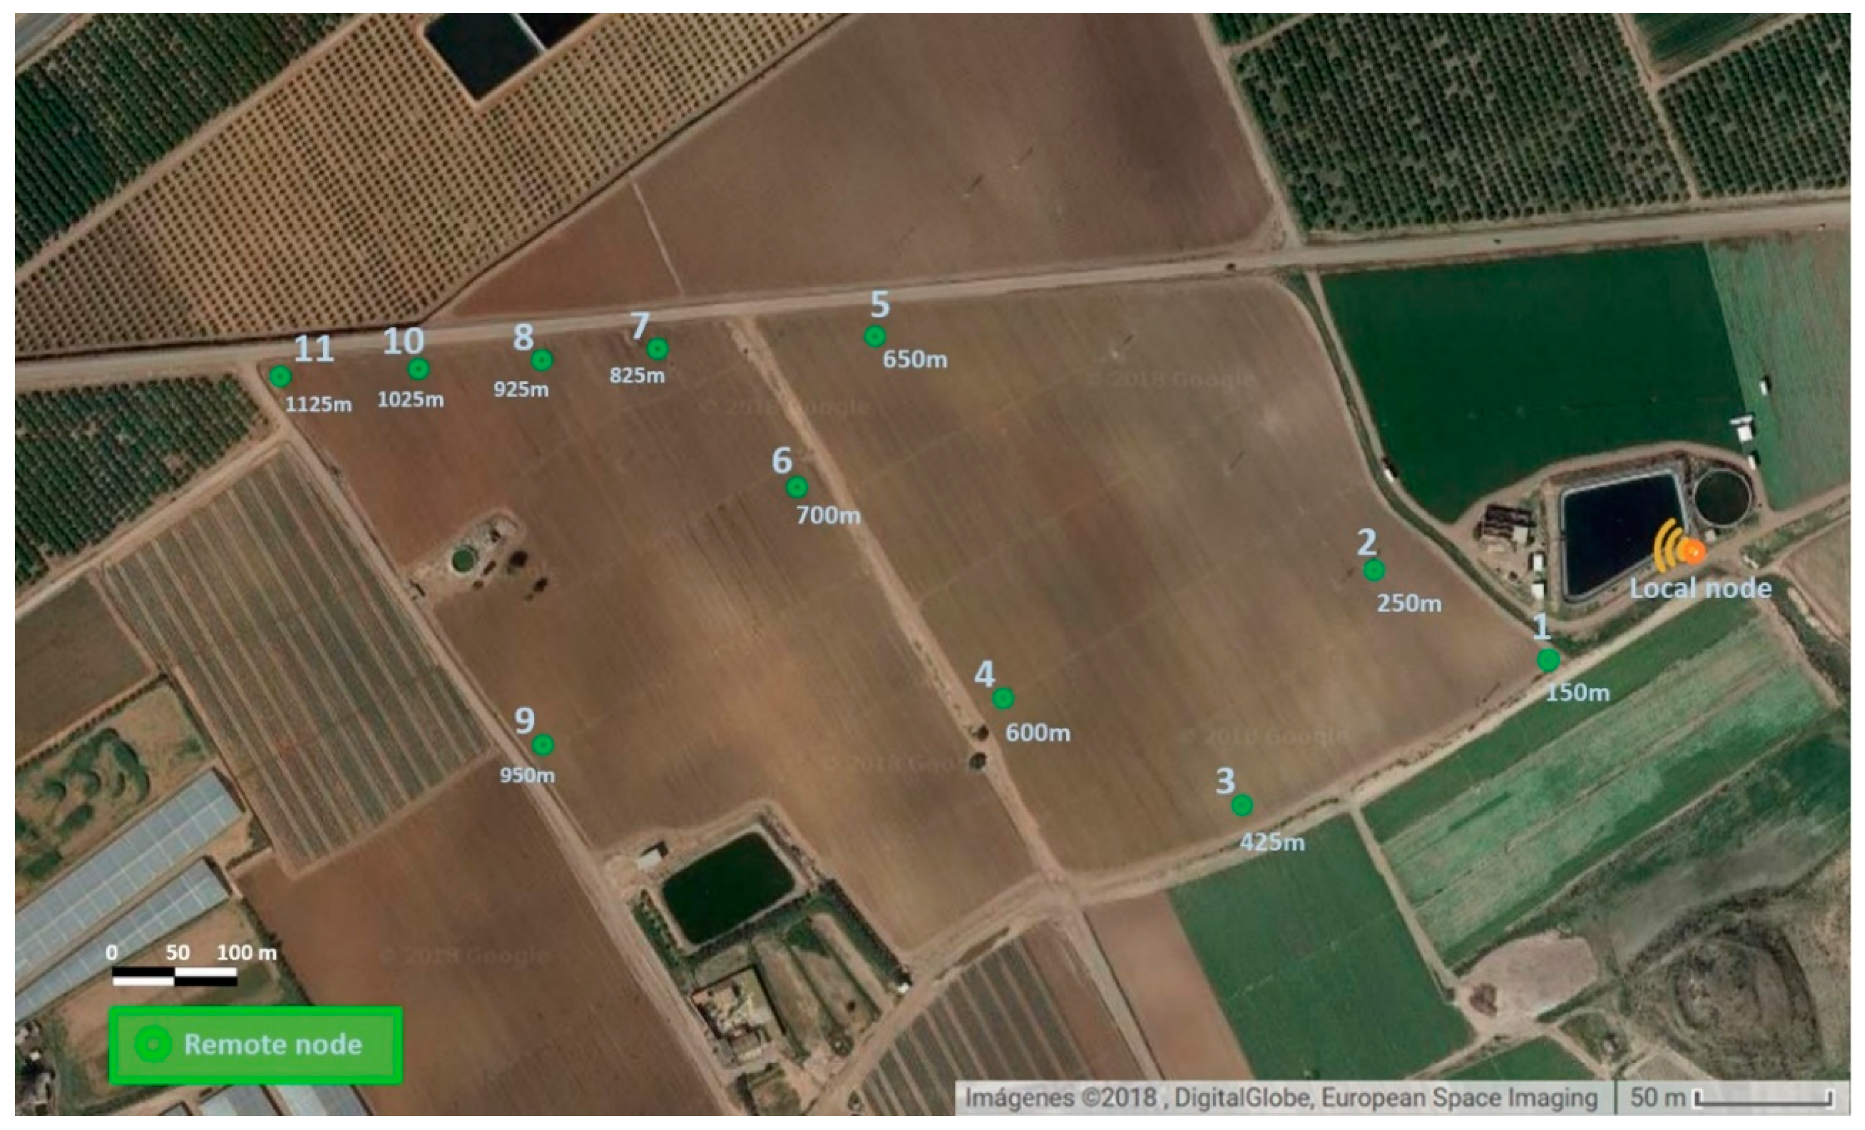
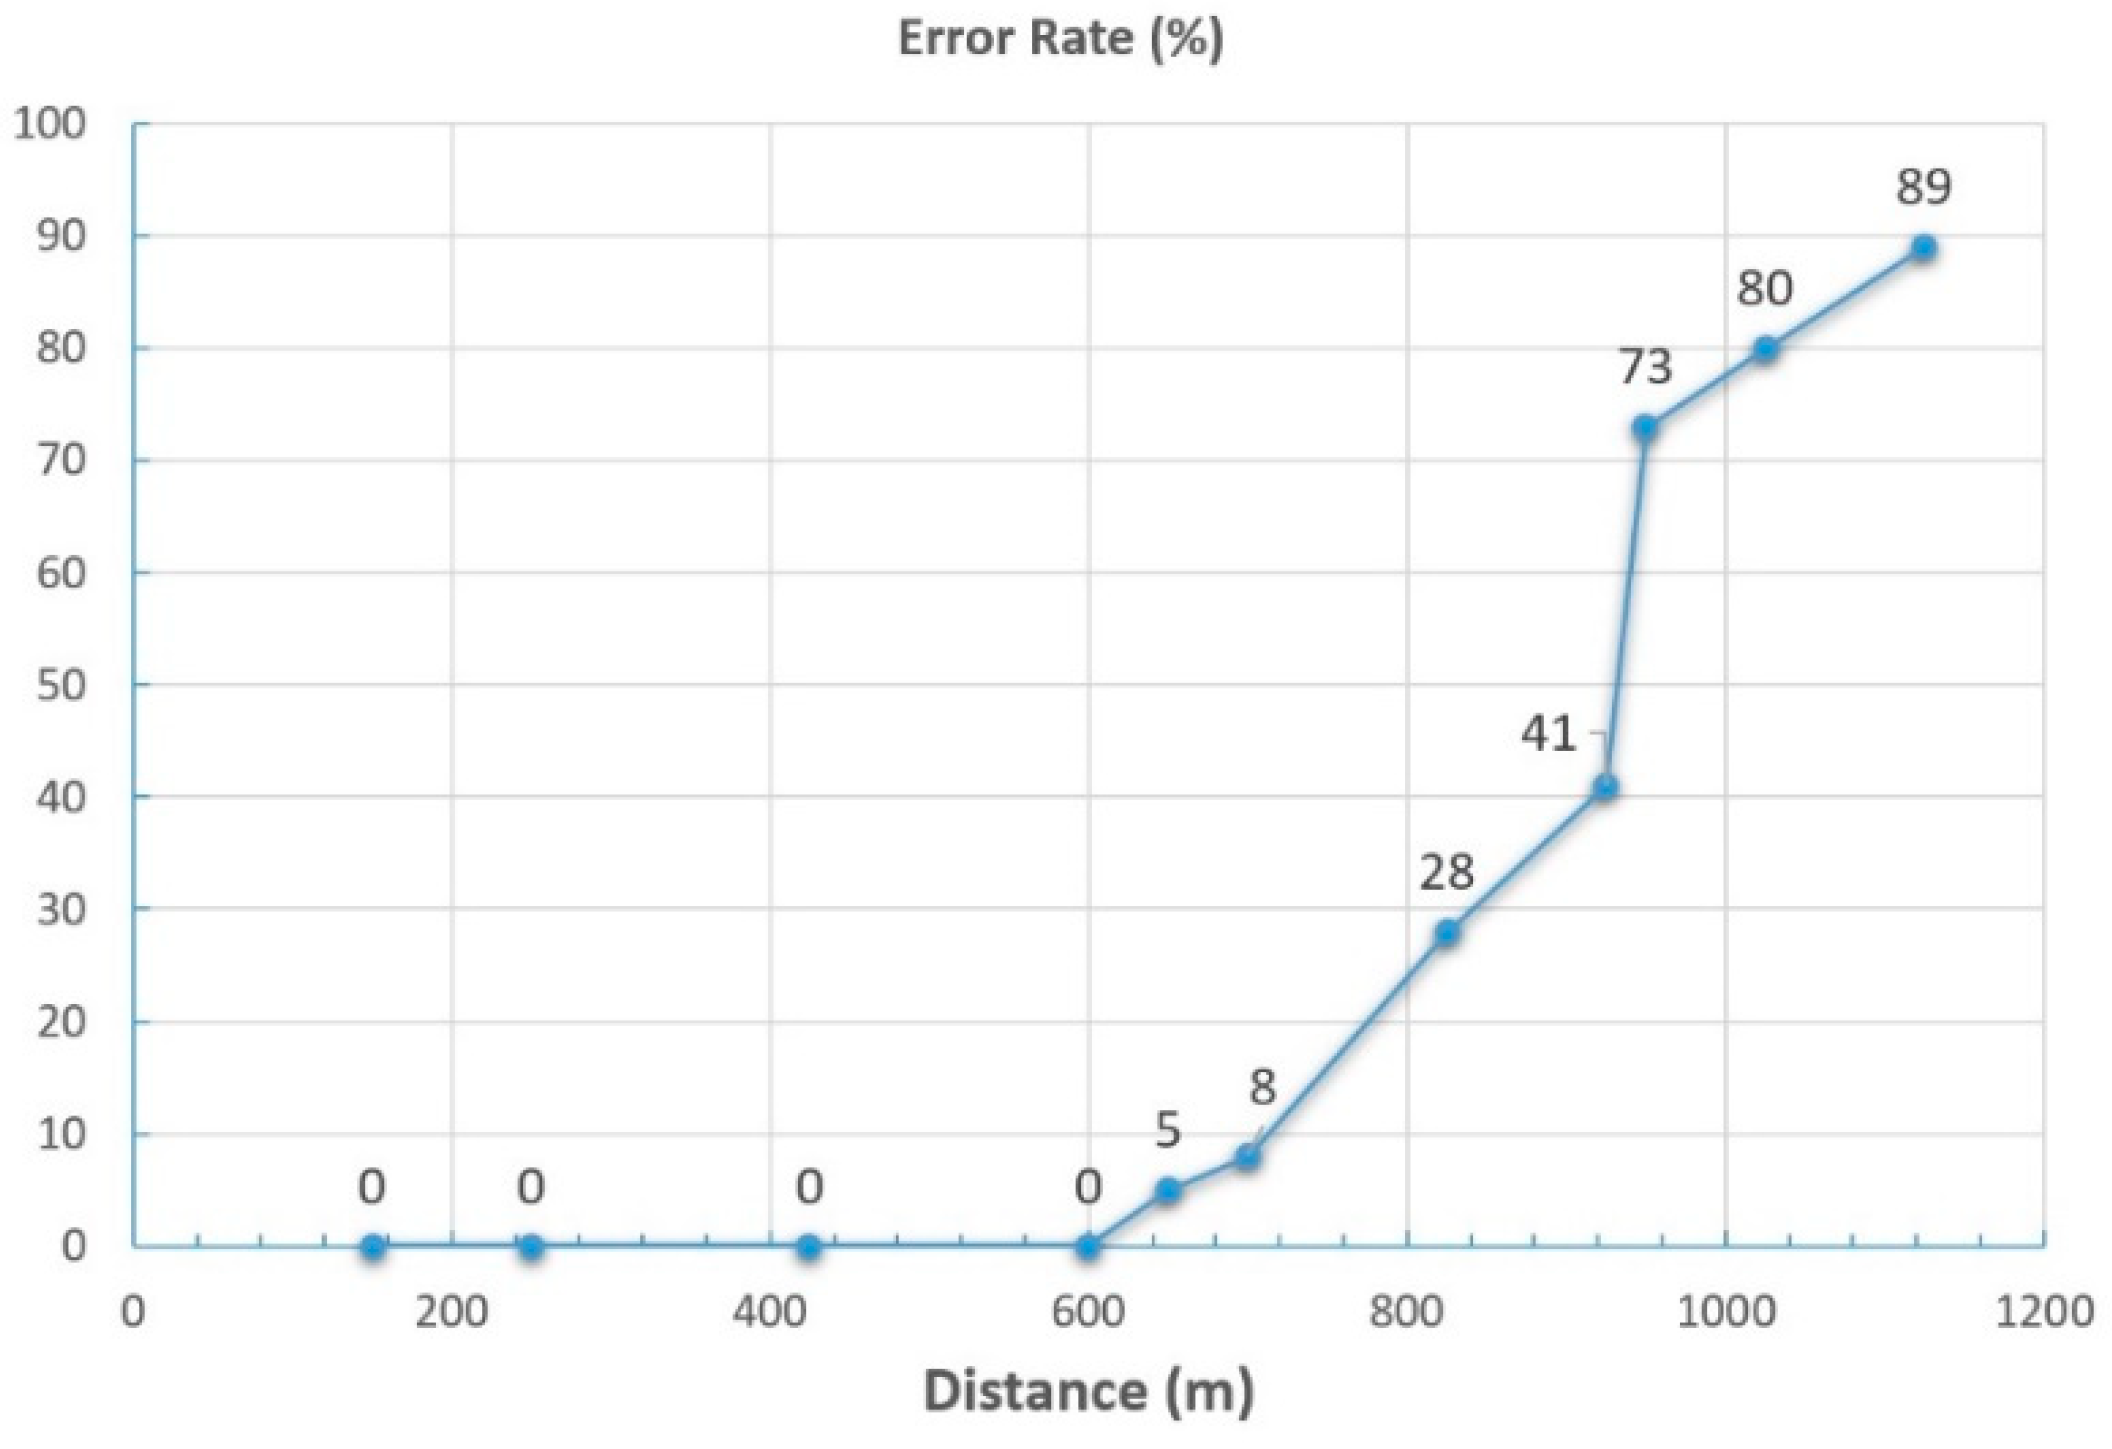
3.2. Experiments on Capture Distance

The maximum distance allowed from the remote node to the control node is another important factor to be analyzed. Therefore, an extensive series of experiments has been done to find the optimal working distances. Since the system was designed for horticultural crops, such as lettuce, the signal loss due to intermediate obstacles can be neglected. This means that the line-of-sight of the different nodes can be maintained, which in general allows for much greater distances.
The experiment consisted in placing the control node at a fixed position of the crop, near the farm house, and 11 remote capture nodes at different distances from 150 m to 1125 m. For each distance, between 20 and 50 images were captured and transmitted to the control node. This way, the error rate, defined as the percentage of images that produced any transmission error, was calculated. Figure 11 contains an aerial view of the crop where the experiments were conducted, with the location of the RICS nodes and the control node.
The obtained graph of the transmission error as a function of the distance is presented in Figure 12. In these tests, the images have a resolution of 320 × 240 pixels.
As is evident from Figure 12, the error progressively increases with distance. The error is 0 for all the distances below 600 m, meaning that no error occurred in the transmission of these images. It remains at low values until the distance reaches 750 m. However, the error grows very quickly from 800 m, being unacceptable for distances greater than 1000 m. Thus, if the local controller node is situated in the center of the crop, the system can cover effectively an area with a diameter around 1500 m, which should be enough for most small and average farms. Figure 13 shows some of the typical errors in the images produced by loss of packages due to the distance.
In the experiments, it has been observed that the loss of data in the transmission affects the final size of the received images. For example, the files received in Figure 13a–d have sizes 50.5 Kb, 44.1 Kb, 25.1 Kb and 13.0 Kb, respectively. This allows detecting errors in the transmission of the images and, consequently, automate the request of a new image to the active remote node. Thereby, the embedded microprocessor of the coordinator node verifies the integrity of the image file by checking the header and end-of-file according to the JPEG image format, as well as the size of the received data stream.

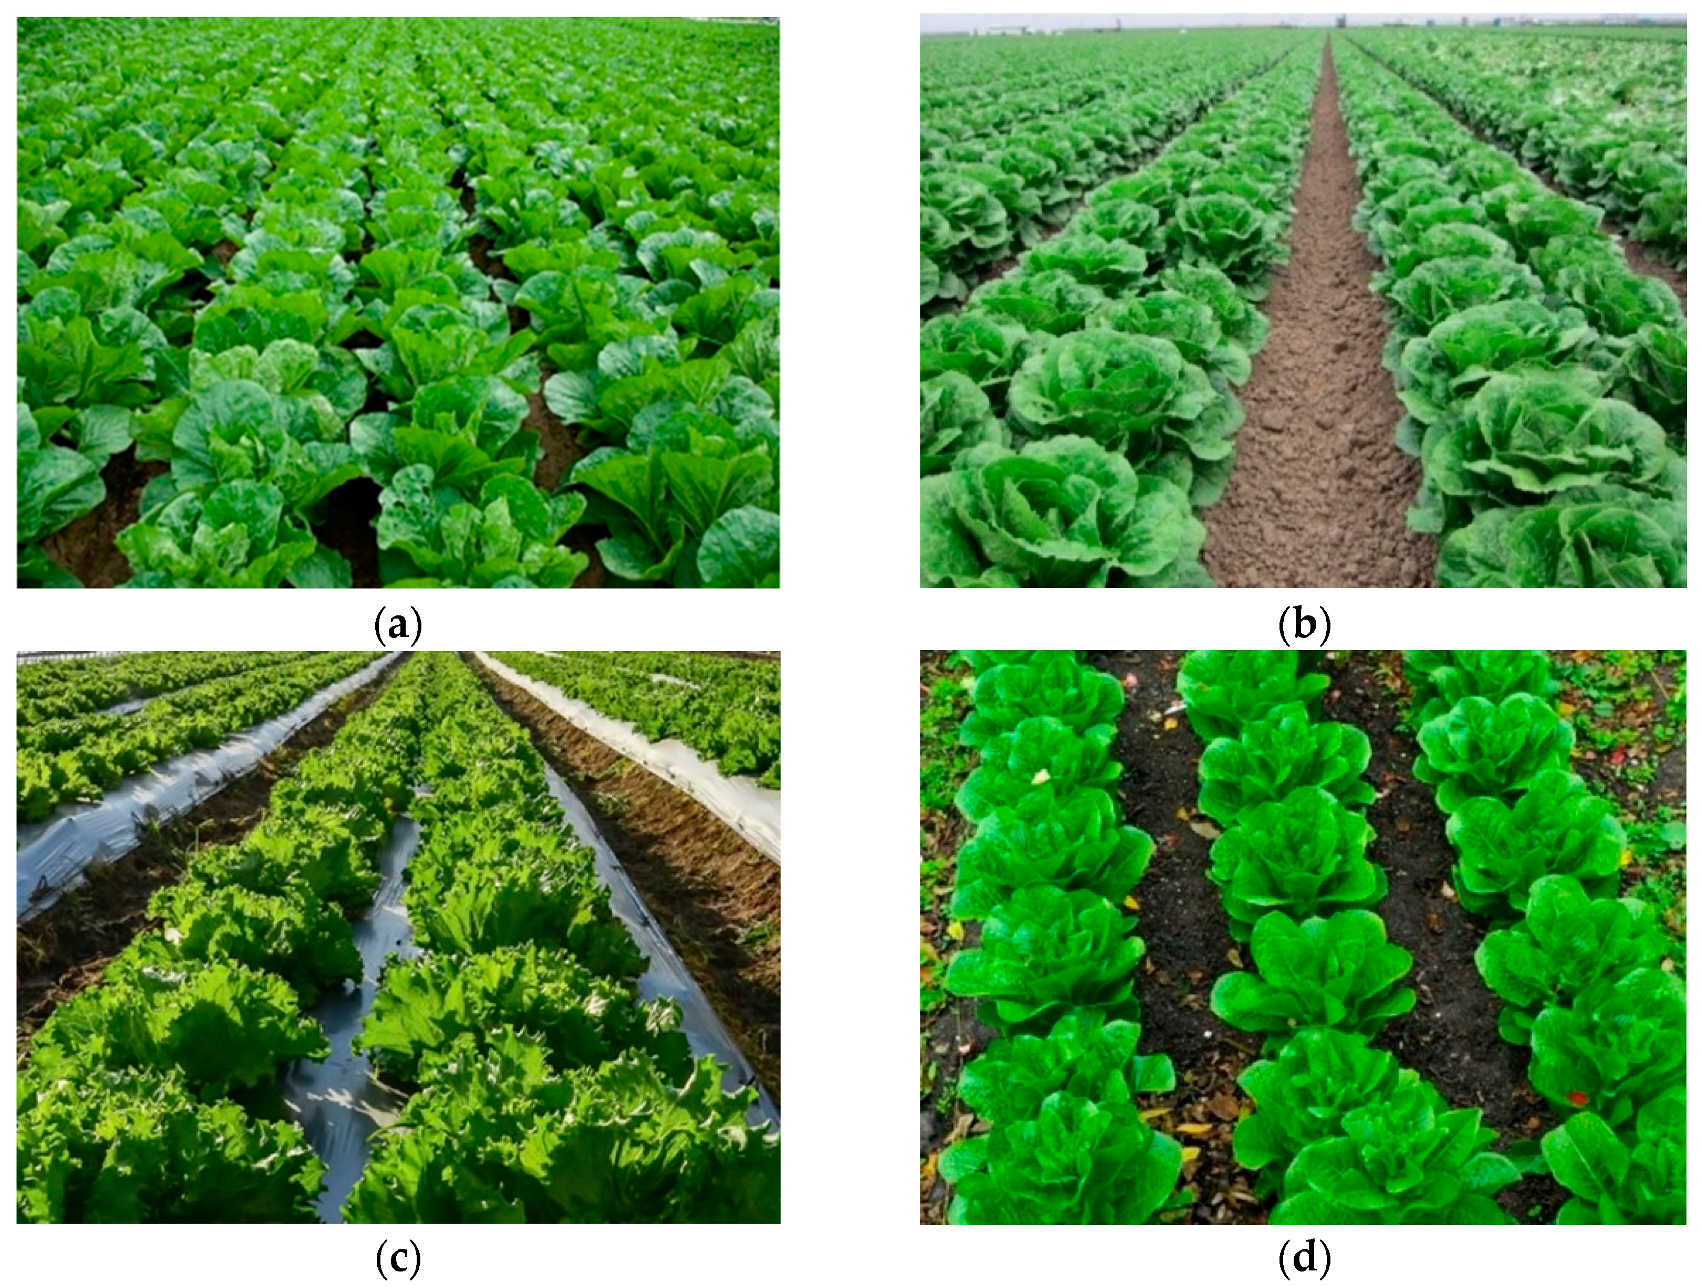
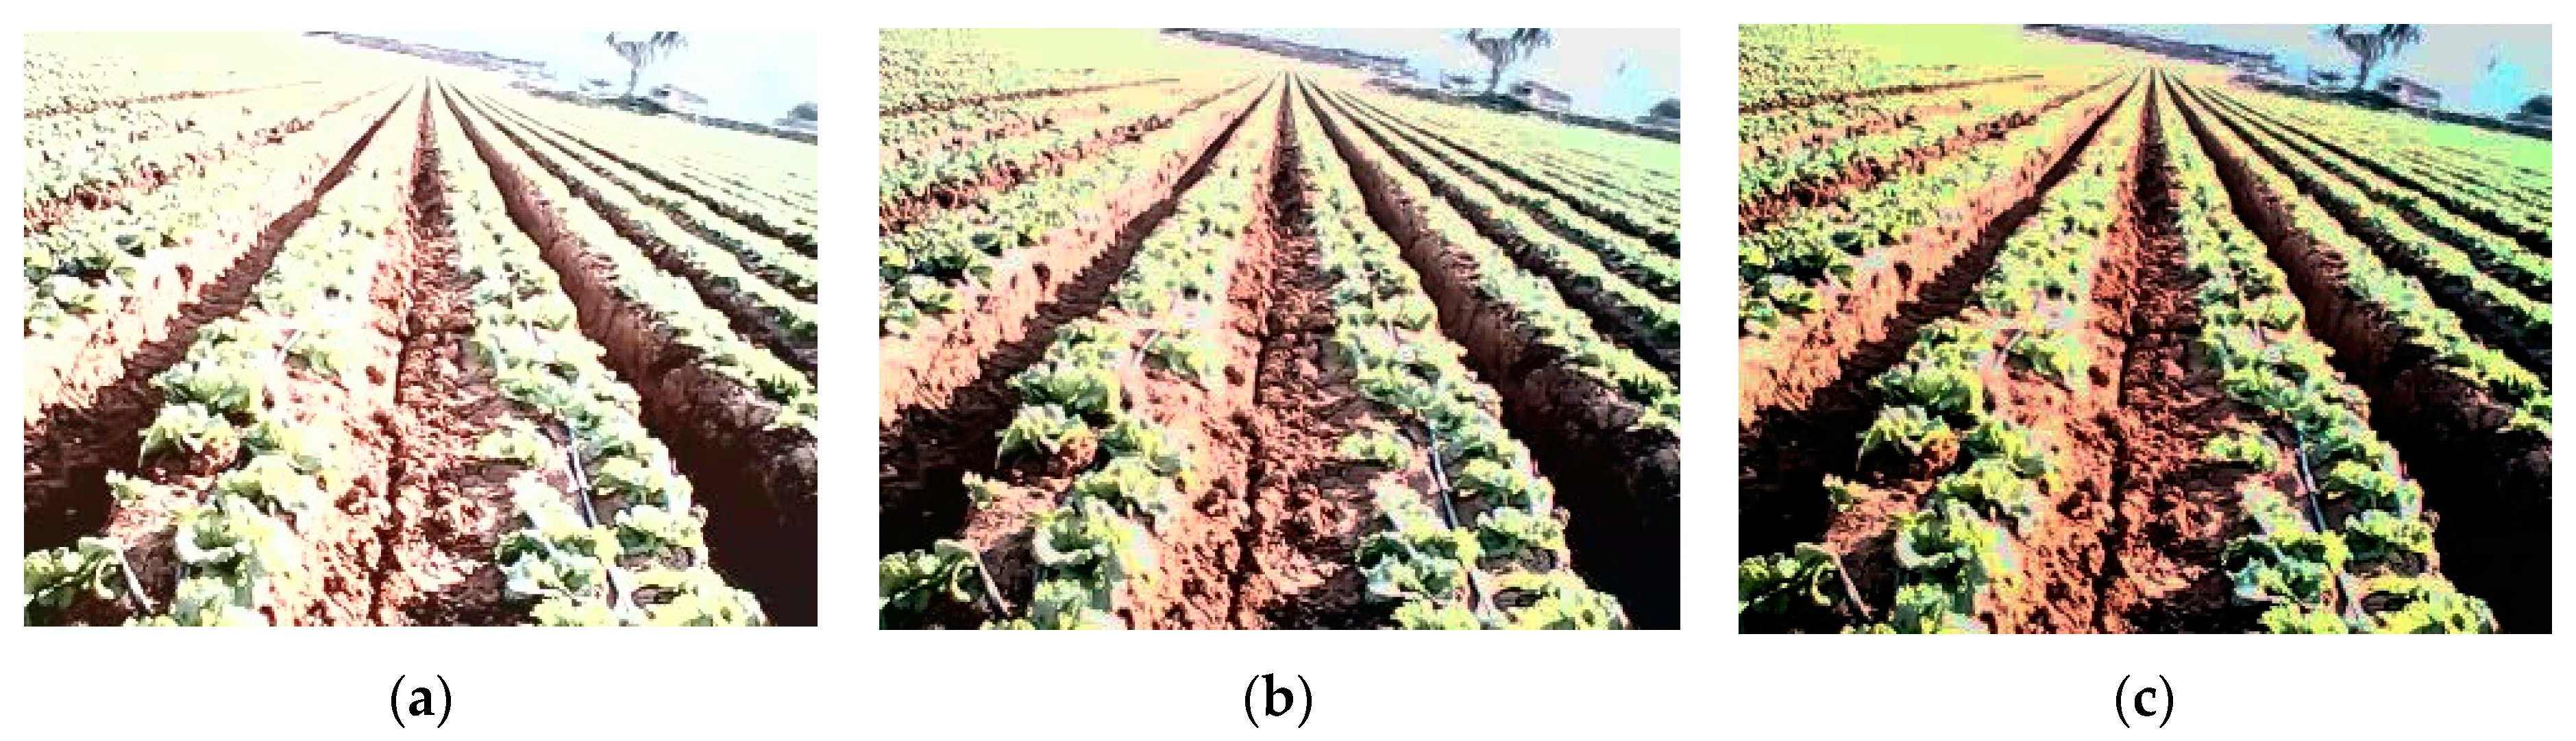
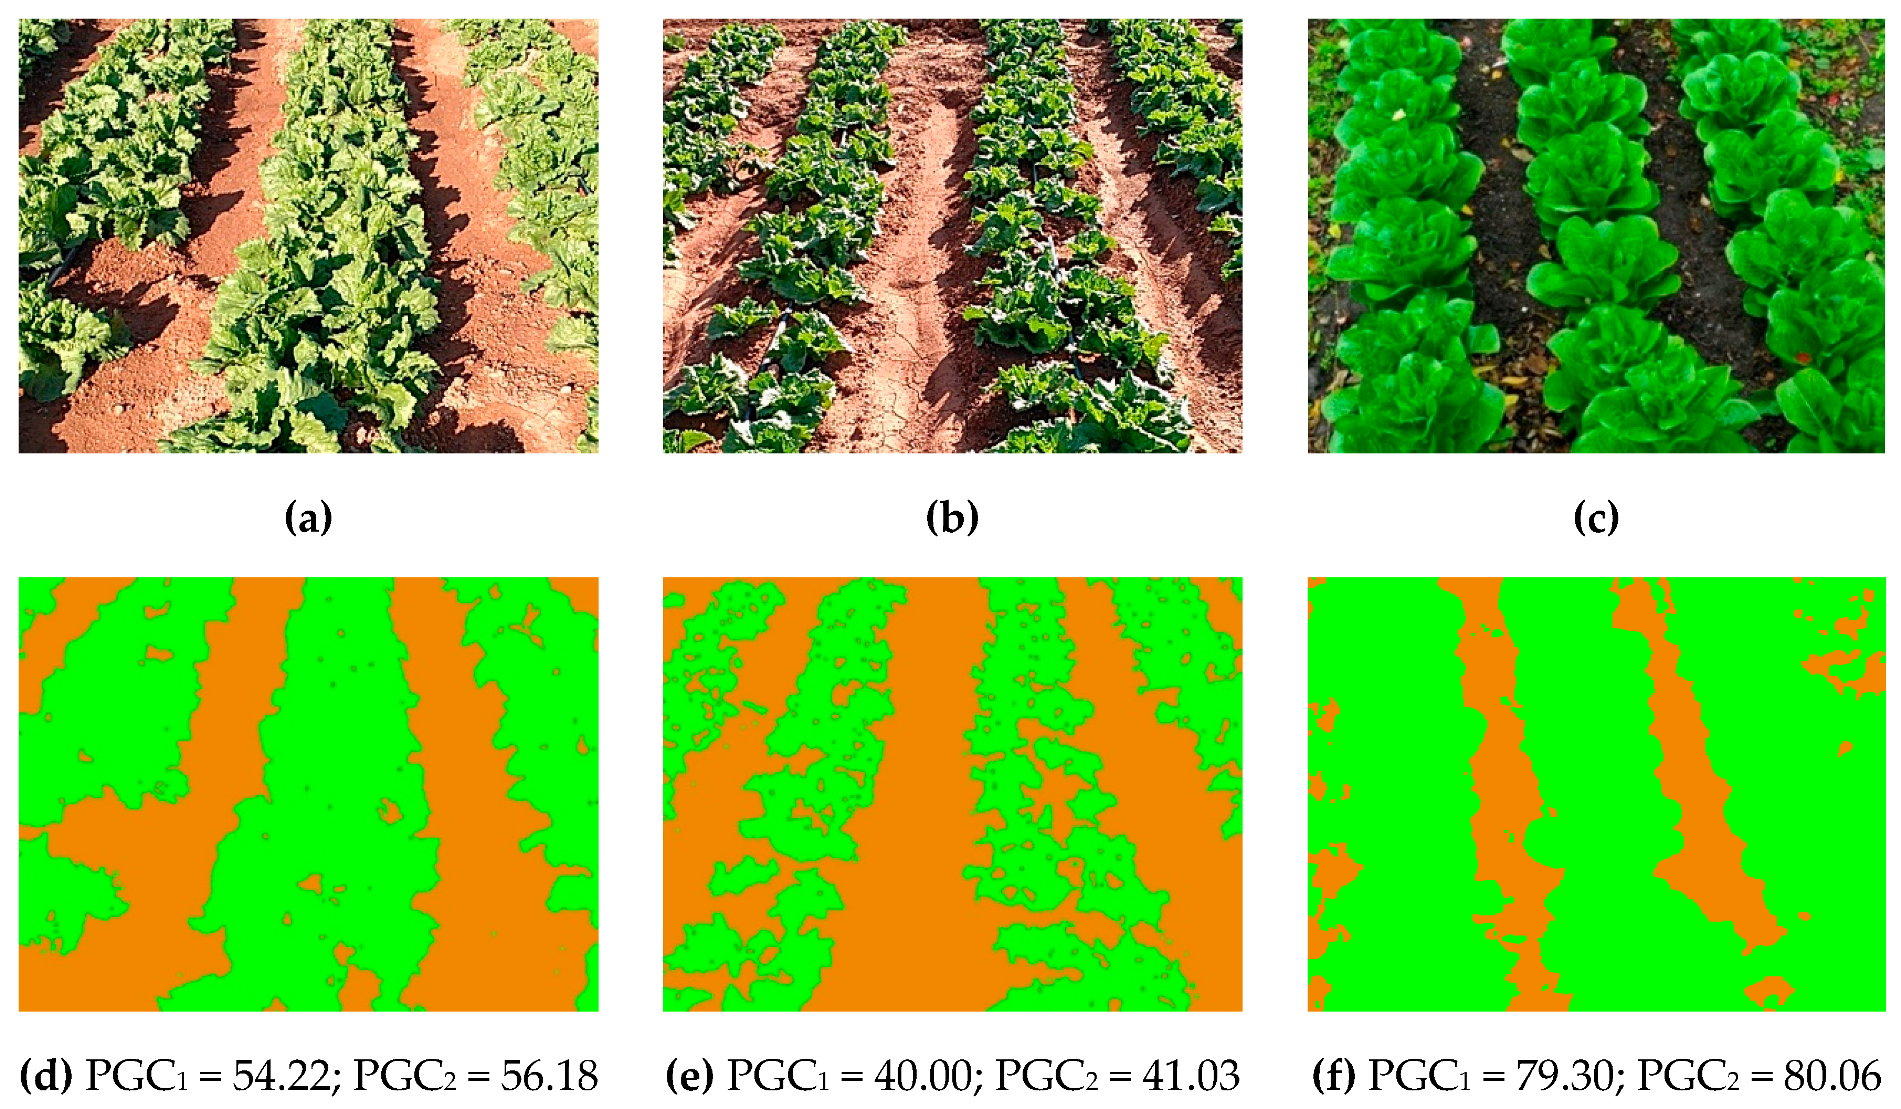
3.3. Experiments on Camera Capture Parameters and Plant/Soil Segmentation

The A20/A6C camera used in the RICS nodes allows for the configuration of the main capture parameters, such as the brightness, contrast and white balance. On the other hand, the viewing angle can also be manually adjusted by modifying the angle of the capture box, as shown in Figure 9a.
For this reason, some additional tests have been done to find the optimal setup of the system. The same scene was captured under different configurations of the parameters, searching for the optimal setup. Figure 14 shows an example of some of these tests for different configurations under outdoor natural lighting conditions. Since the image quality is a subjective property, the experimentation was done by trial and errors by experts in image processing.
The ultimate objective of the system is to calculate the percentage of green cover (PGC) to estimate the water requirements of the crop. Therefore, the last experiment consists in analyzing the images with the plant/soil segmentation algorithm implemented in the application and presented in [52]. This algorithm uses models for plant and soil color distributions in different color spaces. The models consist of the normalized histograms of the plant pixels and the soil pixels, selected by the user during the training phase. Given a new image, the algorithm reprojects the histograms in the image, obtaining the probabilities of plant and soil for each pixel. The class with the highest probability is selected pixel-by-pixel. Finally, morphology operators open and close are applied to remove some false positives and false negatives. The algorithm tests 11 standard color spaces and selects the optimal space and combination of channels [13].
To test the accuracy and robustness of the method, 10 images of the crops were analyzed using different models based on L*a*b* and I1I2I3 color spaces. Some sample results are presented in Figure 15. Generic color models for plants were applied in both cases.
The relative error in the obtained PGCs, calculated as the average absolute difference between the PGCs produced by both models, is only 0.945%. This high accuracy allows for a precise estimation of the crop coefficient parameter, Kc, which according to [8] can be obtained within a margin of error around 2%. From this coefficient Kc, the water balance can be computed using the FAO-56 methodology [53], achieving an optimal management of the water resources.

4. Conclusions

Computer vision is known to be a very powerful tool for water management in agricultural engineering. However, the use of image capture nodes in the field is limited by the environmental conditions, the requirement to be used in large areas, and the low availability of external communication systems. In this sense, ZigBee systems can be adjusted to provide an optimal solution, given their high level of scalability, their large coverage distances, and their low power consumption. The main weak point is its low data transmission speed, which in theory can be up to 250 Kbps, but must be reduced to only 19 Kbps for a reliable link without data loss.
The experiments have successfully proved that it is possible to transfer images of VGA resolution through the XBee network, with average times of 15–22 s for images of 35–50 Kbytes. This has been achieved using the AT mode of XBee, which avoids cutting the images into small information packages required in the API mode. In that case, the image would be split in 255 bytes per packet, consuming a transmission time of 120–150 s per image.
These results are similar to those observed by other authors, such as the performance comparison of wireless protocols presented in [36], where the LoRa and ZigBee protocols were found to be the most adequate technologies for agronomy applications. Moreover, compared to the use of drones and satellites, these systems based on inexpensive networks of fixed camera nodes can offer a greater availability of images at a lower cost of installation and operation. By contrast, they do not offer the possibility of capturing the entire crop. The captured images allow for the computation of the PGC parameter with an error around 1%, from which the crop coefficient, Kc, and the water balance of the plants can be estimated.
As the future work, there is still a long way to get a completely automatic system that estimates the irrigation needs of the crops with the obtained visual and meteorological information. For example, an important aspect is to define the pattern of automatic capture through the incorporation of weather forecasts. The time between captures could be increased or reduced, with the objective of maintaining the energy in the RICS nodes at optimum levels.

Author Contributions

Conceptualization, A.M.-A., J.M.M.-G.-P., A.R.-C., G.G.-M. and J.M.M.-M.; methodology, A.M.-A., J.M.M.-G.-P. and J.M.M.-M.; software, A.M.-A. and J.M.M.-G.-P.; validation, A.M.-A., J.M.M.-G.-P., A.R.-C., G.G.-M. and J.M.M.-M.; investigation, A.M.-A. and J.M.M.-G.-P.; resources, J.M.M.-M.; writing of the original draft preparation, A.M.-A. and A.R.-C.; writing of review and editing, G.G.-M.; visualization, A.M.-A., J.M.M.-G.-P. and A.R.-C.; supervision, J.M.M.-G.-P. and J.M.M.-M.; project administration, J.M.M.-M.; funding acquisition, A.R.-C., G.G.-M. and J.M.M.-M.

Funding

This research was funded by the Spanish Ministry of Economy and Competitiveness (MINECO), as well as the European Regional Development Fund (ERDF) under the projects TIN2015-66972-C5-3-R and AGL2015-66938-C2-1-R. This article is the result of the activity carried out under the “Research Program for Groups of Scientific Excellence in the Region of Murcia” of the Seneca Foundation (Agency for Science and Technology of the Region of Murcia, Spain).

Conflicts of Interest

The authors declare no conflict of interest. The funders had no role in the design of the study; in the collection, analyses, or interpretation of data; in the writing of the manuscript, or in the decision to publish the results.

References

  1. Sesma, J.; Molina-Martínez, J.M.; Cavas-Martínez, F.; Fernández-Pacheco, D.G. A mobile application to calculate optimum drip irrigation laterals. Agric. Water Manag. 2015, 151, 13–18. [Google Scholar] [CrossRef]
  2. Levidow, L.; Pimbert, M.; Vanloqueren, G. Agroecological Research: Conforming—Or Transforming the Dominant Agro-Food Regime? Agroecol. Sustain. Food Syst. 2014, 38, 1127–1155. [Google Scholar] [CrossRef]
  3. Laliberte, A.S.; Rango, A.; Herrick, J. Unmanned aerial vehicles for rangeland mapping and monitoring: A comparison of two systems. In Proceedings of the American Society for Photogrammetry and Remote Sensing, Tampa, FL, USA, 7–11 May 2007. [Google Scholar]
  4. Xiang, H.; Tian, L. Method for automatic georeferencing aerial remote sensing (RS) images from an unmanned aerial vehicle (UAV) platform. Biosyst. Eng. 2011, 108, 104–113. [Google Scholar] [CrossRef]
  5. Raine, S.R.; Meyer, W.S.; Rassam, D.W.; Hutson, J.L.; Cook, F.J. Soil-water and solute movement under precision irrigation: Knowledge gaps for managing sustainable root zones. Irrig. Sci. 2007, 26, 91–100. [Google Scholar] [CrossRef]
  6. Adeyemi, O.; Grove, I.; Peets, S.; Norton, T. Advanced monitoring and management systems for improving sustainability in precision irrigation. Sustainability 2017, 9, 353. [Google Scholar] [CrossRef]
  7. Escarabajal-Henarejos, D.; Molina-Martínez, J.M.; Fernández-Pacheco, D.G.; Cavas-Martínez, F.; García-Mateos, G. Digital photography applied to irrigation management of Little Gem lettuce. Agric. Water Manag. 2015, 151, 148–157. [Google Scholar] [CrossRef]
  8. González-Esquiva, J.M.; García-Mateos, G.; Escarabajal-Henarejos, D.; Hernández-Hernández, J.L.; Ruiz-Canales, A.; Molina-Martínez, J.M. A new model for water balance estimation on lettuce crops using effective diameter obtained with image analysis. Agric. Water Manag. 2017, 183, 116–122. [Google Scholar] [CrossRef]
  9. Bogena, H.R.; Huisman, J.A.; Oberdörster, C.; Vereecken, H. Evaluation of a low-cost soil water content sensor for wireless network applications. J. Hydrol. 2007, 344, 32–42. [Google Scholar] [CrossRef]
  10. Díaz, S.E.; Pérez, J.C.; Mateos, A.C.; Marinescu, M.C.; Guerra, B.B. A novel methodology for the monitoring of the agricultural production process based on wireless sensor networks. Comput. Electron. Agric. 2011, 76, 252–265. [Google Scholar] [CrossRef]
  11. Coates, R.W.; Delwiche, M.J.; Broad, A.; Holler, M. Wireless sensor network with irrigation valve control. Comput. Electron. Agric. 2013, 96, 13–22. [Google Scholar] [CrossRef]
  12. Goumopoulos, C.; O’Flynn, B.; Kameas, A. Automated zone-specific irrigation with wireless sensor/actuator network and adaptable decision support. Comput. Electron. Agric. 2014, 105, 20–33. [Google Scholar] [CrossRef]
  13. Hernández-Hernández, J.L.; García-Mateos, G.; González-Esquiva, J.M.; Escarabajal-Henarejos, D.; Ruiz-Canales, A.; Molina-Martínez, J.M. Optimal color space selection method for plant/soil segmentation in agriculture. Comput. Electron. Agric. 2016, 122, 124–132. [Google Scholar] [CrossRef]
  14. Segovia-Cardozo, D.A.; Rodriguez-Sinobas, L.; Zubelzu, S. Water use efficiency of corn among the irrigation districts across the Duero river basin (Spain): Estimation of local crop coefficients by satellite images. Agric. Water Manag. 2019, 212, 241–251. [Google Scholar] [CrossRef]
  15. Li, L.; Mu, X.; Macfarlane, C.; Song, W.; Chen, J.; Yan, K.; Yan, G. A half-Gaussian fitting method for estimating fractional vegetation cover of corn crops using unmanned aerial vehicle images. Agric. For. Meteorol. 2018, 262, 379–390. [Google Scholar] [CrossRef]
  16. González-Esquiva, J.M.; Oates, M.J.; García-Mateos, G.; Moros-Valle, B.; Molina-Martínez, J.M.; Ruiz-Canales, A. Development of a visual monitoring system for water balance estimation of horticultural crops using low cost cameras. Comput. Electron. Agric. 2017, 141, 15–26. [Google Scholar] [CrossRef]
  17. Mora, M.; Avila, F.; Carrasco-Benavides, M.; Maldonado, G.; Olguín-Cáceres, J.; Fuentes, S. Automated computation of leaf area index from fruit trees using improved image processing algorithms applied to canopy cover digital photograpies. Comput. Electron. Agric. 2016, 123, 195–202. [Google Scholar] [CrossRef]
  18. Rosell, J.R.; Sanz, R. A review of methods and applications of the geometric characterization of tree crops in agricultural activities. Comput. Electron. Agric. 2012, 81, 124–141. [Google Scholar] [CrossRef]
  19. Brogi, C.; Huisman, J.A.; Pätzold, S.; von Hebel, C.; Weihermüller, L.; Kaufmann, M.S.; van der Kruk, J.; Vereecken, H. Large-scale soil mapping using multi-configuration EMI and supervised image classification. Geoderma 2019, 335, 133–148. [Google Scholar] [CrossRef]
  20. Schaeffer, B.A.; Schaeffer, K.G.; Keith, D.; Lunetta, R.S.; Conmy, R.; Gould, R.W. Barriers to adopting satellite remote sensing for water quality management. Int. J. Remote Sens. 2013, 34, 7534–7544. [Google Scholar] [CrossRef]
  21. Tzounis, A.; Katsoulas, N.; Bartzanas, T.; Kittas, C. Internet of Things in agriculture, recent advances and future challenges. Biosyst. Eng. 2017, 164, 31–48. [Google Scholar] [CrossRef]
  22. Hardin, P.J.; Hardin, T.J. Small-scale remotely piloted vehicles in environmental research. Geogr. Compass 2010, 4, 1297–1311. [Google Scholar] [CrossRef]
  23. Nebiker, S.; Annen, A.; Scherrer, M.; Oesch, D. A ligth weight multispectral sensor for micro UAV—Opportunities for very high resolution airborne remote sensing. Int. Arch. Photogramm. Remote Sens. Spat. Inf. Sci. 2008, 37, 1193–1199. [Google Scholar]
  24. Lelong, C.C.D.; Burger, P.; Jubelin, G.; Roux, B.; Labbé, S.; Baret, F. Assessment of unmanned aerial vehicles imagery for quantitative monitoring of wheat crop in small plots. Sensors 2008, 8, 3557–3585. [Google Scholar] [CrossRef] [PubMed]
  25. Laliberte, A.S.; Rango, A. Image Processing and Classification Procedures for Analysis of Sub-decimeter Imagery Acquired with an Unmanned Aircraft over Arid Rangelands. GIScience Remote Sens. 2011, 48, 4–23. [Google Scholar] [CrossRef]
  26. Hardin, P.J.; Jensen, R.R. Small-Scale Unmanned Aerial Vehicles in Environmental Remote Sensing: Challenges and Opportunities. GIScience Remote Sens. 2011, 48, 99–111. [Google Scholar] [CrossRef]
  27. Andrade-sanchez, P.; Pierce, F.J.; Elliott, T.V. Performance Assessment of Wireless Sensor Networks in Agricultural Settings. In 2007 ASAE Annual Meeting; American Society of Agricultural and Biological Engineers: St. Joseph, MI, USA, 2007; p. 1. [Google Scholar]
  28. Tate, R.F.; Hebel, M.A.; Watson, D.G. WSN link budget analysis for precision agriculture. In Proceedings of the American Society of Agricultural and Biological Engineers Annual International Meeting, St. Joseph, MI, USA, 29 June–2 July 2008. [Google Scholar]
  29. Mayer, K.; Ellis, K.; Taylor, K. Cattle health monitoring using wireless sensor networks. In Proceedings of the Communication and Computer Networks Conference (CCN 2004); ACTA Press: Calgary, AB, Canada, 2004; pp. 8–10. [Google Scholar]
  30. Osroosh, Y.; Khot, L.R.; Peters, R.T. Economical thermal-RGB imaging system for monitoring agricultural crops. Comput. Electron. Agric. 2018, 147, 34–43. [Google Scholar] [CrossRef]
  31. Goense, D.; Thelen, J. Wireless sensor networks for precise Phytophthora decision supportv. In Proceedings of the 2005 ASAE Annual Meeting. American Society of Agricultural and Biological Engineers, Tampa, FL, USA, 25–27 September 2005. [Google Scholar]
  32. Haneveld, P.K. Evading Murphy: A Sensor Network Deployment in Precision Agriculture; Delft, The Netherlands, 28 June 2007. [Google Scholar]
  33. Ruiz-Garcia, L.; Barreiro, P.; Robla, J.I. Performance of ZigBee-Based wireless sensor nodes for real-time monitoring of fruit logistics. J. Food Eng. 2008, 87, 405–415. [Google Scholar] [CrossRef]
  34. Martin, A.; Hebel, M.A.; Ralph, F.; Tate, R.F.; Dennis, G.; Watson, D.G. Results of Wireless Sensor Network Transceiver Testing for Agricultural Applications. In Proceedings of the 2007 ASAE Annual Meeting, Minneapolis, MN, USA, 17–20 June 2007. [Google Scholar]
  35. Zhang, N.; Wang, M.; Wang, N. Precision agriculture—A worldwide overview. Comput. Electron. Agric. 2002, 36, 113–132. [Google Scholar] [CrossRef]
  36. Jawad, H.M.; Nordin, R.; Gharghan, S.K.; Jawad, A.M.; Ismail, M. Energy-efficient wireless sensor networks for precision agriculture: A review. Sensors 2017, 17, 1781. [Google Scholar] [CrossRef]
  37. Malaver, A.; Motta, N.; Corke, P.; Gonzalez, F. Development and integration of a solar powered unmanned aerial vehicle and a wireless sensor network to monitor greenhouse gases. Sensors 2015, 15, 4072–4096. [Google Scholar] [CrossRef]
  38. Aquino-Santos, R.; González-Potes, A.; Edwards-Block, A.; Virgen-Ortiz, R.A. Developing a new wireless sensor network platform and its application in precision agriculture. Sensors 2011, 11, 1192–1211. [Google Scholar] [CrossRef] [PubMed]
  39. Cancela, J.J.; Fandiño, M.; Rey, B.J.; Martínez, E.M. Automatic irrigation system based on dual crop coefficient, soil and plant water status for Vitis vinifera (cv Godello and cv Mencía). Agric. Water Manag. 2015, 151, 52–63. [Google Scholar] [CrossRef]
  40. Rao, Y.; Jiang, Z.H.; Lazarovitch, N. Investigating signal propagation and strength distribution characteristics of wireless sensor networks in date palm orchards. Comput. Electron. Agric. 2016, 124, 107–120. [Google Scholar] [CrossRef]
  41. Edwards-Murphy, F.; Magno, M.; Whelan, P.M.; O’Halloran, J.; Popovici, E.M. B+WSN: Smart beehive with preliminary decision tree analysis for agriculture and honey bee health monitoring. Comput. Electron. Agric. 2016, 124, 211–219. [Google Scholar] [CrossRef]
  42. Sai, Z.; Fan, Y.; Yuliang, T.; Lei, X.; Yifong, Z. Optimized algorithm of sensor node deployment for intelligent agricultural monitoring. Comput. Electron. Agric. 2016, 127, 76–86. [Google Scholar] [CrossRef]
  43. Fernández-Pacheco, D.G.; Ferrández-Villena, M.; Molina-Martínez, J.M.; Ruiz-Canales, A. Performance indicators to assess the implementation of automation in water user associations: A case study in southeast Spain. Agric. Water Manag. 2015, 151, 87–92. [Google Scholar] [CrossRef]
  44. Aiello, G.; Giovino, I.; Vallone, M.; Catania, P.; Argento, A. A decision support system based on multisensor data fusion for sustainable greenhouse management. J. Clean. Prod. 2018, 151, 87–92. [Google Scholar] [CrossRef]
  45. González-Esquiva, J.M.; García-Mateos, G.; Hernández-Hernández, J.L.; Ruiz-Canales, A.; Escarabajal-Henerajos, D.; Molina-Martínez, J.M. Web application for analysis of digital photography in the estimation of irrigation requirements for lettuce crops. Agric. Water Manag. 2017, 183, 136–145. [Google Scholar] [CrossRef]
  46. Escarabajal-Henarejos, D.; Molina-Martínez, J.M.; Fernández-Pacheco, D.G.; García-Mateos, G. Methodology for obtaining prediction models of the root depth of lettuce for its application in irrigation automation. Agric. Water Manag. 2015, 151, 167–173. [Google Scholar] [CrossRef]
  47. Warren, G.; Metternicht, G. Agricultural applications of high-resolution digital multispectral imagery: Evaluating within-field spatial variability of canola (Brassica napus) in Western Australia. Photogramm. Eng. Remote Sens. 2005, 71, 595–602. [Google Scholar] [CrossRef]
  48. Sudevalayam, S.; Kulkarni, P. Energy harvesting sensor nodes: Survey and implications. IEEE Commun. Surv. Tutorials 2011, 43, 443–461. [Google Scholar] [CrossRef]
  49. Akhtar, F.; Rehmani, M.H. Energy replenishment using renewable and traditional energy resources for sustainable wireless sensor networks: A review. Renew. Sustain. Energy Rev. 2015, 45, 769–784. [Google Scholar] [CrossRef]
  50. Zhang, Z.; Wu, P.; Han, W.; Yu, X. Remote monitoring system for agricultural information based on wireless sensor network. J. Chin. Inst. Eng. Trans. Chin. Inst. Eng. A 2017, 40, 75–81. [Google Scholar] [CrossRef]
  51. Gutierrez, J.; Villa-Medina, J.F.; Nieto-Garibay, A.; Porta-Gandara, M.A. Automated irrigation system using a wireless sensor network and GPRS module. IEEE Trans. Instrum. Meas. 2014, 63, 166–176. [Google Scholar] [CrossRef]
  52. Hernández-Hernández, J.L.; Ruiz-Hernández, J.; García-Mateos, G.; González-Esquiva, J.M.; Ruiz-Canales, A.; Molina-Martínez, J.M. A new portable application for automatic segmentation of plants in agriculture. Agric. Water Manag. 2017, 183, 146–157. [Google Scholar] [CrossRef]
  53. Allen, R.G.; Luis, S.P.; RAES, D.; Smith, M. FAO Irrigation and Drainage Paper No. 56. Crop Evapotranspiration (Guidelines for Computing Crop Water Requirements); FAO: Rome, Italy, 1998. [Google Scholar]
Figure 1. Global view of the proposed system. The main components are the in-field remote vision nodes, the local control node web, the web server and the remote clients.
Water 11 00255 g001
Figure 2. Schematic configuration of a remote vision node or RICS box. The placement of the box is configurable and determines the part of the crop that is visible under the area of interest.
Water 11 00255 g002
Figure 3. Some samples of the images captured by the RICS nodes in a crop of lettuce. Image resolution is 640 × 480 pixels. (a,b,d) are images of romaine lettuce (Lactuca sativa L. var. Longifolia). (c) is the image of iceberg lettuce (Lactuca sativa L. var. Capitata ‘Iceberg’).
Water 11 00255 g003
Figure 4. Sample view and diagram of the RICS box. (a) Assembly of the prototype RICS node. (b) The same prototype with the box closed, showing the two photovoltaic modules and the position of the antenna. (c) Diagram of the elements in a stacked mount: XBee 868LP, a battery charger/photovoltaic module controller, A20 module and the Li-ion battery in the top of the enclosure.
Water 11 00255 g004
Figure 5. Power supply current profile for a 1-hour data cycle of remote node.
Water 11 00255 g005
Figure 6. Sample view and diagram of the coordinator node. (a) Final prototype assembly of the node. (b) Schematic diagram of the node. (c) Diagram of the elements in a stacked mount; the elements are placed in a stacked mount to save space and increase the capabilities of the prototype.
Water 11 00255 g006
Figure 7. Sample view of the control and verification console, with check commands received.
Water 11 00255 g007
Figure 8. Steps of the protocol for image request and transmission.
Water 11 00255 g008
Figure 9. Global view of a remote capture node in the field. (a) Location of the node on a crop of lettuce. (b) Sample image captured by the system.
Water 11 00255 g009
Figure 10. Some sample images received in the coordinator node with different transmission speeds: (a) 57,600 bps; (b) 38,400 bps; (c) 28,800 bps; (d) 19,200 bps (image received without errors).
Water 11 00255 g010aWater 11 00255 g010b
Figure 11. Aerial view of the location of the local control node and the remote capture nodes (source: DigitalGlobe, European Space Imaging).
Water 11 00255 g011
Figure 12. Error rates in the transmission of images from the remote RICS nodes to the local coordinator node, as a function of the distance between them. The speed is 19,200 bps and the resolution is 320 × 240 pixels.
Water 11 00255 g012
Figure 13. Some sample images received in the coordinator node at different distances from the remote node: (a) 600 m (image received without errors); (b) 700 m; (c) 950 m; (d) 1125 m.
Water 11 00255 g013
Figure 14. Sample images obtained with different capture configurations of the A20/A6C camera, changing the parameters of brightness and contrast: (a) cloudy mode; (b) daylight mode 1; (c) daylight mode 2.
Water 11 00255 g014
Figure 15. Plant/soil segmentation of the images obtained by the RICS nodes for a crop of lettuce. (ac) are captured images. (df) are segmented images. For each image, the percentage of green cover is indicated using the L*a*b* (PGC1) and I1I2I3 color model (PGC2). PGC = the percentage of green cover.
Water 11 00255 g015
Table 1. Measured currents of the remote node in different states.
Measured Current ConsumptionPower onIdleIdle + Cam onHigh Rate TransmissionSleep Mode
A20/A6C + XBee 868LP + Battery charger200 mA95 mA140 mA (180 mA peaks)200 mA (240 mA peaks)1.2 mA
XBee 868LP 25 mA25 mA50 mA1.7 µA
Battery charger----85 µA
A20/A6C camera 60 mA115 mA150 mA<1 mA

