Effect of Phenyl-Acyl Compounds on the Growth, Morphology, and Toxin Production of Microcystis aeruginosa Kützing


1
Organic Chemistry Natural Products Group, Institute of Chemistry, Universidad de Antioquia, Calle 67 No. 53-108, 050010 Medellín, Colombia
2
Environmental Management and Modeling Research Group (GAIA), Universidad de Antioquia, Calle 67 No. 53-108, 050010 Medellín, Colombia
*
Authors to whom correspondence should be addressed.
Water 2019, 11(2), 236; https://doi.org/10.3390/w11020236
Submission received: 20 November 2018
/
Revised: 14 January 2019
/
Accepted: 16 January 2019
/
Published: 30 January 2019
(This article belongs to the Special Issue Advancing Knowledge on Cyanobacterial Blooms in Freshwaters)
Abstract
:The proliferation of cyanobacteria and, consequently, the production of cyanotoxins is a serious public health concern; for their control, several alternatives have been proposed, including physical, chemical, and biological methods. In the search for new alternatives and a greater understanding of the biochemical process involved in the blooms’ formation, we report here the effect of eight phenyl-acyl compounds in the growth of Microcystis aeruginosa Kützing (assesed as cell density/count and Chl a fluorescence concentration) morphology, and production of the toxin microcystin-LR (MC-LR). Caffeic acid and eugenol decreased the growth of M. aeruginosa Kützing and the levels of Chl a. However, 3,5-dimethoxybenzoic acid and syringic acid caused the opposite effect in the growth; 2′and 4′only affected the Chl a. A reduction in the concentration of the MC-LR toxin was detected after treatment with syringic acid, caffeic acid, and eugenol. According to HPLC/MS (High Performance Liquid Chromatography coupled to Mass Spectrometry), a redox process possibly occurs between caffeic acid and MC-LR. The optical microscopy and Scanning Electron Microscopy analyses revealed morphological changes that had been exposed to caffeic acid and vanillin, specifically in the cell division and presence of mucilage. Finally, assays in Daphnia pulex De Geer neonates indicated that caffeic acid had a non-toxic effect at concentrations as high as 100 mg/L at 48 h.
Keywords:
blooms; cyanobacteria; control; toxins; phenyl-acyl compounds; caffeic acid; non-toxic; redox microcystin LR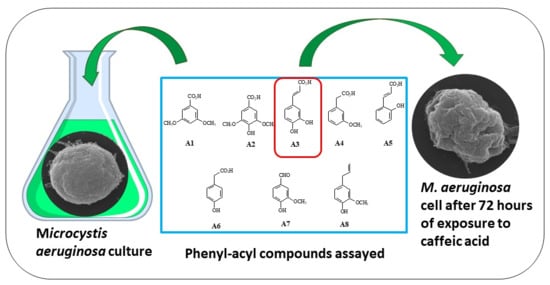
1. Introduction
Currently, water bodies are threatened with eutrophication, which leads to an increased risk of blooms of potentially toxic cyanobacteria. The recognition of its impacts on ecosystems, and the implementation of sustainability programs in water management and bloom prevention, requires new alternatives to, and knowledge of, water treatment to avoid health risks [1]. In particular, the effects of cyanotoxins on human health are well-known. For example, 53 patients died due to intravenous exposure to several microcystins (MCs) during a hemodialysis treatment in Caruaru, Brazil [2].
To eliminate intact cyanobacteria and prevent the release of intracellular toxins, different approaches to water treatment have been used, such as flocculation, filtration, and coagulation. However, these methodologies sometimes do not remove all these compounds.
Some algicides, such as copper sulfate, potassium permanganate, and chlorine, are widely used. However, they are highly contaminating and lack specificity, as they cause the death of other organisms present in the same environment [3]. Copper sulfate is the most commonly used algicide because of its cost, ease of application, and effectiveness [4]. Nevertheless, its intensive application in lakes and reservoirs is a great problem due to copper accumulation and the consequent toxicity [5]. Therefore, new substances and organisms have been sought to control these blooms. For example, vitamin C has been applied to inhibit Microcystis aeruginosa Kützing [6]. Besides this, aquatic macrophytes affect photosynthesis and the antioxidant system of this cyanobacteria [7]. Other methods include adsorbent sediments [8], chitosan as a coagulant [9], and coagulation-flotation methods with pre-oxidation assistance [10].
It has been proposed that toxins, such as MCs, stimulate the formation of colonies of M. aeruginosa Kützing; thus, they may play a role in their persistence and dominance [11]. Therefore, the inhibition of the production of these toxins could be an alternative to control bloom formation as well avoid harmful effects in animals.
In this study, we assessed the effect of eight phenyl-acyl compounds, derived from natural sources (Figure 1), on the growth and morphology of M. aeruginosa Kützing blooms, as well as on the levels of the microcystin-LR (MC-LR) toxin. We also analyzed the toxicity of these compounds to Daphnia pulex De Geer.
2. Materials and Methods
2.1. Sampling and Culturing of M. aeruginosa
A cyanobacteria sample was collected from the Riogrande II reservoir (Antioquia, Colombia) in May 2016. M. aeruginosa Kützing was the most abundant cell in the blooms, accordingly microscopically analysis. For isolation, samples of 10 mL of bloom were incubated in 250 mL of Blue Green medium BG11 (SIGMA-ALDRICH, St. Louis, MO, USA) [12] in 1 L Erlenmeyer flasks with a photoperiod of 20 h/4 h light 930 lux/dark at 25 °C under continuous aeration using an air pump (Resum Air pump AC 9904, Cranbury, NJ, USA), for seven days. Then, 100 mL of culture were centrifuged at 6000 rpm for 5 min, and the supernatant was transferred to 300 mL of BG11 medium for another seven days to reduce contamination. Finally, 10 mL of the new culture were taken and incubated again in the same culture medium. For culture maintenance, the same initial conditions were followed and every 72 h the medium was replaced.
2.2. Substances
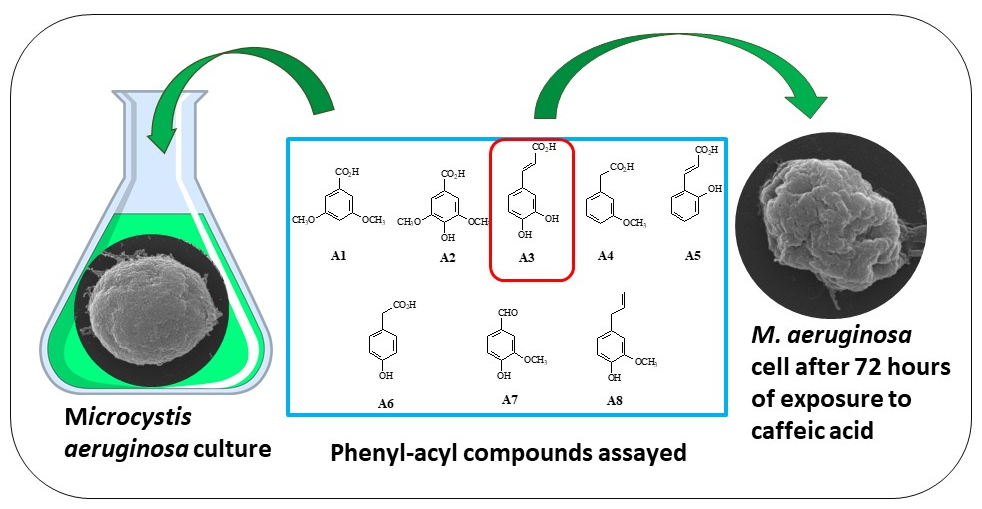
The following substances were obtained from SIGMA-ALDRICH (St. Louis, MO, USA): 3,5-dimethoxybenzoic acid (A1, the code in this text), syringic acid (A2), caffeic acid (A3), 3-methoxyphenylacetic acid (A4), 2′-hydroxycinnamic acid (A5), 4′-hydroxyphenylacetic acid (A6), vanillin (A7), eugenol (A8), and, for copper sulfate, Cu(SO)4 was assigned code A9 (Figure 1). The MC-LR standard was obtained from MP Biomedicals, LLC (Illkirch, France).
2.3. The Growth Inhibition Test
The inoculants for the inhibition tests were prepared from eight-day cultures of M. aeruginosa Kützing in the exponential phase. For this purpose, 20 mL of the culture was taken, and then 200 mL of culture medium (BG11) containing each substance at different concentrations (100 mg/L (C3), 50 mg/L (C2), and 25 mg/L (C1)) were added; the cultures were maintained under the same initial conditions for 72 h. After that, samples were taken for growth measurements through cell counts and the Chl a level at 0 h and after 72 h of culture. The percentage of inhibition was calculated using the following formula: % cyanobacterial inhibition = (1 − treatment/control) × 100, where the treatment and control are the cell densities of M. aeruginosa Kützing exposed and not exposed to different substances, respectively. Finally, the samples were refrigerated for 12 h before lyophilization and then extracted with methanol for the detection of MCs by HPLC/DAD (Diode Array Detector) and HPLC/MS. Each treatment was performed in triplicate, and two growth controls were prepared, one of them with copper sulfate, and the other without substances.
2.3.1. Cell Counts
For the cell counts, 200 μL of M. aeruginosa Kützing cultures treated with substances were collected and diluted in distilled water to the desired concentration. The counts were performed using a Neubauer chamber under an optical microscope (Nikon, YS2-H, Tokyo, Japan). To calculate the number of cells per mL, the chamber dilution factor was considered. To determine the total number of cells after exposure to each substance, the number of final cells was subtracted from the initial cell number. The cell counts were evaluated by two independent observers and performed in triplicate and repeated four times.
2.3.2. The Chl a Measurement
Chl a fluorescence was used as a proxy for the estimation of M. aeruginosa Kützing biomass (µg Chl a/L) [13]. Chl a was measured using a Fluorometer (FluoroProbe III, bbe-Moldaenke, Schwentinental, Germany) with an integrated correction factor for colored dissolved organic matter (CDOM) to compensate for UV-LED radiation interference. This instrument measures the fluorescence of Chl a in the photosystem II after excitation with five light diodes (370, 470, 525, 570, 590, and 610 nm) with a resolution of 0.01 μg Chl a/L.
2.4. Morphological Observations under the Optical Microscope and the Scanning Electron Microscope (SEM)
Each culture that had been exposed to the different substances was observed under optical microscope to identify changes in cell morphology, colony appearance, and the presence of mucilage. For this purpose, acid staining using China ink was performed [14], and M. aeruginosa Kützing cells were placed on 1 cm2 plates and fixed with 2.5% glutaraldehyde for 12 h for a SEM (JEOL, JEOL JSM 6490 LV, Tokyo, Japan) analysis. Then, cells were washed three times consecutively with Sorensen’s phosphate buffer at neutral pH, followed by distilled water, and subsequently dehydrated by washing with 50%, 75%, 95%, and 100% ethanol. After that, the samples were fixed onto a graphite tape and a thin gold coating (Au) was applied (Denton Vacuum, Denton Vacuum Desk IV equipment, Moorestown, NJ, USA). Finally, they were analyzed by scanning electron microscopy to obtain high-resolution images. A secondary electron detector was used to evaluate the morphology and topography of the samples.
2.5. The Effect of Phenyl-Acyl Compounds on Toxin Concentration
The MCs were analyzed in a Gilson 305 and 306 HPLC with a diode array detector (DAD) using a Luna C-18 column (4.6 x 150 mm, 5 μm, Phenomenex, Torrance, CA, USA) with a mobile phase containing water acidified with 0.05% of TFA (trifluoroacetic acid) in pump A, and acetonitrile that had been acidified in the same way in pump B. The gradient was increased from 10% to 60% of B for 25 min, followed by 10 min at 100% of B, and, finally, returning to the initial conditions (10% of B) [15]. A 1 min flow was used, and each run lasted for 40 min. The absorbance was monitored at 238 nm, and the injection volumes were 20 μL. Each sample was injected in triplicate, and the analyses were performed using the Gilson UniPoint software v1.8 (UniPoint, Winnipeg, MB, Canada).
2.6. The Analysis of the Redox Effect of Caffeic Acid on MC-LR by LC/Q-TOF (Liquid Chromatography/Quadrupole-Time of Flight)
To establish the mechanism of action of caffeic acid, 50 mg of pure caffeic acid was added to 200 mL of Milli-Q water containing 50 mL of a MC-LR toxin sample that had been extracted from the culture of M. aeruginosa Kützing; the mixture was maintained for 72 h with constant agitation. Then, a 30 mL sample was taken at 0, 24, and 72 h. The samples were adsorbed in to solid phase extraction C18 cartridges, eluted with methanol, concentrated under reduced pressure, and injected into an HPLC/HR-MS using a UHR-QTOF Impact II-Bruker (Ultrahigh Resolution Quadrupole Time-of-Flight, Bruker Corporatio, Billerica, MA, USA). The extracts were separated using a Chromolith High Resolution C18 column, Germany (50 × 4.6 mm), which was maintained at 40 °C. The mobile phase comprised Milli-Q water plus 0.1% formic acid (A) and acetonitrile plus formic acid 0.1% (B). The separation was performed using a gradient that increased from 5% B to 10% B for 1 min, followed by 50% (B) up to 4 min and up to 95% (B) at 6 min, and that finally returned to the initial conditions at 8 min. The auto-sampler was maintained at 10 °C always. Data were acquired in positive ion electrospray scanning mode from 50 to 2000 m/z with a 2 s/scan and a 0.1 s inter-scan delay. The ion source capillary and sampling cone parameters were 2.9 and 25 V, respectively. The desolvation temperature was 220 °C, and the source temperature was 80 °C. The cone gas and desolvation gas flows were 8 L h−1. A tuning mix solution was used as a calibrant. Instrument control and data acquisition (centroid) and processing were performed using the Bruker Compass DataAnalysis 4.3 software (Bruker Corporation, Billerica, MA, USA).
2.7. The Acute Toxicity Tests with D. pulex
Assays were carried out by exposing five neonates of D. pulex, aged <24 h old, to phenyl acyl compounds and copper sulfate. A total of 30 mL of growth medium, mixed with the substances, was added to each container containing D. pulex to a final concentration of 25, 50, and 100 mg/L. After 24, 48, and 72 h of exposure, the number of survivors in each test vessel was counted to identify the lethal concentration 50 (LC50). Analyses were done in triplicate for a total of 15 neonates; in addition, water was used as a negative control.
2.8. Data Analysis
Initially, a goodness-of-fit test (the Kolmogorov–Smirnov test) was performed to establish statistically significant differences in the cell density measurements that were obtained from the tests using different substances. A parametric variance analysis with a significance level of 0.05 was applied. In cases wherein statistically significant differences were found, a comparison analysis of multiple ranges was performed to determine which samples were different from each other. To establish correlations between different cell density measurements, a Spearman correlation analysis with a significance level of 0.05 was applied using the statistical package Statgraphics Centurion XVI (Statgraphics.Net, Madrid, Spain).
The LC50 was determined from the acute toxicity results, and the IBM SPSS Statistics 21 software (IBM, Armonk, NY, USA) was used as an analytical tool.
3. Results
3.1. Growth Inhibition of M. aeruginosa Kützing
The effects of the substances on the cultures of M. aeruginosa Kützing were assessed in two ways (Figure 2): cell density measurements and Chl a quantities. Caffeic acid and eugenol were powerful inhibitors in both parameters at 50–100 mg/L; vanillin exhibited a medium inhibitory effect at both 50 mg/L and 100 mg/L.
However, a differential response was noticed when Chl a levels were considered. Syringic acid, 2′-hydroxycinnamic acid, and 4′-hydroxyphenylacetic acid were strong inhibitors of Chl a at the highest concentration. This seems to indicate a specific action in the levels of Chl a. Strangely, at a lower concentration, 3,5-dimethoxybenzoic acid, and especially syringic acid, were powerful promotors of M. aeruginosa Kützing growth. As might be expected, copper sulfate caused 100% inhibition; this compound has been conventionally used to control blooms in reservoirs for several years [16].
3.2. The Analysis of Morphology of M. aeruginosa Kützing by Microscopy
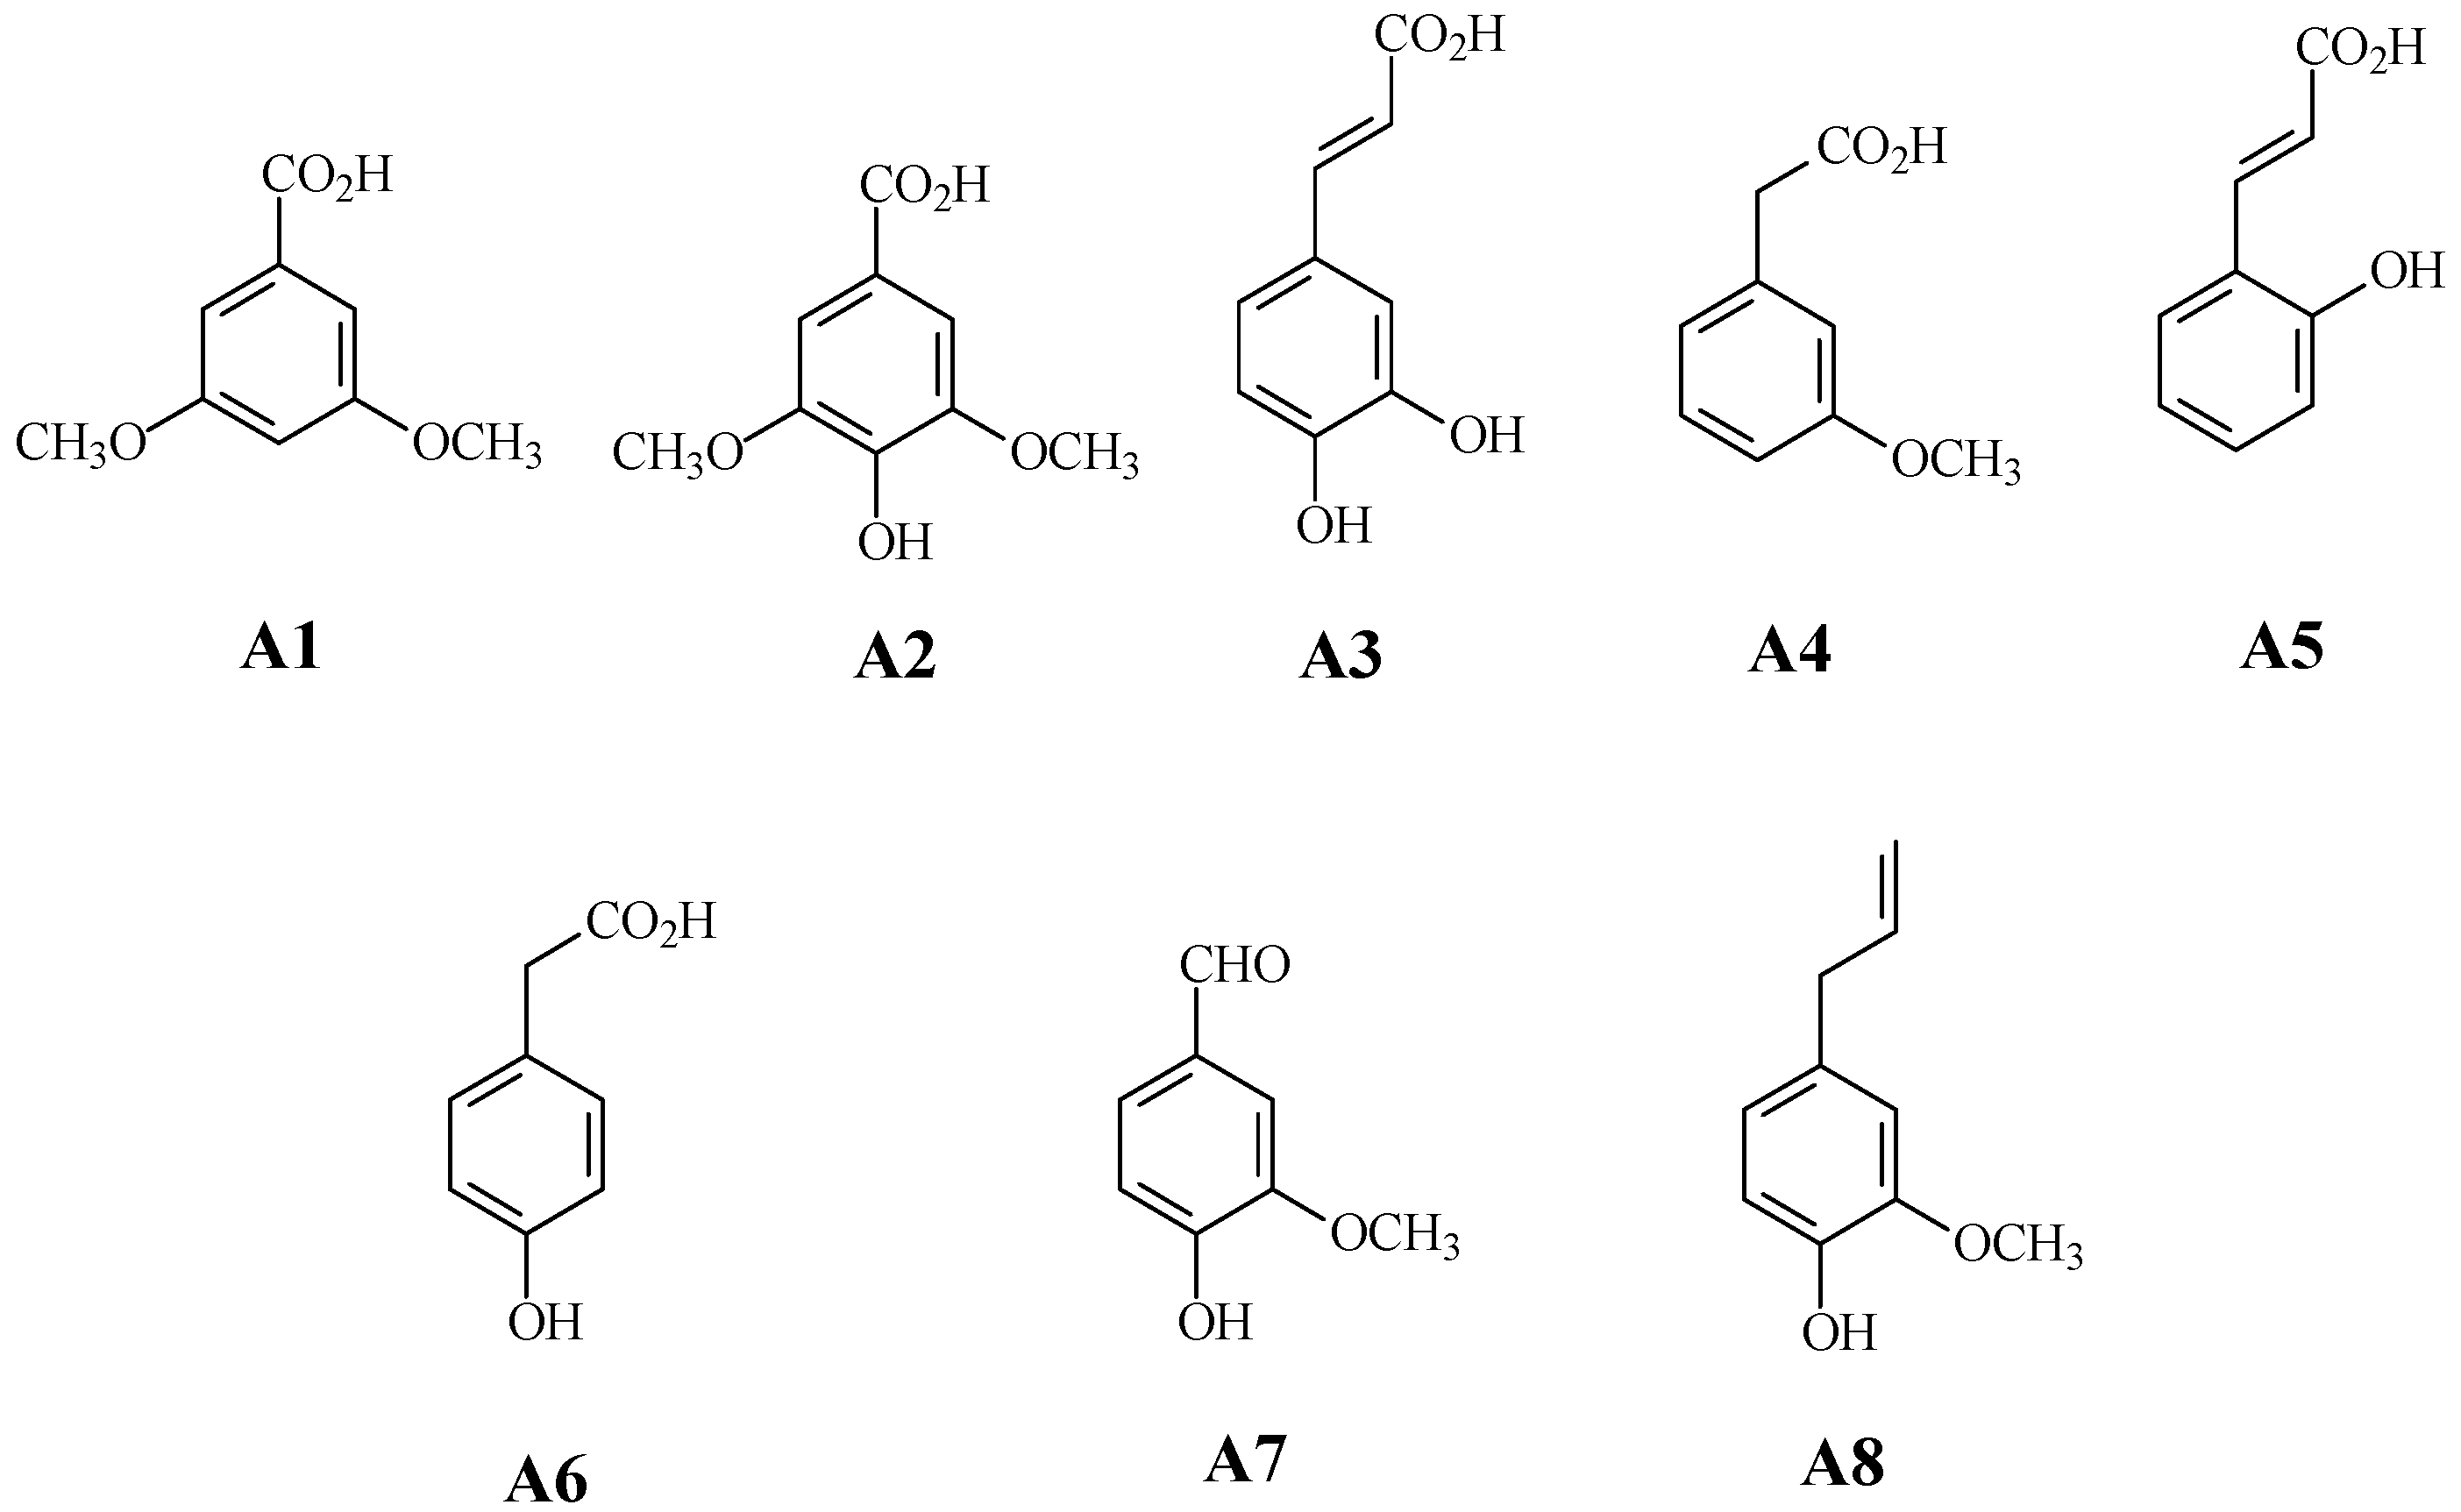
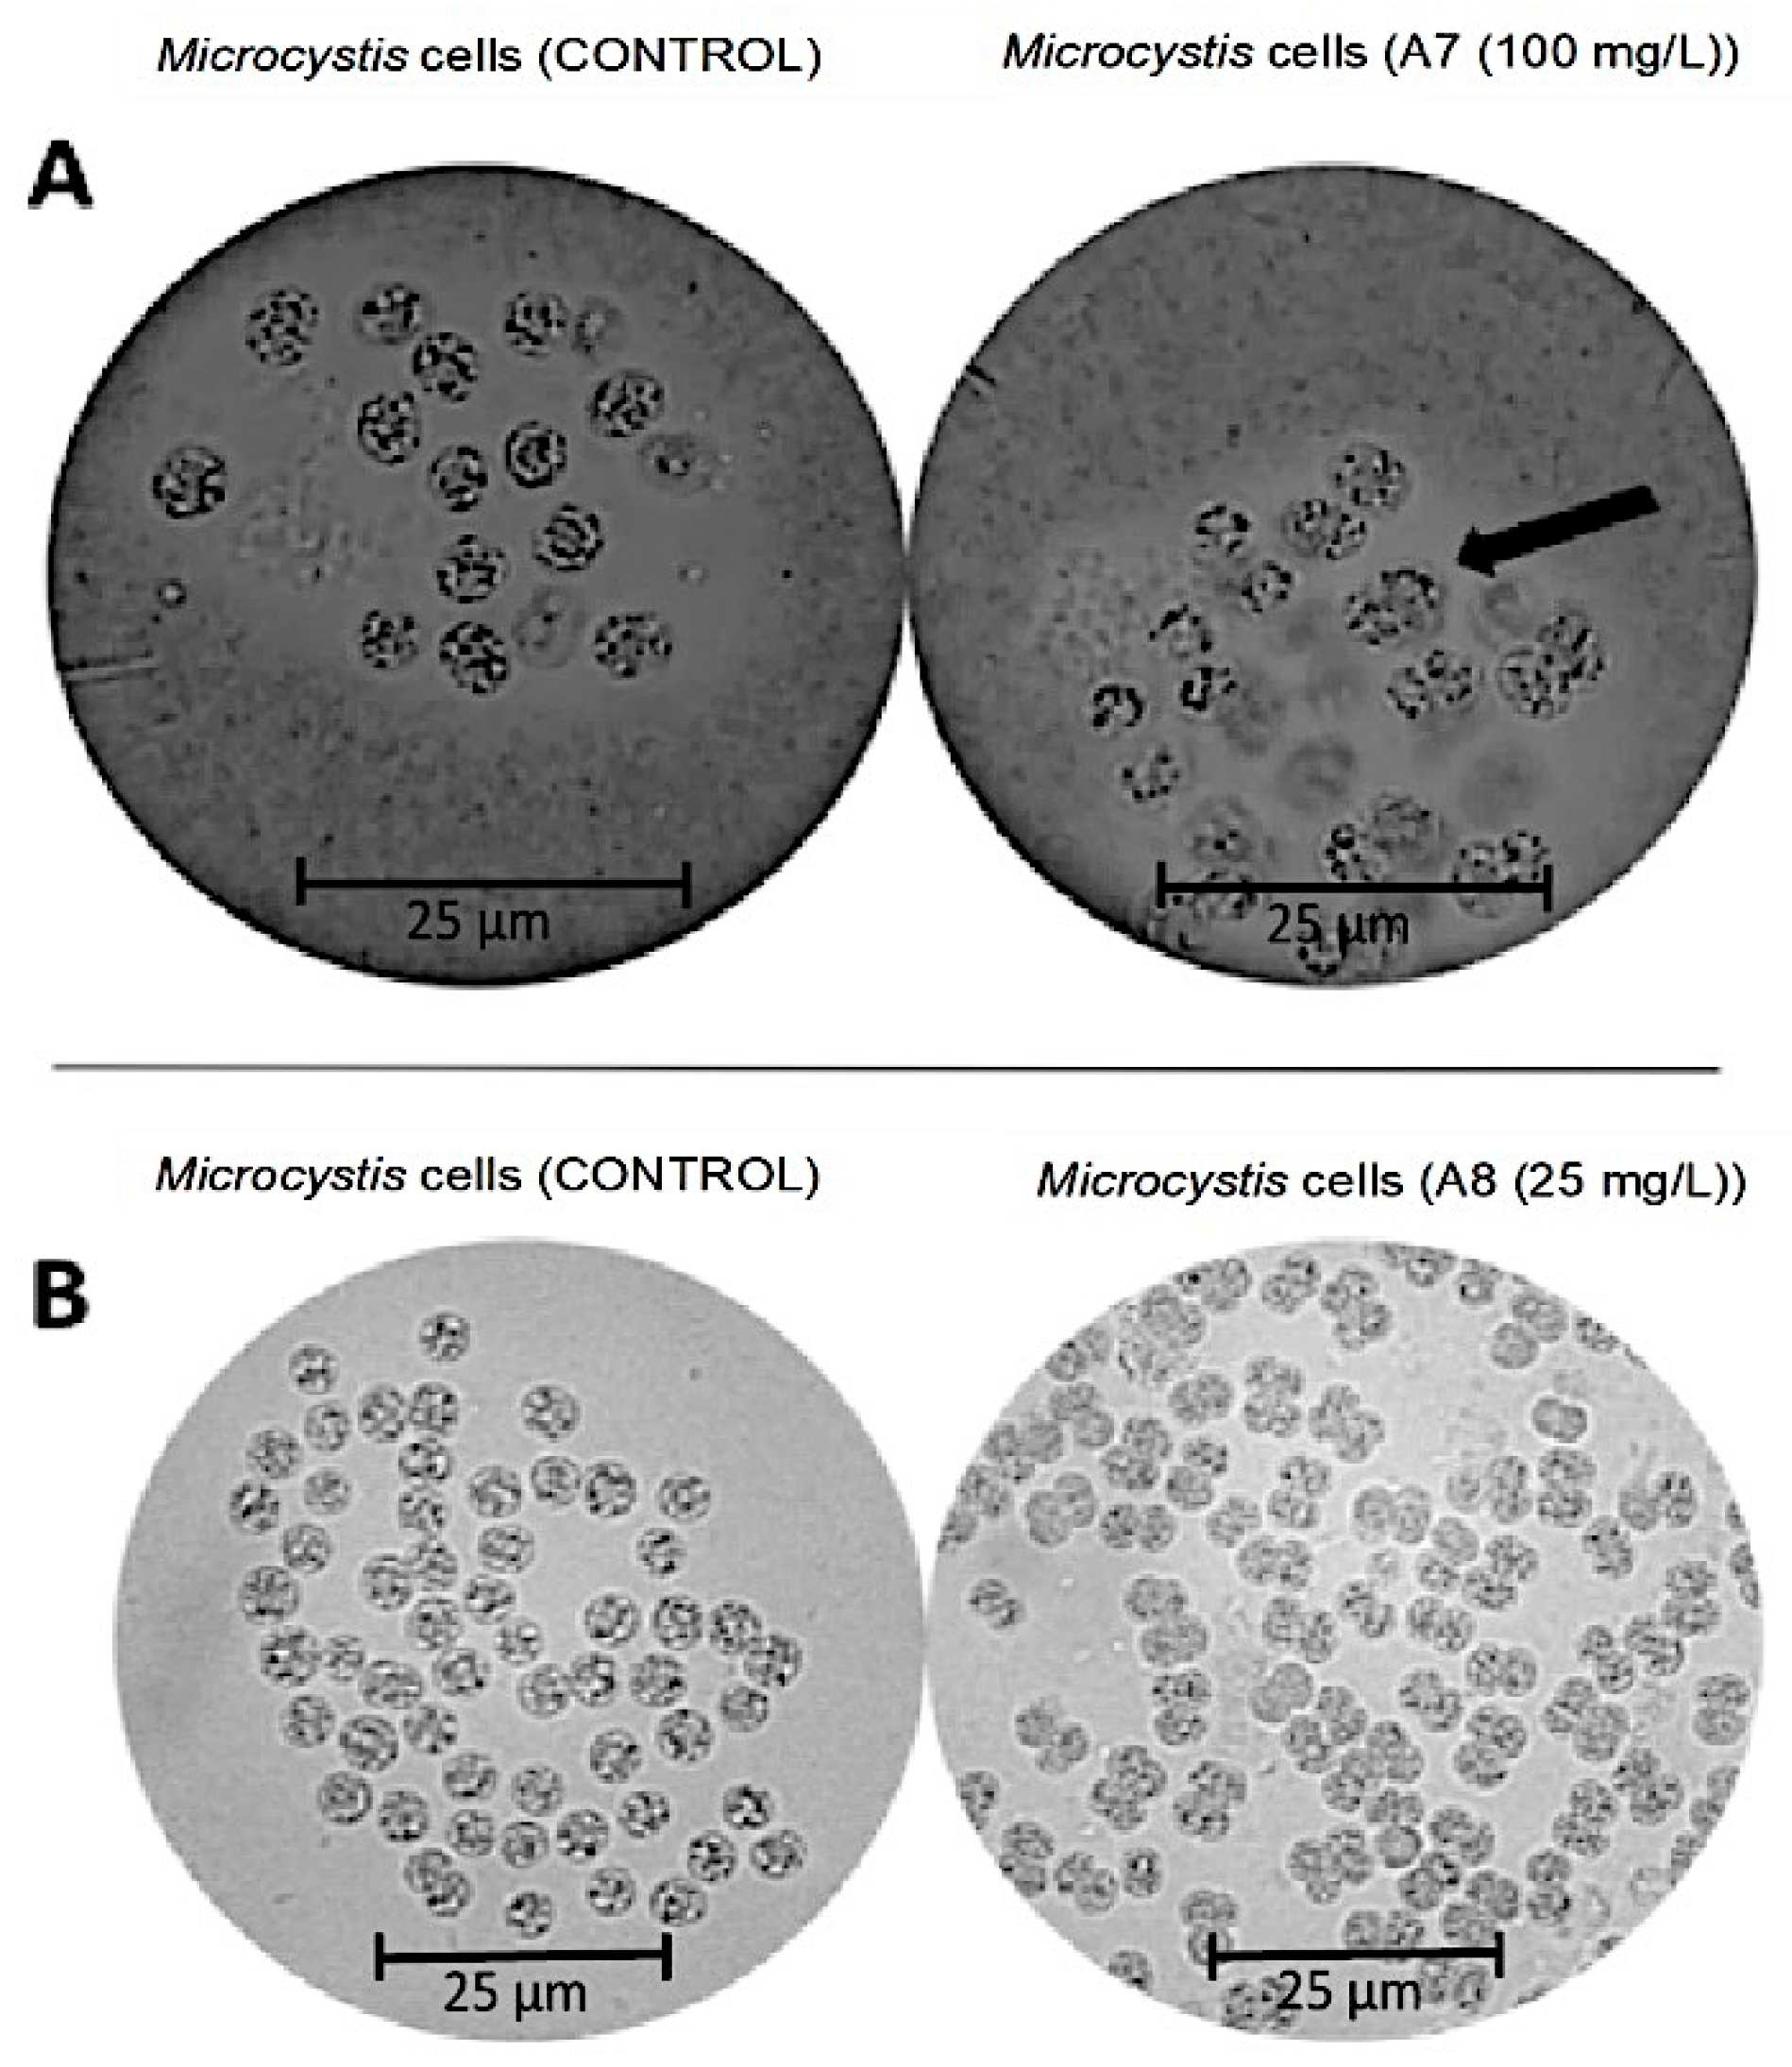
The effect of the more active compounds (caffeic acid, eugenol, and vanillin) on M. aeruginosa Kützing was identified through a microscopy analysis. Several changes in the structure of the M. aeruginosa Kützing cells were observed under optical microscopy. A delayed cell division behavior was noticed 72 h after treatments with vanillin (Figure 3A) and eugenol (Figure 3B) at 100 mg/L. Moreover, optical microscopy evidenced changes in the cellular division of M. aeruginosa Kützing, since normal conditions produce symmetrical sister cells, but environmental perturbations increase the asymmetry between sister cells; when cells of M. aeruginosa Kützing were exposed to vanillin and eugenol, this effect was noticed as shown in Figure 3.
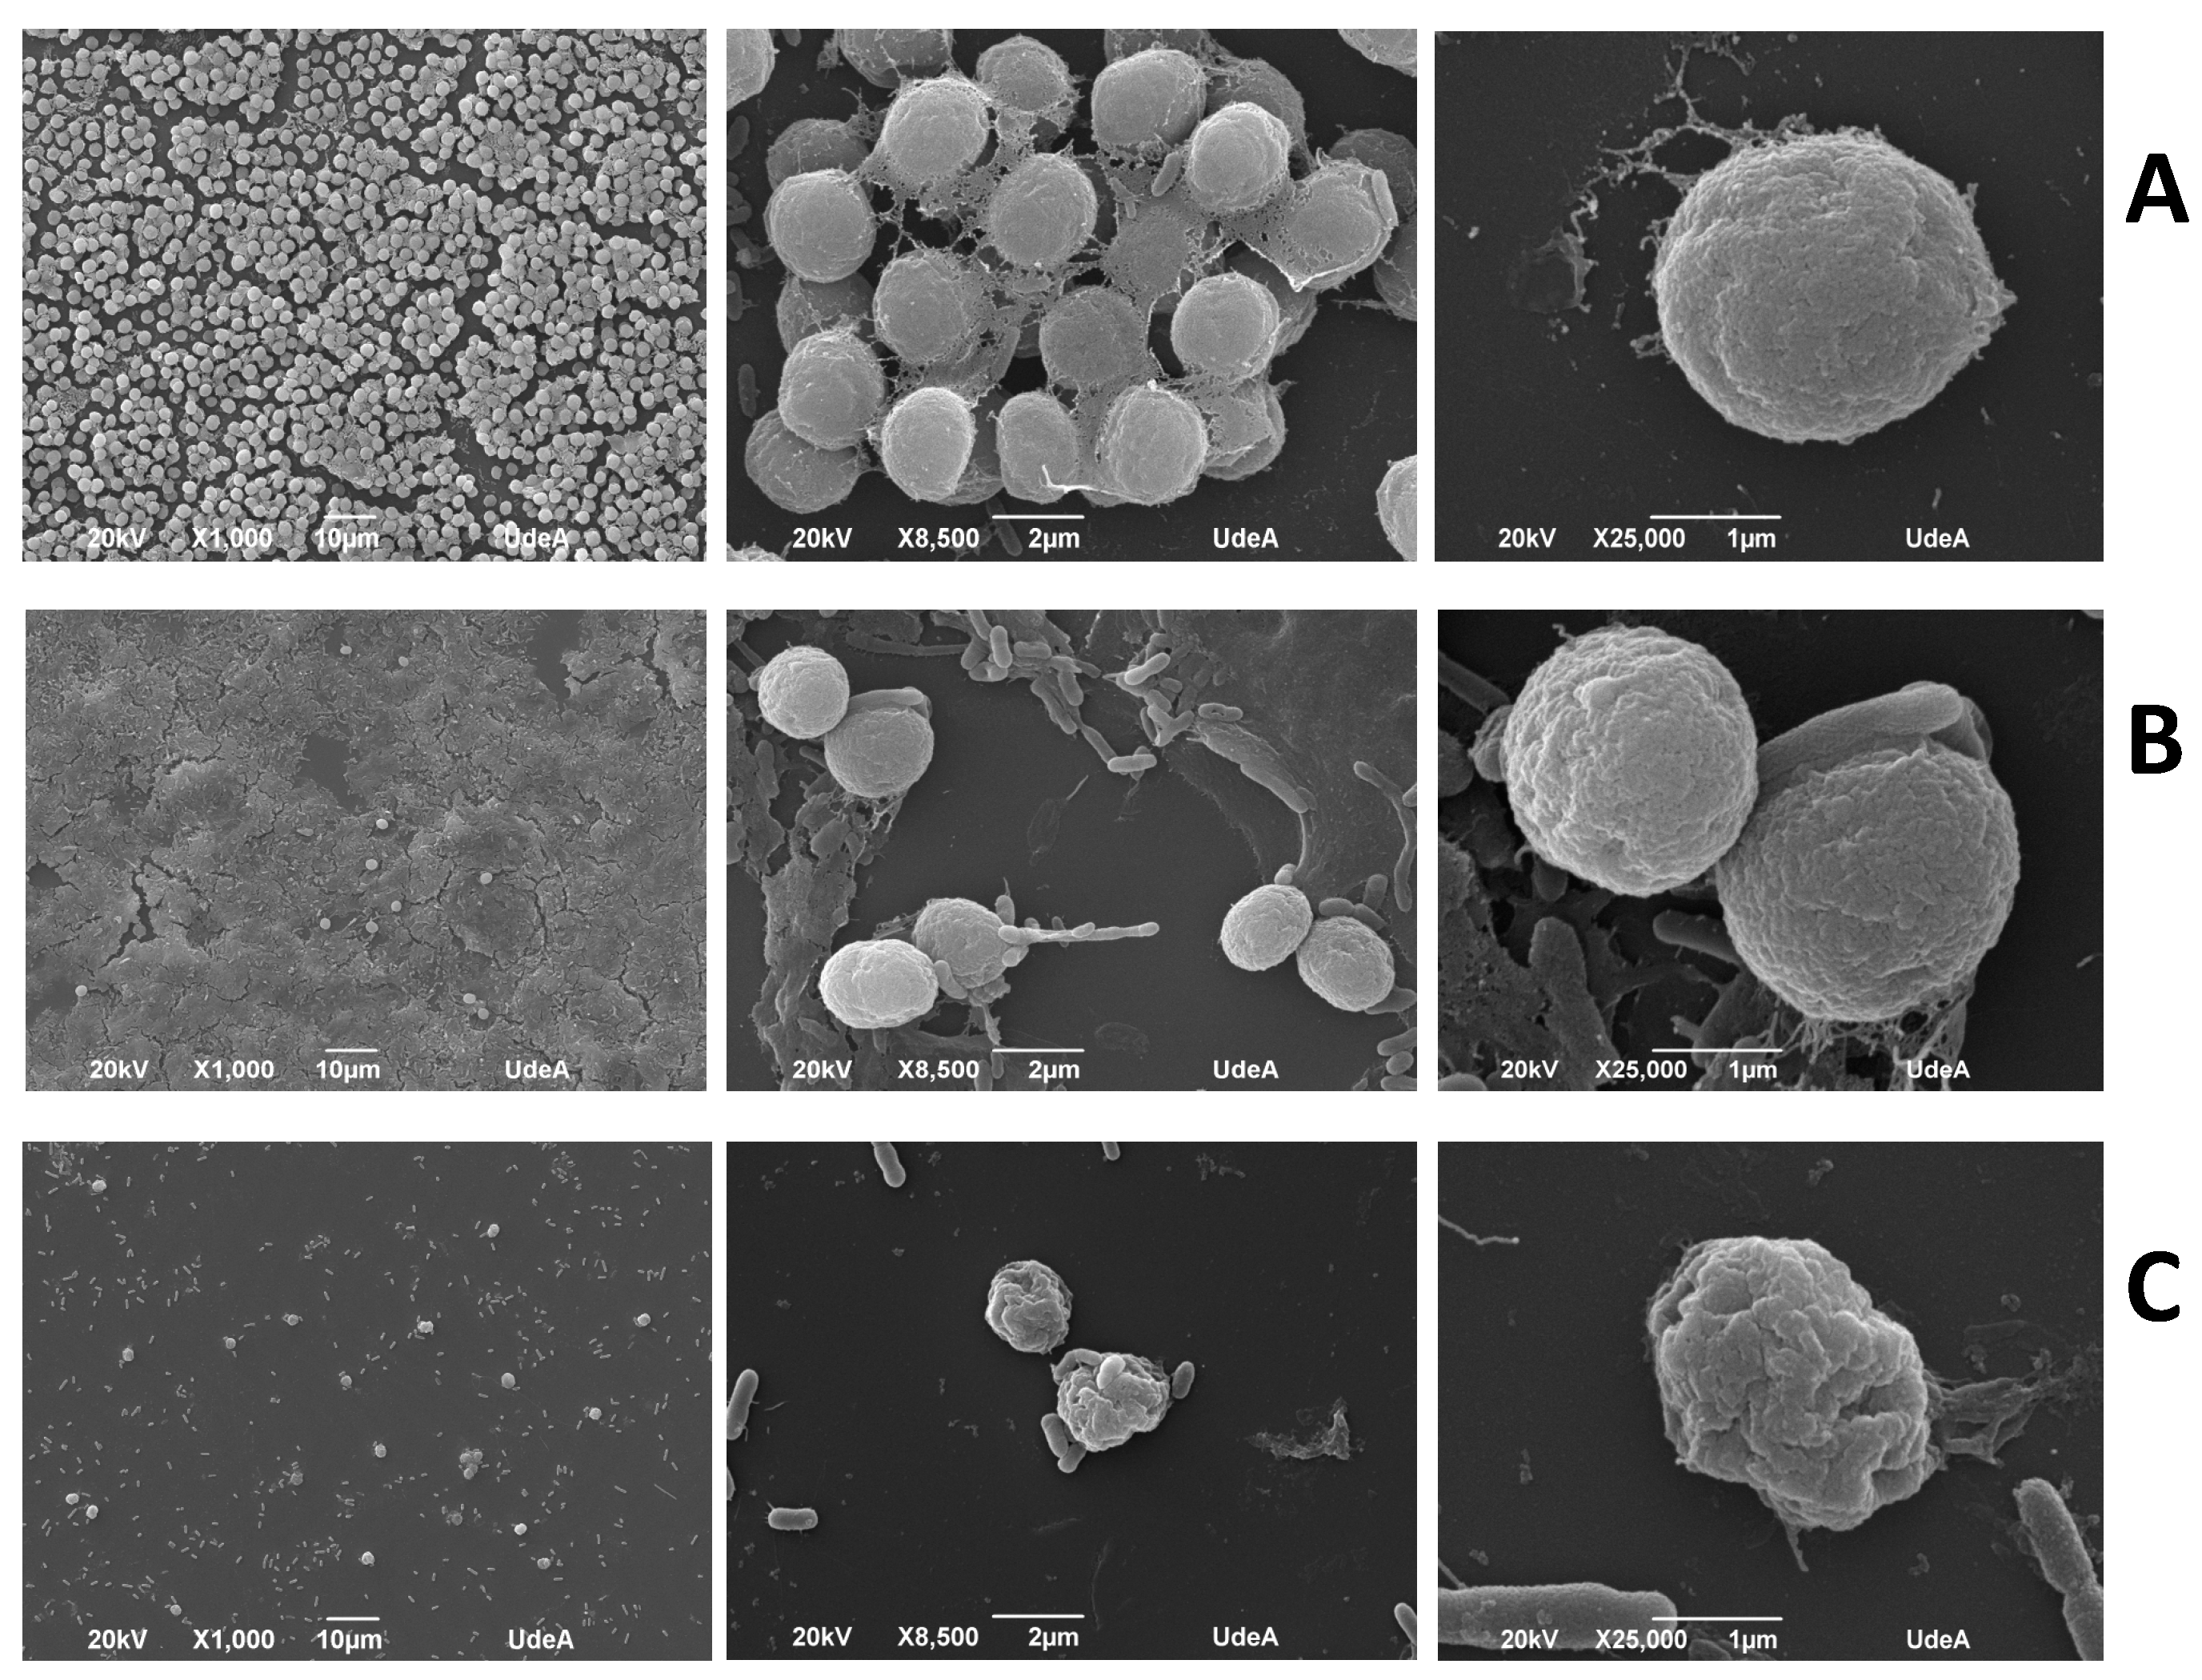
In the SEM images, M. aeruginosa Kützing cultures treated with vanillin and caffeic acid showed significant changes in their morphology. In the first instance the control sample (Figure 4A) displayed well-formed and homogeneous cells embedded in a mucilage. In samples treated with vanillin (Figure 4B), the colony had partially lost its integrity and scattered cells can be seen in small groupings on a disintegrated mucilage. In cultures treated with caffeic acid (Figure 4C), the effects were more severe because mucilage was not appreciated, and the cells seem to have been lysed.
3.3. The Effect of Phenyl-Acyl Compounds on MC-LR Production
Through an HPLC-DAD analysis, the main toxin in M. aeruginosa Kützing was found to be MC-LR. To establish the effect of the compounds on the MC-LR level, we chose three compounds: syringic acid at non-growth inhibitory concentrations and caffeic acid and eugenol, which are powerful growth inhibitors and were found to reduce the levels of Chl a.
MC-LR concentrations were reduced after exposure to syringic acid by up to 77% at 50 mg/L and 84% at 100 mg/L, to caffeic acid by up to 89% at 50 mg/L and 100% at 100 mg/L, and after exposure to eugenol by up to 27% at 25 mg/L and 85% and 93% at 50 and 100 mg/L, respectively (Figure 5). A decrease in the toxin level could be explained based on the reduction of M. aeruginosa Kützing growth.
3.4. The Analysis of the Redox Effect of Caffeic Acid on MC-LR by LC/Q-TOF
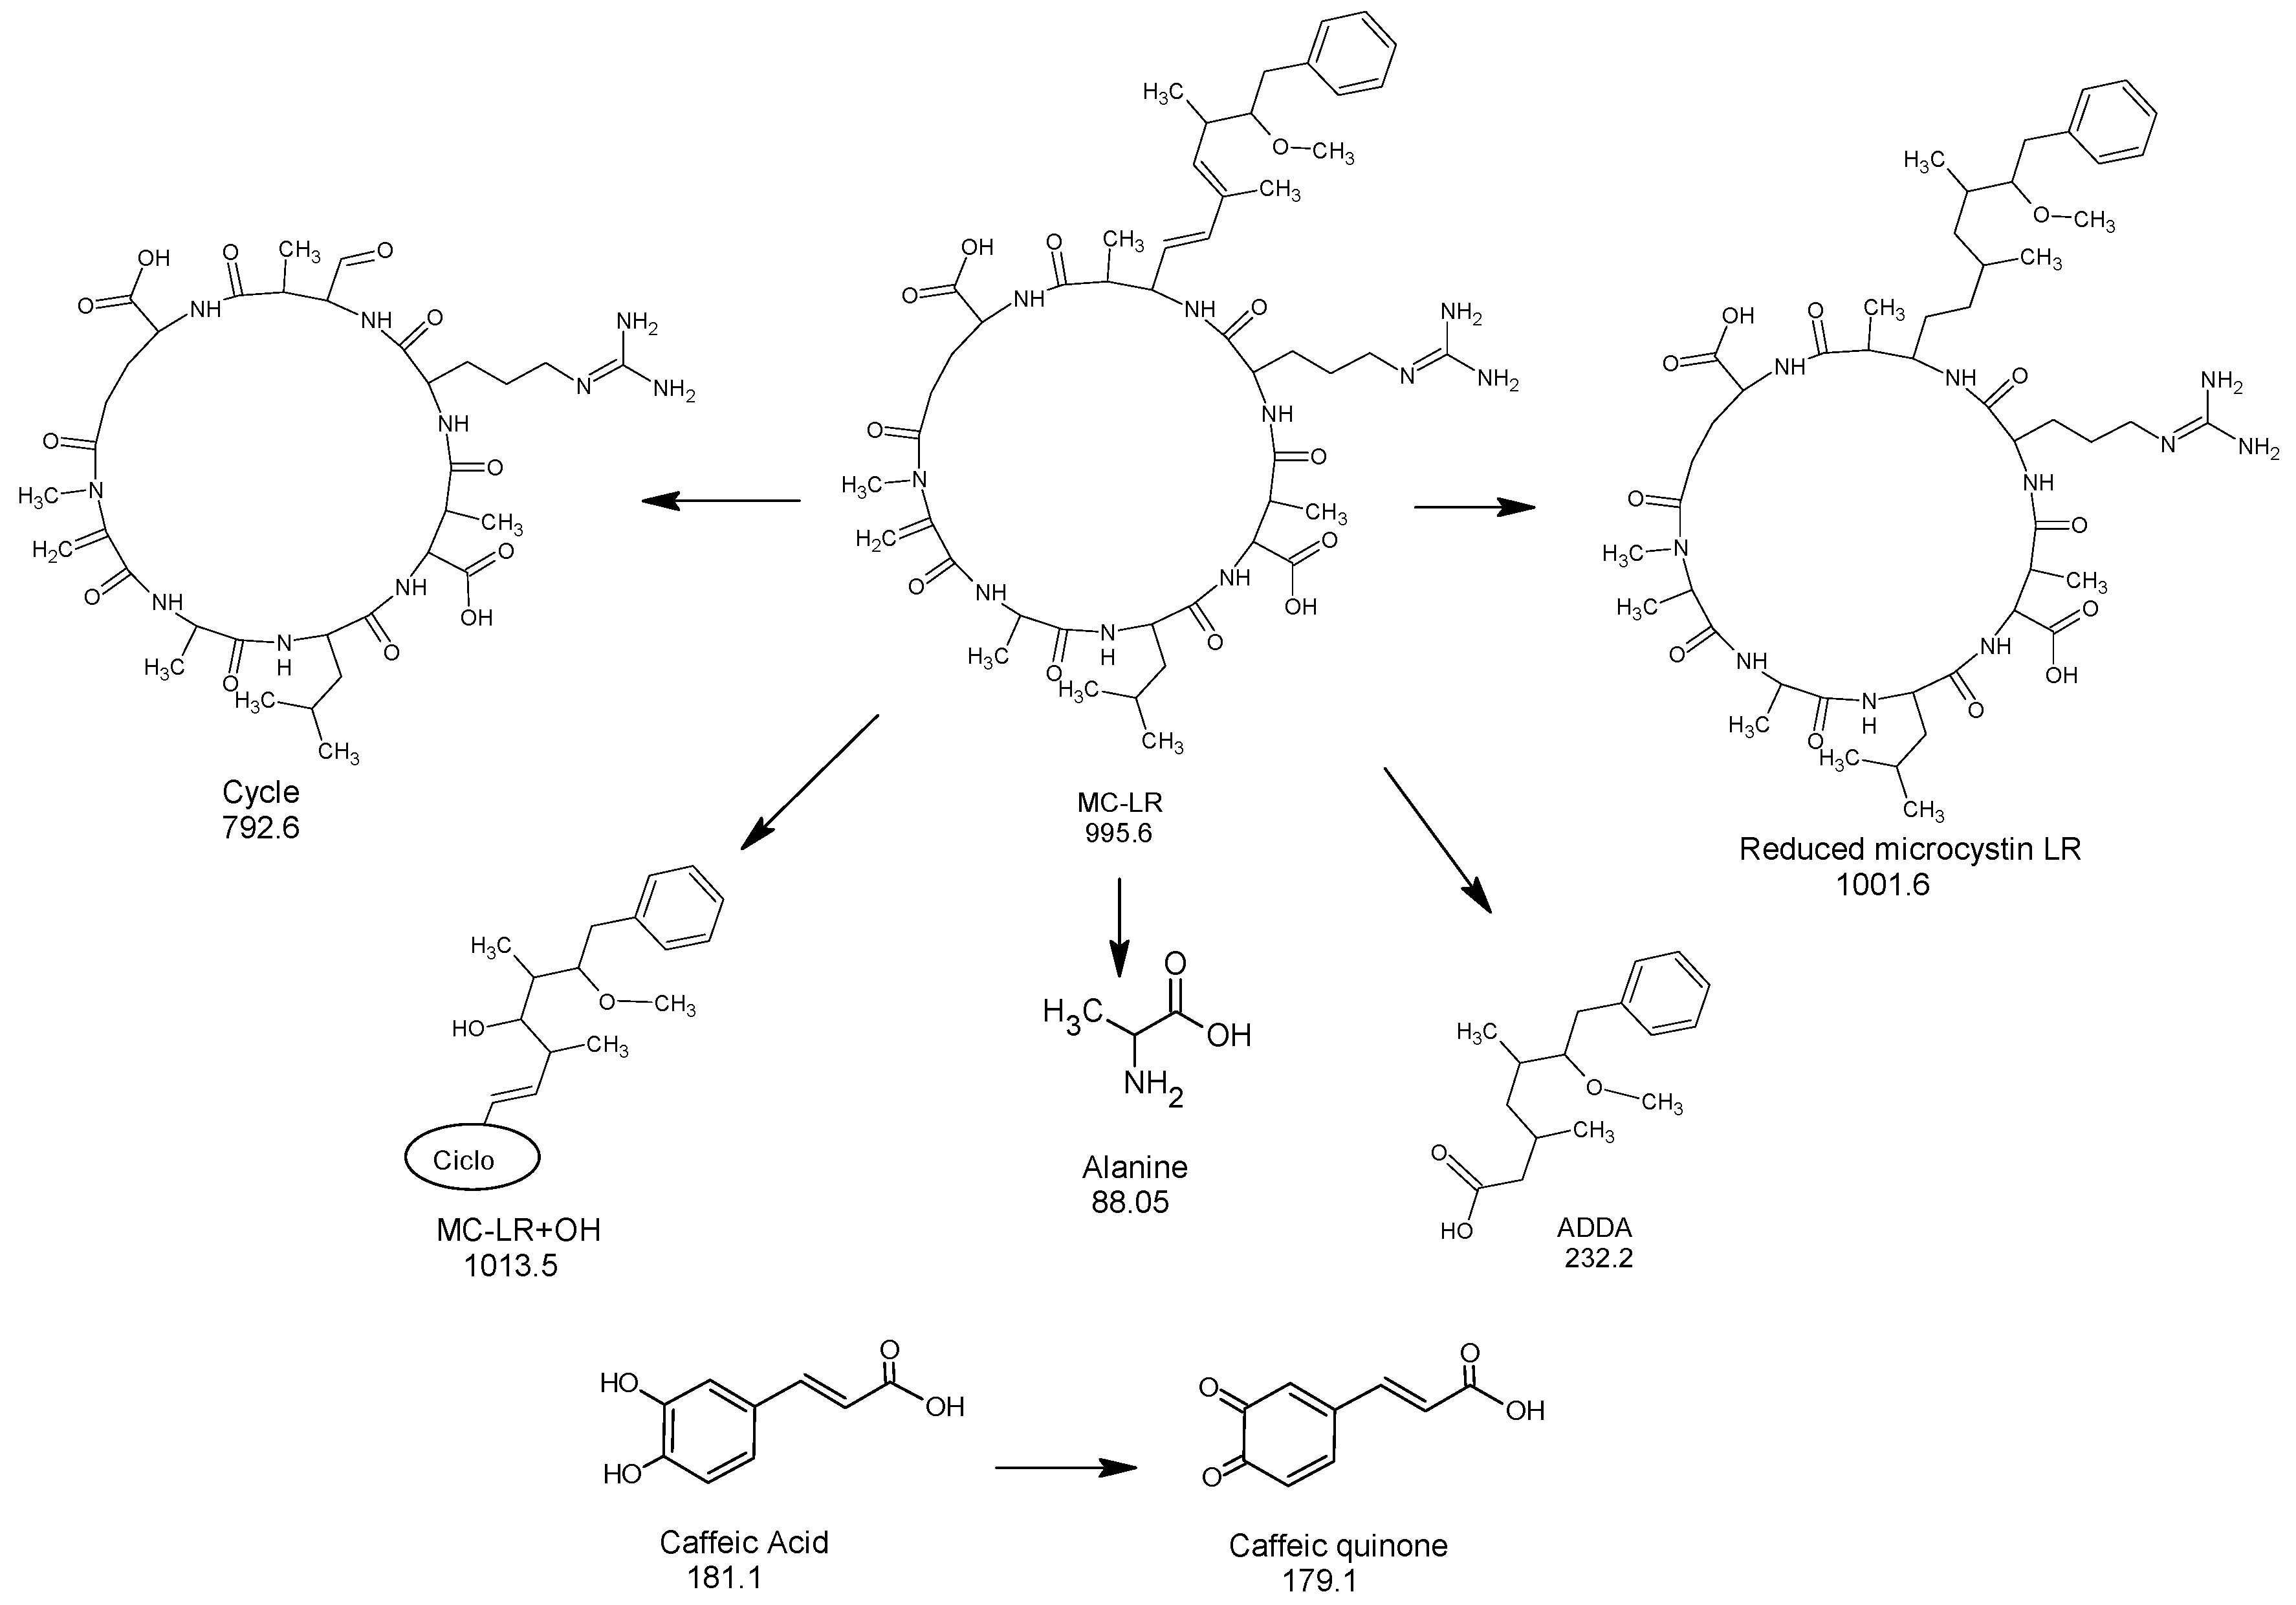
It is widely known that phenols possess a high redox capability, and because of that are tested like antioxidants. Several hours after mixing caffeic acid with MC-LR toxin, a grayish color had developed in the solution, which intensified over time, and changes in both compounds were observed through HPLC/MS. After 72 h, the presence of caffeic acid was detected by a peak at m/z 181.1; however, another substance with a peak at m/z 179.1 was also observed that corresponded to the quinone of caffeic acid by oxidation of the orto-dihydroxy system. Similarly, a peak at m/z 995.6 was assigned to the MC-LR toxin, and a peak at m/z 1001.5 to a new compound formed by reduction of the quinone of caffeic acid (Figure 6).
In addition, other molecules formed by degradation of the original toxin were identified, such as the peaks at m/z 88.05 and 135.1, which were assignable to an alanine and a part of the side chain ADDA, respectively. Besides this, the peaks at m/z 792.6 and 232.2 seem to indicate an oxidative breaking of ADDA.
3.5. Toxicological Effects
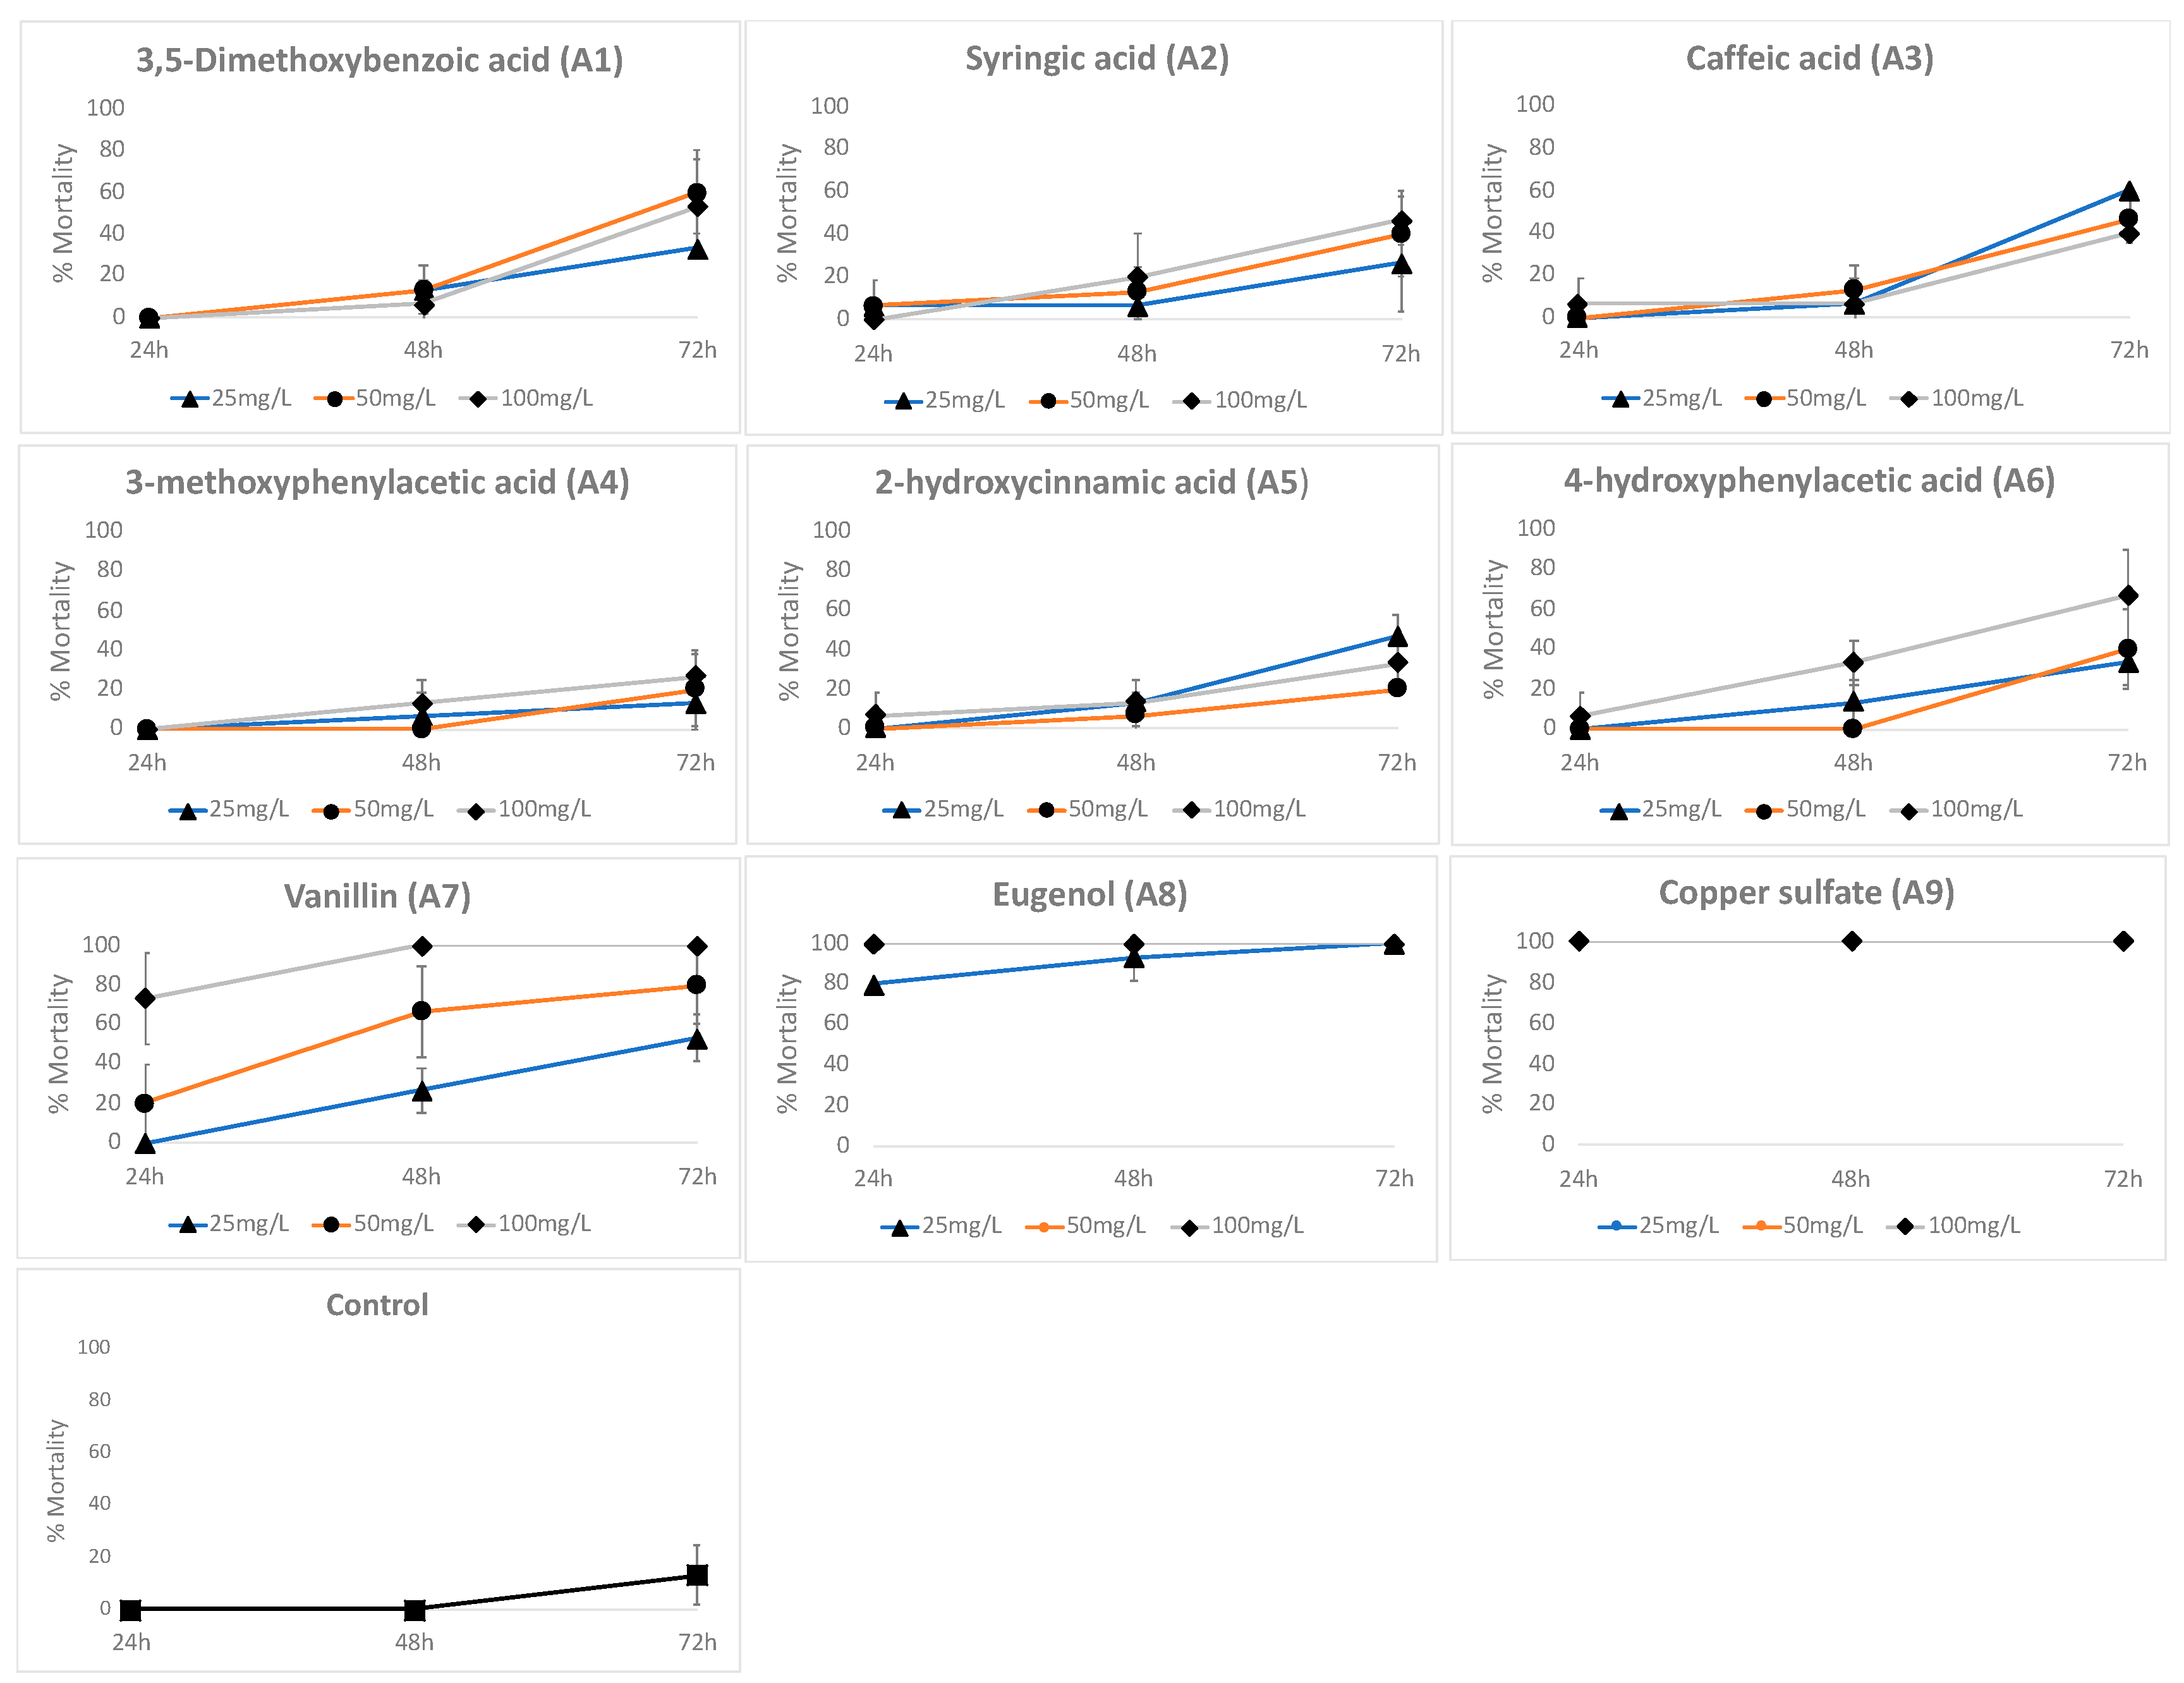
To establish the toxicity of the phenyl-acyl compounds, D. pulex neonates were used. 3,5-dimethoxybenzoic acid, syringic acid, caffeic acid, 3-methoxyphenylacetic acid, 2′-hydroxycinnamic acid, and 4′-hydroxyphenylacetic acid caused less than 10% mortality in the first 24 h. After 48 h, 4′-hydroxyphenylacetic acid caused close to 40% mortality, and the other compounds caused less than 20% mortality (Figure 7). However, eugenol and copper sulfate exhibited high neonate mortality: 80% to 100% at 24 h and 100% at 48 h at the concentrations of 25, 50, and 100 mg/L. For vanillin, mortality was 100% at 48 h at 100 mg/L. Table 1 shows the LC50 results; some data were not estimated statistically because, under the treatment, all neonates either died (eugenol) or survived in the control (water).
4. Discussion
Currently, several strategies are used to control Microcystis blooms and toxins, ranging from the application of dangerous copper salts to ultrasound and adsorption on materials such as activated carbon [17]. In this research, eight phenyl-acyl compounds were assayed as inhibitors of M. aeruginosa Kützing growth and toxin production. Eugenol, caffeic acid, and vanillin showed inhibition activities of 100%, 75%, and 50%, respectively, at 50 mg/L. The effects on the growth of M. aeruginosa Kützing were assessed through cell count and Chl a analysis; however, these results were not comparable. Therefore, there was a lack of correlation between cell counts and Chl a levels, which was possibly due to the different mechanisms of action in M. aeruginosa Kützing.
The production of Chl a was completely inhibited by syringic acid, 2′-hydroxycinnamic acid, and 4′-hydroxyphenylacetic at 100 mg/L, while, according to the cell count, there was close to 45% inhibition. A probable mechanism of action of these compounds could involve oxidative damage to Chl a through the inhibition of antioxidant enzymes [18]. The other substances, 3,5-dimethoxybenzoic acid and 3-methoxyphenylacetic acid, were weak growth promotors; however, there are no data on the effect of these substances as inductors of cyanobacteria growth or their role in the formation of blooms. In the same way, some phenols, such as those that originate from the decomposition of organic matter, have also shown an effect on the development of cyanobacterial blooms [11,19].
According to these results, caffeic acid was the best M. aeruginosa Kützing growth inhibitor. It reduced the level of MC-LR and was practically a non-toxic substance, since overall survival was observed in D. pulex neonates, which survived when exposed to all concentrations; the effects that were noticed after 48 h may be caused by starvation. This harmless effect has been previously reported for this type of compound in Danio rerio [20]. However copper sulfate, which is recommended as an algicide, is toxic to many other species in aquatic environments [16,21].
Regarding the mechanism of action of these compounds, caffeic acid seems to involve a redox mechanism to degrade MC-LR, which was detected by means of direct observation of the color of the solution and HPLC/MS. Some authors have already proposed the use of phenolic acids to inhibit M. aeruginosa growth [20,22,23]. It has been suggested that the autoxidation of phenols induces inhibitory effects by the production of free radicals [24] with the generation of radical superoxide anions. In this way, they can induce a lipid peroxidation that affects cell membrane permeability and causes the death of M. aeruginosa Kützing [20]. Similarly, rice straw extracts that contain this same type of phenolic acid were shown to provoke changes in the antioxidant enzyme system in the cells of results cyanobacteria, such as M. aeruginosa Kützing, thereby suspending their growth and causing cell death [25].
In addition, several of the assayed molecules also seem to act at the stage of formation of the mucilage, which is mainly composed of exopolysaccharides, and whose main function is the agglutination and protection of the colonies [26,27]. These results are in accordance with the SEM images (Figure 4C) because damage to the membrane and changes in the mucilage’s stability were also observed under caffeic acid treatment. In addition, vanillin and eugenol caused delays in cell division, since dividing cells were detected after 72 h of treatment (Figure 3A,B). These same substances also caused asymmetry between sister cells, an effect that has already been reported for M. aeruginosa Kützing under treatment of copper sulfate and the herbicide diuron, and could be an indicator of environmental disturbance [28].
About the effect of caffeic acid, the fragmentation patterns of MC-LR toxin agree with previous reports [29]. However, the exact mechanism of the MC-LR toxin’s transformation needs to be elucidated, including the residues in the molecule that are reduced by caffeic acid and the kinetics of the process. These findings open new perspectives on the elimination of MC-LR toxins in potable reservoirs contaminated with cyanobacterial blooms, based on a chemical or physical redox process.
Cyanobacteria blooms develop quickly in large areas that contain millions of hectoliters of water; therefore, the application of substances for their control could be related to an early detection method. Otherwise, the amounts of required inhibitory substances would be too large and possibly affect the water’s quality and increase costs. Therefore, knowledge about the effects and the mechanism of action of these types of substances can generate information about new control methods as well as provide additional data about the chemical, biological, and physical agents that trigger the blooms. Thus, exogenous substances and products from industrial activity or vegetal biomass decomposition in reservoirs could also elicit these blooms.
5. Conclusions
In this work, several effects were detected in M. aeruginosa Kützing after the application of several phenyl-acyl compounds. Some of them, such as caffeic acid, were inhibitory, while others were found to act as growth promotors. The activity of caffeic acid included changes in cell morphology and division and the formation of mucilage, while its mechanism of action on the MC-LR toxin seems to involve a degradative redox process. Molecules with promotor effects indicate the existence of other biochemical mechanisms in the blooms’ formation that are different from those that have traditionally been considered, such as edaphic factors and nutrient availability.
Author Contributions
Methodology: N.H., F.E.; Investigation: N.H., J.P.V., M.T.F.; Interpretations: N.H., M.T.F., F.E.; Writing: N.H., F.E.; Supervision N.H., F.E.
Funding
COLCIENCIAS-COLOMBIA (grant FP44842-049-2016).
Conflicts of Interest
The authors declare no conflict of interest.
References
- He, X.; Wert, E.C. Colonial cell disaggregation and intracellular microcystin release following chlorination of naturally occurring Microcystis. Water Res. 2016, 101, 10–16. [Google Scholar] [CrossRef] [PubMed]
- Azevedo, S.M.F.O.; Carmichael, W.W.; Jochimsen, E.M.; Rinehart, K.L.; Lau, S.; Shaw, G.R.; Eaglesham, G.K. Human intoxication by microcystins during renal dialysis treatment in Caruaru — Brazil. Toxicology 2002, 181–182, 441–446. [Google Scholar] [CrossRef]
- Su, J.; Yang, X.; Zhou, Y.; Zheng, T. Marine bacteria antagonistic to the harmful algal bloom species Alexandrium tamarense (Dinophyceae). Biol. Control 2011, 56, 132–138. [Google Scholar] [CrossRef]
- Padovesi-Fonseca, C.; Philomeno, M.G. Effects of algicide (copper sulfate) application on short-term fluctuations of phytoplankton in Lake Paranoá, central Brazil. Braz. J. Biol. 2004, 64, 819–826. [Google Scholar] [CrossRef] [PubMed]
- Carey, C. Resilience to Blooms Resilience to Blooms. Science 2015, 10–13. [Google Scholar] [CrossRef]
- Chen, Y.; Li, J.; Wei, J.; Kawan, A.; Wang, L.; Zhang, X. Vitamin C modulates Microcystis aeruginosa death and toxin release by induced Fenton reaction. J. Hazard. Mater. 2017, 321, 888–895. [Google Scholar] [CrossRef] [PubMed]
- Mohamed, Z.A. Macrophytes-cyanobacteria allelopathic interactions and their implications for water resources management — A review. Limnologica 2017, 63, 122–132. [Google Scholar] [CrossRef]
- Herrera, N.A.; Flórez, M.T.; Echeverri, L.F. Evaluación preliminar de la reducción de microcistina-LR en muestras de florecimientos a través de sistemas sedimentarios. Rev. Int. Contam. Ambient. 2015, 31, 405–414. [Google Scholar]
- Mucci, M.; Noyma, N.P.; de Magalhães, L.; Miranda, M.; van Oosterhout, F.; Guedes, I.A.; Huszar, V.L.M.; Marinho, M.M.; Lürling, M. Chitosan as coagulant on cyanobacteria in lake restoration management may cause rapid cell lysis. Water Res. 2017, 118, 121–130. [Google Scholar] [CrossRef]
- Lin, J.L.; Hua, L.C.; Hung, S.K.; Huang, C. Algal removal from cyanobacteria-rich waters by preoxidation-assisted coagulation–flotation: Effect of algogenic organic matter release on algal removal and trihalomethane formation. J. Environ. Sci. (China) 2018, 63, 147–155. [Google Scholar] [CrossRef]
- Lin, Y.; Chen, A.; Wu, G.; Peng, L.; Xu, Z.; Shao, J. Growth, microcystins synthesis, and cell viability of Microcystis aeruginosa FACHB905 to dissolved organic matter originated from cattle manure. Int. Biodeterior. Biodegrad. 2017, 118, 126–133. [Google Scholar] [CrossRef]
- Stanier, R.Y.; Kunisawa, R.; Mandel, M.; Cohen-Bazire, G. Purification and properties of unicellular blue-green algae (Order Chroococcales). Bacteriol. Rev. 1971, 35, 171–205. [Google Scholar] [CrossRef] [PubMed]
- Gregor, J.; Geriš, R.; Maršálek, B.; Heteša, J.; Marvan, P. In situ quantification of phytoplankton in reservoirs using a submersible spectrofluorometer. Hydrobiologia 2005, 548, 141–151. [Google Scholar] [CrossRef]
- Sant’Anna, C.L.; Azevedo, M.T.D.P.; Senna, P.A.C.; Komárek, J.; Komárková, J. Planktic Cyanobacteria from São Paulo State, Brazil: Chroococcales. Rev. Bras. Botânica 2004, 27, 213–227. [Google Scholar] [CrossRef]
- Aguete, E.C.; Gago-Martínez, A.; Leão, J.M.; Rodríguez-Vázquez, J.A.; Menàrd, C.; Lawrence, J.F. HPLC and HPCE analysis of microcystins RR, LR and YR present in cyanobacteria and water by using immunoaffinity extraction. Talanta 2003, 59, 697–705. [Google Scholar] [CrossRef]
- Kinley, C.M.; Iwinski, K.J.; Hendrikse, M.; Geer, T.D.; Rodgers, J.H. Cell density dependence of Microcystis aeruginosa responses to copper algaecide concentrations: Implications for microcystin-LR release. Ecotoxicol. Environ. Saf. 2017, 145, 591–596. [Google Scholar] [CrossRef]
- Şengül, A.B.; Ersan, G.; Tüfekçi, N. Removal of intra- and extracellular microcystin by submerged ultrafiltration (UF) membrane combined with coagulation/flocculation and powdered activated carbon (PAC) adsorption. J. Hazard. Mater. 2018, 343, 29–35. [Google Scholar] [CrossRef]
- Ni, L.; Rong, S.; Gu, G.; Hu, L.; Wang, P.; Li, D.; Yue, F.; Wang, N.; Wu, H.; Li, S. Inhibitory effect and mechanism of linoleic acid sustained-release microspheres on Microcystis aeruginosa at different growth phases. Chemosphere 2018, 212, 654–661. [Google Scholar] [CrossRef]
- Wang, W.; Zhang, Y.; Shen, H.; Xie, P.; Yu, J. Changes in the bacterial community and extracellular compounds associated with the disaggregation of Microcystis colonies. Biochem. Syst. Ecol. 2015, 61, 62–66. [Google Scholar] [CrossRef] [Green Version]
- Jin, P.; Wang, H.; Huang, W.; Liu, W.; Fan, Y.; Miao, W. The allelopathic effect and safety evaluation of 3,4-Dihydroxybenzalacetone on Microcystis aeruginosa. Pestic. Biochem. Physiol. 2017. [Google Scholar] [CrossRef]
- Zhou, C.; Huang, J.C.; Liu, F.; He, S.; Zhou, W. Effects of selenite on Microcystis aeruginosa: Growth, microcystin production and its relationship to toxicity under hypersalinity and copper sulfate stresses. Environ. Pollut. 2017, 223, 535–544. [Google Scholar] [CrossRef] [PubMed]
- Mecina, G.F.; Dokkedal, A.L.; Saldanha, L.L.; Chia, M.A.; Cordeiro-Araújo, M.K.; do Carmo Bittencourt-Oliveira, M.; da Silva, R.M.G. Response of Microcystis aeruginosa BCCUSP 232 to barley (Hordeum vulgare L.) straw degradation extract and fractions. Sci. Total Environ. 2017, 599–600, 1837–1847. [Google Scholar] [CrossRef] [PubMed]
- Zhang, C.; Ling, F.; Yi, Y.L.; Zhang, H.Y.; Wang, G.X. Algicidal activity and potential mechanisms of ginkgolic acids isolated from Ginkgo biloba exocarp on Microcystis aeruginosa. J. Appl. Phycol. 2014, 26, 323–332. [Google Scholar] [CrossRef]
- Nakai, S.; Inoue, Y.; Hosomi, M. Algal growth inhibition effects and inducement modes by plant-producing phenols. Water Res. 2001, 35, 1855–1859. [Google Scholar] [CrossRef]
- Hua, Q.; Liu, Y.-G.; Yan, Z.-L.; Zeng, G.-M.; Liu, S.-B.; Wang, W.-J.; Tan, X.-F.; Deng, J.-Q.; Tang, X.; Wang, Q.-P. Allelopathic effect of the rice straw aqueous extract on the growth of Microcystis aeruginosa. Ecotoxicol. Environ. Saf. 2018, 148, 953–959. [Google Scholar] [CrossRef]
- Kehr, J.-C.; Dittmann, E. Biosynthesis and Function of Extracellular Glycans in Cyanobacteria. Life 2015, 5, 164–180. [Google Scholar] [CrossRef] [PubMed] [Green Version]
- Pereira, S.; Zille, A.; Micheletti, E.; Moradas-Ferreira, P.; De Philippis, R.; Tamagnini, P. Complexity of cyanobacterial exopolysaccharides: Composition, structures, inducing factors and putative genes involved in their biosynthesis and assembly. FEMS Microbiol. Rev. 2009, 33, 917–941. [Google Scholar] [CrossRef]
- Costas, E.; Lopez-Rodas, V. Copper sulphate and DCMU-herbicide treatments increase asymmetry between sister cells in the toxic cyanobacteria Microcystis aeruginosa: Implications for detecting environmental stress. Water Res. 2006, 40, 2447–2451. [Google Scholar] [CrossRef]
- Duan, X.; Sanan, T.; De La Cruz, A.; He, X.; Kong, M.; Dionysiou, D.D. Susceptibility of the Algal Toxin Microcystin-LR to UV/Chlorine Process: Comparison with Chlorination. Environ. Sci. Technol. 2018, 52, 8252–8262. [Google Scholar] [CrossRef]
Figure 1.
The phenyl-acyl compounds that were assayed in this work: 3,5-dimethoxybenzoic acid (A1, the code in this text), syringic acid (A2), caffeic acid (A3), 3-methoxyphenylacetic acid (A4), 2′-hydroxycinnamic acid (A5), 4′-hydroxyphenylacetic acid (A6), vanillin (A7), eugenol (A8), and, for copper sulfate, Cu(SO)4 was assigned code A9.

Figure 2.
The effects of phenyl-acyl compounds on the growth of Microcystis aeruginosa Kützing at 72 h of growth according to cell density measurements and chlorophyll a concentration. 3,5-dimethoxybenzoic acid (A1), syringic acid (A2), caffeic acid (A3), 3-methoxyphenylacetic acid (A4), 2′-hydroxycinnamic acid (A5), 4-hydroxyphenylacetic acid (A6), vanillin (A7), eugenol (A8), and, for copper sulfate, a Cu(SO)4 control (A9). The concentrations assayed were: 100 mg/L (C3), 50 mg/L (C2), and 25 mg/L (C1). The letters and numbers refer to the structures shown in Figure 1.

Figure 3.
Aspects of M. aeruginosa Kützing cells under an optical microscope (40x) after treatment with vanillin (A) and eugenol (B) for 72 h. Scale bar: 25 µm.
Figure 3.
Aspects of M. aeruginosa Kützing cells under an optical microscope (40x) after treatment with vanillin (A) and eugenol (B) for 72 h. Scale bar: 25 µm.

Figure 4.
Scanning Electron Microscope (SEM) images showing M. aeruginosa Kützing colonies without treatment (A) and exposed to vanillin (B) and caffeic acid (C).
Figure 4.
Scanning Electron Microscope (SEM) images showing M. aeruginosa Kützing colonies without treatment (A) and exposed to vanillin (B) and caffeic acid (C).

Figure 5.
The effect of syringic acid (A), caffeic acid (B), and eugenol (C) on the concentration of microcystin-LR (MC-LR) in cultures of M. aeruginosa Kützing. The concentrations assayed were 100 mg/L (C3), 50 mg/L (C2), and 25 mg/L (C1).
Figure 5.
The effect of syringic acid (A), caffeic acid (B), and eugenol (C) on the concentration of microcystin-LR (MC-LR) in cultures of M. aeruginosa Kützing. The concentrations assayed were 100 mg/L (C3), 50 mg/L (C2), and 25 mg/L (C1).


Figure 6.
A proposed oxide-reductive pathway of the decomposition of MC-LR with caffeic acid.

Figure 7.
The toxicity of phenyl-acyl compounds and copper sulfate on Daphnia pulex De Geer neonates. Control = the culture medium without a compound.
Figure 7.
The toxicity of phenyl-acyl compounds and copper sulfate on Daphnia pulex De Geer neonates. Control = the culture medium without a compound.


Table 1.
LC50 values for D. pulex De Geer neonates exposed to different phenyl-acyl compounds at 24, 48, and 72 h. The confidence intervals (95%) are given in parenthesis.
Table 1.
LC50 values for D. pulex De Geer neonates exposed to different phenyl-acyl compounds at 24, 48, and 72 h. The confidence intervals (95%) are given in parenthesis.
| Phenyl-Acyl | LC50 24 h | LC50 48 h | LC50 72 h |
|---|---|---|---|
| A1 | NE | 251.854 | 71.8 (52.98–108.68) |
| A2 | 760.41 (NE) | 146.26 (101.15–436.72) | 87.49 (66,86–132.07) |
| A3 | 131.62 (NE) | 228.62 (NE) | 84.30 (53.52–241.42) |
| A4 | NE | 179.88 (112.21–7471.96) | 125.42 (88.37–261.20) |
| A5 | 131.62 (NE) | 177.83 (112.21–7471.96) | 125.63 (79.01–554.19) |
| A6 | 131.62 (NE) | 126.25 (93.90–242.85) | 69.37 (52.58–99.22) |
| A7 | 80.42 (67.26–98.41) | 40.43 (32.73–51.42) | 26.62 (22.,41–39.5) |
| A8 | 20.885 (NE) | 13.23 (9.05–19.26) | 7.1 |
| A9 | NE | NE | NE |
NM, no mortality; NE, not estimated. 3,5-dimethoxybenzoic acid (A1), syringic acid (A2), caffeic acid (A3), 3-methoxyphenylacetic acid (A4), 2′-hydroxycinnamic acid (A5), 4′-hydroxyphenylacetic acid (A6), vanillin (A7), eugenol (A8), and, as a control, copper sulfate (A9).
© 2019 by the authors. Licensee MDPI, Basel, Switzerland. This article is an open access article distributed under the terms and conditions of the Creative Commons Attribution (CC BY) license (http://creativecommons.org/licenses/by/4.0/).
Share and Cite
MDPI and ACS Style
Herrera, N.; Florez, M.T.; Velasquez, J.P.; Echeverri, F. Effect of Phenyl-Acyl Compounds on the Growth, Morphology, and Toxin Production of Microcystis aeruginosa Kützing. Water 2019, 11, 236. https://doi.org/10.3390/w11020236
AMA Style
Herrera N, Florez MT, Velasquez JP, Echeverri F. Effect of Phenyl-Acyl Compounds on the Growth, Morphology, and Toxin Production of Microcystis aeruginosa Kützing. Water. 2019; 11(2):236. https://doi.org/10.3390/w11020236
Chicago/Turabian StyleHerrera, Natalia, Maria Teresa Florez, Juan Pablo Velasquez, and Fernando Echeverri. 2019. "Effect of Phenyl-Acyl Compounds on the Growth, Morphology, and Toxin Production of Microcystis aeruginosa Kützing" Water 11, no. 2: 236. https://doi.org/10.3390/w11020236
Note that from the first issue of 2016, this journal uses article numbers instead of page numbers. See further details here.