Atmospheric Teleconnection-Based Extreme Drought Prediction in the Core Drought Region in China


1
State Key Laboratory of Water Resources and Hydropower Engineering Science, Wuhan University, Wuhan 430072, China
2
Department of Civil Engineering, Joongbu University, Go Yang, Gyeong Gi 10279, Korea
*
Authors to whom correspondence should be addressed.
Water 2019, 11(2), 232; https://doi.org/10.3390/w11020232
Submission received: 29 December 2018
/
Revised: 25 January 2019
/
Accepted: 27 January 2019
/
Published: 30 January 2019
(This article belongs to the Special Issue The Drought Risk Analysis, Forecasting, and Assessment under Climate Change)
Abstract
:This paper aims to improve the predictability of extreme droughts in China by identifying their relationship with atmospheric teleconnection patterns (ATPs). Firstly, a core drought region (CDR) is defined based on historical drought analysis to investigate possible prediction methods. Through the investigation of the spatial-temporal characteristics of spring drought using a modified Mann–Kendall test, the CDR is found to be under a decadal drying trend. Using principal component analysis, four principal components (PCs), which explain 97% of the total variance, are chosen out of eight teleconnection indices. The tree-based model reveals that PC1 and PC2 can be divided into three groups, in which extreme spring drought (ESD) frequency differs significantly. The results of Poisson regression on ESD and PCs showed good predictive performance with R-squared value larger than 0.8. Furthermore, the results of applying the neural networks for PCs showed a significant improvement in the issue of under-estimation of the upper quartile group in ESD, with a high coefficient of determination of 0.91. This study identified PCs of large-scale ATPs that are candidate parameters for ESD prediction in the CDR. We expect that our findings can be helpful in undertaking mitigation measures for ESD in China.
1. Introduction
Under global warming, the occurrence of extreme climate disasters is predicted to become more frequent, with droughts being one of the most severe disasters [1,2,3,4]. Annually droughts cause 6–8 billion dollars in damages globally, and people who are affected by droughts suffer far more damage than other natural disasters. The number of droughts has been increasing in China, which has experienced even more severe droughts over the past two decades [5,6,7].
Although China occupies 6% of the freshwater in the world, a total volume of 2.8 trillion m3, the water availability per capita is only 25% of the global average. Furthermore, uneven spatial-temporal distribution of precipitation has been observed in recurrent droughts in northern China, as well as frequent floods in southern China in the summer, and reverse signals during the spring [1]. Significant economic and societal losses have been incurred due to persistent severe droughts in 1997 and from 1999 to 2002 in northern China [2]. In 2000, droughts affected more than 40 million hectares’ agricultural areas [5]. The spring drought in 2011 over southern China has received much attention [6,8,9], as it resulted in more than 1.09 billion dollars in economic losses solely in Hubei Province. For the entire affected area, the destroyed crops exceeded 98.9 million hectares, and more than 4.9 million people and 3.4 million livestock suffered from deficient drinking water. This disaster has strongly impacted agriculture, industry, fisheries, and the daily life of the public. In recent decades, drought has attracted the attention of both the government and the public, and thus, the drying trend in China has been widely examined: Drought areas revealed an expanding trend in northern China in the last half-century using the China-Z index [7], while a drying signal in North China has also been detected using the surface humidity index during 1951–1998.
Drought management has evolved from passive management methods to proactive management methods, including overall risk analysis and hazard assessment [10]. However, it is challenging to define drought precisely due to its different temporal-spatial distribution and water demand of human society. Nowadays most drought studies are based on Palmer Drought Severity Index (PDSI) [11] using soil water balance equation or Standardized Precipitation Index (SPI) [12] using precipitation. Although PDSI can measure both wetness and dryness with statistical accuracy [11,13], SPI is preferred in this study due to its flexible temporal scale. Drought forecasting has been widely studied using both statistical and dynamical approaches [14]. Statistical methods are based on historical records, such as artificial neural networks and extreme learning machines [15]. Dynamical approaches refer to climatological or hydrological models based on variables (e.g., air temperature and precipitation) from atmospheric-ocean general circulation models (GCMs). Although well-designed statistical methods perform better in China, physical processes that are highlighted by dynamic models are often ignored [16].
As multiple causes generate droughts [17], it is recommended to examine the impact of atmospheric circulation anomalies [18] because of their protracted feedback on climate [19], which can be used to predict drought. As the spring drought in 2011 over southern China caused substantial social and economic losses, the causes of this drought have been widely investigated to avoid such great economic loss by accurately forecasting drought. Atmospheric circulation patterns have been found to exert significant influence in this event—the La Niña event in 2010–11 decreased the moisture transfer from tropical oceans to southern China and strengthened the dry flow from Siberia to China, while the positive North Atlantic Oscillation (NAO) in January–May 2011 also led to drier conditions in China through sub-polar and subtropical waveguides [4]. Jin et al. [9] reveal that the persistent spring drought events in 2011 were caused by maintenance of the quasi-stationary waves at middle-high latitudes and anomalous thermal-forcing over southeast Asia, which is possibly related to La Niña events. Zhang et al. [20] suggested that the western Pacific subtropical high may have a significant influence on drought patterns in China. Wu et al. [21] analyzed the relationship between recent drought events in Southwest China and anomalous atmospheric circulation patterns and stressed the need to detect the influencing factors, such as the Arctic Oscillation (AO). Although there are also apparent changes in spring rainfall, the mechanism for spring drought has received little attention and remains to be evaluated. Xin et al. [22] found that NAO is inversely correlated with the late spring upper-troposphere temperature with a three-month lag time over central China, and the inter-decadal change of winter NAO may cause the decrease in South China late spring rainfall. Kim et al. [23] found a three-month lagged correlation between NAO and spring precipitation in Korea and suggested that NAO be a possible parameter for drought forecasting. Understanding the atmospheric circulation patterns (ACPs) influencing drought development is essential in the management of this spatially extensive and recurrently prolonged natural hazard [24].
Therefore, the purpose of this study was to investigate the spatial-temporal characteristics of extreme droughts and to improve the prediction of extreme droughts related to large-scale atmospheric teleconnection patterns over China. The following questions were considered in this study: 1) What are the spatial-temporal characteristics of extreme droughts in China? 2) What is the association of extreme droughts linked with large-scale atmospheric teleconnection patterns across China? 3) How can we predict extreme droughts in the core drought region in China?
2. Data and Method
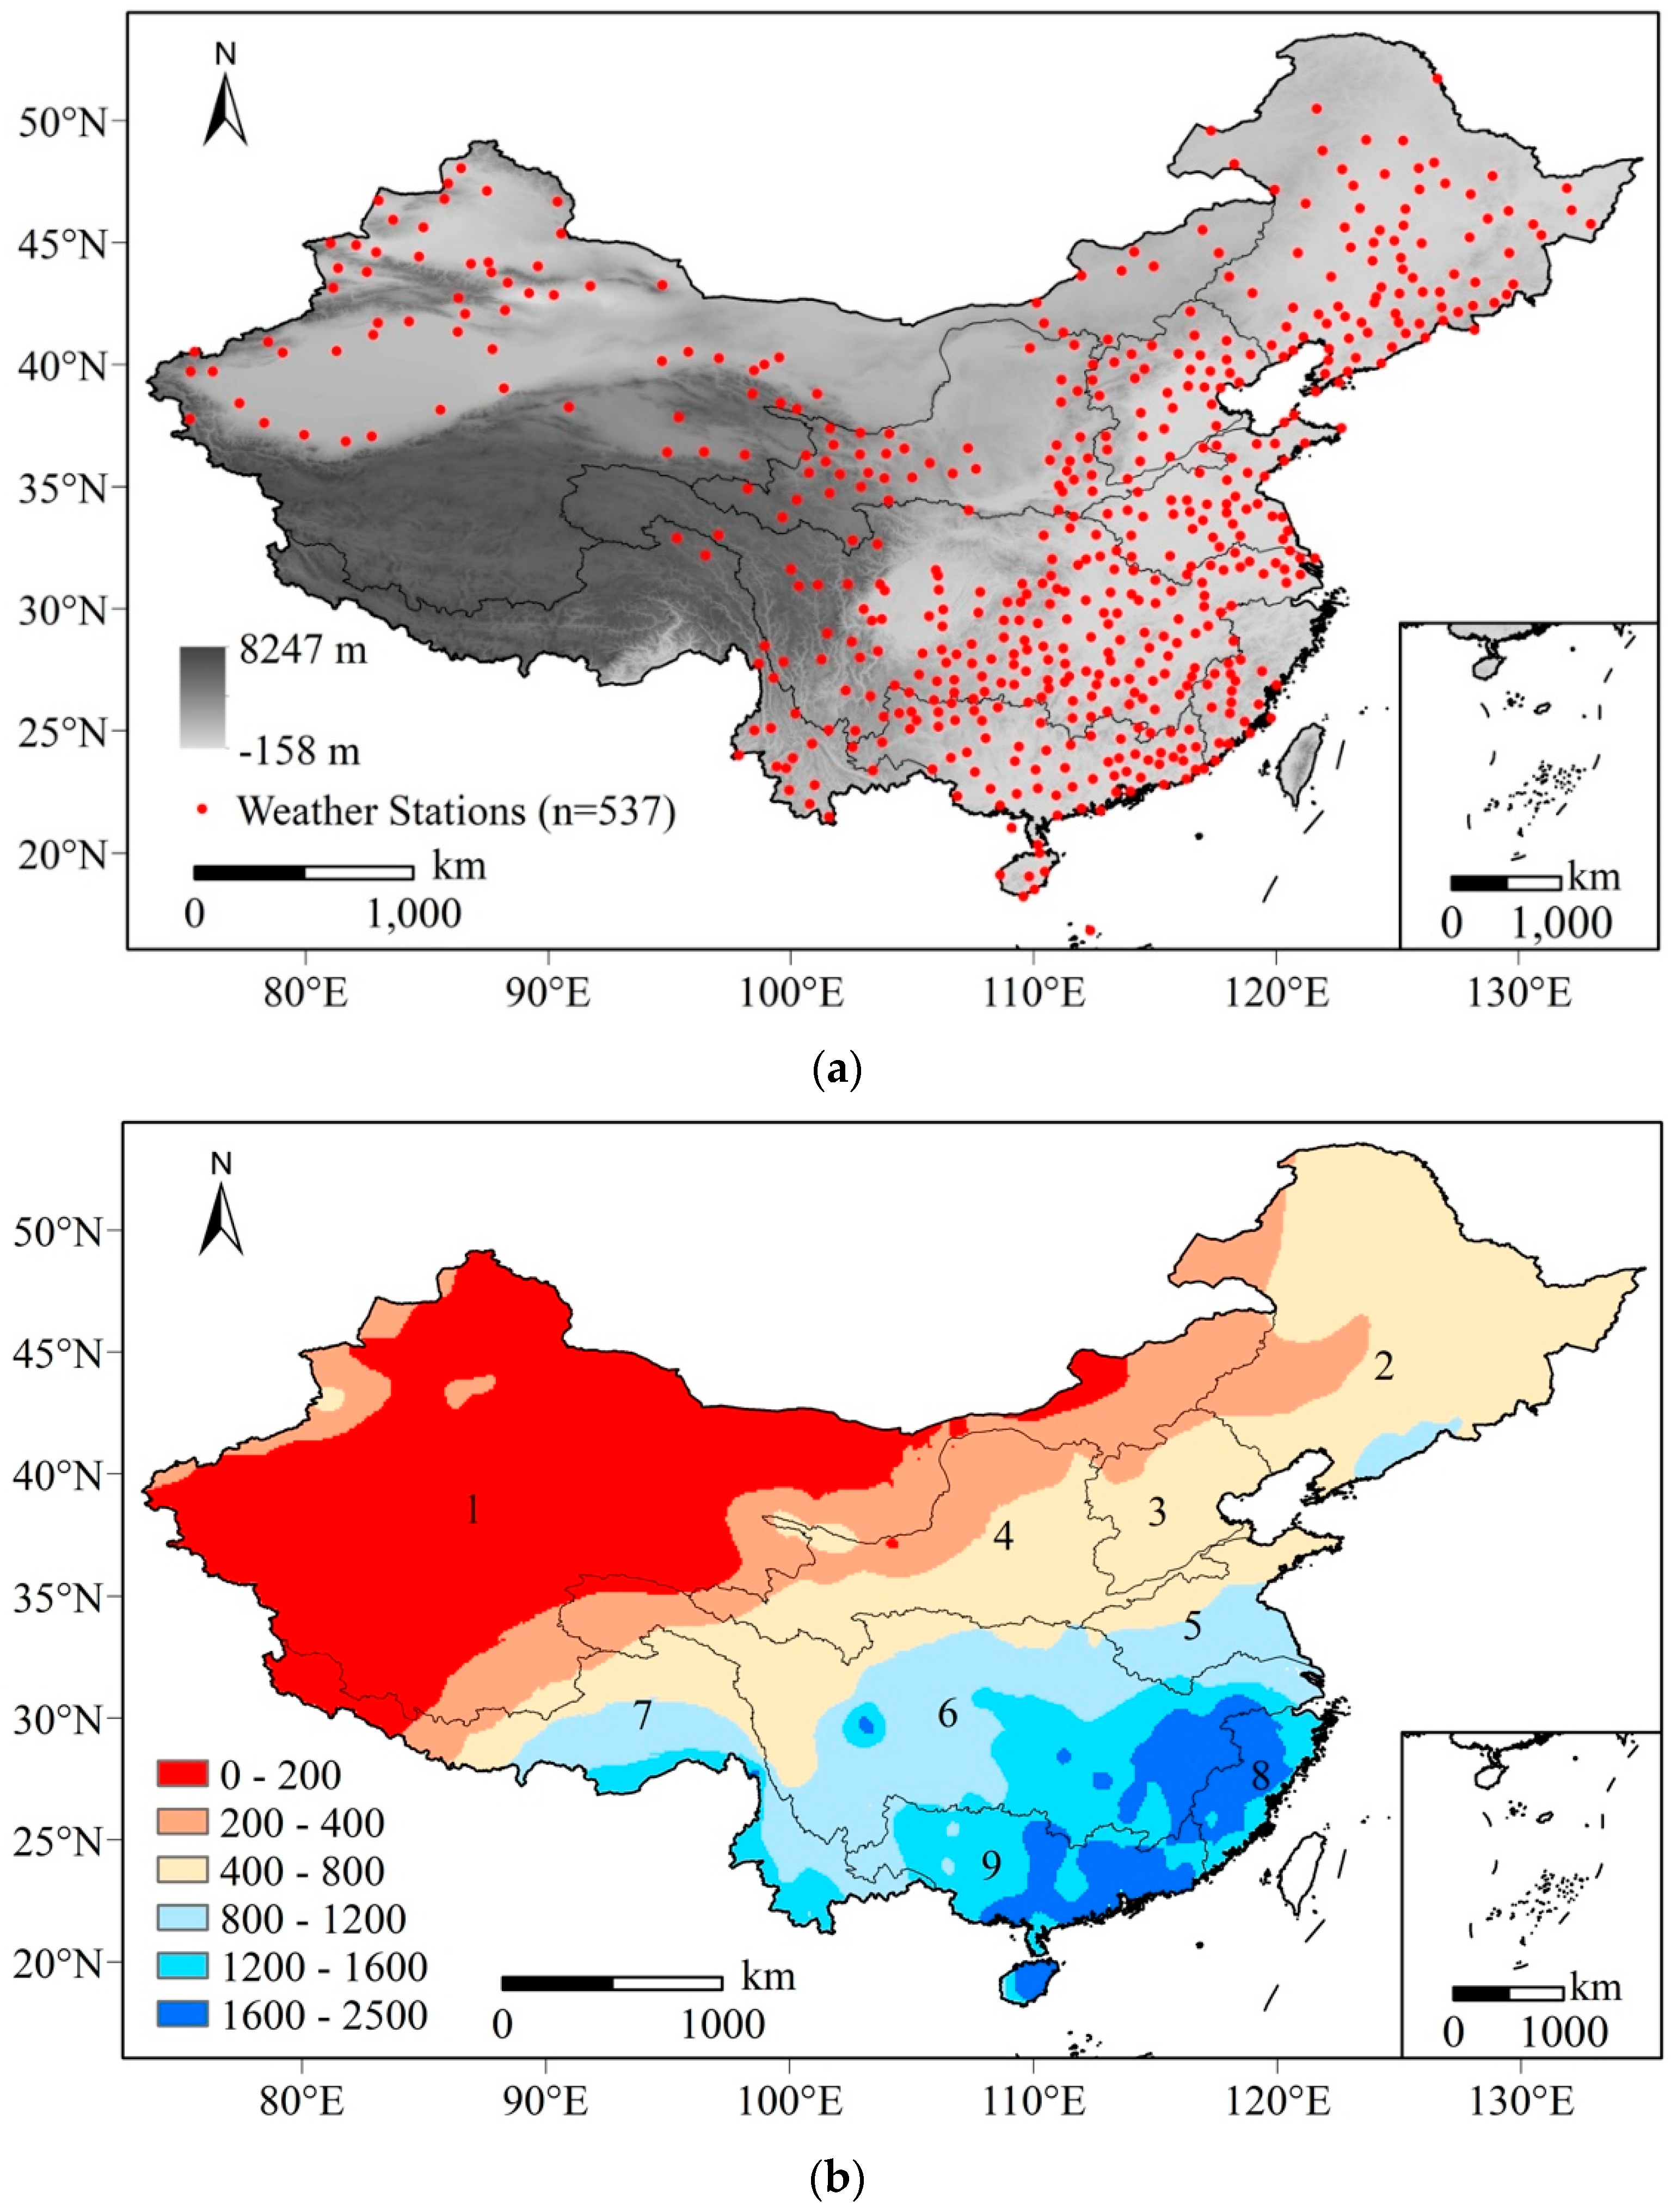
The daily precipitation data used in this study are complete data from 1961 to 2017 from 537 stations over China (Figure 1a shows the location of stations and Chinese topography), provided by the China Meteorological Data Service Center. Figure 1b shows the annual precipitation (mm) and nine major river basins in China. In this study, a seasonal Standardized Precipitation Index (SPI) is estimated to detect extreme drought conditions (SPI < −1.5).
The National Oceanic and Atmospheric Administration (NOAA; http://www.noaa.gov/) uses rotated principal component analysis to analyze monthly mean standardized 500 mb height anomalies in the region 20 °N to 90 °N and provides Northern Hemisphere teleconnection patterns as ten indices. Simultaneous and lagged correlations with atmospheric teleconnection indices were analyzed to select the candidate predictors of extreme drought in China: North Atlantic Oscillation (NAO), East Atlantic (EA), East Atlantic/Western Russia (EA-WR), Scandinavia (SCA), Polar/Eurasia (POL), West Pacific (WP), Pacific/North American (PNA) and Tropical/Northern Hemisphere (TNH), as shown in Table 1.
One of the most important teleconnection patterns [25] is NAO, which is a north-south dipole (Greenland and central latitudes of the North Atlantic between 35°N and 40°N) of anomalies and shows considerable inter-annual or multi-decadal variability [26]. Several studies suggest that the preceding winter NAO will affect the early spring temperature in East Asia [27]. Sun and Yang [15] also find that the positive NAO might arouse an anomalous anti-cyclonic circulation over the North Atlantic and western Europe regions and lead to severe drought in southern China in spring 2011.
EA is the second prominent pattern of low-frequency variability across North Atlantic which is structurally similar to the NAO and consists of a north-south dipole of anomaly centers displaced southeastward to the approximate nodal lines of the NAO mode. EA/WR is one of three prominent teleconnection patterns affecting Eurasia all over the year and consists of four main anomaly centers. The main surface temperature anomalies linked with positive EA/WR reflect above-normal temperatures in East Asia and below-normal temperatures across western Russia and northeastern Africa. SCA consists primarily of circulation center in Scandinavia, with weaker centers across western Europe and eastern Russian/west Mongolia. POL exists whole the year and is linked with fluctuations in the intensity of the circumpolar circulation. WP is a primary pattern of low-frequency variability in North Pacific consisting of a north-south dipole of anomalies [25] (the Kamchatka Peninsula and portions of southeastern Asia and the western subtropical North Pacific) during winter and spring. PNA is an important pattern of low-frequency variability in the Northern Hemisphere extra-tropics. Although PNA is a natural internal pattern of climate variability, it is also strongly influenced by the El Niño/Southern Oscillation (ENSO) phenomenon. TNH was first proposed by Mo and Livezey [28] and exists as a wintertime pattern.
Trend analysis is often used to detect changes in time-series data. One of the commonly used non-parametric trend tests is called the Mann–Kendall (MK) test [21,22,29,30]. The null hypothesis H0 indicates that sample data (Xi, i = 1, 2…, n) are randomly ordered and there is no trend, while the alternative hypothesis H1 represents a monotonic trend in X. MK test uses Z to denote the trend in time-series data: The symbol of Z represents the trend direction (positive for an upward trend, vise-versa for negative), and the magnitude of Z relates to the slope of trend and the significance level, where |Z| > 1.64 for the 10% significance level and |Z| > 1.96 for the 5% significance level. Because the existence of autocorrelation in the dataset will affect the probability of detecting trends, which is often ignored, Hamed and Rao [31] developed a modified non-parametric trend test whose accuracy is better than the original MK test when considering empirical significance level. In this study, the modified MK test is adopted.
For multiple possible prediction parameters, we first extracted several principal components (PCs) using principal component analysis (PCA) [32], a function-reduction method, to account for a large part of the variance of original parameters and to predict decadal extreme spring droughts (ESDs). The tree-based model [8,33] is then used to classify extreme droughts (response variables) in spring based on the PCs (potential precursors). Poisson regression, which is often used for prediction of count data, as well as neural networks are adopted for predicting ESDs. Neural networks, which is more often called artificial neural networks (ANN), are nonlinear models that can discover data patterns and estimate complex relationship with high accuracy [2]. Among many types of neural networks, a feed-forward ANN comprising of multiple neurons arranged in layers is the most popular model for time-series forecasting [32]. ANN is typically made up of several layers of nodes. Input and output layers receive external information and export results. One or more intermediate layers contains the complex calculation processes, which is often described as a black box. Next, Receiver Operating Characteristics (ROC) analysis, which was initially developed during World War II for classifying radar signals from noise [34], is used to test the results of Poisson regression and neural networks. ROC analysis is typically used to evaluate the performance of a statistical classification model based on the sensitivity (TPR, true positive rate) and 1-specificity (FPR, false positive rate), which can be estimated by:
where TP indicates that the predicted and original results are both true, FP indicates that the predicted result is true, but the original result is false, TN indicates that the predicted and original results are both false, and FN indicates that the predicted result is false, but the original result is true. More details about ROC are described by Zou et al. [34].
3. Results
3.1. Diagnostic Analysis of Historical Spring Droughts in China
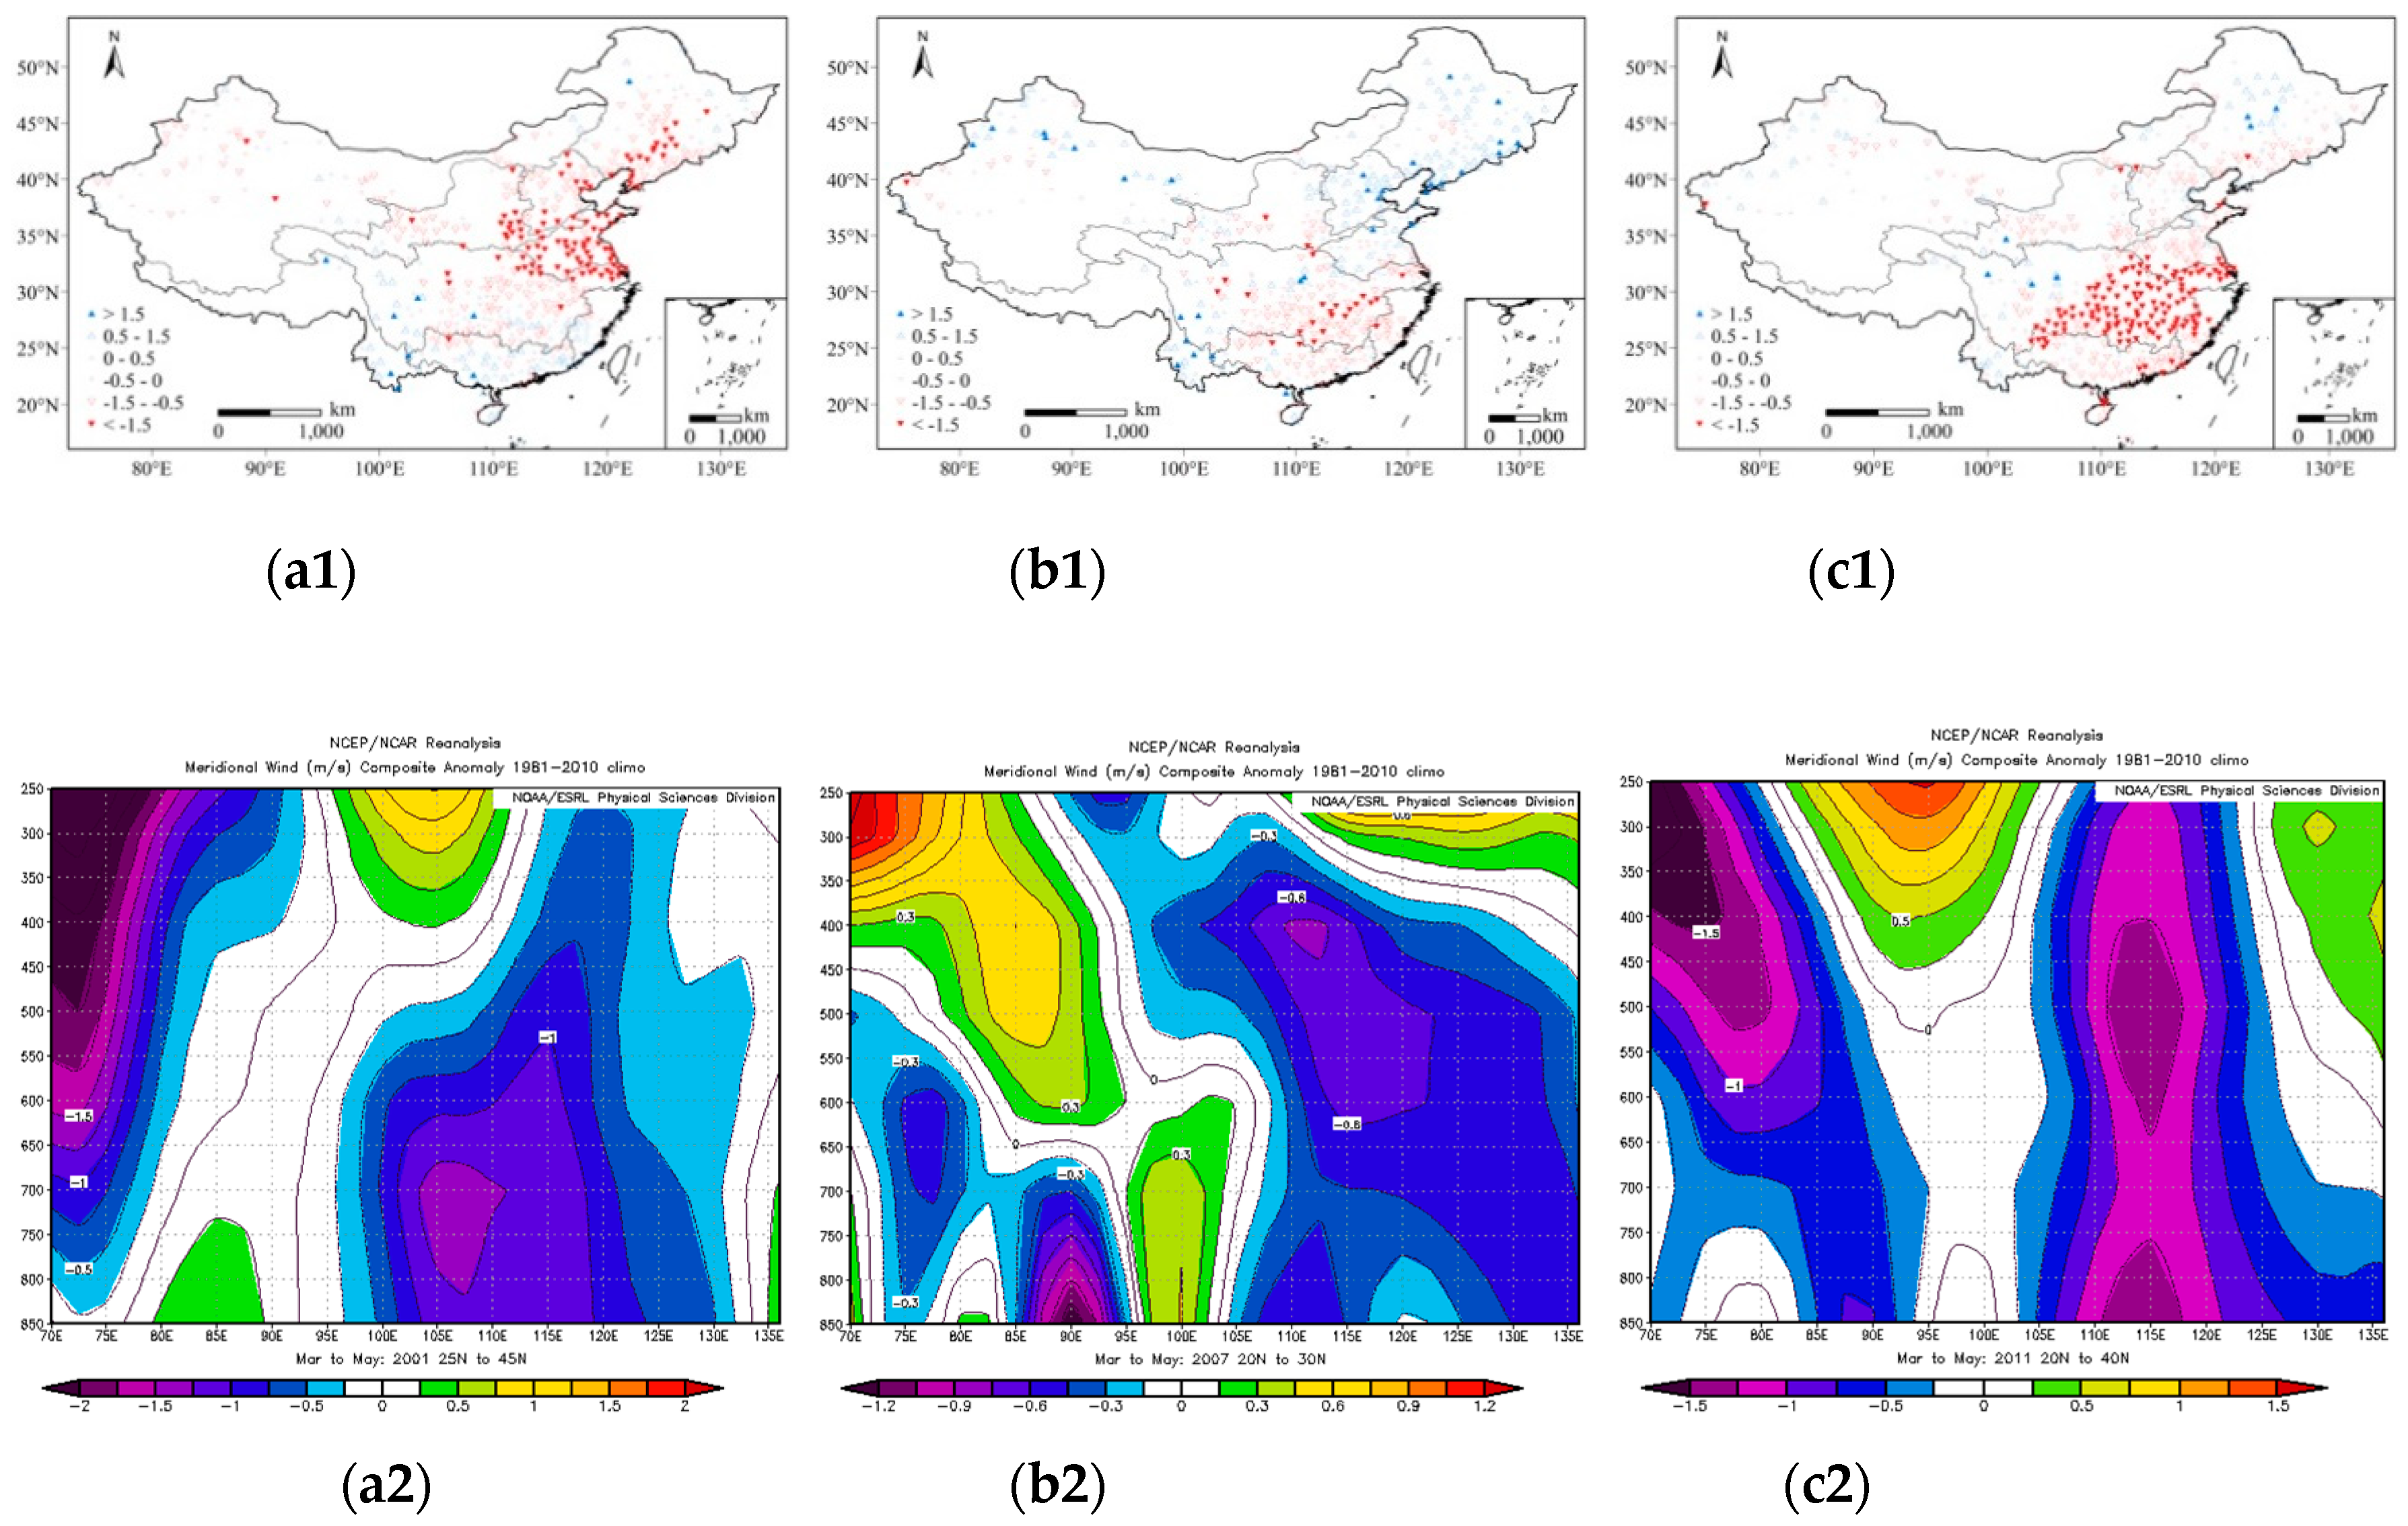
In this study, three representative droughts (2001/2007/2011) were selected to assess the drought development process in accordance with SPI3 and the composite anomalies of the meridional spring wind (m/s) conditions between 850 mb and 250 mb in the corresponding area over China (Figure 2). The upper three figures give drought information using SPI3, while the lower three figures show meridional wind condition. The range of latitude in the lower figures corresponds to extreme drought region in the upper figure, and the range of longitude accords with the upper map, the y-axis of lower figures ranges from 850 mb to 250 mb. Red color in the upper figures denotes drought condition and blue color in the lower figures represents weaker meridional wind and vice versa.
In 2001, nearly all stations over north and central China undergone a drought condition (SPI < −0.5), while many stations, covering the entire Huaihe river basin, northwest of the Yangtze river basin, southeast of the Yellow river basin and south of Haihe/Songliao river basin, have experienced an extreme drought (SPI < −1.5), as shown in Figure 2a1. Figure 2a2 displays the meridional wind composite anomaly between 25 °N–40 °N and 70 °E–135 °E. There are visible blue band ranging from 70 °E–90 °E in the higher atmosphere and 100 °E–125 °E in the lower atmosphere. As there are limited meteorological stations and the effect of meridional wind is also weaker on local weather due to high altitude over China in the region 70 °E–90 °E, the significant influence of weaker meridional wind that can also be detected comes from the range 100 °E–125 °E, where extreme drought prevails. The mechanism that weaker meridional wind led to lower precipitation is also apparent—less moisture is transferred by meridional wind from the south sea to land in the north.
In 2007, a drought disaster struck southern China, including south of Yangtze river basin, Pearl river basin, and Southeast river basin, where the population is densely distributed, and the economy is very prosperous, and drought can cause much more significant social and economic loss. Although approximately only 20 stations are undergoing extreme drought, the large spatial scale of this disaster also appeals for public attention. In the corresponding longitude (100 °E–120 °E), blue color prevails in the meridional wind graph. Although there was stronger meridional wind in the upper atmosphere, its influence on drought appears to be weaker due to thin air.
As mentioned before, an extreme drought occurred during the spring of 2011, which is displayed by Figure 2c1. Large parts of Yangtze river basin and part of Huaihe/Southeast/Pearl river basin suffer striking extreme drought. Figure 2c2 shows the composite anomaly of meridional wind at 20 °N–40 °N and 70 °E–130 °E. Over the drought region, the meridional winds were weaker than normal throughout the entire atmospheric layer. This strong correlation may be a useful signal to predict extreme drought over China.
From the investigation of historical droughts, a core drought region (CDR) with range (25 °N–35 °N, 105 °E–120 °E) under more severe drought risk is selected for the forecasting of ESD. There are, in total, 176 stations within CDR, 120 stations (68%) in the lower reach of the Yangtze river basin, 27 stations (15%) in the Huaihe river basin, and 13/11/4 stations in Southeastern/Pearl/Yellow river basins, respectively.
3.2. Changes in Spring Precipitation and Extreme Droughts in China
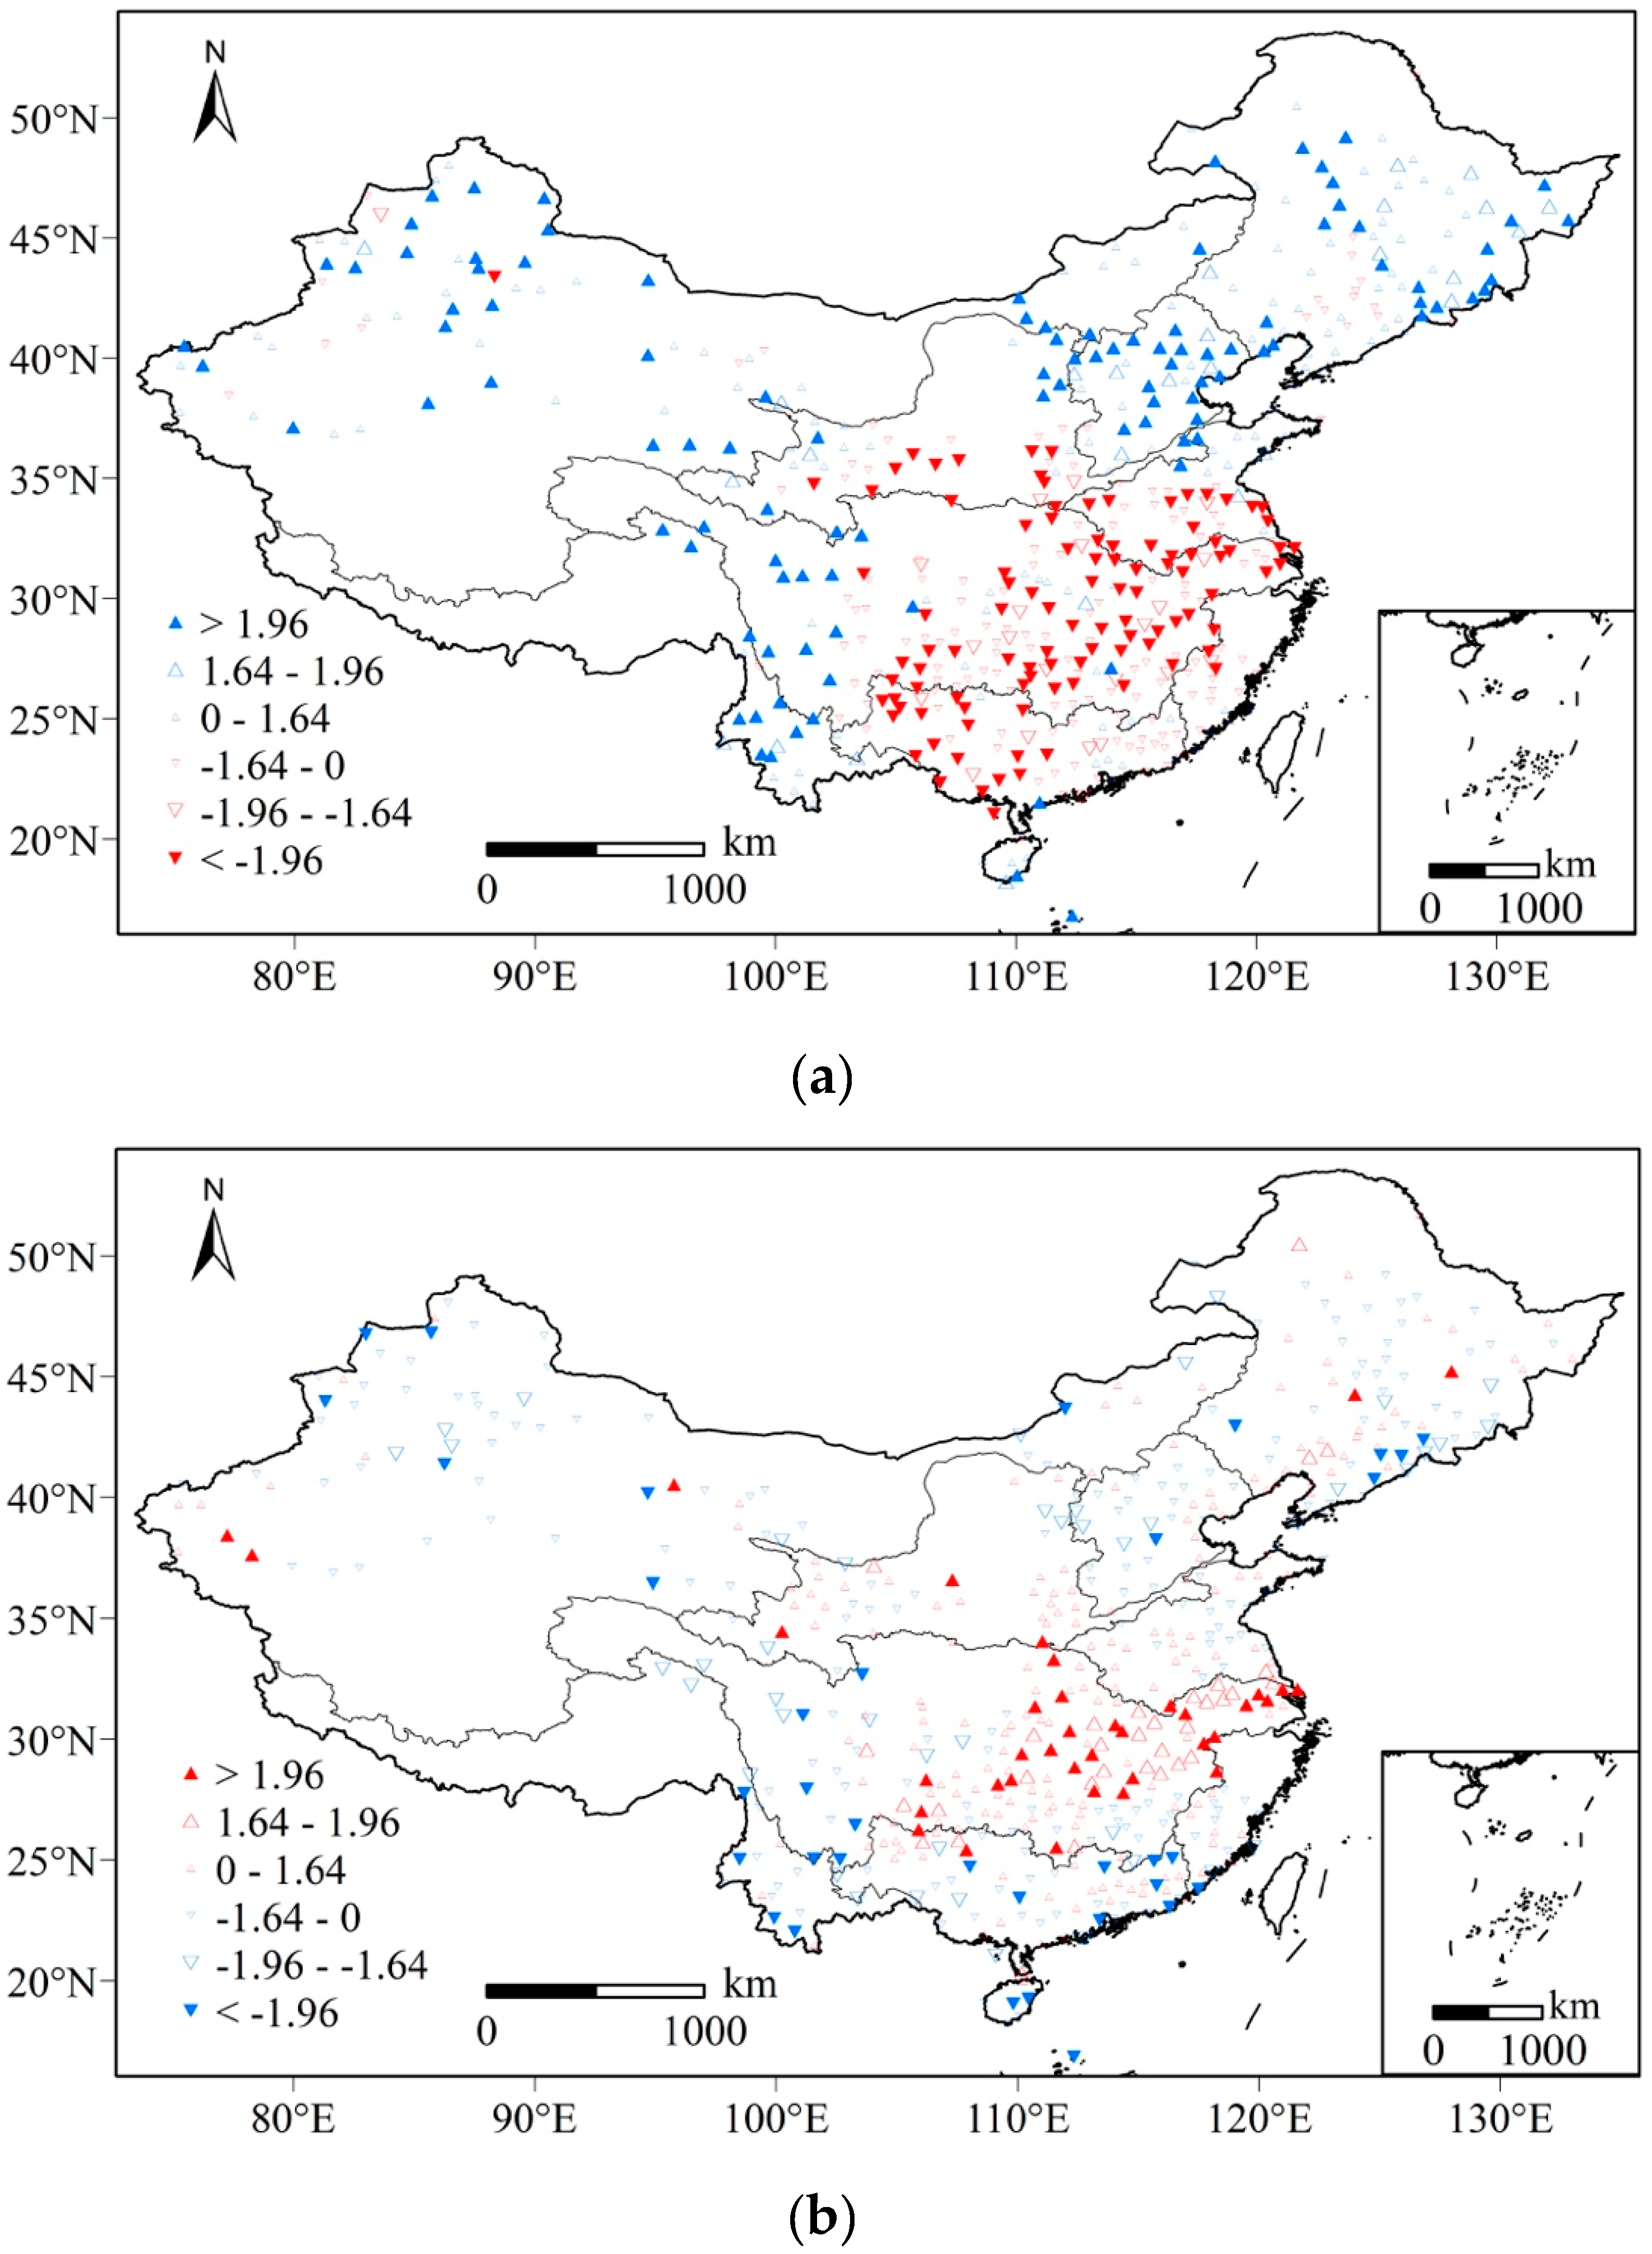
The trend of spring precipitation and extreme drought is shown in Figure 3. The shift in spring precipitation indicates a significant decadal drying trend in central China (125 stations with 10% significance and 103 stations with 5% significance), which matches the CDR well. In CDR, there are 68 stations (53%) and 56 stations (43%) showing a decrease in spring precipitation with 10% and 5% significance, respectively. Although northeastern China has received more rainfall, the major water resources in China come from precipitation in central and southeast China, where the population is densely distributed, and industry is relatively more prosperous. As central China is more water-demanding and undergoes a decrease in spring rainfall, it is vital to study the influence of decadal water resource reduction on water resource management in this region. Compared to the trend of spring precipitation, a smaller area around the lower reach of the Yangtze river basin suffers more frequent ESD, where 43 (33%) and 24 (19%) stations in CDR show an increase in ESD frequency at 10% and 5% significance levels, respectively. Owing to the enormous economic losses caused by drought disasters, the cause and prediction methods of ESD are studied in this paper to promote better mitigation measures.
3.3. Extreme Spring Drought Prediction in the CDR
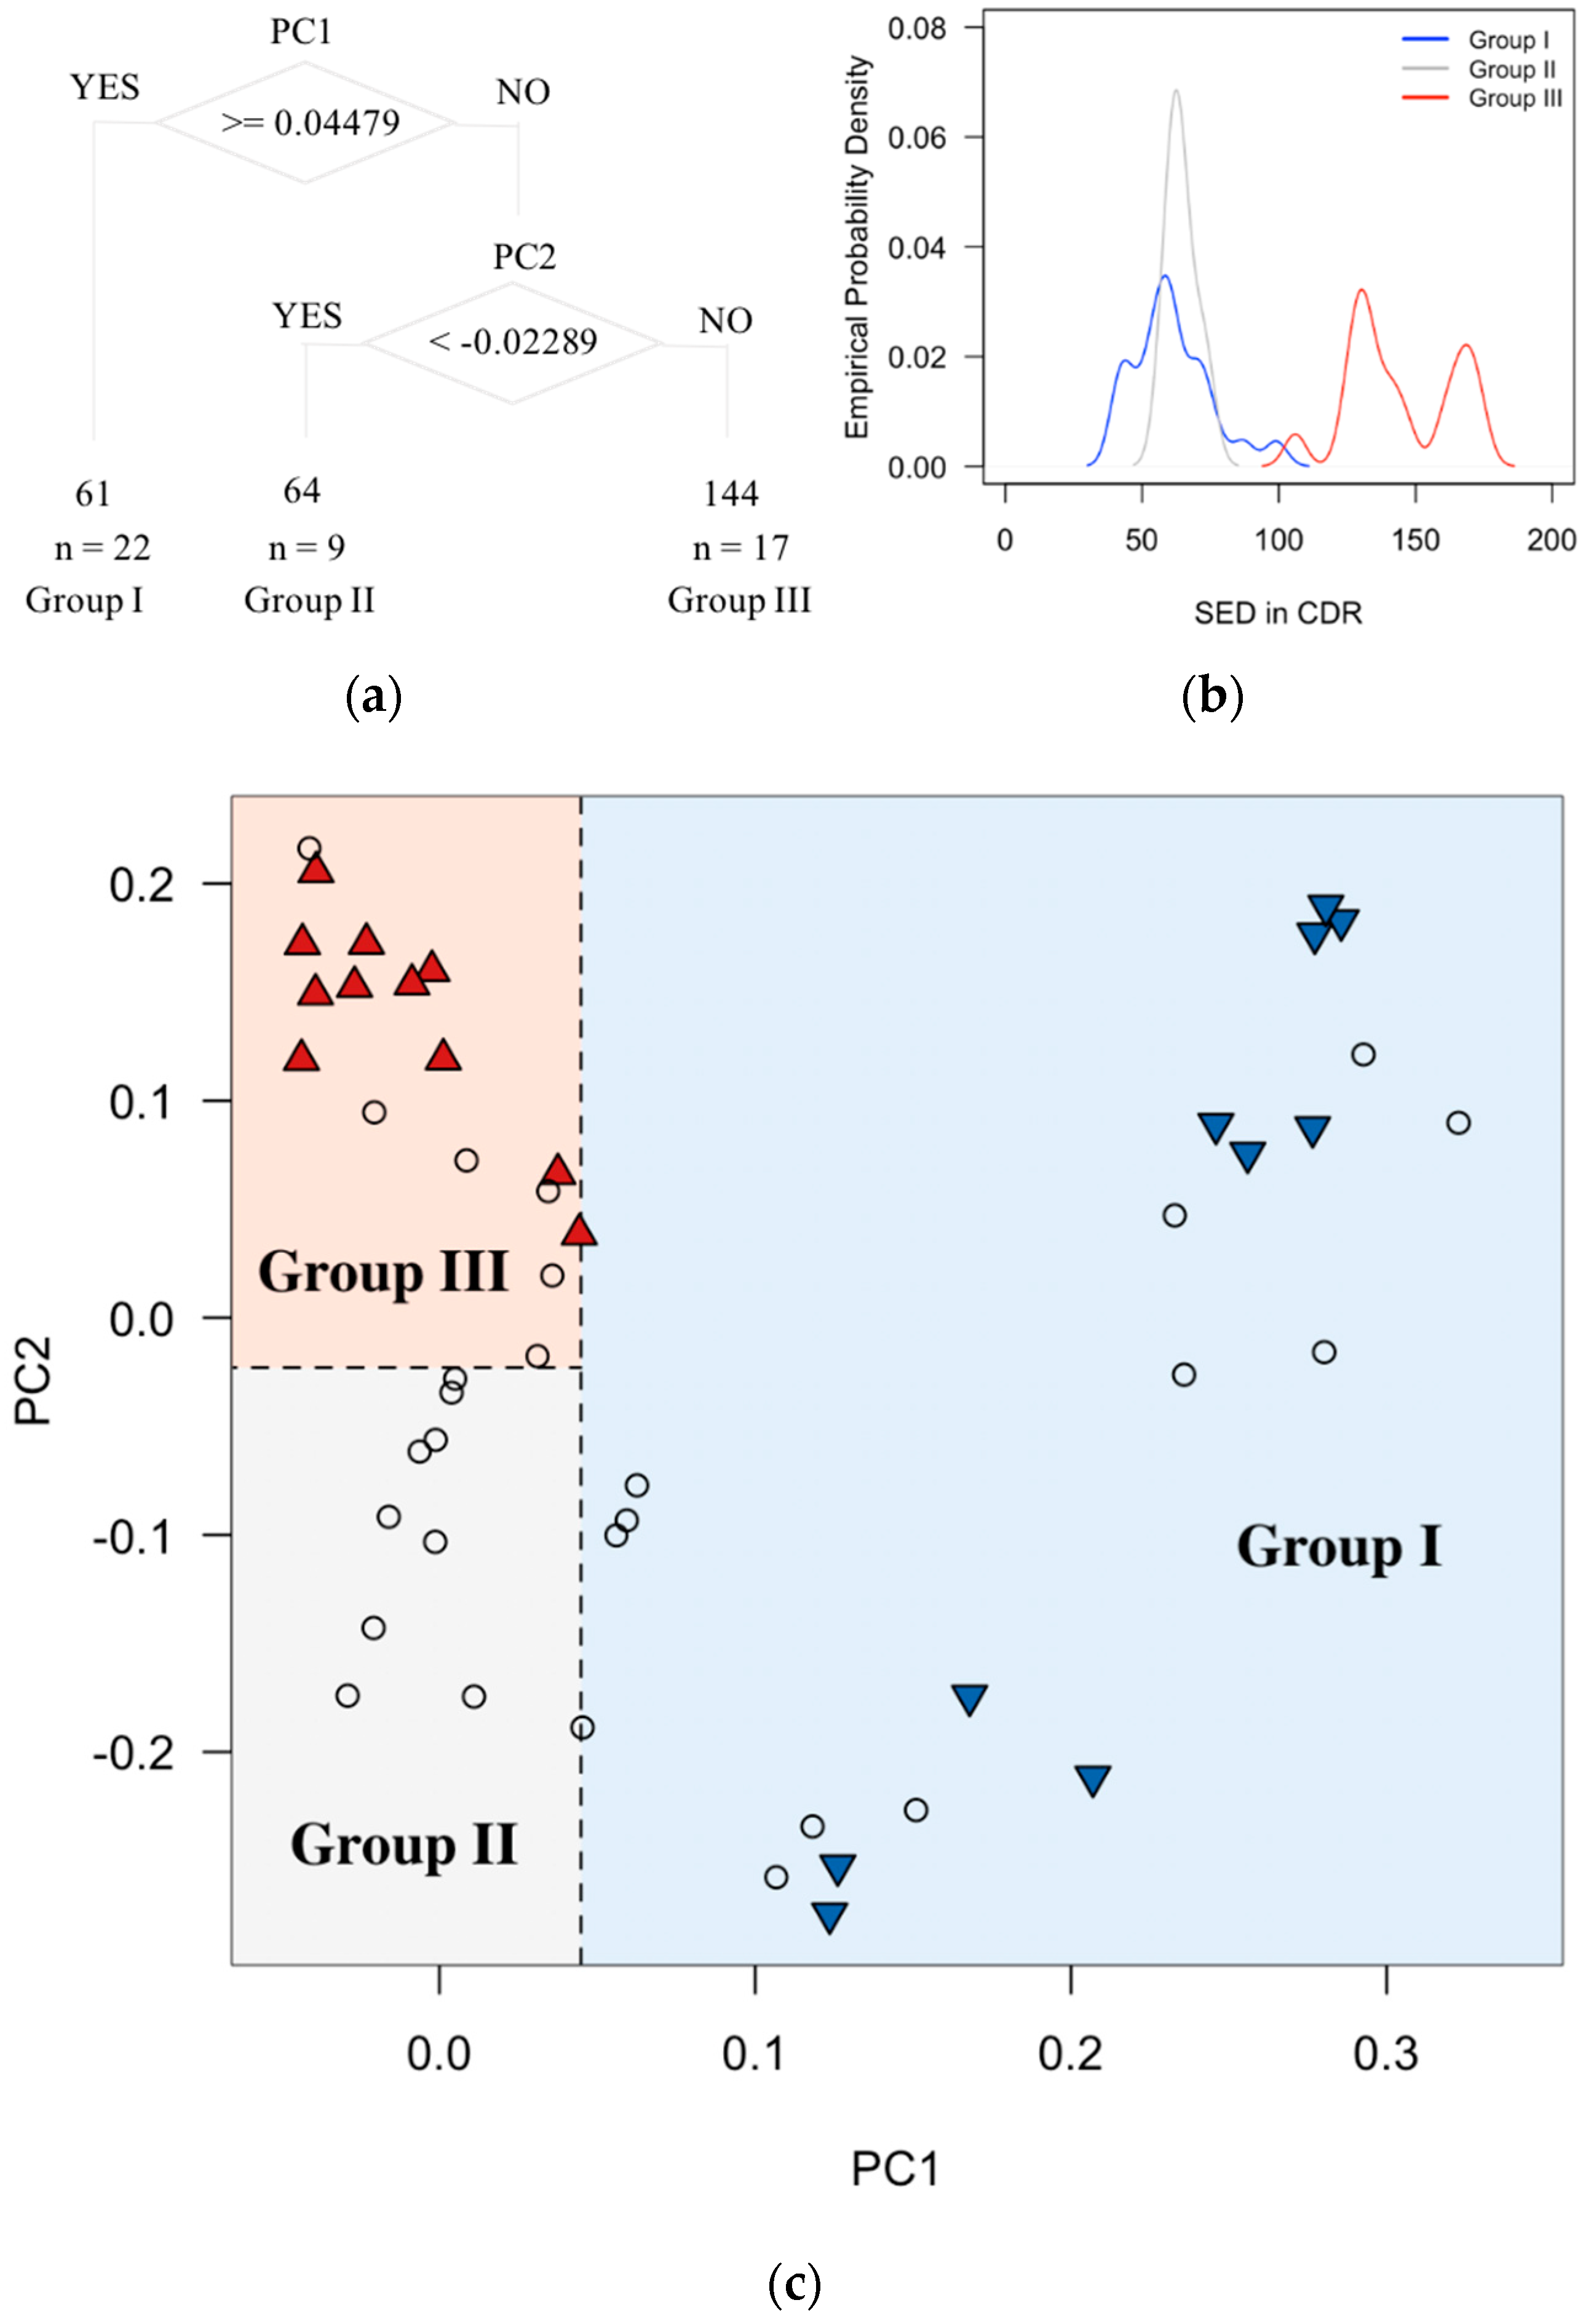
PCA has been applied on the eight possible precursors of ESD to obtain linearly uncorrelated variables (PCs). The dimension reduction result is shown in Table 2. Although there are many rules to select PCs—based upon eigenvalues of the covariance matrix of dataset or proportion of variance—we select PCs according to the requirement and result of the following analysis. Based on PC1 and PC2, we use a tree-based model to classify ESD frequency in CDR into three groups, as shown in Figure 4a: Group 1, PC1 ≥ 0.04479; Group 2, PC1 < 0.04479 and PC2 < −0.02289; Group 3, PC1 < 0.04479 and PC2 ≥ −0.02289. From the empirical probability density of ESD frequency of each group in Figure 4b, Group 3 shows a higher probability in higher ESD frequency. Figure 4c uses PC1 and PC2 to partition ESD, where blue background means Group 1 and red for Group 3. The red triangles and blue inverted triangles represent upper and lower quantile of ESD, with all red triangles located in Group 3 and all blue inverted triangles in Group 1. That is, when PC1 < 0. 04479 and PC2 ≥ −0.02289, the ESD frequency is significantly greater. This result may be used as an effective warning signal∔when PC1 < 0.04479 and PC2 ≥ −0.02289, the drought risk is higher over CDR.
ESD frequency is count data and shows a strong correlation with PCs. Consequently, we used Poisson regression and neural networks to predict ESD. After trying different options to select PCs, we choose PC1~4 as prediction parameters, which gives much better results than PC1~3 and cannot be significantly improved by additionally choosing PC5. Table 3 shows the coefficients of each possible predictors and the corresponding p-values (all p-values are near to 0) using Poisson regression, while the coefficient of determination (R-squared value) between original ESD and simulated results by Poisson regression is 0.834, which strongly suggests these variables to be prediction parameters.
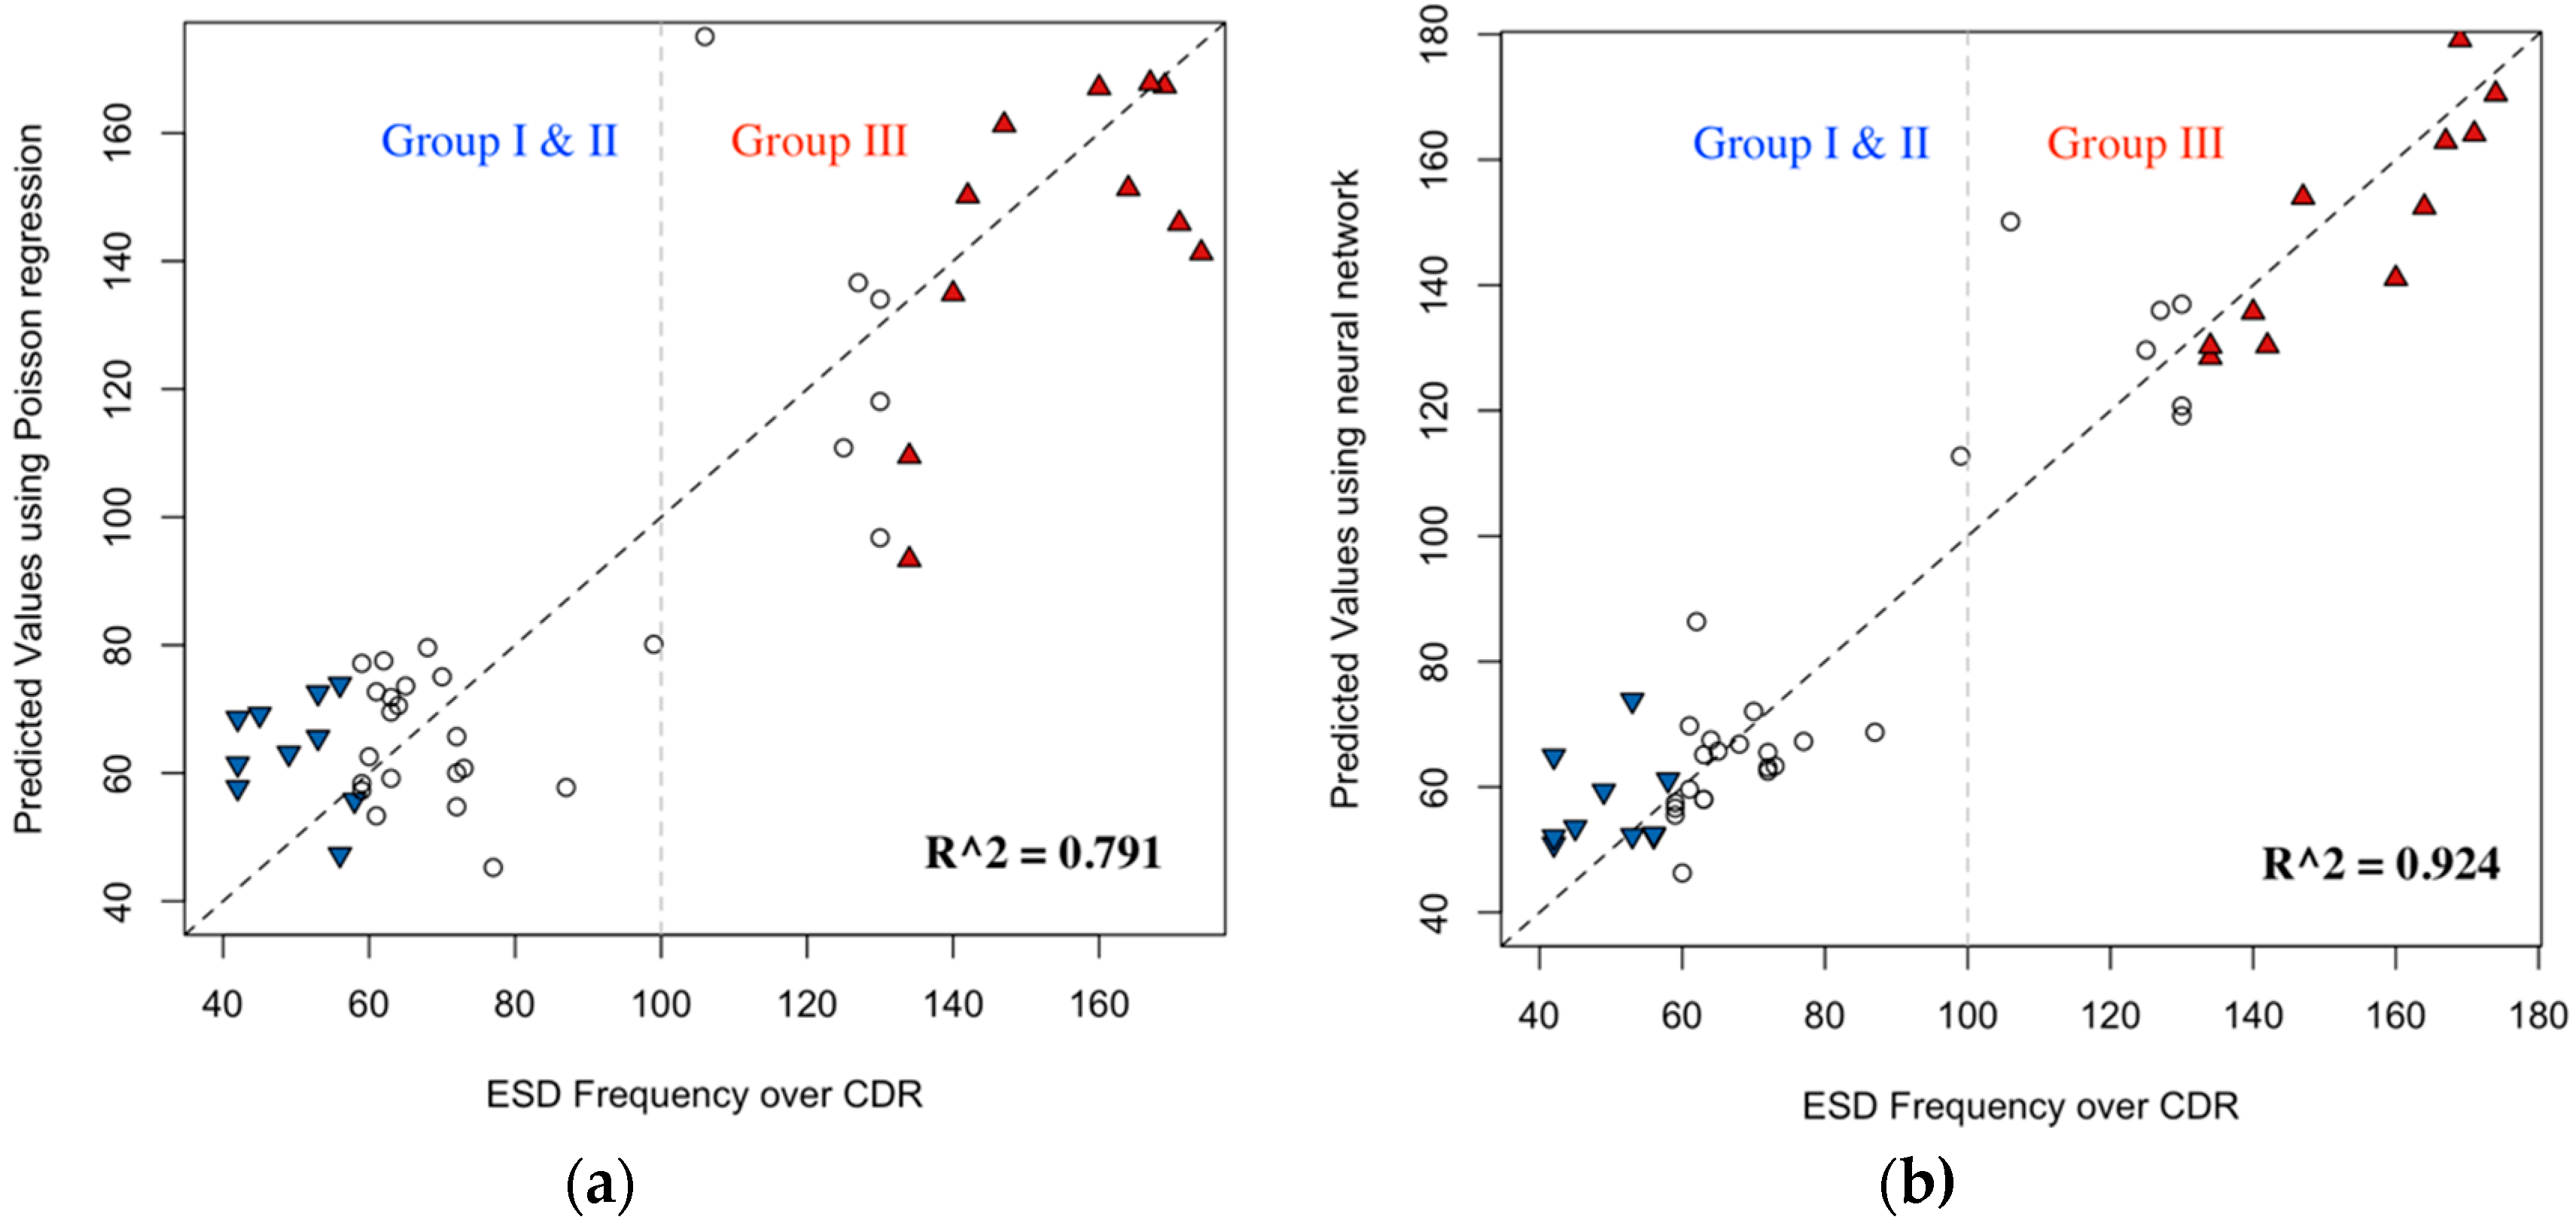
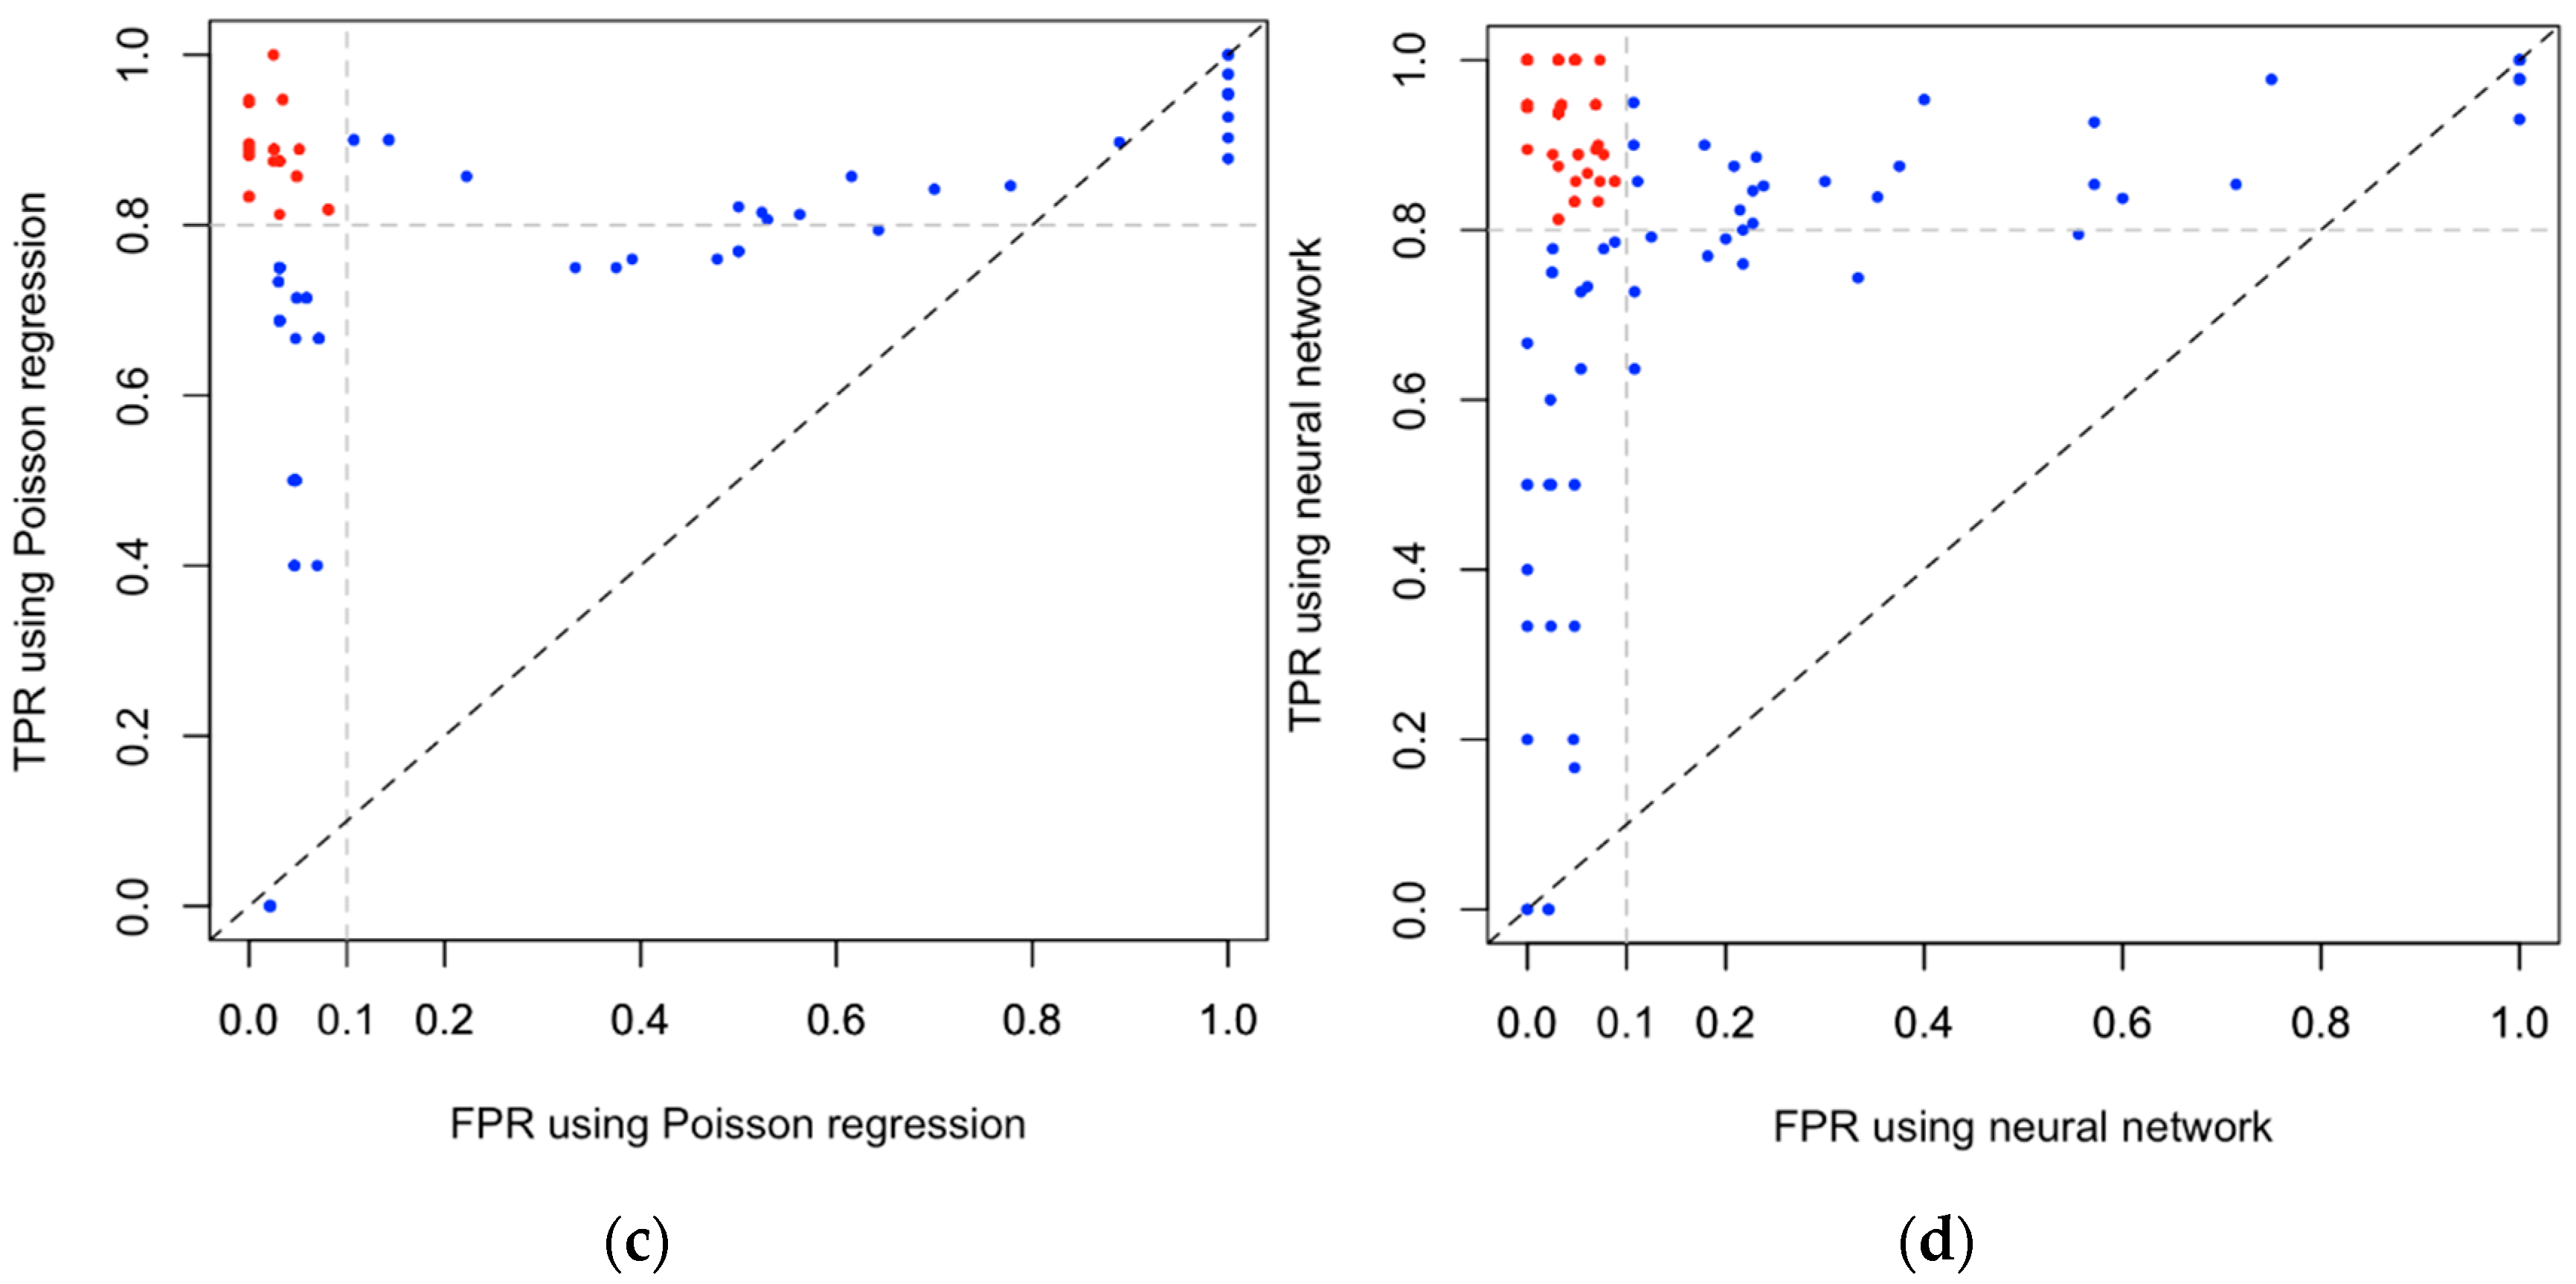
After testing the effectiveness of four candidate predictors, we used leave-one-out cross-validation to investigate the predictability of Poisson regression and neural networks. The predicted ESD versus original records is given in Figure 5a,b, where the high R-squared value (0.791 for Poisson regression and 0.924 for neural networks) suggests PCs of teleconnection indices to be useful in the prediction of ESD over CDR. In addition, the application of the neural networks to the PCs resulted in a significant improvement in the under-estimation of the top quartile group in ESD with a high determinant (R2 = 0.924). For the ROC analysis, we predict the ESD of one decade for each time using Poisson regression and neural networks, and then classify the predicted result and original ESD based on thresholds, ranging from minimum to maximum ESD, to be positive (both greater than, equal to or less than the threshold) or negative. After that, we plot the results as shown in Figure 5c,d. The diagonal line connecting the left bottom and top right corners represent random guess results. Points below the line indicate worse results than random guesses, points closer to (0,1) suggest better results. The red points in the figure indicate FPR < 0.1 and TPR > 0.8, so the corresponding thresholds (around 80 for Poisson regression and 100 for neural networks) are useful in classifying the predicted results. For neural networks, ten thresholds around 100 can lead to a perfect classification result with FPR = 0 and TPR = 1. This result suggests Poisson regression and neural networks to be helpful in predicting ESD over CDR using teleconnection indices.
4. Summary and Conclusions
This study analyzed the trend of spring precipitation and ESD frequency and their lagged correlation with atmospheric teleconnection patterns over China to detect the characteristics and causes of ESD and improve its predictability. Based on complete daily precipitation data from 1961–2017 covering 537 stations over Chia, SPI3 are computed for drought analysis. The main results are summarized as follows. In recent decades (2001/2007/2011), central and southeast China has undergone several severe drought disasters. Therefore, a CDR over 25 °N–35 °N, 105 °E–120 °E under more severe drought risk is defined for drought prediction in this study. According to modified MK test on spring precipitation and ESD, it was found that there is a significant decadal drying trend in central and southeast China, which is approximately identical with CDR. To predict drought events over CDR, eight teleconnection indices have been chosen as candidate parameters through lagged correlation analysis. Firstly, PCA is employed to extract useful information in predictors and reserve it in linearly uncorrelated variables, and then these PCs are adapted to conduct further forecasting analysis.
Based on PC1 and PC2 using the tree-based model, ESD over CDR is classified into three groups, where ESD frequency is higher in Group 3 according to the empirical probability function. This result may be used as a useful warning signal—when PC1 < 0. 04479 and PC2 ≥ −0.02289, the drought risk is higher over CDR. When we use Poisson regression to model ESD over CDR, the coefficient of determination between the model result and original ESD has reached 0.834, which strongly suggests these variables to be prediction parameters.
ESD over CDR is well predicted by Poisson regression and neural networks using PCs, with the R-squared value equal to 0.834 and 0.914. The ROC evaluation of the prediction results also suggests these two models be candidate prediction techniques. In addition, this study identified the applicability of the ESD prediction in China’s CDR through combined neural networks and PCs for ATPs. The results of the study were based on limited observations, but this study makes it possible to diagnose ESD and clarify its drought prediction techniques and practical strategies for coping with ESD in China. Then Leave-one-out cross-validation is applied to investigate the predictability of Poisson regression and neural networks. The higher R-squared value 0.924 for neural networks (compared to 0.791 for Poisson regression) reveals that ESD over CDR is highly predictable using PCs and appropriate methodology. Besides, the application of the neural networks to the PCs resulted in a significant improvement in the under-estimation of the top quartile group in ESD. Using the ROC analysis, ten thresholds around 100 can lead to a perfect classification result with FPR = 0 and TPR = 1 based on neural networks. Based on the above analysis, we highly suggest that the excellent classification result of ESD based on PC1 and PC2 and the high predictability using neural networks on ESD may be helpful in drought management in central and southeast China.
Author Contributions
conceptualization, Q.G. and J.-S.K.; Formal analysis, Q.G. and J.-S.K.; Methodology, J.C. and J.-S.K.; resources, H.C.; writing—original draft preparation, Q.G. and J.-S.K.; writing—review and editing, J.C., H.C., and J.-H.L.
Funding
This collaborative research was funded by the National Research Foundation of Korea (grant number: NRF-2018K2A9A06024031) and the National Natural Science Foundation of China (grant number: NSFC-51811540407).
Conflicts of Interest
The authors declare no conflicts of interest.
References
- Jefferson, M. IPCC Fifth Assessment Synthesis Report: “Climate Change 2014: Longer Report”: Critical Analysis; Elsevier: New York, NY, USA, 2015; pp. 362–363. [Google Scholar]
- Mishra, A.K.; Desai, V.R. Drought forecasting using feed-forward recursive neural network. Ecol. Model. 2006, 198, 127–138. [Google Scholar] [CrossRef]
- Chen, S.; Muhammad, W.; Lee, J.H.; Kim, T.W. Assessment of Probabilistic Multi-Index Drought Using a Dynamic Naive Bayesian Classifier. Water Resour. Manag. 2018, 32, 4359–4374. [Google Scholar] [CrossRef]
- Lee, J.H.; Park, S.Y.; Kim, J.S.; Sur, C.Y.; Chen, J. Extreme drought hotspot analysis for adaptation to a changing climate: Assessment of applicability to the five major river basins of the Korean Peninsula. Int. J. Climatol. 2018, 38, 4025–4032. [Google Scholar] [CrossRef]
- Dai, A. Increasing drought under global warming in observations and models. Nat. Clim. Chang. 2013, 3, 52–58. [Google Scholar] [CrossRef]
- Dai, A. Drought under global warming: A review. Wiley Interdiscip. Rev. Clim. Chang. 2011, 2, 45–65. [Google Scholar] [CrossRef]
- Zhai, J.Q.; Su, B.; Krysanova, V.; Vetter, T.; Gao, C.; Jiang, T. Spatial variation and trends in PDSI and SPI indices and their relation to streamflow in 10 large regions of China. J. Clim. 2010, 23, 649–663. [Google Scholar] [CrossRef]
- Breiman, L. Classification and Regression Trees; Routledge: Abingdon, UK, 2017. [Google Scholar]
- Jin, D.; Guan, Z.; Tang, W. The Extreme Drought Event during Winter–Spring of 2011 in East China: Combined Influences of Teleconnection in Midhigh Latitudes and Thermal Forcing in Maritime Continent Region. J. Clim. 2013, 26, 8210–8222. [Google Scholar] [CrossRef]
- Zhang, Q. Drought and its impacts. In China Climate Impact Assessment; China Meteorol Press: Beijing, China, 2003. [Google Scholar]
- Palmer, W.C. Meteorological Drought, Weather Bureau Research Paper No. 45; United States Department of Commerce: Washington, DC, USA, 1965.
- McKee, T.B.; Doesken, N.J.; Kleist, J. The relationship of drought frequency and duration to time scales. In Proceedings of the 8th Conference on Applied Climatology, Boston, MA, USA, 17–22 January 1993; American Meteorological Society: Boston, MA, USA, 1993; pp. 179–183. [Google Scholar]
- Heim, J.R.; Richard, R. A review of twentieth-century drought indices used in the United States. Bull. Am. Meteorol. Soc. 2002, 83, 1149–1165. [Google Scholar] [CrossRef]
- Zou, X.; Zhai, P.; Zhang, Q. Variations in droughts over China: 1951–2003. Geophys. Res. Lett. 2005, 32, L04707. [Google Scholar] [CrossRef]
- Sun, C.; Yang, S. Persistent severe drought in southern China during winter–spring 2011: Large-scale circulation patterns and possible impacting factors. J. Geophys. Res. Atmos. 2012, 117. [Google Scholar] [CrossRef]
- Wang, Z.; Zhai, P. Climate Change in Drought over Northern China during 1950–2000. Acta Geogr. Sin. 2003, 58, 61–68. [Google Scholar]
- Hayes, M.J.; Wilhelmi, O.V.; Knutson, C.L. Reducing drought risk: Bridging theory and practice. Nat. Hazards Rev. 2004, 5, 106–113. [Google Scholar] [CrossRef]
- Mishra, A.K.; Singh, V.P. A review of drought concepts. J. Hydrol. 2010, 391, 202–216. [Google Scholar] [CrossRef]
- Deo, R.C.; Şahin, M. Application of the extreme learning machine algorithm for the prediction of monthly Effective Drought Index in eastern Australia. Atmos. Res. 2015, 153, 512–525. [Google Scholar] [CrossRef] [Green Version]
- Zhang, Z.; Jin, Q.; Chen, X.; Xu, C.Y.; Jiang, S. On the linkage between the extreme drought and pluvial patterns in china and the large-scale atmospheric circulation. Adv. Meteorol. 2016, 2016, 8010638. [Google Scholar] [CrossRef]
- Wu, Y.; Wu, S.; Wen, J.; Xu, M.; Tan, J. Changing characteristics of precipitation in China during 1960–2012. Int. J. Climatol. 2016, 36, 1387–1402. [Google Scholar] [CrossRef]
- Xin, X.; Yu, R.; Zhou, T.; Wang, B. Drought in Late Spring of South China in Recent Decades. J. Clim. 2006, 19, 3197–3206. [Google Scholar] [CrossRef]
- Kim, J.S.; Seo, G.S.; Jang, H.W.; Lee, J.H. Correlation analysis between Korean spring drought and large-scale teleconnection patterns for drought forecasting. KSCE J. Civ. Eng. 2017, 21, 458–466. [Google Scholar] [CrossRef]
- Irannezhad, M.; Chen, D.; Kløve, B.; Moradkhani, H. Analysing the variability and trends of precipitation extremes in Finland and their connection to atmospheric circulation patterns. Int. J. Climatol. 2017, 37, 1053–1066. [Google Scholar] [CrossRef]
- Barnston, A.G.; Livezey, R.E. Classification, seasonality and persistence of low-frequency atmospheric circulation patterns. Mon. Weather Rev. 1987, 115, 1083–1126. [Google Scholar] [CrossRef]
- Hurrell, J.W. Decadal trends in the North Atlantic Oscillation: Regional temperatures and precipitation. Science 1995, 269, 676–679. [Google Scholar] [CrossRef] [PubMed]
- Yu, R.; Zhou, T. Impacts of winter-NAO on March cooling trends over subtropical Eurasia continent in the recent half century. Geophys. Res. Lett. 2004, 31, 261–268. [Google Scholar] [CrossRef]
- Mo, R.E.; Livezey, R.E. Tropical-extratropical geopotential height teleconnections during the Northern Hemisphere winter. Mon. Weather Rev. 1986, 114, 2488–2515. [Google Scholar] [CrossRef]
- Myronidis, D.; Stathis, D.; Ioannou, K.; Fotakis, D. An Integration of Statistics Temporal Methods to Track the Effect of Drought in a Shallow Mediterranean Lake. Water Resour. Manag. 2012, 26, 4587–4605. [Google Scholar] [CrossRef]
- Szinell, C.S.; Bussay, A.; Szentimrey, T. Drought tendencies in Hungary. Int. J. Climatol. J. R. Meteorol. Soc. 1998, 18, 1479–1491. [Google Scholar] [CrossRef] [Green Version]
- Hamed, K.H.; Rao, A.R. A modified Mann-Kendall trend test for autocorrelated data. J. Hydrol. 1998, 204, 182–196. [Google Scholar] [CrossRef]
- Wold, S.; Esbensen, K.; Geladi, P. Principal component analysis. Chemom. Intell. Lab. Syst. 1987, 2, 37–52. [Google Scholar] [CrossRef]
- Kim, J.S.; Jain, S.; Moon, Y.I. Atmospheric teleconnection-based conditional streamflow distributions for the Han River and its sub-watersheds in Korea. Int. J. Climatol. 2012, 32, 1466–1474. [Google Scholar] [CrossRef]
- Zou, K.H.; O’Malley, A.J.; Mauri, L. Receiver-operating characteristic analysis for evaluating diagnostic tests and predictive models. Circulation 2007, 115, 654–657. [Google Scholar] [CrossRef]
Figure 1.
Precipitation data from 537 stations over China during the period 1961–17. (a) Location of 537 weather stations and topography over China; and (b) Annual precipitation (mm) and nine major river basins in China (1 = Continental River Basin; 2 = Songliao River Basin; 3 = Haihe River Basin; 4 = Yellow River Basin; 5 = Huaihe River Basin; 6 = Yangtze River Basin; 7 = Southwest River Basin; 8 = Southeast River Basin; 9 = Pearl River Basin).

Figure 2.
Spring extreme droughts and composite anomaly of meridional wind (m/s) at the corresponding areas in 2001 (a1/a2), 2007 (b1/b2), and 2011(c1/c2).
Figure 2.
Spring extreme droughts and composite anomaly of meridional wind (m/s) at the corresponding areas in 2001 (a1/a2), 2007 (b1/b2), and 2011(c1/c2).

Figure 3.
(a) Modified Mann–Kendall trend of spring precipitation; and (b) extreme drought frequency at 10% and 5% significance levels.
Figure 3.
(a) Modified Mann–Kendall trend of spring precipitation; and (b) extreme drought frequency at 10% and 5% significance levels.

Figure 4.
Classification of decadal spring extreme drought frequency in the core drought region based on (a) tree-based model; (b) probability density of each group; and (c) principal component 1 (PC1) and principal component 2 (PC2).
Figure 4.
Classification of decadal spring extreme drought frequency in the core drought region based on (a) tree-based model; (b) probability density of each group; and (c) principal component 1 (PC1) and principal component 2 (PC2).

Figure 5.
Extreme spring drought (ESD) frequency over CDR (a) using Poisson regression; and (b) neural networks. Receiver Operating Characteristics (ROC) evaluation for prediction results of (c) Poisson regression; and (d) neural networks.
Figure 5.
Extreme spring drought (ESD) frequency over CDR (a) using Poisson regression; and (b) neural networks. Receiver Operating Characteristics (ROC) evaluation for prediction results of (c) Poisson regression; and (d) neural networks.


Table 1.
Major Atmospheric Teleconnection Patterns in Different Regions of the Northern Hemisphere.
| Regions | Prominent Patterns |
|---|---|
| North Atlantic | North Atlantic Oscillation (NAO) |
| East Atlantic (EA) | |
| Eurasia | East Atlantic/Western Russia (EATL/WRUS) |
| Scandinavia (SCA) | |
| Polar/Eurasia (POL) | |
| North Pacific/North America | West Pacific (WP) |
| Pacific/North American (PNA) | |
| Tropical/Northern Hemisphere (TNH) |
Table 2.
Explained variance of principal components (PCs) for decadal teleconnection indices.
| Importance of Components | PC1 | PC2 | PC3 | PC4 | PC5 | PC6 | PC7 | PC8 |
|---|---|---|---|---|---|---|---|---|
| Standard deviation | 29.6473 | 12.3784 | 9.96176 | 5.87891 | 4.31489 | 3.18466 | 2.01416 | 3.378 × 10⁻¹⁵ |
| Proportion of Variance | 0.7332 | 0.1278 | 0.08278 | 0.02883 | 0.01553 | 0.00846 | 0.00338 | 0.00001 |
| Cumulative Proportion | 0.7332 | 0.861 | 0.94379 | 0.97262 | 0.98816 | 0.99662 | 0.99999 | 1 |
Table 3.
Coefficients of Poisson regression.
| Estimate | Std. Error | z value | Pr(>|z|) | Remark | |
|---|---|---|---|---|---|
| Intercept | 4.6318 | 0.0186 | 249.018 | <2 × 10⁻¹⁶ | *** |
| PC1 | −2.3031 | 0.1483 | −15.530 | <2 × 10⁻¹⁶ | *** |
| PC2 | 1.5252 | 0.1111 | 13.728 | <2 × 10⁻¹⁶ | *** |
| PC3 | −1.0643 | 0.1128 | −9.437 | <2 × 10⁻¹⁶ | *** |
| PC4 | −0.7187 | 0.1155 | −6.220 | 5 × 10⁻¹⁰ | *** |
*** means significance level is nearly 0.
© 2019 by the authors. Licensee MDPI, Basel, Switzerland. This article is an open access article distributed under the terms and conditions of the Creative Commons Attribution (CC BY) license (http://creativecommons.org/licenses/by/4.0/).
Share and Cite
MDPI and ACS Style
Gao, Q.; Kim, J.-S.; Chen, J.; Chen, H.; Lee, J.-H. Atmospheric Teleconnection-Based Extreme Drought Prediction in the Core Drought Region in China. Water 2019, 11, 232. https://doi.org/10.3390/w11020232
AMA Style
Gao Q, Kim J-S, Chen J, Chen H, Lee J-H. Atmospheric Teleconnection-Based Extreme Drought Prediction in the Core Drought Region in China. Water. 2019; 11(2):232. https://doi.org/10.3390/w11020232
Chicago/Turabian StyleGao, Qinggang, Jong-Suk Kim, Jie Chen, Hua Chen, and Joo-Heon Lee. 2019. "Atmospheric Teleconnection-Based Extreme Drought Prediction in the Core Drought Region in China" Water 11, no. 2: 232. https://doi.org/10.3390/w11020232
Note that from the first issue of 2016, this journal uses article numbers instead of page numbers. See further details here.