Examining Water Security in the Challenging Environment in Togo, West Africa


1
Pan African University Institute of Water and Energy Sciences Including Climate Change, Tlemcen, Algeria. B.P. 119 Pôle Chetouane, Tlemcen 13000, Algeria
2
Faculty of Social sciences, Center for Middle Eastern Studies, Lund University, 22100 Lund, Sweden
3
Université de Lomé, Lomé 01BP1515, Togo
*
Author to whom correspondence should be addressed.
Water 2019, 11(2), 231; https://doi.org/10.3390/w11020231
Submission received: 30 October 2018
/
Revised: 25 January 2019
/
Accepted: 28 January 2019
/
Published: 29 January 2019
(This article belongs to the Section Water Resources Management, Policy and Governance)
Abstract
:Water shortages across the globe have increased due to climate change among other factors with negative impacts expected at the river basin level. Anticipating these impacts will help experts act in a timely manner to avoid a future water crisis. As part of addressing the future water shortage impacts on the Togolese community, this paper assessed water security in the context of the global environmental change in the Oti River Basin taking Oti Nord sub-basin (ONSB) as a case study. Key informants’ interviews were done with staff from governmental institutions, Non-Governmental Organizations (NGOs), community-based organizations, and private operators. The Improved Fuzzy Comprehensive Evaluation Model (IFCEM) was used for assessing water security (WS). A basin level WS evaluation system including five subcomponents (external environment security, water resources security, water-society security, water economic security, and water-environment security) and 23 indicators related to climate, socio-economy, water availability, and consumption were constructed. The results showed that the water level is very insecure in the sub-basin for the assessed years (2010, 2015, and 2025) with the year 2025 being the worst (expected a decrease of water security by 20% and 1% in 2025 compared to the years 2015 and 2010, respectively). This insecurity is found to be the result of many factors including technical, institutional, juridical, environmental, socio-cultural, hydrogeological, and demographical factors. However, managerial factors such as institutional instability, the inadequacies in water and related sector evolution, and the absence of de-centralized water management structures, the non-operationalization of management organs/financial instruments, and culture (i.e., taboos and bylaws) are found to be key to the study area. The paper concluded that the operationalization of management organs/financial instruments may enable the application of adopted water policies and regulations, which may lead to a sound and coordinated management of the available water resources since this will enable the government’s self-investment in clean water provision, data acquisition (potential water available and the estimation of economic driven potential water needs, which are key for any sound development), and a stimulated joined effort from the existing institutions. In addition, the establishment of a sound waste management system and awareness raising, and educative activities regarding water pollution will be of great benefit for this cause.
1. Introduction
1.1. Background of the Study
Water security is broadly referred to as a condition where there is a sufficient quantity of water meeting quality standards at an affordable price, for sustaining both the short-term and long-term livelihoods, human well-being, socio-economic development, and ecosystem services [1].
Statistics have shown that 66% of the world population experiences severe water scarcity for, at least, a part of the year. While one billion people face severe water scarcity all year round [2]. The driving forces to this global water insecurity include population explosion, urbanization, economic development, changes in living standard, water pollution, over-abstraction of groundwater, and climate change [3,4]. All these drivers are expected to increase the level of water shortage due to the increase in water demand [4,5].
According to the International Panel on Climate Change [6], vulnerability of freshwater resources will be associated with severe consequences for economic, social, and ecological systems. Nevertheless, both vulnerability and consequences to be faced are reported to vary across the globe depending on factors such as the geographical location, water availability and utilization, demographic changes, existing management and allocation systems, water management legal frameworks, existing governance structures, institutions, and the resilience of ecosystems.
Climate models projected an increase in the aridity in the 21st century in most parts of the globe (including Africa, southern Europe, the Middle East, America, Australia, and Southeast Asia) [7]. These changes were reported to be associated with an increase of the incidence of extremes weather events, which will increase the risks of water supplies, the sea-level rise, and the seawater intrusion [6]. Moreover, IPCC projected that each degree of the warming, will expose approximately 7% of the global population to at least 20% decrease of renewable water resources [8,9]. Thus, an annual $500 billion has been reported as the cost associated with water insecurity to the global economy [10]. The situation is reported to be the subject of amplification at any point in the world [11]. Predictions have shown that the international river basin are likely to experience ‘low water security’ over the coming decades [12]. As a result, an increase in the percentage of global population living in river basins with new or aggravated water scarcity is projected to increase [13].
By 2050, half of the world’s population is expected to live in water-stressed areas [9,14]. In Africa, by 2030, up to 250 million people are expected to live in areas with high water stress [15]. Togo faces a high threat regarding water security [5]. The Volta River Basin and the Niger River Basin are generally considered to be the most affected basins by freshwater shortage in West Africa due to climate change [16]. The simulation tool SimCLIM2013 showed a 1 °C increase in temperature against a decrease in the associated precipitation up to 80 mm/year and a decrease in the number of rainy days and an alteration in the rainfall distribution over the period from 1986 to 2012 compared to the reference period from 1961 to 1985 in the Togo scenario [17]. Groundwater depletion observed in the overall country with the resource is expected to be completely exhausted by 2055 in the savannah region (which belong to the Oti Nord Sub-basin) under the extreme scenario [17].
Problems like a water shortage, water pollution, and environmental deterioration in Togo may get worse and become a major impediment to the country’s socio-economic development. Nevertheless, existing studies have only looked at the potential impacts of climate change on ground water with a focus on administrative boundaries [17] and urban water supply [18]. Very few studies have meticulously assessed water security at the hydrological basin level. Based on the above, the present study aims to quantify water security in the Oti River Basin (ORB) in Togo in the challenging environment over time using the Improved Fuzzy Comprehensive Evaluation Model under various socio-economic and physical water condition scenarios by investigating the contributing factors to the state of water level in the basin.
1.2. Water Security in Sub-Saharan Africa
In Sub-Saharan Africa (SSA), the threat facing water resources have impacts whether indirectly or directly on health, food production, ecosystems, and conflict occurrence [19]. Several studies showed that food production in SSA will be adversely affected as a result of water scarcity [20]. As a matter of fact, farming communities (especially the smallholder) in Africa are facing a series of robust negative impacts of climate variability and change on their production including crop and livestock losses among other consequences [21,22]. Consequently, this situation will be associated with an increase in nutrition challenges [23].
On the other hand, water shortages in transboundary water basins can be the base for cooperation or confrontation among the states [24,25] and can increase conflict possibilities in fragile places like SSA among others [26]. As a matter of fact, projection showed an increase in conflicts associated with water scarcity and stress [27]. Transboundary river basins in Africa, especially in SSA, are expected to face an increasing trend in water scarcity and stress pattern. In West Africa, the Volta River Basin (to which the Oti River Basin is part) and the Niger River Basin have already been reported as the most affected basins by a freshwater shortage [28].
1.3. Water Security Assessment
There is a variety of methods used to assess water security including indices, indicators, frameworks, and models. Some of these models are described below.
I- Water Security Status Indicators (WSSI): The WSSI assessment method is designed to (1) provide a framework to guide communities in selecting suitable or appropriate freshwater indicators, (2) integrate governance throughout the assessment process, first by incorporating stakeholders and second by incorporating the results of the assessment into water planning decisions and behaviour modifications, and (3) provide a path to integrate the assessment of both water quantity and water quality in terms of aquatic ecosystems and human health [29]. Although this method is innovative and flexible based on its characteristics, it is not adaptable.
II- The Canadian Water Sustainability Index: The Canadian Water Sustainability Index (CWSI) is based on numerical scoring. It integrates a range of water-related data and information into a series of indicators where each of them is assigned a score ranging from 0 to 100, with a higher score meaning that the community is closer to the ideal conditions for the said indicator [30]. A total of 15 indicators are considered and grouped into five component scores, where each component score comprises the average score for the three indicators. The five component scores are then averaged to calculate the final CWSI score. Although it was found to be adaptable with “some minor modifications” [30], and receptive among communities (due to the reflection of its indicators of communities’ reality), the method is usually limited by its huge requirement of data, which are sometimes unavailable and create a data gap.
III- Asian Water Development Framework: The Asian Water Development Framework has been developed with the objective of establishing a mean of measuring water security. It focuses on the importance of measurements. The assessment is done through a set of key indicators that represents the inherent tensions among different water uses since water resources are under increasing stress. These key indicators include household water security, economic water security, urban water security, environmental water security, and resilience to water-related disasters. The framework is known for its capacity to indicate the adequate adaptation options (whether increasing investment, improving governance, or expanding capacity in the water sector). It is also known for its replicability and its ability to provide a robust, pragmatic, and readily understood assessment of water security. Nevertheless, the indicators are known to be very complex. In addition, this framework is limited to national and regional rather than individual basins level water security assessment. Furthermore, the framework provides only the baseline for analyzing trends and the effects of policies and reforms that can be monitored and reported to stakeholders. The framework offers a new way for leaders to look at the strengths and weaknesses of water resources management and service delivery.
IV- Fuzzy comprehensive evaluation model: This method uses the catastrophe fuzzy membership functions and fuzzy numbers to determine, respectively, the dependency of water security on variables such as climate change, economic development, and population growth. Thus, it can easily evaluate water security under the challenging environment (including climate change, economic development, and population growth, etc.). In addition, the method is known for its aptitude to reduce the subjectivity in the evaluation process (associated with expert judgement during the weighting process), which can create bias and make the overall result less reliable [31]. In addition, the method provides more options compared to other classic theories (limited either to no or yes but not both) in terms of subjective criteria measurement under the fuzzy environment. The Fuzzy Comprehensive Evaluation Model (FCEM) is recognized as effective in the way to formulate decisions to problems in a fuzzy environment associated with uncertainties such as environmental changes (including climate change, changes in population, and land degradation) [32]. Thus, it can be widely used to understand the environmental change impact on water security and identify adaptation measures.
2. Methodology
2.1. Study Area
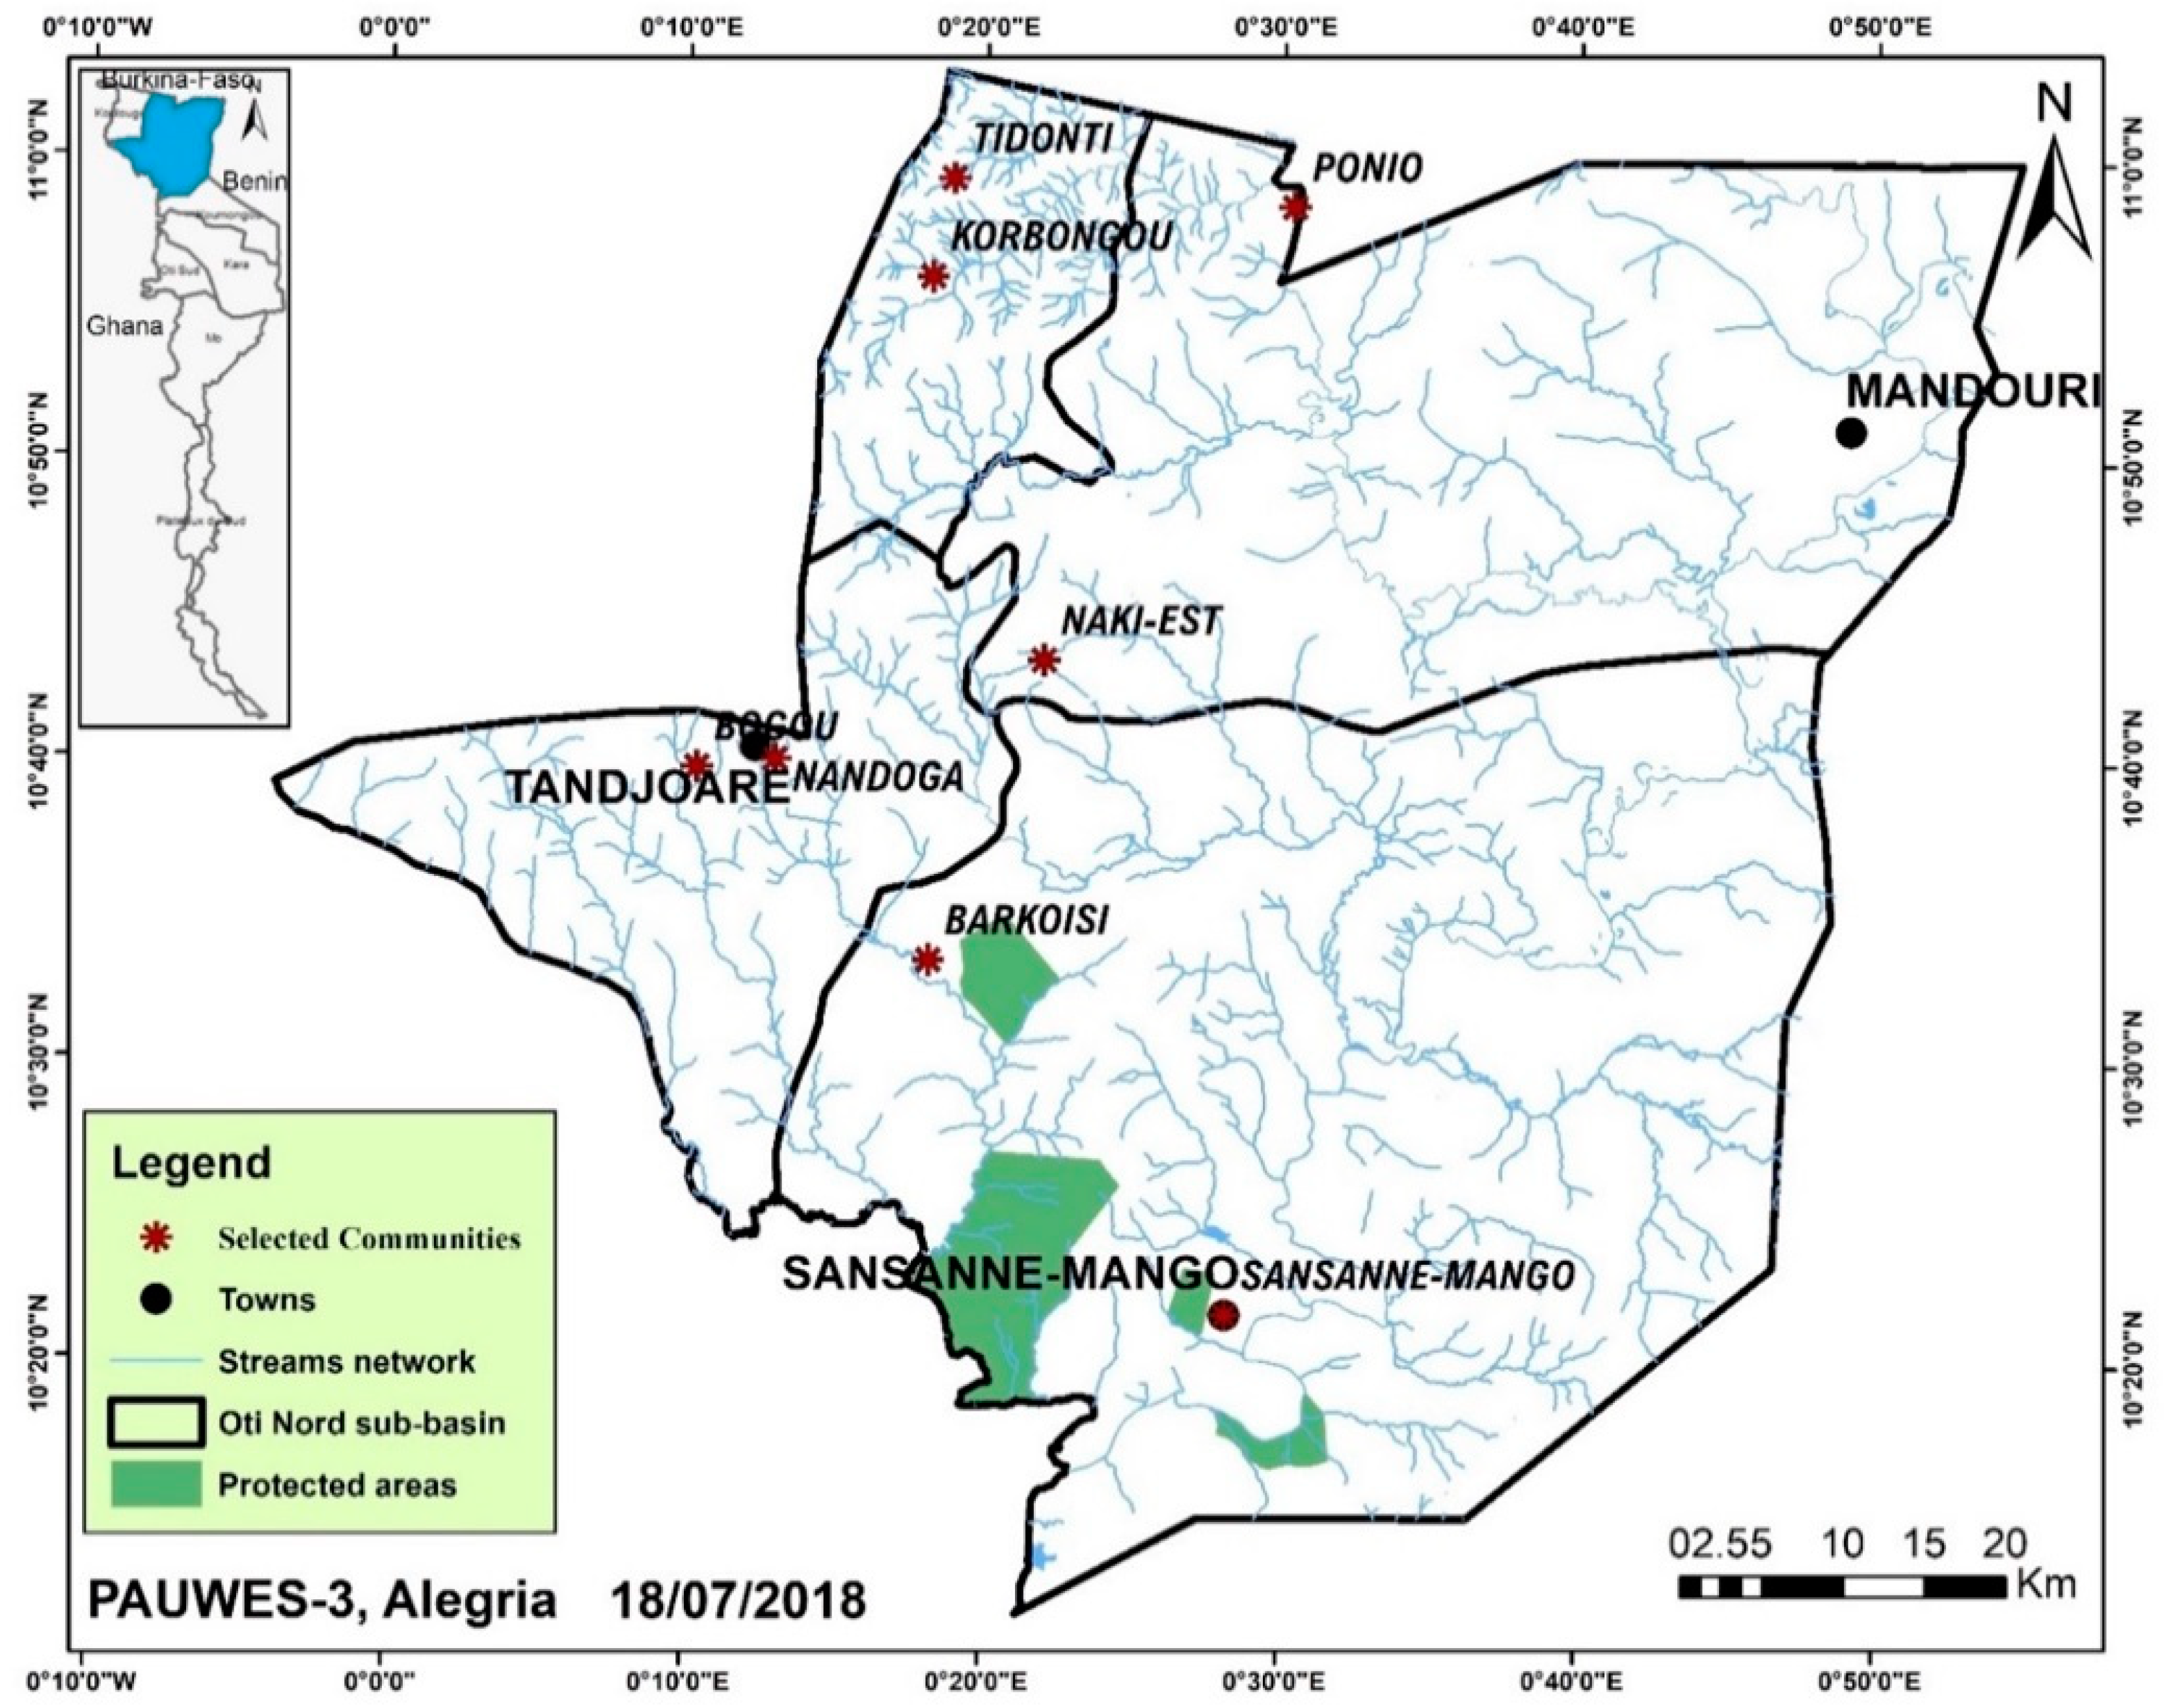
The ORB represents the Togolese part of the Volta River Basin, which stretches from approximately the latitude 5°30′ N in Ghana to the latitude 14°30′ N in Mali. It covers an area of 26,700 km2, which is about 47.3% of the country, and lies between 6°10′ and 11°10′ latitude north and between 0° and 1°25′ longitude east. This study was conducted in the Oti Nord sub-basin (ONSB), which is one of the sub-basins of the Oti River Basin (Figure 1). The ONSB covers the entire Kpendjal district and small portions of Tandjoare, Tone, and Oti districts. The ONSB is part of the savannah region characterized by high population growth rate, a high poverty level (65% of the population in 2017), and food insecurity (53.3% of the population in 2010) [33]. In addition, the study area is also known for its acute land degradation and high exposure to flood events [34]. Groundwater is the main water resources in the ONSB. Currently, there are neither wastewater treatment plants nor a sound domestic waste management system, which results in high pollution of water sources (especially surface water). From a hydrological point of view, the Oti River drains the sub-basin and its tributaries are characterized by a simple seasonal variation with high water levels between August and October. The River’s annual flow varies between 100 and 300 m3/s, while the annual recharge capacity in ONSB is about 177 mm.
2.1.1. Data Collection
To achieve the objectives of this study, a multi-stage sampling technique was employed where all districts in the sub-basin have been considered and the counties were purposely selected based on the availability of community-based organizations. As a result, eight counties were selected, namely, Sansanne-Mango, Ponio, Tidonti, Korbongou, Barkoisi, Naki Est, Bogou, and Nandoga. A total of 12 community-based organizations out of the selected counties were available and accessible during the period of data collection (April to July 2018).
Primary data were collected using a semi-structured interview. The overall interview was done with key persons purposely selected (persons knowledgeable about or who work in the context of Oti River basin) from the identified institutions. Meost of the informants held senior positions within the institutions (e.g., Director, Monitoring/Evaluation Officer, Project manager/leader) with most of them having at least three years working experience in the institution.
Secondary data were obtained from existing literature, governmental documents, and databases. These data included climate-based parameters, socio-economic parameters, physical characteristics of water resource, societal water usage, and sanitation practices.
The obtained data, Table 1, were analysed in three ways: (1) data on contributing factors to the state of water level in the basin were analysed using simple descriptive statistics of the SPSS and Excel, (2) data about water resource and its interaction with the environment and society were analysed in a multiple steps-wise approach (based on the improved fuzzy comprehensive evaluation model) to quantify the water security level, and (3) ArcGIS was used for mapping the study site.
2.1.2. The Fuzzy Comprehensive Evaluation Model (FCEM) and the Improved Fuzzy Comprehensive Evaluation Model (IFCEM)
The fuzzy comprehensive evaluation model is based on the catastrophe theory that is initially designed to deal with discontinuous dynamic systems, especially those governed by potential energy-like functions [35]. The theory is associated with basic assumptions with results having their application in other domains. Assuming a dynamic system M with a set of input variables (control variables) and output variables (response variables). The potential function V of the said system can be expressed as V (x, u) with x and u representing, respectively, the response variables and the control variables. According to Loehle (1989) [36], the control variables can be assumed to be slowly dynamic compared to the state variables. The value of all control variables known as “catastrophe progression” ranges between 0 and 1 in the normalization formula and can be obtained from the initial membership function through recursive algorithms subject to the normalization formula.
The catastrophe evaluation method was improved by Reference [37] with the purpose of accommodating sub-systems to have high-level indicators (more than four) and incorporate the gradations of evaluations’ samples. The multi-criteria evaluation method consists of three steps: (1) dividing the system into sub-systems, parameters, and then indicators (organized in each sub-system based on the their inner logic relationships and their importance) [35], (2) normalizing the initial data obtained using catastrophe theory and fuzzy mathematics (based on the adequate catastrophe model) [38], (3) finalizing the value of each subsystem based on the principle of a minimum value or the principle of a mean value (depending on whether the indicators are complementary to each other or interchangeable within one system) [35].
The improvement of the traditional catastrophe evaluation method was done through the introduction of an additional fuzzy membership function (for sub-systems having more than four low level variables/indicator) and a score transformation formula. The improved catastrophe evaluation method follows a series of seven steps depicted below.
Step-1: Establishment of the Indicator System
Water security represents the result of interaction between water as a natural resource, the environment, and the society (involving economic activities) among other factors. As the result, factors such as climate change, population growth, and economic development among others may have some impacts on water security since they are under a continuous change. Although these factors are independent, they may interact and restrain one another within the system, which affects water security.
While combining the concepts of entity and the association model, the water security system based on the study context and the available literature [39] among others is divided into five sub-systems in the present study and includes external environment security, water resources security, water-society security, water economic security, and water-environment security. “Water resources security” depicts the characteristics of water as a resource in the sub-basin, especially its physical availability to sustain all kinds of human activity (including domestic, agricultural, commercial, recreational, and others). It throws light on how much water is available. The “water-society security” subsystem is the reflection of the interaction between water and society. It expresses the society utilization pattern of the physical water resources. “Water-economic security” subsystem focuses on the value of water allocated for all economic activities in the sub-basin. It brings together agriculture, industry, and other economic activities. The “water-environment security” subsystem mainly addresses the health of surface and ground waters in the study area. In this case, only the quality of water in the ecosystem is considered (as the environment flow is not yet defined in Togo). Lastly, the “External environment security” subsystem refers to factors that are not directly part of the water system, but that interact and affect the system. For each sub-system, key parameters have been selected. Lastly, the overall indicators have been defined based on the parameters selected including the literature as well as the context of the study.
Step 2: Normalization of the Indicator’s Values
The original value of each indicator is attached with a range and unit. The normalization is a process which consists of converting indicators’ original values into dimensionless values to make their use easier (as they become free from their units). The normalization is completed based on the functional relationship (positive or negative) of each indicator. In this case, values of indicators were transformed into numbers ranging between 0 and 1 using the “larger is better” formula (for variables expressing a better condition when their values are large) (1) or “smaller is better” formula (for variables expressing a better condition when their values are small) (2) as follows.
where i is the indicator, Xi the original value of i, and Ximin and Ximax are, respectively, the minimum and maximum value of the indicator i.
Step-3: Establishment of the Fuzzy Membership Function
This step follows the normalization step and consists of establishing the catastrophe fuzzy membership function for each indicator selected through catastrophe models (function of the number of low-level indicators contained in a high-level index, which are sub-systems). In this case, the low-level variables are the systems’ indicators while the high-level variables are the systems’ sub-systems. The fuzzy membership function for a high-level index containing two low level variables (cusp model) or three low level variables (swallowtail model) or four low level variables (butterfly model) [38] or five low level variables (Wigmam model) [37] are shown below.
Step-4: Calculation of Sub-Systems /Indexes
The calculation of the sub-systems’ values and the overall water security value follow either the un-comparative/minimum value or the comparative/mean value principles, as described below.
(a) Un-Comparative or Minimum Value Principle
The function of the control variables cannot be replaced with each other within the sub-system. Therefore, the minimum value of the control variables (a, b, c, d....n) can be used for the sub-system.
(b) Comparative or Mean Value Principle
The control variables can fill up the deficiency of each other. Therefore, their mean value can be used for the system, as depicted below.
Step-5: Calculation of Water Security
The water security value is then obtained through successive calculations in accordance with the priority of the levels. In the context of this study, the overall water security (which represents, in this case, the high-level index) contains five low level indices (SS1, SS2, SS3, SS4, SS5), which makes it fit the Wigwam catastrophe model depicted below.
As all the sub-systems are complementary in achieving the overall water security, the comparative or mean value principle was applied, and the formula is shown below.
Step-6: Score Transformation
It consists of determining the gradations of the evaluation samples since these gradations are difficult to establish directly through the catastrophe evaluation method [37]. It helps transform the high values obtained from the catastrophe evaluation method, which is difficult to compare into more commonly used synthetic values. This supposes that the relative membership degree for all indices are equal to where xi is determined by the number of grades. Based on the suitable catastrophe model and the theory of Cramer’s Rule and Vander monde determinant, the modified values of the water security (Y) can be obtained using the following formula.
Step-7: Water Security Gradation
In this study, the gradation system adopted is the one proposed by Reference [37]. The water security level is divided into five grades: 0.2 (very insecure), 0.4 (insecure), 0.6 (basic security), 0.8 (secure), and 1.0 (very secure).
3. Results and Discussion
3.1. Water Security in the ONSB
In this paper, a water security evaluation system including five sub-systems (external environment security, water resources security, water-society security, water economic security, and water-environment security) and 23 indicators related to climate, socio-economy, and water availability and consumption was considered. The observed (2010 and 2015) and projected (2025) values of each indicators were obtained from the Ministry of Water and Rural Water Systems, Sanitation and Hygiene regional directorate, Water and rural water systems regional directorate, Agriculture, livestock, and fishing regional directorate, National Meteorological services, and private institutions “Togolaise des Eaux.” The overall data obtained are depicted in Table 2.
The data compiled from various sources are normalized. For the indicators expressing a better condition when their values are large, which is known as “larger is better” (positive), formula (12) is used while formula (13) is used for the indicators known as “smaller is better” (negative).
where, i is the indicator, Xi the original value of i, and Ximin and Ximax are the minimum and maximum value of the indicator, i, respectively.
The values of the indicators were transformed into dimensionless values ranging between 0 and 1, as shown in Table 3.
Taking into consideration the theory of catastrophe models, the water security system as well as the sub-system B1 meet the Wigwam model while the remaining sub-systems (B2, B3, B4, and B5) meet the butterfly model. Based on the fuzzy membership function of each involved model and the principle of the mean value (in sub-systems as well as the overall water security computation), the synthetic values of catastrophe assessment for the year 2010, 2015, and 2025 were calculated. The following equations were used for the establishment of the fuzzy memberships.
The butterfly catastrophe:
The Wigwam catastrophe:
Value of each sub-system is computed using Equation (16) while the overall water security level is computed using Equations (17) and (18).
The overall results of the values of the sub-systems and the water security in ONSB are presented in Table 4.
The values of water security sub-systems show that water-resources security sub-system followed an increasing pattern over the period of 2010 and 2015 (up to 47% in 2015 compared to 2010). This situation may be mainly due to the high stream flow in 2015 (45240 m3/year) compared to the inter-annual stream flow (approximately 32946 m3/year), which may be due to high rainfall combined with a moderate temperature). However, by 2025, the value of this sub-system is expected to decrease until 53% compared to the previous years. This situation may be attributed to the sharp increase of the temperature by 2025 (about 0.91 degree Celsius) compared to 2010 and 2015. This decrease in water-resources security in the sub-basin is in concordance with the results of the WEAP assessment of ground water resources under the changing climate in the Savanah region. As a matter of fact, the whole country faces a decrease in ground water resources (as the main source of water for a drinking purpose as well as dry season agricultural activities in the study area) with the savannah region to which the ONSB is part. It has been reported to completely exhaust its ground water resources by 2053 (under the extreme scenario of the RCP 8.5) [17].
As for the water-society security sub-system, which defines the pattern between water as a resource and the society, the value has shown an increasing pattern over the period from 2010 to 2015 (up to 34% increase in 2015 compared to 2010). This situation may be due to the overall efforts for improving clean water access in order to achieve the Millennium Development Goals targets concerning clean water. This result is consistent with the National Institute of Statistic, Demographic, and Economic Studies (INSEED) findings, which reported that the access to clean water has followed an increasing pattern over the period from 2010 to 2015 [33]. Nevertheless, this level of security is projected to decrease in 2025 by 33% compared to 2010.
At the same time, the water-environment security, which has to do with the health of the ecosystems (only quality aspect of water considered) has been characterized by a decreasing pattern over time especially compared to the year 2010 (decrease of the value of the system by up to 13% in 2025). This situation is consistent with the transboundary diagnosis of Volta River Basin findings where the degradation of the quality of surface water associated with the degradation of aquatic ecosystems has been recognized as one of the most acute problem in ORB, Togo [49,50]. This degradation in the study area is attributed to unimproved sanitation, inadequate management of domestic waste, bad fishing practices, livestock watering in the river bed, chemical from agricultural activities, and other domestic activities such as laundry in the river beds. However, the result showed that the ecosystem health will be improved by 2025 compared to 2015, which is considered as the worst. This slight increase may be due to the efforts planned for improving sanitation by ensuring access to improved latrines, which eradicates the open defecation.
For water economic security, the results depicted an overall increasing pattern (up to 33% in 2025 compared to the year 2010). This situation may be attributed to a substantial increase in livestock in the study area and irrigation projects (development of irrigation potentials known as “agropole”).
The final values of water security over time in the ONSB were obtained through the transformation of original synthetic values of water security. The transformation was done using the following equation, Equation (19), (with the overall result depicted in Table 5).
As shown in Table 5, the water security level assessment revealed an overall insecurity in the ONSB. The year 2010 has been depicted as ‘very insecure.’ Although 2015 is still in the same range of insecurity, the status of the sub-basin has improved compared to 2010. Lastly, projections depicted that the water security level will decrease by 20% in 2025 compared to the year 2015. This result is consistent with the findings of Gain et al. [12], which reported that river basins are likely to experience ‘low water security’ over the coming decades.
Water insecurity in the ONSB is found to be the result of a combination of decreasing available water resources and water quality deterioration. However, considering water barriers proposed by Reference [44], the per capita of water availability in the sub-basin decreases over time. The lowest values obtained (3033 m3 per capita per year) are higher than the water stress threshold (estimated at 1700 m3 per capita). This implies that that physical water insecurity in the ONSB is much more quality than quantity related.
3.2. Barriers to Water Security in the Sub-Basin
Although the existence of water management institutions as well as the efforts made to ensure water security by these institutions in the sub-basin, the water level is found to be insecure with the probability of being worse in the future. To be able to take measures in order to improve the future water status, existing institutions highlighted potential barriers. These factors were found to be technical (63%), institutional (44%), juridical (44%), environmental (37%), socio-cultural (22%), hydrogeological (19%), and demographical (19%). Other barriers include the siltation of river and unbeneficial source of energy for water mobilization. Most of the assessed institutions highlighted a range of barriers contributing to water insecurity in the sub-basin, explaining why, in some cases, the total exceeds 100%. The following are the details of barriers to water security in the ONSB.
(1) Technical barriers: The main highlighted technical barriers were limited fund (89%) and lack or limit water related data (40%). Other barriers included limitation in expert human resources (10%) and water infrastructures (5%). The limited fund was both in terms of a government investment in the water sector as well as the external aid in the efforts for universal provision of clean water. For the government, access to clean water is just one of the various existing priorities of the country. Thus, there are limited funds to be allocated to this need as well as other needs. As a matter of fact, the round table organized in June 2011 towards IWRM funding was without financial outcomes (MAEH, 2015). Limited water related data highlighted the fact that the data necessary, required for any sound planning, mobilization, and development of water is lacking. These data include the exact values of potential renewable water resources in the country or at the basin level, and the sectoral needs for water among others. This situation is reported to be associated with either an overestimation or underestimation of the available water resources as well as consumed water already used, and the potential user’s needs.
(2) Institutional barriers: Most of the assessed institutions have highlighted a range of institutional barriers including the limited collaboration among key actors (43%), the institutional instability (36%), the inadequacies in water and the related sector evolution (20%), absence of decentralized water management structures (14%), and the limited coordination within the sector (14%). The limited collaboration among water actors has to do with the limited concentration meetings between actors and the ineffective monitoring of water committees and clean water users and sanitation associations. Another aspect of the collaboration is the transboundary collaboration with other Volta River Basin riparian countries (especially between Togo and Burkina Faso). As a matter of fact, fishing communities in the sub-basin reported that the quantity of water in the Oti River in Mango regulated by the Kopienga dam (in Burkina Faso) has had impacts on the capture, which affects these communities’ overall revenue. The institutional instability has to do with the fact that the Ministry of Water and Rural Water Systems (MWRWS) that oversees water resources development, mobilization, and management has been submitted to an alternation of status, which acts sometimes as an autonomous institution and, at other times, as a dependent institution. As a matter of fact, the ministry acted as an independent structure only under the government of 2006 (year at which the ministry was for the first time established), between 2009 to 2013, and in 2018. Its dependency covered the periods from 2006 to 2008 (under the ministry of mining and energy) and 2013 to 2017 (under the ministry of rural equipment and the ministry of agriculture). This situation has been reported to be associated with perturbations in the process of implementation of activities at the central level, as the priorities of the ministry to which it is attached are, in most cases, privileged. Inadequacy in the water and related sector evolution concerns the water sector and the sanitation sector. Efforts are made to ensure water security (in terms of quality and quantity). However, respondents recognized that the sanitation sector is still lagging (open defecation is still going on) and reported the sector to be the “poor parent.” In fact, this aspect has been reported as being the “brain teaser” to water security. The ground observation has proven that local activities are still being managed by the central structures. All the directorates at the central level are not represented at the local level and all the water-related activities are coordinated only by the regional water and rural water systems directorate, which is specifically mandated as a technical service.
(3) Juridical barriers: The non-application of juridical texts (77%), the non-operationalization of management organs/financial instruments (36%), and the political will (20%) are the key factors that have been highlighted as being the juridical barriers to water security in the ONSB. As a matter of fact, organs to be adopted according to the water code in order to ensure an effective water resources management at a hydrological basin level are not established (basin agencies and basin committees) even after the decree 2012-004/PR on 29 February 2012 (article 1 of the section IV), which gives the mandate for the operationalization of these organs and institutions. Key water resources management organs, which are established, are not operational (i.e., National Water Council). The political will in this context has been referred to as the wrong oriented priorities of the government (as much effort is made toward infrastructures, housing, and electricity while the water sector is neglected). Another aspect of this will is that water mobilization is sometimes politically-based. As a matter of fact, water is provided, in some cases, as reward to some key political actors for their faithfulness and not on the need basis.
(4) Environmental barriers: Environmental factors that are hindering water security in the sub-basin are water pollution (76%), flood disaster (16%), and climate change (8%). Water pollution has been attributed to limited access to sanitary facilities and the norm of realization for those facilities (regarding the water tables and the treatment of the sludge). In this frame, it has been reported that, in some cases, the sealing mechanism in not considered. Out of these situations, both ground water and surface water quality are undermined. Another aspect of the pollution is the pollution by domestic waste due to unsustainable waste management practices in the areas as well as in the whole country. Furthermore, chemical farming represents a huge contributor to water pollution (as the agriculture represents the main activity in the area). In addition, some respondents highlighted flood as a barrier since, in some of the communities assessed, flooding events are sometimes associated with the destruction of water infrastructures (i.e., case of pipes), with the possibility of leaving the communities without water for years.
(5) Hydrogeological barriers. These barriers are related to the availability of water as well as the easiness for that water to be abstracted. Ground observation across the communities revealed a drying up of shallow water points, which hindered pumping water from boreholes between February and June. This situation is explained by the fact that the sub-basin falls under the Upper Proterozoic ages Volta basin is sedimentary-associated with discontinuous and localized aquifers. The productive layers are the sandstones of Bombouaka with the Dapaong group (with the Korbongou and Tossiegou formations) and the Mont Panbako group (with the Bogou formation), which lie in high depth in the area, especially around the Oti district characterized by a thick layer of clay. Thus, it requires us to go very deep in some areas in order to have access to water (making water abstraction complex). In addition, ground water is in some areas that are either very mineralized or have a high concentration of hydrogen sulphide. This situation is mainly due to the deep location of productive layers, which makes the recharged water sojourn for long period in rocks. In addition, the recharge capacity in the study area is one of the lowest (about 177 mm per year against 363 mm per year in Kara).
(6) Socio-cultural barriers: The socio-cultural barriers included the lack of sense for paying for water services, especially in rural areas, since water is still considered as a gift from God, “free”. This situation affected the profitability of the infrastructures. Thus, the inability of the management committees to ensure the maintenance of the existing infrastructures was affected. Another source of the problem is that communities ignore the impact of unimproved water on people’s health. As they stated, “our fore parents used to drink water from rivers, and they were strong.” The last socio-cultural factor encountered is regarding the use of latrines. For culture conservators, based on taboos, it is forbidden to use latrines (considered as a whole). This situation is considered one of the reasons why open defecation is still taking place.
(7) Demographic barriers: Population growth represented a key barrier in ensuring water in sufficient quality and quantity to communities.
In summary, beyond the common key factors that are contributing to water insecurity in Africa including weak/bad governance (the lack of funds, limited institutional and human capacity, limited/lack of coordination, lack of harmonization/application of laws and policies, inadequate data, water pollution) [51,52,53], and the biophysical factors (hydrogeological characteristics, extremes, climate) [53]. Water insecurity in the context of the ONSB is attributed to additional managerial factors including (institutional instability, the inadequacies in water, and related sector evolution, absence of decentralized water management structures, and the non-operationalization of management organs/financial instruments) and the local culture (i.e., taboos and bylaws).
4. Conclusions and Recommendations
This study is an attempt to evaluate water security in the context of the global environmental change by quantifying water security and investigating the contributing factors to the state of the water level in the Oti River Basin. For the quantification of the water security, the Improved Fuzzy Comprehensive Evaluation Model (IFCEM) was used. The assessment results revealed an overall insecurity in the ONSB for the assessed years (2010, 2015, and 2025) with 2025 being the worst. A decrease of water security by 20% in 2025 is expected when compared to 2015. Based on the above, there is evidence that water security is subject to changes under the challenging environment.
Changes in the inner logic relationships and the importance of the sub-systems in the overall water security system has resulted in the value of the water security index in Table 6.
The resulting values depicted an overall decrease in the water security level in the future (up to 6% in 2025) (Table 6). Nevertheless, it has been observed that the value of water security varies with changes in the inner logic relationship and importance of sub-systems. The results show that the WSS-WES-WEES-EES-WRS inner logic and importance arrangement scenario gives a higher value of water security in the future (increase in the water security value by 12% in 2025 compared to the value obtained of 0.1578). In addition, the WES, WEES, EES, WRS, WSS and WEES, EES, WRS, WSS, WES inner logic and importance arrangement scenarios give a better value of the water security. Based on the above, considering the context of the Oti River Basin, although all the sub-systems contributed to the overall water security status, future water resources management strategies need to consider three sub-systems such as the water society security, the water economic security, and the water environment security, which may improve the overall water security level.
The paper showed that there is a high agreement among the assessed institutions and stakeholders so that there are barriers explaining the status of water security in the basin. The highly recognized barriers include technical factors, institutional factors, juridical factors, environmental factors, socio-cultural factors, hydrogeological factors, and demographical factors. However, managerial factors such as institutional instability, the inadequacies in water, and related sector evolution, absence of decentralized water management structures, the non-operationalization of management organs/financial instruments, and the culture (i.e., taboos and bylaws) are found to be key to the study area. Therefore, to overcome some of these barriers and to improve water security in Togo, the paper concluded that the operationalization of management organs/financial instruments might enable the application of adopted water policies and regulations. This may enable a sound and coordinated management of the available water resources since this will assist the government’s self-investment in clean water provision and data acquisition (potential water available and the estimation of economic driven potential water needs, which are key for any sound development) and stimulate the joined effort from the existing institutions. In addition, the establishment of a sound waste management system and awareness raising, and educative activities regarding water pollution will be of great benefit.
Few caveats need to be highlighted for the sake of readers regarding the interpretation of the results of the study. First, the evaluation system (sub-systems, indicators, inner logic relationship, and the importance of sub-systems) developed is contextually based. Second, aspects such as water management or governance (including the existence or absence of treaties etc.) has not been considered in this study since it does not represent an end to water security but a mean to achieve water security. Third, parameters for which data are lacking are either not considered or approximated (regional or national values or the value of year closed to the assessment year) or kept constant in the assessment.
Author Contributions
Methodology, M.Y., K.A.M., M.D.T.G.; Analysis and Field visits, M.Y.; Resources, K.A.M., M.D.T.G., M.Y.; Data, M.D.T.G., M.Y.; Writing-Original Draft Preparation M.Y.; Writing Review, Editing and Submission, K.A.M., M.Y.; Co-Supervision, M.D.T.G.; Supervision, K.A.M.; Open Access Publication, K.A.M.
Funding
This research was funded by the African Union Commission and GIZ.
Acknowledgments
Background research for this article was done in the context of master’s thesis in water policy at Pan African University Institute of Water and Energy Sciences including Climate Change PAUWES. Therefore, the authors thank the African Union Commission and GIZ for funding this research.
Conflicts of Interest
The authors declare no conflict of interest.
References
- United Nations Educational, Scientific and Cultural Organisation-International Hydrological Program. UNESCO-IHP. Final Report. In Proceedings of the 20th Session of the Intergovernmental Council, Paris, France, 4–7 June 2012; UNESCO: Paris, France, 2012. [Google Scholar]
- Mekonnen, M.M.; Hoekstra, A.Y. Four billion people facing severe water scarcity. Sci. Adv. 2016, 2. [Google Scholar] [CrossRef] [PubMed]
- Wang, X.; Jian-yun, Z.; Shahid, S.; Elmahdi, A.; Runi-min, H.; Mahtab, A. Gini coefficient to assess equity in domestic water supply in the Yellow River. Mitig. Adapt. Strateg. Glob. Chang. 2012, 17, 65–75. [Google Scholar] [CrossRef]
- Srinivasan, V.; Seto, K.C.; Emerson, R.; Gorelick, S.M. The impact of urbanization on water vulnerability: A coupled human-environment system approach for Chennai, India. Glob. Environ. Chang. 2013, 23, 229–239. [Google Scholar] [CrossRef]
- Vörösmarty, C.J.; Mclntyre, P.B.; Gessner, M.O.; Dudgeon, D.; Prusevich, A.; Green, P.; Glidden, S.; Bunn, S.E.; Sullivan, C.A.; Liermann, C.R.; et al. Global threats to human water security and river biodiversity. Nature 2010, 467, 555–561. [Google Scholar] [CrossRef] [Green Version]
- Intergovernmental Panel on Climate Change (IPCC). Managing the Risks of Extreme Events and Disasters to Advance Climate Change Adaptation. In A Special Report of the Working Groups I and II of the Intergovernmental Panel on Climate Change; Cambridge University Press: Cambridge, UK; New York, NY, USA, 2012. [Google Scholar]
- Dai, A. Increasing Drought under Global Warming in Observations and Models. Nat. Clim. Chang. 2013, 3, 52–58. [Google Scholar] [CrossRef]
- Döll, P.; Jiménez-Cisneros, B.; Oki, T.; Arnell, N.W.; Benito, G.; Cogley, J.G.; Jiang, T.; Kundzewicz, Z.W.; Mwakalila, S.; Nishijima, A. Integrating risks of climate change into water management. Hydrol. Sci. J. 2015, 60, 4–13. [Google Scholar] [CrossRef]
- Schewe, J.; Heinke, J.; Gerten, D.; Haddeland, I.; Arnell, N.W.; Clark, D.B.; Dankers, R.; Eisner, S.; Fekete, B.M.; Colón-González, F.J.; et al. Multi-model assessment of water scarcity under climate change. Proc. Natl. Acad. Sci. USA 2014, 111, 3245–3250. [Google Scholar] [CrossRef]
- Sadoff, C.W.; Hall, J.W.; Grey, D.; Aerts, J.C.J.H.; Ait-Kadi, M.; Brown, C.; Cox, A.; Dadson, S.; Garrick, D.; Kelman, J.; et al. Securing Water, Sustaining Growth: Report of the GWP/OECD Task Force on Water Security and Sustainable Growth; University of Oxford: Oxford, UK, 2015; 180p. [Google Scholar]
- Christensen, J.H.; Hewitson, B.; Busuioc, A.; Chen, A.; Gao, X.; Held, R.; Jones, R.; Kolli, R.K.; Kwon, W.K.; Laprise, R.; et al. Regional Climate Projections, Climate Change, 2007: The Physical Science Basis. Contribution of Working Group I to the Fourth Assessment Report of the Intergovernmental Panel on Climate Change; University Press: Cambridge, UK, 2007; Chapter 11; ISBN 978-0-521-88009-1. [Google Scholar]
- Gain, A.K.; Giupponi, C.; Wada, Y. Measuring global water security towards sustainable development goals. Environ. Res. Lett. 2016, 11, 124015. [Google Scholar] [CrossRef] [Green Version]
- Gerten, D.; Lucht, W.; Ostberg, S.; Heinke, J.; Kowarsch, M.; Kreft, H.; Kundzewicz, Z.W.; Rastgooy, J.; Warren, R.; Schellnhuber, H.J. Asynchronous exposure to global warming: Freshwater resources and terrestrial ecosystems. Environ. Res. Lett. 2013, 8, 034032. [Google Scholar] [CrossRef]
- Schlosser, C.A.; Strzepek, K.M.; Gao, X.; Gueneau, A.; Fant, C.; Paltsev, S.; Rasheed, B.; Smith-Greico, T.; Blanc, É.; Jacoby, H.D.; et al. The Future of Global Water Stress: An Integrated Assessment. Earth’s Future 2014. [Google Scholar] [CrossRef]
- Food and Agriculture Organization. Hot Issues: Water Scarcity. 2013. Available online: http://www.fao.org/nr/water/issues/scarcity.html (accessed on 22 January 2019).
- Roudier, P.; Ducharne, A.; Feyen, L. Climate change impacts on runoff in West Africa: A review. Hydrol. Earth Syst. Sci. 2014, 18, 2789–2801. [Google Scholar] [CrossRef]
- Ministère de l’Environnement et des Ressources Forestière/Direction de l’Environnement/Troisième communication Nationale (MERF/DE/TCN). Troisième Communication Nationale sur les Changements Climatiques au Togo; Troisième communication Nationale: Paris, France, 2015.
- Ahiablame, L.; Engel, B.; Venort, T. Improving Water Supply Systems for Domestic Uses in Urban Togo: The Case of a Suburb in Lomé. Water 2012, 4, 123–134. [Google Scholar] [CrossRef] [Green Version]
- Nkem, J.N.; Munang, R.; Jallow, B. Decentralizing Solutions for Rural Water Supply Under Climate Impacts in Sub-Saharan Africa. Environment 2011, 53, 14–17. [Google Scholar] [CrossRef]
- Thornton, P.K.; Jones, P.G.; Ericksen, P.J.; Challinor, A.J. Agriculture and food systems in sub-Saharan Africa in a four-plus degree world. Philos. Trans. R. Soc. Ser. A 2011, 369, 117–136. [Google Scholar] [CrossRef] [PubMed]
- Alliance for a Green Revolution in Africa (AGRA). Africa Agriculture Status Report 2014: Climate Change and Smallholder Agriculture in Sub-Saharan Africa. Nairobi, Kenya. 2014, Issue No. 2. Available online: https://www.climateinvestmentfunds.org/sites/cif_enc/files/aasr-2014climate-change-and-smallholder-agriculture-in-ssa.pdf (accessed on 28 January 2019).
- Intergovernmental Panel on Climate Change. Africa. In Climate Change 2014—Impacts, Adaptation and Vulnerability: Part B: Regional Aspects: Working Group II Contribution to the IPCC Fifth Assessment Report; Cambridge University Press: Cambridge, UK, 2014; pp. 1199–1266. [Google Scholar] [CrossRef]
- Munang, R.; Andrews, J. Despite Climate Change, Africa Can Feed Africa. Africa Renewal, Special Edition on Agriculture, 2014. Available online: http://www.un.org/africarenewal/magazine/special-edition-agriculture-2014/despite-climate-change-africa-can-feed-africa (accessed on 22 January 2019).
- Mourad, K.A. Marginal and Virtual Water for Sustainable Water Resources Management in Syria; Lund University: Lund, Sweden, 2012; ISBN 978-91-7473-352-5. [Google Scholar]
- Mourad, K.A.; Alshihabi, O. Assessment of future Syrian water resources supply and demand by WEAP model. Hydrol. Sci. J. 2016, 61, 393–401. [Google Scholar] [CrossRef]
- Cimons, M. Water Shortages Amplify the Potential for Violence. How Drought fuels Conflict. 2017. Available online: https://www.popsci.com/water-shortages-fuel-conflict (accessed on 3 January 2018).
- Gueye, M.K.; Sell, M.; Strachan, J. Trade, Climate Change and Sustainable Development: Key Issues for Small states, Least Developed Countries, and vulnerable economies; Commonwealth Secretariat: London, UK, 2009. [Google Scholar]
- Oyebande, L.; Odunuga, S. Climate Change Impact on Water Resources at the Transboundary Level in West Africa: The Cases of the Senegal, Niger and Volta Basins. Open Hydrol. J. 2010, 4, 163–172. [Google Scholar] [CrossRef]
- Norman, E.S.; Dunn, G.; Bakker, K.; Allen, D.M.; Albuquerque, R.C. Water security assessment: Integrating governance and freshwater indicators. Water Resour. Manag. 2013, 27, 535–551. [Google Scholar] [CrossRef]
- Policy Research Initiative Sustainable Development Briefing Note: Canadian Water Sustainability Index. 2007. Available online: http://publications.gc.ca/collections/Collection/PH2-1-14-2007E.pdf (accessed on 22 January 2109).
- Xiao-Jun, W.; Jian-yun, Z.; Shahid, S.; Xing-hui, X.; Rui-min, H. Catastrophe theory to assess water security and adaptation strategy in the context of environmental change. Mitig. Adapt. Strateg. Glob. Chang. 2014, 19, 463–477. [Google Scholar] [CrossRef]
- Othman, M.; Ku-Mahamud, K.R.; Abu Bakar, A. Fuzzy evaluation method using fuzzy rule approach in multicriteria analysis. Yugoslav J. Oper. Res. 2008, 18, 95–107. [Google Scholar] [CrossRef]
- Institut National de la Statistique et des Etudes Economiques et Démographique (INSEED). Togo: Profil de Pauvreté 2006–2011–2015. 2016. Available online: https://searchworks.stanford.edu/view/12136951 (accessed on 28 January 2019).
- Barry, B.; Obuobie, E.; Andreini, M.; Andah, W.; Pluquet, M. The Volta River Basin. Comprehensive Assessment of Water Management in Agriculture Comparative Study of River Basin Development and Management. 2005. Available online: http://www.iwmi.cgiar.org/assessment/files_new/research_projects/river_basin_development_and_management/VoltaRiverBasin_Boubacar.pdf (accessed on 12 September 2018).
- Wang, W.; Liu, S.; Zhang, S.; Chen, J. Assessment of a model of pollution disaster in near-shore coastal waters based on catastrophe theory. Ecol. Model. 2011, 222, 307–312. [Google Scholar] [CrossRef]
- Loehle, C. Catastrophe theory in ecology: A critical review and an example of the butterfly catastrophe. Ecol. Model. 1989, 49, 125–152. [Google Scholar] [CrossRef]
- Yang, F.; Shao, D.; Xiao, C.; Tan, X. Assessment of urban water security based on catastrophe theory. Water Sci. Technol. 2012, 66, 487–493. [Google Scholar] [CrossRef]
- Su, S.; Li, D.; Yu, X.; Zhang, Z.; Zhang, Q.; Xiao, R.; Zhi, J.; Wu, J. Assessing land ecological security in Shanghai (China) based on catastrophe theory. Stoch. Environ. Res. Risk Assess. 2011, 25, 737–746. [Google Scholar] [CrossRef]
- Wang, X.J.; Jian-yun, Z.; Jian-hua, W.; Rui-min, H.; ElMahdi, A.; Jin-hua, L.; Xin-gong, W.; King, D.; Shahid, S. Climate change and water resources management in Tuwei river basin of northwest China. Mitig. Adapt. Strateg. Glob. Chang. 2012, 19, 107–120. [Google Scholar] [CrossRef]
- Jia, X.; Cai, Y.; Wang, X.; Sun, L. An improved method for integrated water security assessment in the Yellow River basin, China. Stoch. Environ. Res. Risk Assess. 2015, 29, 2213–2227. [Google Scholar] [CrossRef]
- Liu, K.K.; Li, C.H.; Cai, Y.P.; Xu, M.; Xia, X.H. Comprehensive evaluation of water resources security in the Yellow River basin based on a fuzzy multi-attribute decision analysis approach. Hydrol. Earth Syst. Sci. 2014, 18, 1605–1623. [Google Scholar] [CrossRef] [Green Version]
- Volta Basin Authority (VBA). Assessment of the Current State of Water Management and Climate Change in the Volta Basin as part of the Establishment of an Observatory for Water Resources and Related Ecosystems. Final Report. 2014. Available online: https://www.gwp.org/globalassets/global/gwp-waf_files/wacdep/brochure_assessment_wacdep_abv_en.pdf (accessed on 6 August 2018).
- Shao, D.; Yang, F.; Xiao, C.; Tan, X. Evaluation of water security: An integrated approach applied in Wuhan urban agglomeration, China. Water Sci. Technol. 2012, 66, 79–87. [Google Scholar] [CrossRef] [PubMed]
- Falkenmark, M. The massive water scarcity threatening Africa-why isn’t it being addressed. Ambio 1989, 18, 112–118. [Google Scholar]
- Asian Development Bank (ADB). Asian Water Development Outlook: Measuring Water Security in Asia and the Pacific; Asian Development Bank: Mandaluyong City, PA, USA, 2013. [Google Scholar]
- Babel, M.S.; & Shinde, V. A framework for water security assessment at basin scale. APN Sci. Bull. 2018, 8. [Google Scholar] [CrossRef]
- FAO-AQUASTAT. FAO Global Information System on Water and Agriculture. 2012. Available online: http://www.fao.org/nr/water/aquastat/maps/index.stm (accessed on 22 January 2019).
- Pérez-Foguet, A.; Giné, R. Analyzing water poverty in basins. Water Resour. Manag. 2011, 25, 3595–3612. [Google Scholar] [CrossRef]
- Ministère des Mines, de l’Energie et de l’Eau/Direction Générale de l’Eau et de l’assainissement/Département des Affaires Economiques et Sociales des Nations Unies (MMEE/DGEA/UN-DESA). Rapport de Synthèse: Gestion Intégrée des Ressources en Eau (GIRE) et Objectif du Millénaire pour le Développement (OMD) au Togo; UNEP: Nairobi, Kenya, 2009.
- United Nations Environment Programme and the Global Environment Facility (UNEP-GEF Volta) Project. Volta Basin Trans boundary Diagnostic Analysis; UNEP: Nairobi, Kenya, 2013. [Google Scholar]
- Ringler, C. What’s Really Causing Water Scarcity in Africa south of the Sahara? 2013. Available online: http://www.ifpri.org/blog/what%E2%80%99s-really-causing-water-scarcity-africa-south-sahara (accessed on 17 January 2019).
- Salami, A.; Stampini, M.; Kamara, A.B. (Eds.) Development Aid and Access to Water and Sanitation in Sub-Saharan Africa: Overview; African Development Bank (AfDB) Group & Temporary Relocation Agency (TRA): Tunis-Belvedere, Tunisia, 2011; Available online: https://www.afdb.org/fileadmin/uploads/afdb/Documents/Publications/WPS%20140%20Development%20Aid%20and%20Access%20to%20Water%20NV1%2022.pdf (accessed on 24 January 2019).
- United Nations Water. International Decade for Action ‘Water for Life’ 2005–2015. 2014. Available online: http://www.un.org/waterforlifedecade/africa.shtml (accessed on 17 January 2019).
Figure 1.
Map of the Oti River Basin and Oti Nord sub-basin.


Table 1.
Indicators for water security assessment in the Oti Nord sub-basin.
| Sub-System | Parameters | Parameters Description or Logic | Indicators | Unit | Functional Relationship | Source |
|---|---|---|---|---|---|---|
| Water-Resources Security (WRS) (B1) | Modulus of surface water | It reflects the amount of surface water resources in each part of the Basin. It can be calculated as the ratio between the total renewable surface water resources amount and the evaluation area | Modulus of surface water (C1) | 106 m3 km−2 | Positive | [40,41] |
| Modulus of ground water | It reflects the amount of groundwater resources in the basin. It can be calculated as the ratio between the total renewable groundwater resources amount and the evaluation area. | Modulus of ground water (C2) | 106 m3 km−2 | Positive | [40,41] | |
| Stream flow | It gives an idea on the moisture level of a year. It can be calculated through as a ration between the annual discharge in a locality and the inter-annual discharge over a period. | Stream flow index (C3) | - | Positive | [42] | |
| Ground water recharge | It gives an idea of the state of ground water as well as its evolution. | Ground water recharge capacity (C4) | mm/year | Positive | [42] | |
| Water availability | It reflects the amount of water resources available. It is calculated through the total amount of water resources (or surface runoff)/total population. | Per capital water resources availability (C5) | m3/capita/year | Positive | [43,44] | |
| Water-Society Security (WSS) (B2) | Water consumption | It gives an idea on the total amount of water withdrawn, and which is no longer available to be used. It is calculated through the total amount of water resources withdrawn (concerns only the domestic water withdrawn) /total population. It can change under external factors and increased economic activities. | Per capital water consumption (C6) | m3/person/year | Negative | [12,31] |
| Drinking water conditions | It gives an idea of the urban population having access up to standard drinking water. It can be calculated using the ratio between the urban population having access up to standard drinking water and the total urban population. | Urban population with access to improved water (C7) | % | Positive | [40] | |
| It gives an idea of the rural and semi-urban population having access to standard drinking water. It can be calculated using the ratio between the rural and semi-urban population having access to standard drinking water and the total rural and semi-urban population. | Rural and semi-urban population with access to improved water (C8) | % | Positive | [40] | ||
| Drinking water exposure | It gives an idea on the quality of surface water in the study area. It can be calculated as the ratio between the site-specific thermo-tolerant coliforms (30°C) and the permissible limits of these germs. | Surface water quality factor (C9) | - | Negative | [45,46] | |
| Water-Economic Security (WES) (B3) | Water consumption | It expresses the total amount of water withdrawn for economic purpose (Agricultural, livestock, and industrial). It can be calculated as the ratio between the total amount of water withdrawn for economic activities and the total water* 100 | Economic water consumption rate (C10) | % | Positive | [45] |
| Economic water value | It gives an idea on the revenue generated by commercial/industrial sector water use (CFA/m3). It can be measured through the ratio between the non-agricultural GPP and the non-agricultural water use in the basin. | Commercial/industrial revenue per m3 of water (C11) | FCFA/m3 | Positive | [45] | |
| It gives an idea on the revenue generated by the livestock sector water use. It can be estimated through the ratio between livestock GPP and the amount of water used for the purpose. | Livestock revenue per m3 of water (C12) | FCFA/m3 | Positive | [45] | ||
| Water allocation | The parameter gives an idea on how water is allocated in the sub-basin but also the price attached to the allocation depending on the activity. The price may vary from one activity to the other. | Non-agricultural water price (C13) | FCFA/m3 | Negative | [39] | |
| Agricultural water price (C14) | FCFA/m3 | Negative | [39] | |||
| Water-Environment Security (WEES) (B4) | Pollution level/Health of water bodies (Surface and ground water) | It depicts the pollution level of water, particularly in the rivers of the sub-basin whether directly or indirectly contaminated. It can be calculated as the ratio between the dissolved oxygen and the permissible limit. EU and OMS standards have been considered in this case. | Surface water quality factor (C15) | - | Negative | [45,46] |
| It gives an idea on the quality of ground water in the study area. It can be calculated as the ratio between the site-specific pollutants (nitrates in this case) and the permissible limits of these pollutants. EU and OMS standards have been considered in this case. | Ground water quality factor (C16) | - | Negative | [45,46] | ||
| The pollution level can be defined by the population having access to improved sanitation. | Population with access to improved sanitation (C17) | % | Positive | |||
| The reuse of waste water gives an idea regarding the level of pollution in the sub-basin. It can be calculated as a ratio between the amount of water (industrial or domestic) re-used and the total water consumed. | Water reuse rate (C18) | % | Positive | [46] | ||
| Water resources utilization | This parameter can be captured using a ratio between the total amount of water supplied or used (for any purpose) and the total amount of water resources available. It concerns both surface and ground water and captures the level of human pressure on water resources. | Water resources utilisation rate (C19) | % | Negative | [39,40,47] | |
| External-Environment Security (EES) (B5) | Population growth | Increase in population growth may be associated with an increase in the water demand. | Population growth rate (C20) | % | Negative | [45] |
| Land degradation | This parameter expresses the soil conditions, which play key roles in the water recharge rate but also the quality of surface water. It can be calculated as the ratio between the land degradation area (only the land with degradation indices 4 and 5 are considered) and the evaluation area. | Land degradation rate C21) | % | Negative | [42,48] | |
| GDP growth | Change in the GDP reflect water use for an economic purpose. Its increases may be associated with the increase in water demand. | GDP growth rate (C22) | % | Negative | [31,39] | |
| Temperature | Changes in temperature are associated with changes in the evapotranspiration, which may impact the amount of water available. In this case, the average temperature has been considered. | Temperature (C23) | °C | Negative | [31,39] |
Table 2.
Basin level water security indicator values (observed and projected).
| Sub-Systems | Indicator | 2010 | 2015 | 2025 |
|---|---|---|---|---|
| Water-Resources Security (WRS) (B1) | Modulus of surface water (C1) (106 m3 km−2) | 0.23 | 0.23 | 0.23 |
| Modulus of ground water (C2) (106 m3 km−2) | 0.125 | 0.125 | 0.125 | |
| Stream flow index (C3) | 0.7 | 1.37 | 1.12 | |
| Ground water recharge capacity (C4) (mm/year) | 177 | 177 | 177 | |
| Per capital water resources availability (C5) (m3/capita/year) | 3860 | 3478 | 3033 | |
| Water-Society Security (WSS) (B2) | Per capital water consumption (C6) (m3/person/year) | 15.51 | 20.08 | 24.64 |
| Urban population with access to improved water (C7) (%) | 43 | 45 | 100 | |
| Rural and semi-urban population with access to improved water (C8) (%) | 50.88 | 99.52 | 100 | |
| Surface water quality factor (C9) | 21.5 | 21.5 | 21.5 | |
| Water-Economic Security (WES) (B3) | Economic water consumption rate (C10) (%) | 0.49 | 0.69 | 2.09 |
| Commercial/industrial (of fountain and water kiosks) revenue per m3 of water (C11) (FCFA/m3) | 75 | 75 | 75 | |
| Livestock revenue per m3 of water (C12) (FCFA/m3) | 5385 | 5385 | 5385 | |
| Non-agricultural (fountain and water kiosks) water price (C13) (FCFA/m3) | 315 | 315 | 315 | |
| Agricultural (livestock) water price (C14) (FCFA/m3) | 0 | 0 | 0 | |
| Water-Environment Security (WEES) (B4) | Surface water quality factor (C15) | 0.5 | 0.5 | 0.5 |
| Ground water quality factor (C16) | 0.09 | 0.09 | 0.09 | |
| Population with access to improved sanitation (C17) (%) | 68.4 | 66.37 | 100 | |
| Water re-use rate (C18) (%) | 0 | 0 | 0 | |
| Water resources utilization rate (C19) (%) | 0.65 | 1.1 | 2.09 | |
| External-Environment Security (EES) (B5) | Population growth rate (C20) (%) | 2.84 | 2.2 | 2 |
| Land degradation rate (C21) (%) | 62.25 | 77.25 | 107 | |
| GDP growth rate (C22) (%) | 4.02 | 5.1 | 5.31 | |
| Temperature (C23) (°C) | 29.3 | 29.3 | 30.21 |
Table 3.
Values of the selected indicators after normalization.
| Sub-Systems | Indicator | 2010 | 2015 | 2025 |
|---|---|---|---|---|
| Water-Resources Security (WRS) (B1) | Modulus of surface water (C1) | 0 | 0 | 0 |
| Modulus of ground water (C2) | 0 | 0 | 0 | |
| Stream flow index (C3) | 0 | 1 | 0.6269 | |
| Ground water recharge capacity (C4) | 0 | 0 | 0 | |
| Per capital water resources availability (C5) | 1 | 0.5381 | 0 | |
| Water-Society Security (WSS) (B2) | Per capital water consumption (C6) | 1 | 0.4995 | 0 |
| Urban population with access to improved water (C7) | 0 | 0.0351 | 1 | |
| Rural and semi-urban population with access to improved water (C8) | 0 | 0.9902 | 1 | |
| Surface water quality factor (C9) | 1 | 1 | 1 | |
| Water-Economic Security (WES) (B3) | Economic water consumption rate (C10) | 0 | 0.125 | 1 |
| Commercial/industrial (of fountain and water kiosks) revenue per m3 of water (C11) | 0 | 0 | 0 | |
| Livestock revenue per m3 of water (C12) | 0 | 0 | 0 | |
| Non-agricultural water price (C13) | 1 | 1 | 1 | |
| Agricultural (livestock) water price (C14) | 1 | 1 | 1 | |
| Water-Environment Security (WEES) (B4) | Surface water quality factor (C15) | 1 | 1 | 1 |
| Ground water quality factor (C16) | 1 | 1 | 1 | |
| Population with access to improved sanitation (C17) | 0.0604 | 0 | 1 | |
| Water re-use rate (C18) (%) | 0 | 0 | 0 | |
| Water resources utilization rate (C19) (%) | 1 | 0.6875 | 0 | |
| External-Environment Security (EES) (B5) | Population growth rate (C20) (%) | 0 | 0.7619 | 1 |
| Land degradation rate (C21) (%) | 1 | 0.6648 | 0 | |
| GDP growth rate (C22) (%) | 1 | 0.1628 | 0 | |
| Temperature (C23) (°C) | 1 | 1 | 0 |
Table 4.
Value of indicators at different levels.
| Sub-Systems | 2010 | 2015 | 2025 |
|---|---|---|---|
| Water-Resources Security (WRS) (B1) | 0.2000 | 0.3804 | 0.1780 |
| Water-Society Security (WSS) (B2) | 0.5000 | 0.7579 | 0.7500 |
| Water-Economic Security (WES) (B3) | 0.4000 | 0.4707 | 0.6000 |
| Water-Environment Security (WEES) (B4) | 0.6991 | 0.5872 | 0.6000 |
| External-Environment Security (EES) (B5) | 0.7500 | 0.8452 | 0.2500 |
| Water security (synthetic values) | 0.7841 | 0.8456 | 0.7814 |
Table 5.
Evaluation results.
| System | 2010 | 2015 | 2025 |
|---|---|---|---|
| Water security (synthetic values) | 0.7841 | 0.8456 | 0.7814 |
| Water security (modified synthetic values) | 0.1592 | 0.1994 | 0.1578 |
| Level of water security | Very Insecure | Very Insecure | Very Insecure |
Table 6.
Sensitivity analysis results.
| 2010 | 2015 | 2025 | |
|---|---|---|---|
| Water security 1 (WRS, WSS, WES, WEES, EES) | 0.1592 | 0.1994 | 0.1578 |
| Water security 2 (WSS, WES, WEES, EES, WRS) | 0.1757 | 0.223 | 0.1796 |
| Water security 3 (WES, WEES, EES, WRS, WSS) | 0.1756 | 0.20546 | 0.1661 |
| Water security 4 (WEES, EES, WRS, WSS, WES) | 0.1858 | 0.2189 | 0.1587 |
| Water security 5 (EES, WRS, WSS, WES, WEES) | 0.1756 | 0.22559 | 0.1490 |
WRS = Water-Resources Security. WSS = Water-Society Security. WES= Water-Economic Security. WEES = Water-Environment Security. EES= External-Environment Security.
© 2019 by the authors. Licensee MDPI, Basel, Switzerland. This article is an open access article distributed under the terms and conditions of the Creative Commons Attribution (CC BY) license (http://creativecommons.org/licenses/by/4.0/).
Share and Cite
MDPI and ACS Style
Yomo, M.; Mourad, K.A.; Gnazou, M.D.T. Examining Water Security in the Challenging Environment in Togo, West Africa. Water 2019, 11, 231. https://doi.org/10.3390/w11020231
AMA Style
Yomo M, Mourad KA, Gnazou MDT. Examining Water Security in the Challenging Environment in Togo, West Africa. Water. 2019; 11(2):231. https://doi.org/10.3390/w11020231
Chicago/Turabian StyleYomo, Mawulolo, Khaldoon A. Mourad, and Masamaeya D. T. Gnazou. 2019. "Examining Water Security in the Challenging Environment in Togo, West Africa" Water 11, no. 2: 231. https://doi.org/10.3390/w11020231
Note that from the first issue of 2016, this journal uses article numbers instead of page numbers. See further details here.