Influence of Personal Attributes and Demographic Diversity on Nzoia Basin Negotiation Outcomes


Policy Analysis Section, Multi-Actor Systems (MAS) Department, Faculty of Technology, Policy and Management, Delft University of Technology, Building 31, Jaffalaan 5, 2628 BX Delft P.O. Box 5015 2600 GA Delft, The Netherlands
*
Author to whom correspondence should be addressed.
Water 2019, 11(2), 227; https://doi.org/10.3390/w11020227
Submission received: 24 December 2018
/
Revised: 18 January 2019
/
Accepted: 24 January 2019
/
Published: 29 January 2019
(This article belongs to the Section Water Resources Management, Policy and Governance)
Abstract
:The Kenyan government has made significant advances in water resources management at the local authority (county) level with little or no cooperation at the drainage basin level. Research on critical determinants of cooperation amongst transboundary water negotiation teams is limited. In this paper, we assess whether personal attribute diversity (PAD) is a stronger factor than demographic diversity (gender, age, and education play) in determining whether the negotiation team will cooperate or make unilateral actions. We use a negotiation game to study decisions taken by water policymakers. After that, we conduct a multiple discriminant analysis (MDA) to assess the influence of PAD, gender, age, and education on water negotiation outcomes. The findings indicate that PAD plays a significant role in determining whether the group will cooperate or compete. Gender, education, and age barely influence the outcome. Only upon removal of the PAD variable do we see an increase in the discriminant power of gender and education. Age has minimal influence on the negotiation outcomes. We apply the research at a lower level of governance (Nzoia River Basin). However, results might be extrapolated to a bigger basin, like the Nile Basin, through future multiple level analysis which takes account of the complex socio-technical systems.
1. Introduction
Water scarcity is one of the major challenges facing the world today [1,2,3,4,5,6]. UN-Water defines water scarcity as either physical water shortage or inaccessibility caused by failed water supply systems or inadequate water infrastructures [3]. The problem with this defnition is it combines water deficit and water scarcity in one defintion, which can be misleading or inaccurate in circumstances where there is no water deficit but only water scarcity. Jaeger et al. [7] explain that water scarcity should be distinguished from water deficit. Water scarcity is normative and anthropocentric in nature because it varies based on temporal, spatial and social values (direct and indirect ) regarding multiple water uses. We adopt the Kampas and Rozakis [8] (p. 1258) definition of water scarcity as “the opportunity costs of forgone human options that result from a specific water use decision”. Jaeger et al. [7] explain that water deficit is purely descriptive. Kampas and Rozakis [8] (p. 1258) define water deficit as “the case where the water is not enough for a specific biophysical process”.
United Nations (UN) Food and Agriculture Organization (FAO) statistics indicate that approximately one-fifth of the global population is living in a water scarce area and one quarter suffer as a result of economic water scarcity [2]. Economic water scarcity occurs when there is sufficient water (no water deficit) but no infrastructure or strong governance system to increase access. The Global Water Insititute records that approximately 700 million persons in 43 states face water scarcity [9]. The United Nations Educational, Scientific and Cultural Organization (UNESCO) affirms that in 2018, 3.6 billion people lived in water scarce regions with a projected increment to 4.8–5.7 billion in 2050 [1]. The UN Convention to Combat Desertification (UNCCD) climate change scenario predicts large numbers of persons, upto 700 million, being displaced from arid and semi-arid areas by 2030 [3]. When the surface water is limited, most countries quickly shift strategy and tap into groundwater resources [10]. Richey et al. [4] ascertain that by 2015, one-third of the largest ground water resources were distressed.
Anthropogenic interventions and activities to water, soil and air systems are the main contributors to water scarcity, within a given river basin [5]. Thus there is need for cooperation within a shared river basin to sustainably manage and control anthropogenic interventions and activities [11,12,13,14,15]. In a shared river basin, there will always be in-group and out-group tensions as diverse teams are negotiating to minimise human actions and interventions that threaten current and future water security [6,16,17,18,19,20,21,22,23]. Therefore, the negotiation team needs to create a willingness amongst the different riparian states to cooperate and sustain the cooperation [13].
Research indicates that the inability of transboundary water negotiation teams to arrive at a win-win solution [24,25] is a major barrier to cooperation [13] for a given river basin [11,17]. According to research, one approach to counter win-lose solutions is introducing a shared superordinate identity (SSI) to surpass in and out-group differences [26]. SSI creates a perception that the riparian governments belong to one group even though they represent different states or local governments [27,28,29]. It reduces competition, increases cooperation and helps to avoid one-sided outcomes [30,31,32]. It also spurs innovation leading to knowledge creation, knowledge transfer and improved negotiation outcomes [33,34,35] According to Gaertner et al. [30], SSI can bridge cultural divides and reduce inter-group conflicts [32]. It also creates an enabling environment for developing both bonding (in-group) and bridging (out-group) social capital [34]. Putnam [36] defines social capital as “social networks and the associated norms of reciprocity and trustworthiness” [36] (p. 137). Bonding social capital in a river basin binds the people within a given riparian state. Bridging social capital on the other hand, builds bridges between different riparains states sharing the drainage basin [36] (p. 143). Climate change has been one of the effective tools to create SSI [17]. Through concerted climate-change actions, bridging social capital between riparian states that share a given basin has been strengthened [17,37,38,39].
SSI is essential for diverse out-groups that have a limited history of collaborative actions [40,41]. We define diversity as the distribution of demographic attributes (e.g., age, nationality, racio-ethinicty, sex, education level) and underlying personal attributes (e.g., values, cognitive, functional, personality, capabilities, knowledge). Studies confirm that diversity has value [36,42]. First to the network of water negotiators representing the riparian states within a given river basin, it spurs creativity and innovation [36]. Haidt [42] (p. 2) states that a diverse environment encourages complex thinking, increases performance, participation, motivation to do more than the bare minimum and interest in the subject matter. Where there is inequity, diversity may support the process of removing barriers to achieving equity and addressing past inequities [18]. Salman [43] explains how a bilateral water agreement between two downstream countries that share water flows within the river forecloses the future use of the water by the upstream countries. In this instance, diversity may facilitate the removal of the foreclosure barrier and address inequities occasioned by the bilateral agreement.
Jackson, Stone and Alvarez [44] classify diversity into two groups, namely, personal and demographic attributes. Demographic attributes are defined as “immutable … readily detected during a brief interaction with a person, and for which social consensus can be assumed” [44] (p. 56). Haidt [42] (p. 4) provides a list of demographic attributes, namely, sex, age, race, and ethnicity. Jackson et al. [44] (p. 56) define personal attributes as “mutable and subjectively construed psychological and interpersonal characteristics”. Haidt [42] (p. 4) provides a list of personal attributes, namely, status, knowledge, behavioral style and values. Haidt [42] argues that amongst PAD, values (including attitudes) have barely been researched. Kakabadse et al. [45] (p. 23) affirm the importance of personal attributes, specifically cognitive abilities, values, background and experiences, in influencing decisions.
Previous research has mainly focused on demographic diversity (DD), with limited studies on underlying personal attributes diversity (PAD) [46]. Jackson [46] (p.805) identifies the most studied attributes in diversity research. Sex (DD) was the highest studied, followed by age (DD), racio-ethnicity (DD), education level (DD), functional background (PAD), tenure in organisation (DD), tenure in job/team (DD), cognition/mental models (PAD), personality (PAD), education content (DD), cultural values (PAD) and finally nationality (DD). Most of the studies focused on performance outcomes with a small percentage focusing on process and affective outcomes.
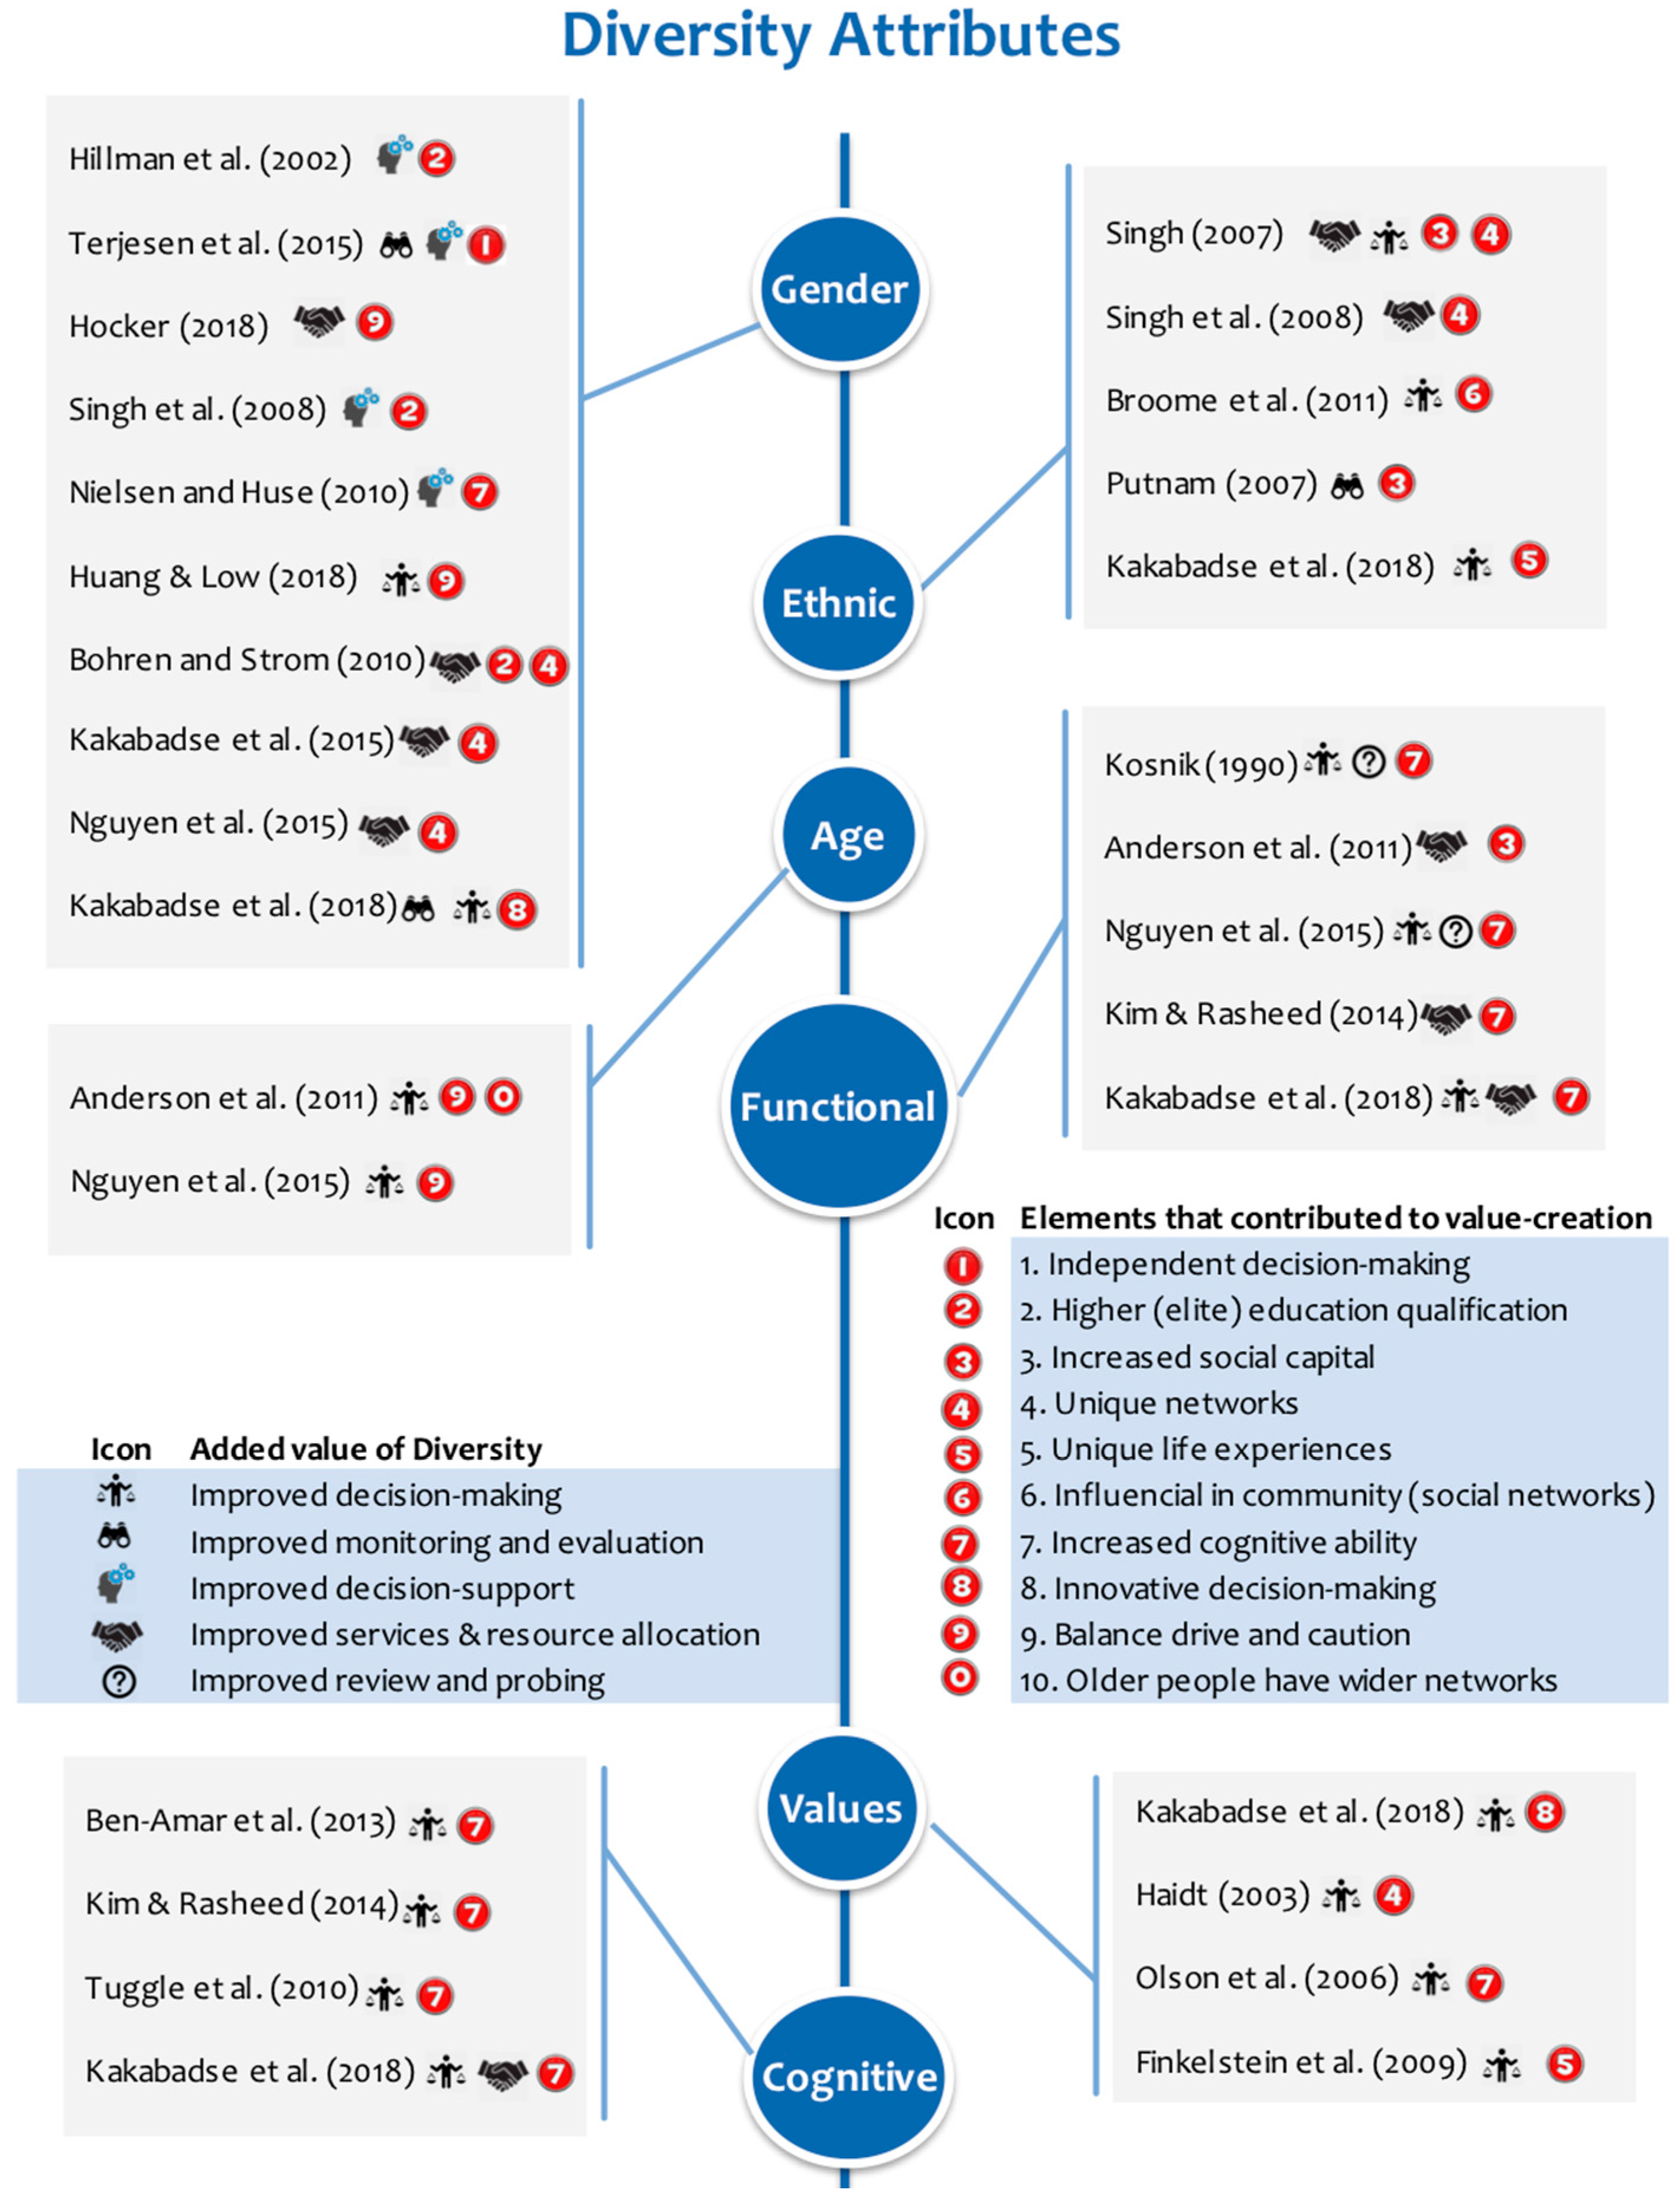
Haidt [42] argues that different forms of diversity lead to different effects and a general study on diversity that does not disaggregate it into its attributes may not produce useful policy insights. Kakabadse [45] concludes that most of the available research is at the conceptual level, with very limited empirical research on the value addition of diversity. Figure 1 contains literature review on DD and PAD studies and their respective added value including the elements that contributed to value-creation [45]. Most of the studies are at the conceptual level with empirical research limited to studies on: values, cognitive, nationality and age diversity.
According to Figure 1, gender diversity is the most studied with mixed results on its added value and the contributing elements to value-creation [45,47,48,49,50,51,52,53,54,55]. From the literature, age, was the least studied, with consistent results. Age contributed to improved decision making by balancing personal drive with caution [55,56]. Moreover, older persons were considered an asset because they possessed a broader network that was essential in the decision-making processes [56]. Ethnicity is critical when: social capital needs to be built; new life experiences or unique social connections are missing in the current network; or influential social personalities are needed [36,45,50,57,58]. Nguyen (2015) indicates that increased cognitive ability leads to improved review and probing [55].
Functional diversity led to improved decisions and services due to one major element: increased team cognitive ability [45,55,56,59,60]. The cognitive results were the most consistent. Cognitive diverse teams made better decisions due to increased team thinking ability [45,60,61,62]. A value diverse group improves the decisions made due to: increased innovation when working in mixed teams [45], introduction to unique networks [42], increased cognitive ability [63] and the unique life experiences of each team member [64].
Demographic diversity is costly, especially in the short-term [36]. Based on Twigg and Taylor [65], diversity led to reduced levels of trust and social cohesion. The study mainly looked at demographic diversity (age, ethnicity, income level, education level, occupation, tenure and place of residence) [65], (p. 1429). De Oliveira and Nisbett [66] conclude that demographic diversity does not lead to wiser decisions. Putnam [36] (pp. 149–150,165) adds that demographic, specifically ethnic, diversity triggers anomie and social isolation. He adds, that in the short-term ethnic diversity is negatively correlated with social capital and engagement in cooperative actions. According to Putnam [36] (p. 149), increased demographic diversity has demonstrated:
- Declined confidence in one’s ability to influence the situation and bring about change;
- Lesser frequency to participate in democratic processes, with increased interest and political knowledge that is essential for protests;
- A lower expectation of cooperation by the opposing team to resolve the collective dilemma; and
- Declining interest to participate in joint actions.
There is barely any research on the discriminant power of DD and PAD in a given group [45]. We conducted this research to address the identified research gap with the aim of reducing the water management costs that arise from heterogeneity, by predicting the possible future group configuration and its strongest diversity attribute. In addition, there is no study that assesses what happens when the heterogeneous groups transform into a demographic homogenous (DH) or a personal attribute homogenous (PAH) group. Do other subdued diversity attributes take prominence and change the group dynamics? The outcomes may guide water resources management experts to emphasize on the most powerful diversity attribute, so as to enhance its benefits, reduce the costs and focus less on attributes that have limited or no impact on the final outcome. Based on the research outcomes, further diversity studies in water resources management can be conducted on how to introduce and strengthen SSI using the most powerful diversity attribute, so that the heterogeneous group enjoys the benefits of diversity and homogeneity (SSI).
Therefore, we hypothesize that PAD is a stronger predictor than DD (age, education level, and gender) of water negotiation outcomes (whether a water negotiation groups will develop SSI surpassing in and out-group differences and cooperate or they will act unilaterally), and will diminish in PAH groups leading to a change in group dynamics as DD takes prominence. With the use of a negotiation game known as Nzoia WeShareIt, we examine seven teams of negotiators from four county governments (Bungoma, Trans Nzoia, Kakamega and Busia) in the western part of Kenya. By analyzing the in-game and post-game data, we assess which, if any, of these four variables, are useful in predicting whether the composition of certain negotiation teams will cooperate or act unilaterally, leading to unhealthy competition for scarce water resources.
We conducted a discriminant analysis (DA) as a grouping and predictive technique, with the pre-game and post-game questionnaire data. First, we maintained the status quo, the players negotiate within an environment where the four variables are under consideration. Afterward, we conducted a follow-up analysis where we excluded PAD, which is the variable with the highest discriminant power. We then assessed the power of the other three variables in predicting whether the negotiation groups will cooperate or unilaterally act. The two instances are compared to assess the discriminating power of PAD and DD (gender, age, and education level).
The remainder of the paper is organized as follows. First, we provide a detailed description of the Nzoia river basin case study, the water negotiation game (Nzoia WeShareIt), the procedure we employed to play the game and collect the research data and how we analyzed the data. The third section discusses the results of the in-game, and post-game questionnaire data. The final section discusses and makes concluding remarks.
2. Materials and Methods
In this section, we will explain the case study, the design and application of the Nzoia WeShareIt negotiation game and a description of the four--pronged data analysis procedure. In step one we selected the methodology. In step two we conducted a crosstabs procedure. Crosstabs procedure is used to create cross tables or contingency tables to disaggregate the data according to gender, age and education. These tables are useful for examining the relationship between two categorical variables. The crosstab contains the number of cases for all the probable combinations of the three variables. The third step in data analysis was assumption testing for the multiple discriminant analysis (MDA) procedure. In the third step, we conducted the MDA. We used the MDA to predict the values of a grouping variable, based on the independent variables values. After that, we conducted a follow-up MDA analysis where we excluded the variable with the strongest discriminant power.
2.1. The Nzoia WeShareIt Water Policy Game
The Nzoia WeShareIt game was inspired by the original Nzoia WeShareIt game, which had been designed for the Nile river basin where different upstream and downstream countries had to negotiate to earn ‘happy faces’ [16,17,18,19,21,67]. Later, we customized the game for the smaller Nzoia basin within the larger Nile river ecosystem [17,20,67]. Water policy gaming is selected as a quasi-experiment to understand the contribution of PAD and DD to water negotiation outcomes. Policy games are defined by Mayer [68] (p. 535) as:
“Reality is simulated through the interaction of role players using non-formal symbols as well as formal, computerized sub-models where necessary. The technique allows a group of participants to engage in collective action in a safe environment to create and analyze the futures they want to explore. It enables the players to pre-test strategic initiatives in a realistic environment”.
Water policy games have been used due to a number of benefits. A policy game may lead to the building of trust, relationships, and coalitions, through repeated constructive social interactions [69] (pp. 5–7). Meaningful social interactions [69,70,71], challenge players existing mental blocks that hinder cooperation [14]. In the course of the interactions, players clarify existing values and judgments [72] through “step-wise, round-based interactions [69] (p. 6)” that enable the players to frame and reframe issues [73]. The players can also jointly co-create knowledge [69] (p. 6), by communicating deep-seated tacit information that they would never articulate in a formal setting [69] (p. 5). A game setting can reveal what diplomacy seeks to conceal [74] thus drawing the participants closer to the core problem. Once the tacit and explicit knowledge is clarified and reframed, a shared understanding of the issues may develop.
Games have been proven to influence real world outcomes through knowledge diffusion. When players continuously communicate their shared understanding, it may lead to diffusion of knowledge [69] (p. 6). During the debriefing session, the players discuss the lessons learned and how they plan to apply them it in real life settings, leading to knowledge integration [69] (p. 7). Knowledge integration also occurs when games simulate a real-life policy challenge and provide the players with the opportunity to test viable options before applying them to real life circumstances [75] (pp. 825–826). In a game, the risks are low because there are no real-life consequences to the decisions made. As a consequence, games provide policymakers with a safe environment to test various policy options and find the set of options that may work to their advantage [68,75,76,77].
Conversely, the design of a policy game requires a comprehensive approach to ensure that knowledge learnt and created during a game session, is transferred into real life. To address this sustainability challenge, Medema [69] proposes that policy games provide actors with precise mechanisms that can be incorporated into ongoing processes. We designed the Nzoia WeShareIt game based on an ongoing policy reform of the overall water governance systems in Kenya [78,79,80]. The policy game would provide an opportunity for the policymakers to test prospective policies, which have already been proposed or may be proposed and identify the most viable provisions on diversity in the water sector. Some research findings recommend embedding a game in an already ongoing process whose outcomes are critical for the players, to facilitate knowledge diffusion, transfer, and integration [69,70,71]. The ongoing processes that we embedded the game in are the current legislative reviews aimed at developing new laws and regulations that are aligned to the 2016 Water Act [81]. Additionally, research findings recommend that knowledge integration [69] (p. 7) should be one of the goals of a game designed for social learning [69,82]. Therefore, we designing the game we incorporated three game mechanics for cooperation to ensure that there is knowledge diffusion. First, the players have a shared goal of jointly managing the Nzoia river basin. Second, players had their own individual goals of making their county government residents happy. Third, the game was designed to ensure that the competition between the shared goal and the individual goals is healthy and leads to the development of complementary roles and niches within the basin [16,17,18,19,20,21,41,67].
The Nzoia WeShareIt game was designed for application in the Nzoia river basin, in Western Kenya. This river basin comprises of a surface area of 12,900 km2 and is home to approximately 3.5 million persons. The primary economic activity is agriculture (mainly rain-fed), and the basin produces 30% of Kenyan maize and sugar [23,83,84,85]. Six counties share the basin, namely: Uasin Gishu, Trans Nzoia, Kakamega, Bungoma, Busia, and Siaya. Water access in the Nzoia Basin is between 46.7% and 88.9% (46.7% for Siaya, 82.9% for Busia, 88.9% for Bungoma, 76.7% for Trans Nzoia, 76.1% for Kakamega and 88.9% for Uasin Gishu). The hydroelectric energy access in the study area is deficient (4.3% for Siaya, 6% for Busia, 5.6% for Bungoma, 8.9% for Trans Nzoia, 5.6% for Kakamega and 27.9% for Uasin Gishu) [85]. Currently, most of the residents rely on wood fuel as their primary source of energy. Also, most county governments do not have enough resources to abstract the water for food and/or energy production. However, with increased economic growth and a rapidly growing population, the competition for the shared resource is increasing [23,83,84,85].
2.2. Game Design Method
2.2.1. Overview and Design
The Nzoia WeShareIt game’s essential characteristics are the counties in the Nzoia basin and it allows participants to negotiate over resources and products, thus generating an artificial water-food-energy nexus. Participants in the Nzoia WeShareIt game were 35 water-policymakers from the Nzoia river basin in Kenya, all of them dealing with water policy and water scarcity challenges in their daily work. In each game session, there were five players representing the five distinct counties in the game. The policy makers’ assignment was to fulfil their constituents needs with respect to food, energy and investment in public services. By fulfilling these needs, they could earn ‘happy faces’, representing their happy citizens. Each player’s resources (food, energy, water and income), generation capacity and required turnover to generate happy faces were different according to the characteristics assigned to their specific county.
In total there were seven game sessions. We played two game sessions in Busia, Bungoma and Trans Nzoia county governments, and one game session in Kakamega county government [86]. In total, there were 12 females and 23 males. Most of the participants had a bachelor’s degree (20). The age range of most of the participants was 25 to 34 (11), 35 to 44 (7) and 45 to 55 (10) [67].
At the start of the Nzoia game, the players were given a limited volume of water with pre-determined food, energy and nature parcels based on the amount of water. Thereafter, players can sell or purchase food and hydro-electric energy for 500 euros per food or energy parcel, to address their shortages or earn money to supply a certain amount of basic needs to their citizens and thus generate ‘happy faces’. However, in successive rounds, they have to negotiate the price, so scarcity may lead to higher prices; abundance to lower prices. Also, the players need to identify which county governments have a comparative advantage regarding food and/or hydro-electric power production and negotiate food and energy production quantities and prices. For instance, Busia could negotiate for a constant supply of food and energy from two different neighboring county governments based on an agreed price. Thus, the other two county governments would produce excess food and energy and Busia would ensure that they have the agreed finance to purchase the excess production. The money earned from Busia would allow the other districts to invest in public services to generate their ‘happy faces’. The game mechanism guarantees that cooperation leads to better outcomes especially when scarcity of resources occurs (in a drought period); going alone in such circumstances leads to critical shortcomings and unhappy faces.
2.2.2. Procedure
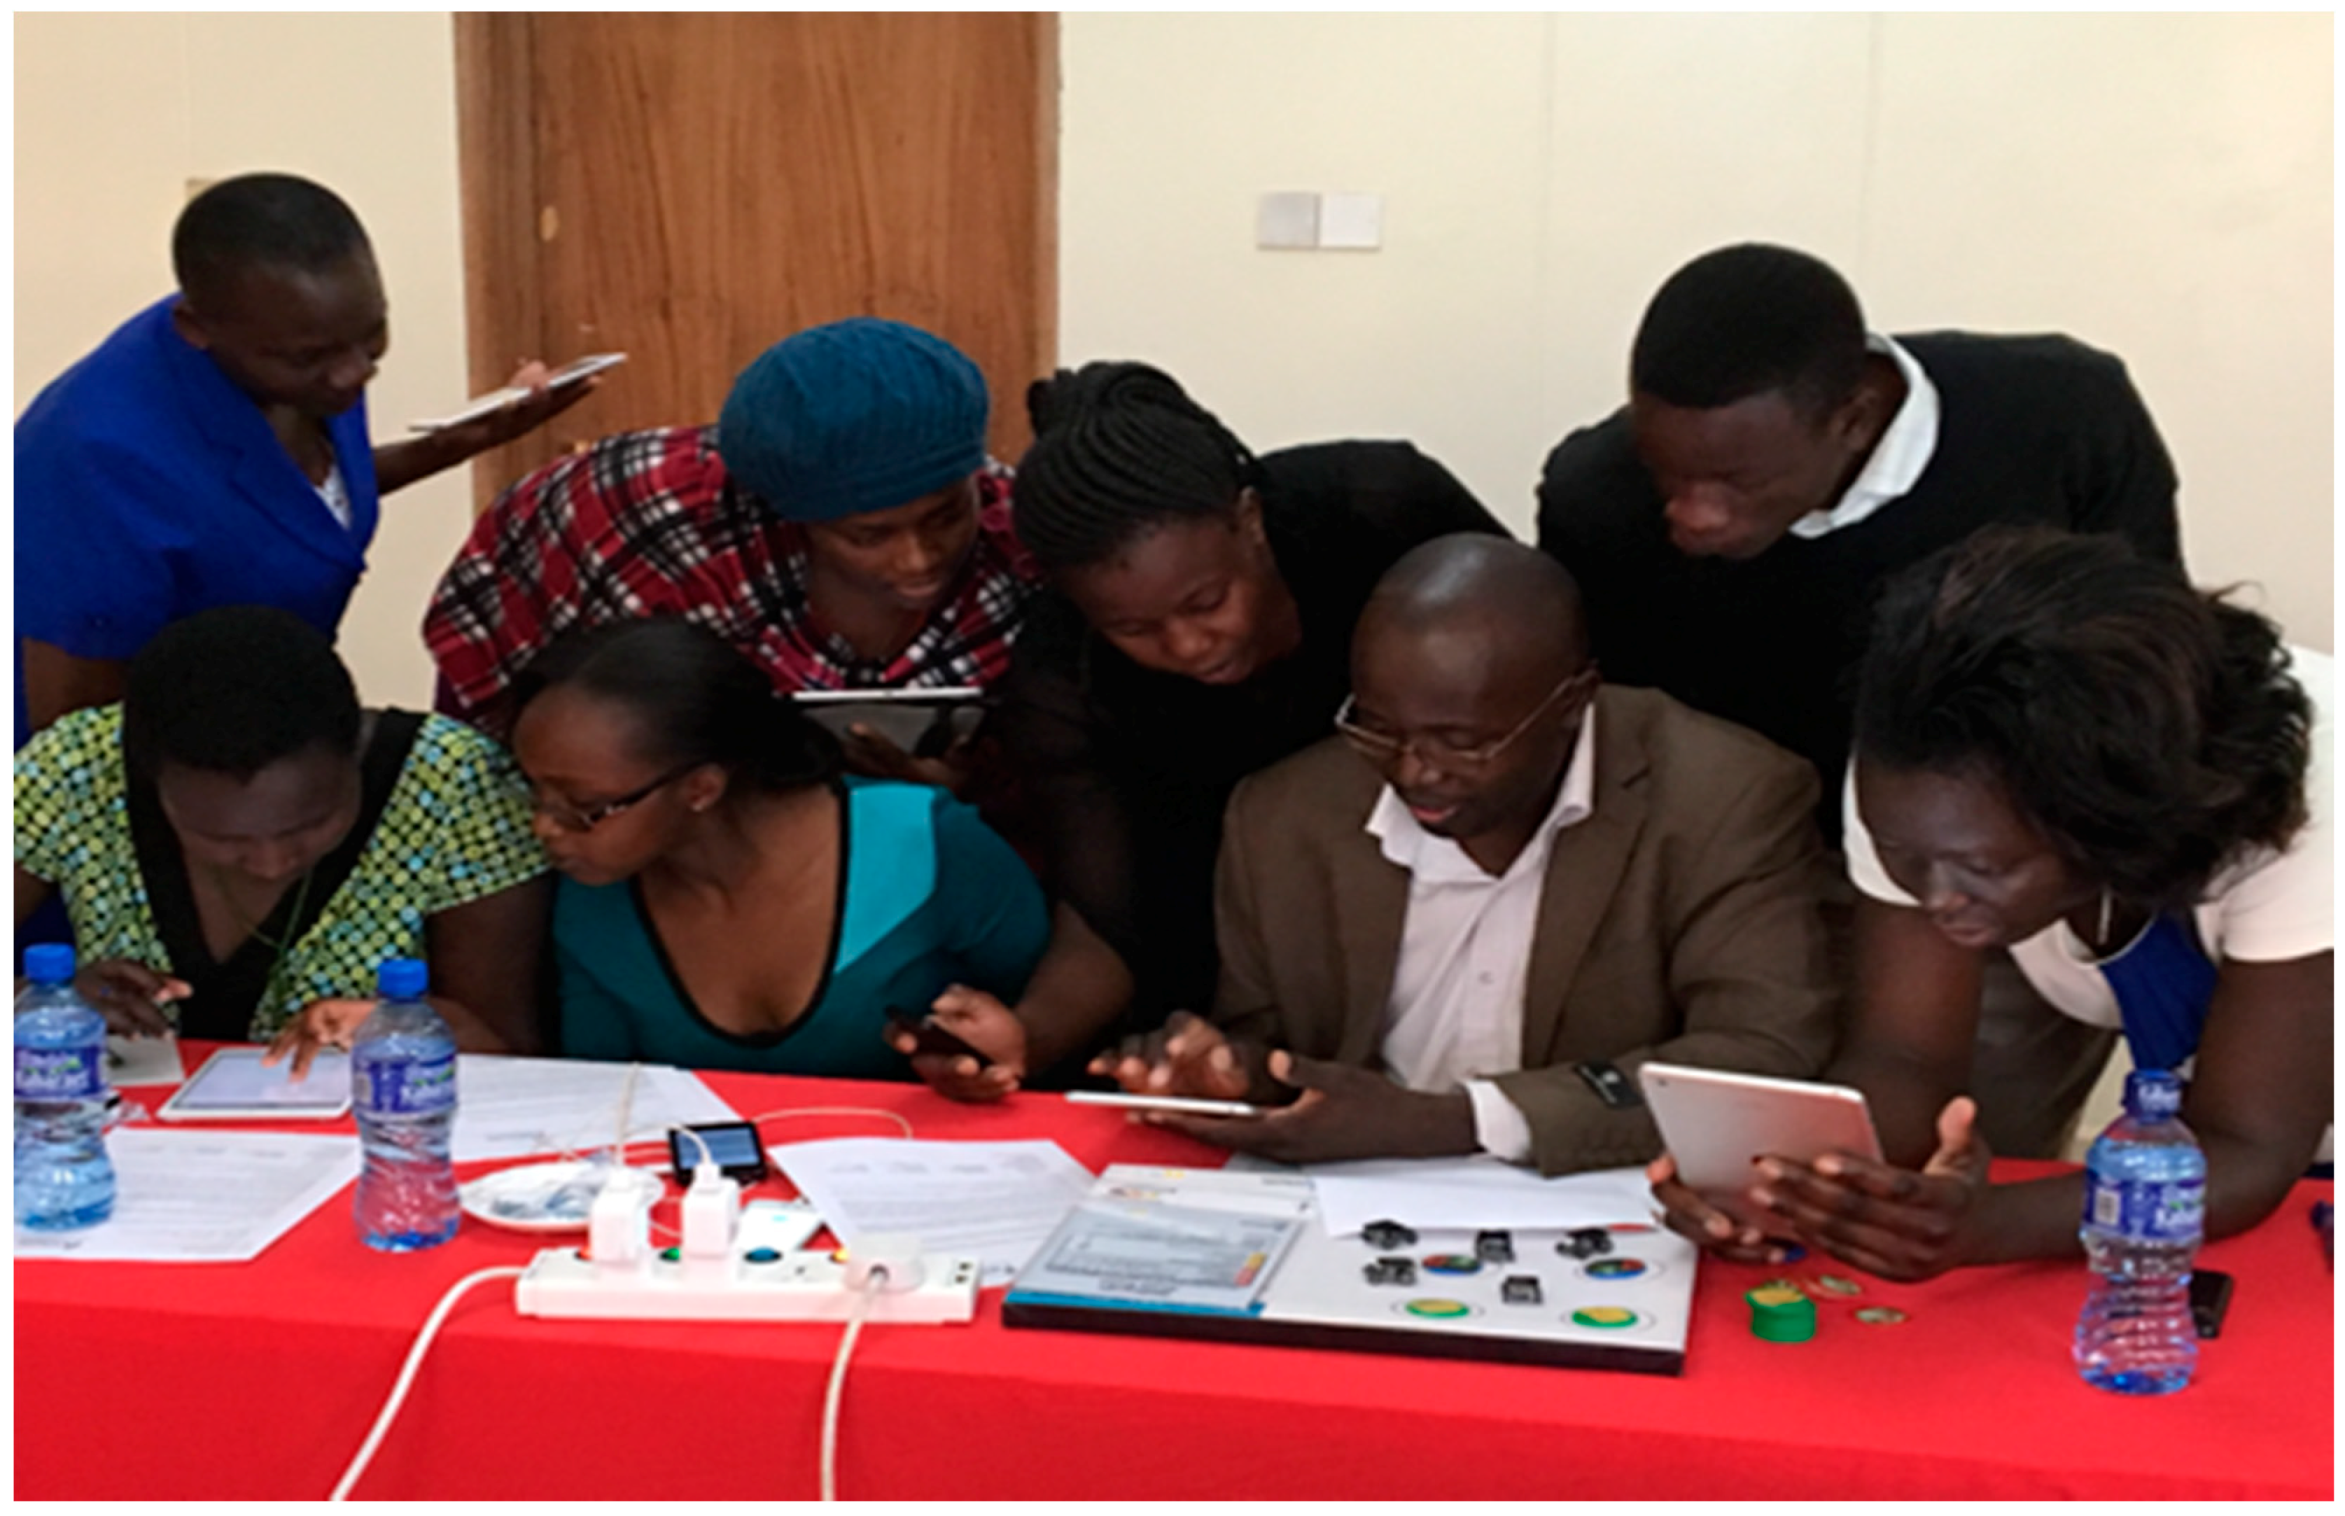
Five participants entered into a hotel meeting room, pre-arranged with five board games and five iPads and all the supporting gadgets and information (Figure 2). As they waited for the other participants, they first filled in an online pre-game questionnaire. On their desk there was also an information sheet on how to play the game. Each player was guided by a game facilitator, on the general tasks and the game instructions. At the conclusion of each session, the participants rated the Dyad negotiations during that particular trading round, in the form of an in-game questionnaire. We visualized the results in a leaderboard projected on the screen. In each round, Dyads or Triads were given 30 min to negotiate during the trading round. The results of the negotiations are recorded in the iPad and projected in real-time on the whiteboard screen [67].
Following the game session, participants completed a post-game online questionnaire. They reported their learning outcomes from the negotiation on a 5-point Likert scale, with endpoints of 1 (Very Inaccurate) and 5 (Very Accurate). The learning outcomes were phrased in statements like: through the game ‘I became more aware of the need for joint action.’ More information on the game design, application and assessment is available as supplementary information S1.
2.3. Data Analysis
2.3.1. Step 1: Selection of Methodology
To conduct our analysis, we needed a statistical procedure that is both a grouping method and a predictive technique. Discriminant analysis (DA) is used to predict the values of a grouping variable (which is the dependent variable) based on the values of the independent variables. The grouping variable is categorical (usually dichotomous, but it can be also multinomial) and the independent variables should be continuous (however, ordinal variables are also used).
Amongst the grouping techniques, we had to select between cluster analysis (CA) and MDA. CA groups the population members in homogeneous classes or clusters (or groups). The researcher does not know the groups in advance; they will be created during the clustering procedure. The cluster analysis technique computes the distances between cases and then builds a similarity or proximity matrix based on those distances. The cases that are close to one another are included in the same cluster.
We already knew the groups in advance and did not need to undertake cluster analysis. We needed a grouping methodology for predictive purposes. We seek to assess whether PAD is a stronger predictor than DD (age, education level, and gender) of water negotiation outcomes (whether a water negotiation groups will develop SSI surpassing in and out-group differences and cooperate or they will act unilaterally), and will diminish in PAH groups leading to a change in group dynamics as DD takes prominence. Therefore, MDA was found to be the most relevant procedure, based on the nature of the data and the purpose of the analysis. The game data for conducting MDA is available as supplementary information S2.
2.3.2. Step 2: Creating the Crosstabs
We used SPSS to create crosstab contingency tables, which are useful for examining the relationship between two categorical variables. The crosstab tables are in Appendix A. We extracted the grouping variables and the three independent variables from the pre and postgame questionnaires. The grouping variables are the 7 game sessions; and (2) four independent variables, namely age range, gender (male, female), education level and the respondent ID (35 respondents).
Table A1 (Appendix A) are the results from conducting a cross-tabulation of Gender * Education. The results indicate that the highest number of player’s highest attained education was bachelors (8 females and 12 male). The lowest education completed was primary education, by one female. The highest education completed was a Master’s degree. Only one woman and two men had completed a Master’s degree. There were six male and one female whose highest level of education was a college diploma.
Table A2 (Appendix A) are the results from conducting a cross-tabulation of Game * Age. The results indicate that the highest number of players were in the 25 to 34 age brackets (#11) and the lowest was the 55 to 64 age brackets (#3). Trans-Nzoia county government policymakers were mainly young persons (25 to 44), and Bungoma county government mainly comprised of elderly persons (45 to 64). Only one game session (Busia_2) had an even distribution of players in all the age sets: 1 player in each age bracket (see also Table A3 and Table A4).
Table A5 (Appendix A) are the results from conducting a cross-tabulation of Game * Gender. The results indicate that three groups purely comprised of male players. The other three game sessions had an acceptable gender balance (3 × 2). One group had four females and one male. No group had no male represented. We performed a chi-square test and tabulated the results in Table A6 (see also Table A7).
Table A8 (Appendix A) are the results from conducting a cross-tabulation of Game * Education. The results are similar to Table A1 results. However, Table A8 is not disaggregated by gender. All the game sessions had players with a bachelor’s degree. The players with the highest education were from Trans Nzoia county government. The player with the lowest education was from Busia county government. Trans Nzoia is the upstream county government, and Busia is the downstream county government (see also Table A9 and Table A10).
2.3.3. Step 3: Assumption Testing
Before conducting the MDA procedure, we first checked some assumptions that are required to be tested before running an MDA procedure, to ensure that the model is robust [87]. The three assumptions that were tested and met are: (1) the dependent variable is categorical, with disjoint groups; (2) the independent variables are continuous (or at least ordinal); and (3) there is no critical multicollinearity (the independent variables are not strongly correlated with each other). The detailed results of the assumptions testing are in Appendix B.
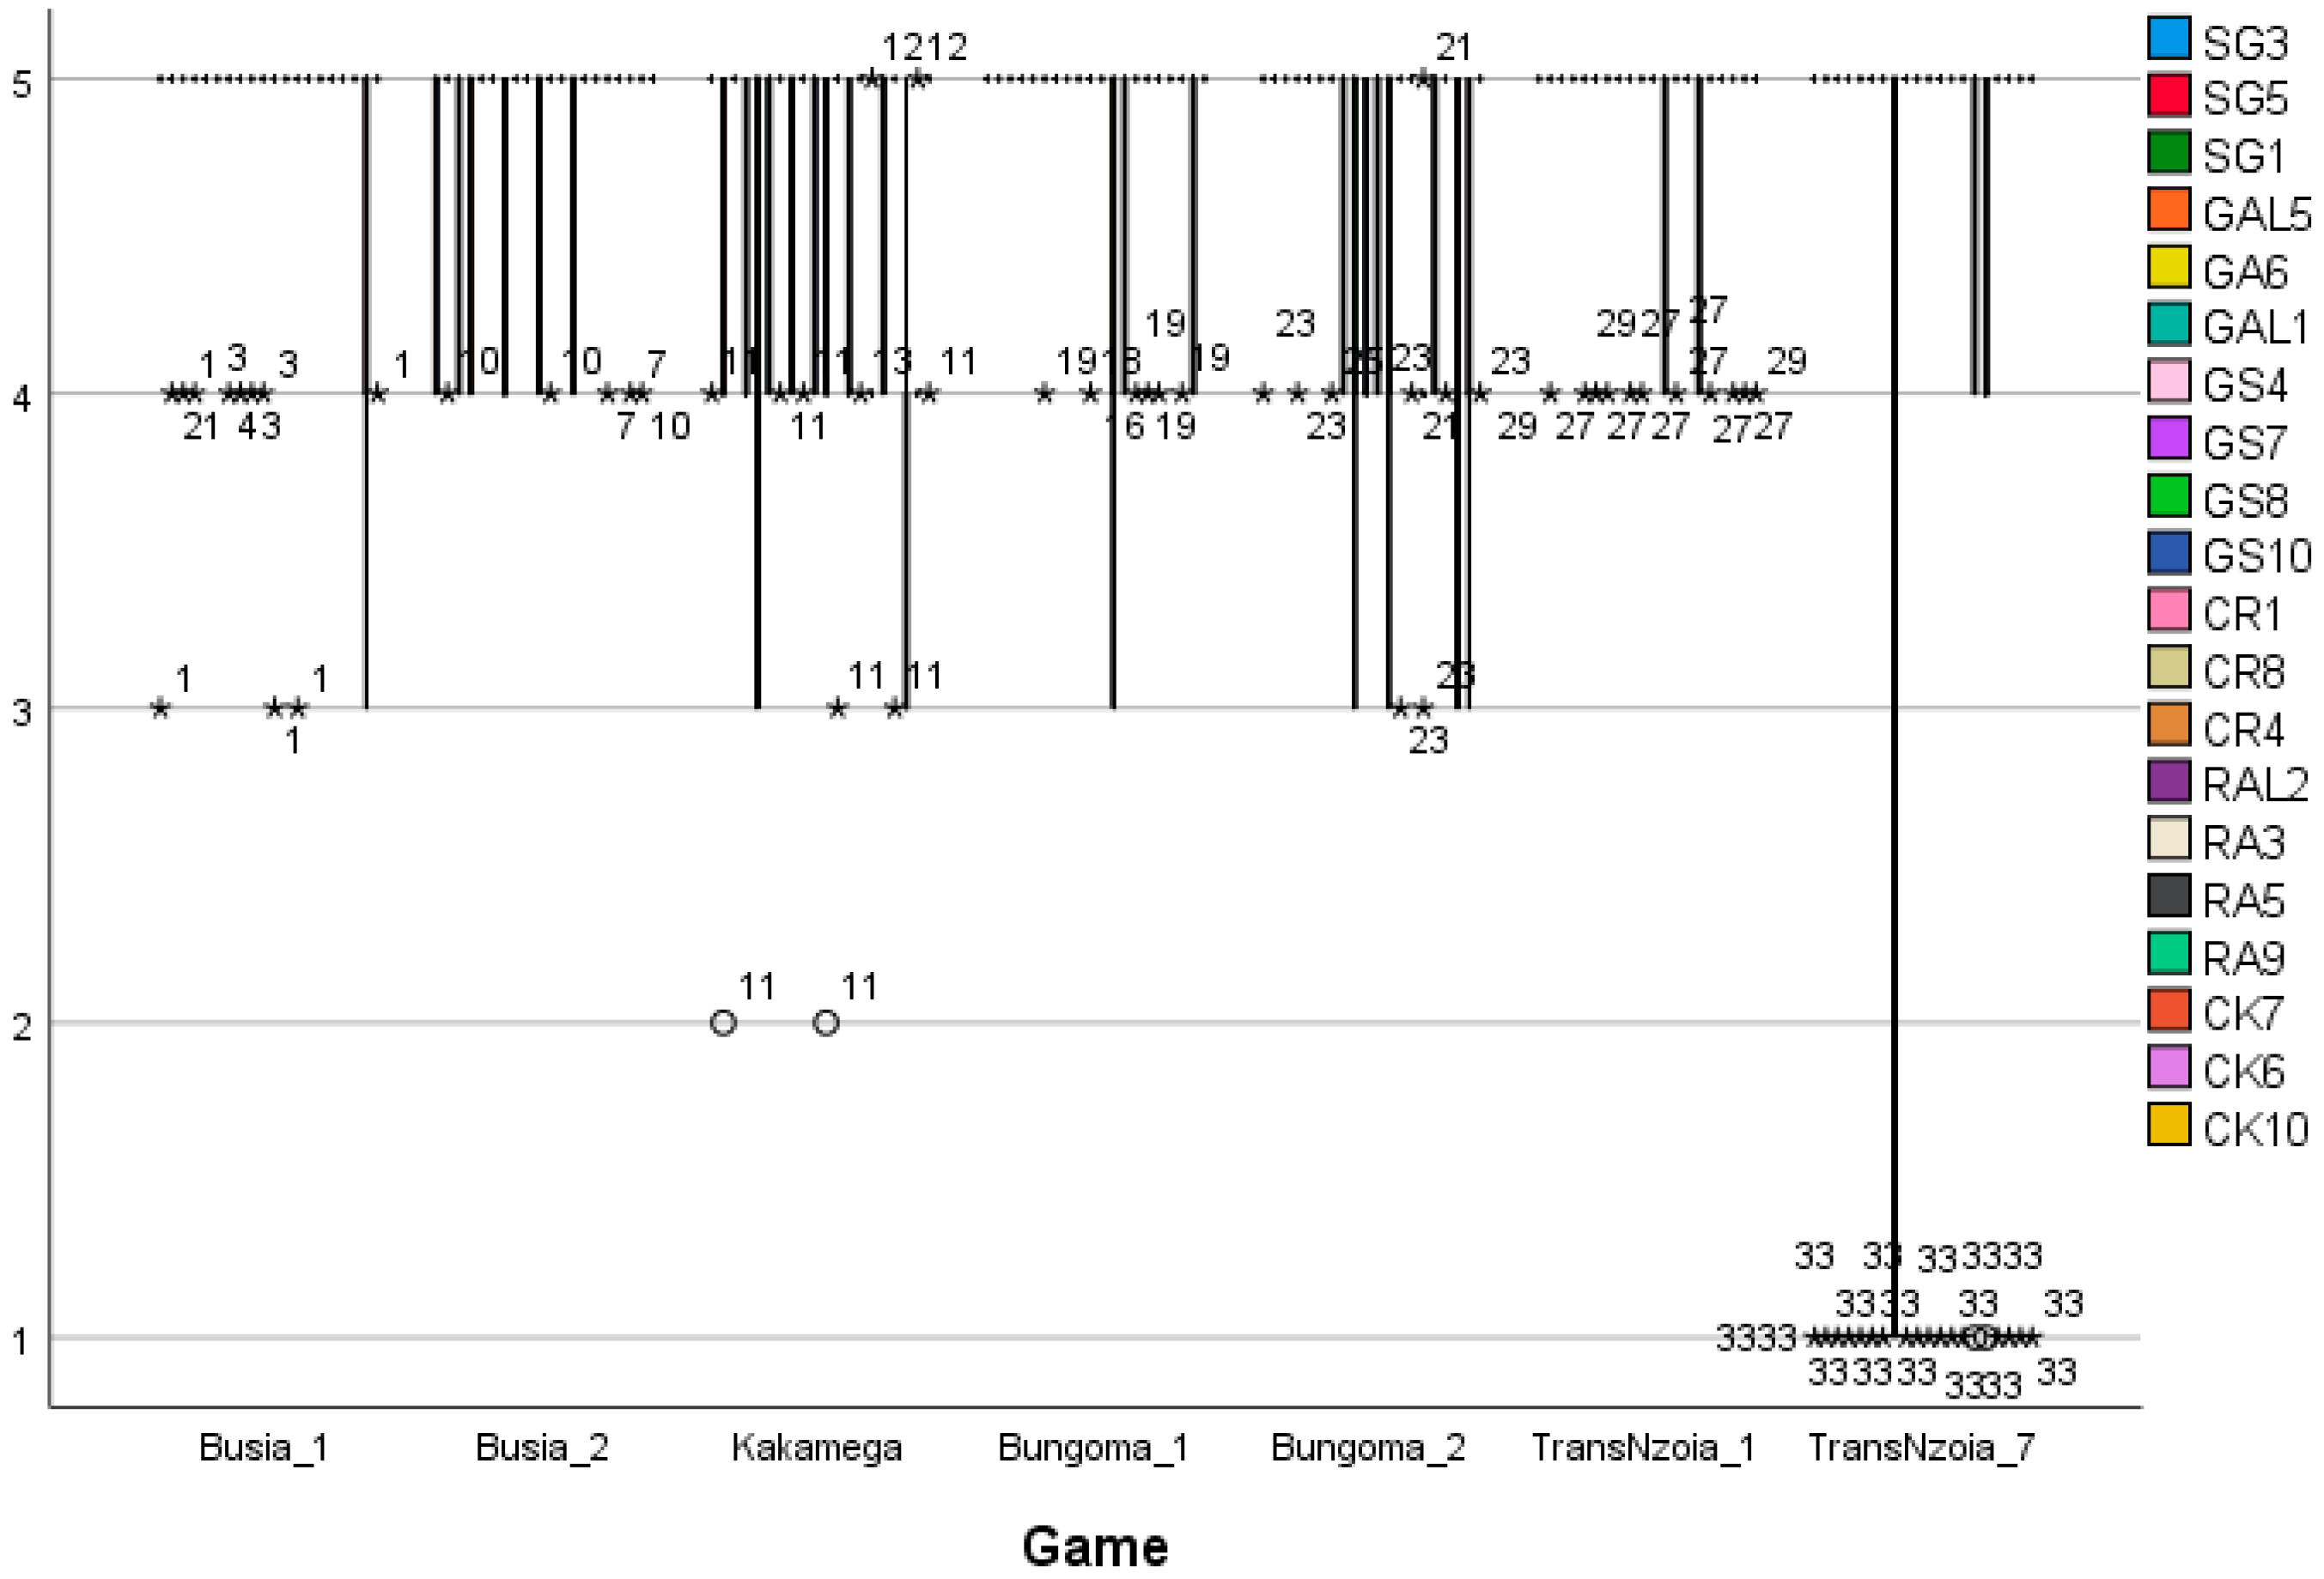
The last assumption we tested was that the data do not present significant outliers. The outliers may represent a danger for our proposed analysis because they affect the mean and standard deviation. We conducted a graphical test, using boxplot chart histograms to identify outliers (Figure A1 and Figure A2 in Appendix B). Based on the graphical representation of all the assessment results of the 20 dependent variables distributed according to gender (Figure A1) and the seven game sessions (Figure A2), we identified multiple outliers. Some outliers appear to be extreme because of their distance from the mean. We proceeded to conduct the MDA, after testing the robustness of the model to determine whether the outliers affected the model. The model was found to be robust enough not to be affected by the significant outliers, as described in Section 2.3.2 and Appendix B.
2.3.4. Step 4: Conducting a Multiple Discriminant Analysis (MDA) Procedure
To conduct the MDA procedure, we used the SPSS discriminant analysis function. For the MDA classification, we treated all groups as equal and used the within-groups covariance matrix. The MDA functions assigned each case to one group by computing the probability of belonging to one group based on the scores of the independent variables (IDVs). From the MDA we were able to differentiate the groups of the response variables. The MDA procedure aims to use the results to identify what differentiates various negotiators (female, male, young, elderly, and their education level). The MDA procedure creates the following discriminant function:
where the dependent variable is y, the x’s are the explainers and the b, s are the coefficients.
y = b0 + b1 x1 + b2 x2 + … + bk xk
In MDA, the number of discriminant functions created by the algorithm is min (c − 1, k), where c represents the number of categories in the dependent variable, and k is the number of independent variables. Therefore, we created the discriminant functions by the following algorithm: min (7 − 1, 4).
3. Results
3.1. In-Game Data Results
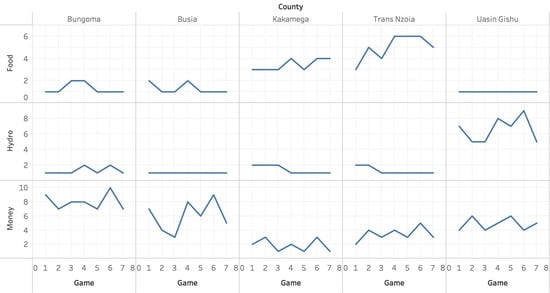
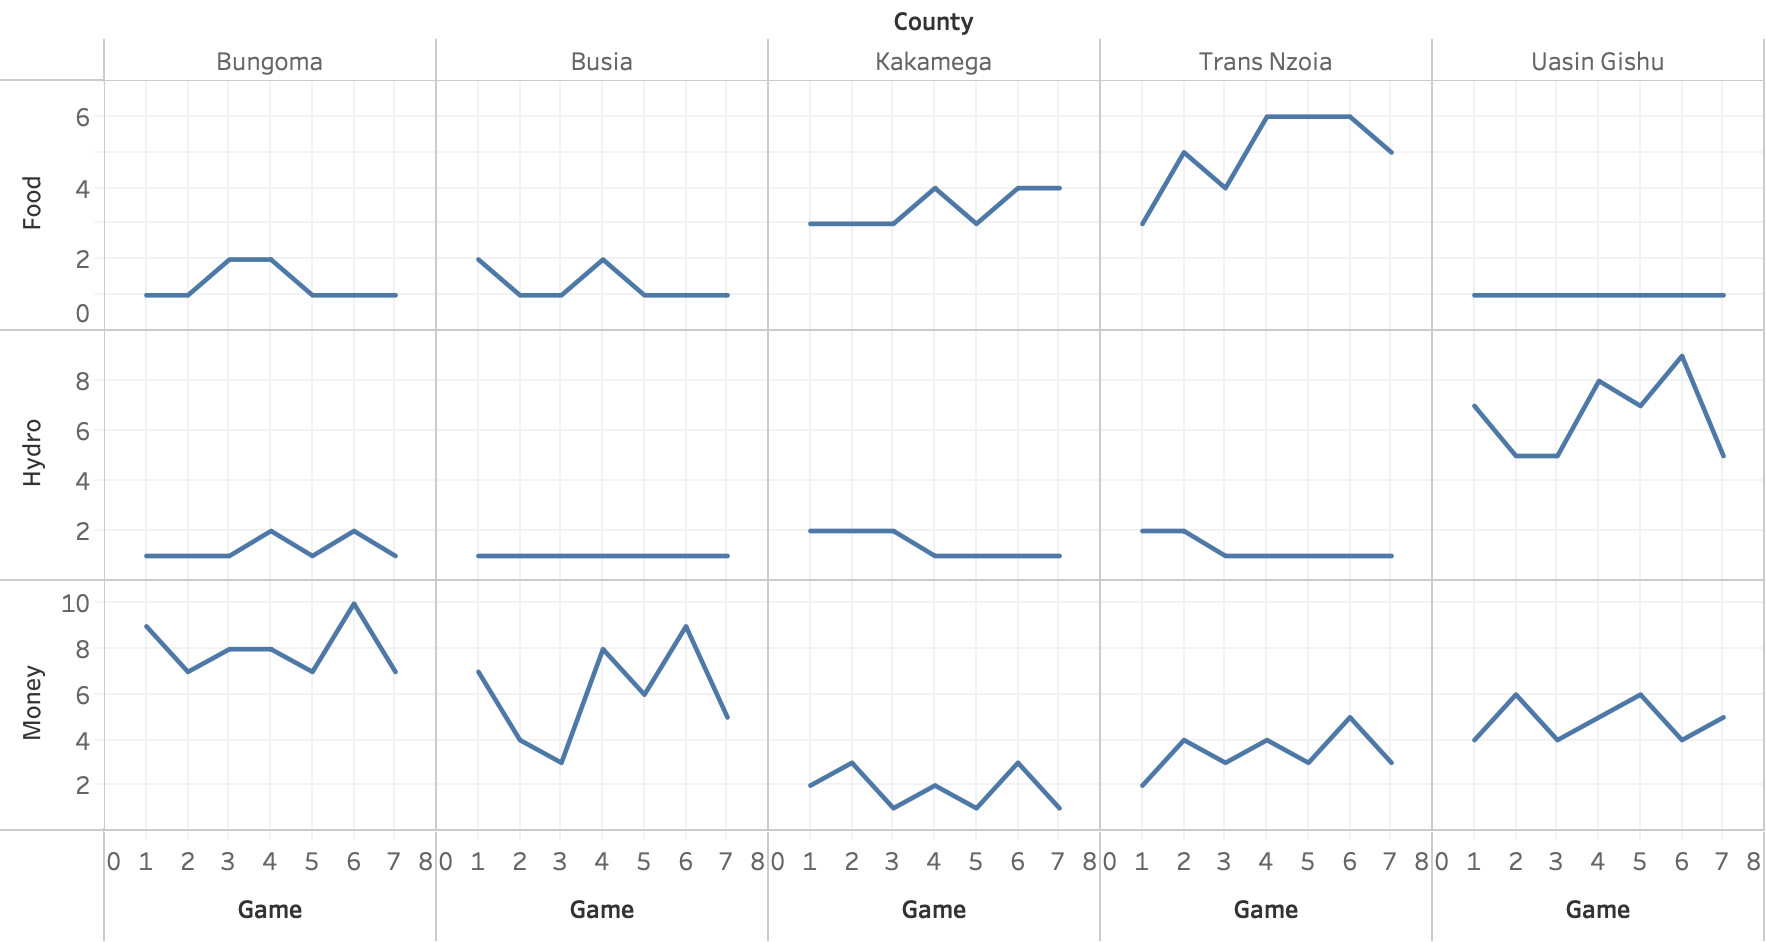
There were two datasets of the in-game data that we found relevant for this particular analysis. The first dataset is the changes in the resources (Food, Energy in the form of Hydroelectric Power and Money) in the seven game sessions for the five county governments. The second dataset is the grand total of smileys earned in the seven game sessions for the five county governments. We analyzed the dataset using the one vital element of cooperation, SSI [88,89]. Figure 3 visualizes the changes in the food, energy and money resources, based on the negotiations between the five policymakers in each of the seven game sessions. The in-game data is available as supplementary information S2.
Based on the results, there was more evidence of SSI in the game sessions 4 and 6 where the critical producers of food (Trans Nzoia and Kakamega), increased their production to be able to sell the surplus to the other local authorities. In the game session 4, Trans Nzoia also increases food production, thus pursuing SSI based on its comparative advantage, but Kakamega does not increase its production in the game session 4. Uasin Gishu county government pursues SSI in 4, 5 and 6, with better results in game 6, followed by 4 and finally 5. Busia and Bungoma also pursue SSI with the highest changes in the money resource in the game session 6, followed by game session 4 and then 5. Therefore, from the results, game session 6 negotiation outcomes lead to cooperation, evidenced by the five county governments pursuing SSI in an environment where there are goal asymmetries.
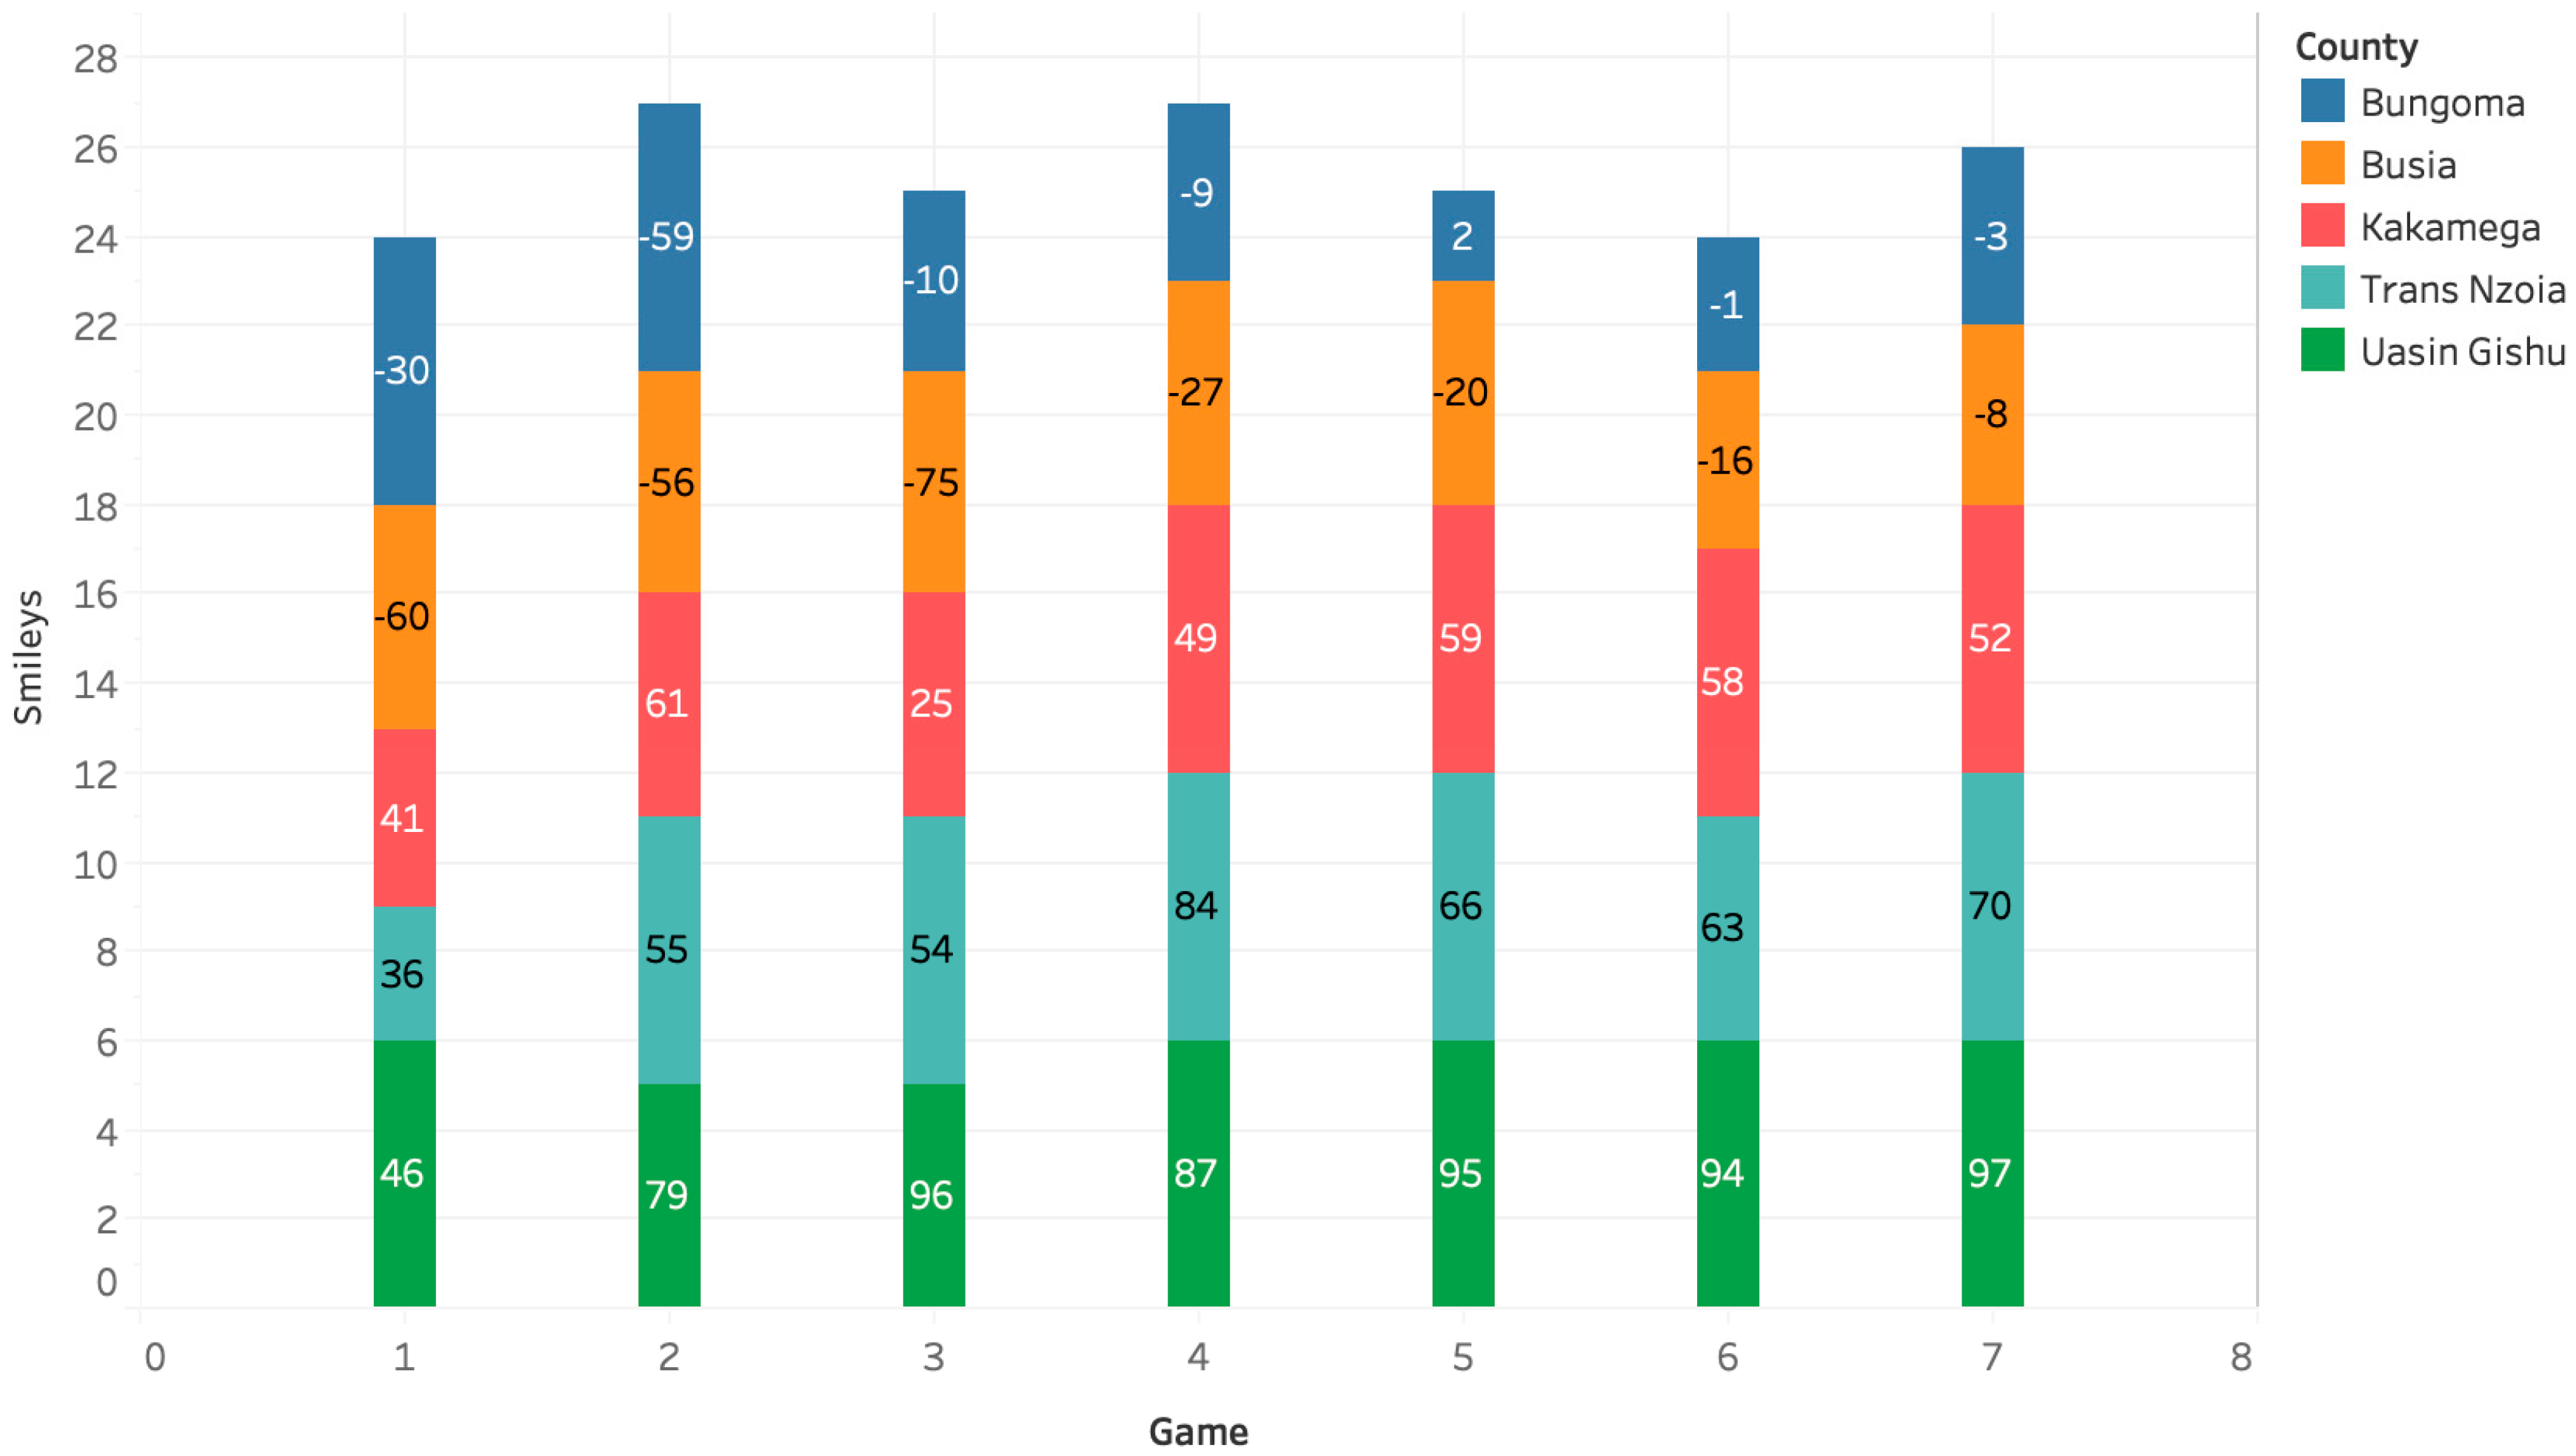
Figure 4 visualizes the total of smileys earned based on the negotiations between the five policymakers in each of the seven game sessions. Participants earned smileys when the county government met its residents’ food, energy, and investments in public service needs. Based on the results, there is more evidence of SSI in the game sessions 4 to 6 because inequities reduce. Game session 7 has the least negative results whereas game session 2 has the highest negative results.
- Group 1: Unilateral actions (Game session 1, 2 and 3 comprising of 15 policy makers in 3 water negotiation teams).
- Group 2: Cooperation (Game session 4, 5, 6 and 7 comprising of 20 policy makers in 4 water negotiation teams).
Based on the varied outcomes (cooperation and unilateral actions), it was not clear what diversity attribute was the strongest predictor of the water negotiation outcomes. To gain more insights, we proceeded to conduct an MDA procedure, as explained in the subsequent parts of this section.
3.2. Strength of the MDA Procedure
The program computed four discriminant functions based on four independent variables, education, gender, age, and respondent ID. Every function derives a meaning depending on the variables that it is correlated. Also, with the help of the discriminant function, the program computed the probability whether k belongs to one category or another and assign each k to a category.
Table A11 in Appendix C represents the Eigenvalues of each function. These values show the importance of each function. The first function has an Eigenvalue was equal to 56.94 and explains 97.1% of the total modal variance. By contrast, the second function is less critical, its Eigenvalue is only 1.38, and explains only 2.3% of the total modal variance. The third function has an Eigenvalue of 0.28 and explains 0.5% of the total modal variance. The final function has an Eigenvalue of 0.03 and does not explain any percentage of the modal variance. In the last column of Table 1 are canonical correlation coefficients. These squares show the percentage of the variation in the response variables, which is an explanation of the variation by each function. The canonical correlation associated with the first eigenvalue was equal to 0.99, followed by 0.76. The first function explains the highest variation whereas function 4 explains the lowest.
The table of Wilks’ Lambda (Table A11 in Appendix C) indicates how strong is the discriminating power of the independent variables or how well the independent variables explain the dependent variables. The lower the Wilks’ Lambda, the stronger the discriminating power of the independent variables. The first line represents the Wilks’ Lambda for all the four functions, which was found to be statistically significant (Wilks Λ = 0.006, F (24, 148.248), p = 0.0005). Additionally, the Wilks’ Lambda for function 2 through 4 was found to be statistically significant (Wilks Λ = 0.319, F (15, 32.557), p = 0.005). Since the Chi-square test p-value for functions 1 through 4 and 2 through 4 is lower than 0.005, it indicates that the MDA model is robust.
By contrast, the 3 through 4 and function 4, were not found to be statistically significant (Wilks Λ = 0.758, F (8, 7.887), p = 0.445) and (Wilks Λ = 0.972, F (3, 0.810), p = 0.847). Moreover, the p-value in the two tables indicates the distances between the group centroid are significant. Table A12 (Appendix C) contain the functions of group centroids for functions 1 through 4, evaluated at group means. For each function, we have at least seven centroids. Since the p values are lower than 5%, then the distances between the centroid are large enough to be considered significant for functions 1 through 4. Therefore, there are good chances that the discriminant functions classify the cases correctly.
3.3. Test of Equality of Group Means
Table 2 is the test of equality of group means. It presents the Wilks’ Lambda values for each of the independent variables. Respondent ID has the lowest Wilks’ Lambda, thus the highest discriminating power, which is statistically significant. The results of the tests of equality of group means of gender and education and respondent ID are statistically significant. The results of age are not statistically significant.
Based on the pooled within-groups correlations between discriminating variables and standardized canonical discriminant functions listed in Table A13, the MDA computed the structure matrix for function 1 to 4. Based on the discriminant functions, the SPSS program computed, for each case, the probabilities of belonging to each of the seven original groups.
The table of the classification of the results (Table A14 in Appendix C), indicates that all the classification results for the groups: Busia_1, Busia_2, Kakamega and Trans Nzoia_2 were correctly classified. However, Bungoma_1, Bungoma_2, and Trans Nzoia_1 were incorrectly classified. Trans Nzoia_1 is the only group where the females largely outnumbered the males (4 females, 1 male). Bungoma_1 and Bungoma_2, comprised of purely male teams. Therefore, the incorrectly classified groups were the extremes. Overall, an outstanding percentage of 94.3% were correctly classified, proving the power of the discriminant function in our model.
3.4. MDA Procedure 1: Four Function Structure Matrix
Table 3 on the structure matrix, describes the correlation between each discriminant function and the independent variables. The first function is positively correlated with respondent ID, education and age and negatively correlated with gender. We could assume that this function is associated with a negotiation team selected based on PAD, education, and age, with little consideration of education and no consideration of gender. In function 1, the highest (0.937) positive discriminating factor is PAD and the only negative discriminating factor is gender (−0.023).
The second function is positively correlated with ID, age and gender. Function 2 is negatively correlated with education. We could assume that this function is associated with a negotiation team selected based on PAD, age, and gender with little consideration of education. In function 2, the highest (0.668) positive discriminating factor is gender, followed by age and then PAD/skills (ID). Function 2, as explained earlier, explains only 2.3% of the total modal variance. Function 3 and 4, will not be considered, because they are statistically insignificant, based on the previous analyses.
When gender, age and education are combined with respondent ID, the discriminating power of PAD (respondent ID) shows overwhelmingly that the effect of gender, age and education is negligible, as evident in function one results of the structure matrix (Table 3). The first canonical discriminant function is crucial because it explains 97.1% of the variance (Table A11). Additionally, the Wilks’ Lambda for a test of functions 1 through 4 is only 0.006, and its p-value is 0.0005, which confirms the immense power of the function 1 (Table A11). Function one is heavily controlled by PAD. The influencing power of education, age, and gender is negligible.
3.5. MDA Procedure 2: Three Function Structure Matrix Less Personal Attributes Diversity (PAD)
Due to the high discriminating power of PAD, in the next MDA model, we removed the respondent ID from the structure matrix, in favor of looking for generic gender effects. Thus, when we left the model with only three functions, the structure matrix changed (see Table 4). Gender and education gained more prominence.
The first function is positively correlated with education and negatively correlated with gender and age. Function 1 was found to be statistically significant (Wilks Λ = 0.252, F (18, 39.969), p = 0.002). Function 2 is positively correlated to all the three independent variables, which was found not to be statistically significant (Wilks Λ = 0.685, F (10, 10.967), p = 0.36). Function 3 is positively correlated to gender and age and negatively correlated to education, which was found not to be statistically significant (Wilks Λ = 0.910, F (4, 2.728), p = 0.604). While the new model is not as strong as the previous model (42.9% of original grouped cases correctly classified, (see Table A15 in Appendix C), it provided insights into the probable structural composition of the functions when we do not consider PAD. Gender and education have a high discriminating power while the predicting power of age is negligible.
4. Discussion and Conclusions
The results confirm the hypothesis that PAD is a better predictor than DD (age, education level, and gender) of negotiation outcomes (whether a water negotiation groups will develop SSI surpassing in and out-group differences and cooperate or they will act unilaterally). The MDA procedure indicate that the strongest predictor of water negotiation outcomes in the Nzoia WeShareIt game is PAD. When assessing the impact on negotiation outcomes in the MDA, a four-structure matrix PAD is the dominant predictor with little or no influence from gender, age and education.
The results also support previous studies indicating that PAD is a stronger predictor of improved decision-making than DD. Based on the reviewed literature, we attribute PAD being the strongest predictor of the water negotiation outcomes to four main factors: increased cognitive ability [45,60,61,62,63], innovative decision-making [45], unique networks [42], and unique life experiences [64].
Moreover, when we eliminated PAD from the model, gender and education gained more prominence and competed almost equally. Thus, when PAD is negligible, for instance a water negotiation team comprising of only lawyers (functional), with similar knowledge, cognitive skills, capabilities and values, then gender and education diversity will take prominence. Since age and gender are negatively correlated, they jointly have a stronger discriminating power than education. The discriminating power of gender is the highest because its correlation coefficient is the highest, followed very closely by education. However, when gender and age are combined, they possess more discriminating power than education.
These second result clearly presents a challenge and possibly an opportunity. Based on previous research, it is important to focus more on PAD rather than DD [42]. As Putnam state DD “at least in the short run, seems to bring out the turtle in all of us” [36] (p. 151). However, the results in this paper indicate that when PAH negotiation team is constituted, there is a high likelihood that decisions will be influenced not by PAD (because it no longer exists) but by gender and education level. Moreover, as earlier discussed, the literature on DD is not conclusive. It provides numerous outcomes that could not be easily substantiated since most of the studies on DD were conceptual in nature with no empirical backing. Moreover, DD research indicate that in the short term, DD does not build trust [65], social cohesion [36,42,65], nor does it lead automatically to improved decision-making [66]. Research also indicates that DD is useful for monitoring, evaluation, service delivery, broadening the network, tapping into unique networks and fostering equity [45,54].
Therefore, if the aim of the basin management institution is to improve decision making and enhance cooperation, PAH may be a threat to this aim, thereby presenting a challenge. Nevertheless, in such instances, there are two policy options that water policymakers may decide upon, which may open more opportunities for integrated river basin management. First, diversify their PAH negotiation teams by introducing new members who possess divergent values, skills, capabilities, functional, cognitive abilities and knowledge. Second, introduce SSI to develop bonding and bridging social capital that enables the demographic heterogeneous PAH group to surpass their differences, perceive themselves as one team, and be willing to cooperate.
This empirical study, conducted in Kenya, supports the argument that diversity discussions should move away from whether diversity is good or bad towards understanding how the different diversity attributes contribute to cooperative decision-making, their respective elements and their unique value addition. If the policy aim is improved decision-making in water management, then more focus should be on PAD than on DD. However, if the aim is improved supervision, monitoring, evaluation and service delivery, then DD should be the focus when deciding on group composition. In addition, as argued above, there are different types of DD and PAD, each with different influencing power on specific circumstances and outcomes. However, it should be noted that the conclusion regarding the functions of PAD and DD is inferred from the literature review conducted at the beginning of this paper and not directly assessed in this particular study. Therefore, to get more clarity there is a need for further investigations on the contribution of different diversity attributes to negotiation outcomes in a given river basin.
The research approach faced a few limitations. First, the broad assertion that water resource negotiation teams can be ideally formed with attention to the diversity characteristics presented in the paper may be considered is an assumption. Sometimes, the formation of the team is based on the national laws and regulations or other considerations. Moreover, we acknowledge the limitation that the research is based on outcomes of a simulation game and not an actual negotiation. This is one of the major challenges faced by transition management experiments, whether gaming simulation or otherwise. We acknowledge the limitations of the study and propose caution and further analyses in the form of an actual pilot programme before considering scaling up. Nevertheless, gaming simulation has an effective role to play in research and knowledge diffusion. Gaming simulation can be attributed to real life situations through use of a game as a research tool and ensuring a diffusion of knowledge on real world situations. The Nzoia WeShareIt game was entrenched to the ongoing water policy reforms in Kenya to test the efficacy of proposed diversity related water policies in a game environment before actual application in a real-life setting. Another limitation is that the Nzoia WeShareIt game constructed solely intra-county basin management, whereas most of the water negotiations are conducted at the international basin level. The Nzoia WeShareIt game is inspired by the Nile WeShareIt game, which we developed for the Nile basin. The Nzoia river basin is a sub-basin of the Lake Victoria basin and the Nile basin. Considering the complexity and challenges in this sub-basin; and it being the largest tributary to the Lake Victoria basin in Kenya and second largest at the international level after Kagera basin, and also considering the upstream–downstream tensions within this sub-basin, it seems justifiable to use the term basin. We also note that the conclusions and the use of the games as a learning tool for negotiators would have been made much stronger with a meta-game session involving several or all of the county teams. We hope to implement this in future studies to ensure that the results are validated at the basin level by all the county governments.
Clearly there is need for further studies to understand these complexities and provide more guidance to decision-makers on what mix of diversity attributes to focus on, so as to get the intended outcome. Our study concentrated on water negotiations in the Nzoia river basin in Kenya. Our findings, therefore, are valid only for this particular situation, but the implications might be wider. The findings put to discussion the idea that DD rather than PAD characteristics are the best predictor of successful negotiations. Evidently this is not always the case and we are not the first to make this claim explicit. Therefore, at the river basin level, determining the predictors of negotiation outcomes can guide the water policymakers to focus on strengthening the high predictors to get the best outcome out of a planned water negotiation. This information would support or expedite the process of developing cooperative framework agreements aimed at increasing water access and reducing water scarcity.
Supplementary Materials
The following are available online at the TU Delft Repository. S1: The game design concept report is found in the TU Delft Repository: (http://doi.org/10.4233/uuid:3a1f1e27-274b-4459-8a14-ba3068a9cb4a). S2: The data used to conduct the MDA, found in the 4TU open data repository (10.4121/uuid:b1d47ae5-e1e2-4b0e-a7eb-df9450574f6b).
Author Contributions
Conceptualization, A.M.O.; Data curation, A.M.O.; Formal analysis, A.M.O. and B.E.; Funding acquisition, B.V.d.W.; Investigation, A.M.O.; Methodology A.M.O.; Project administration, B.E. and B.V.d.W.; Resources, B.V.d.W.; Supervision, B.E. and B.V.d.W.; Validation, A.M.O., B.E. and B.V.d.W.; Visualization, A.M.O.; Writing—original draft, A.M.O.; Writing—review and editing, A.M.O., B.E. and B.V.d.W.
Funding
This research received no external funding.
Conflicts of Interest
The authors declare no conflict of interest.
Appendix A: Crosstabulation, Chi-Square Tests and Symmetric Measures

Table A1.
Gender * Education crosstabulation.
| Count | |||||||
|---|---|---|---|---|---|---|---|
| Education | Completed Primary Education | Completed Secondary Education | College Diploma | Bachelor’s Degree | Master’s Degree | Total | |
| Gender | Female | 1 | 1 | 1 | 8 | 1 | 12 |
| Male | 0 | 3 | 6 | 12 | 2 | 23 | |
| Total | 1 | 4 | 7 | 20 | 3 | 35 | |
Table A2.
Game * Age crosstabulation.
| Count | |||||||
|---|---|---|---|---|---|---|---|
| Age | 18 to 24 | 25 to 34 | 35 to 44 | 45 to 54 | 55 to 64 | Total | |
| Game | Busia_1 | 1 | 3 | 0 | 1 | 0 | 5 |
| Busia_2 | 1 | 1 | 1 | 1 | 1 | 5 | |
| Kakamega | 1 | 1 | 1 | 2 | 0 | 5 | |
| Bungoma_1 | 1 | 0 | 1 | 2 | 1 | 5 | |
| Bungoma_2 | 0 | 1 | 1 | 2 | 1 | 5 | |
| TransNzoia_1 | 0 | 3 | 2 | 0 | 0 | 5 | |
| TransNzoia_7 | 0 | 2 | 1 | 2 | 0 | 5 | |
| Total | 4 | 11 | 7 | 10 | 3 | 35 | |
Table A3.
Chi-square tests: Game * Age.
| Chi-Square Tests | Value | df | Asymptotic Significance (2-Sided) |
|---|---|---|---|
| Pearson Chi-Square | 16.509 a | 24 | 0.869 |
| Likelihood Ratio | 22.302 | 24 | 0.561 |
| Linear-by-Linear Association | 0.498 | 1 | 0.480 |
| N of Valid Cases | 35 |
35 cells (100.0%) have expected count less than 5. The minimum expected count is 0.43.
Table A4.
Symmetric measures: Game * Age.
| Symmetric Measures | Value | Approximate Significance | |
|---|---|---|---|
| Nominal by Nominal | Phi | 0.687 | 0.869 |
| Cramer’s V | 0.343 | 0.869 | |
| N of Valid Cases | 35 | ||
Table A5.
Game * Gender crosstabulation.
| Count | ||||
|---|---|---|---|---|
| Gender | Female | Male | Total | |
| Game | Busia_1 | 3 | 2 | 5 |
| Busia_2 | 2 | 3 | 5 | |
| Kakamega | 0 | 5 | 5 | |
| Bungoma_1 | 0 | 5 | 5 | |
| Bungoma_2 | 0 | 5 | 5 | |
| TransNzoia_1 | 4 | 1 | 5 | |
| TransNzoia_2 | 3 | 2 | 5 | |
| Total | 12 | 23 | 35 | |
Table A6.
Chi-square tests: Game * Gender.
| Chi-Square Tests | Value | df | Asymptotic Significance (2-Sided) |
|---|---|---|---|
| Pearson Chi-Square | 15.471 a | 6 | 0.017 |
| Likelihood Ratio | 19.809 | 6 | 0.003 |
| Linear-by-Linear Association | 0.493 | 1 | 0.483 |
| N of Valid Cases | 35 |
a 14 cells (100.0%) have expected count less than 5. The minimum expected count is 1.71.
Table A7.
Symmetric measures: Game * Gender.
| Symmetric Measures | Value | Approximate Significance | |
|---|---|---|---|
| Nominal by Nominal | Phi | 0.665 | 0.017 |
| Cramer’s V | 0.665 | 0.017 | |
| N of Valid Cases | 35 | ||
Table A8.
Game * Education crosstabulation.
| Count | |||||||
|---|---|---|---|---|---|---|---|
| Education | Completed Primary Education | Completed Secondary Education | College Diploma | Bachelor’s Degree | Master’s Degree | Total | |
| Game | Busia_1 | 0 | 0 | 1 | 4 | 0 | 5 |
| Busia_2 | 1 | 2 | 1 | 1 | 0 | 5 | |
| Kakamega | 0 | 1 | 1 | 3 | 0 | 5 | |
| Bungoma_1 | 0 | 1 | 2 | 2 | 0 | 5 | |
| Bungoma_2 | 0 | 0 | 1 | 4 | 0 | 5 | |
| TransNzoia_1 | 0 | 0 | 0 | 3 | 2 | 5 | |
| TransNzoia_2 | 0 | 0 | 1 | 3 | 1 | 5 | |
| Total | 1 | 4 | 7 | 20 | 3 | 35 | |
Table A9.
Chi-square tests: Game * Education.
| Chi-Square Tests | Value | df | Asymptotic Significance (2-Sided) |
|---|---|---|---|
| Pearson Chi-Square | 25.567 a | 24 | 0.376 |
| Likelihood Ratio | 24.506 | 24 | 0.433 |
| Linear-by-Linear Association | 5.313 | 1 | 0.021 |
| N of Valid Cases | 35 |
a 35 cells (100.0%) have expected count less than 5. The minimum expected count is 0.14.
Table A10.
Symmetric measures: Game * Education.
| Symmetric Measures | Value | Approximate Significance | |
|---|---|---|---|
| Nominal by Nominal | Phi | 0.855 | 0.376 |
| Cramer’s V | 0.427 | 0.376 | |
| N of Valid Cases | 35 | ||
Appendix B: MDA Assumption Testing
We ran some Pearson correlations between the twenty dependent variables to test moderate range correlations. The results indicated strong correlations between the dependent variables. Additionally, the Box’s M test was assessed. The Box’s M value of 40.776 associated with a p-value of 0.478, is non-significant (i.e., p < 0.05). Thus, we assumed equal covariance matrices between the groups, for purposes of conducting the MDA procedure.
Figure A1.
Gender disaggregated boxplot chart histograms.

These outliers are not due to data entry errors or data collection errors. Data entry was electronic through the SurveyMonkey website. Therefore, the chances of data entry errors due to lack of attention, negligence, and tiredness were eliminated. Data collection was also done electronically through the participants filing the online questionnaires. Thus, eliminating errors due to human mistakes or equipment malfunction. Also, data transfer from SurveyMonkey to SPSS was not manual. Thus, eliminating any form of data transfer errors. Therefore, the outliers we were dealing with are genuine non-typical and unusual values in the population.
Figure A2.
Game sessions disaggregated boxplot chart histograms.

We had two solutions to deal with genuine outliers. The first option was to remove the outlier from the data series. The second option was to keep the outliers in the data series. Based on the graphical representation of all the assessment results of the 20 dependent variables distributed according to the seven game sessions, we realized that removing the outliers would remove all the assessment results of respondent ID number 33 and 27. It would also impact on the results of some respondents, for instance, respondent ID number 1, 11 and 23. Therefore, we decided to keep the outliers.
Appendix C: Supplementary Discriminant Analysis Results
Table A11.
Wilks’ Lambda for test of functions 1 through 4.
| Test of Function(s) | Wilks’ Lambda | Chi-Square | df | Sig. |
|---|---|---|---|---|
| 1 through 4 | 0.006 | 148.248 | 24 | 0.000 |
| 2 through 4 | 0.319 | 32.557 | 15 | 0.005 |
| 3 through 4 | 0.758 | 7.887 | 8 | 0.445 |
| 4 | 0.972 | 0.810 | 3 | 0.847 |
df = degrees of freedom.
Table A12.
Functions of group centroids.
| Game | Function | |||
|---|---|---|---|---|
| 1 | 2 | 3 | 4 | |
| Busia_1 | −10.163 | −1.615 | 0.251 | 0.101 |
| Busia_2 | −6.452 | 0.609 | −0.964 | 0.015 |
| Kakamega | −3.597 | 0.707 | 0.493 | −0.285 |
| Bungoma_1 | −0.040 | 1.194 | 0.088 | 0.019 |
| Bungoma_2 | 3.261 | 0.818 | 0.485 | 0.248 |
| TransNzoia_1 | 6.764 | −1.435 | −0.038 | −0.088 |
| TransNzoia_7 | 10.227 | −0.279 | −0.315 | −0.011 |
Unstandardized canonical discriminant functions evaluated at group means.
Table A13.
Canonical discriminant function coefficients.
| Function | 1 | 2 | 3 | 4 |
|---|---|---|---|---|
| Gender | −0.673 | 2.282 | 1.535 | −0.797 |
| Education | −0.201 | −1.061 | 0.894 | 0.336 |
| id | 0.675 | 0.051 | −0.019 | −0.029 |
| Age | 0.240 | 0.036 | −0.219 | 0.860 |
| (Constant) | −10.810 | 0.051 | −5.648 | −2.200 |
Unstandardized coefficients.
Table A14.
Classification results.
| Game | Predicted Group Membership | Total | |||||||
|---|---|---|---|---|---|---|---|---|---|
| Busia_1 | Busia_2 | Kakamega | Bungoma_1 | Bungoma_2 | TransNzoia_1 | TransNzoia_2 | |||
| Original Count | Busia_1 | 5 | 0 | 0 | 0 | 0 | 0 | 0 | 5 |
| Busia_2 | 0 | 5 | 0 | 0 | 0 | 0 | 0 | 5 | |
| Kakamega | 0 | 0 | 5 | 0 | 0 | 0 | 0 | 5 | |
| Bungoma_1 | 0 | 0 | 0 | 5 | 0 | 0 | 0 | 5 | |
| Bungoma_2 | 0 | 0 | 0 | 1 | 4 | 0 | 0 | 5 | |
| TransNzoia_1 | 0 | 0 | 0 | 0 | 1 | 4 | 0 | 5 | |
| TransNzoia_2 | 0 | 0 | 0 | 0 | 0 | 0 | 5 | 5 | |
| % | Busia_1 | 100 | 0 | 0 | 0 | 0 | 0 | 0 | 100 |
| Busia_2 | 0 | 100 | 0 | 0 | 0 | 0 | 0 | 100 | |
| Kakamega | 0 | 0 | 100 | 0 | 0 | 0 | 0 | 100 | |
| Bungoma_1 | 0 | 0 | 0 | 100 | 0 | 0 | 0 | 100 | |
| Bungoma_2 | 0 | 0 | 0 | 20 | 80 | 0 | 0 | 100 | |
| TransNzoia_1 | 0 | 0 | 0 | 0 | 20 | 80 | 0 | 100 | |
| TransNzoia_2 | 0 | 0 | 0 | 0 | 0 | 0 | 100 | 100 | |
a 94.3% of original grouped cases correctly classified.
Table A15.
Classification results (functions 1 through 3).
| Game | Predicted Group Membership | Total | |||||||
|---|---|---|---|---|---|---|---|---|---|
| Busia_1 | Busia_2 | Kakamega | Bungoma_1 | Bungoma_2 | TransNzoia_1 | TransNzoia_7 | |||
| Original Count | Busia_1 | 0 | 0 | 1 | 1 | 0 | 3 | 0 | 5 |
| Busia_2 | 0 | 3 | 1 | 1 | 0 | 0 | 0 | 5 | |
| Kakamega | 0 | 0 | 2 | 1 | 2 | 0 | 0 | 5 | |
| Bungoma_1 | 0 | 0 | 1 | 2 | 2 | 0 | 0 | 5 | |
| Bungoma_2 | 0 | 0 | 1 | 1 | 3 | 0 | 0 | 5 | |
| TransNzoia_1 | 0 | 0 | 0 | 0 | 1 | 4 | 0 | 5 | |
| TransNzoia_7 | 0 | 0 | 0 | 0 | 2 | 2 | 1 | 5 | |
| % | Busia_1 | 0 | 0 | 20 | 20 | 0 | 60 | 0 | 100 |
| Busia_2 | 0 | 60 | 20 | 20 | 0 | 0 | 0 | 100 | |
| Kakamega | 0 | 0 | 40 | 20 | 40 | 0 | 0 | 100 | |
| Bungoma_1 | 0 | 0 | 20 | 40 | 40 | 0 | 0 | 100 | |
| Bungoma_2 | 0 | 0 | 20 | 20 | 60 | 0 | 0 | 100 | |
| TransNzoia_1 | 0 | 0 | 0 | 0 | 20 | 80 | 0 | 100 | |
| TransNzoia_7 | 0 | 0 | 0 | 0 | 40 | 40 | 20 | 100 | |
a 42.9% of original grouped cases correctly classified.
References
- United Nations World Water Assessment Program (WWAP)/UN-Water. The United Nations World Water Development Report 2018: Nature-Based Solutions for Water; UNESCO Publishing: Paris, France, 2018; Available online: https://unesdoc.unesco.org/ark:/48223/pf0000261424 (accessed on 18 January 2019).
- UN Water. Coping with Water Scarcity: Challenge of the Twenty-First Century. 2007, p. 29. Available online: http://www.fao.org/3/a-aq444e.pdf (accessed on 18 January 2019).
- UN Water. Water Scarcity. 2018. Available online: http://www.unwater.org/water-facts/scarcity/ (accessed on 17 December 2018).
- Richey, A.S.; Thomas, B.F.; Lo, M.H.; Reager, J.T.; Famiglietti, J.S.; Voss, K.; Swenson, S.; Rodell, M. Quantifying renewable groundwater stress with GRACE. Water Resour. Res. 2015, 51, 5217–5238. [Google Scholar] [CrossRef] [PubMed] [Green Version]
- Cetinkaya, C.P.; Gunacti, M.C. Multi-Criteria Analysis of Water Allocation Scenarios in a Water Scarce Basin. Water Resour. Manag. 2018, 8, 2867–2884. [Google Scholar] [CrossRef]
- Barchiesi, S.; Sanchez, J.C.; Cross, K.; de Madrid, M.P.; Onencan, A.M. Adaptation Planning—Views towards Resilience and Up-scaling Success to Enhance Transboundary Water Governance (Chapter Five). In Transboundary Water Governance: Adaptation to Climate Change; IUCN, in Collaboration with the IUCN Environmental Law Centre: Gland, Switzerland, 2014; Volume 75, pp. 113–241. [Google Scholar]
- Jaeger, W.K.; Plantinga, A.J.; Chang, H.; Dello, K.; Grant, G.; Hulse, D.; McDonnell, J.J.; Lancaster, S.; Moradkhani, H.; Morzillo, A.T.; et al. Toward a formal definition of water scarcity in natural-human systems. Water Resour. Res. 2013, 49, 4506–4517. [Google Scholar] [CrossRef] [Green Version]
- Kampas, A.; Rozakis, S. On the Scarcity Value of Irrigation Water: Juxtaposing Two Market Estimating Approaches. Water Resour. Manag. 2017, 31, 1257–1269. [Google Scholar] [CrossRef]
- Hameeteman, E. Future water (In) security: Facts, figures, and predictions. In Proceedings of the Water Congress, Presented by Hilbren Buys, Bursa, Turkey, 22–24 March 2013; pp. 1–16. [Google Scholar]
- Neal, M.J.; Greco, F.; Connell, D.; Conrad, J. The Social-Environmental Justice of Groundwater Governance. In Integrated Groundwater Management; Springer: New York, NY, USA, 2016; pp. 253–272. [Google Scholar] [Green Version]
- Zeitoun, M.; Mirumachi, N. Transboundary water interaction I: Reconsidering conflict and cooperation. Int. Environ. Agreem. Polit. Law Econ. 2008, 8, 297. [Google Scholar] [CrossRef]
- Wolf, A.T. Shared waters: Conflict and cooperation. Annu. Rev. Environ. Resour. 2007, 32, 241–269. [Google Scholar] [CrossRef]
- Sadoff, C.W.; Grey, D. Cooperation on international rivers: A continuum for securing and sharing benefits. Water Int. 2005, 30, 420–427. [Google Scholar] [CrossRef]
- Phillips, D.; Daoudy, M.; McCaffrey, S.; Öjendal, J.; Turton, A. Trans-Boundary Water Cooperation as a Tool for Conflict Prevention and Broader Benefit-Sharing; Ministry for Foreign Affairs Stockholm: Washington, DC, USA, 2006.
- Enserink, B.; Onencan, A. Nile Basin Scenario Construction. In Proceedings of the IAIA17 Conference Proceedings Impact Assessment’s Contribution to the Global Efforts in Addressing Climate Change: 37th Annual Conference of the International Association for Impact Assessment, Montréal, QC, Canada, 4–7 April 2017; pp. 1–6. [Google Scholar]
- Onencan, A.M.; Van de Walle, B.; Enserink, B.; Chelang’a, J.; Kulei, F. WeShareIt Game: Strategic Foresight for Climate-change Induced Disaster Risk Reduction. In Proceedings of the Humanitarian Technology: Science, Systems and Global Impact 2016, HumTech2016, Boston, MA, USA, 7–9 June 2016; pp. 307–315. [Google Scholar]
- Onencan, A.M.; Van de Walle, B. Designing Disaster Diplomacy in the Context of a Climate Change Water Game. In Proceedings of the 48th International Simulation and Gaming Association Conference (ISAGA 2017) on Simulation Games for Sustainable Cities and Smart Infrastructures, Delft, The Netherlands, 10–14 July 2017; pp. 43–57. [Google Scholar]
- Onencan, A.M.; Van de Walle, B. Equitable and Reasonable Utilization: Reconstructing the Nile Basin Water Allocation Dialogue. Water 2018, 10, 707. [Google Scholar] [CrossRef]
- Onencan, A.M.; Van de Walle, B. From Paris Agreement to Action: Enhancing Climate Change Familiarity and Situation Awareness. Sustainability 2018, 10, 1929. [Google Scholar] [CrossRef]
- Onencan, A.M.; Kortmann, R.; Kulei, F.; Enserin, B. MAFURIKO: Design of Nzoia basin location based flood game. Procedia Eng. 2016, 159, 133–140. [Google Scholar] [CrossRef]
- Onencan, A.M.; Enserink, B.; Van de Walle, B.; Chelang’a, J. Coupling Nile Basin 2050 scenarios with the IPCC 2100 projections for climate-induced risk reduction. Procedia Eng. 2016, 159, 357–365. [Google Scholar] [CrossRef]
- Onencan, A.M.; Enserink, B. THE NILE BASIN BY 2050: Strategic Foresight on the Nile Basin Water Governance; Nile Basin Discourse: Entebbe, Uganda, 2014; p. 28. Available online: http://www.nilebasindiscourse.org/images/downloads/THE-NILE-BASIN-BY-2050-Strategic-Foresight-on-the-Nile-Basin-Water-Governance.pdf (accessed on 18 January 2019).
- Onencan, A.M. TU Delft Serious Game Elevates Nzoia. Delft, The Netherlands, 2017; p. 12. Available online: https://repository.tudelft.nl/islandora/object/uuid%3A91914ae3-453b-458a-ab58-555789a4533c (accessed on 5 June 2018).
- Groom, B.; Grosjean, P.; Kontoleon, A.; Swanson, T.; Zhang, S. Relaxing rural constraints: A ‘win-win’policy for poverty and environment in China? Oxf. Econ. Pap. 2009, 62, 132–156. [Google Scholar] [CrossRef]
- Tippett, J.; Searle, B.; Pahl-Wostl, C.; Rees, Y. Social learning in public participation in river basin management—Early findings from HarmoniCOP European case studies. Environ. Sci. Policy 2005, 8, 287–299. [Google Scholar] [CrossRef]
- Doucerain, M.M.; Amiot, C.E.; Thomas, E.F.; Louis, W.R. What it Means to be American: Identity Inclusiveness/Exclusiveness and Support for Policies About Muslims among US-born Whites. Anal. Soc. Issues Public Policy 2018, 18, 224–243. [Google Scholar] [CrossRef]
- Setti, M.; Garuti, M. Identity, Commons and Sustainability: An Economic Perspective. Sustainability 2018, 10, 409. [Google Scholar] [CrossRef]
- New, R.; Savulescu, J.; Faber, N.S. Cooperation in Social Dilemmas: How Can Psychology Help to Meet Climate Change Goals? Muscanell, N., Ed.; The Inquisitive Mind, 2018; Volume 1. Issue 35. Available online: http://www.in-mind.org/article/cooperation-in-social-dilemmas-how-can-psychology-help-to-meet-climate-change-goals (accessed on 15 December 2018).
- Point, S.; Branscombe, N.R.; Haji, R. Global Climate Change: A Social Identity Perspective on Informational and Structural Interventions. In Understanding Peace and Conflict Through Social Identity Theory: Contemporary Global Perspectives; Mark, A.F., Mcdonald, R., Branscombe, N.R., Eds.; Springer: Cham, Switzerland; University of Wisconsin: Madison, WI, USA, 2016; Available online: http://www.columbia.edu/~rim2114/publications/Ferguson_McDonald_Branscombe_2016.pdf (accessed on 18 January 2019).
- Gaertner, S.L.; Dovidio, J.F.; Nier, J.A.; Ward, C.M.; Banker, B.S. Across Cultural Divides: The Value of a Superordinate Identity; Russell Sage Foundation: New York, NY, USA, 1999. [Google Scholar]
- Wenzel, M.; Mummendey, A.; Waldzus, S. Superordinate identities and intergroup conflict: The ingroup projection model. Eur. Rev. Soc. Psychol. 2008, 18, 331–372. [Google Scholar] [CrossRef]
- Gaertner, S.L.; Dovidio, J.F.; Banker, B.S.; Houlette, M.; Johnson, K.M.; McGlynn, E.A. Reducing intergroup conflict: From superordinate goals to decategorization, recategorization, and mutual differentiation. Group Dyn. Theory Res. Pract. 2000, 4, 98. [Google Scholar] [CrossRef]
- Kane, A.A. Unlocking knowledge transfer potential: Knowledge demonstrability and superordinate social identity. Organ. Sci. 2010, 21, 643–660. [Google Scholar] [CrossRef]
- Eggins, R.A.; Haslam, S.A.; Reynolds, K.J. Social identity and negotiation: Subgroup representation and superordinate consensus. Personal. Soc. Psychol. Bull. 2002, 28, 887–899. [Google Scholar] [CrossRef]
- Argote, L.; Kane, A.A. Superordinate Identity and Knowledge Creation and Transfer in Organizations; Oxford University Press: Oxford, UK, 2009; pp. 166–190. [Google Scholar]
- Putnam, R.D. E pluribus unum: Diversity and community in the twenty-first century the 2006 Johan Skytte Prize Lecture. Scand. Political Stud. 2007, 30, 137–174. [Google Scholar] [CrossRef]
- Kelman, I. Disaster Diplomacy: How Disasters Affect Peace and Conflict; Routledge: London, UK, 2011. [Google Scholar]
- Birkmann, J.; Buckle, P.; Jaeger, J.; Pelling, M.; Setiadi, N.; Garschagen, M.; Fernando, N.; Kropp, J. Extreme events and disasters: A window of opportunity for change? Analysis of organizational, institutional and political changes, formal and informal responses after mega-disasters. Nat. Hazards 2010, 55, 637–655. [Google Scholar] [CrossRef]
- Pelling, M.; Dill, K. Disaster politics: Tipping points for change in the adaptation of sociopolitical regimes. Prog. Hum. Geogr. 2010, 34, 21–37. [Google Scholar] [CrossRef]
- Onencan, A.; Meesters, K.; Van de Walle, B. Methodology for participatory gis risk mapping and citizen science for solotvyno salt mines. Remote Sens. 2018, 10, 1828. [Google Scholar] [CrossRef]
- Onencan, A.; Enserink, B.; Van de Walle, B. A Study of Trust and Cooperation in the Nzoia River Basin Using a Water Policy Game. Sustainability 2018, 10, 4678. [Google Scholar] [CrossRef]
- Haidt, J.; Rosenberg, E.; Hom, H. Differentiating Diversities: Moral Diversity Is Not Like Other Kinds 1. J. Appl. Soc. Psychol. 2003, 33, 1–36. [Google Scholar] [CrossRef]
- Salman, S.M. Downstream riparians can also harm upstream riparians: The concept of foreclosure of future uses. Water Int. 2010, 35, 350–364. [Google Scholar] [CrossRef]
- Jackson, S.E.; Stone, V.K.; Alvarez, E.B. Socialization amidst diversity-the impact of demographics on work team oldtimers and newcomers. Res. Organ. Behav. 1992, 15, 45–109. [Google Scholar]
- Kakabadse, A.; Goyal, R.; Kakabadse, N. Value-creating Boards—Diversity and Evolved Processes. J. Creat. Value 2018, 4, 22–41. [Google Scholar] [CrossRef]
- Jackson, S.E.; Joshi, A.; Erhardt, N.L. Recent research on team and organizational diversity: SWOT analysis and implications. J. Manag. 2003, 29, 801–830. [Google Scholar]
- Hillman, A.J.; Cannella, A.A., Jr.; Harris, I.C. Women and racial minorities in the boardroom: How do directors differ? J. Manag. 2002, 28, 747–763. [Google Scholar] [CrossRef]
- Terjesen, S.; Aguilera, R.V.; Lorenz, R. Legislating a woman’s seat on the board: Institutional factors driving gender quotas for boards of directors. J. Bus. Ethics 2015, 128, 233–251. [Google Scholar] [CrossRef]
- Hocker, E. Gender Differences in the Propensity to Initiate Negotiations: Organizational Transparency, Diversity Climate, and the Mediating Role of Organizational Trust. Ph.D. Thesis, University of Oklahoma, Norman, OK, USA, 2018; p. 122. Available online: https://shareok.org/bitstream/handle/11244/301375/2018_Hocker_Elizabeth_Dissertation.pdf?sequence=2 (accessed on 15 December 2018).
- Singh, V.; Terjesen, S.; Vinnicombe, S. Newly appointed directors in the boardroom:: How do women and men differ? Eur. Manag. J. 2008, 26, 48–58. [Google Scholar] [CrossRef]
- Nielsen, S.; Huse, M. The contribution of women on boards of directors: Going beyond the surface. Corp. Gov. Int. Rev. 2010, 18, 136–148. [Google Scholar] [CrossRef]
- Huang, J.; Low, C. The Myth of the Male Negotiator: Gender’s Effect on Negotiation Strategies and Outcomes. 2018, p. 37. Available online: https://faculty.wharton.upenn.edu/wp-content/uploads/2018/05/MythMaleNegotiator_WorkingPaper_JHuang.pdf (accessed on 15 December 2018).
- Bøhren, Ø.; Strøm, R.Ø. Governance and politics: Regulating independence and diversity in the board room. J. Bus. Financ. Account. 2010, 37, 1281–1308. [Google Scholar] [CrossRef]
- Kakabadse, N.K.; Figueira, C.; Nicolopoulou, K.; Hong Yang, J.; Kakabadse, A.P.; Özbilgin, M.F. Gender diversity and board performance: Women’s experiences and perspectives. Hum. Resour. Manag. 2015, 54, 265–281. [Google Scholar] [CrossRef]
- Nguyen, D.D.; Hagendorff, J.; Eshraghi, A. Which executive characteristics create value in banking? Evidence from appointment announcements. Corp. Gov. Int. Rev. 2015, 23, 112–128. [Google Scholar] [CrossRef]
- Anderson, R.C.; Reeb, D.M.; Upadhyay, A.; Zhao, W. The economics of director heterogeneity. Financ. Manag. 2011, 40, 5–38. [Google Scholar] [CrossRef]
- Broome, L.L.; Conley, J.M.; Krawiec, K.D. Dangerous categories: Narratives of corporate board diversity. Ncl Rev. 2010, 89, 759. [Google Scholar]
- Singh, V. Ethnic diversity on top corporate boards: A resource dependency perspective. Int. J. Hum. Resour. Manag. 2007, 18, 2128–2146. [Google Scholar] [CrossRef]
- Kosnik, R.D. Effects of board demography and directors’ incentives on corporate greenmail decisions. Acad. Manag. J. 1990, 33, 129–150. [Google Scholar]
- Kim, K.-H.; Rasheed, A.A. Board heterogeneity, corporate diversification and firm performance. J. Manag. Res. 2014, 14, 121. [Google Scholar]
- Tuggle, C.S.; Sirmon, D.G.; Reutzel, C.R.; Bierman, L. Commanding board of director attention: Investigating how organizational performance and CEO duality affect board members’ attention to monitoring. Strateg. Manag. J. 2010, 31, 946–968. [Google Scholar] [CrossRef]
- Ben-Amar, W.; Francoeur, C.; Hafsi, T.; Labelle, R. What makes better boards? A closer look at diversity and ownership. Br. J. Manag. 2013, 24, 85–101. [Google Scholar] [CrossRef]
- Olson, B.J.; Parayitam, S.; Twigg, N.W. Mediating Role of Strategic Choice Between Top Management Team Diversity and Firm Performance: Upper Echelons Theory Revisited. J. Bus. Manag. 2006, 12, 111–126. [Google Scholar]
- Finkelstein, S.; Hambrick, D.C.; Cannella, A.A. Strategic Leadership: Theory and Research on Executives, Top Management Teams, and Boards; Strategic Management (Oxford University Press): Oxford, UK, 2009. [Google Scholar]
- Twigg, L.; Taylor, J.; Mohan, J. Diversity or disadvantage? Putnam, Goodhart, ethnic heterogeneity, and collective efficacy. Environ. Plan. A 2010, 42, 1421–1438. [Google Scholar] [CrossRef]
- De Oliveira, S.; Nisbett, R.E. Demographically Diverse Crowds Are Typically not much Wiser than Homogeneous Crowds. Ann Arbor, MI, USA, 2018. Available online: https://www.pnas.org/content/pnas/early/2018/02/08/1717632115.full.pdf (accessed on 12 January 2019).
- Onencan, A.M.; Enserink, B.; van de Walle, B. Game Design Concept Report: Application of the We Share It Game Elements in Nzoia River Basin. 2018, p. 53. Available online: https://repository.tudelft.nl/islandora/object/uuid:3a1f1e27-274b-4459-8a14-ba3068a9cb4a (accessed on 18 January 2019).
- Geurts, J.L.A.; Duke, R.D.; Vermeulen, P.A.M. Policy Gaming for Strategy and Change. Long Range Plan. 2007, 40, 535–558. [Google Scholar] [CrossRef]
- Medema, W.; Furber, A.; Adamowski, J.; Zhou, Q.; Mayer, I. Exploring the potential impact of serious games on social learning and stakeholder collaborations for transboundary watershed management of the St. Lawrence river basin. Water 2016, 8, 175. [Google Scholar] [CrossRef]
- Zhou, Q. The Princess in the Castle: Challenging Serious Game Play for Integrated Policy Analysis and Planning. Ph.D. Thesis, TU-Delft, Delft, The Netherlands, 2014. [Google Scholar]
- Mayer, I.; Bekebrede, G.; Harteveld, C.; Warmelink, H.; Zhou, Q.; van Ruijven, T.; Lo, J.; Kortmann, R.; Wenzler, I. The research and evaluation of serious games: Toward a comprehensive methodology. Br. J. Educ. Technol. 2013, 45, 502–527. [Google Scholar] [CrossRef]
- Bots, P.; van Daalen, E. Functional design of games to support natural resource management policy development. Simul. Gaming 2007, 38, 512–532. [Google Scholar] [CrossRef]
- Mostert, E.; Craps, M.; Pahl-Wostl, C. Social learning: The key to integrated water resources management? Water Int. 2008, 33, 293–304. [Google Scholar] [CrossRef]
- Onencan, A.M.; Enserink, B.; Walle, B.V.d. Sustainability Indicators: Monitoring Cross-County Water Cooperation in the Nzoia River Basin, Kenya. Sustainability 2019, 11, 560. [Google Scholar] [CrossRef]
- Mayer, I.S. The gaming of policy and the politics of gaming: A review. Simul. Gaming 2009, 40, 825–862. [Google Scholar] [CrossRef]
- Shubik, M. Games for Society, Business, and War; Elsevier: New York, NY, USA, 1975. [Google Scholar]
- Zhou, Q.; Bekebrede, G.; Mayer, I.; Warmerdam, J.; Knepflé, M. The climate game: Connecting water management and spatial planning through simulation gaming. In Water Governance as Connective Capacity; Ashgate Publishing Ltd.: Farnham, UK, 2013; pp. 109–127. [Google Scholar]
- Government of Kenya (GoK). 2017/2018 National Water Resources Situation Report. In Secondary 2017/2018 National Water Resources Situation Report; Secondary Government of Kenya (GoK), Ed.; Government of Kenya (GoK): Nairobi, Kenya, 2018. Available online: https://www.wra.go.ke/annual-reports/ (accessed on 28 December 2018).
- Government of Kenya (GoK). National Water Service Strategy (NWSS). In Secondary National Water Service Strategy (NWSS); Secondary Government of Kenya (GoK), Ed.; Government of Kenya (GoK): Nairobi, Kenya, 2007. Available online: http://urbanlex.unhabitat.org/sites/default/files/urbanlex/nwss_0.pdf (accessed on 26 December 2018).
- Government of Kenya (GoK). Sessional Paper No. 1 of 1999 on National Policy on Water Resources Management and Development. In Secondary Sessional paper No. 1 of 1999 on National Policy on Water Resources Management and Development; Secondary Government of Kenya (GoK), Ed.; Government of Kenya (GoK): Nairobi, Kenya, 1999. Available online: https://www.ircwash.org/sites/default/files/824-KE99-18207-1.pdf (accessed on 18 January 2019).
- Government of Kenya (GoK). The Water Act 2016. In Secondary The Water Act 2016; Secondary Government of Kenya (GoK), Ed.; Government of Kenya (GoK): Nairobi, Kenya, 2016. Available online: http://kenyalaw.org/kl/fileadmin/pdfdownloads/Acts/WaterAct_No43of2016.pdf (accessed on 18 January 2019).
- Haug, C.; Huitema, D.; Wenzler, I. Learning through games? Evaluating the learning effect of a policy exercise on European climate policy. Technol. Forecast. Soc. Chang. 2011, 78, 968–981. [Google Scholar] [CrossRef]
- Le, A.; Pricope, N. A Novel Application of Agent-based Modeling: Projecting Water Access and Availability Using a Coupled Hydrologic Agent-based Model in the Nzoia Basin, Kenya. 2015. Available online: http://cescos.fau.edu/gawliklab/papers/KleckaWR1982.pdf (accessed on 18 January 2019).
- Gathee, N.G.; Odera, P.A. Comparison of ANN-NARX, SMAR-LTF and LPMLTF Flood Forecasting Models in the Nzoia Basin, Kenya. J. Sustain. Res. Eng. 2016, 2, 36–44. [Google Scholar]
- Kenya Commission on Revenue Allocation. Kenya: County Factsheets. In Secondary Kenya: County Factsheets; Secondary Kenya Commission on Revenue Allocation, Ed.; Government of Kenya: Nairobi, Kenya, 2013. Available online: http://www.crakenya.org/wp-content/uploads/2013/07/CRA-County-Fact-sheets-2nd-Edition-June-2013.pdf (accessed on 22 October 2017).
- Onencan, A.M. Assessment of Hybrid Board Game-Based Learning Outcomes Using the Beatty Theoretical Framework. In Proceedings of the International Simulation and Gaming Association Conference, Delft, The Netherlands, 10–14 July 2017; pp. 161–172. [Google Scholar]
- Klecka, W.R. Discriminant Analysis; Sage Publications Inc.: Beverly Hills, CA, USA; London, UK, 1980; Volume 19, p. 74. [Google Scholar]
- Depping, A.E.; Mandryk, R.L. Cooperation and Interdependence: How Multiplayer Games Increase Social Closeness. In Proceedings of the Annual Symposium on Computer-Human Interaction in Play, Amsterdam, NL, The Netherlands, 15–18 October 2017; pp. 449–461. [Google Scholar]
- Rocha, J.B.; Mascarenhas, S.; Prada, R. Game Mechanics for Cooperative Games. 2008, pp. 72–80. Available online: http://revistacomsoc.pt/index.php/zondgames08/article/viewFile/343/319 (accessed on 18 January 2019).
Figure 1.
Demographic and personal attributes diversity studies that assess the added value of diversity and elements that contribute to value-creation.
Figure 1.
Demographic and personal attributes diversity studies that assess the added value of diversity and elements that contribute to value-creation.

Figure 2.
Nzoia WeShareIt game session 6 in Trans-Nzoia county government. One key observation from this game session was the participants barely sat at their tables, they moved around to find solutions to their common challenges and did not make decisions before discussing with other members of the water negotiation team.

Figure 3.
The changes in the resources (Food, Energy in the form of Hydroelectric Power and Money) in the seven game sessions for the five county governments.
Figure 3.
The changes in the resources (Food, Energy in the form of Hydroelectric Power and Money) in the seven game sessions for the five county governments.

Figure 4.
Grand totals of smileys earned in the seven game sessions for the five county governments.
Figure 4.
Grand totals of smileys earned in the seven game sessions for the five county governments.

Table 1.
The table of the Eigenvalues of each function.
| Function | Eigenvalue | % of Variance | Cumulative% | Canonical Correlation |
|---|---|---|---|---|
| 1 | 56.935 a | 97.1 | 97.1 | 0.991 |
| 2 | 1.376 a | 2.3 | 99.5 | 0.761 |
| 3 | 0.282 a | 0.5 | 100.0 | 0.469 |
| 4 | 0.029 a | 0.0 | 100.0 | 0.167 |
a First 4 canonical discriminant functions were used in the analysis.
Table 2.
Tests of equality of group means.
| Variable | Wilks’ Lambda | F | df1 | df2 | Sig. |
|---|---|---|---|---|---|
| Gender | 0.558 | 3.697 | 6 | 28 | 0.008 |
| Education | 0.560 | 3.667 | 6 | 28 | 0.008 |
| id | 0.020 | 233.333 | 6 | 28 | 0.000 |
| Age | 0.845 | 0.854 | 6 | 28 | 0.540 |
F = F-test value, which replaces the Chi-square test value, when there are two degrees of freedom (df).
Table 3.
Structure matrix for functions 1 through 4.
| Variable | Function | |||
|---|---|---|---|---|
| 1 | 2 | 3 | 4 | |
| id | 0.937 * | 0.013 | 0.295 | −0.187 |
| Education | 0.069 | −0.475 | 0.850 * | 0.218 |
| Gender | −0.023 | 0.668 | 0.726 * | 0.164 |
| Age | 0.017 | 0.319 | 0.026 | 0.947 * |
Pooled within-groups correlations between discriminating variables and standardized canonical discriminant functions. Variables ordered by absolute size of correlation within the function. * Largest absolute correlation between each variable and any discriminant function.
Table 4.
Structure matrix for functions 1 through 3.
| Variable | Function | ||
|---|---|---|---|
| 1 | 2 | 3 | |
| Education | 0.574 | 0.818 * | −0.037 |
| Gender | −0.578 | 0.815 * | 0.044 |
| Age | −0.203 | 0.280 | 0.938 * |
Pooled within-groups correlations between discriminating variables and standardized canonical discriminant functions. Variables ordered by absolute size of correlation within the function. * Largest absolute correlation between each variable and any discriminant function.
© 2019 by the authors. Licensee MDPI, Basel, Switzerland. This article is an open access article distributed under the terms and conditions of the Creative Commons Attribution (CC BY) license (http://creativecommons.org/licenses/by/4.0/).
Share and Cite
MDPI and ACS Style
Onencan, A.M.; Enserink, B.; Van de Walle, B. Influence of Personal Attributes and Demographic Diversity on Nzoia Basin Negotiation Outcomes. Water 2019, 11, 227. https://doi.org/10.3390/w11020227
AMA Style
Onencan AM, Enserink B, Van de Walle B. Influence of Personal Attributes and Demographic Diversity on Nzoia Basin Negotiation Outcomes. Water. 2019; 11(2):227. https://doi.org/10.3390/w11020227
Chicago/Turabian StyleOnencan, Abby Muricho, Bert Enserink, and Bartel Van de Walle. 2019. "Influence of Personal Attributes and Demographic Diversity on Nzoia Basin Negotiation Outcomes" Water 11, no. 2: 227. https://doi.org/10.3390/w11020227
Note that from the first issue of 2016, this journal uses article numbers instead of page numbers. See further details here.